


Abstract
Flash floods are among the most destructive natural hazards, often causing substantial loss of life and severe damage to infrastructure and property. Predicting flood-prone areas remains challenging because flood generation is controlled by complex interactions among topographic, hydrological, climatic, and environmental factors. In this study, six machine learning algorithms—Random Forest (RF), Logistic Regression (LR), Support Vector Machine (SVM), Decision Tree Classifier (DTC), AdaBoost, and Artificial Neural Network (ANN)—were developed to predict flash-flood inundation locations using satellite-derived flood inventories from two major rainfall events in Wadi El-Darb and Wadi El-Allaqi, Egypt. Model performance was evaluated using accuracy, precision, recall, and F1-score. During model development, Random Forest and Decision Tree Classifier achieved the highest prediction accuracy (94%), followed by AdaBoost and ANN (92%), while Logistic Regression (89%) and SVM (88%) also produced satisfactory results. To evaluate model generalization, the trained models were independently validated using a rainfall event in Wadi Hodein (Egypt) and a major flash-flood event that occurred in Oman during April 2024. The external validation showed that AdaBoost achieved the highest predictive performance in both validation basins, with accuracies of 87% for Wadi Hodein and 83% for Oman, providing encouraging initial evidence of applicability across hydrologically similar arid watersheds, While AdaBoost and Logistic Regression maintained satisfactory performance during external validation, other algorithms exhibited noticeable reductions in recall and F1-score, particularly in the Oman case study, indicating variability in model generalization across independent watersheds These findings suggest that the proposed framework may support flood susceptibility assessment in ungauged arid environments with comparable hydrological characteristics, although further validation across a wider range of climatic and geological settings is needed. Overall, the results highlight the value of integrating satellite remote sensing with machine learning to support flood hazard assessment, disaster preparedness, early warning systems, and flood risk management in data-scarce regions.
1. Introduction
Floods are among the most frequent and destructive natural disasters worldwide, causing severe impacts on human life, infrastructure, and ecosystems [1,2,3]. Recent global assessments report that flood events have inundated more than 2.23 million km2 and affected over 290 million people in the last few decades [4], Information on floods—such as the spatial and temporal extent of inundation, flood depth, vulnerable areas, high-risk zones, and safe locations—is essential for effective disaster management and emergency response [5], These figures highlight the growing need for accurate and reliable methods to predict flood inundation under extreme rainfall events.
Climate change is expected to intensify the frequency and magnitude of extreme rainfall events in many regions in the world, increasing the likelihood of flash floods and large-scale inundation [6]. Assessing future flood hazard under such conditions is particularly challenging, as it requires integrating rainfall projections with complex topographic, hydrologic, and land-surface characteristics across large spatial domains [7].
Traditional deterministic models become computationally expensive at these scales, especially when forced with outputs from multiple climate scenarios. Therefore, the development of machine learning models that can incorporate diverse rainfall events alongside topographic and environmental predictors offers a promising pathway for efficiently simulating and mapping future flood hazards [8,9].
Flood hazard assessment plays a crucial role in supporting early warning systems and reducing flood-related impacts. Traditionally, several approaches have been applied, ranging from statistical analyses based on historical flood data [10] to uncertainty-based methods such as Artificial Neural Networks and fuzzy logic [11]. Remote sensing techniques have also become a key tool for detecting and mapping inundated areas [12]. In addition, hydrological and hydrodynamic models—such as MIKE, Info Works ICM, and LISFLOOD-FP—are widely used to simulate the spatial distribution and evolution of floods [13,14]. However, these models often require high-resolution input data, extensive calibration, and are computationally expensive when applied to large regions. As a result, machine learning approaches have gained attention as efficient alternatives, offering the ability to integrate diverse inputs and rapidly predict flood-prone locations.
Advances in computer science and artificial intelligence have greatly expanded the use of machine learning in flood prediction. These algorithms enhance the efficiency of hazard assessment, address complex nonlinear relationships, and often provide more objective results compared to traditional methods. Owing to their flexibility and predictive capability, machine learning models have shown strong potential for widespread application in flood hazard studies. Broadly, machine learning techniques can be divided into supervised, unsupervised, and reinforcement learning. Supervised learning relies on labeled datasets to learn patterns and predict new outcomes, while unsupervised learning groups data into clusters without prior labels. Reinforcement learning, on the other hand, focuses on optimizing decision-making through iterative interaction with the environment. Several machine learning algorithms have been widely applied in flood risk assessment, each with unique strengths in pattern recognition and prediction. These include Convolutional Neural Networks (CNNs) and Recurrent Neural Networks (RNNs) [15], Random Forest (RF) [16], Logistic Regression (LR) [17], Support Vector Machines (SVM) ([18]), and Particle Swarm Optimization (PSO) [19], These models generally work by identifying relationships between input indicator factors and flood risk outcomes, enabling predictions under different environmental and hydrological scenarios [20]. In this study, six machine learning algorithms, Random Forest, Logistic Regression, Support Vector Machine, Decision Tree Classifier, AdaBoost, and ANN, were selected for flood hazard assessment, and their results were systematically compared.
Recent advances in remote sensing, cloud-computing platforms, and machine learning have significantly enhanced flood susceptibility assessment by enabling the integration of multi-source geospatial datasets with advanced predictive algorithms. Recent studies have demonstrated the effectiveness of combining Sentinel-1 SAR imagery, Landsat data, and the Sentinel Application Platform (SNAP) for flood assessment under different environmental conditions, highlighting the value of satellite-based approaches for flood monitoring and hazard mapping [21]. Similarly, integrating satellite imagery with machine learning algorithms has substantially improved flood susceptibility mapping by combining remotely sensed environmental variables with robust predictive models and comprehensive performance evaluation [22]. More recent studies have also emphasized systematic comparisons of machine learning algorithms and the integration of multiple environmental conditioning factors to improve the accuracy, reliability, and interpretability of flood susceptibility models [23]. Despite these advances, relatively few studies have evaluated the spatial transferability of machine learning models across independent watersheds, particularly in ungauged arid environments. Addressing this limitation is one of the primary objectives of the present study.
Despite the significant progress in flood hazard assessment, several limitations remain in the existing literature. Physically based hydrological and hydraulic models, while capable of providing detailed flood simulations, require extensive input data, calibration, and computational resources, which are often unavailable in arid and ungauged regions. On the other hand, many machine learning studies rely on locally trained datasets and are typically developed for specific watersheds, limiting their transferability to other regions with different hydrological and geomorphological characteristics. In addition, although remote sensing has been widely used for flood detection, its integration with machine learning models for predictive flood hazard assessment in data-scarce environments remains limited. Many existing approaches focus either on flood mapping or susceptibility analysis and are commonly developed for individual watersheds. Consequently, there remains a need to investigate the extent to which machine learning models trained using multi-source satellite datasets can generalize to independent watersheds with comparable hydrological and environmental characteristics.
To address these gaps, the main objectives of this study are summarized as follows:
- -
- To develop and evaluate a machine learning framework for flood susceptibility assessment in arid and data-scarce regions using multi-source satellite data.
- -
- To integrate satellite-derived flood inundation maps, satellite-based rainfall data, and topographic/environmental conditioning factors for model training and evaluation.
- -
- To compare the performance of multiple supervised and unsupervised machine learning algorithms for flood susceptibility mapping.
- -
- To investigate whether training the models using two hydrologically distinct basins (Wadi El-Darb and Wadi El-Allaqi) improves their ability to generalize to independent case studies.
- -
- To evaluate model transferability by testing the trained models on independent and unseen case studies (Wadi Hodein and a flood event in Oman) without retraining.
- -
- To investigate the potential of satellite-driven machine learning approaches for supporting flood susceptibility mapping in ungauged regions.
The novelty of this study lies in the development and evaluation of a machine learning framework for flood susceptibility assessment in arid and data-scarce environments through the integration of multi-source satellite datasets, including flood inundation maps and event-based rainfall information. Unlike many previous studies that focus on single-watershed analyses, this research combines data from two hydrologically distinct basins to investigate whether broader training conditions can improve model generalization. Furthermore, the proposed framework is evaluated using two independent flood events without retraining, providing an initial assessment of model transferability under different environmental conditions. The external validation demonstrates encouraging results while also highlighting that transferability varies among machine learning algorithms and requires further evaluation across a wider range of climatic and geomorphological settings. Overall, the study demonstrates the potential of satellite-driven machine learning approaches for supporting flood susceptibility assessment in data-scarce environments.
2. Materials and Methods
2.1. Study Area
This study focuses on two distinct watersheds in Egypt that were selected based on their hydrological importance and the availability of suitable satellite imagery for flood analysis. The first site is Wadi El-Darb, located in the Eastern Desert, which drains eastward toward the Red Sea and directly threatens Ras Gharib city, one of the most vulnerable urban areas to flash floods along the Red Sea coast. Wadi El-Darb extends between latitudes 28°08′ N and 28°24′ N and longitudes 32°20′ E and 32°44′ E, and is well known for its susceptibility to intense flash flooding. The second site is Wadi El-Allaqi, one of the largest catchments in the Eastern Desert, extending partially into Sudan and draining westward into Lake Nasser, upstream of the High Aswan Dam. Wadi El-Allaqi spans the region between latitudes 20°00′ N and 23°10′ N and longitudes 32°30′ E and 35°10′ E, and, similar to Wadi El-Darb, is highly prone to flash flood events.
The rationale for selecting these two basins lies in their contrasting drainage directions, geomorphological features, and hydrological settings. Wadi El-Darb represents a west–east drainage system, where floods pose direct risks to coastal urban areas, while Wadi El-Allaqi illustrates an east–west drainage system, where floodwaters contribute to Lake Nasser. This contrast was deliberately chosen to ensure that the machine learning models are trained on diverse hydrological conditions, enabling them to capture different flood-generating processes and to enhance their robustness for wider application. In both basins, suitable satellite images capturing flood events were available, which facilitated the extraction of inundated locations used for model training and validation. Figure 1 shows the geographic location and boundaries of the two case study areas.
Figure 1.
(a) Location map of Wadi El-Darb watershed in Egypt along the Red Sea coast; (b) location map of Wadi El-Allaqi watershed in southeastern Egypt; (c) regional overview showing the study area location within Egypt and its proximity to Sudan and the Red Sea.
The selection of Wadi El-Darb and Wadi El-Allaqi as case studies is based on both their hydrological significance and data availability. These basins are located in arid and semi-arid regions where flash floods are typically triggered by short-duration, high-intensity rainfall events. The geomorphological characteristics of these wadis, including steep slopes, sparse vegetation cover, and low infiltration capacity, promote rapid surface runoff and increase flood susceptibility. Wadi El-Darb, in particular, has experienced severe flash flood events, such as the Ras Gharib flood on 28 October 2016, which caused significant damage to infrastructure and settlements. Similarly, Wadi El-Allaqi is a large and hydrologically active basin that responds quickly to intense rainfall events, such as the event of 7–9 August 2024, generating noticeable runoff and flood inundation. In addition to their hydrological characteristics, the availability of high-quality satellite imagery corresponding to these flood events played a key role in their selection. This ensured the ability to accurately extract flood inundation maps required for training and validating the machine learning models.
Although Wadi El-Darb, Wadi El-Allaqi, Wadi Hodein, and the Oman validation basin differ in their local geological composition and lithological characteristics, they share several important hydrological and geomorphological features typical of arid environments. All watersheds are characterized by sparse vegetation, ephemeral stream networks, limited infiltration during intense rainfall, steep mountain fronts, and rapid runoff responses that generate flash floods. These common hydrological characteristics provide a suitable basis for evaluating the transferability of the developed machine learning models while acknowledging that local geological variability may influence runoff generation to some extent.
2.2. Data Description
This part describes the steps in processing the acquired data for the machine learning model implementation. All variables were derived from all raster datasets acquired, processed, and subsequently prepared for modeling using geospatial techniques and analysis.
2.2.1. Flood Events Description
The flood events used in this study were selected based on the occurrence of significant rainfall that generated observable surface runoff in the study areas, along with the availability of corresponding satellite imagery. Two major rainfall-triggered flood events were considered. The first event occurred on 28 October 2016 in Wadi El-Darb (Ras Gharib region), which resulted in severe flash flooding affecting the area. The second event corresponds to a multi-day rainfall event that took place from 7 to 9 August 2024 in Wadi El-Allaqi, leading to noticeable surface runoff and flood inundation.
These events were selected to represent different temporal and hydrological conditions, ensuring that the dataset captures variability in flood generation processes. For each event, satellite imagery acquired immediately after the rainfall was used to delineate the flood extent, which was then used to extract flooded and non-flooded samples for model development.
2.2.2. Rainfall Data Description
Rainfall data used in this study were obtained exclusively from satellite-based products provided by the Center for Hydrometeorology and Remote Sensing (CHRS), as no ground-based rain gauge data were available within the study areas. Therefore, no merging or bias correction between different rainfall sources was required.
The rainfall variable was considered on an event basis, where the total rainfall associated with each flood-triggering event was used as an input to the machine learning models. The CHRS dataset has a spatial resolution of approximately 0.1° (~10 km), which is suitable for representing regional rainfall patterns in arid environments.
Rainfall data were downloaded as raster layers corresponding to the selected flood events. To integrate rainfall into the dataset, the rainfall value at each sample point was extracted from the raster data using spatial interpolation techniques within the GIS environment. This ensured that each point in the dataset was associated with a representative rainfall value corresponding to the triggering event.
2.2.3. Dataset Description
The dataset used for model development was constructed by combining samples from both Wadi El-Darb and Wadi El-Allaqi. This integration was intentionally performed to expose the machine learning models to diverse hydrological conditions, rainfall characteristics, and geomorphological features, thereby improving their ability to generalize across different environments.
The combined dataset was randomly divided into training (70%) and testing (30%) subsets, ensuring that both subsets included representative samples from the two watersheds. This approach enables the models to learn from heterogeneous conditions while maintaining a consistent evaluation framework. Figure 2. Flowchart of the proposed methodology for flood susceptibility assessment, illustrating the processes of data collection, preprocessing, training dataset construction, machine learning model development, validation, and flood susceptibility mapping.
Figure 2.
Proposed methodology for flood susceptibility assessment.
2.2.4. Derivation of Flash Flood Triggering Factors
Flash floods result from the combined influence of topographic, hydrological, and environmental factors, making the careful selection of input variables essential for reliable machine learning predictions [24]. In this study, static triggering factors were derived mainly from global datasets, guided by basin characteristics and insights from previous research. Rainfall is the primary driver of floods; however, runoff also depends on watershed conditions such as catchment area, topography, and land use/land cover. The selected factors include elevation, slope degree, slope length, topographic wetness index (TWI), distance to main streams, and curve number, etc., with most derived from Shuttle Radar Topographic Mission (SRTM) DEM data.
Although lithology, bedrock permeability, and geological structures influence runoff generation, these variables were beyond the scope of the current satellite-based framework because consistent geological datasets were unavailable for all study and validation basins. Instead, infiltration-related characteristics were represented indirectly through the Curve Number (CN), which incorporates Hydrologic Soil Groups and land-use information. Therefore, CN should be regarded as a partial representation of infiltration characteristics rather than a direct representation of geological conditions.
The data processing starts with the derivation of flash flood-triggering factors after processing the SRTM DEM using ArcMap version 10.8.2 software. The majority of flash flood triggering factors, such as elevation, topographic wetness index (TWI), slope length, slope degree, and distance from the main stream, were extracted for each pixel from the DEM using geospatial techniques. The data sources of these input factors were outlined in Table 1. Here is an example of some of the influencing factors and how to calculate them:
Table 1.
Input factor selection and data source.
- ▪
- Slope
The slope is one of the key factors that trigger flash floods; areas with higher slope angles will increase the water’s velocity. This means that the speed of the flow of flooded waters is controlled by slope, and as a result, it is considered an important factor that can lead to flash floods [24]. In addition to this, an increased slope led to surface runoff and a reduction in infiltration. The slope (in degrees) of the study area was derived from the SRTM DEM using the spatial analyst tool in the ArcMap GIS environment.
- ▪
- Topographic Wetness Index (TWI)
This is a factor that has a direct impact on flood occurrence. It is a spatial representation of the variation of basin wetness. It measures the tendency to accumulate water at any point in the basin [25]. Each pixel of the TWI raster data depicts the amount of water stored in the location represented by such a pixel.
In order to calculate the TWI for the study area, the following equation was used after using the map algebra tool raster calculator in ArcMap for the calculation [26].
where
α indicates the upslope area of a specific catchment area draining through a particular point;
β represents the slope angle (in degrees) at such a point [26]. Areas with high values of TWI are highly correlated with flooding.
- Curvature
Curvature is the degree of curvature of a curve. Negative curvature means concave downward, positive curvature means convex upward, and a curvature of 0 means the surface is flat. Therefore, the smaller the curvature value, the more prone to flooding. In this paper, the curvature analysis tool in ArcGIS version 10.8.2 software was used to obtain the curvature distribution of the study area.
- Stream Power Index (SPI)
The Stream Power Index (SPI) is used to quantify the erosive and destructive potential of flowing water. It is calculated based on two key parameters: catchment area (flow accumulation) and slope, as expressed in Equation (2).
where α: the catchment area, β: Slope.
It should be noted that several of the conditioning factors used in this study are derived from the same DEM dataset and may exhibit some degree of correlation. However, the selection of these variables is consistent with previous studies in flood susceptibility assessment, where DEM-derived indices such as slope, curvature, topographic wetness index (TWI), stream power index (SPI), and flow accumulation are widely used due to their strong physical relevance to hydrological processes.
Each of these factors captures a different aspect of terrain influence on flood generation, including runoff velocity, flow convergence, water accumulation potential, and surface morphology. Therefore, they were retained to preserve the physical interpretability of the model inputs.
Flood samples derived from satellite imagery are naturally concentrated near drainage networks, which may influence the importance of variables such as distance to stream. Although efforts were made to include non-flooded samples from diverse locations, this spatial clustering may still affect model interpretation.
Furthermore, the machine learning algorithms employed in this study, particularly tree-based models such as Random Forest and Decision Tree Classifier, are known to be relatively robust to multicollinearity and can effectively handle correlated predictors. In addition, factor importance analysis was conducted to evaluate the contribution of each variable to the model performance.
Although geological conditions influence runoff generation through lithology, bedrock permeability, weathering characteristics, and structural features, these variables were not explicitly incorporated into the machine learning models because consistent geological datasets with comparable spatial resolution were unavailable for all study and validation basins. Instead, geological effects were considered only indirectly through the Curve Number (CN), which integrates Hydrologic Soil Groups and land-use characteristics that influence infiltration and runoff potential. Therefore, the CN should be interpreted as a partial representation of infiltration-related properties rather than a direct substitute for geological information.
To assess potential feature redundancy within the 14 flood conditioning factors, a multicollinearity diagnostic was conducted using the Variance Inflation Factor (VIF). As presented in Table 2, all primary hydro-geomorphological and meteorological factors (Factors 1 to 11) exhibited exceptional statistical independence, with VIF values strictly below 2.5, well within the conservative academic threshold of 5.0. Severe collinearity was mathematically observed only among the curvature components (Plan, Profile, and Total Curvatures), which is physically expected due to their definitive geometric relationships. However, all 14 parameters were strictly retained in the final modeling framework. This decision is justified by the deployment of advanced, non-linear machine learning algorithms (such as Random Forest, AdaBoost, and Support Vector Machines), which are structurally robust against multicollinearity and capable of processing overlapping topographic constraints without losing prediction stability.
Table 2.
Multicollinearity analysis of the 14 flood conditioning factors using the Variance Inflation Factor (VIF).
Although several DEM-derived variables exhibited relatively high VIF values, they were retained because the objective of this study was predictive flood susceptibility mapping rather than statistical coefficient inference. Many machine learning algorithms are capable of handling correlated predictors during model training, although multicollinearity may influence the interpretation of feature importance rankings. Consequently, the reported feature importance values should be interpreted as model-specific measures of predictive contribution rather than evidence of independent hydrological influence. Because several terrain attributes are derived from the same digital elevation model, they inevitably share overlapping information, and their relative importance may vary among machine learning algorithms.
2.3. Research Methodology
This study utilizes multiple datasets including remote sensing data, geological, and topographic data to map historical flood occurrences, develop susceptibility models, and evaluate their accuracy, As a part of the machine learning data requirements, gridded rainfall data for the defined flash flood events historical dates was obtained and incorporated into the analysis, as it is a crucial factor influencing the occurrence of flood events, the temporal and spatial patterns of rainfall were analyzed to understand its role in triggering the selected flash flood occurrences.
The study’s key requirement was to associate all factors that lead to flash floods together as input data for the machine learning model. In the previous section, all flash-flood conditioning factors were calculated, but we need to link the calculated pixel Factors with the associated rainfall that possibly triggered the flash floods within that location.
To associate the historical locations of flash floods with their corresponding rainfall events, the following steps were followed.
The dates of the flash flood events and the corresponding dates of the rainfall data that match these dates were first selected and compiled.
Rainfall data were obtained from satellite-based products (CHRS) due to the absence of ground-based rain gauge measurements in the study areas.
Rainfall data were added to the dataset, which was used as input data for the machine learning.
A database consisting of all the spatiotemporal features extracted from the past flood events, combined with the different selected factors and their corresponding target class for each pixel, was created. This database served as input for the classification modeling as described before. The database was prepared for further processing before the actual implementation of the machine learning models.
- ▪
- Overview of Machine Learning Algorithms
This study addresses a binary classification task, where flood-prone and non-flooded locations were distinguished using machine learning. To identify the most suitable approach, several algorithms—including Random Forest, Support Vector Machine, Decision Tree Classifier, Logistic Regression, AdaBoost, and Artificial Neural Networks—were comparatively evaluated. These models were selected for their proven accuracy, efficiency, and robustness against overfitting in similar applications. The following sections outline some of their theoretical basis and operational mechanisms, providing the foundation for evaluating their predictive performance in this research.
- ▪
- Random Forest
Random Forest is a widely used ensemble learning algorithm that combines the results of multiple decision trees built through bootstrap aggregation and random feature selection [27]. One of its key advantages is the ability to evaluate the relative importance of input variables, offering insights into data relationships [28]. Decision trees, the building blocks of Random Forest, partition data using criteria such as Gini impurity and information entropy, both aimed at reducing classification uncertainty. Random Forest is highly effective in handling large datasets with complex, non-linear interactions between variables without requiring assumptions about their relationships. It is also robust, efficient, and capable of producing accurate results even with default parameter settings. These strengths make Random Forest one of the most versatile and reliable machine learning techniques for predictive modeling.
- ▪
- Logistic regression
Binary Logistic Regression (LR) is a supervised classification method used to predict dichotomous outcomes (‘0’ or ‘1’). It employs the logistic function, ranging from 0 to 1, to estimate the probability that a data point belongs to the positive class [29]. The function is defined as in Equation (3):
where
P(x) is interpreted as the probability of the dependent variable Y equaling a success/case rather than a failure/non-case;
e is the base of the natural logarithm (approximately 2.71828);
β0 and β1 are the regression coefficients, which are estimated from the training data.
Logistic Regression is widely used for binary classification due to its simplicity, probabilistic interpretation, and ability to capture non-linear relationships between predictors and the outcome variable.
- ▪
- Artificial Neural Networks (ANNs)
Artificial Neural Networks (ANNs) are non-linear machine learning models inspired by the structure of the human brain, designed to capture complex interactions between input and output variables [30]. A typical ANN consists of an input layer, one or more hidden layers, and an output layer, where hidden layers apply non-linear transformations to extract patterns from the data [31]. The learning process is based on assigning weights to inputs and adjusting them iteratively to minimize prediction errors. The general form of the ANN output can be expressed as follows:
where
O(v) is the output of the neural network;
ωo is the bias (intercept) term;
k is the total number of flood conditioning factors;
ωr the flood conditioning factors’ weight coefficient;
f specifies the activation function in the hidden and output layers, ranging from 0 to 1.
The function is calculated by Equation (5)
where
ω is the vector containing all the weights without the intercept;
ν is the vector of all covariates;
is a scaled product of the weights and input vectors.
This iterative training process enables ANNs to learn underlying patterns and enhance predictive performance, making them highly effective for flood hazard modeling.
2.4. Flood Inundation Mapping from Satellite
Flood inundation maps were derived from satellite imagery and used as reference data for training and validating the machine learning models. In this study, multispectral Sentinel-2 imagery with a spatial resolution of 10 m was utilized due to its high spatial detail and suitability for surface water detection. The images were selected immediately after the rainfall and runoff events to capture the maximum spatial extent of flood inundation.
Preprocessing steps included atmospheric correction and cloud masking to ensure the reliability of the spectral information. Flooded areas were identified using a combination of spectral water indices, including the Normalized Difference Water Index (NDWI), Modified Normalized Difference Water Index (MNDWI), and Soil Moisture Index (SMI). These indices were employed to enhance the detection of open water and saturated soils, which are characteristic of flood conditions, especially in arid and semi-arid regions.
Threshold-based classification was applied to each index to distinguish flooded from non-flooded pixels. The outputs of the different indices were then integrated to improve classification accuracy and reduce misclassification caused by soil background or vegetation effects. The accuracy of the extracted flood maps was evaluated through visual interpretation and comparison with known flood-affected areas and high-resolution imagery where available.
The final flood inundation maps were used to generate the binary target variable required for machine learning model development, where flooded locations were assigned a value of 1 and non-flooded locations a value of 0.
The performance of machine learning models is strongly influenced by the selection of hyperparameters, which control model complexity, learning behavior, and generalization capability. In this study, commonly used hyperparameters were adopted for each algorithm based on their relevance in controlling model structure and prediction performance. These parameters were selected to ensure stable and reliable results while avoiding overfitting. A summary of the key hyperparameters used for each machine learning model is presented in Table 3.
Table 3.
Hyperparameter settings and tuning strategy for the machine learning models.
Hyperparameter optimization was performed using a combination of Grid Search and empirical tuning. For DTC, Grid Search with cross-validation was applied, whereas for RF, SVM, LR, AdaBoost, and ANN, parameter values were selected based on literature recommendations and preliminary experimental evaluation.
2.5. Flood Hazard Assessment Model
The flood hazard assessment in this study was carried out on two contrasting case studies, Wadi El-Darb and Wadi El-Allaqi, both of which have experienced runoff events triggered by extreme rainfall. Multiple significant rainfall events across Egypt were first identified, and satellite images corresponding to these events were downloaded and used as reference (observed) data. The spatial extent of the analysis was defined according to the coverage of the available satellite imagery rather than being restricted solely to the watershed boundaries, ensuring that the reference data captured the maximum possible flooded area during each event. These images were then used to verify whether specific data points were flooded or not.
A total of approximately 1600 sample points were extracted from the study areas, representing both flooded and non-flooded locations. Flooded samples were identified from the satellite-derived inundation maps, while non-flooded samples were selected from areas outside the detected flood extent. Care was taken to ensure that the dataset represents the spatial variability of the study areas and includes a balanced representation of both classes.
The dataset was constructed using samples extracted from the two selected flood events (28 October 2016 in Wadi El-Darb and 7–9 August 2024 in Wadi El-Allaqi), ensuring that the machine learning models were trained on diverse flood conditions.
To construct the training dataset, fourteen flood-influencing factors were selected: Topographic Wetness Index (TWI), Curve Number (CN), distance to stream, slope degree, precipitation, slope length, elevation, curvature, profile curvature, aspect, plan curvature, drainage density, Stream Power Index (SPI), and flow accumulation, as shown in Figure 3 and Figure 4.
Figure 3.
Explanatory factors of Wadi El-Darb. Spatial distribution of the conditioning factors used for flood susceptibility modeling. Each raster layer represents a predictor variable from which values were extracted at the sampled flood and non-flood locations. The extracted values were combined to create the feature dataset used for machine learning model training and testing.
Figure 4.
Explanatory factors of Wadi El-Allaky. Spatial distribution of the conditioning factors used for flood susceptibility modeling. Each raster layer represents a predictor variable from which values were extracted at the sampled flood and non-flood locations. The extracted values were combined to create the feature dataset used for machine learning model training and testing.
Although lithology, bedrock permeability, and geological structures can significantly influence runoff generation, these variables were beyond the scope of the current satellite-based framework because consistent geological datasets with comparable spatial resolution were not available for all study and validation basins. Instead, infiltration-related characteristics were represented indirectly through the Curve Number (CN), which incorporates Hydrologic Soil Groups and land-use information. Therefore, CN reflects part of the hydrological response associated with infiltration capacity but should not be considered a direct representation of geological conditions.
The flooded and non-flooded points were assigned values of 1 and 0, respectively. The dataset was then randomly split into training (70%) and testing (30%) subsets, corresponding to approximately 1120 samples for training and 480 samples for testing. The split was performed while maintaining a representative distribution of flooded and non-flooded samples in both subsets to ensure robust model evaluation, ensuring consistency by applying the same data partitioning across all machine learning models. Several supervised machine learning algorithms were applied, including Random Forest, Support Vector Machine, Decision Tree Classifier, Artificial Neural Network, AdaBoost Classifier, and Logistic Regression. Model performance was evaluated by comparing predicted flood-prone locations with the observed inundation maps derived from satellite imagery of the selected rainfall events.
This workflow enabled the systematic testing of multiple algorithms and input factors across two contrasting watersheds, providing insights into the predictive capacity of machine learning approaches for flood hazard mapping in arid regions of Egypt.
The machine learning methodology adopted in this study follows a systematic sequence of steps to ensure the robustness and reliability of the developed models. First, all training data were loaded and compiled into a unified dataset, containing both the flood-influencing factors and the binary target variable representing flooded and non-flooded locations. The dataset was then split into two subsets: 70% for training and 30% for testing, ensuring a balanced distribution of flooded and non-flooded points.
Pre-processing of the data was performed prior to model training. This included handling missing values, which were filled with zeros to maintain consistency and prevent bias in model learning. Following pre-processing, the models were trained using selected algorithms, namely Random Forest (RF), Support Vector Machine (SVM), Artificial Neural Network (ANN), AdaBoost, Decision Tree Classifier (DTC), and Logistic Regression (LR).
After training, the models were evaluated on both the training and testing subsets to assess their predictive performance. To further enhance model accuracy, fine-tuning of hyperparameters was conducted. For instance, in the case of the Decision Tree Classifier, optimal settings such as max_depth = 4, min_samples_leaf = 2, min_samples_split = 6, and random_state = 42 were tested. Similarly, for the Support Vector Machine, the classifier was tuned with parameters including C = 30, degree = 2, kernel = ‘poly’, and random_state = 42.
Finally, the testing accuracy of each model was evaluated after fine-tuning, and the comparative performance of all algorithms was analyzed to identify the most suitable machine learning approach for flood hazard prediction.
It should be noted that the spatial extent of the analysis was defined based on the coverage of available satellite imagery corresponding to the selected flood events. In some cases, the satellite image footprint was either larger or smaller than the exact watershed boundaries. This approach was adopted to maximize the use of observed flood information derived from remote sensing, particularly in data-scarce regions.
Despite this, the modeling framework maintains hydrological consistency, as all conditioning factors were derived based on terrain and watershed characteristics, including flow direction, flow accumulation, drainage networks, and distance to the main stream. These variables inherently represent the hydrological behavior of the basin and control runoff generation and flood processes.
Therefore, while the spatial extent was influenced by data availability, the analysis remains physically meaningful and representative of the hydrological system.
3. Results
3.1. Model Evaluation Method
In this study, the performance of the machine learning models was evaluated using four widely adopted metrics: accuracy (ACC), precision (P), recall (R), and F1-score (F). Accuracy measures the overall proportion of correctly classified points, including both flooded and non-flooded locations. Precision evaluates the ability of the model to correctly identify flood-prone points among all points predicted as flooded. Recall measures the proportion of actual flooded points that were correctly identified by the model. The F1-score, which is the harmonic mean of precision and recall, provides a balanced measure of the model’s ability to detect flood-prone locations.
The metrics were calculated according to the following equations:
where TP (true positives) are correctly predicted flooded points, FP (false positives) are non-flooded points incorrectly predicted as flooded, TN (true negatives) are correctly predicted non-flooded points, and FN (false negatives) are flooded points incorrectly predicted as non-flooded.
This framework ensured a robust and objective evaluation of the predictive capabilities of the applied machine learning algorithms.
The evaluation of six machine learning algorithms—Random Forest (RF), Logistic Regression (LR), Support Vector Machine (SVM), Decision Tree Classifier (DTC), AdaBoost, and Artificial Neural Networks (ANNs)—was carried out using four metrics: precision, recall, F1-score, and overall accuracy.
3.2. Models Comparison
Among the models, Random Forest and Decision Tree Classifier achieved the highest accuracy (0.94), with both models demonstrating balanced precision and recall across the flooded and non-flooded classes. RF, in particular, maintained high stability (precision = 0.96, recall = 0.93 for flooded points), confirming its robustness in handling complex datasets.
The ANN model also performed strongly (accuracy = 0.92), with an F1-score of 0.927, indicating reliable detection of flood-prone areas. Similarly, AdaBoost achieved consistent results (accuracy = 0.92), though its metrics were slightly lower than those of ANN.
Logistic Regression and SVM yielded slightly lower accuracies (0.89 and 0.88, respectively), yet they still provided competitive results and demonstrated good generalization ability. LR was particularly effective at capturing flooded points (recall = 0.93), while SVM maintained balance across classes.
Overall, based on accuracy and stability across all metrics, Random Forest emerges as the most suitable model for flood hazard prediction, followed closely by the Decision Tree Classifier and ANN. These models demonstrate strong potential for application in large-scale flood prediction studies.
To present these findings more effectively, the following figure, number 5, shows a comparison between all the accuracy algorithms.
It is important to note that all performance metrics presented in this study, including accuracy, fine-tuning, recall, and the F1 metric (Figure 5), were calculated based on the test dataset, which represents 30% of the total data. The remaining 70% of the dataset was used to train the machine learning models.
Figure 5.
Model performance comparison: Bar chart comparing accuracy, precision, recall, and F1-score across all algorithms.
The total dataset comprises approximately 1600 sample points, including both flooded and unflooded locations. A balanced representation of both categories was ensured during dataset construction to minimize potential bias and guarantee a reliable assessment of model performance.
To better understand the role of each conditioning factor in flood susceptibility prediction, the relative importance and direction of influence of all input variables were analyzed across the applied machine learning models. Each algorithm evaluates the contribution of predictors differently, but together they provide a comprehensive view of the mechanisms driving flooding.
The feature importance analysis revealed that some conditioning factors were consistently assigned higher predictive importance by several machine learning algorithms, whereas others received relatively lower importance. These rankings provide insight into how the models utilized the available predictors during flood susceptibility estimation, rather than establishing causal hydrological mechanisms. For example, Support Vector Machines (SVMs) assigned a strong negative weight to distance to main stream, indicating that shorter distances were consistently associated with higher predicted flood susceptibility within the SVM model, while larger distances reduced it. Similarly, density showed a high positive weight, indicating that density received relatively high predictive importance in distinguishing flooded from non-flooded locations. Logistic Regression assigned relatively high positive coefficients to slope degree and precipitation, indicating a positive association with predicted flood susceptibility within the fitted model, whereas several curvature-related variables received lower or negative coefficients within the model. Random Forest and Decision Tree classifiers consistently highlighted distance to stream and curve number (CN) as dominant predictive variables, while topographic indices such as slope length and curvature played smaller, sometimes negative roles. Artificial Neural Networks (ANNs) distributed influence across multiple variables, but reinforced the importance of distance to stream and CN as consistently important predictors across the trained models.
Overall, the models not only identified the most influential predictors (distance to stream, CN, density, and elevation) but also indicated whether each variable exhibited a positive or negative association with the predicted flood susceptibility within the corresponding machine learning model. This dual interpretation adds depth to the flood hazard analysis, highlighting how different machine learning algorithms assigned varying predictive importance and association directions to the conditioning factors. The following sub-figures (Figure 6) illustrate these findings, showing the factor importance and the direction of their influence for each machine learning model.
Figure 6.
Factor importance and the direction of their influence across the implemented machine learning models: (A) Logistic Regression, (B) Artificial Neural Network (ANN), (C) Support Vector Machine (SVM), (D) AdaBoost, (E) Decision Tree Classifier, and (F) Random Forest.
It is important to note that the feature importance measures derived from different machine learning algorithms cannot be directly compared in a quantitative sense, as they rely on different underlying mechanisms. For example, regression-based models (such as Logistic Regression and Support Vector Machines) provide coefficients indicating the direction of influence of each variable, while tree-based models (such as Random Forests and decision trees) estimate the relative importance of variables based on their contribution to decision splits.
It should be noted that feature importance measures differ across machine learning algorithms, and direct comparison between models should be treated qualitatively. Consequently, the reported importance rankings reflect general trends rather than absolute or directly comparable values.
Furthermore, because several conditioning factors are derived from the same digital elevation model, some degree of multicollinearity is unavoidable despite the inclusion of the VIF analysis. Consequently, the relative importance assigned to individual variables may partly reflect shared predictive information among correlated terrain attributes and the mathematical structure of each machine learning algorithm. Therefore, the reported feature importance rankings should be interpreted primarily as model-specific measures of predictive contribution rather than independent evidence of the physical influence of individual factors on flood occurrence.
To complement the graphical outputs, Table 4 summarizes the dominant role of each conditioning factor across the different machine learning models. The table shows whether each variable generally exhibited a positive or negative association with predicted flood susceptibility. This comparison highlights the consistency of certain predictors (e.g., distance to stream and curve number) and the variable behavior of others (e.g., curvature indices). This tabular synthesis reinforces that distance to stream, curve number, density, and elevation are the most consistently important predictors identified by the evaluated machine learning models across models, whereas topographic curvature variables generally received lower predictive importance or negative associations depending on the algorithm.
Table 4.
Influence of each input factor across the evaluated machine learning algorithms.
Accordingly, the feature importance analysis is intended to improve understanding of model behavior and facilitate comparison among different machine learning algorithms rather than to establish independent hydrological causality or quantify the physical contribution of individual conditioning factors.
To further evaluate the spatial performance of the developed models, flood susceptibility maps were generated for the Ras Ghareb case study using a sample of different machine learning algorithms. These maps illustrate the spatial distribution of flood-prone areas classified into different susceptibility levels, providing a visual comparison of model outputs.
For the Ras Ghareb area, generated using different machine learning algorithms. The maps show the spatial distribution of flood susceptibility classes ranging from low to very high, as shown in Figure 7.
Figure 7.
Flood susceptibility maps of the Ras Ghareb area generated using three different machine learning algorithms: (A) AdaBoost Classifier, (B) Logistic Regression, and (C) Random Forest. Blue areas represent predicted flooded (flood-susceptible) locations, whereas red areas represent predicted non-flooded (non-susceptible) locations.
4. Discussion
To further evaluate the robustness and generalizability of the developed machine learning models, an additional case study was introduced outside the primary training domain. After identifying the algorithms that achieved the highest predictive performance among the six tested models, the selected methods were first applied to a new watershed, Wadi Hodein, located in southeastern Egypt, using an extreme rainfall event that generated noticeable surface runoff as a test case. Furthermore, the models were evaluated on a major rainfall and flash-flood event that occurred across parts of Oman from 14 to 15 April 2024, during which more than 90 mm of rain was recorded in Al Mudhaibi (North Al Sharqiyah Governorate), and widespread inundation affected wadis such as Wadi Bani Khalid and Samad Al Shan. For both events, satellite-derived flood inundation maps were employed as observed reference data to validate the model predictions. This dual evaluation provided an initial assessment of model transferability across distinct climatic and geomorphological settings. The results showed that while several machine learning algorithms maintained satisfactory predictive performance, others experienced noticeable reductions in accuracy, indicating that transferability varies among algorithms and is influenced by regional environmental conditions. These findings highlight both the potential and the limitations of applying satellite-driven machine learning approaches beyond the calibration watersheds.
This dataset was not part of the model training process and thus represented unseen data, providing an initial assessment of model transferability across different watersheds. The performance of each algorithm was tested against this independent dataset to assess how well models trained on Wadi El-Darb and Wadi El-Allaqi could predict flood-prone locations in a hydrologically and topographically different environment. The accuracy metrics derived from this analysis were used to evaluate the extent to which the selected algorithms could generalize beyond the initial case studies. Rather than confirming universal applicability, the external validation provides evidence of the models’ ability to generalize under comparable environmental conditions while also revealing differences in performance among algorithms.
For the Oman case study, a total of 889 sample points were used to evaluate the model performance, including 439 flooded points and 450 non-flooded points, as shown in Figure 8. The samples were spatially distributed across the study area to ensure balanced representation of both classes and to reduce spatial bias. Flooded points were primarily concentrated along drainage pathways, while non-flooded points were selected from areas away from the main channels and elevated terrains to ensure a representative dataset for validation.
Figure 8.
Spatial distribution of the validation sample points used in the Oman case study. Blue points indicate flooded locations, whereas red points indicate non-flooded locations.
This validation step strengthens the practical significance of the research by providing initial evidence that the trained models may be applicable to other ungauged basins with comparable hydrological characteristics. At the same time, the variability observed among model performances indicates that additional validation is required before broader transferability can be established.
Although the validation watersheds differ from the training basins in their local geological settings, they exhibit similar hydrological behavior characteristic of arid environments, including ephemeral drainage networks, limited vegetation cover, and rapid runoff following high-intensity rainfall. The satisfactory predictive performance obtained in these independent basins suggests that the selected topographic, hydrological, and rainfall predictors capture the dominant controls on flood generation despite variations in geological conditions. Nevertheless, incorporating explicit geological variables, such as lithology or bedrock permeability, could further improve model transferability and represents an important direction for future research.
It is important to note that the models were applied directly to these external case studies without any retraining. This approach represents a spatial transferability test, where the models trained on Wadi El-Darb and Wadi El-Allaqi were used to predict flood-prone areas in entirely different watersheds. The independent validation results from Wadi Hodein and Oman provide encouraging evidence of the generalization capability of the trained models. However, the observed variability in predictive performance among the tested algorithms indicates that transferability should not be considered uniform across all machine learning methods. Instead, the results suggest that successful application depends on both the selected algorithm and the similarity between the calibration and target watersheds.
Although Wadi El-Darb, Wadi El-Allaqi, Wadi Hodein, and the Oman validation basin exhibit differences in lithology and local geological composition, they share several important hydrological characteristics typical of arid environments. All four watersheds are characterized by ephemeral drainage systems, sparse vegetation cover, steep mountainous terrain, and flash floods generated primarily by short-duration, high-intensity rainfall events. These common hydrological characteristics promote rapid runoff generation despite local variations in bedrock type and permeability. Consequently, the satisfactory performance of the trained models in Wadi Hodein and Oman suggests that the selected topographic, hydrological, and rainfall-related predictors capture the dominant controls on flood generation across these arid watersheds. Nevertheless, the inclusion of explicit geological variables, such as lithology or bedrock permeability, may further improve model transferability and should be considered in future studies.
Although a random 70/30 train–test split was adopted, it is acknowledged that spatial autocorrelation may exist due to the clustered nature of flood occurrences. This may introduce some degree of spatial dependence between training and testing samples.
The independent validation results showed accuracies ranging from 69–87% for Wadi Hodein (Figure 9) and 44–83% for the Oman flood event (Figure 10), demonstrating varying levels of model transferability beyond the training domain.
Figure 9.
Comparison of model accuracy for each machine learning algorithm in Wadi Hodein.
Figure 10.
Comparison between models’ accuracy for each algorithm in the Oman flood case study (April 2024 rainfall event).
The quantitative evaluation of the external validation experiments is summarized in Table 5 using four performance metrics: accuracy, precision, recall, and F1-score. Overall, the results demonstrate that the predictive performance of the machine learning models varies across the two independent validation basins, reflecting differences in their environmental and hydrological characteristics.
Table 5.
Detailed quantitative overall accuracy (%) of the six machine learning algorithms across the validation settings.
For Wadi Hodein, AdaBoost achieved the best overall performance, with an accuracy of 87%, precision of 98%, recall of 80%, and an F1-score of 88%, indicating a well-balanced ability to correctly identify both flooded and non-flooded locations. Random Forest also performed strongly, achieving an accuracy of 84% and a high F1-score of 85%, followed by Logistic Regression and Decision Tree Classifier, which maintained satisfactory performance across all evaluation metrics. In contrast, ANN and SVM showed substantially lower performance, with accuracies of 46% and comparatively low precision, recall, and F1-scores, suggesting limited generalization capability for this independent watershed.
The external validation results for the Oman case study revealed greater variability among the evaluated algorithms. AdaBoost again demonstrated the most robust performance, achieving the highest accuracy (83%) and an F1-score of 80%, confirming its superior transferability to a geographically distinct watershed. Logistic Regression also maintained satisfactory predictive capability, with an accuracy of 79% and an F1-score of 73%. Although Random Forest achieved perfect precision (100%), its recall decreased substantially to 17%, resulting in a relatively low F1-score (29%). This indicates that the model produced very few false-positive predictions but failed to identify a considerable proportion of the actual flooded locations. Similarly, Decision Tree Classifier, ANN, and SVM exhibited lower recall and F1-score values; these findings indicate that while AdaBoost and Logistic Regression maintained satisfactory predictive performance during the Oman validation, other algorithms exhibited substantial reductions in recall and F1-score, highlighting important differences in model transferability across independent watersheds.
Overall, the external validation demonstrates that ensemble-based approaches, particularly AdaBoost, provide the most reliable spatial transferability across independent arid watersheds. The observed reduction in model performance in the Oman case study, compared with Wadi Hodein, likely reflects differences in geological setting, terrain characteristics, and hydrological response between the training and validation basins. Nevertheless, the satisfactory performance of the best-performing models indicates that the selected topographic, hydrological, and rainfall-related predictors successfully capture the dominant controls on flood generation and support the applicability of the proposed framework for flood susceptibility assessment in ungauged arid environments.
The observed transferability of the proposed framework is consistent with recent studies highlighting the importance of external validation for assessing the robustness of machine learning models beyond their calibration domains [32]. Previous research has demonstrated that machine learning models can successfully generalize to independent flood events when the dominant hydrological processes are adequately represented, while also emphasizing that predictive performance is influenced by regional environmental variability [32]. Likewise, recent remote sensing-based flood assessment studies have shown that integrating satellite-derived environmental variables with advanced machine learning algorithms improves the reliability and operational applicability of flood susceptibility mapping across different geographical settings [21,23]. The present findings are in agreement with these observations, as the AdaBoost model consistently achieved the highest predictive performance in both the Wadi Hodein and Oman validation basins despite differences in geological and environmental conditions. This suggests that the selected conditioning factors effectively capture the dominant controls governing flash-flood generation in arid environments, while reinforcing the importance of external validation for evaluating model robustness and practical applicability.
The independent validation conducted in Oman provides valuable insight into the generalization capability of the developed models. While several algorithms maintained satisfactory predictive performance, others exhibited substantial reductions in accuracy compared with their performance in the calibration watersheds. These differences indicate that model transferability is influenced by regional variations in topography, hydrological response, rainfall characteristics, and environmental conditions, as well as by the inherent characteristics of individual machine learning algorithms. Consequently, the present findings should be interpreted as providing encouraging initial evidence of transferability under comparable environmental conditions, rather than demonstrating universal applicability. Additional validation across a broader range of watersheds and climatic settings is therefore recommended to further assess the robustness and generalization capability of the proposed framework.
Although the proposed machine learning models demonstrated strong performance in predicting flood inundation areas, several limitations should be acknowledged. First, the study relies primarily on satellite-derived inundation maps from a limited number of historical rainfall events, which may introduce uncertainties due to sensor resolution, cloud contamination, and potential classification errors in reference data. Second, the training dataset is constrained by the availability of labeled flood events, which may limit the ability of the models to fully capture the complex hydrological variability across different climatic and geomorphological conditions. Third, although the independent validation demonstrated encouraging generalization capability, the observed differences in model performance between Wadi Hodein and Oman indicate that transferability varies among machine learning algorithms and environmental settings. Therefore, additional testing across a broader range of watersheds remains necessary before the proposed framework can be considered broadly applicable. Further testing across a wider range of watersheds is still required to ensure stronger spatial generalization and robustness under extreme or rare hydrological conditions. Future research should focus on integrating multi-source data, including high-resolution remote sensing, real-time rainfall measurements, and physically based hydrological variables, to improve model reliability. In addition, emerging deep learning architectures, such as convolutional neural networks (CNNs) and hybrid physics-informed machine learning models, present promising directions for enhancing spatial feature extraction and improving predictive accuracy. The incorporation of real-time data assimilation and transfer learning techniques could further support the development of scalable, transferable flood prediction systems capable of supporting early warning systems and disaster risk reduction strategies in data-scarce regions.
The reported model performance should therefore be interpreted with caution, as the use of random data splitting may lead to optimistic estimates of accuracy. Future work could incorporate spatial cross-validation or block-based validation techniques to better account for spatial dependence.
5. Conclusions
This study demonstrated the potential of machine learning for accurately predicting flood inundation locations in data-scarce environments. By combining rainfall events with remote sensing imagery, two contrasting watersheds—Wadi El-Darb, which drains eastward toward Ras Gharib, and Wadi El-Allaqi, which drains westward into Lake Nasser—were used as case studies to construct robust training datasets. Fourteen flood-influencing factors derived from global datasets and DEM-based analyses were integrated as inputs, and six machine learning algorithms (RF, LR, SVM, DTC, AdaBoost, and ANN) were tested.
The results showed that Random Forest (RF) and Decision Tree Classifier (DTC) achieved the highest accuracy (94%), closely followed by ANN and AdaBoost (92%), while Logistic Regression (89%) and SVM (88%) provided slightly lower yet reliable performance. Evaluation metrics (accuracy, precision, recall, and F1-score) confirmed that ensemble-based and tree-based models offered more stable and consistent results across both case studies.
To further assess model transferability and robustness, the top-performing algorithms were validated on two independent, unseen rainfall events outside the training domain. The first was in Wadi Hodein, southeastern Egypt, which experienced a localized extreme rainfall event that produced significant surface runoff. The second was the major flash-flood event that occurred across parts of Oman from 14–15 April 2024, during which over 90 mm of rain was recorded in Al Mudhaibi (North Al Sharqiyah Governorate), causing widespread inundation across wadis such as Wadi Bani Khalid and Samad Al Shan. In both cases, satellite-derived flood extent maps were used as observational references.
The external validation results demonstrated that several models, particularly AdaBoost and Logistic Regression, maintained satisfactory predictive performance when applied to independent flood events outside the training watersheds, whereas other algorithms exhibited substantial reductions in recall and F1-score, especially during the Oman validation. These findings indicate that the proposed framework has promising potential for application in comparable hydrological settings, while also highlighting that model transferability may vary according to regional environmental and geomorphological characteristics.
Overall, this research demonstrates the effectiveness of machine learning techniques for flood hazard assessment in arid and semi-arid regions, particularly where hydrometeorological observations are limited. The proposed framework achieved reliable performance in the investigated case studies and showed encouraging results during independent external validation, suggesting its potential applicability to watersheds with comparable hydrological and environmental characteristics.
While the results are encouraging, the extension of the methodology to large-scale domains such as the Nile Basin or the Arabian Peninsula should be considered as a potential future research direction, as it requires further validation across a wider range of climatic and geomorphological conditions.
In principle, the framework could be integrated with rainfall forecast data to support near-real-time flood prediction, since rainfall represents the primary dynamic driver of flood generation, while most terrain-related factors remain relatively stable over time. However, such an operational implementation was not explored in the present study and remains a direction for future work.
These findings contribute to improving flood susceptibility mapping in data-limited arid and semi-arid regions and provide a comparative assessment of machine learning performance across different hydrological settings. The results also help to better understand the influence of key conditioning factors on flood occurrence and highlight the potential of satellite-based datasets for supporting data-driven flood hazard studies. Future work may further explore extensions toward operational applications and early warning systems.
The application of the trained models to independent case studies provides an initial indication of their potential applicability to new regions; however, further validation across diverse environments is required to fully assess model transferability.
Author Contributions
M.M. Conceptualization, methodology, data analysis, writing—original draft. D.A., M.A.H. and A.M.E. Supervision, review, and editing. All authors have read and agreed to the published version of the manuscript.
Funding
This research received no external funding.
Data Availability Statement
The data supporting the findings of this study are available from publicly accessible sources. Digital Elevation Model (DEM) data were obtained from the USGS EarthExplorer (https://earthexplorer.usgs.gov/, 3 July 2026). Precipitation data were obtained from the Climate Hazards Center InfraRed Precipitation with Station data (CHIRPS) (https://www.chc.ucsb.edu/data/chirps, 3 July 2026). Land use/land cover and soil datasets were obtained from the sources cited in the manuscript. The processed flood inventory, derived conditioning factors, and machine learning datasets generated during this study are available from the corresponding author upon reasonable request.
Conflicts of Interest
The authors declare that they have no known financial or personal relationships that could have appeared to influence the work reported in this paper. On behalf of all authors, the corresponding author confirms that there is no conflict of interest.
References
- Ward, P.J.; Jongman, B.; Aerts, J.C.J.H.; Bates, P.D.; Botzen, W.J.W.; Loaiza, A.D.; Hallegatte, S.; Kind, J.M.; Kwadijk, J.; Scussolini, P.; et al. A global framework for future costs and benefits of river-flood protection in urban areas. Nat. Clim. Change 2017, 7, 642–646. [Google Scholar] [CrossRef] [Scilit]
- Woodruff, J.D.; Irish, J.L.; Camargo, S.J. Coastal flooding by tropical cyclones and sea-level rise. Nature 2013, 504, 44–52. [Google Scholar] [CrossRef] [Scilit] [PubMed]
- Lian, J.; Xu, H.; Xu, K.; Ma, C. Optimal management of the flooding risk caused by the joint occurrence of extreme rainfall and high tide level in a coastal city. Nat. Hazards 2017, 89, 183–200. [Google Scholar] [CrossRef] [Scilit]
- Tellman, B.; Sullivan, J.A.; Kuhn, C.; Kettner, A.J.; Doyle, C.S.; Brakenridge, G.R.; Erickson, T.A.; Slayback, D.A. Satellite imaging reveals increased proportion of population exposed to floods. Nature 2021, 596, 80–86. [Google Scholar] [CrossRef] [Scilit] [PubMed]
- Panhalkar, S.S.; Jarag, A.P. Flood risk assessment of Panchganga River (Kolhapur district, Maharashtra) using GIS-based multicriteria decision technique. Curr. Sci. 2017, 112, 785–793. [Google Scholar] [CrossRef] [Scilit]
- Trenberth, K.E. Changes in precipitation with climate change. Clim. Res. 2011, 47, 123–138. [Google Scholar] [CrossRef] [Scilit]
- Alfieri, L.; Bisselink, B.; Dottori, F.; Naumann, G.; de Roo, A.; Salamon, P.; Wyser, K.; Feyen, L. Global projections of river flood risk in a warmer world. Earths Future 2017, 5, 171–182. [Google Scholar] [CrossRef] [Scilit]
- Mosavi, A.; Ozturk, P.; Chau, K.-W. Flood Prediction Using Machine Learning Models: Literature Review. Water 2018, 10, 1536. [Google Scholar] [CrossRef] [Scilit]
- Costache, R. Flash-flood Potential Index mapping using weights of evidence, decision Trees models and their novel hybrid integration. Stoch. Environ. Res. Risk Assess. 2019, 33, 1375–1402. [Google Scholar] [CrossRef] [Scilit]
- Benito, G.; Thorndycraft, V.R. Systematic, Palaeoflood and Historical Data for the Improvement of Flood Risk Estimation: Methodological Guidelines; Consejo Superior de Investigaciones Científicas, Centro de Ciencias Medioambientales: Madrid, Spain, 2004. [Google Scholar]
- Apel, H.; Thieken, A.H.; Merz, B.; Blöschl, G. Flood risk assessment and associated uncertainty. Nat. Hazards Earth Syst. Sci. 2004, 4, 295–308. [Google Scholar] [CrossRef] [Scilit]
- Burke, J.J.; Pricope, N.G.; Blum, J. Thermal imagery-derived surface inundation modeling to assess flood risk in a flood-pulsed Savannah watershed in Botswana and Namibia. Remote Sens. 2016, 8, 676. [Google Scholar] [CrossRef] [Scilit]
- Donnelly, J.; Abolfathi, S.; Pearson, J.; Chatrabgoun, O.; Daneshkhah, A. Gaussian process emulation of spatio-temporal outputs of a 2D inland flood model. Water Res. 2022, 225, 119100. [Google Scholar] [CrossRef] [Scilit] [PubMed]
- Li, G.; Shao, W.; Su, X.; Li, Y.; Zhang, Y.; Song, T. Urban Flood Hazard Assessment Based on Machine Learning Model. Water Resour. Manag. 2025, 39, 1953–1970. [Google Scholar] [CrossRef] [Scilit]
- Sushanth, K.; Mishra, A.; Mukhopadhyay, P.; Singh, R. Real-time streamflow forecasting in a reservoir-regulated river basin using explainable machine learning and conceptual reservoir module. Sci. Total Environ. 2023, 861, 160680. [Google Scholar] [CrossRef] [Scilit] [PubMed]
- Lee, S.; Kim, J.C.; Jung, H.S.; Lee, M.J.; Lee, S. Spatial prediction of flood susceptibility using random-forest and boosted-tree models in Seoul metropolitan city, Korea. Geomat. Nat. Hazards Risk 2017, 8, 1185–1203. [Google Scholar] [CrossRef] [Scilit]
- Tehrany, M.S.; Pradhan, B.; Jebur, M.N. Spatial prediction of flood susceptible areas using rule based decision tree (DT) and a novel ensemble bivariate and multivariate statistical models in GIS. J. Hydrol. 2013, 504, 69–79. [Google Scholar] [CrossRef] [Scilit]
- Yin, G.; Yoshikane, T.; Yamamoto, K.; Kubota, T.; Yoshimura, K. A support vector machine-based method for improving real-time hourly precipitation forecast in Japan. J. Hydrol. 2022, 612, 128125. [Google Scholar] [CrossRef] [Scilit]
- Razavi-Termeh, S.V.; Sadeghi-Niaraki, A.; Jelokhani-Niaraki, M.; Choi, S.-M. Flood susceptibility mapping using optimized deep learning models: A non-structural framework. Appl. Water Sci. 2025, 15, 208. [Google Scholar] [CrossRef] [Scilit]
- Zhao, G.; Pang, B.; Xu, Z.; Yue, J.; Tu, T. Mapping flood susceptibility in mountainous areas on a national scale in China. Sci. Total Environ. 2018, 615, 1133–1142. [Google Scholar] [CrossRef] [Scilit] [PubMed]
- Ahmad, M.N.; Shao, Z.; Javed, A. Mapping impervious surface area increase and urban pluvial flooding using Sentinel Application Platform (SNAP) and remote sensing data. Environ. Sci. Pollut. Res. Int. 2023, 30, 125741–125758. [Google Scholar] [CrossRef] [Scilit] [PubMed]
- Wedajo, G.K.; Lemma, T.D.; Fufa, T.; Gamba, P. Integrating Satellite Images and Machine Learning for Flood Prediction and Susceptibility Mapping for the Case of Amibara, Awash Basin, Ethiopia. Remote Sens. 2024, 16, 2163. [Google Scholar] [CrossRef] [Scilit]
- Li, Z.; Tian, J.; Zhu, Y.; Chen, D.; Ji, Q.; Sun, D. A Study on Flood Susceptibility Mapping in the Poyang Lake Basin Based on Machine Learning Model Comparison and SHapley Additive exPlanations Interpretation. Water 2025, 17, 2955. [Google Scholar] [CrossRef] [Scilit]
- Tien Bui, D.; Hoang, N.D.; Martínez-Álvarez, F.; Ngo, P.-T.T.; Hoa, P.V.; Pham, T.D.; Samui, P.; Costache, R. A novel deep learning neural network approach for predicting flash flood susceptibility: A case study at a high frequency tropical storm area. Sci. Total Environ. 2020, 701, 134413. [Google Scholar] [CrossRef] [Scilit] [PubMed]
- Shahabi, H.; Shirzadi, A.; Ghaderi, K.; Omidvar, E.; Al-Ansari, N.; Clague, J.J.; Geertsema, M.; Khosravi, K.; Amini, A.; Bahrami, S.; et al. Flood detection and susceptibility mapping using Sentinel-1 remote sensing data and a machine learning approach: Hybrid intelligence of bagging ensemble based on K-Nearest Neighbor classifier. Remote Sens. 2020, 12, 266. [Google Scholar] [CrossRef] [Scilit]
- Costache, R.; Pham, Q.B.; Sharifi, E.; Linh, N.T.T.; Abba, S.; Vojtek, M.; Vojteková, J.; Nhi, P.T.T.; Khoi, D.N. Flash-flood susceptibility assessment using multi-criteria decision making and machine learning supported by remote sensing and GIS techniques. Remote Sens. 2020, 12, 106. [Google Scholar] [CrossRef] [Scilit]
- Band, S.S.; Janizadeh, S.; Pal, S.C.; Saha, A.; Chakrabortty, R.; Melesse, A.M.; Mosavi, A. Flash flood susceptibility modeling using new approaches of hybrid and ensemble tree-based machine learning algorithms. Remote Sens. 2020, 12, 3568. [Google Scholar] [CrossRef] [Scilit]
- La Cava, W.; Bauer, C.; Moore, J.H.; Pendergrass, S.A. Interpretation of machine learning predictions for patient outcomes in electronic health records. arXiv 2019, arXiv:1903.12074. [Google Scholar] [CrossRef] [Scilit]
- Pradhan, B. Flood susceptible mapping and risk area delineation using logistic regression, GIS and remote sensing. J. Spat. Hydrol. 2009, 9, 1–18. [Google Scholar]
- Günther, F.; Fritsch, S. neuralnet: Training of Neural Networks. R J. 2010, 2, 30–38. Available online: https://journal.r-project.org/articles/RJ-2010-006/index.html (accessed on 3 July 2026). [CrossRef] [Scilit]
- Zhang, Z.; Laakso, T.; Wang, Z.; Pulkkinen, S.; Ahopelto, S.; Virrantaus, K.; Li, Y.; Cai, X.; Zhang, C.; Vahala, R.; et al. Comparative study of AI-based methods-Application of analyzing inflow and infiltration in sanitary sewer subcatchments. Sustainability 2020, 12, 6254. [Google Scholar] [CrossRef] [Scilit]
- Pakdehi, M.; Ahmadisharaf, E.; Nazari, B.; Cho, E. Transferability of machine-learning-based modeling frameworks across flood events for hindcasting maximum river water depths in coastal watersheds. Nat. Hazards Earth Syst. Sci. 2024, 24, 3537–3559. [Google Scholar] [CrossRef] [Scilit]
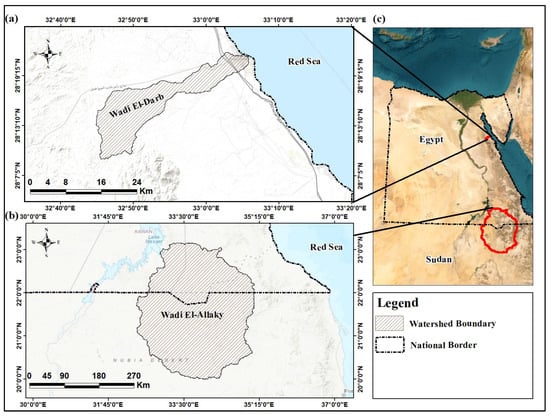
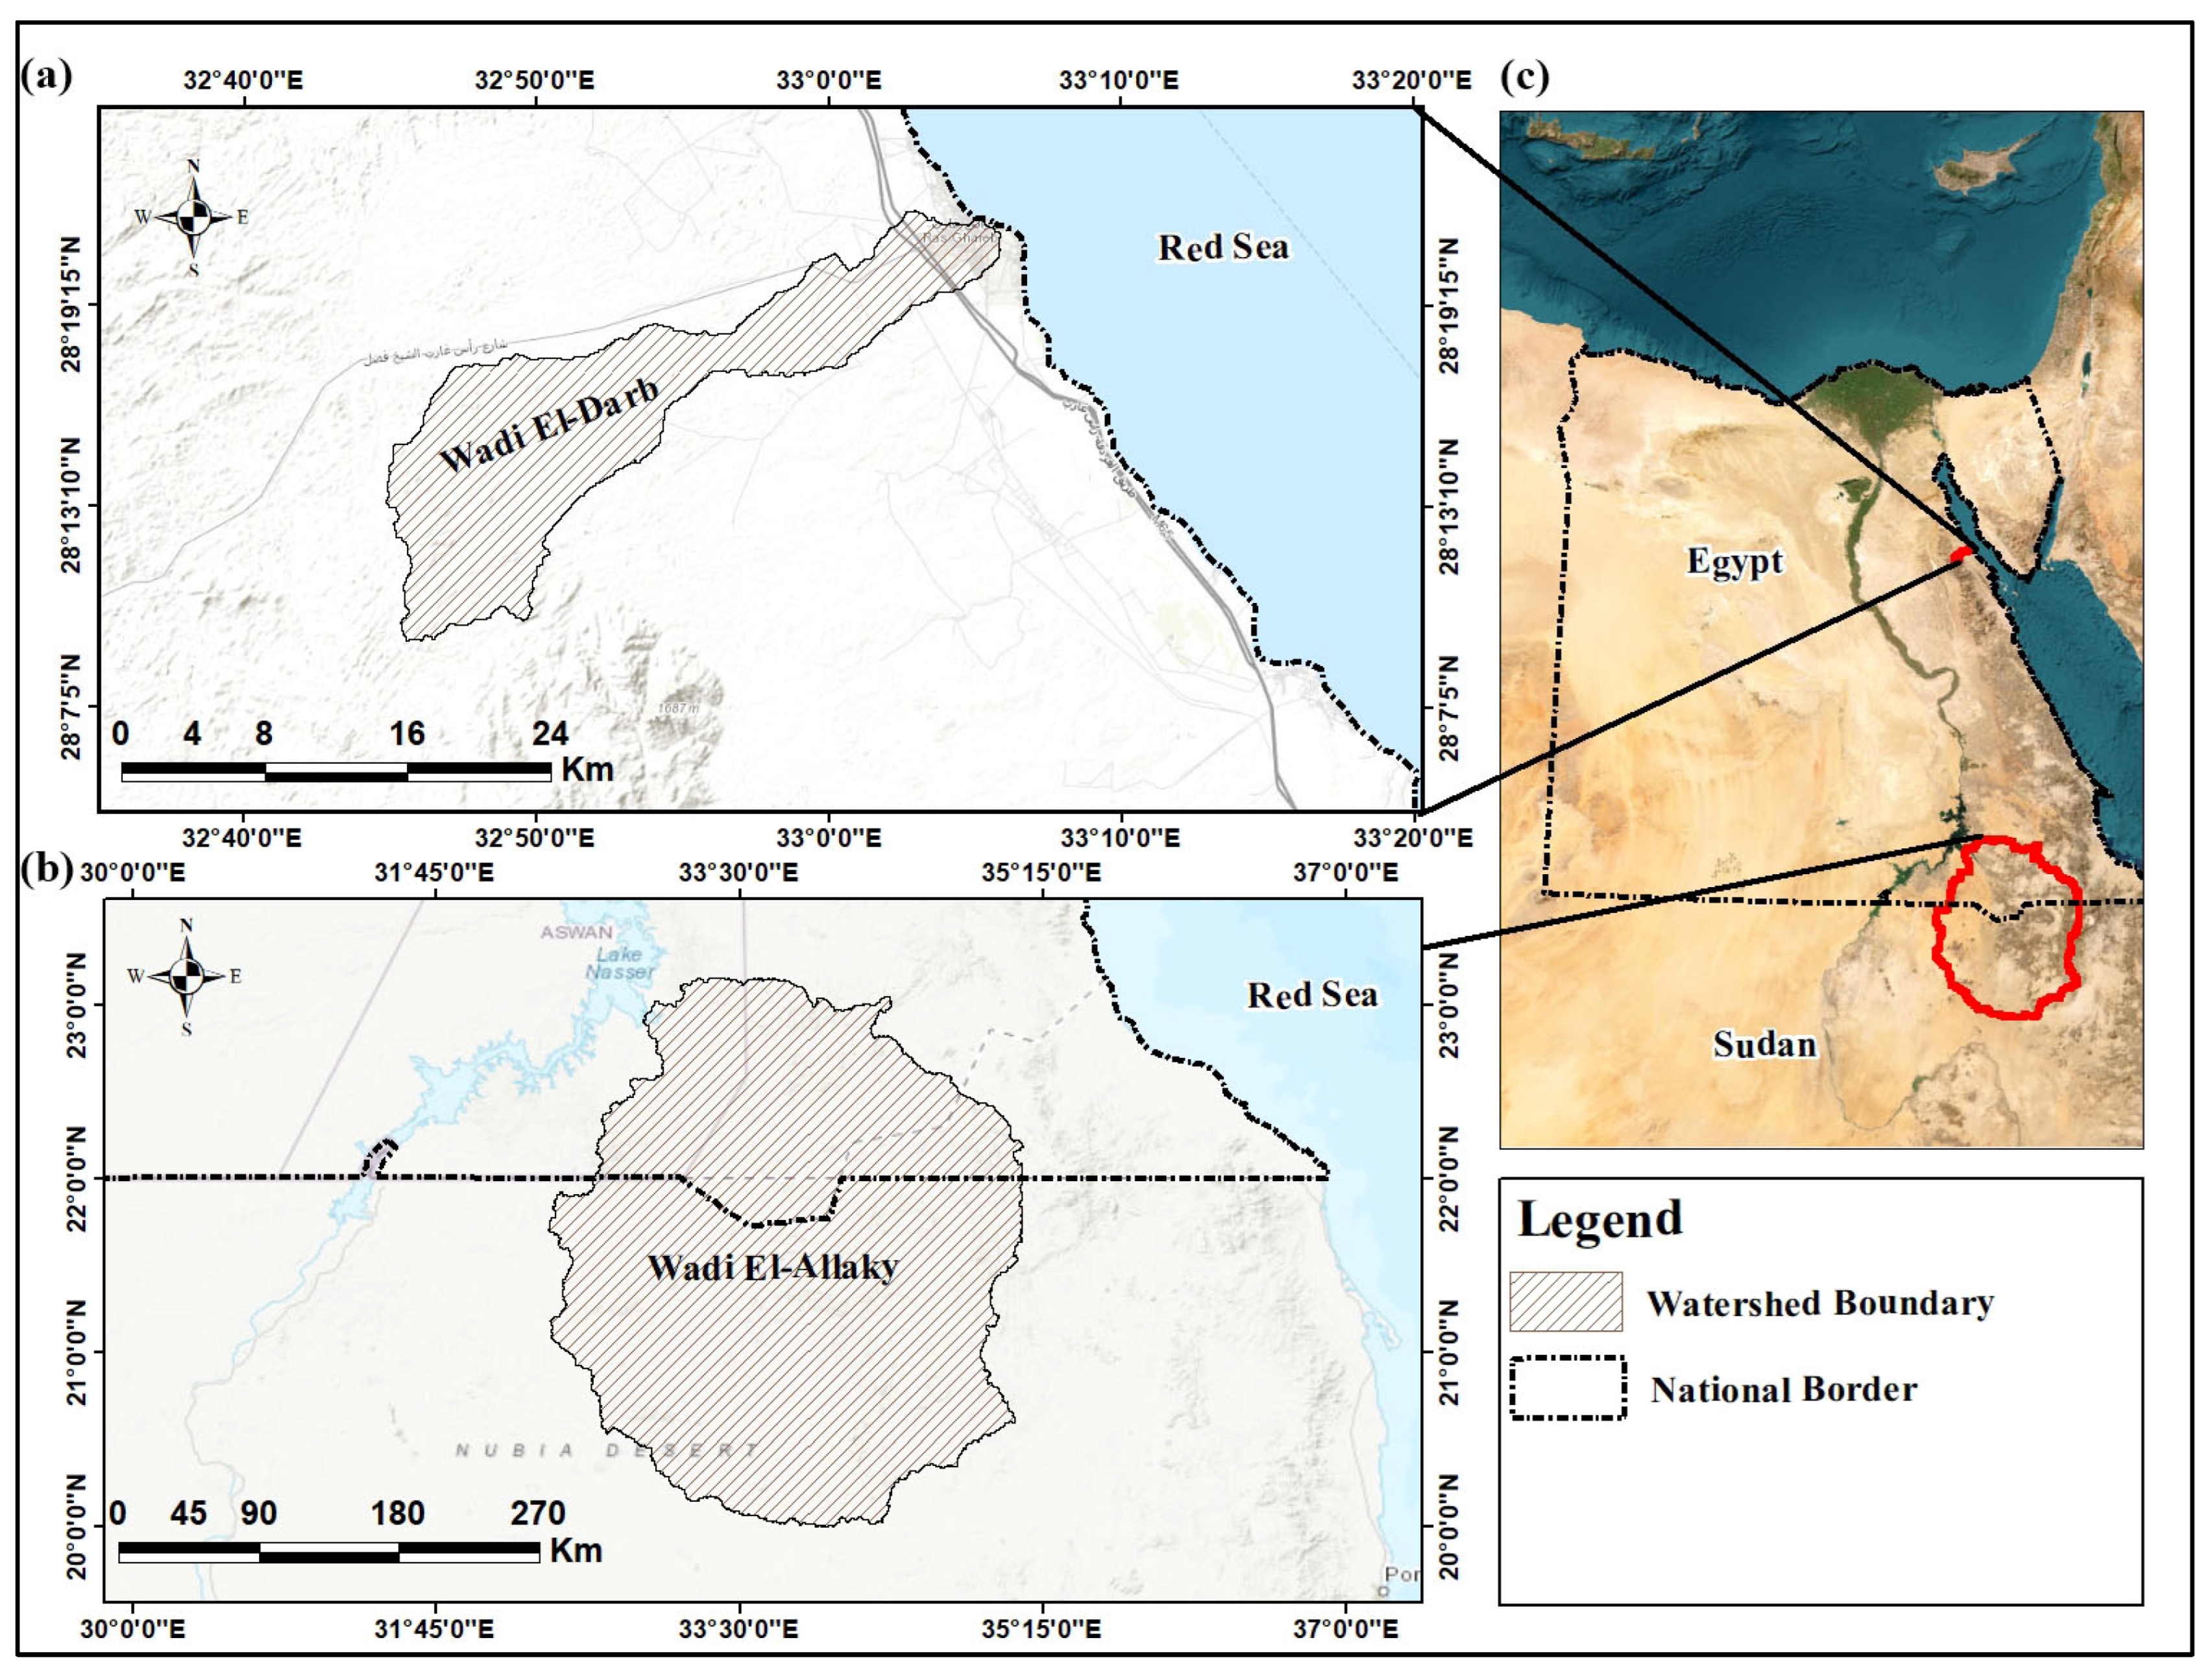
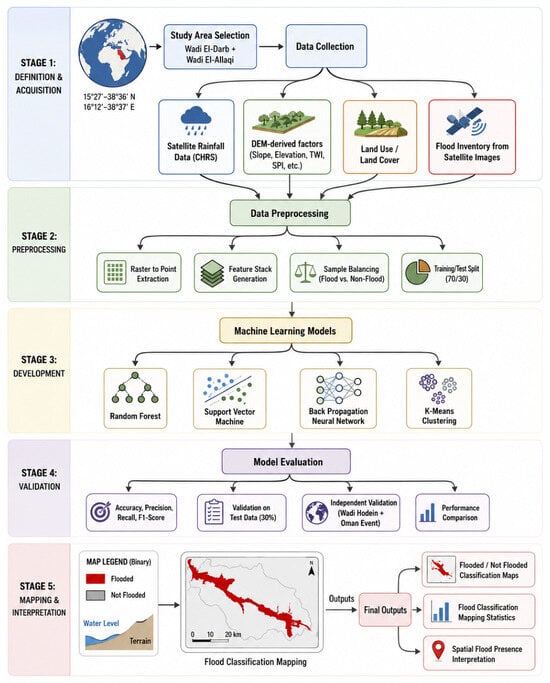
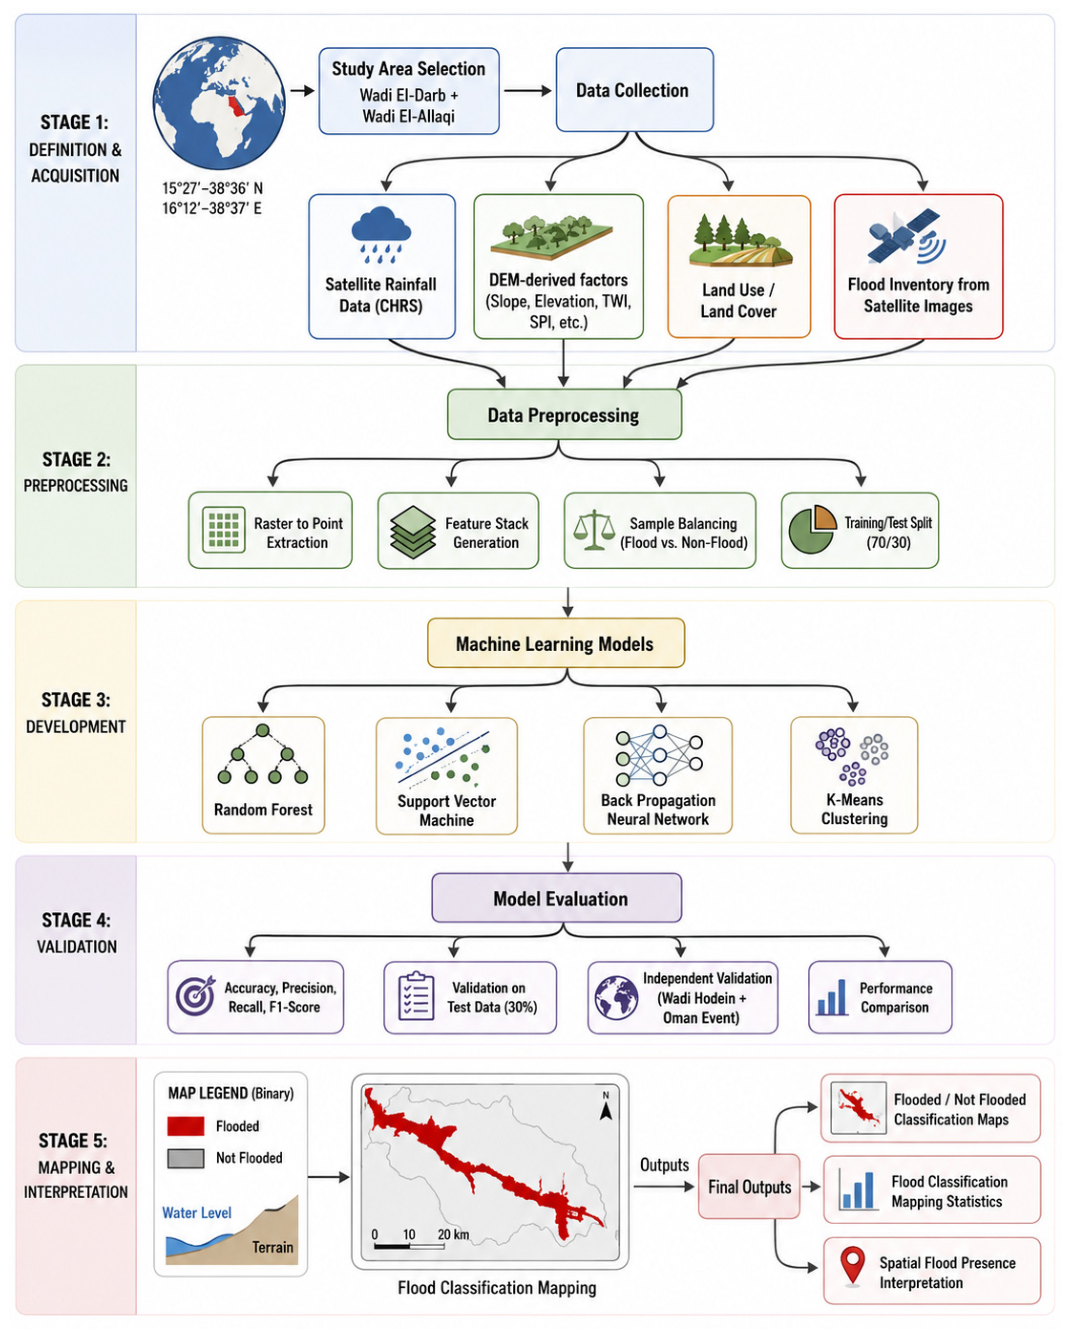
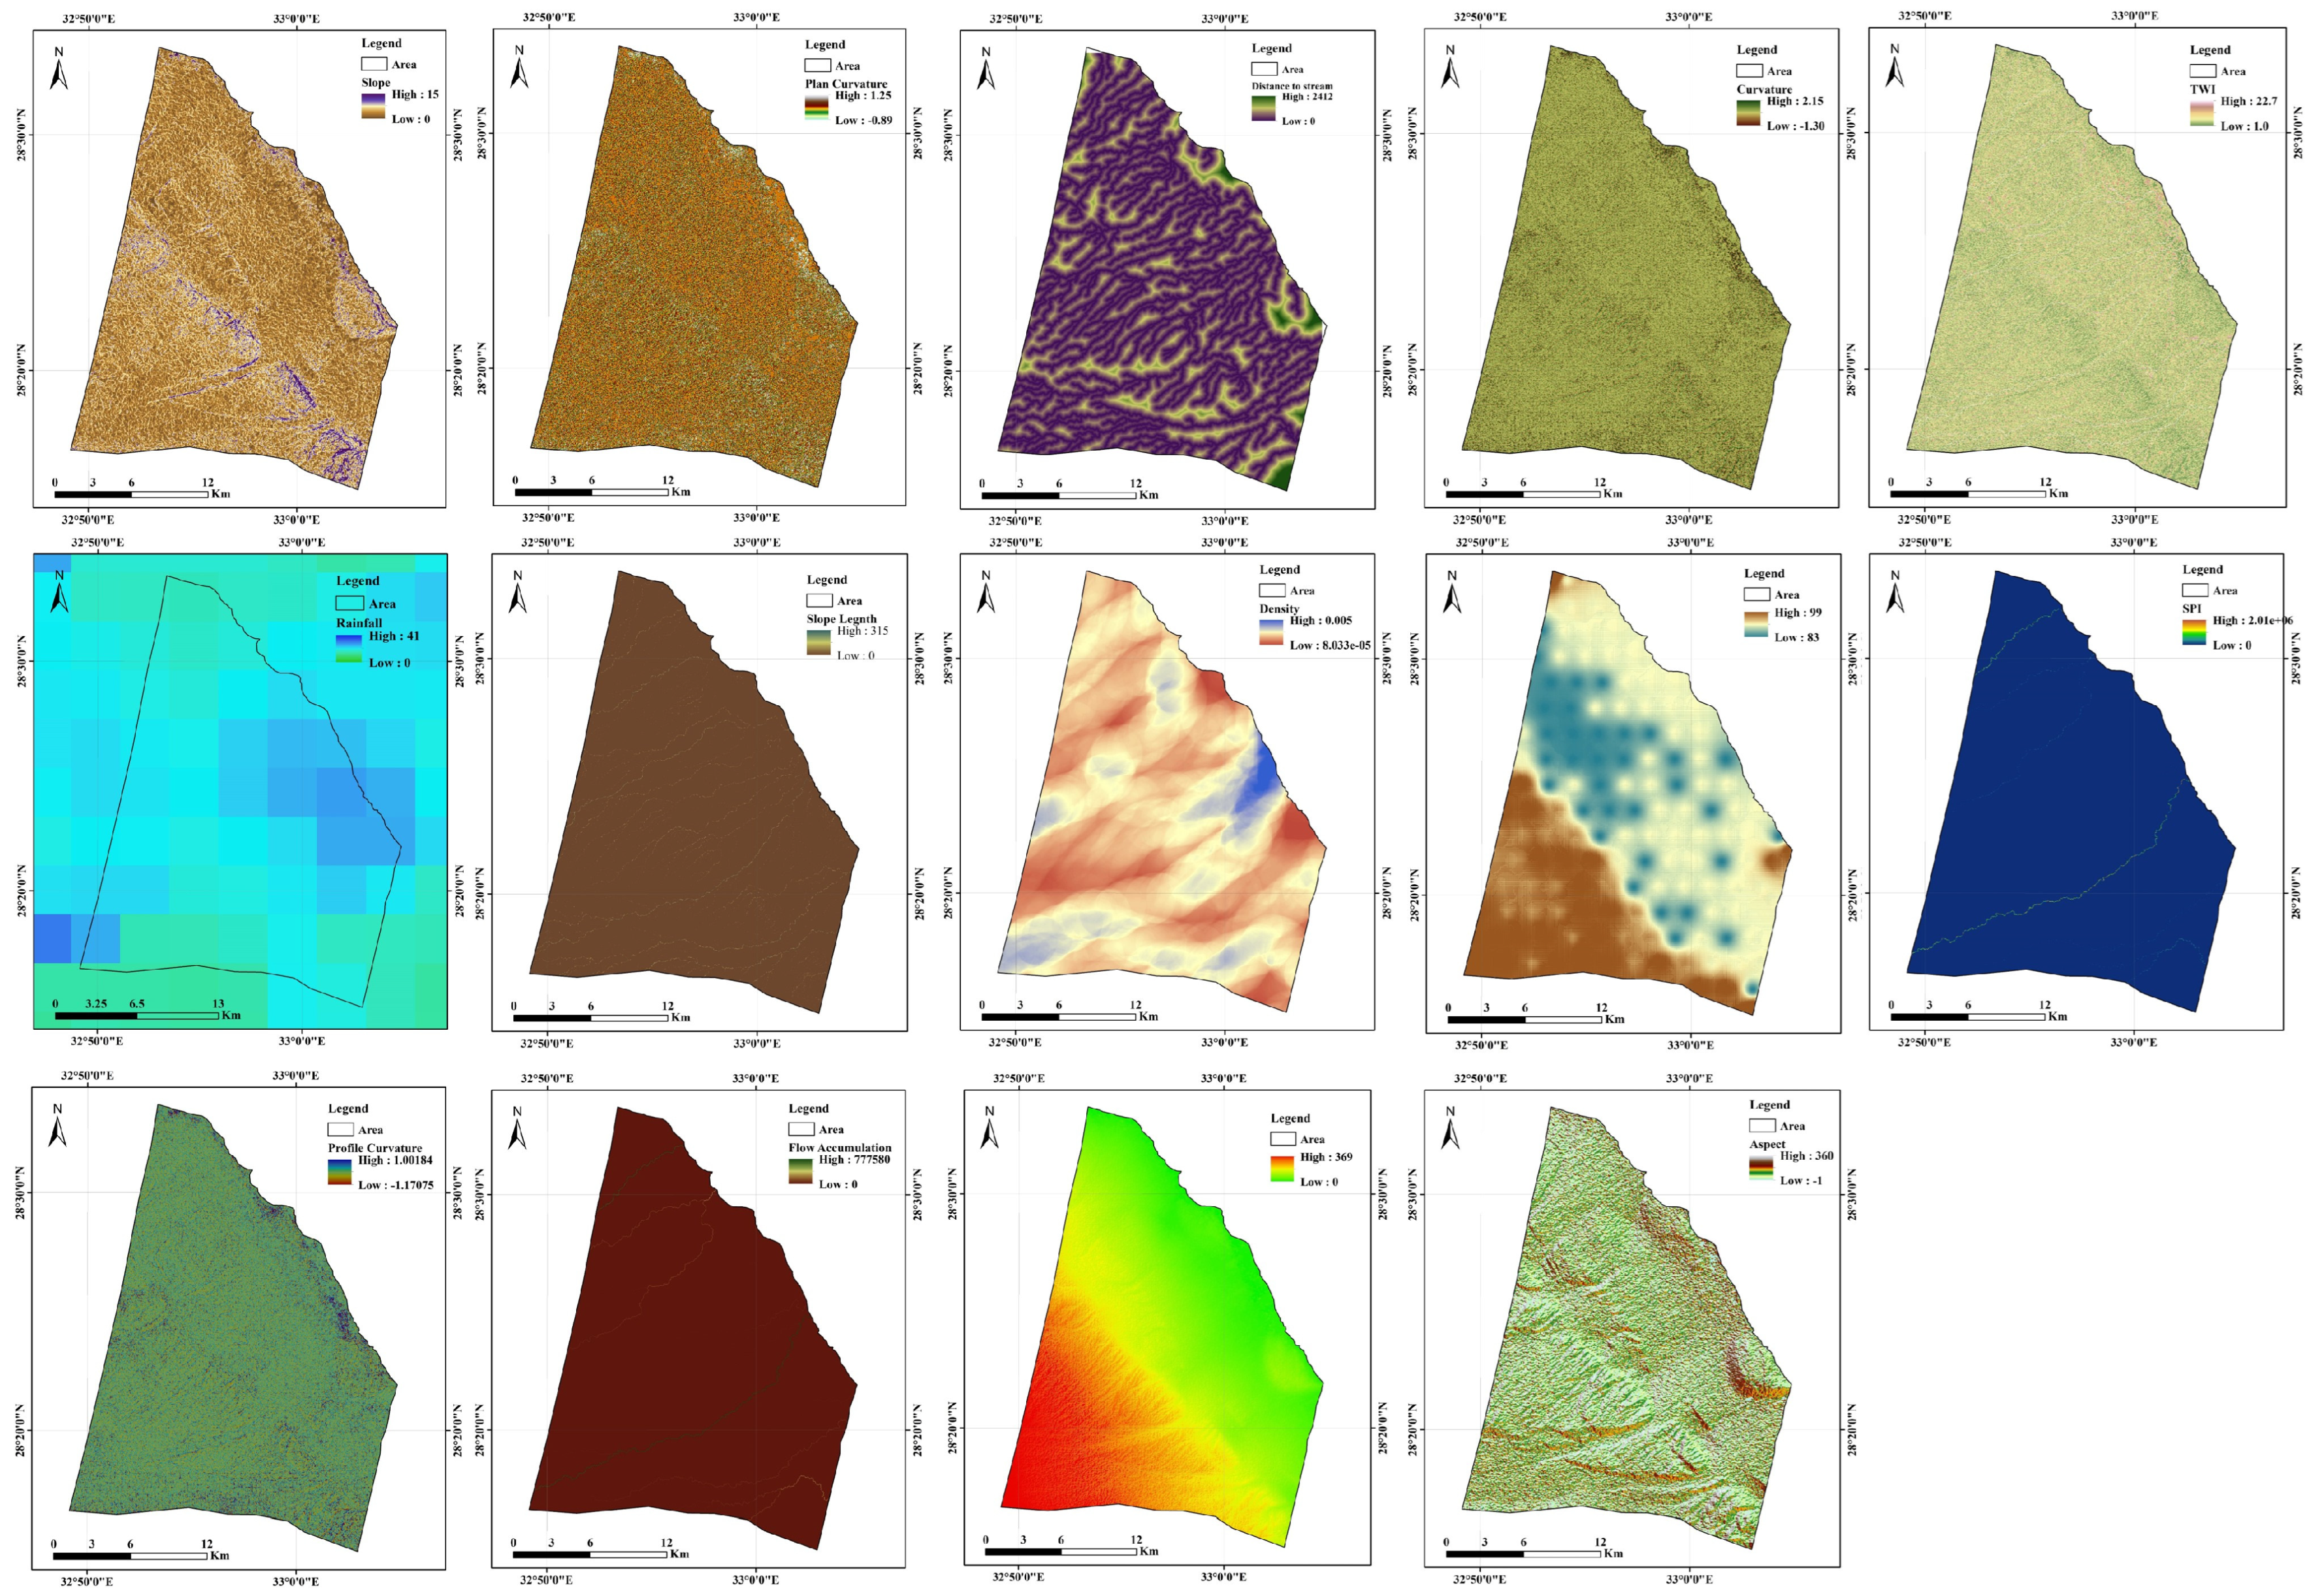
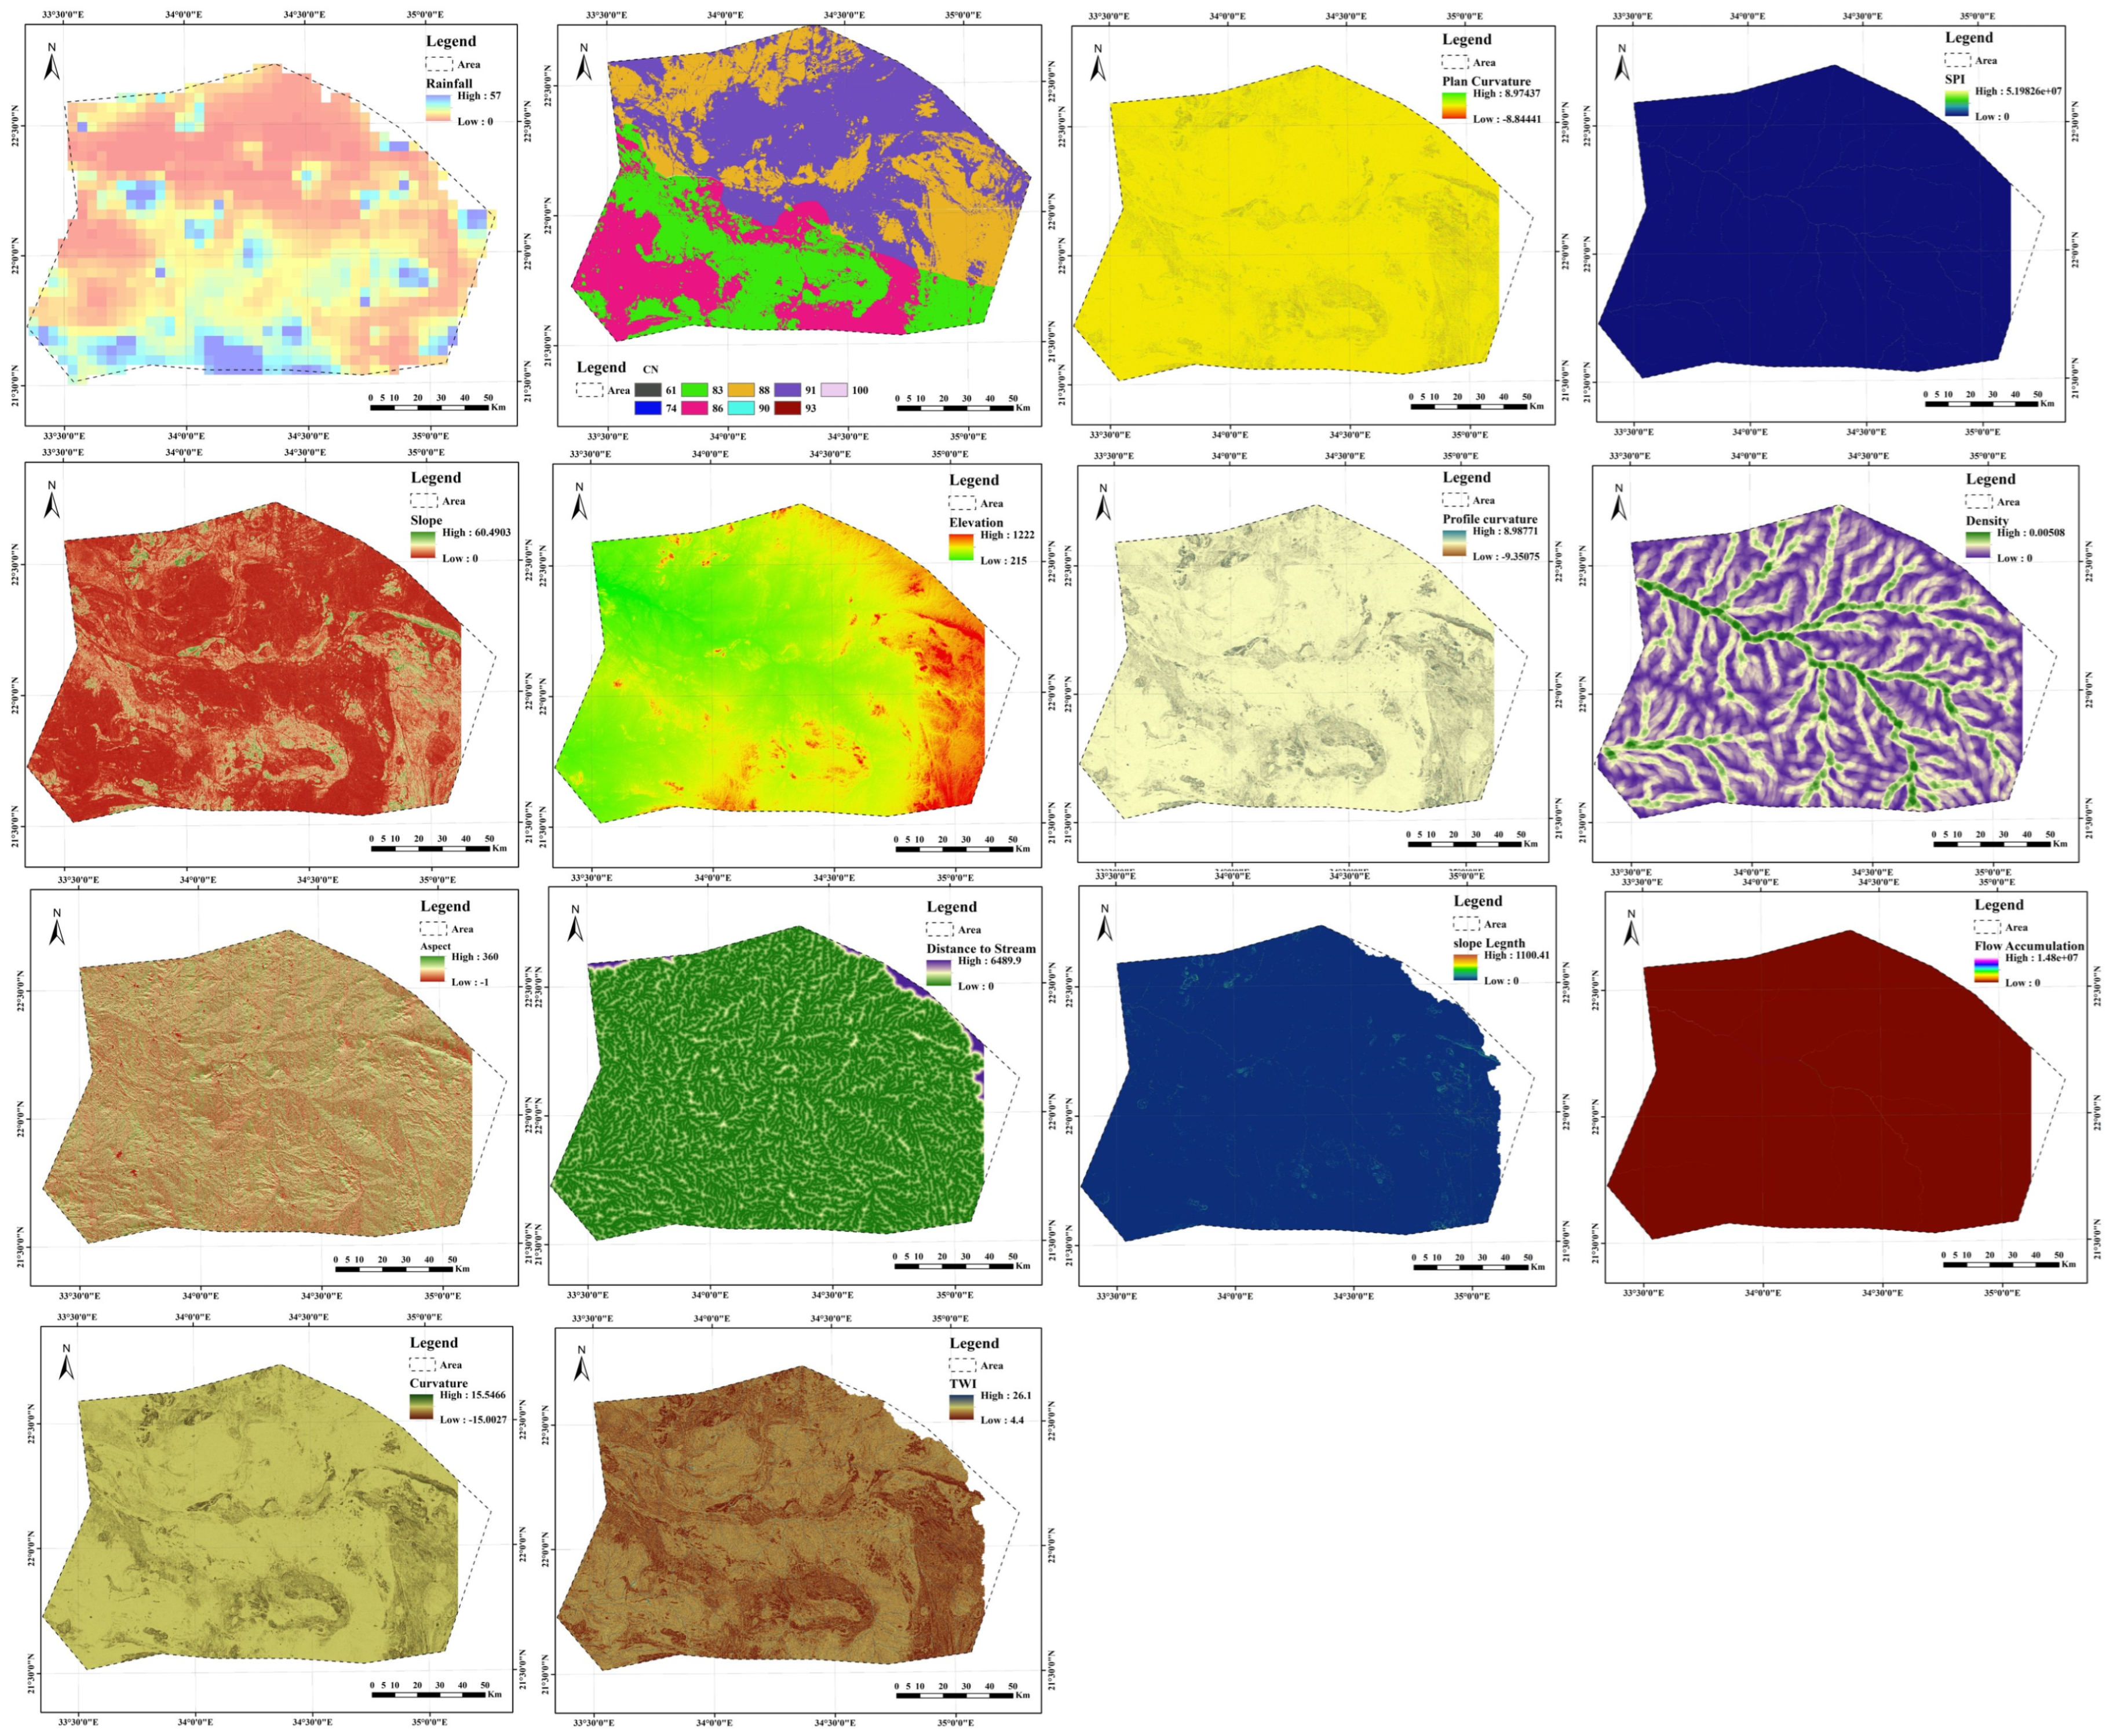
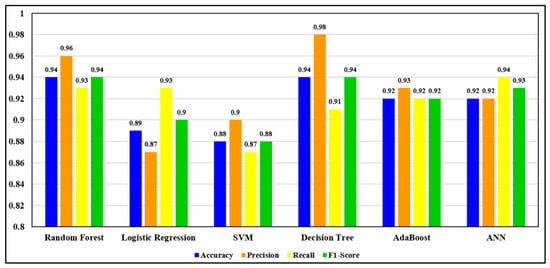
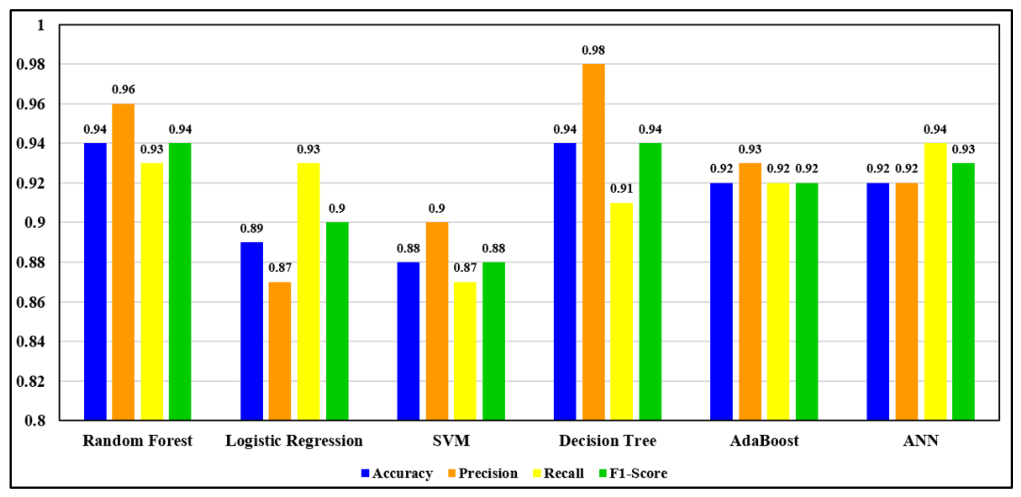
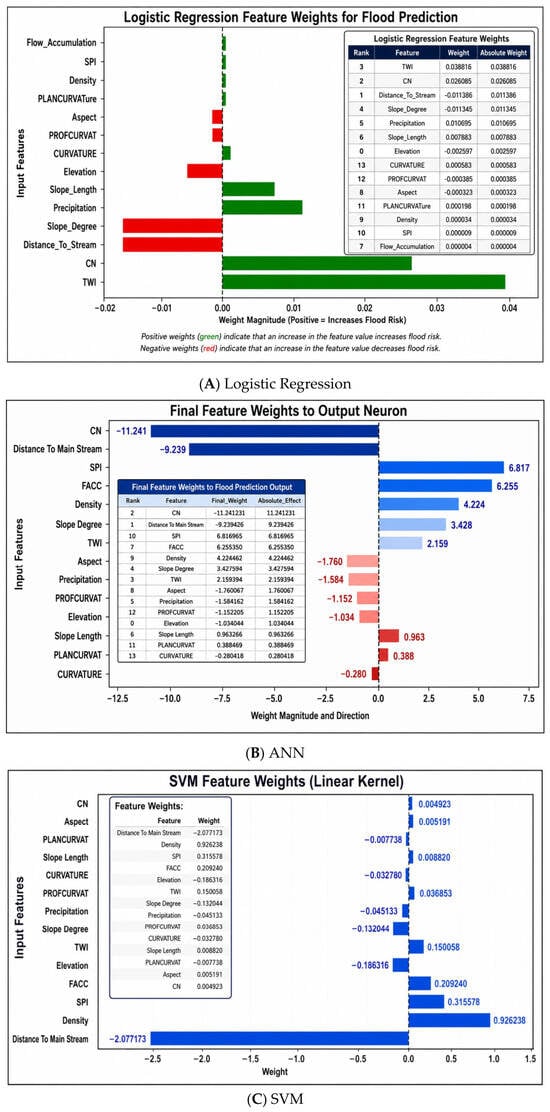
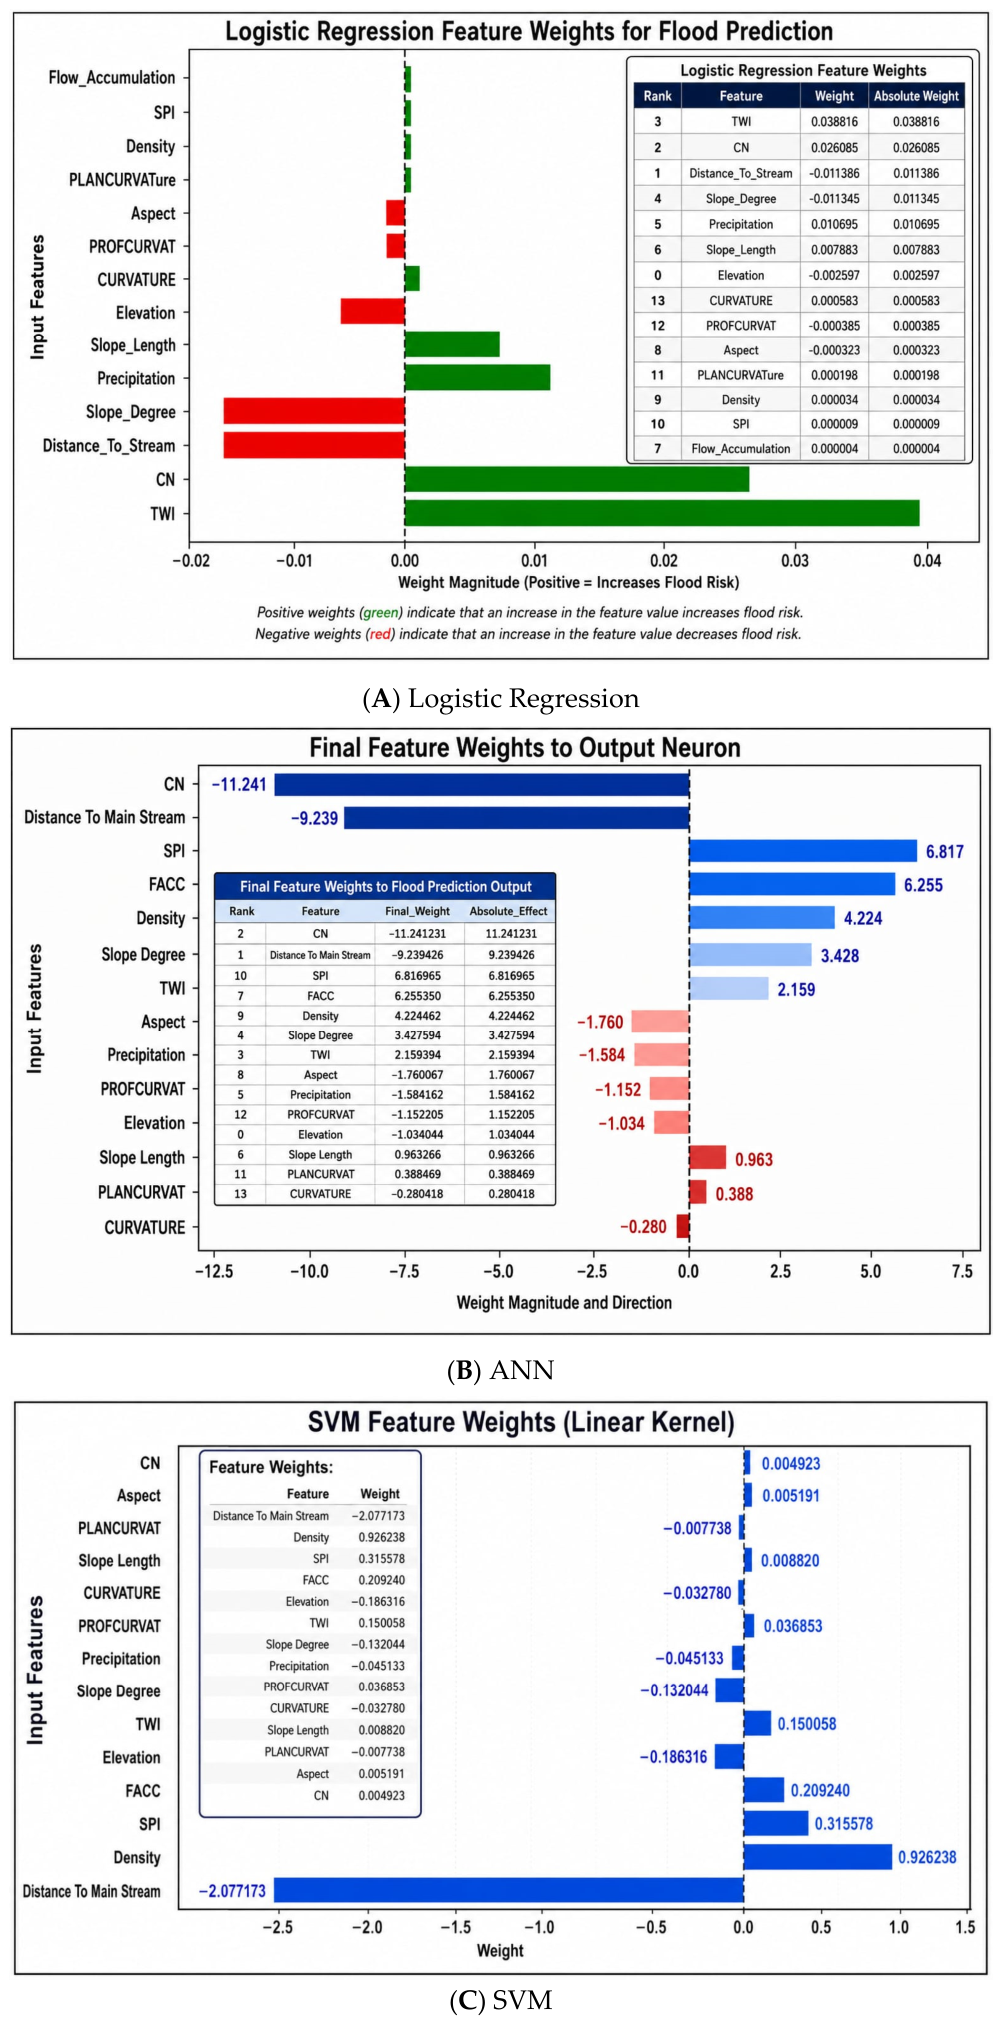
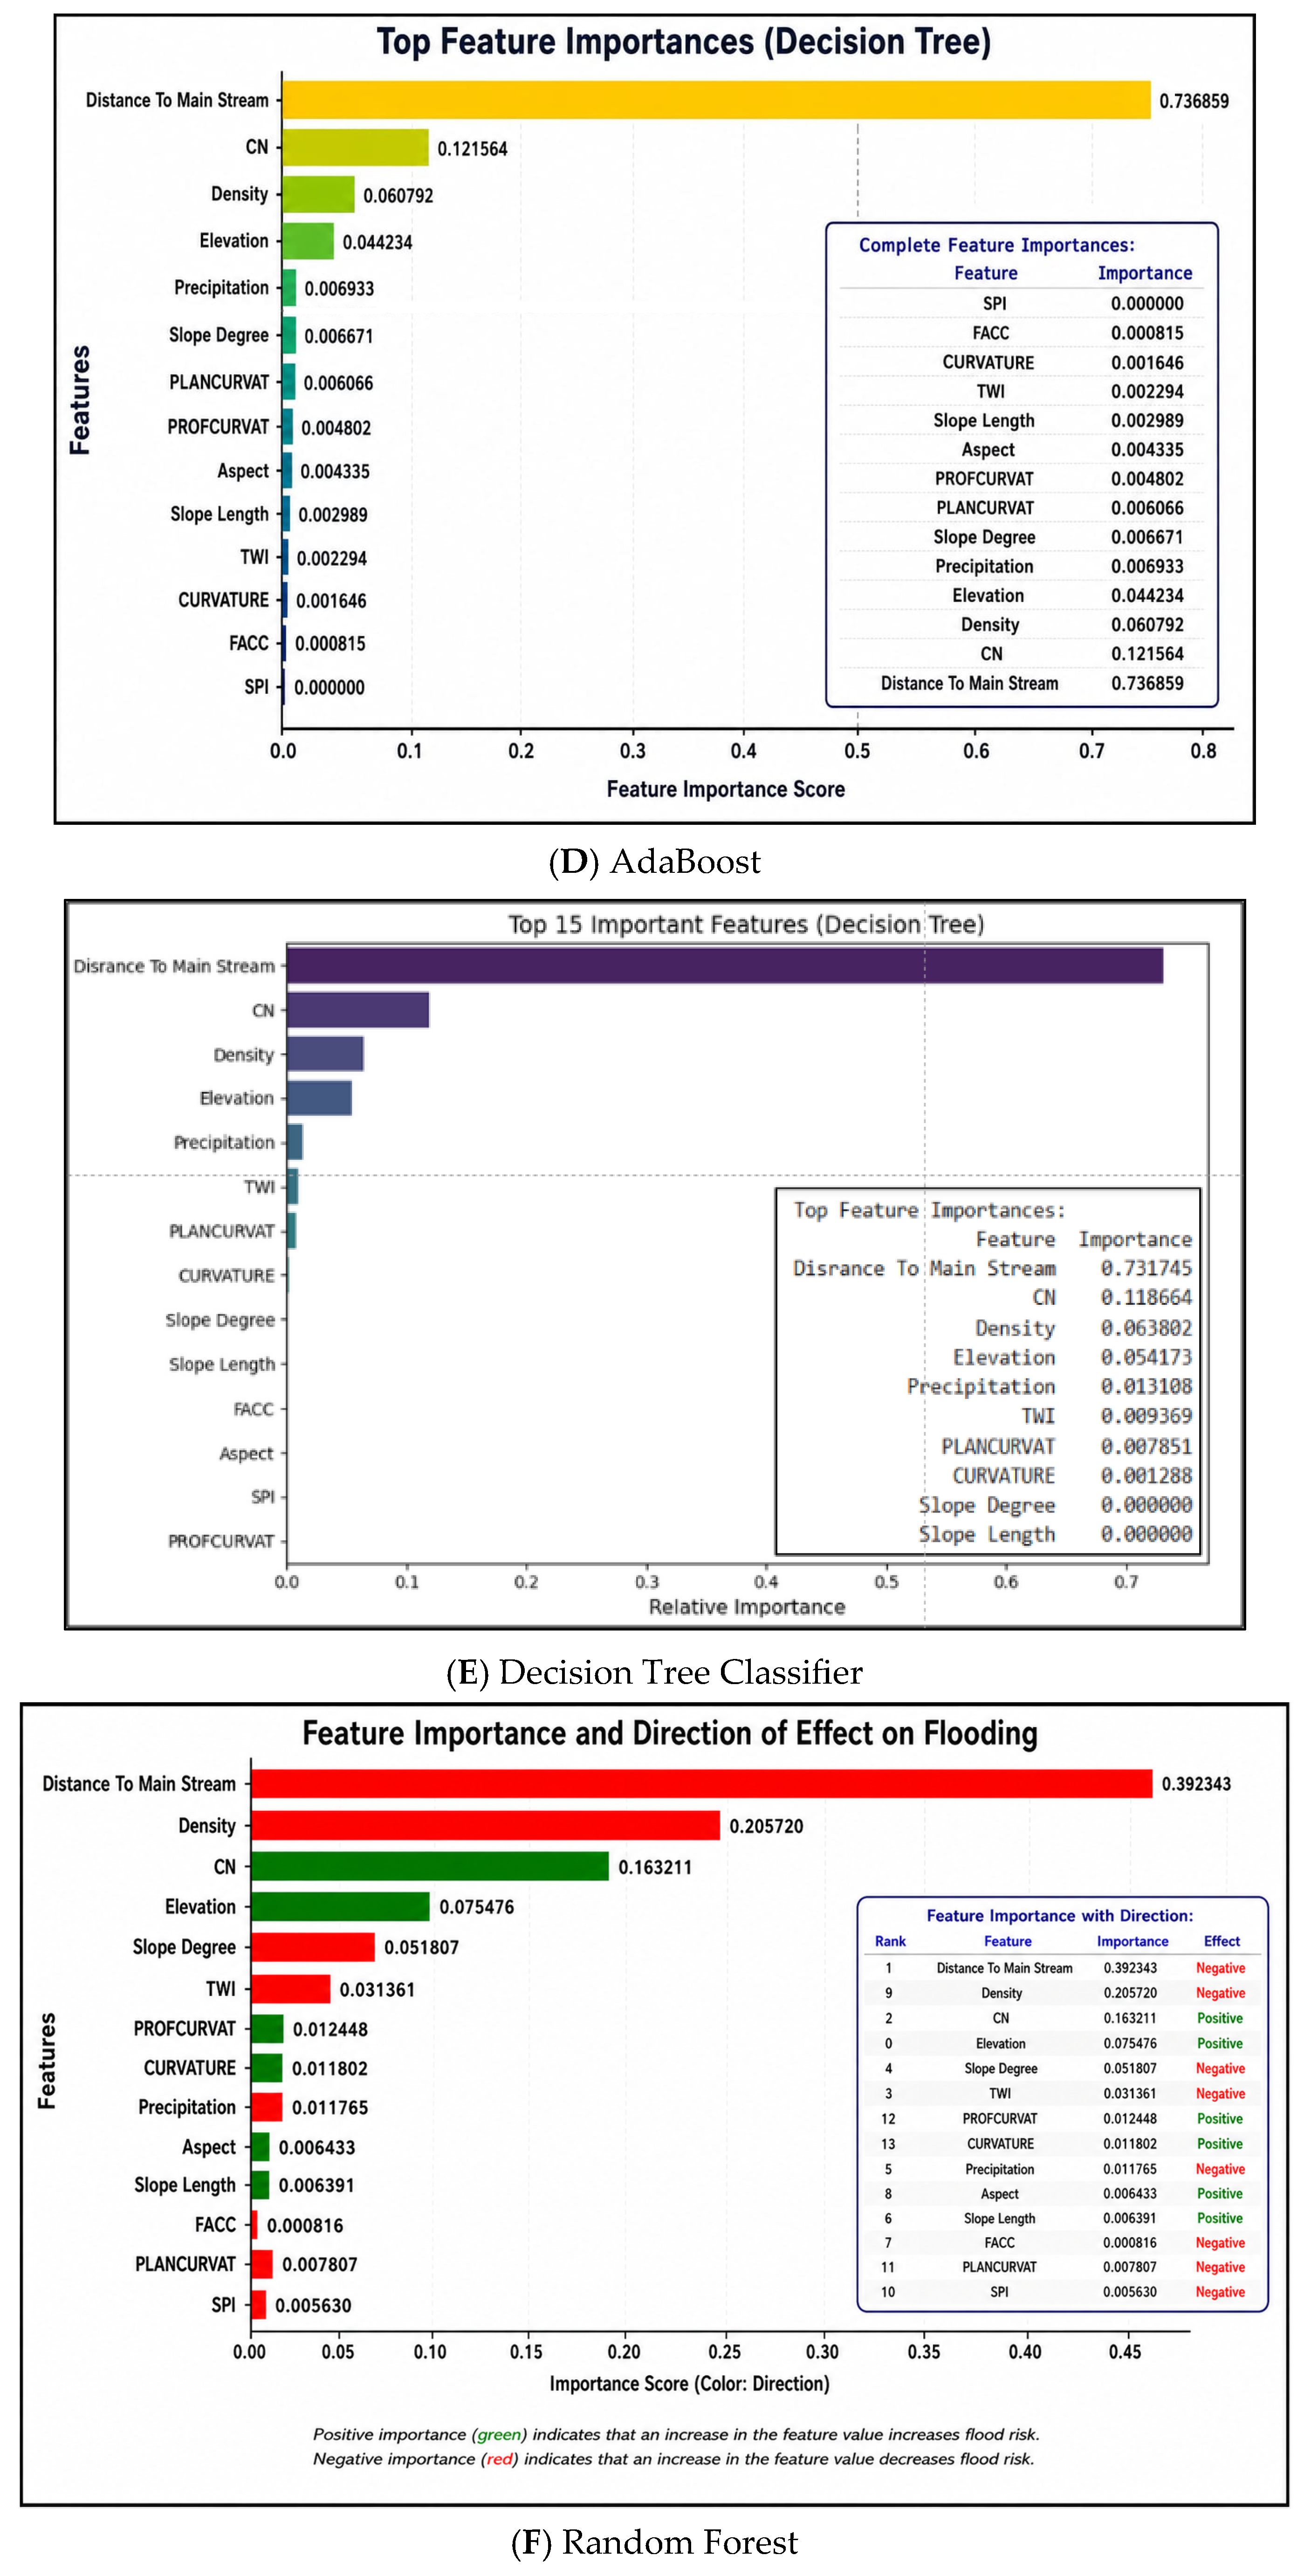
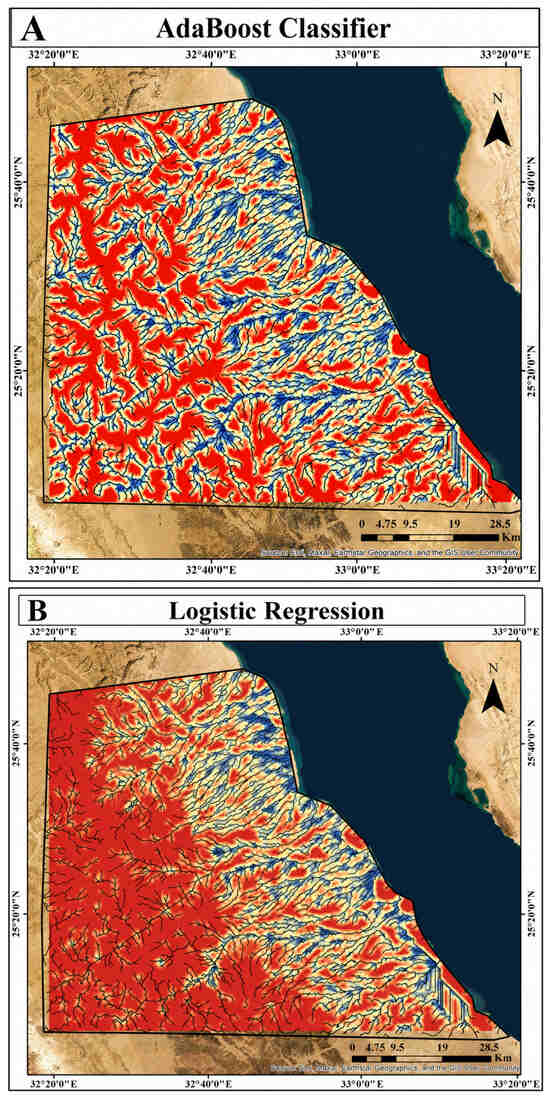
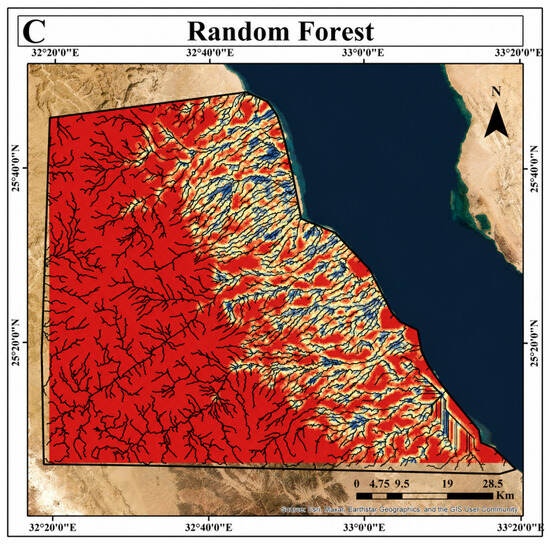
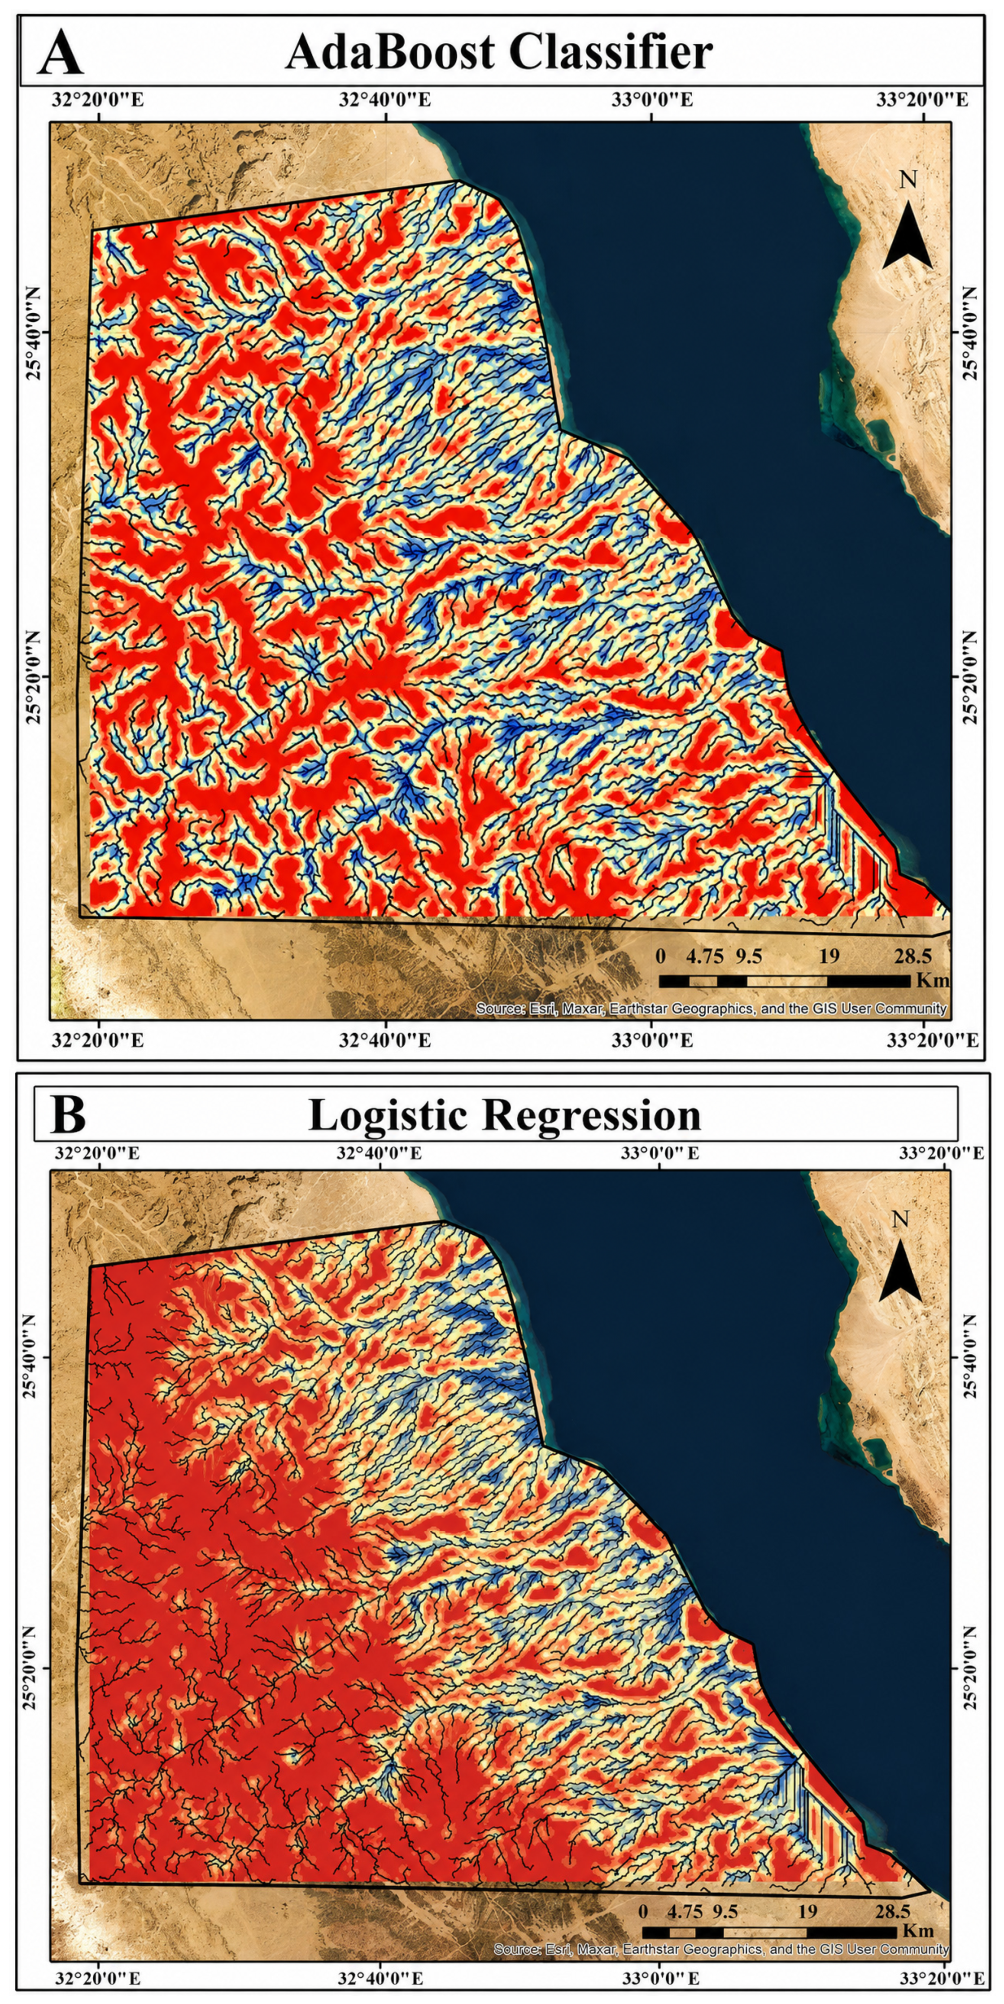
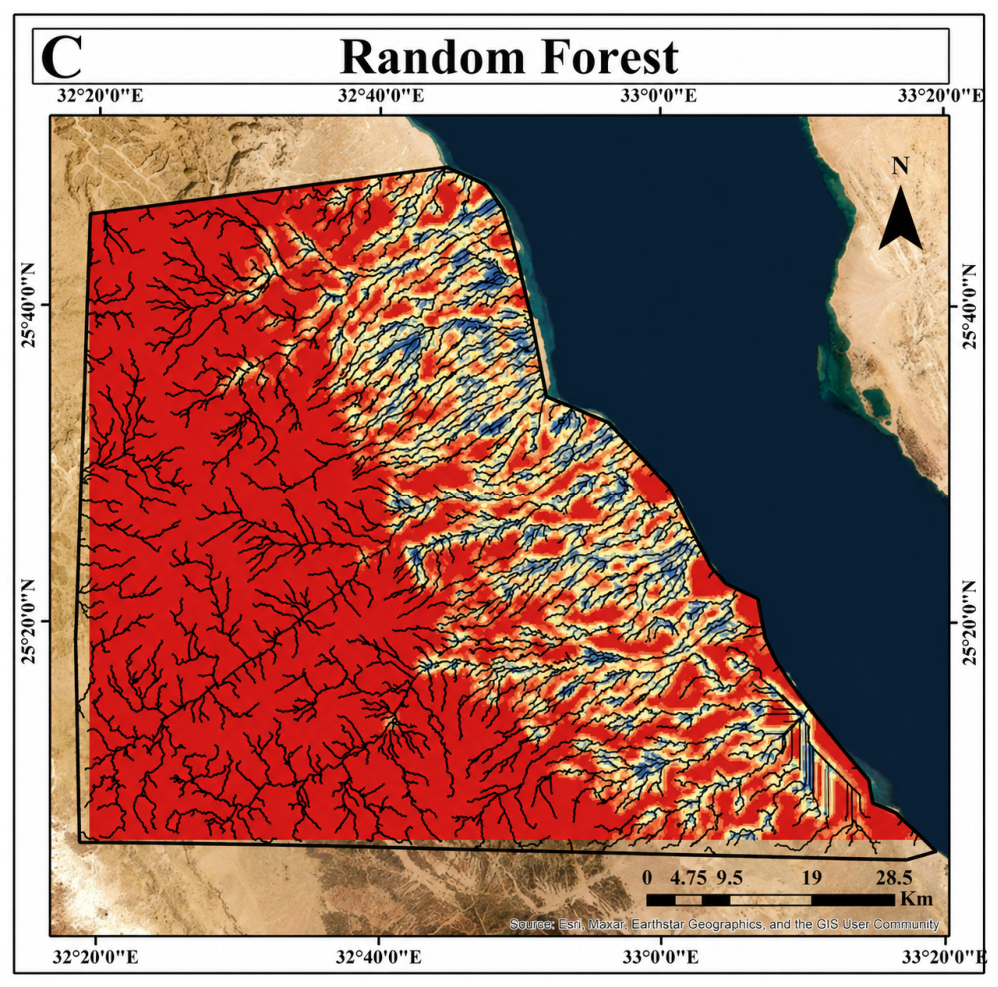
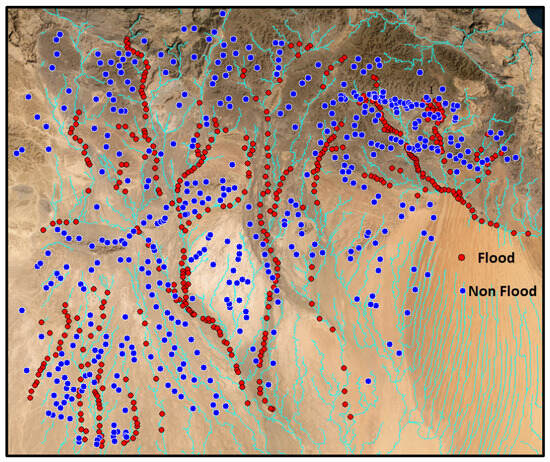
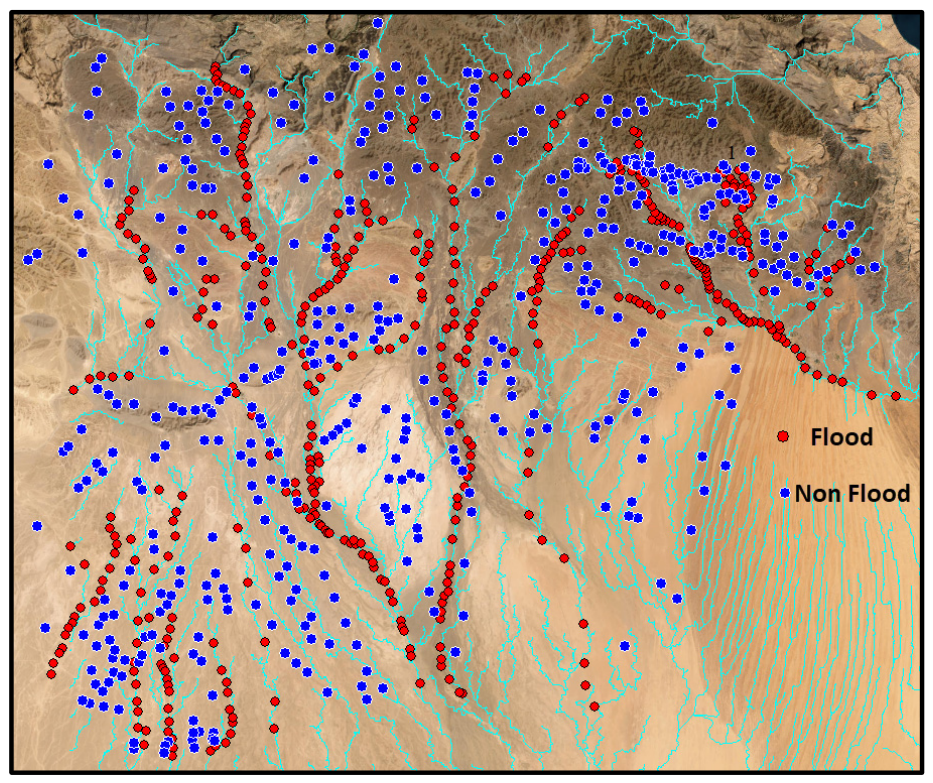
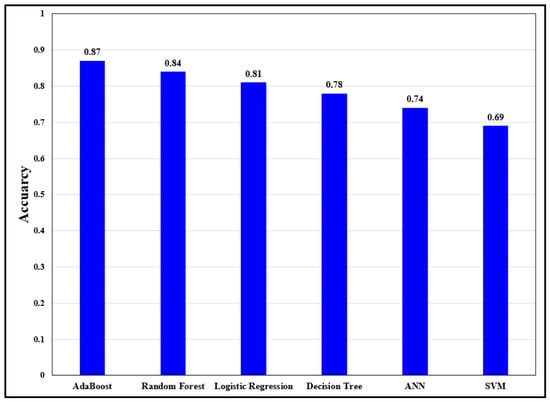
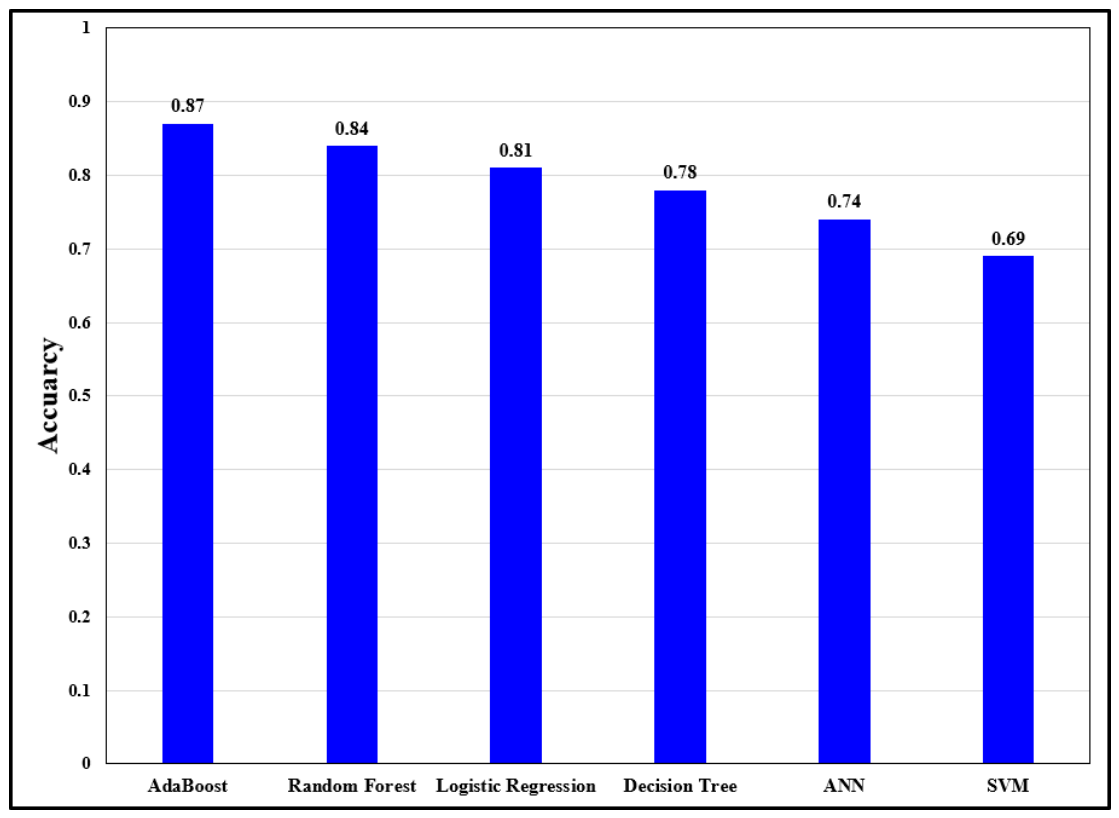
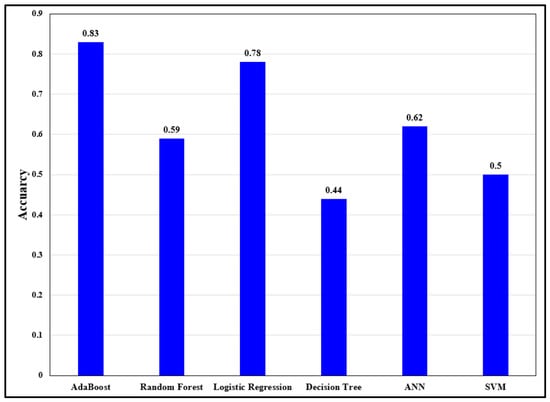
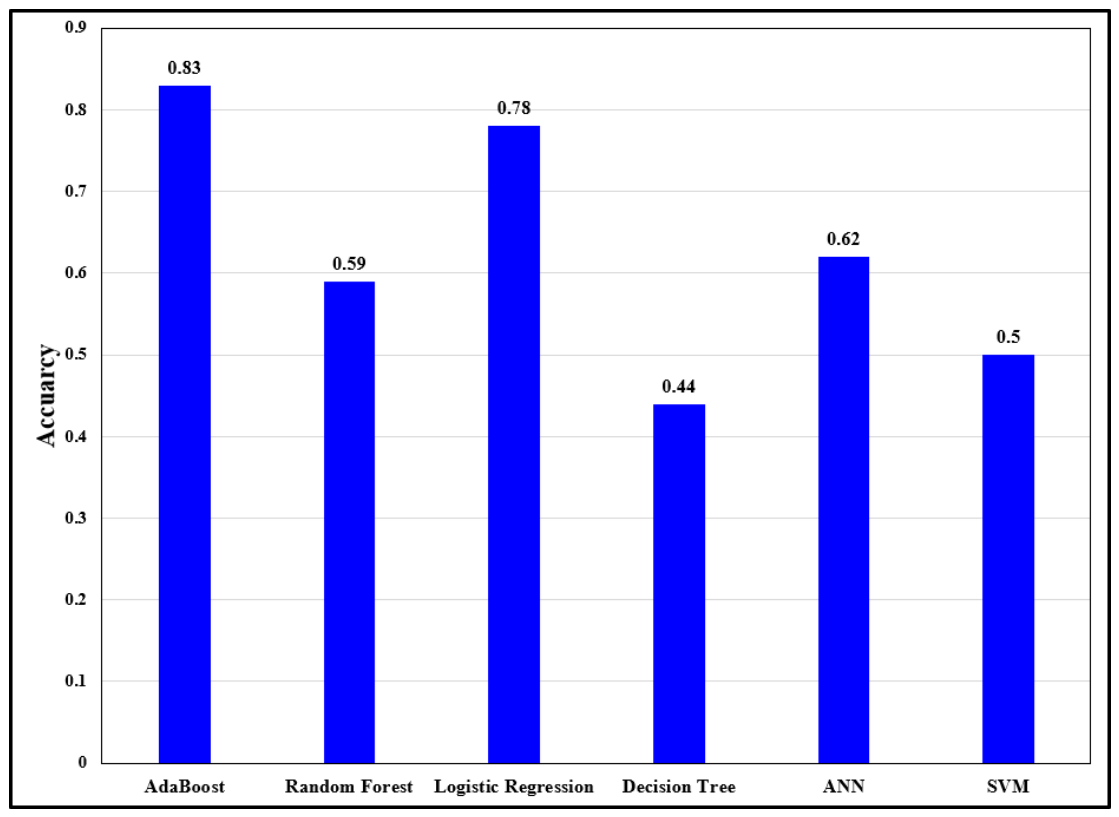

Disclaimer/Publisher’s Note: The statements, opinions and data contained in all publications are solely those of the individual author(s) and contributor(s) and not of MDPI and/or the editor(s). MDPI and/or the editor(s) disclaim responsibility for any injury to people or property resulting from any ideas, methods, instructions or products referred to in the content. |
© 2026 by the authors. Licensee MDPI, Basel, Switzerland. This article is an open access article distributed under the terms and conditions of the Creative Commons Attribution (CC BY) license.