Article

A Multi-Criteria Open-Source GIS Approach for Wildfire Risk Mapping: Methodology and Application in the Apulia Region (Southern Italy)


CNR IMIOT, C. da Santa Loja, Zona Industriale, Tito Scalo, 85050 Potenza, Italy
*
Author to whom correspondence should be addressed.
Geomatics 2026, 6(4), 79; https://doi.org/10.3390/geomatics6040079
Submission received: 9 June 2026 / Revised: 8 July 2026 / Accepted: 12 July 2026 / Published: 15 July 2026

Abstract

Wildfires are an increasing threat to Mediterranean ecosystems and populated areas. This study proposes an innovative static wildfire risk assessment methodology for the Apulia Region (southern Italy). The framework produces a Fire Risk Global Index (FRGi) by spatially combining two sub-indices related to risk, which are hazard and vulnerability, in line with European Community and United Nations guidelines. Hazard is quantified through five sub-indices—vegetational, historical, climatic, morphological, and anthropogenic—combined into a Long-Term Danger Index (LTDi). Vulnerability integrates ecological, economic, and wildland-urban interface components into a Fire Vulnerability Index (FVi). All processing was performed in an open-source GIS environment (QGIS) at a spatial resolution of 20 m, ensuring full reproducibility for public administrations. Preliminary validation confirms the internal consistency of the model, demonstrating a statistically significant relationship between risk classes and historical fire occurrence. Beyond its scientific contribution, the methodology serves as an operational tool for civil protection planning at the regional scale.

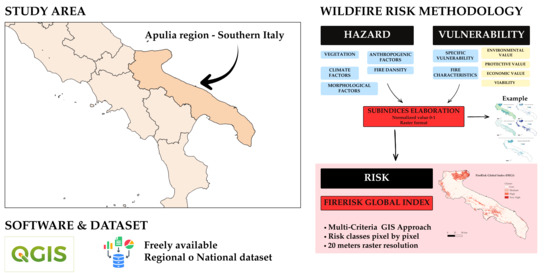
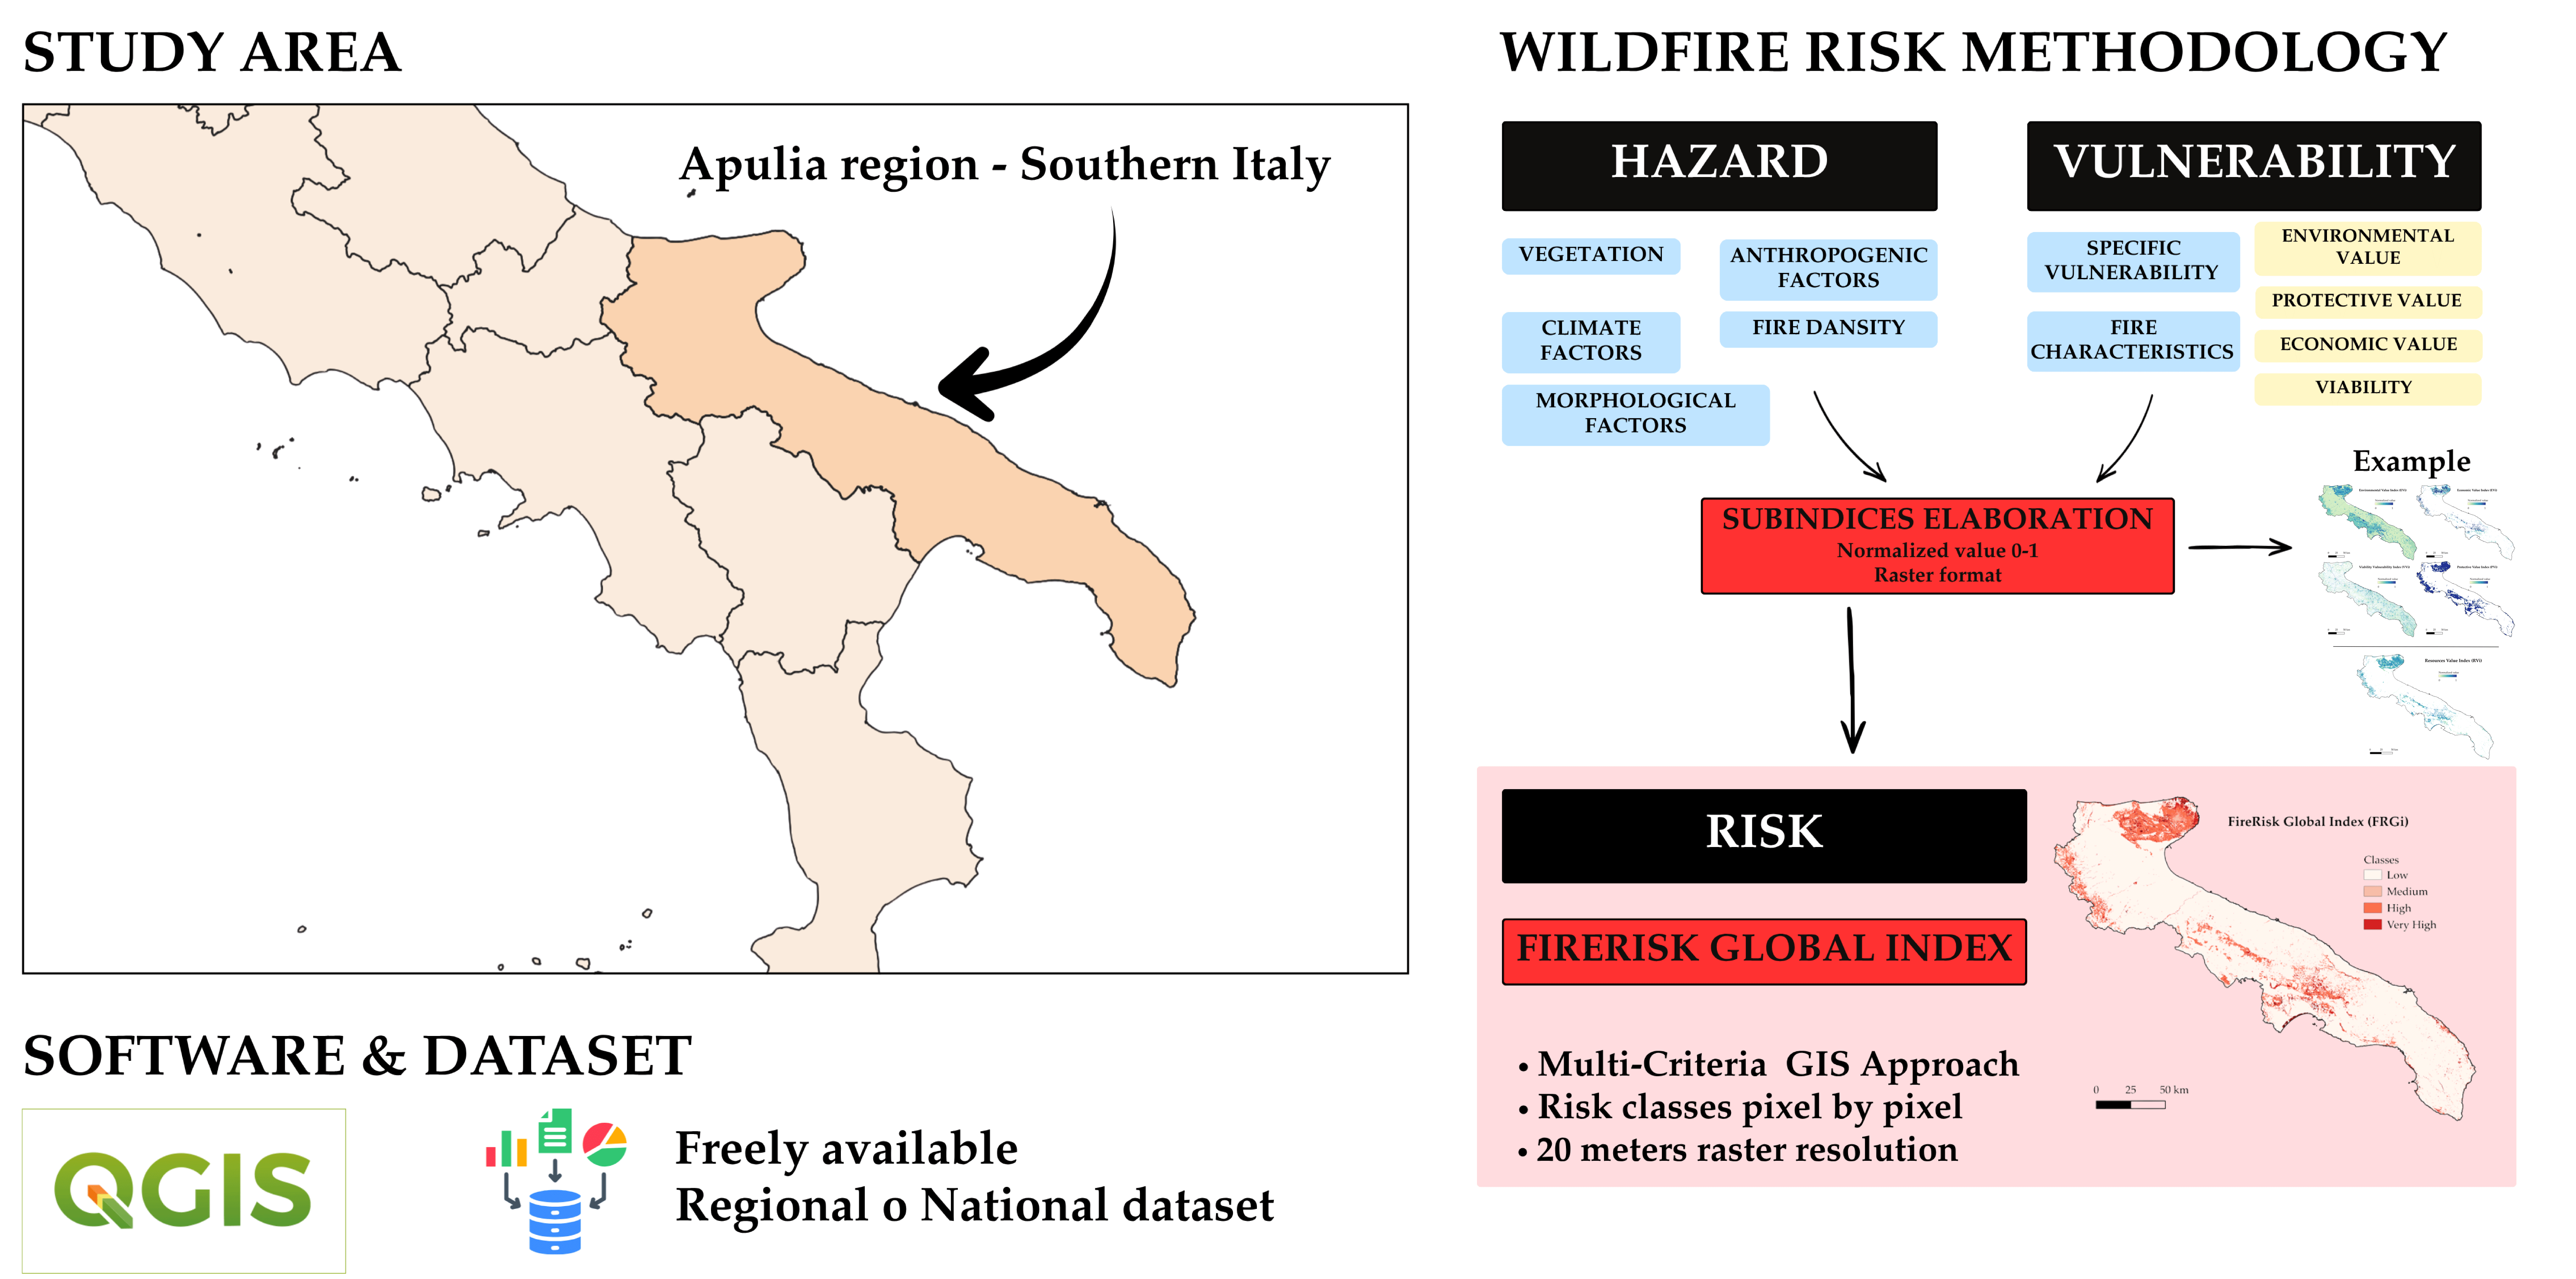
Graphical Abstract

1. Introduction

Wildfires represent a significant danger to both people and the environment, especially in densely populated areas. The 2024 Report of the Joint Research Centre of the European Commission on forest fires in Europe, the Middle East and North Africa [1] shows that 2023 was one of the five worst years for wildfires in the EMEA area since 2000. The fires affected more than 500,000 hectares of natural land, equivalent to approximately half the island of Cyprus. In recent years, catastrophic fires have been frequent in the European Union and neighbouring countries. 2023 was no exception: Several fires broke out in this area that could not be controlled using traditional firefighting means, the so-called “megafires”, including a fire near the city of Alexandroupolis, in the Greek region of Eastern Macedonia and Thrace. This was the largest single fire recorded in the EU since the European Forest Fire Information System (EFFIS) began monitoring them in 2000 [2]. Italy, on the other hand, in 2023 faced wildfires that devastated a total area of 1073 km2. Of this area, approximately 157 km2 consisted of terrestrial forest ecosystems. Of these, 63% were composed of broadleaved evergreen species such as holm oak forests and Mediterranean scrubland; 17% were coniferous forests; and 15% were deciduous broadleaved forests, predominantly mixed with oak species. The 2023 fires in Italy were significant both in terms of the extent of the areas affected, second only to 2021 over the past six years, and in terms of their concentration in specific provinces. Compared to 2022, there was a 36% increase in total burned area and a 6% increase in burned forest area alone [3].
The impact of climate change on wildfires becomes more evident each year. The EFFIS report highlights a clear upward trend in fire danger levels, longer fire seasons, and more frequent and rapidly spreading megafires that traditional firefighting methods struggle to contain. Fires are no longer confined to Southern Europe but are becoming an increasing threat to regions of Central and Northern Europe as well [4]. More than 90% of forest fires in the EU are caused by human activities [5]. In Italy, this trend is particularly evident, as only 2% of fires are attributable to natural causes. Furthermore, according to Turco et al. [6], the recent increase in fire activity in certain areas may be linked to socio-economic changes, which, together with climatic ones, can create landscape configurations that are even more hazardous and unpredictable; new and more up-to-date tools capable of responding to the emerging needs of wildfire planning and management are therefore required.
The use of static and dynamic fire models, such as increasingly accurate hazard and vulnerability maps, can provide decision support during the forecasting phase and consequently in prevention activities [7]. These tools supply Civil Protection authorities and decision-makers with the resources needed to address occasional anomalies in seasonal fire trends. Static wildfire risk maps are crucial tools for forest fire management, as they incorporate various factors to assess fire risk [8]. Indeed, risk zoning is often required by specific regulations in regional plans for the planning of forecasting, prevention and active firefighting activities. These maps typically combine static indicators such as terrain characteristics (elevation, slope, aspect) and proximity to roads and settlements with dynamic factors such as fuel moisture conditions [9,10].
In the scientific literature, the proposed methodologies differ and also vary according to the territorial context [11,12]. Furthermore, risk assessment inherently requires the evaluation of both hazard and vulnerability [13]. Spatial risk assessment constitutes a fundamental pillar of wildfire risk management, grounded in the capacity to map and prioritise fire hazards alongside exposed and vulnerable assets. This process generates essential information for identifying areas at elevated risk, ultimately guiding strategies related to wildfire preparedness, prevention, mitigation, and post-fire recovery planning [14].
All these topics cannot be addressed without the use of geomatic and geospatial technologies. Such technologies have established themselves as a foundational element in the understanding, management, and mitigation of wildfire impacts, offering a wide and versatile range of tools and methods applicable across the various stages of wildfire research. These encompass pre-fire management activities such as risk assessment and predictive modelling, real-time fire detection and monitoring through advanced instruments including UAVs and satellite sensors, as well as post-fire assessment and ecosystem recovery, integrating remote sensing, GIS, and Google Earth Engine (GEE). In this way, geospatial technologies provide invaluable knowledge both for the scientific community and for policymakers. Through the systematic analysis of wildfire risk factors, these technologies enable stakeholders to prioritise resource allocation and implement effective land management strategies. In this regard, Khan et al. [15] conducted a comprehensive review of the scientific literature, highlighting the pivotal role of geospatial technologies in wildfire research. Geostatistical approaches are fundamental in the field of forest fire science, given the spatial characteristics of the phenomenon as well [16].
Geographic Information Systems (GIS) are commonly used to integrate these various factors [17], as they allow the incorporation of territorial variables such as vegetation type, climatic factors, and proximity to water bodies [18]. The geospatial approaches for developing risk indices are numerous, and several examples can be found in the literature. The most notable ones are based on the application of machine learning algorithms to various fire-predisposing factors or on the assignment of weights to those factors [7,19,20,21]. Furthermore, these approaches are increasingly being applied to other aspects of forest fire planning, such as active firefighting operations [22]. In Italy, in addition to examples of methodologies applied at the regional scale [23], there are regulatory references that define the discipline in this field from both a legislative and a technical standpoint [24,25,26,27]. The present study is situated within the Italian context.
In this work, a new methodology is proposed and applied in the context of the Apulia Region for the assessment of static fire risk based on morphological, vegetational, climatic, and anthropogenic factors. The innovative character of this methodology lies in the development of a Fire Risk Global Index that accounts for both hazard and vulnerability aspects, in line with the framework proposed by the European Community [28]. The various complex sub-indices that constitute the risk index were computed in an open-source GIS environment, which represents one of the fundamental elements of the study, given that the open-source approach is already widely adopted in the scientific community for wildfire studies [29], though often using methodologies that require advanced technical expertise and are therefore rarely replicable by public authorities [30]. Furthermore, all indices and sub-indices were produced at the individual pixel level with a spatial resolution of 20 m, thus enabling a local-scale assessment of risk. The risk mapping framework thus structured, beyond its scientific value, has also an operational and applied significance, as it has been incorporated into the Regional Plan for the Forecasting, Prevention and Active Firefighting against Forest Fires 2023–2025 of Apulia Region [31].

2. Materials and Methods

2.1. Study Area

The Apulia region lies along the western edge of the Adriatic Sea and represents the easternmost part of Italy (Figure 1). The region is characterised by a remarkable territorial discontinuity, owing to the irregular development of its coastline and a highly varied surface morphology. The total area of Apulia is approximately 19,350 km2: more than half of the territory (53.2%) is flat, 45.3% is hilly, and just over 1% is mountainous [32]. The uniformity of the region’s orography results in modest climatic differences across its various zones, influenced not only by the limited altitudinal variations but also by the topographic configuration.
Based on data from the Regional Plan for the Forecasting, Prevention and Active Firefighting against Forest Fires 2023–2025 of Apulia Region relating to the most recent available year [31], Apulia ranks fifth among Italian regions by number of forest fires and fourth, after Sicily, Sardinia, and Calabria, by burned forest area. Restricting the analysis to fires exceeding 30 hectares in extent between 2008 and 2021, the Apulia region ranks sixth nationally by total area burned. More specifically, during this period, there were approximately 120 fires larger than 30 ha, with an average of approximately 150 ha per event and 8.5 events per year.
Analysis of statistics from the past ten years confirms the seasonal nature of wildfires in the region. The period from June to September concentrates nearly 93% of all fire events recorded between 2012 and 2021, as well as almost 97% of the total area burned and over 97% of the forested area affected.

2.2. Indices and Subindices Calculation Methodology

Fire risk models should incorporate multiple interconnected components that account for both fire behaviour dynamics and the surrounding environmental conditions [33,34]. The goal of this integration is to produce a holistic assessment capable of estimating both the likelihood of fire occurrence and its potential consequences [35]. In response to these needs, the Three-Year Plan for Fire Forecasting, Prevention, and Active Firefighting of Apulia Region has provided the framework within which an innovative static risk zoning methodology was developed, centred on a dedicated fire risk index consistent with Civil Protection guidelines [31]. Fire risk modelling constitutes a key decision-support tool for Civil Protection planning and fuel management, with the overarching objective of reducing wildfire damage. At different administrative levels, risk and vulnerability assessments are a mandatory requirement for land-use planning and risk reduction programmes. In recent years, the scientific literature has seen the proliferation of several methodological approaches, ranging from integrated GIS models based on physical parameters to combined physical/statistical and stochastic/causal frameworks. These studies have consistently demonstrated the advantage of approaches that draw on multiple and heterogeneous data sources [36,37,38]. The risk assessment framework developed in this study incorporates both hazard and vulnerability components, in accordance with United Nations guidelines [39]. This approach systematically evaluates and weights the principal wildfire-contributing factors, including vegetation characteristics and land cover patterns, climatic conditions, topographic features, and socioeconomic variables. The resulting methodology produces a combined map that classifies the regional territory into distinct risk categories at a sub-municipal scale, in line with European Community requirements [40].
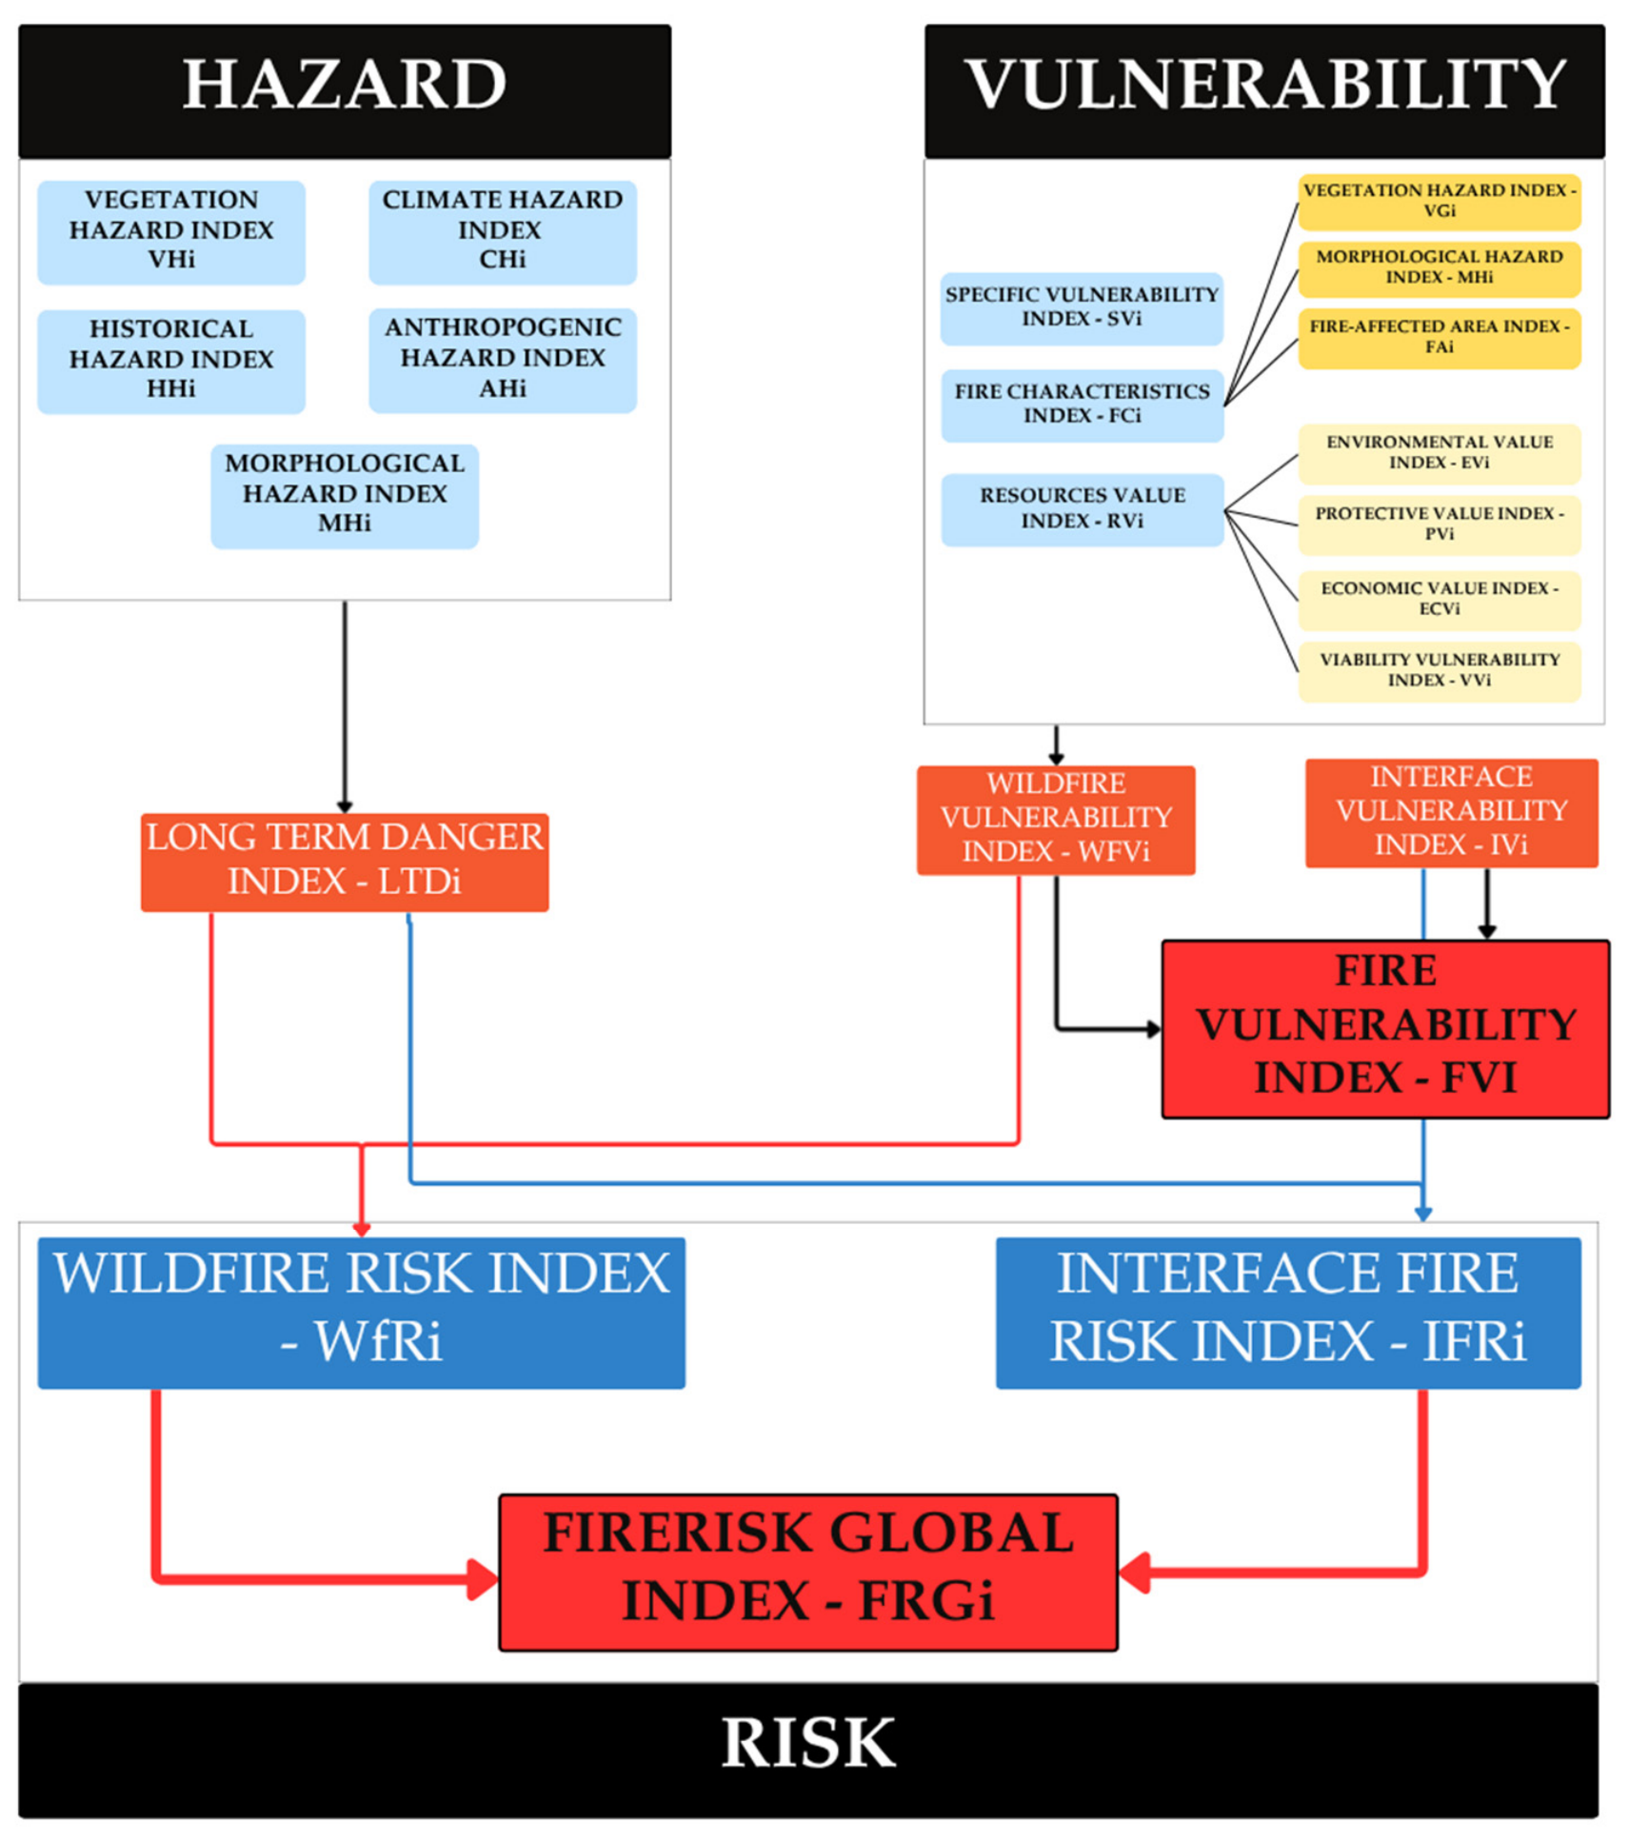
The construction of indices and sub-indices requires the selection of an appropriate combination strategy [41]. This study adopts a weighted additive model that substantially reinterprets the approach originally proposed by Chuvieco & Congalton [42], first applied in Spain and subsequently adapted to other territorial contexts. This approach is consistent with standard Multi-Criteria Analysis (MCA) procedures [41,43,44,45]. The methodology operates through the linear combination of variables, each assigned a specific weight reflecting its relative contribution to fire risk. Every variable is processed to account for its weighted influence on hazard levels, and the final integrated hazard map is generated by overlaying the various layers and indices according to the model’s criteria. Weight values are derived through a normalisation procedure ranging from 0 to 1 [46,47]. Several authors have acknowledged that weight assignment is inherently subjective, yet it generally reflects the relative importance of each variable in elevating fire risk [41,42]. Each factor is classified into discrete levels according to its expected influence on fire danger. Given the complexity of the indices and sub-indices involved, a detailed workflow diagram was produced to illustrate the multicriteria analysis process implemented in this study (Figure 2).
The analysis drew on datasets from two main sources: data provided by the Apulia Region and publicly available online resources. All processing operations were carried out using the latest version of QGIS 3.34.11-Prizren, exploiting both native modules and dedicated plugins within the software.

2.2.1. Hazard Subindices Calculation

The results of this process enabled the development of various sub-indices and indices that are useful both individually and in aggregate. These were ultimately combined to create the two final.
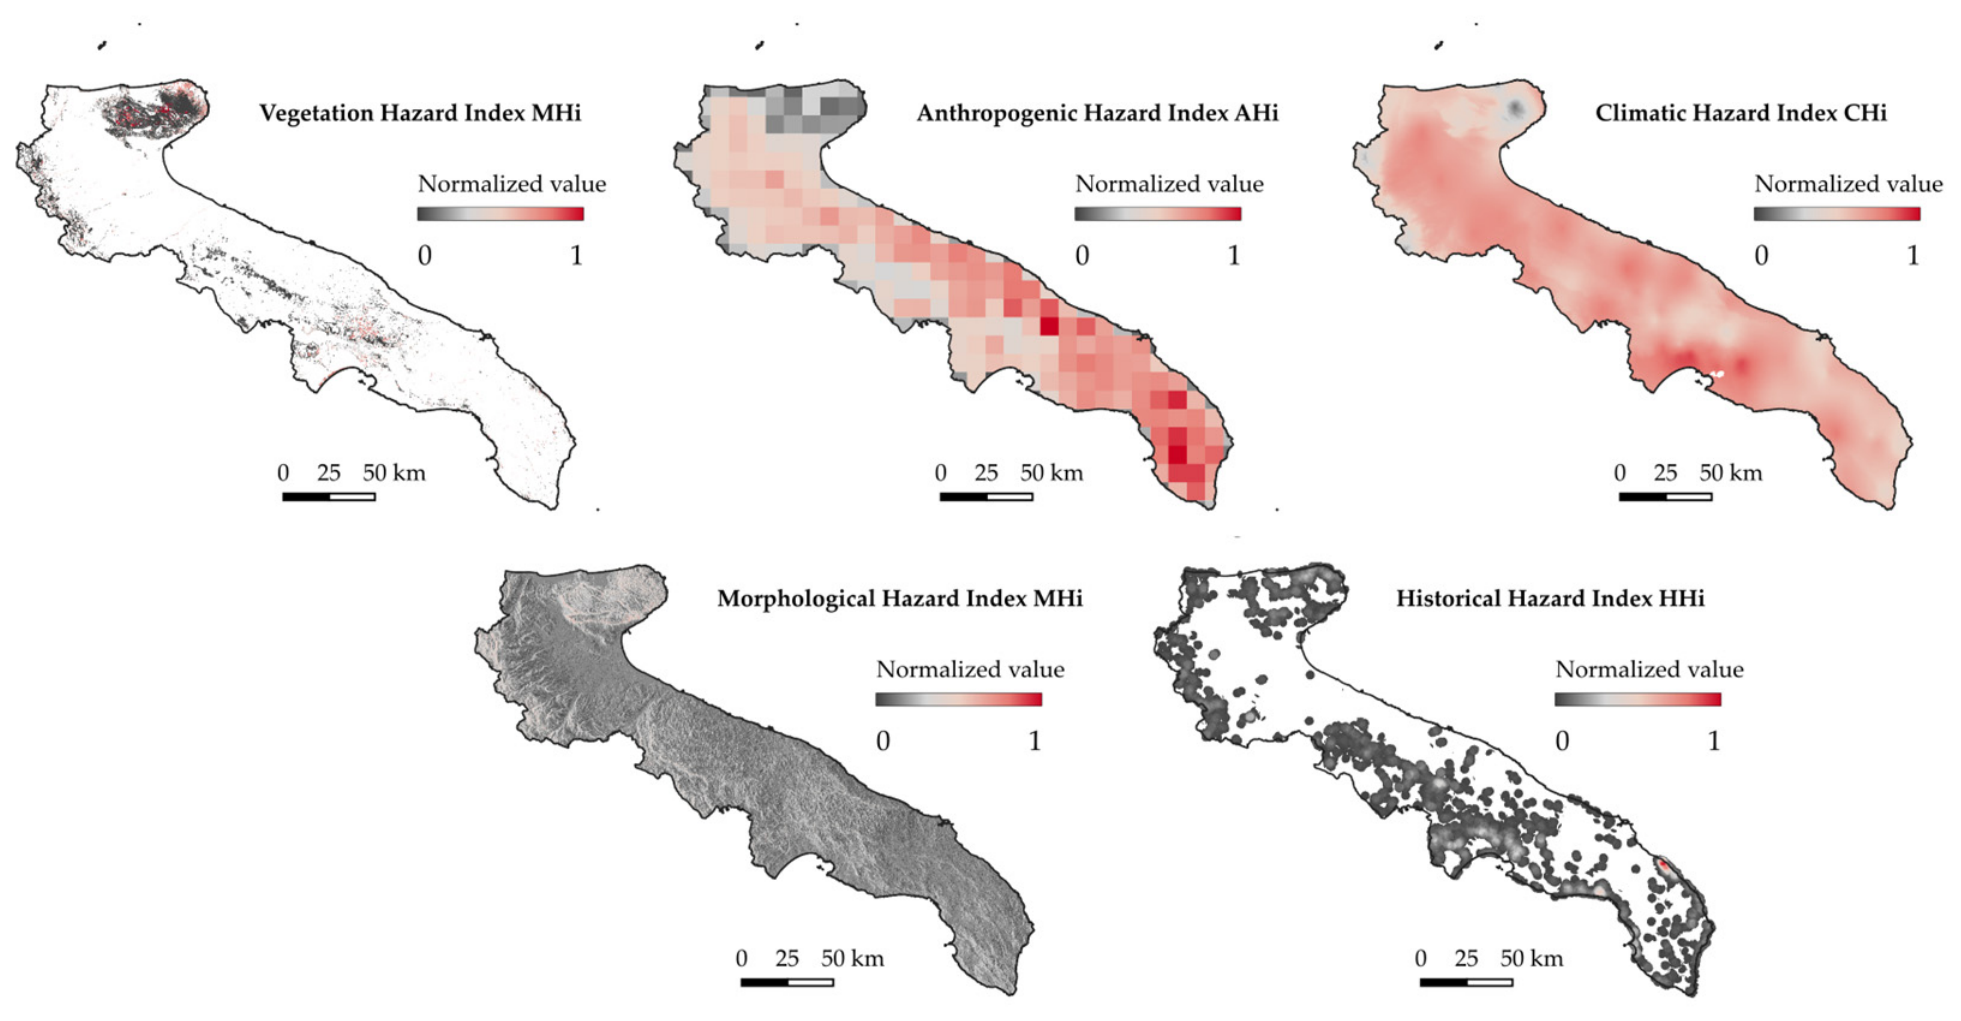
Hazard encompasses any phenomenon, circumstance, human activity, or condition with the potential to cause various adverse impacts, including loss of life, injuries, health effects, property damage, disruption of livelihoods and services, socioeconomic difficulties, or environmental degradation [48]. The methodology incorporates five distinct hazard indices: Vegetational Hazard Index (VHi), Historical Hazard Index (HHi), Climatic Hazard Index (CHi), Morphological Hazard Index (MHi) and Anthropogenic Hazard Index (AHi). The combination of these indices, weighted appropriately, produces the Long-Term Danger Index (LTDi).
Vegetational Hazard Index (VHi). The fuel map supplied by the Apulia Region was used as the primary input for developing the VHi. The data is freely provided by public authorities upon specific request in a metadata-rich vector format. The fuel map was created by integrating remote sensing data (LiDAR) with measurements taken partly in the field and partly in the laboratory, using the models proposed by Scott & Burgan [49] as a reference. In the context of forest fires, a fuel map is a spatially explicit representation of the distribution, type, and structure of vegetative fuels present in a given territory, aimed at describing the characteristics of the fuel bed that influence ignition, fire spread, and fire intensity. Fuel maps classify vegetation into homogeneous units (fuel models) that synthesise the physical and biological properties of fuels, such as fuel load, horizontal and vertical continuity, the ratio of live to dead fuels, and their response to meteorological conditions, making them suitable as inputs for fire behaviour models and fire spread simulators [49]. The map is provided by the Apulia Region in polygonal vector format.
Each fuel model was assigned a numerical hazard value that reflects the pyrological characteristics determining fire behaviour during a wildfire [50]. For this operation, the linear flame intensity curves (KW/m) associated with the different fuel models were examined and considered, as reported in the dataset provided by the Apulia Region (Table 1).
For the calculation of historical hazard (HHi), a map of fire occurrences [5,51] was prepared for the period 2000–2021 from data provided by the Apulia Region. This dataset served as input for the subsequent Kernel Density Estimation (KDE) with a radius of 5 km and using as a weight the parameter of forested hectares burned given for each event. The QGIS plugin used was Heatmap, which generates a density raster (heatmap) from an input point vector layer by applying kernel density estimation. Density is determined by the number of points within a given area, where higher concentrations of points produce higher density values. Heatmaps make it easy to visually detect hotspots and areas where points are clustered.
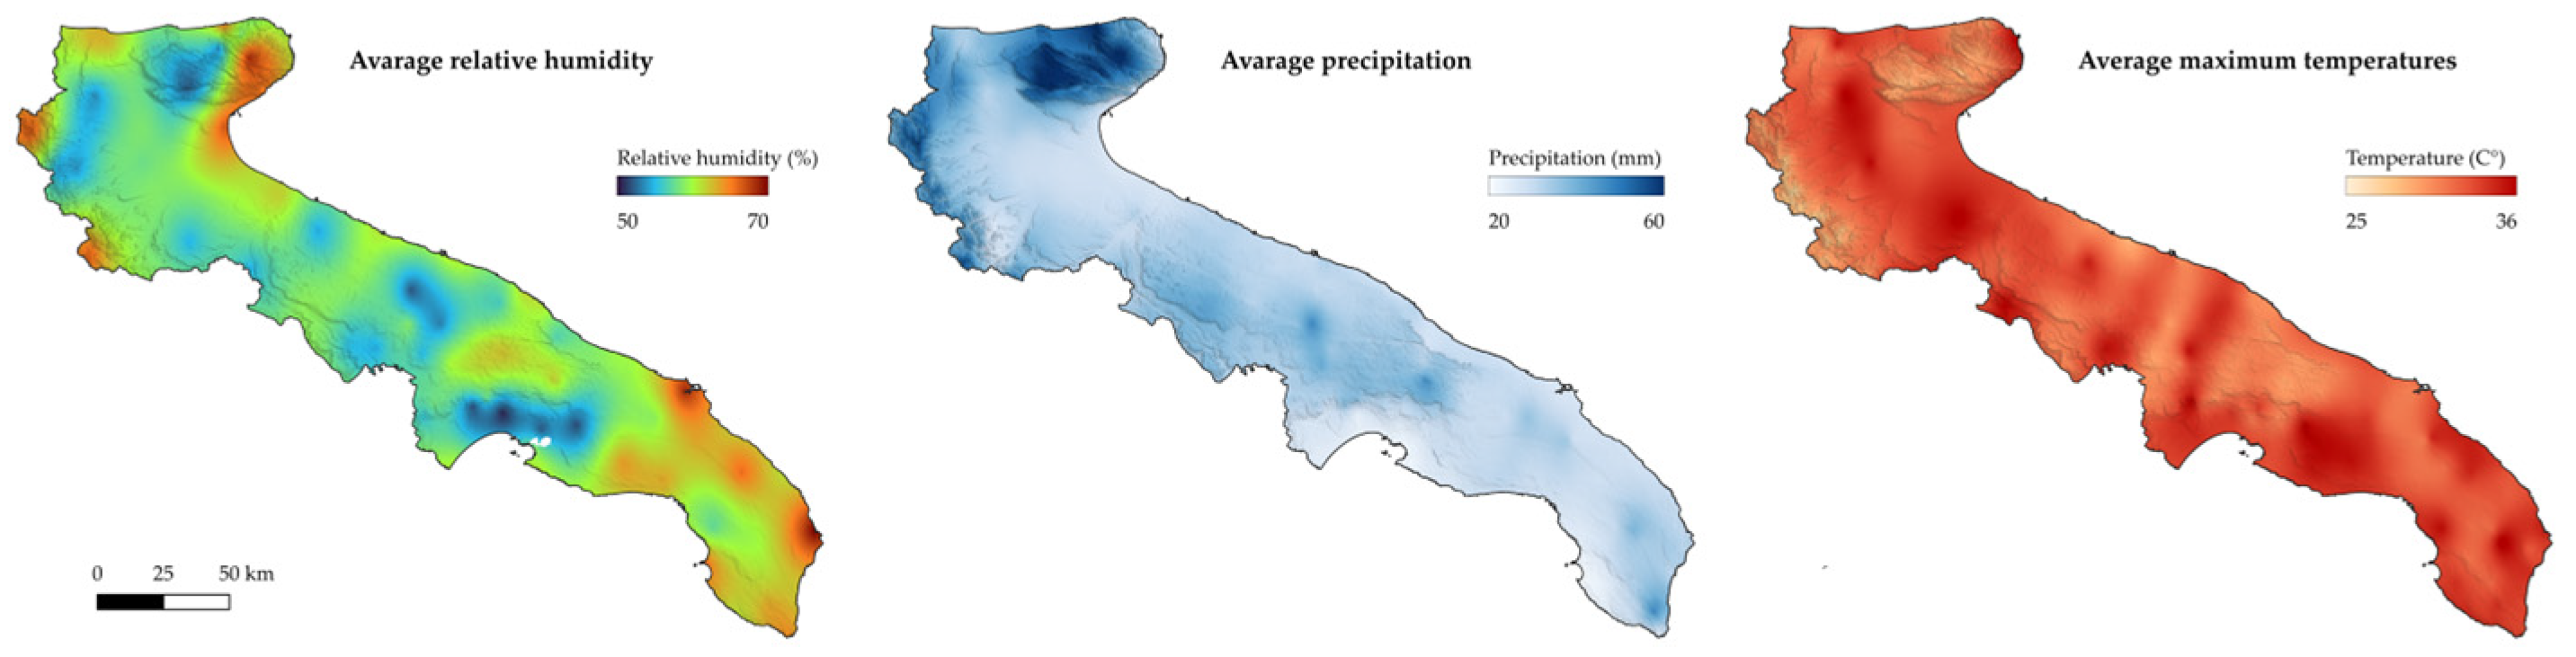
The Climatic Hazard Index (CHi) represents another key metric in the assessment system. The index calculation incorporates historical meteorological data from the Apulia Region’s Functional Centre weather stations, specifically analysing three primary variables: maximum temperature averages, precipitation patterns, and relative humidity levels (Figure 3). These parameters underwent processing through a mathematical model, with the temporal scope varying according to each station’s available data records. The analysis revealed that the structural components of temperature and rainfall demonstrate a strong correlation with elevation, given the region’s limited longitudinal and latitudinal variation. In contrast, humidity measurements showed no significant systematic correlations. To account for local-scale variations, the stochastic component was integrated using ordinary kriging interpolation techniques. This method generates estimates by interpolating observed values, with each observation weighted based on its distance from the estimation point. The analysis produced normalised raster layers for each climatic variable: temperature, precipitation, and relative humidity. These parameters were then combined using a weighted formula that reflects each variable’s impact on fire propagation [52]. The weighting scheme prioritises humidity as the most significant factor, followed by precipitation, with temperature having the least influence.
The CHi calculation employs the following weighted Formula (1):
CHi = (Relative humidity ∗ 0.45) + (Precipitation ∗ 0.35) + (Temperature ∗ 0.2)
The methodology integrates two distinct analytical approaches to generate comprehensive climate hazard assessments. A deterministic component analyses fixed geographical parameters, with particular emphasis on the influence of elevation on meteorological patterns. This relationship is evidenced by systematic variation in temperature and precipitation values along altitudinal gradients. In parallel, a stochastic framework addresses localised climatic fluctuations that cannot be directly attributed to geographical variables. This component captures the random variations and micro-climate effects present in the data. The synthesis of these approaches in calculating the CHi creates a robust analytical framework. By merging topographical data with probabilistic meteorological interpolations from weather station measurements, the model generates high-resolution climate risk mapping across the entirety of the Apulian territory.
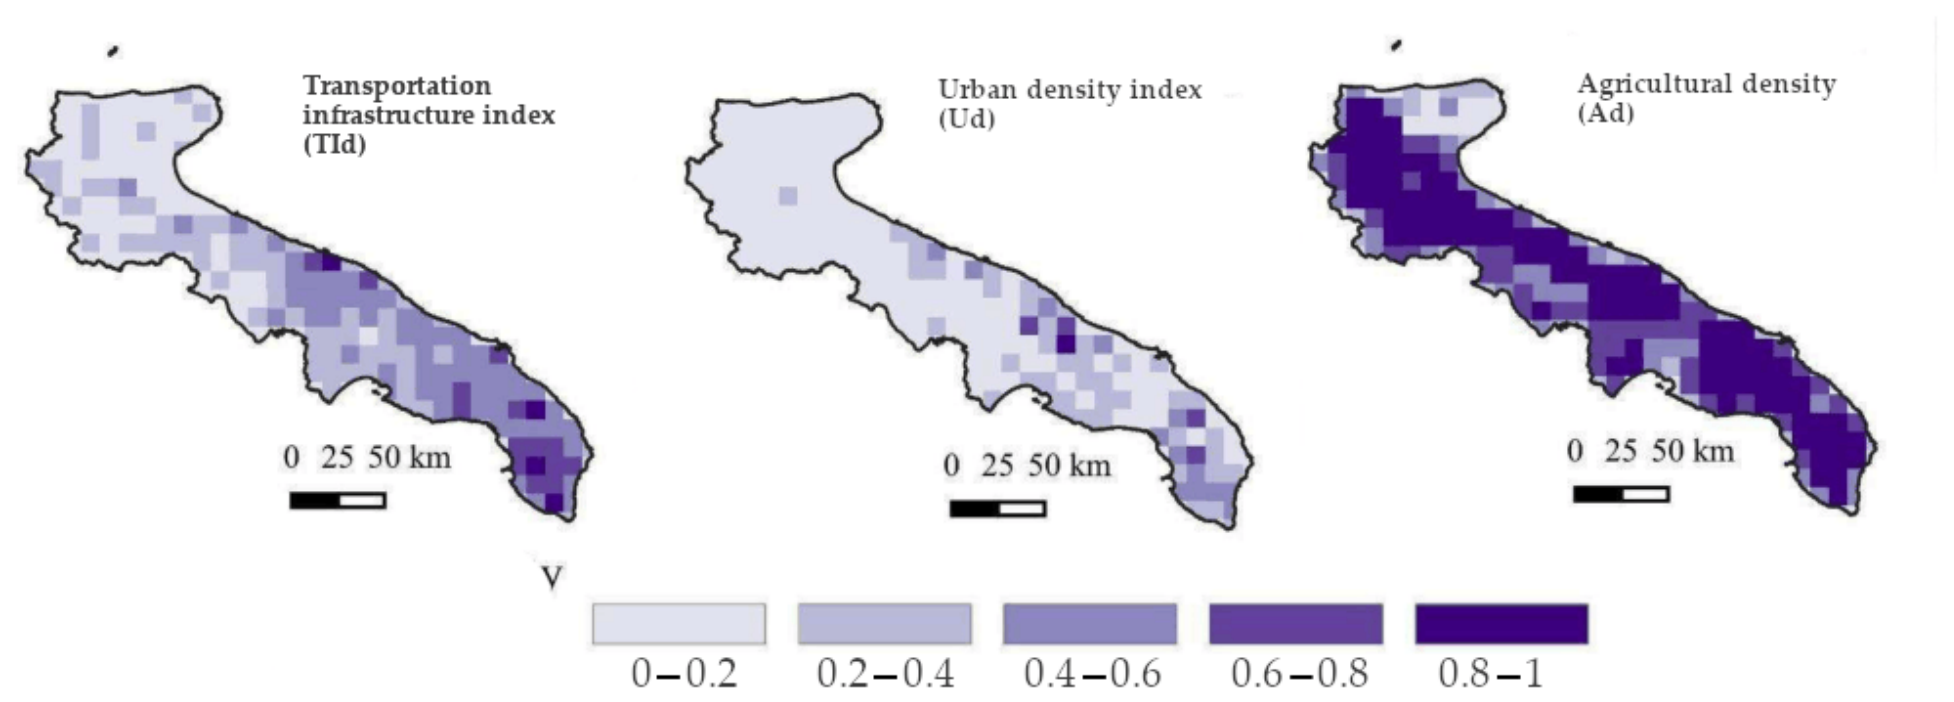
The Anthropogenic Hazard Index (AHi) calculation [53,54] (Figure 4) integrates three density-based components measured at the municipal level, combining transportation infrastructure (TId), agricultural density (Ad), and urban density (Ud), as shown in Formula (2). Since these variables are originally defined at the municipal scale, their values were spatially assigned to all pixels within each municipality, assuming homogeneity within administrative boundaries.
AHi = TId + Ad + Ud
The resulting index was subsequently normalised to a 0–1 range.
The transportation infrastructure index (TId) was derived using a 10 × 10 km reference grid overlaid on vector data of the infrastructure network. For each grid cell, the index represents the ratio between the area occupied by transportation infrastructure (assuming a standardised 10 m road width) and the total cell area. The agricultural density (Ad) quantifies the proportion of agricultural land within each grid cell. This was determined using land-use classifications from the Apulia Region Nature Map [55], specifically identifying areas designated for agricultural purposes. The urban density index (Ud) measures the extent of urban-rural interface zones, defined by establishing a 50 m buffer around the perimeter of urban aggregates within each cell. The final value represents the ratio between these interface areas and the total cell area. The base vector datasets for the calculation of TId and Ud were derived from OpenStreetMap [56], which represents a reliable and well-validated source for extracting data related to buildings and all aspects of the urban fabric [57]. By leveraging the direct OpenStreetMap query functionality available within QGIS, the footprints of all buildings and infrastructure were downloaded.
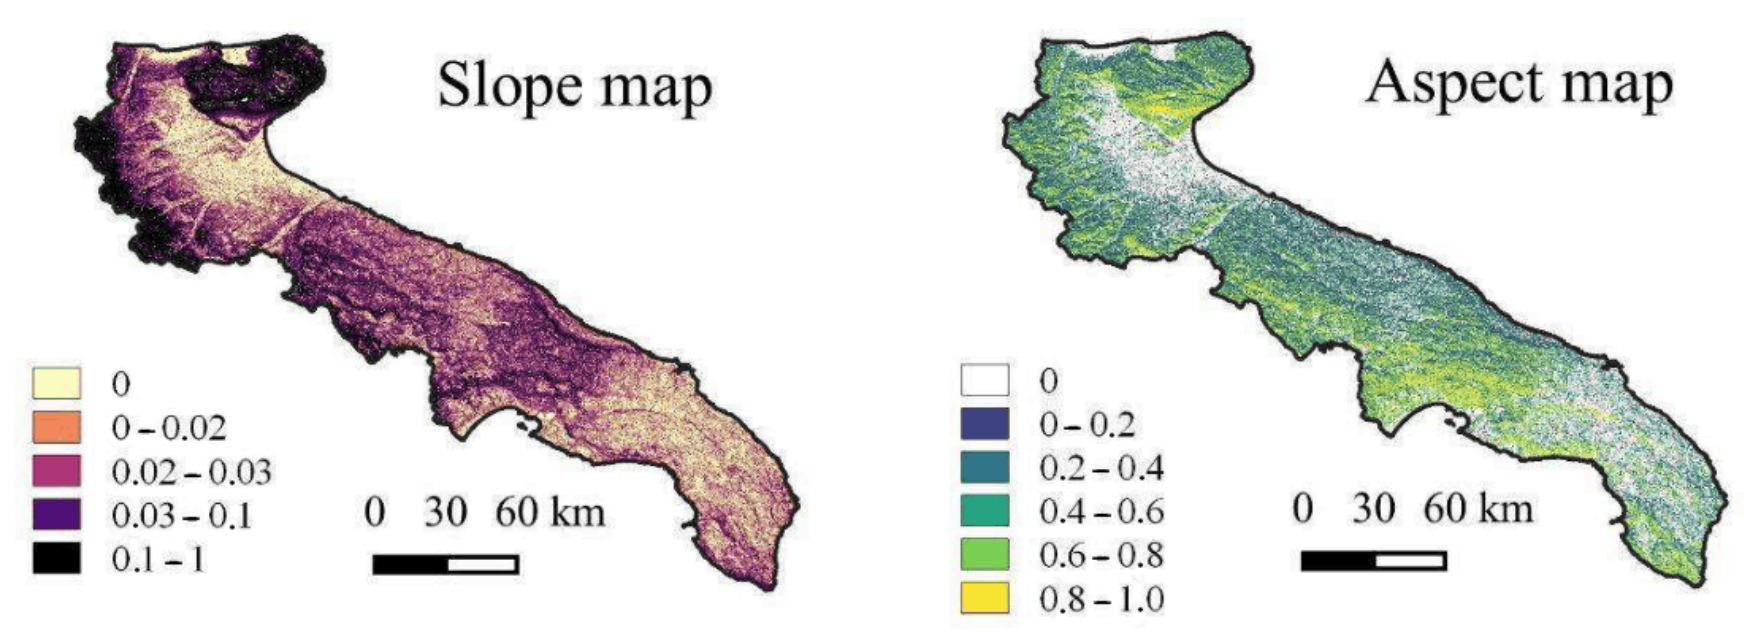
The last sub-index (MHi) derives from the combination of the two topographic elements most relevant to fire hazard assessment: slope and aspect (Figure 5). Slope influences the preheating capacity of the fuel, accelerating the combustion process and consequently the rate of fire spread [58,59].
Aspect influences solar radiation and wind patterns, and therefore temperature and moisture levels. Slope and aspect were derived from a Digital Elevation Model (DEM) with a spatial resolution of 20 m. The range of actual slope and aspect values was standardised to a 0–1 interval (low hazard–high hazard). With regard to slope, normalised values increase as the actual value increases, whereas normalised aspect values increase according to the following order: NW–NE, E–NE, W–NW, E–SE, W–SW, SE–SW. The morphological hazard index is obtained using the following Formula (3):
MHi = (Slope ∗ 0.52) + (Aspect ∗ 0.48)
The weight values were assigned following the calculation of the Pearson correlation coefficient between the dataset of actual fires recorded over the period 2000–2021 and slope, and subsequently between the same dataset and aspect. This analysis revealed that slope is more strongly correlated—albeit marginally—with fire occurrence than aspect, and the MdI calculation formula reflects this finding accordingly.
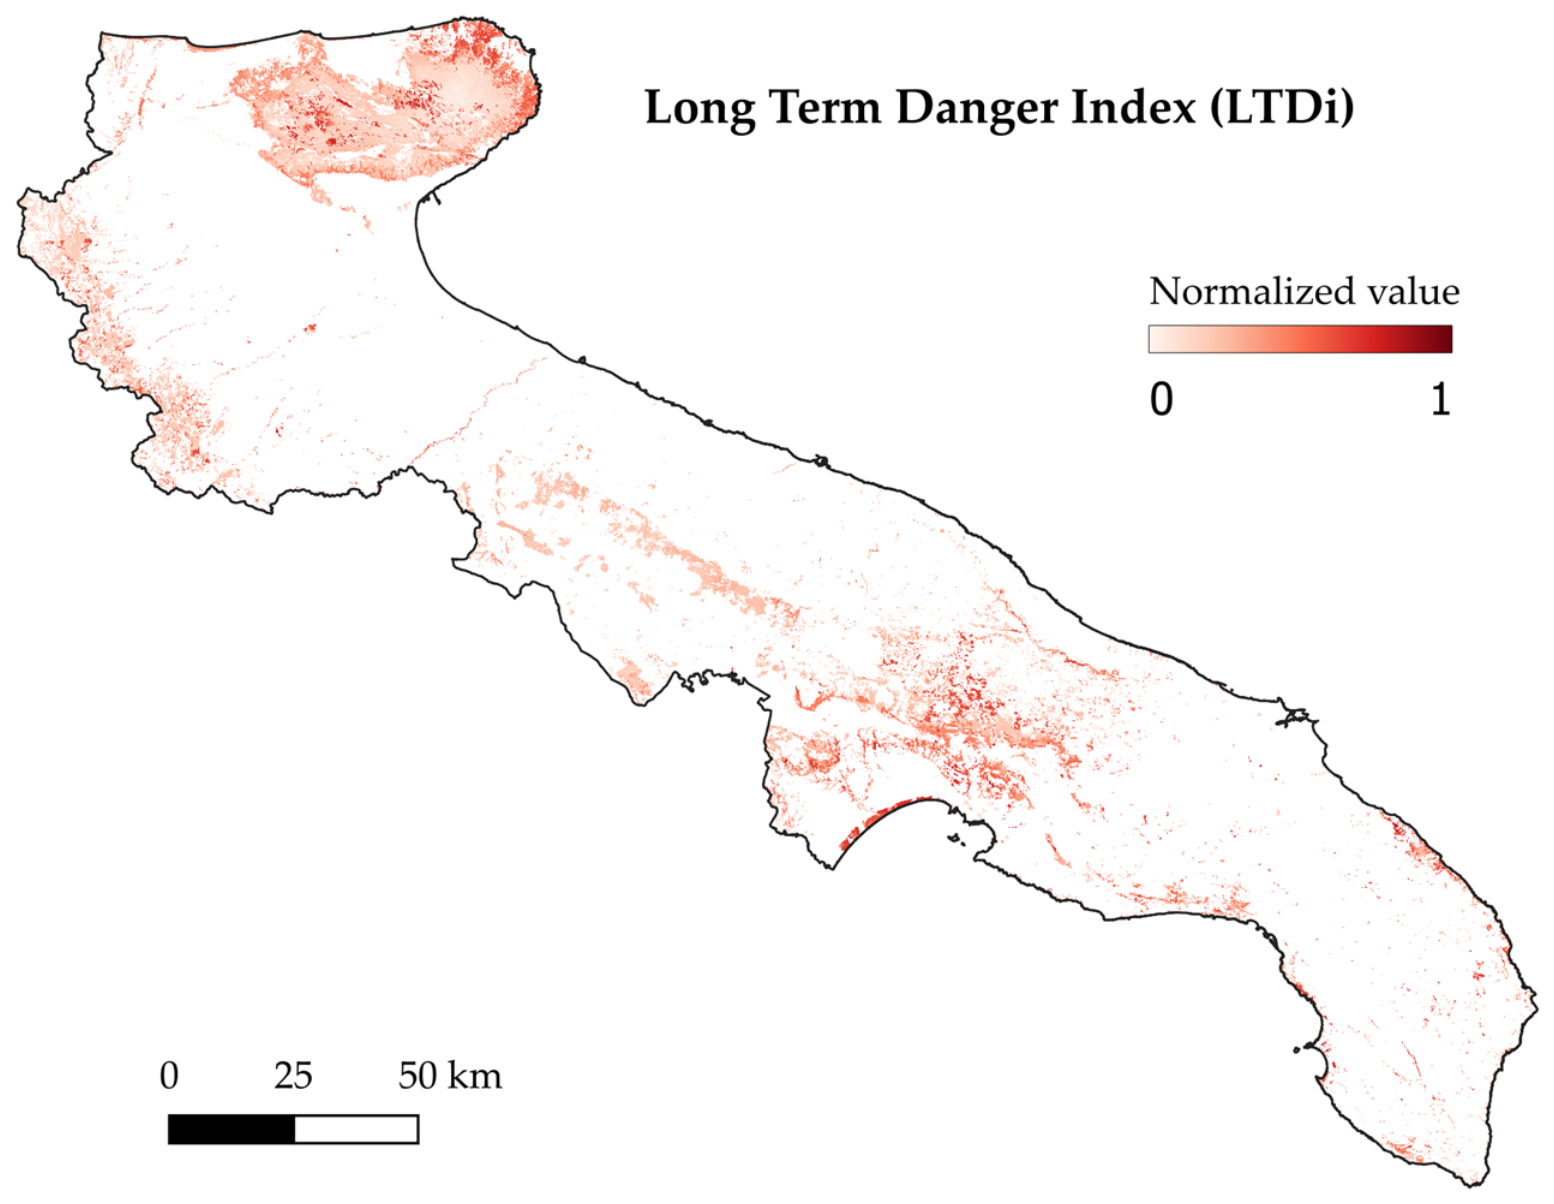
These five sub-indices must, however, be combined with one another in order to compute the Long-Term Danger Index (LTDi). They were weighted and summed to derive the LTDi, which was subsequently normalised to a 0–1 range. The formula for the calculation of the LTDi is as follows (4):
LTDi = (Vhi ∗ 0.387) + (Hhi ∗ 0.242) + (Chi ∗ 0.124) + (Ahi ∗ 0.124) + (Mhi ∗ 0.124)
The weight values were assigned through a Pairwise Comparison approach using a matrix based on the Saaty scale [46,47]. The resulting matrix is then used to calculate the relative weight of each element, helping to determine the overall priorities. All raster datasets were resampled to match the spatial resolution of the finest-resolution layer so as to preserve the spatial detail carried by the higher-resolution variables. In this case, all datasets were brought to the resolution of the VHi raster, as this layer represents the areas with vegetative fuel cover and therefore the areas over which fire risk must be assessed.

2.2.2. Vulnerability Subindices Calculation

Vulnerability, defined as the characteristics of a system or asset that make it susceptible to the harmful effects of a hazard [48], accounts for the potential damage caused by fire, whether ecological, and therefore related to fire behaviour and ecosystem characteristics, or economic, linked to the value of assets and resources affected by the passage of the fire front [60]. The calculation of the Wildfire Vulnerability Index (WVi) takes into consideration and aggregates different aspects, each evaluated by a dedicated sub-index: the Specific Vulnerability Index (SVi), the Fire Characteristic Index (FCi), and the Resource Value Index (RVi).
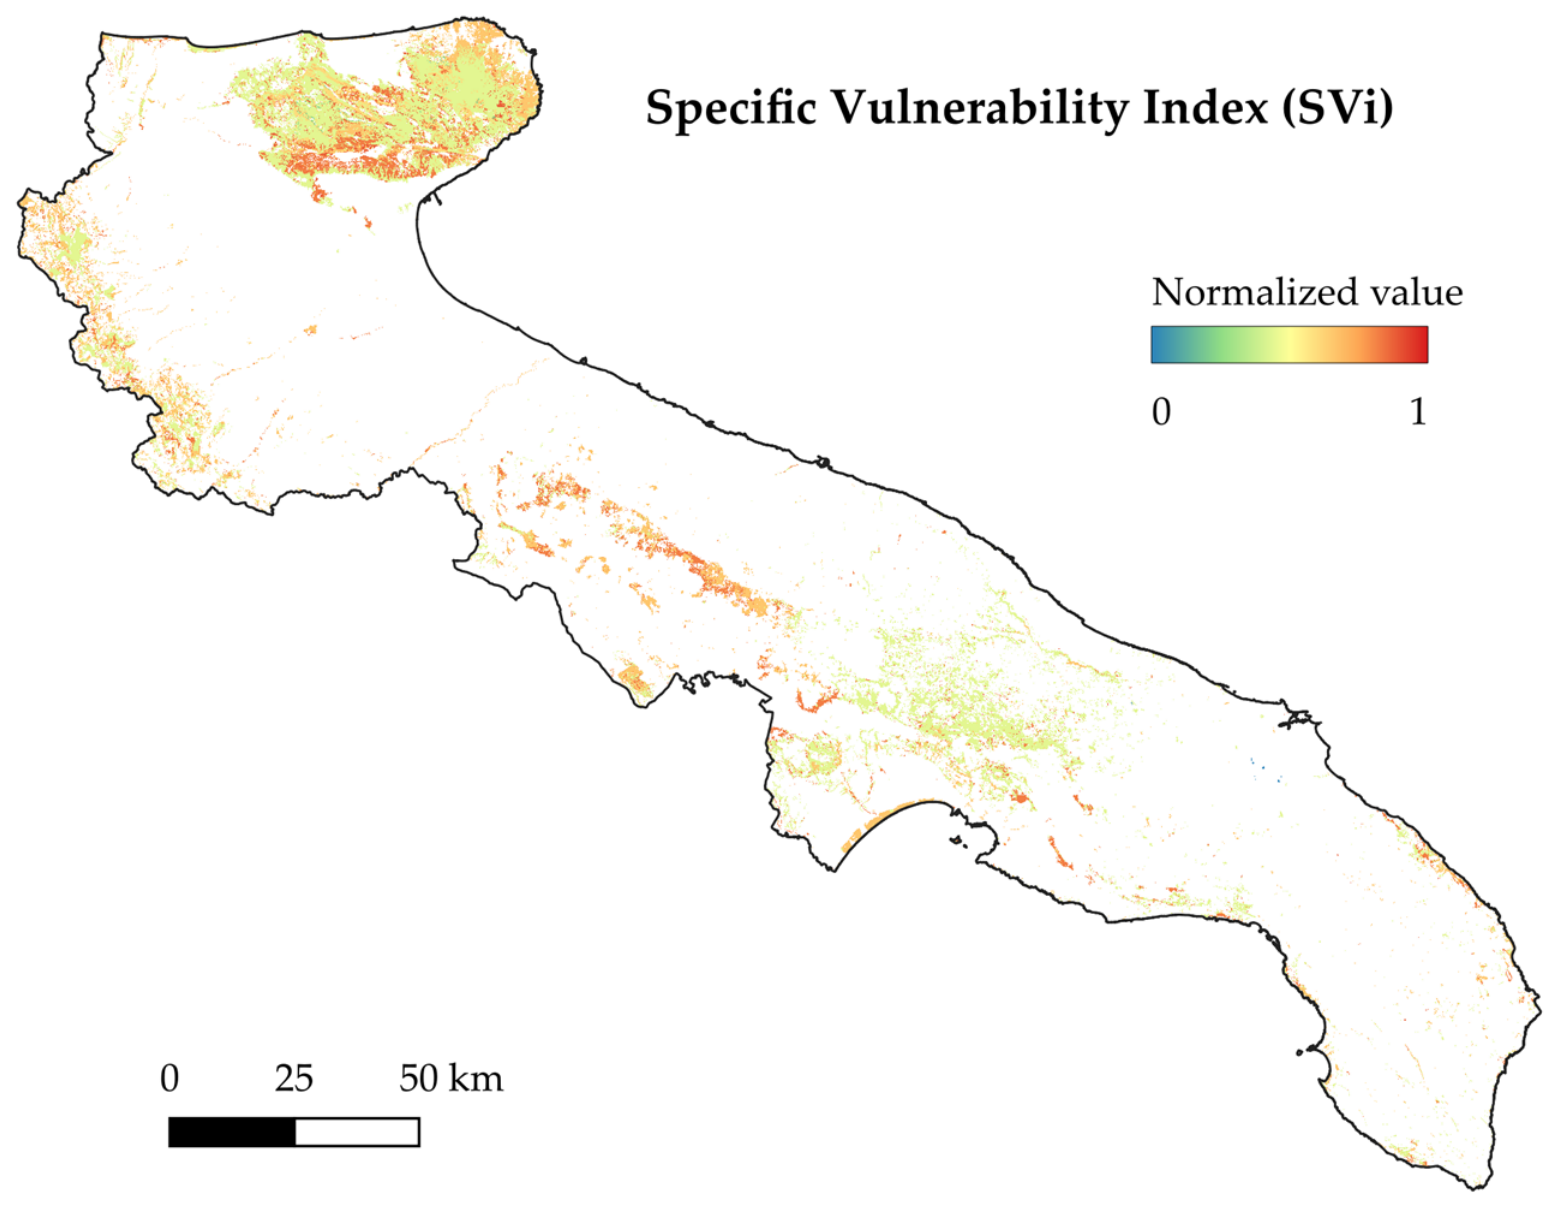
The SVi estimates the potential capacity of an ecosystem to absorb the disturbances caused by a fire of given characteristics. Vegetation can absorb the disturbance factor both passively, through resistance, and through post-fire reconstitution, through resilience. Specific vulnerability is the synthetic value of the combined resistance and resilience capacity. Drawing on the vegetation type information provided by the Forest Category Map of the Apulia Region, resistance (RS) and resilience (Re) values were assigned to each vegetation category; in both cases, values range from 1 to 5, where 5 represents the maximum resistance and resilience. For both parameters, a high value corresponds to a low degree of vulnerability. Consequently, a specific vulnerability is calculated as follows (5):
Svi = 1 − [(Rs ∗ Re)/25]
The values for resistance and resilience are those listed in Table 2 [61,62].
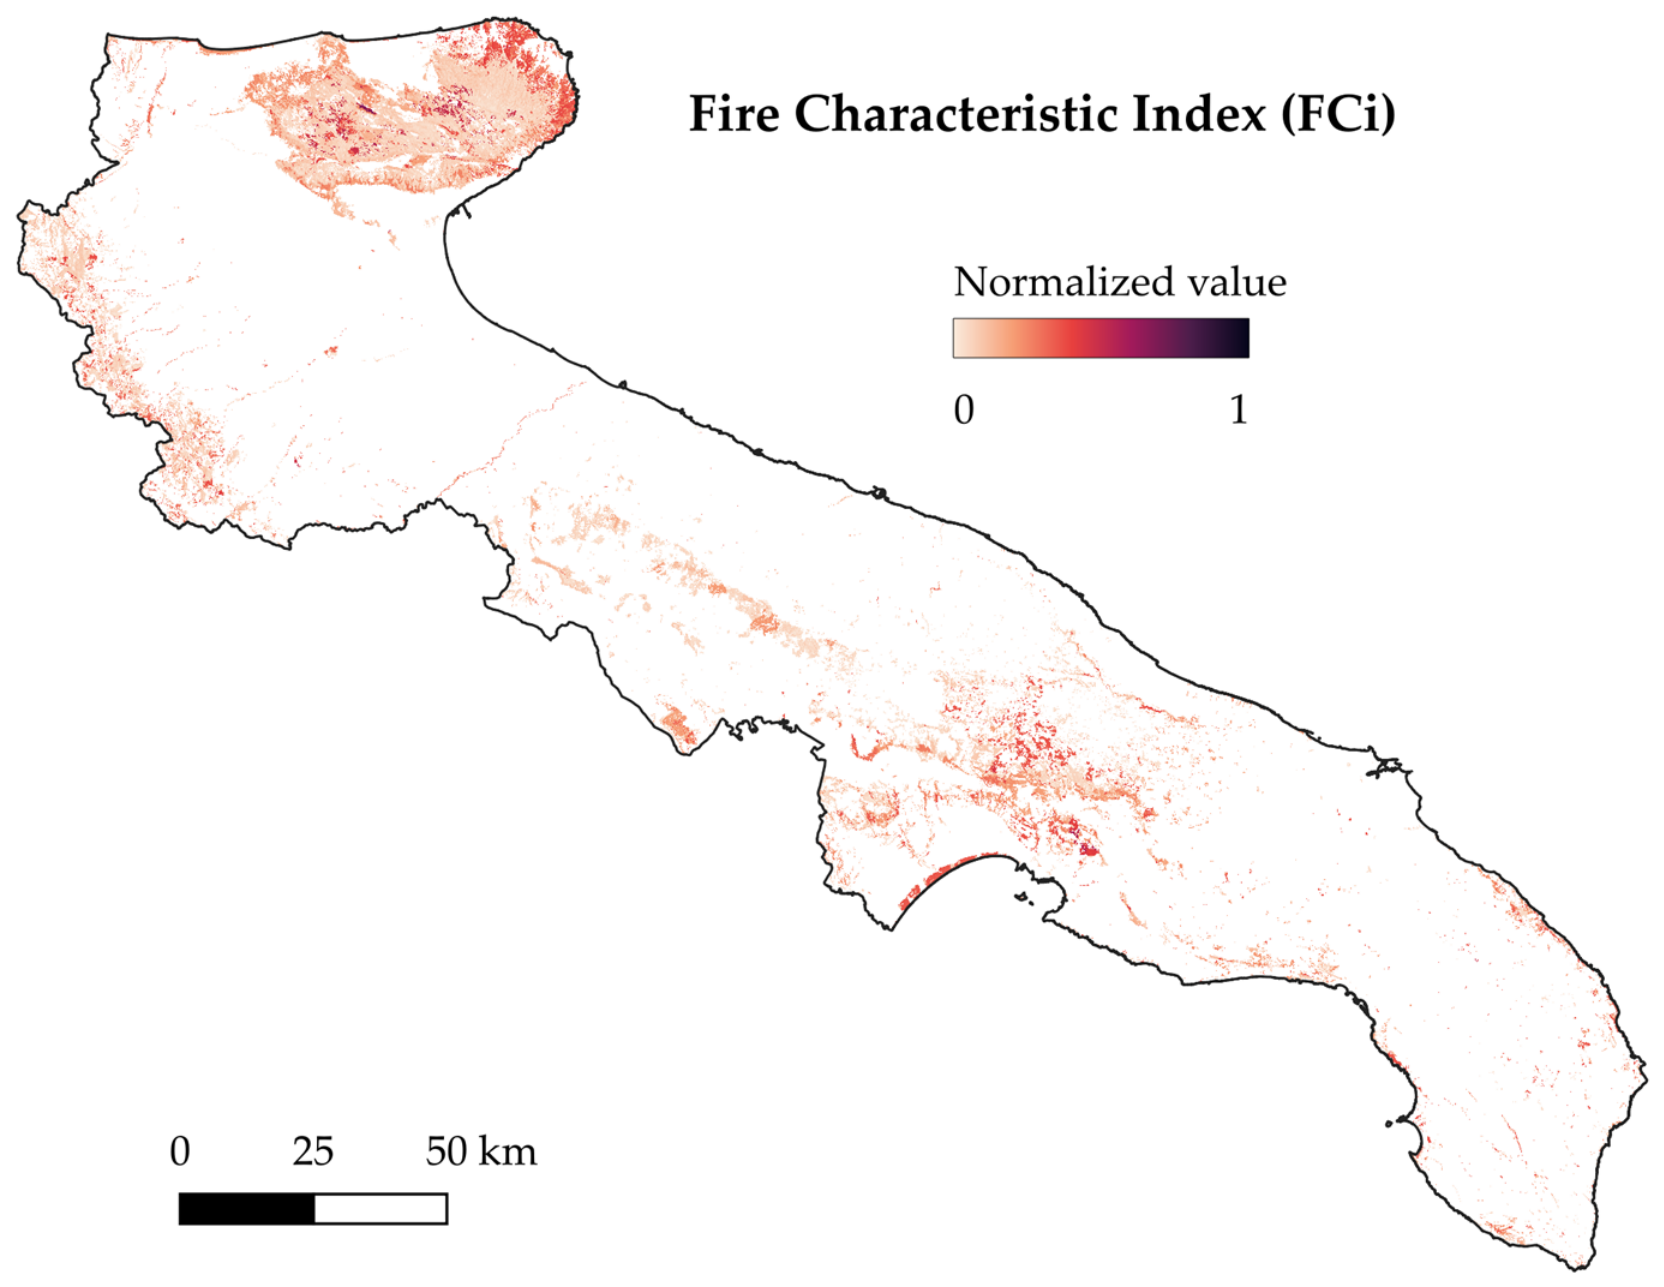
The FCi provides an estimate of the degree of damage that a fire can cause to exposed elements, soil and vegetation, independently of the characteristics of those elements. Following a synthetic approach that accounts only for static parameters, the calculation of the FCi is proposed as the sum of 3 sub-indices, two of which have already been described above: (a) the Vegetation Hazard Index (VHi); (b) the Morphological Hazard Index (MHi); (c) the Fire-affected Area Index (FAi).
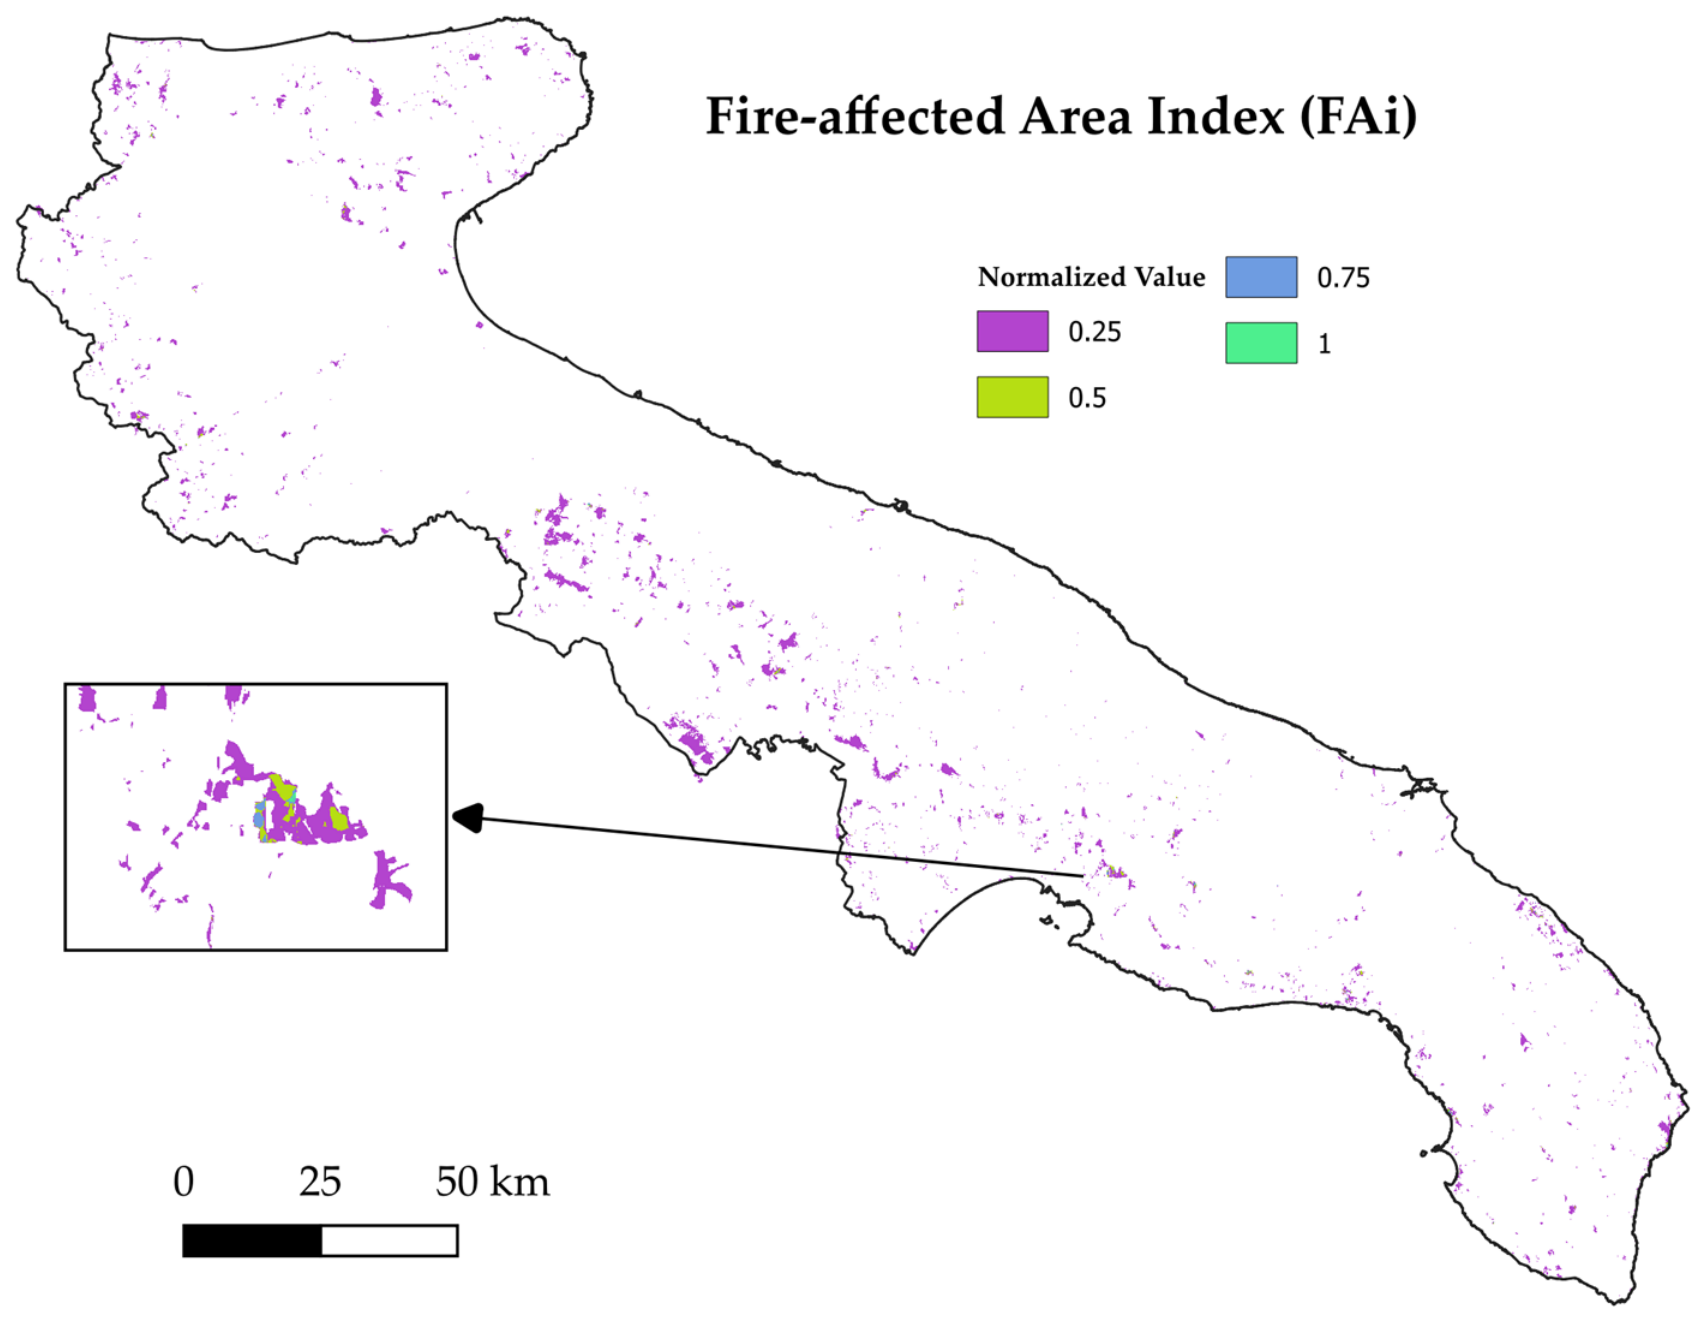
The FAi assigns to each pixel a value representing the historical fire occurrence of that area, expressed in terms of both the extent and the number of past fire events. The reference data are contained in the fire perimeters (polygons) covering the period from 2012 to 2021, produced by the relevant public authorities and provided in vector format. Higher normalised values indicate that the area has been affected by fire in a greater number of years within the period considered. After summing the three sub-indices, the FCi is then normalised to a range of 0 to 1.
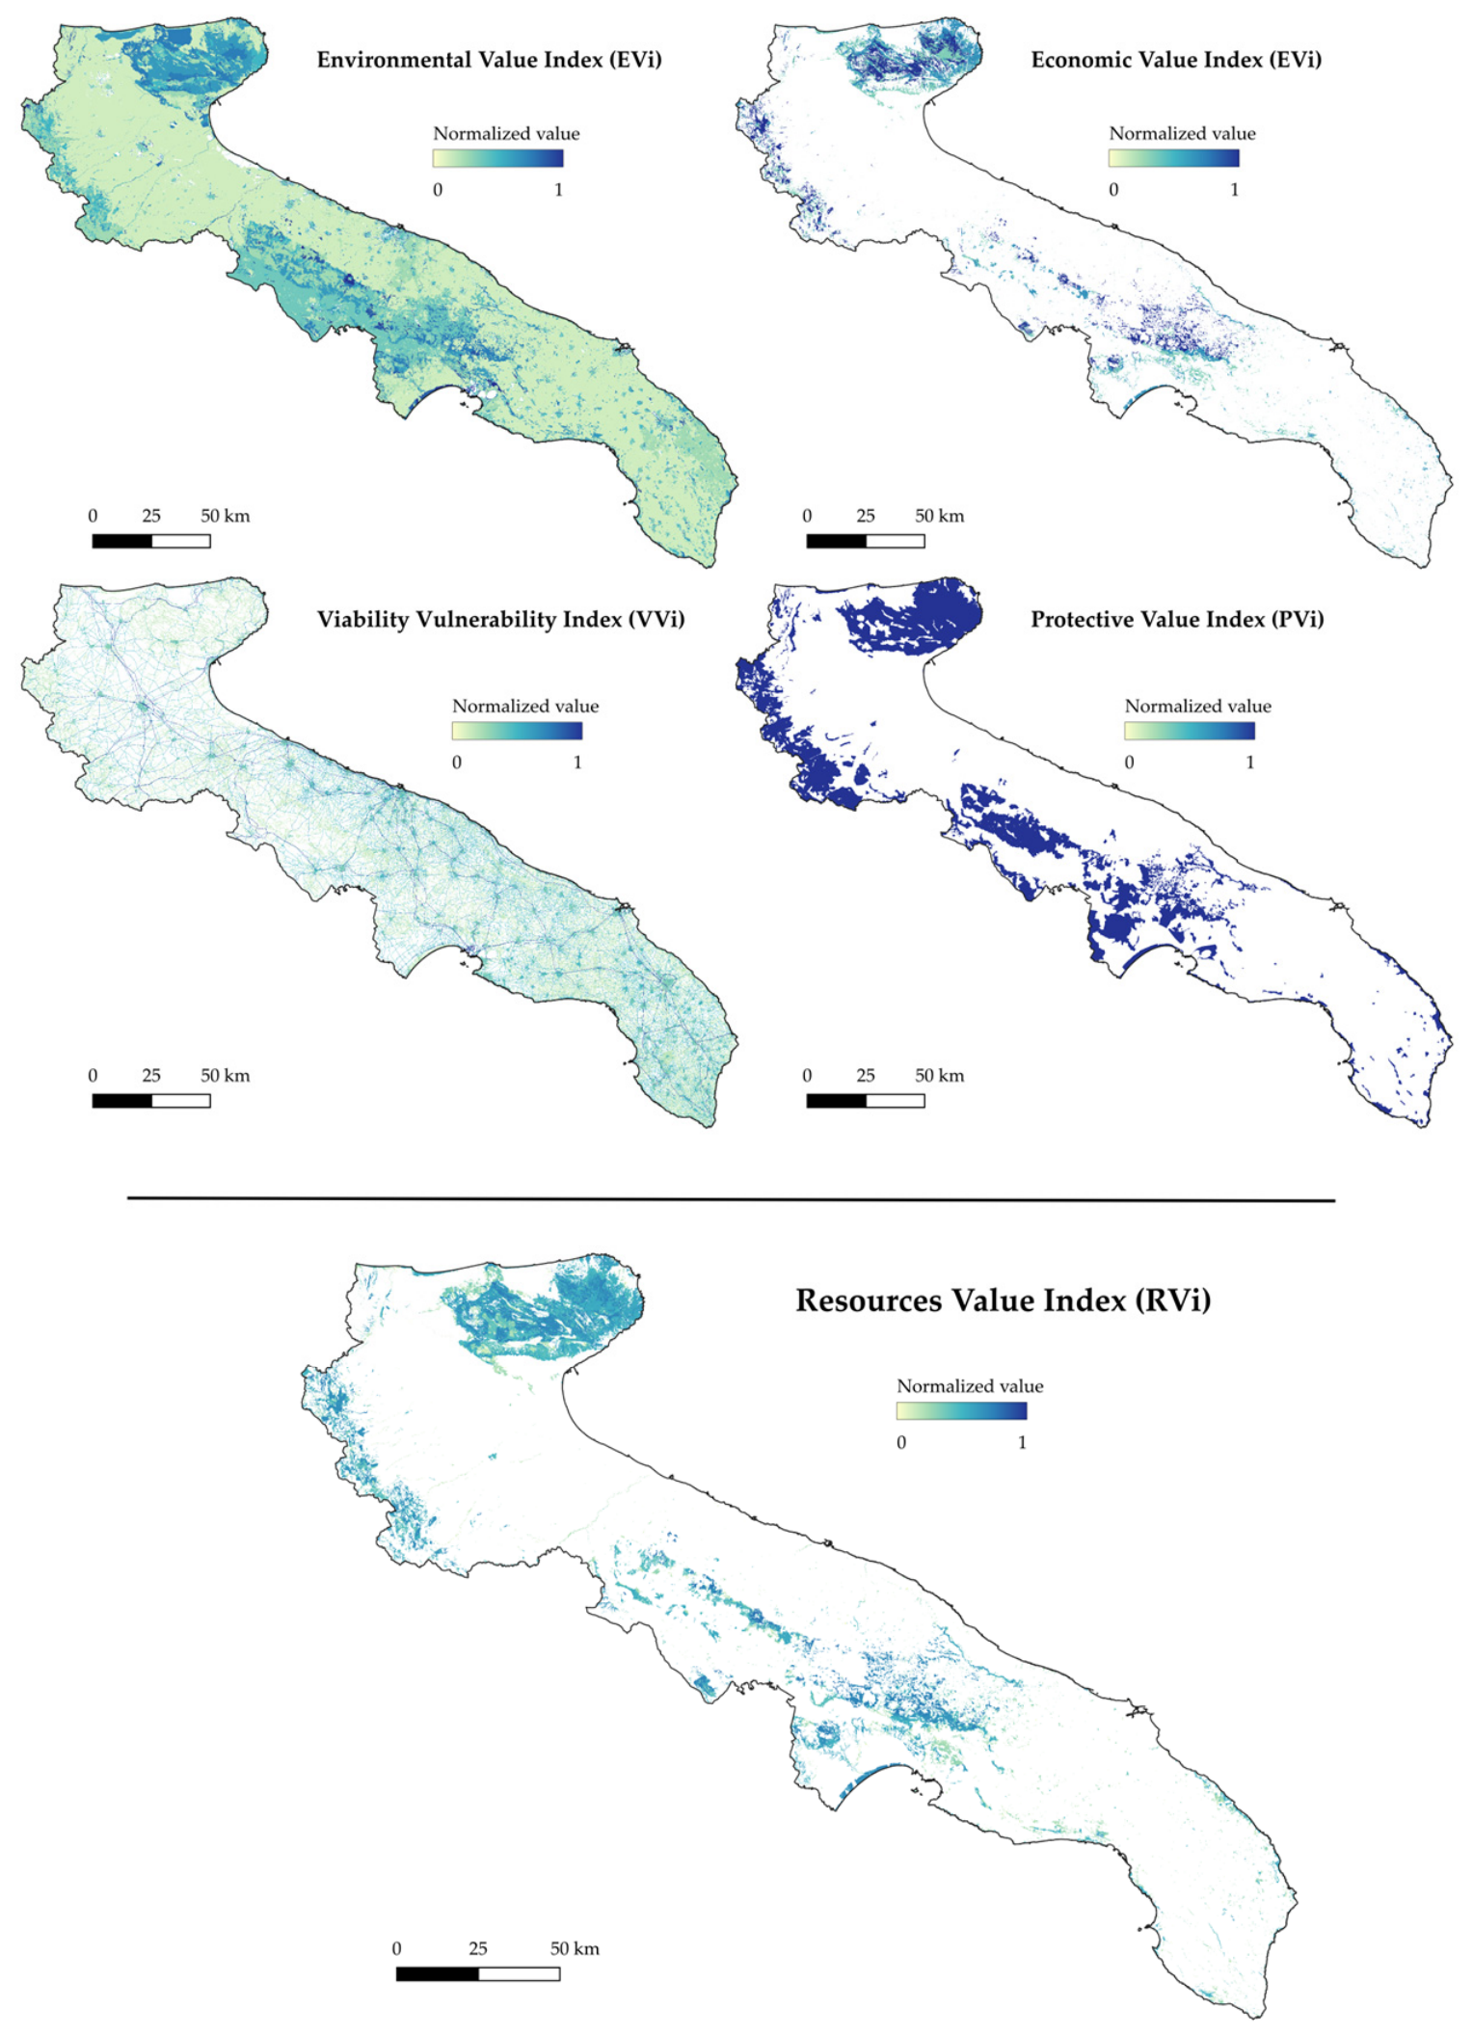
Another complex sub-index contributing to wildfire vulnerability is the Resources Value Index (RVi). This sub-index expresses the damage and/or potential negative changes that fires cause to the natural elements with which they interact, and is derived from the weighted sum, subsequently normalised, of EVi (Environmental Value Index), PVi (Protective Value Index), ECVi (Economic Value Index), and VVi (Viability Vulnerability Index).
For the calculation of the EVi, two indicators contained in the Nature Map dataset of the Apulia Region [55] are used. The first is the Ecological Value Index (understood as naturalistic quality), which provides a map highlighting areas where particular features of environmental naturalness are present. The values assigned to the Ecological Value Index range from 1 (very low ecological value) to 5 (very high ecological value). The second sub-index is the Environmental Fragility Index, which represents the vulnerability of the territory from the perspective of natural environment conservation. It is the result of combining the indices of ecological sensitivity and anthropogenic pressure, where ecological sensitivity is understood as the intrinsic predisposition of each individual biotope to the risk of degradation, and anthropogenic pressure as the disturbance exerted upon it by human activities. The values assigned to the Environmental Fragility Index range from 1 (very low environmental fragility) to 5 (very high environmental fragility). The two sub-indices are summed with assigned weights to obtain the EVi.
The PVi is developed on the basis of the regional hydrogeological constraint map. It is a binary map (classes 0–1) that identifies the absence (0) or presence (1) of the hydrogeological constraint as defined by the Landscape Plan of the Apulia Region. The economic value (ECVi) is expressed by assigning a score to the vegetation types included in the forest typology map of the Apulia Region, consistent with their direct economic function (Table 3).
Finally, the VVi expresses the potential damage from vegetation fires to infrastructure and to users travelling along the road network within the municipal territory. It is established a priori that the vulnerability of the road network to fires increases in relation to the number of users. Therefore, using a layer that incorporates the classification of the forest road network, as well as the regional road and railway network of Apulia, based on physical and legal characteristics, each road type is characterised through the use of specific attributes, and a vulnerability value is assigned to each category according to its hierarchical level, determined in relation to traffic volume and user type. For each linear element, a 50-metre buffer area is defined for VVi calculation.
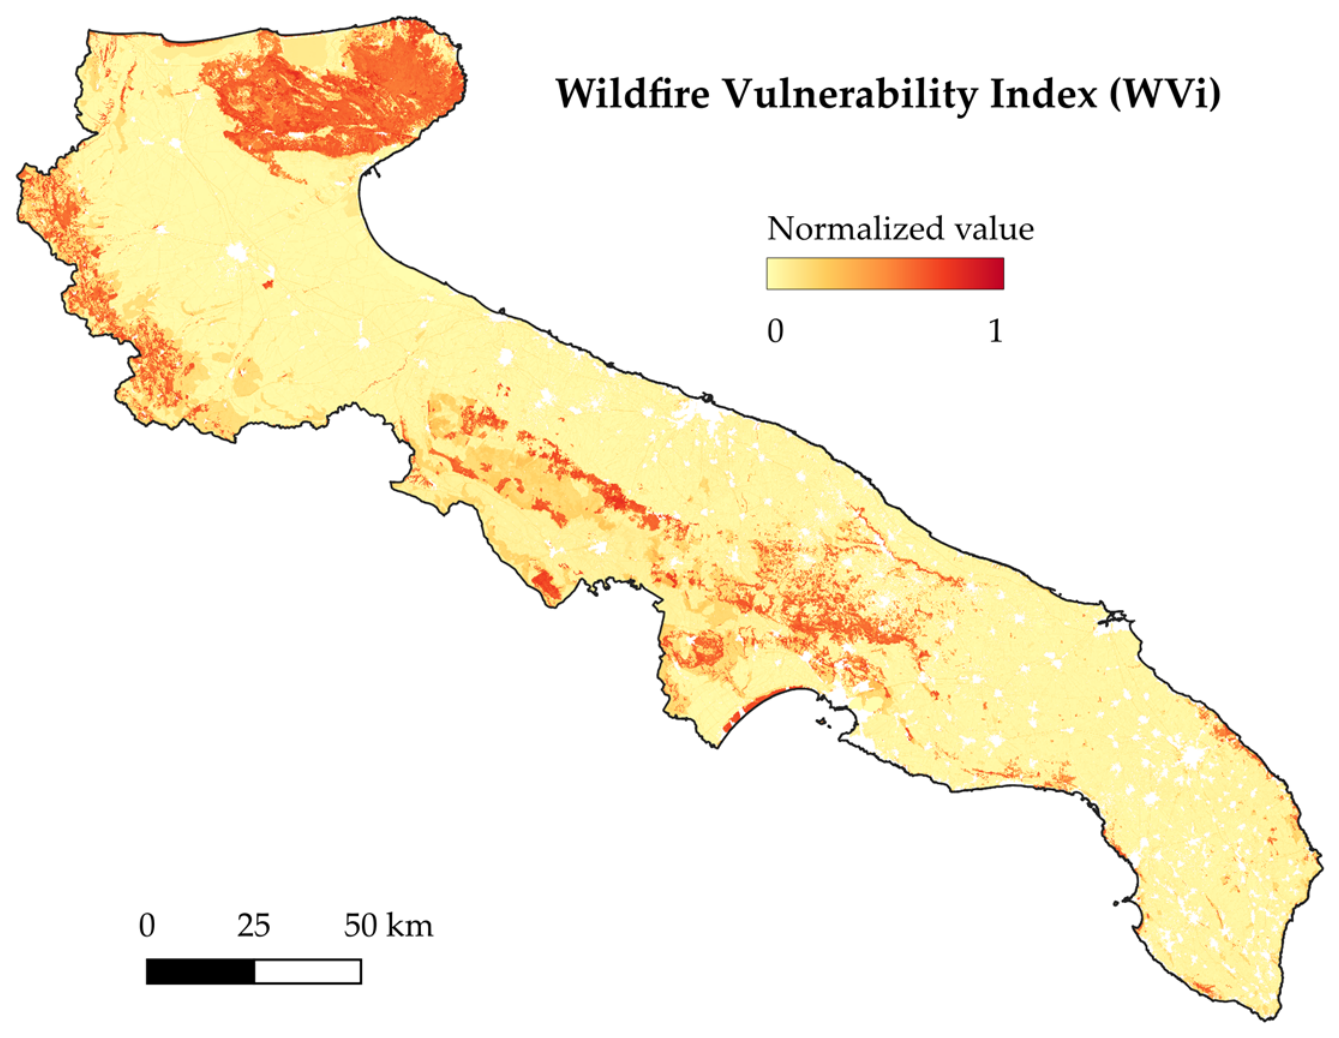
By summing the sub-indices SVi, FCi, and RVi and subsequently normalising the result to a 0–1 range, the Wildfire Vulnerability Index (WVi) is obtained, which brings together the aspects accounting for the vulnerability of the various territorial elements.
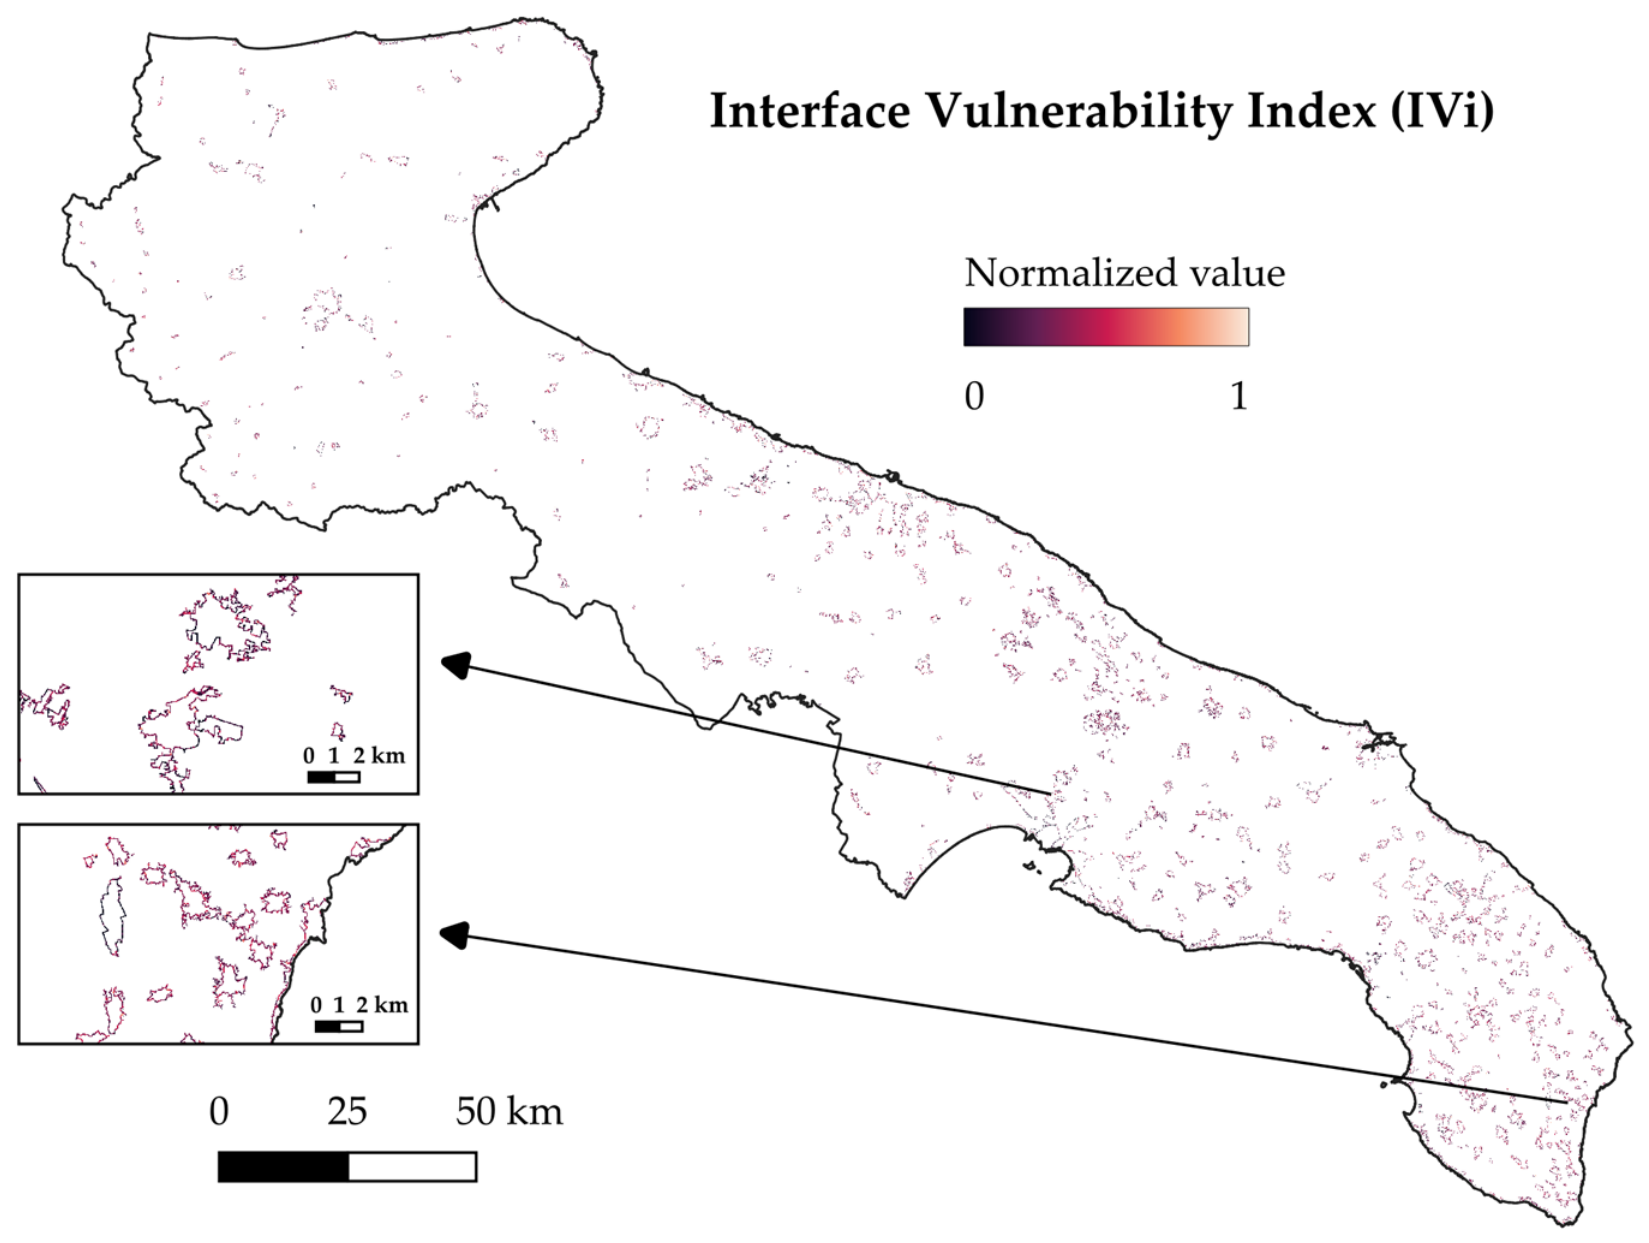
Furthermore, it was necessary to calculate an additional vulnerability index that also accounts for the wildland-urban interface zone, namely the Interface Vulnerability Index (IVi) [63]. The wildland-urban interface is a particularly vulnerable zone due to the presence of buildings and their appurtenances, infrastructure, and people. Settlements are especially vulnerable where vegetation approaches and borders the built-up area. For the mapping of interface fire vulnerability, the exposed elements within the interface zone are identified. Each element is assigned a sensitivity value ranging from 1 to 10, according to the references and tables provided in the operational manual of Civil Protection [25] and the Regional Guidelines of Apulia Region [26]. The overall vulnerability of an area is calculated as the sum of the products between the number of exposed elements for each sensitivity class and the corresponding sensitivity value.
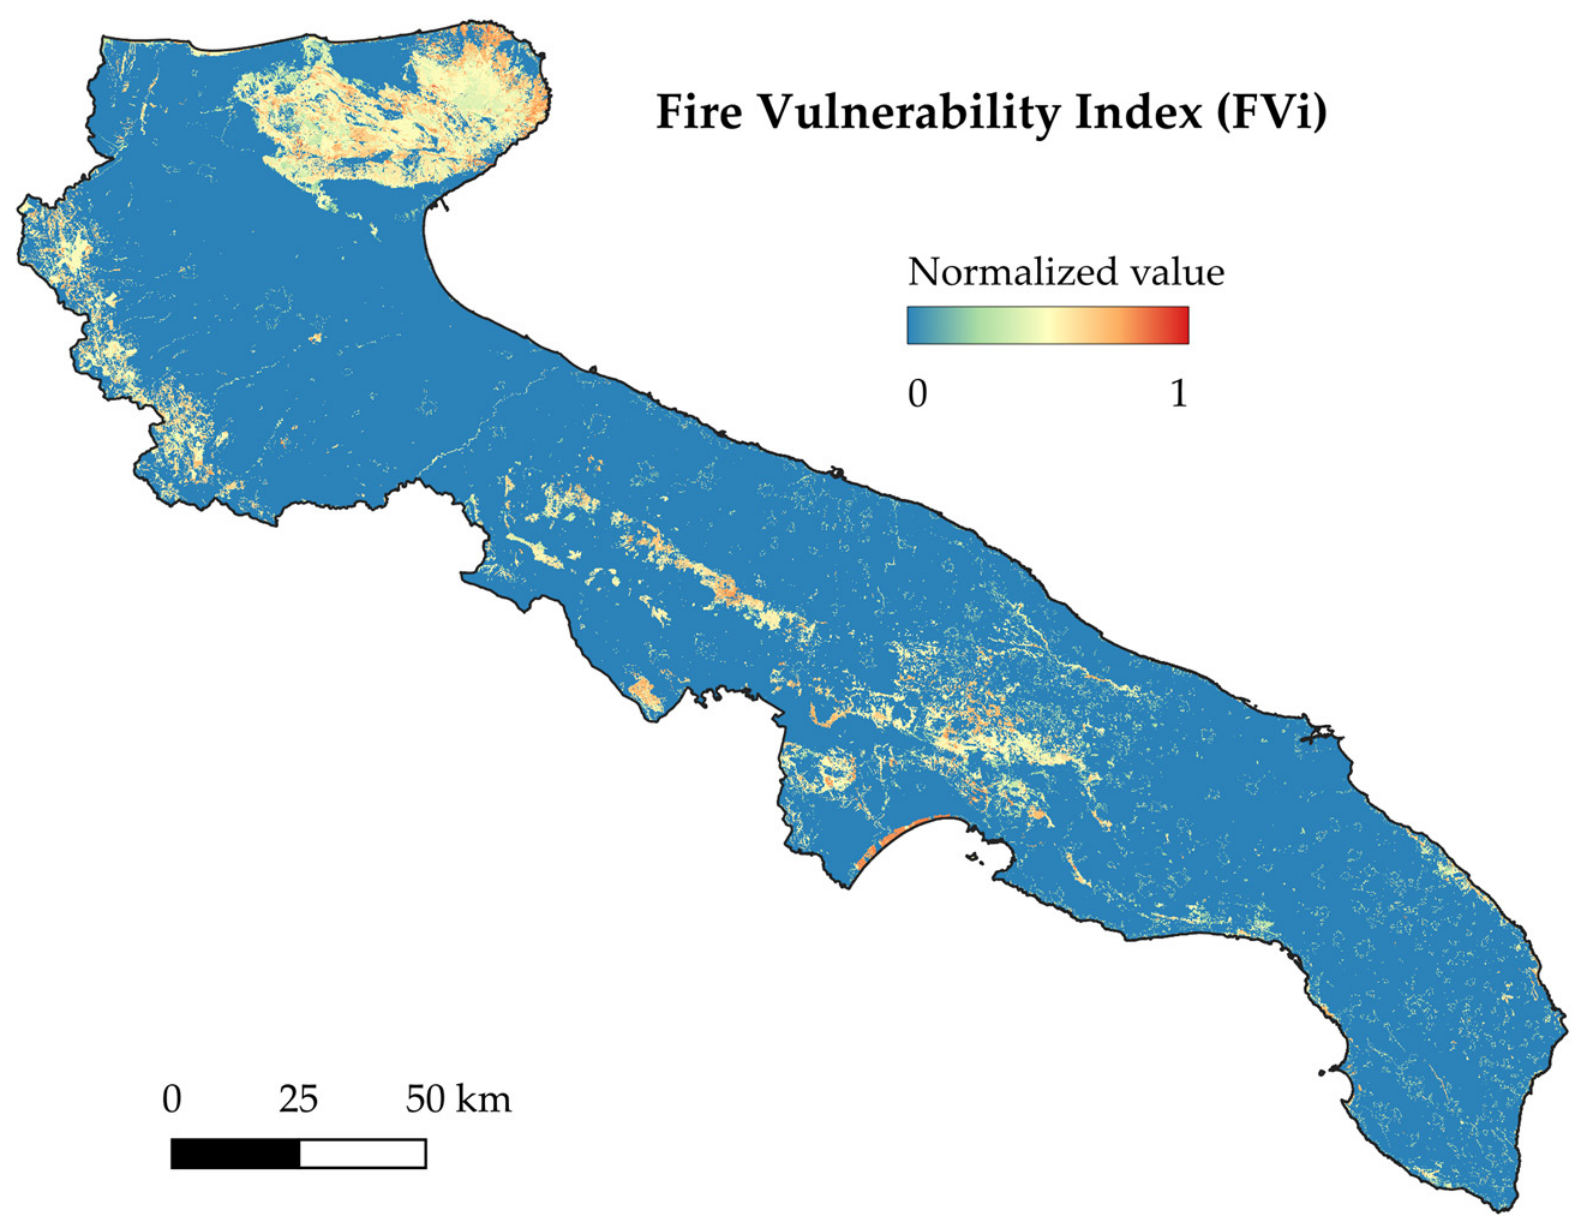
The IVi, together with the WVi, determines one of the two main synthetic indices, namely the Fire Vulnerability Index (FVi). The FVi map is the result of the spatial union of the WVi map and the IVi map, as the two maps address two distinct aspects of vulnerability, the vegetation component and the urban component, respectively. In this case as well, the resulting values were normalised.

2.2.3. Risk Indices Calculation

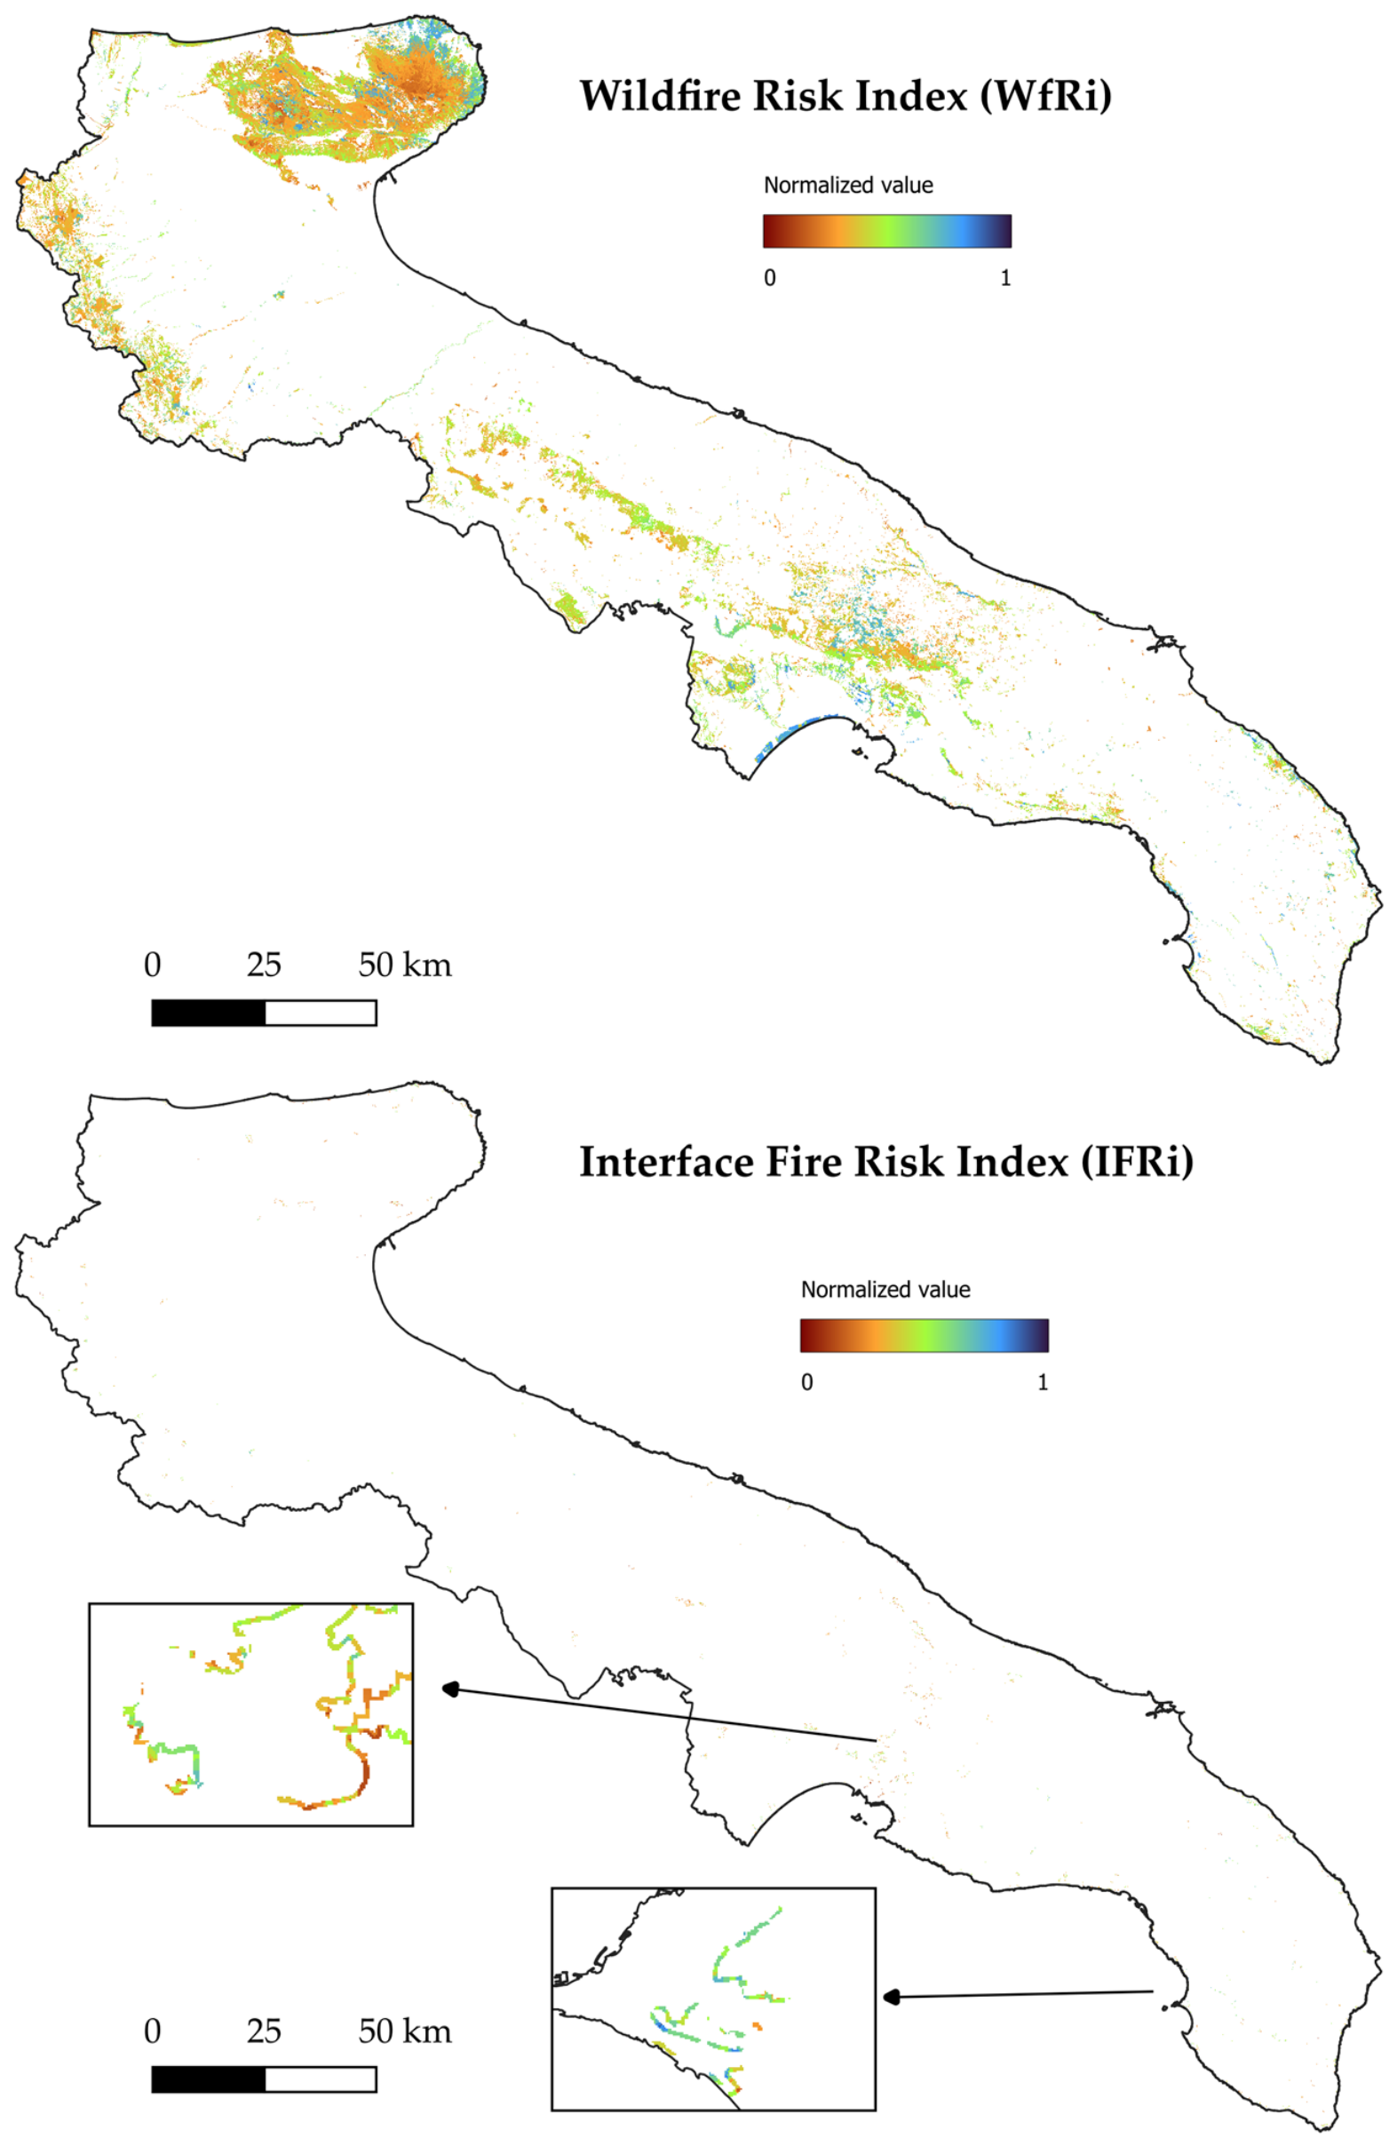
The final phase of this methodology consists of the calculation of the various risk indices, each representing the combination of selected sub-indices produced in the preceding stages. A Fire Risk Global Index (FRGi) map was generated as a composite indicator summarising the combined effect of hazard and vulnerability. An aggregated risk index was proposed that prioritises risk to human life while also accounting for ecological and socioeconomic dimensions. The first index is the Wildfire Risk Index (WfRi), derived from the product of the two indices, LTDi and WVi. The second, the Interface Fire Risk Index (IFRi), is the product of LTDi and IVi.
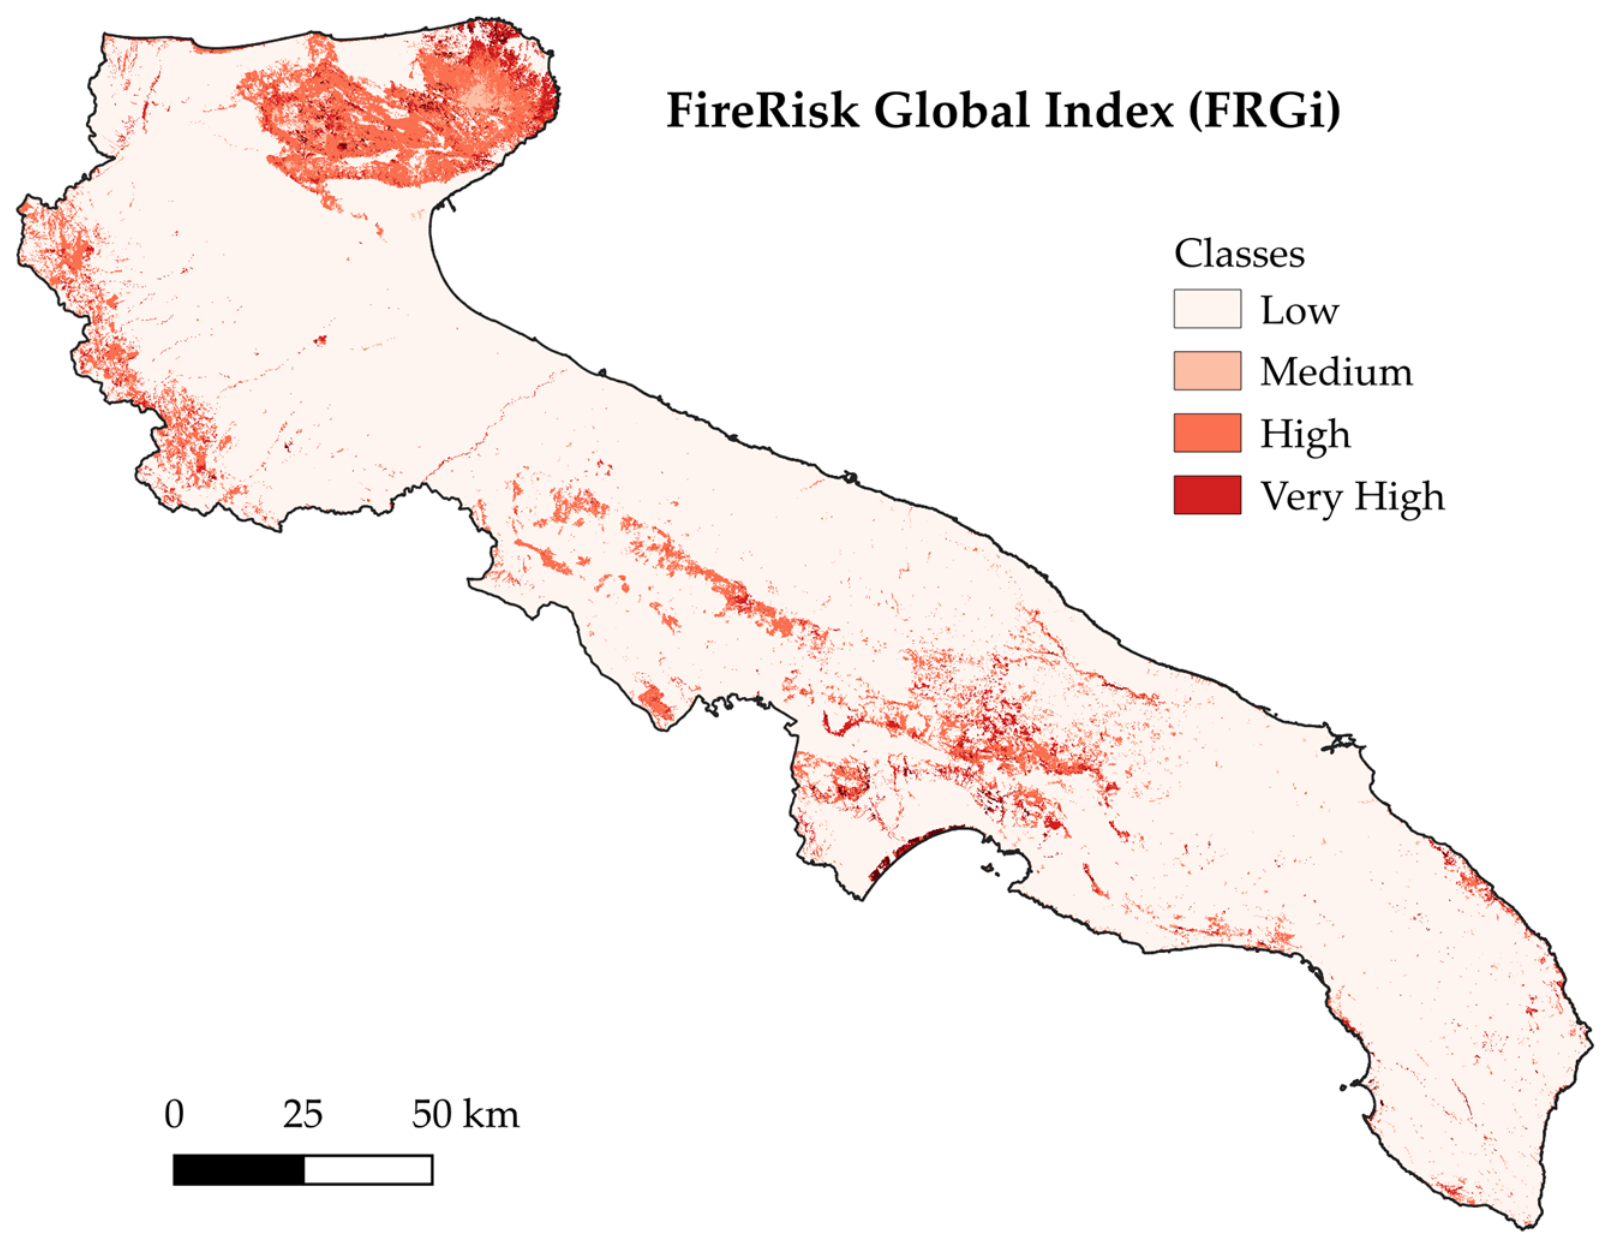
The Fire Risk Global Index (FRGi) represents the final output of this methodology and is obtained from the spatial union of the two preceding risk indices (WfRi and IFRi). The spatial union of the two raster values, performed using a QGIS module, allows the values of the two sub-indices to be combined, since both express a value relative to two different territorial entities: namely, the hazard associated with vegetated areas and the vulnerability associated with the interface area. The classification of the FRGi is defined by assigning a normalised index value to each pixel. These values are subsequently reclassified into five risk classes (low, medium, high, very high). In areas where the hazard and vulnerability values are zero, a “low” risk rating has been assigned, as required by national guidelines.

3. Results

The methodology described in Section 2.2 enabled the development of five hazard sub-indices, several vulnerability sub-indices, and the two final composite indices, presented below.

3.1. Hazard Subindices

The five hazard sub-indices—VHi, HHi, CHi, MHi, and AHi—were calculated as normalised raster layers, each represented as a map in which values approaching 1 indicate higher fire hazard (Figure 6). The spatial resolutions and characteristics of the sub-indices differ from one another, reflecting both the distinct scientific meaning of each indicator and the differing nature of the underlying source data.
The five sub-indices were combined into the Long-Term Danger Index (LTDi, Figure 7), which synthesises vegetational, historical, climatic, morphological, and anthropogenic hazards into a single normalised (0–1) map.

3.2. Vulnerability Subindices

The Specific Vulnerability Index (SVi) map (Figure 8) shows the spatial distribution of ecosystem resistance/resilience capacity across the vegetation categories of the study area.
The Fire-affected Area Index (FAi, Figure 9), based on 2012–2021 fire perimeters, was combined with VHi and MHi to obtain the Fire Characteristics Index (FCi, Figure 10).
The Resources Value Index (RVi, Figure 11) integrates the EVi, PVi, ECVi, and VVi sub-indices into a single map of resource value exposed to fire damage.
Summing SVi, FCi, and RVi and normalising the result to a 0–1 range produced the Wildfire Vulnerability Index (WVi, Figure 12).
The Interface Vulnerability Index (IVi, Figure 13) maps the exposure and sensitivity of the wildland-urban interface. Two zoomed-in views are provided, given the relatively small footprint of the 50 m interface buffers at the regional scale.
The spatial union of WVi and IVi produced the Fire Vulnerability Index (FVi, Figure 14).

3.3. Risk Indices

The Wildfire Risk Index (WfRi) and the Interface Fire Risk Index (IFRi) are shown in Figure 15.
The Fire Risk Global Index (FRGi, Figure 16) represents the final output of the methodology.
Table 4 reports the distribution of the FRGi risk classes across the study area. The results show a strongly asymmetric distribution: the vast majority of the territory (88%) falls within the low-risk class, while higher-risk classes cover progressively smaller portions of the study area, with the “very high” class accounting for less than half a percentage point of the total surface area.
For a preliminary empirical validation of the methodology, the burned areas recorded over the period 2022–2024 were intersected with the FRGi classes (Table 5). These tables can be compared to facilitate a discussion of the results obtained in this regional context.

4. Discussion

In other Mediterranean regions, which are more similar in terms of geographical context and legislation to the case study presented here, the methodologies used vary considerably, particularly in the selection and specific evaluation of the factors to be considered when calculating indices and sub-indices. In addition to these different approaches, there are also various methods for combining and aggregating these indices. However, the common point of reference is often the final output and how public administrations in different countries use it [64].
The methodology proposed here can be usefully compared with recent wildfire risk and vulnerability assessments developed in other Mediterranean European countries sharing similar fire regimes, vegetation types, and land-use pressures. In Spain, more recent efforts such as IberFire [65] have focused on building spatiotemporal datasets to support national-scale risk assessment. In Portugal, wildfire ignition and susceptibility mapping have similarly relied on GIS-based multi-criteria and, more recently, machine-learning approaches integrating topographic, climatic, and anthropogenic factors [66]. In Greece, several studies have applied the Analytic Hierarchy Process (AHP) within a GIS environment to derive wildfire hazard maps at the regional scale, combining geomorphological, climatic, and anthropogenic variables in a manner conceptually close to the hazard sub-indices adopted in the present study [67]. In south-eastern France, Rivière et al. [68] proposed a multi-criteria ecological vulnerability assessment based on fuel load, fire return interval, and forest management, while a broader stepwise vulnerability framework tested across France, Greece, Italy, Portugal, and Spain [69] has highlighted persistent challenges in harmonising data availability and resolution across national contexts.
Compared with these approaches, the present methodology shares the same general MCDA/AHP philosophy but differs in two respects. First, it integrates hazard and vulnerability into a single operational output (the FRGi) explicitly designed for direct incorporation into a regional Civil Protection plan, rather than remaining at the stage of a research prototype. Second, it introduces a dedicated wildland-urban interface vulnerability component (IVi). At the same time, the reliance on regional datasets specific to the Apulia Region (fuel map, forest typology, hydrogeological constraints) mirrors a limitation common to the Spanish, Portuguese, and Greek case studies cited above: cross-country comparability remains constrained by the heterogeneity of national and regional data sources, even where the underlying multi-criteria logic is broadly shared.
In Italy, at the level of forest fire planning, the static risk maps that are generally produced are not integrated into other territorial management frameworks, both due to a lack of regulatory recognition and because the information is often incomplete or insufficiently tailored to the local context. Through their three-year wildfire plans, some Regions provide detailed static risk maps at a high level of informational and spatial detail. The methodologies used for their development vary considerably, and modifications to the national guidelines are frequently proposed. On this basis, the present methodology was developed with the aim of providing an innovative risk management tool capable of generating data that can be used in multiple ways, both for site-specific assessments and for aggregation at the municipal level. The final output has been incorporated into the Plan of the Apulia Region 2023–2025 and is therefore employed as an operational tool for wildfire risk prevention and forecasting activities across the region.
The innovative character of the methodology extends beyond the factors and variables used to compute the sub-indices and indices and encompasses the operational workflow itself. All indices and sub-indices were developed within a fully open-source GIS environment, using QGIS as the primary platform for data processing, spatial analysis, and cartographic output. The adoption of an open-source workflow was a deliberate and methodologically significant choice, as it ensures full reproducibility of the methodology by public authorities and regional administrations, which frequently lack access to proprietary software licences. All geoprocessing operations, including raster algebra, vector-to-raster conversion, spatial joins, buffer generation, and normalisation procedures, were carried out using native QGIS algorithms and dedicated plugins, without reliance on any external proprietary dependency. A key technical challenge in the implementation was the harmonisation of datasets originating from heterogeneous sources, characterised by different spatial resolutions, coordinate reference systems, and data formats (vector and raster). All layers were reprojected to a common coordinate reference system (EPSG:32633—WGS 84/UTM zone 33 N) and resampled to a uniform spatial resolution of 20 m, corresponding to that of the VHi raster layer, which defines the spatial extent of vegetated areas subject to fire risk assessment.
In this study, all raster datasets were resampled to the resolution of the VHi raster, as this variable directly represents the distribution and condition of vegetative fuel, a fundamental element in fire ignition and propagation processes. The selection of the VHi resolution is therefore consistent with the analytical objective, which is to assess fire risk at the scale at which fuel is effectively observed. The adoption of a common spatial resolution is necessary to ensure spatial coherence across the different input layers, as required in GIS and remote sensing analyses, enabling pixel-wise comparisons among heterogeneous variables. In this context, the VHi was treated as the driving variable, given its direct connection to vegetation availability and stress, the primary controlling factors of fire risk. Consequently, the remaining variables (climatic, topographic, and anthropogenic) were adapted to this spatial scale, on the assumption that they can be adequately represented as continuous or averaged fields within each VHi pixel. It is important to note that upscaling coarser-resolution variables to the VHi grid may introduce a spatial representation that is more detailed than the original information, potentially generating smoothing effects and pseudo-replication. Nevertheless, this approach preserves the spatial detail of fuel-related variables, which constitute the most relevant factor in fire risk modelling, while ensuring a coherent basis for the integration of the different datasets.
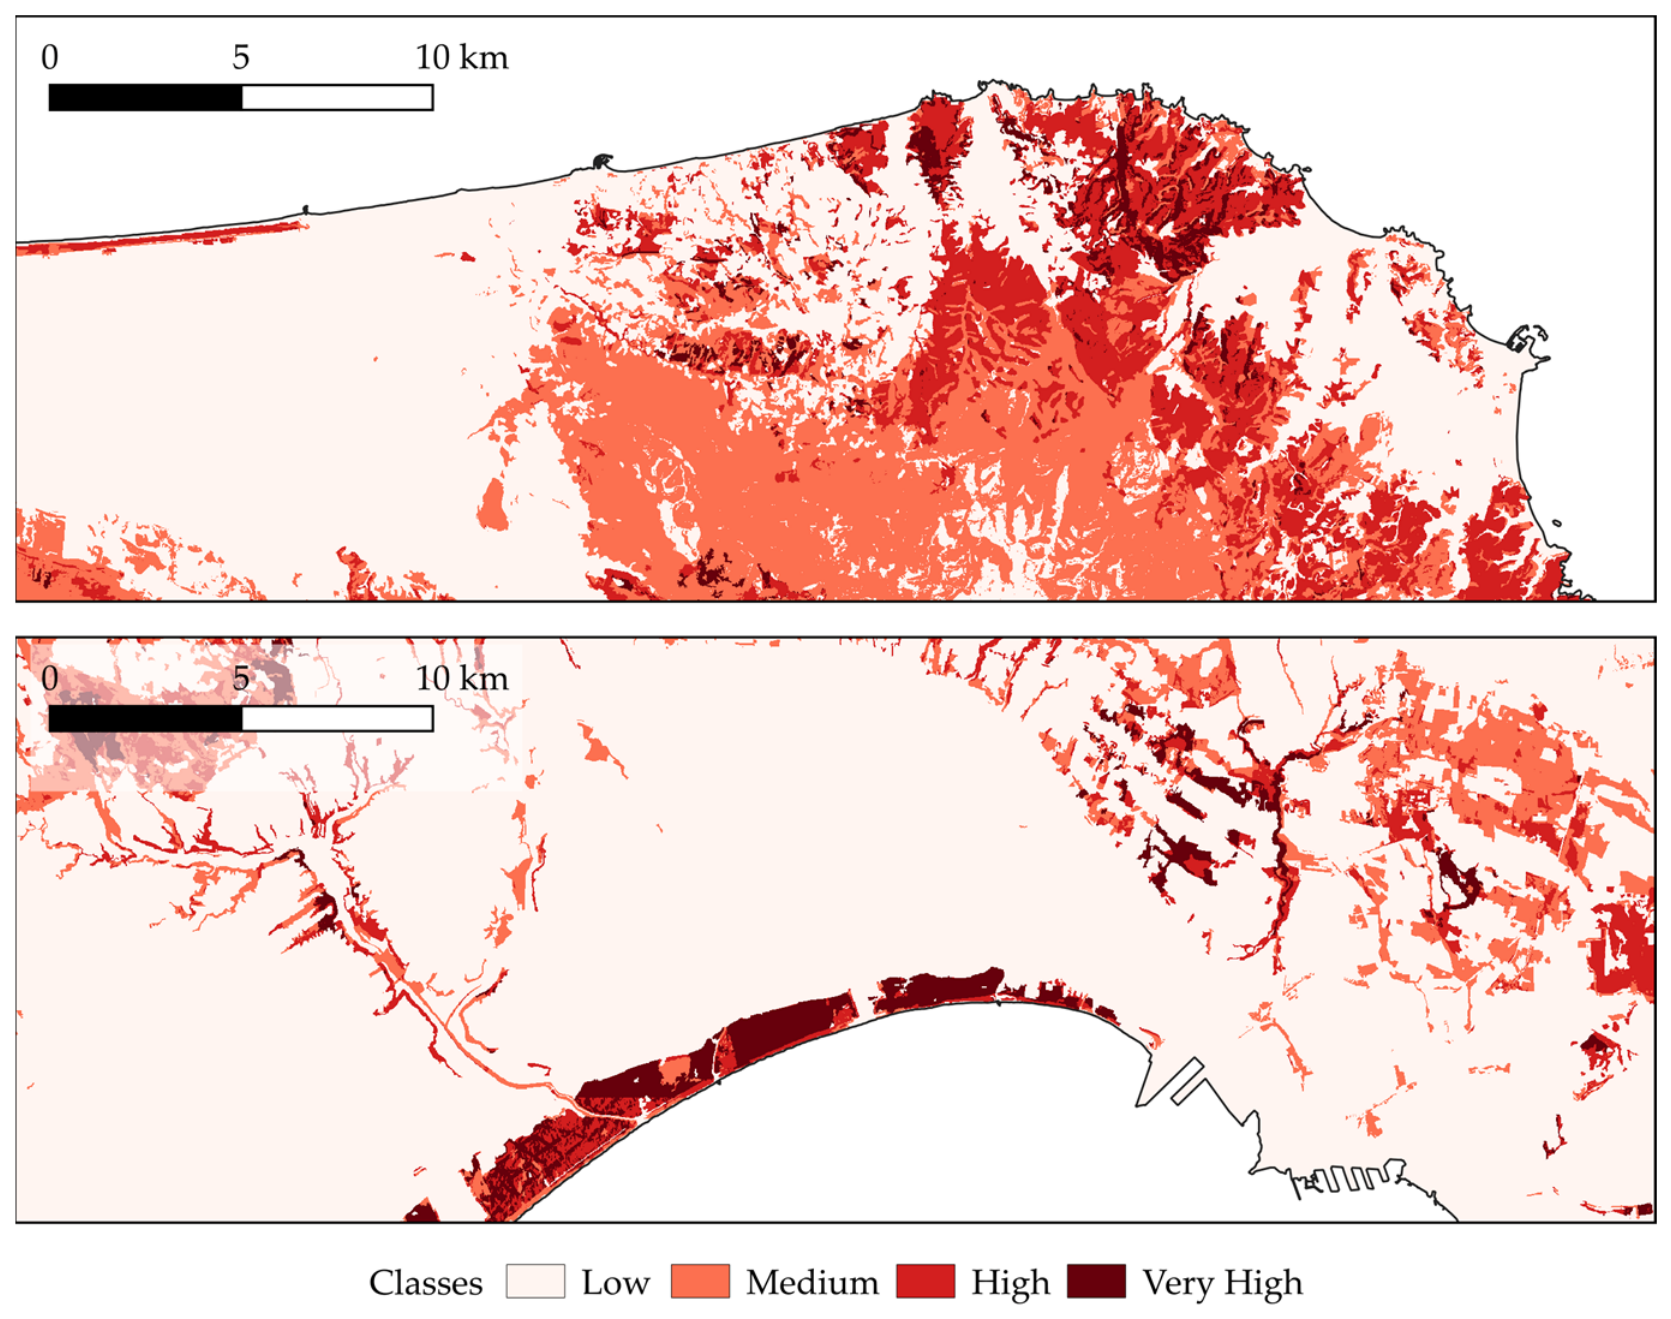
The results should therefore be interpreted with reference to the VHi scale as the analytical reference scale. This approach yields a spatial resolution (Figure 17) that supports a multi-scale framework: it enables local-level risk assessment while also allowing data aggregation according to planning requirements, given that prevention, forecasting, and active firefighting activities are frequently organised on the basis of administrative units.
Fuel resolution is a determining factor in fire modelling, as it controls the spatial distribution of combustible material and fire propagation. Furthermore, the integration of heterogeneous variables in a GIS environment requires a common spatial reference, typically achieved through resolution harmonisation. The choice of analytical scale, therefore, depends on the phenomenon under study, and in the case of wildfires, it is consistent to adopt the resolution of the variable that best represents the fuel [70]. Furthermore, the FRGi was calculated exclusively over areas with vegetative fuel cover, meaning that urban and anthropised areas were excluded from the analysis [49,71]. The assessment of the ability of fire risk indices to predict fire occurrence is a widely addressed topic in the scientific literature. In the present case, given the operational nature of the application, validation was carried out through an analytical examination of selected statistics, with the aim of demonstrating the internal consistency of the model in a statistically interpretable and scientifically defensible manner. Future developments of the methodology are expected to include a more robust statistical evaluation of index performance [72].
Based on the initial assessment of the distribution of classes across the region, it shows that the pattern is typical of environmental risk indices and suggests that the fire-predisposing factors, combustible vegetation, slope, aridity, and aspect, are not uniformly distributed across the territory but are concentrated in specific and spatially limited areas. This distributional behaviour has also been observed in other indices [73,74].
Moreover, for a preliminary empirical validation of the methodology, the burned areas recorded over the period 2022–2024 were considered, and the hectares and percentages falling within each risk class were calculated. Although this does not represent a formal predictive validation, it provides an initial consistency check of the model, showing that higher-risk classes are systematically associated with a greater proportion of burned areas. The final result is significant: if the index were random or poorly calibrated, the distribution of fire events should mirror that of the total surface area. Instead, a clear and systematic divergence is observed; the higher-risk classes are massively overrepresented among burned areas relative to their territorial extent. This can be assessed by comparing the class-level percentages reported in Table 4 and Table 5. The “medium” class proves to be the most overrepresented (nearly 4×), which carries a precise ecological interpretation: it likely represents the most dynamically active transitional zone of the territory, where predisposing conditions combine with a relatively larger available surface area. This pattern, a peak in the intermediate class rather than in the highest one, is commonly observed in the literature and often reflects saturation effects or the extreme rarity of “very high” risk areas. The low class, accounting for 53% of the burned area, represents another noteworthy finding: although 88% of the territory falls within the low-risk class, the sheer extent of that class means that even a low per-unit-area risk generates a substantial share of total burned area in absolute terms.
Regarding replicability, the methodology was developed and calibrated specifically for the Apulia Region, and its direct transferability to other geographical and climatic contexts cannot be assumed without appropriate adaptation. However, the deliberate choice of an entirely open-source workflow, based on QGIS and publicly available datasets, represents a significant step towards broader replicability. Unlike methodologies that depend on proprietary software or highly specialised technical expertise, the proposed framework can, in principle, be adopted and adapted by regional administrations and public authorities across different territorial contexts, provided that equivalent input data are available. The modular structure of the index system further facilitates this process, as individual sub-indices can be recalibrated or replaced to better reflect the environmental, climatic, and socioeconomic characteristics of different study areas. In this sense, the methodology aspires to serve not only as a site-specific planning tool but also as a transferable and adaptable reference framework for wildfire risk assessment at the regional scale. Moreover, building on the structured foundation provided by the Saaty pairwise comparison method, future developments could explore data-driven approaches to weight calibration, including machine learning techniques trained on historical fire data, as a means of further strengthening the objectivity of the index. Looking ahead, several directions appear particularly promising. The integration of dynamic risk components would allow the framework to evolve into a near-real-time risk-monitoring system, significantly enhancing its utility for operational civil protection activities. Periodic updates of the input datasets, including vegetation maps and climatic records, would further improve the temporal representativeness of the indices. The methodology could also be extended and adapted to other Italian or Mediterranean regions, contributing to the development of a more harmonised and comparable approach to wildfire risk assessment across different administrative contexts. Furthermore, the methodology and operational activities carried out allow for rapid updates and modifications in response to evolving needs and the strategies to be implemented.

5. Conclusions

The methodology presented in this study demonstrates that an integrated and reproducible approach to static wildfire risk assessment can be developed entirely within an open-source GIS environment, without relying on proprietary software or advanced technical expertise that would limit its adoption by public administrations. The combined evaluation of hazard and vulnerability, through a structured set of indices that account for vegetational, climatic, morphological, anthropogenic, and ecological factors, allows for a comprehensive and spatially detailed characterisation of fire risk at the regional scale. A key strength of the proposed framework lies in its operational dimension. The incorporation of the Fire Risk Global Index into the Regional Wildfire Plan of Apulia Region confirms that scientifically grounded methodologies can be effectively translated into planning tools for civil protection authorities, bridging the gap between academic research and institutional decision-making. The results also highlight the importance of accounting for both the hazard and vulnerability components when assessing wildfire risk, as neither dimension alone is sufficient to capture the complexity of fire dynamics and their potential impacts on ecosystems, infrastructure, and communities. The wildland-urban interface, in particular, emerges as a critical zone requiring dedicated assessment approaches given the convergence of natural and anthropogenic risk factors. Looking ahead, the methodology lends itself to further refinement through the integration of dynamic risk components, improved validation procedures, and adaptation to other regional contexts within the Mediterranean basin. As climate change continues to extend fire seasons and increase the frequency of extreme fire events, robust and accessible risk assessment tools will play an increasingly central role in supporting prevention, preparedness, and land management strategies at multiple administrative levels.

Author Contributions

The design and conduct of this research are equally shared between the authors. The authors collaborated to produce this paper. Conceptualisation, A.L., G.N., and G.C.; methodology, A.L., G.N., and G.C.; software, G.N. and G.C.; validation, A.L.; investigation, A.L., G.N., and G.C.; data curation, G.N.; writing—original draft preparation, G.C.; writing—review and editing, A.L. and G.C. All authors have read and agreed to the published version of the manuscript.

Funding

This research received no external funding.

Institutional Review Board Statement

Not applicable.

Data Availability Statement

The original contributions presented in the study are included in the article; further inquiries can be directed to the corresponding author.

Acknowledgments

Special thanks to Francesco Vito Ronco and Domenico Donvito of the Apulia Region’s Department of Civil Protection for providing the data used in the preparation of this article.

Conflicts of Interest

The authors declare no conflicts of interest.

Abbreviations

The following abbreviations are used in this manuscript:
VHiVegetation Hazard Index
CHiClimate Hazard Index
HHiHistorical Hazard Index
AHiAnthropogenic Hazard Index
MHiMorphological Hazard Index
LTDiLong-Term Danger Index
SViSpecific Vulnerability Index
FCiFire Characteristics Index
RViResources Value Index
FAiFire-affected Area Index
EViEnvironmental Value Index
PViProtective Value Index
EViEconomic Value Index
VViViability Vulnerability Index
WFViWildfire Vulnerability Index
IViInterface Vulnerability Index
WfRiWildfire Risk Index
FViFire Vulnerability Index
IFRiInterface Fire Risk Index
FRGiFire Risk Global Index

References

  1. San-Miguel-Ayanz, J.; Durrant, T.; Boca, R.; Maianti, P.; Libertà, G.; Oom, D.; Branco, A.; De Rigo, D.; Suarez-Moreno, M.; Ferrari, D.; et al. Advance Report on Forest Fires in Europe, Middle East and North Africa 2024; Publications Office of the European Union: Luxembourg, 2025. [Google Scholar] [CrossRef]
  2. Joint Research Centre. 2023 Among Five Worst Years for Wildfires in Europe, 2024 Provides Some Relief. Available online: https://joint-research-centre.ec.europa.eu/jrc-news-and-updates/2023-among-five-worst-years-wildfires-europe-2024-provides-some-relief-2024-11-19_en (accessed on 19 January 2026).
  3. ISPRA. Incendi Boschivi nel 2023. Available online: https://www.isprambiente.gov.it/it/istituto-informa/comunicati-stampa/anno-2024/incendi-boschivi-nel-2023 (accessed on 23 January 2026).
  4. Jones, M.W.; Kelley, D.I.; Burton, C.A.; Di Giuseppe, F.; Barbosa, M.L.F.; Brambleby, E.; Hartley, A.J.; Lombardi, A.; Mataveli, G.; McNorton, J.R.; et al. State of Wildfires 2023–2024. Earth Syst. Sci. Data 2024, 16, 3601–3685. [Google Scholar] [CrossRef] [Scilit]
  5. Martínez, J.; Vega-Garcia, C.; Chuvieco, E. Human-Caused Wildfire Risk Rating for Prevention Planning in Spain. J. Environ. Manag. 2009, 90, 1241–1252. [Google Scholar] [CrossRef] [Scilit]
  6. Turco, M.; Rosa-Cánovas, J.J.; Bedia, J.; Jerez, S.; Montávez, J.P.; Llasat, M.C.; Provenzale, A. Exacerbated fires in Mediterranean Europe due to anthropogenic warming projected with non-stationary climate-fire models. Nat. Commun. 2018, 9, 3821. [Google Scholar] [CrossRef] [Scilit] [PubMed]
  7. Trucchia, A.; Meschi, G.; Fiorucci, P.; Gollini, A.; Negro, D. Defining Wildfire Susceptibility Maps in Italy for Understanding Seasonal Wildfire Regimes at the National Level. Fire 2022, 5, 30. [Google Scholar] [CrossRef] [Scilit]
  8. Di Fazio, S.; Modica, G. Modello per la definizione di un indice statico del rischio di incendi boschivi in area euro-mediterranea. Tec. Agric. 2009, 3/4, 69–99. [Google Scholar]
  9. Zhang, H.; Qi, P.; Guo, G. Improvement of fire danger modelling with geographically weighted logistic model. Int. J. Wildland Fire 2014, 23, 1130–1146. [Google Scholar] [CrossRef] [Scilit]
  10. Konkathi, P.; Shetty, A.; Kolluru, V.; Yathish, P.H.; Pruthviraj, U. Static Fire Risk Index for the Forest Resources of Karnataka. In Proceedings of the IGARSS 2019—IEEE International Geoscience and Remote Sensing Symposium, Yokohama, Japan, 28 July–2 August 2019; pp. 6716–6719. [Google Scholar] [CrossRef] [Scilit]
  11. Nunes, A.N.; Figueiredo, A.; Pinto, C.; Lourenço, L. Assessing Wildfire Hazard in the Wildland–Urban Interfaces (WUIs) of Central Portugal. Forests 2023, 14, 1106. [Google Scholar] [CrossRef] [Scilit]
  12. Abatzoglou, J.T.; Kolden, C.A.; Cullen, A.C.; Sadegh, M.; Williams, E.L.; Turco, M.; Jones, M.W. Climate change has increased the odds of extreme regional forest fire years globally. Nat. Commun. 2025, 16, 6390. [Google Scholar] [CrossRef] [Scilit] [PubMed]
  13. Erni, S.; Wang, X.; Swystun, T.; Taylor, S.W.; Parisien, M.-A.; Robinne, F.-N.; Eddy, B.; Oliver, J.; Armitage, B.; Flannigan, M.D. Mapping wildfire hazard, vulnerability, and risk to Canadian communities. Int. J. Disaster Risk Reduct. 2024, 101, 104221. [Google Scholar] [CrossRef] [Scilit]
  14. Chuvieco, E.; Yebra, M.; Martino, S.; Thonicke, K.; Gómez-Giménez, M.; San-Miguel, J.; Oom, D.; Velea, R.; Mouillot, F.; Molina, J.R.; et al. Towards an Integrated Approach to Wildfire Risk Assessment: When, Where, What and How May the Landscapes Burn. Fire 2023, 6, 215. [Google Scholar] [CrossRef] [Scilit]
  15. Khan, M.A.; Atif, M.; Ahmad, M. Applications of Geospatial Technology in Wildfire Studies. In Application of Geospatial Technology and Modelling on Natural Resources Management. Advances in Geographic Information Science; Das, S., Pandey, P.C., Mutanga, O., Tikle, S., Jiang, M., Chatterjee, U., Anand, A., Eds.; Springer: Cham, Switzerland, 2025. [Google Scholar] [CrossRef] [Scilit]
  16. Lanorte, A.; Nolè, G.; Cillis, G. Application of Getis-Ord Correlation Index (Gi) for Burned Area Detection Improvement in Mediterranean Ecosystems (Southern Italy and Sardinia) Using Sentinel-2 Data. Remote Sens. 2024, 16, 2943. [Google Scholar] [CrossRef] [Scilit]
  17. Eugenio, F.C.; Rosa dos Santos, A.; Fiedler, N.C.; Ribeiro, G.A.; Gomes da Silva, A.; Banhos dos Santos, Á.; Gaburro Paneto, G.; Schettino, V.R. Applying GIS to develop a model for forest fire risk: A case study in Espírito Santo, Brazil. J. Environ. Manag. 2016, 173, 65–71. [Google Scholar] [CrossRef] [Scilit] [PubMed]
  18. Alasli, M. Static Risk Mapping of Forest Fires in the Case of the Province of Chefchaouen (Morocco). Proc. Int. Cartogr. Assoc. 2019, 2, 2. [Google Scholar] [CrossRef] [Scilit]
  19. Tonini, M.; D’Andrea, M.; Biondi, G.; Degli Esposti, S.; Trucchia, A.; Fiorucci, P. A Machine Learning-Based Approach for Wildfire Susceptibility Mapping. The Case Study of the Liguria Region in Italy. Geosciences 2020, 10, 105. [Google Scholar] [CrossRef] [Scilit]
  20. Ghorbanzadeh, O.; Valizadeh Kamran, K.; Blaschke, T.; Aryal, J.; Naboureh, A.; Einali, J.; Bian, J. Spatial Prediction of Wildfire Susceptibility Using Field Survey GPS Data and Machine Learning Approaches. Fire 2019, 2, 43. [Google Scholar] [CrossRef] [Scilit]
  21. Trucchia, A.; Meschi, G.; Fiorucci, P.; Provenzale, A.; Tonini, M.; Pernice, U. Wildfire hazard mapping in the eastern Mediterranean landscape. Int. J. Wildland Fire 2023, 32, 417–434. [Google Scholar] [CrossRef] [Scilit]
  22. Lourenço, M.; Oliveira, L.B.; Oliveira, J.P.; Mora, A.; Oliveira, H.; Santos, R. An Integrated Decision Support System for Improving Wildfire Suppression Management. ISPRS Int. J. Geo-Inf. 2021, 10, 497. [Google Scholar] [CrossRef] [Scilit]
  23. Scarpa, C.; Elia, M.; D’Este, M.; Salis, M.; Rodrigues, M.; Arca, B.; Duce, P.; Fiori, M.A.F.; Pellizzaro, G. Modelling wildfire activity in wildland-urban interface (WUI) areas of Sardinia, Italy. Int. J. Wildland Fire 2024, 33, WF24109. [Google Scholar] [CrossRef] [Scilit]
  24. Istituto Poligrafico e Zecca dello Stato. Framework Law 353/2000 on Forest Fires. In Gazzetta Ufficiale della Repubblica Italiana; Istituto Poligrafico e Zecca dello Stato: Rome, Italy, 2000; Available online: https://www.parlamento.it/parlam/leggi/00353l.htm (accessed on 14 March 2026).
  25. Italian Department Civil Protection. Manuale Operativo per la Predisposizione di un Piano Comunale o Intercomunale di Protezione Civile; Dipartimento della Protezione Civile: Rome, Italy, 2007. Available online: http://emergenze.protezionecivile.gov.it/static/aefd7127e73d0ba99d2f6a9a6063c39a/Manuale.pdf (accessed on 15 March 2026).
  26. Italian Department Civil Protection. Linee Guida per la Redazione dei Piani di Protezione Civile Comunali; Regione Puglia: Bari, Italy, 2019. Available online: http://www.regione.puglia.it/documents/3171874/3251470/Linee-Guida-per-la-Redazione-dei-Piani-di-Protezione-Civile-Comunali.pdf (accessed on 15 March 2026).
  27. Verde, J.C.; Torres, J.S.; Marques, R.; Franc, R.; Flores, E.; Casartelli, V.; Marengo, A.; Melinato, S.; Mysiak, J.; Salpina, D.; et al. UCPM Wildfire Peer Review Report: Italy 2024; UCPM: Brussels, Belgium, 2024. [Google Scholar] [CrossRef]
  28. Oom, D.; de Rigo, D.; Pfeiffer, H.; Branco, A.; Ferrari, D.; Grecchi, R.; Artés-Vivancos, T.; Houston Durrant, T.; Boca, R.; Maianti, P.; et al. Pan-European Wildfire Risk Assessment; EUR 31160 EN; Publications Office of the European Union: Luxembourg, 2022. [Google Scholar] [CrossRef] [PubMed]
  29. Mangiameli, M.; Mussumeci, G.; Cappello, A. Forest Fire Spreading Using Free and Open-Source GIS Technologies. Geomatics 2021, 1, 50–64. [Google Scholar] [CrossRef] [Scilit]
  30. Graser, A.; Sutton, T.; Bernasocchi, M. The QGIS project: Spatial without compromise. Patterns 2025, 6, 101265. [Google Scholar] [CrossRef] [Scilit] [PubMed]
  31. Apulia Region Department Civil Protection. Piano Regionale di Previsione, Prevenzione E Lotta Attiva Contro Gli Incendi Boschivi 2023–2025. Available online: https://protezionecivile.regione.puglia.it/-/piano-regionale-di-previsione-prevenzione-e-lotta-attiva-contro-gli-incendi-boschivi-2023-2025 (accessed on 15 March 2026).
  32. Boenzi, F.; Caldara, M. Appunti sul paesaggio carsico pugliese. Itiner. Speleol. 1990, 4, 17–30. [Google Scholar]
  33. Chuvieco, E.; Aguado, I.; Jurdao, S.; Pettinari, M.L.; Yebra, M.; Salas, J.; Hantson, S.; de la Riva, J.; Ibarra, P.; Rodrigues, M.; et al. Integrating geospatial information into fire risk assessment. Int. J. Wildland Fire 2014, 23, 606–619. [Google Scholar] [CrossRef] [Scilit]
  34. Xi, D.D.Z.; Taylor, S.W.; Woolford, D.G.; Dean, C.B. Statistical Models of Key Components of Wildfire Risk. Annu. Rev. Stat. Appl. 2019, 6, 197–222. [Google Scholar] [CrossRef] [Scilit]
  35. Dunn, C.J.; O’Connor, C.D.; Abrams, J.; Thompson, M.P.; Calkin, D.E.; Johnston, J.D.; Stratton, R.; Gilbertson-Day, J. Wildfire risk science facilitates adaptation of fire-prone social-ecological systems to the new fire reality. Environ. Res. Lett. 2020, 15, 025001. [Google Scholar] [CrossRef] [Scilit]
  36. CIMA Research Foundation. Available online: https://www.cimafoundation.org/wp-content/uploads/2024/08/20240618_IPA_impaginazione_FIRE_completo.pdf (accessed on 12 April 2026).
  37. Çolak, E.; Sunar, F. The importance of ground-truth and crowdsourcing data for the statistical and spatial analyses of the NASA FIRMS active fires in the Mediterranean Turkish forests. Remote Sens. Appl. Soc. Environ. 2020, 19, 100327. [Google Scholar] [CrossRef] [Scilit]
  38. Leuenberger, M.; Parente, J.; Tonini, M.; Gonzalez Pereira, M.; Kanevski, M. Wildfire susceptibility mapping: Deterministic vs. stochastic approaches. Environ. Model. Softw. 2018, 101, 194–203. [Google Scholar] [CrossRef] [Scilit]
  39. UNISDR. 2009 UNISDR Terminology on Disaster Risk Reduction; United Nations International Strategy for Disaster Reduction: Geneva, Switzerland, 2009; Available online: https://www.undrr.org/publication/2009-unisdr-terminology-disaster-risk-reduction (accessed on 26 March 2026).
  40. Rodrigues, M.; Zúñiga-Antón, M.; Alcasena, F.; Gelabert, P.; Vega-Garcia, C. Integrating geospatial wildfire models to delineate landscape management zones and inform decision-making in Mediterranean areas. Saf. Sci. 2022, 147, 105616. [Google Scholar] [CrossRef] [Scilit]
  41. Chuvieco, E. Wildland Fire Danger Estimation and Mapping: The Role of Remote Sensing; World Scientific Publishing Co.: Singapore, 2003. [Google Scholar]
  42. Chuvieco, E.; Congalton, R.G. Application of remote sensing and geographic information systems to forest fire hazard mapping. Remote Sens. Environ. 1989, 29, 147–159. [Google Scholar] [CrossRef] [Scilit]
  43. Barredo, J.I. Sistemas de Informacion Geografica y Evaluacion Multicriterio en la Ordenacion del Territorio; Ra-Ma: Madrid, Spain, 1996. [Google Scholar]
  44. Vadrevu, K.P.; Eaturu, A.; Badarinath, K.V.S. Fire risk evaluation using multicriteria analysis—A case study. Environ. Monit. Assess. 2010, 166, 223–239. [Google Scholar] [PubMed]
  45. Vicente López, F.J.D.; Crespo Abril, F. A new wildland fire danger index for a Mediterranean region and some validation aspects. Int. J. Wildland Fire 2012, 21, 1030–1041. [Google Scholar] [CrossRef] [Scilit]
  46. Saaty, T.L. Multicriteria Decision Making: The Analytic Hierarchy Process; RWS Publications: Pittsburgh, PA, USA, 1990. [Google Scholar]
  47. Saaty, T.L.; Vargas, L.G. Models, Methods, Concepts and Applications of the Analytic Hierarchy Process; Kluwer Academic Publishers: Boston, MA, USA, 2000. [Google Scholar]
  48. UNISDR. Report of the Open-Ended Intergovernmental Expert Working Group on Indicators and Terminology Relating to Disaster Risk Reduction; United Nations: Geneva, Switzerland, 2016. [Google Scholar]
  49. Scott, J.H.; Burgan, R.E. Standard Fire Behavior Fuel Models: A Comprehensive Set for Use with Rothermel’s Surface Fire Spread Model; General Technical Report RMRS-GTR-153; USDA Forest Service, Rocky Mountain Research Station: Fort Collins, CO, USA, 2005.
  50. Lasaponara, R.; Lanorte, A. Remotely sensed characterization of forest fuel types by using satellite ASTER data. Int. J. Appl. Earth Obs. Geoinf. 2007, 9, 225–234. [Google Scholar] [CrossRef] [Scilit]
  51. Rodrigues, M.; de la Riva, J. An insight into machine-learning algorithms to model human-caused wildfire occurrence. Environ. Model. Softw. 2014, 57, 192–201. [Google Scholar] [CrossRef] [Scilit]
  52. Baines, P.G. Physical mechanisms for the propagation of surface fires. Math. Comput. Model. 1990, 13, 83–94. [Google Scholar] [CrossRef] [Scilit]
  53. Clarke, H.; Gibson, R.; Cirulis, B.; Bradstock, R.A.; Penman, T.D. Developing and testing models of the drivers of anthropogenic and lightning-caused wildfire ignitions in south-eastern Australia. J. Environ. Manag. 2019, 235, 34–41. [Google Scholar] [CrossRef] [Scilit] [PubMed]
  54. Gholamnia, K.; Gudiyangada Nachappa, T.; Ghorbanzadeh, O.; Blaschke, T. Comparisons of Diverse Machine Learning Approaches for Wildfire Susceptibility Mapping. Symmetry 2020, 12, 604. [Google Scholar] [CrossRef] [Scilit]
  55. ISPRA. Carta Della Natura. Available online: https://www.isprambiente.gov.it/it/servizi/sistema-carta-della-natura (accessed on 8 October 2025).
  56. OpenStreetMap Contributors. Available online: https://download.geofabrik.de/europe/italy.html (accessed on 1 May 2026).
  57. de Arruda, H.F.; Reia, S.M.; Ruan, S.; Atwal, K.S.; Kavak, H.; Anderson, T.; Pfoser, D. An OpenStreetMap derived building classification dataset for the United States. Sci. Data 2024, 11, 1210. [Google Scholar] [CrossRef] [Scilit] [PubMed]
  58. Rothermel, R.C. How to Predict the Spread and Intensity of Forest and Range Fires; General Technical Report INT-GTR-143; U.S. Department of Agriculture, Forest Service, Intermountain Forest and Range Experiment Station: Ogden, UT, USA, 1983. [CrossRef] [Scilit]
  59. Kushla, J.D.; Ripple, W.J. Assessing wildfire effects with Landsat thematic mapper data. Int. J. Remote Sens. 1998, 19, 2493–2507. [Google Scholar] [CrossRef] [Scilit]
  60. Papathoma-Köhle, M.; Schlögl, M.; Garlichs, C.; Diakakis, M.; Mavroulis, S.; Fuchs, S. A wildfire vulnerability index for buildings. Sci. Rep. 2022, 12, 6378. [Google Scholar] [CrossRef] [Scilit] [PubMed]
  61. Dimitrakopoulos, A.P.; Panov, P.I. Pyric properties of some dominant Mediterranean vegetation species. Int. J. Wildland Fire 2001, 10, 23–27. [Google Scholar] [CrossRef] [Scilit]
  62. Popović, Z.; Bojović, S.; Marković, M.; Cerdà, A. Tree species flammability based on plant traits: A synthesis. Sci. Total Environ. 2021, 800, 149625. [Google Scholar] [CrossRef] [Scilit] [PubMed]
  63. Aguirre, P.; León, J.; González-Mathiesen, C.; Román, R.; Penas, M.; Ogueda, A. Modelling the vulnerability of urban settings to wildland–urban interface fires in Chile. Nat. Hazards Earth Syst. Sci. 2024, 24, 1521–1537. [Google Scholar] [CrossRef] [Scilit]
  64. Zacharakis, I.; Tsihrintzis, V.A. Environmental Forest Fire Danger Rating Systems and Indices around the Globe: A Review. Land 2023, 12, 194. [Google Scholar] [CrossRef] [Scilit]
  65. Erzibengoa Calvo, J.; Gómez-Omella, M.; Goienetxea Urkizu, I. IberFire—A Detailed Creation of a Spatio-Temporal Dataset for Wildfire Risk Assessment in Spain. arXiv 2025, arXiv:2505.00837. [Google Scholar]
  66. Catry, F.X.; Rego, F.C.; Bação, F.L.; Moreira, F. Modeling and Mapping Wildfire Ignition Risk in Portugal. Int. J. Wildland Fire 2009, 18, 921–931. [Google Scholar] [CrossRef] [Scilit]
  67. Pallikarakis, A.; Konstantopoulou, F. Multi-Criteria Wildfire Risk Hazard Assessment in GIS Environment: Projection for the Future and Impact on RES Projects Installation Planning. J. Geosci. Environ. Prot. 2024, 12, 242–265. [Google Scholar] [CrossRef]
  68. Rivière, M.; Lenglet, J.; Noirault, A.; Pimont, F.; Dupuy, J.-L. Mapping Territorial Vulnerability to Wildfires: A Participative Multi-Criteria Analysis. For. Ecol. Manag. 2023, 539, 121014. [Google Scholar] [CrossRef] [Scilit]
  69. Oliveira, S.; Félix, F.; Nunes, A.; Lourenço, L.; Laneve, G.; Sebastián-López, A. Mapping Wildfire Vulnerability in Mediterranean Europe. Testing a Stepwise Approach for Operational Purposes. J. Environ. Manag. 2018, 206, 158–169. [Google Scholar] [CrossRef] [Scilit]
  70. Taneja, R.; Hilton, J.; Wallace, L.; Reinke, K.; Jones, S. Effect of fuel spatial resolution on predictive wildfire models. Int. J. Wildland Fire 2021, 30, 776–789. [Google Scholar] [CrossRef] [Scilit]
  71. Chuvieco, E.; Aguado, I.; Yebra, M.; Nieto, H.; Salas, J.; Martín, M.P.; Vilar, L.; Martínez, J.; Martín, S.; Ibarra, P.; et al. Development of a Framework for Fire Risk Assessment Using Remote Sensing and Geographic Information System Technologies. Ecol. Modell. 2010, 221, 46–58. [Google Scholar] [CrossRef] [Scilit]
  72. Sirca, C.; Salis, M.; Arca, B.; Duce, P.; Spano, D. Assessing the performance of fire danger indexes in a Mediterranean area. iForest 2018, 11, 563–571. [Google Scholar] [CrossRef] [Scilit]
  73. Laneve, G.; Pampanoni, V.; Uddien Shaik, R. The Daily Fire Hazard Index: A Fire Danger Rating Method for Mediterranean Areas. Remote Sens. 2020, 12, 2356. [Google Scholar] [CrossRef] [Scilit]
  74. Jaque Castillo, E.; Fernández, A.; Fuentes Robles, R.; Ojeda, C.G. Data-based wildfire risk model for Mediterranean ecosystems—Case study of the Concepción metropolitan area in central Chile. Nat. Hazards Earth Syst. Sci. 2021, 21, 3663–3678. [Google Scholar] [CrossRef] [Scilit]
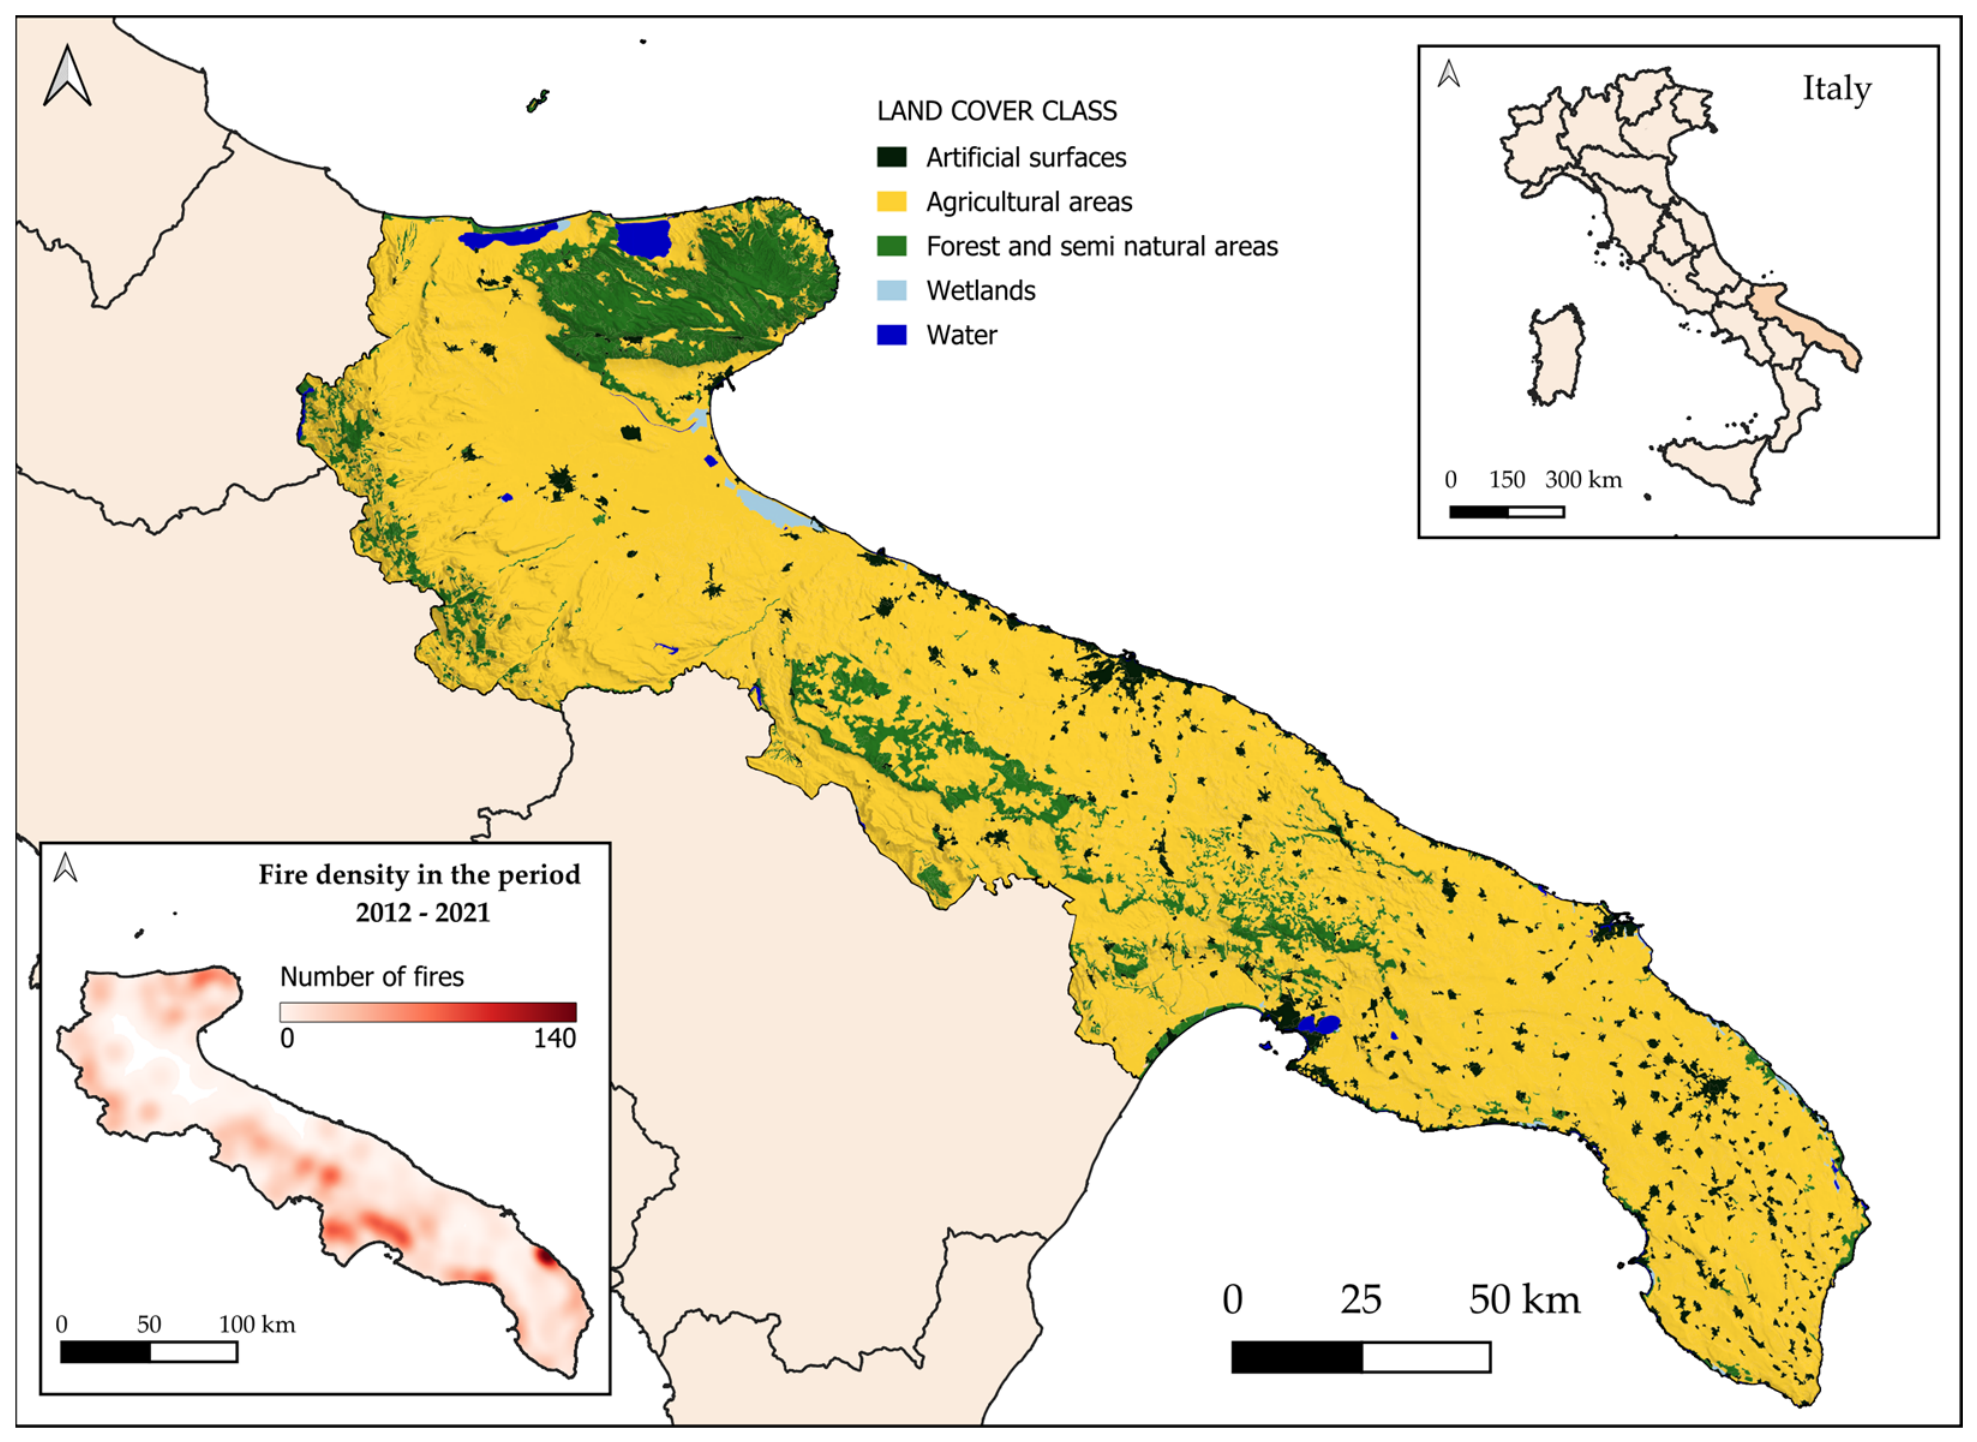
Figure 1. Location of the study area and a representation of land cover by broad category. The map also shows fire density for the period 2012–2021 to illustrate the distribution of this phenomenon within the Apulia region.
Geomatics 06 00079 g001
Figure 2. Workflow of the processed indices and subindices breaking it down into the sections related to the calculation of hazard, vulnerability, and risk.
Geomatics 06 00079 g002
Figure 3. Climate variables maps used to calculate the CHi. Relative humidity values are expressed in %, precipitation values in mm, and maximum temperature in °C.
Geomatics 06 00079 g003
Figure 4. Maps of anthropogenic variables used to calculate the AHi.
Geomatics 06 00079 g004
Figure 5. Slope and aspect maps used to calculate MHi.
Geomatics 06 00079 g005
Figure 6. Maps of calculated hazard subindices.
Geomatics 06 00079 g006
Figure 7. Long-Term Danger Index map.
Geomatics 06 00079 g007
Figure 8. Elaboration of the Specific Vulnerability Index (SVi) map.
Geomatics 06 00079 g008
Figure 9. Fire-Affected Area Index (FAi) mapping.
Geomatics 06 00079 g009
Figure 10. Fire Characteristics Index (FCi) map.
Geomatics 06 00079 g010
Figure 11. RVi map and its sub-indices.
Geomatics 06 00079 g011
Figure 12. Wildfire Vulnerability Index (WVi) map.
Geomatics 06 00079 g012
Figure 13. Interface Vulnerability Index (IVi). Two zoomed-in views are provided to better appreciate the map’s features, as the interface areas are so large (50 m buffers) that they are not very visible on a regional-scale map.
Geomatics 06 00079 g013
Figure 14. Fire Vulnerability Index (FVi) map.
Geomatics 06 00079 g014
Figure 15. Wildfire Risk Index (WfRi) and Interface Fire Risk Index (IFRi) maps. Two zoom levels are provided to better appreciate the characteristics of the maps, as the interface areas are so large (50 m buffer) that they are not very visible on a regional-scale map.
Geomatics 06 00079 g015
Figure 16. Fire Risk Global Index (FRGi) map.
Geomatics 06 00079 g016
Figure 17. Two screenshots of the Fire Risk Global Indices (FRGi) for two areas in the Apulia region, showing the resolution.
Geomatics 06 00079 g017
Table 1. Rating of VHi values based on the linear flame intensity (KW/m) of each fuel model.
Fuel ModelLinear Flame IntensityVHi Value
13500 KW/m 0.035
2 8000 KW/m 0.08
3 100,000 KW/m 1
4 40,000 KW/m 0.4
5 30,000 KW/m 0.3
6 60,000 KW/m 0.6
7 12,500 KW/m 0.7
8 400 KW/m 0.004
9 480 KW/m 0.0048
Table 2. Resistance and Resilience Scores for each forest type.
Forest TypeResistance ScoreResilience Score
Artificial poplar plantations 4 4
Other broadleaved plantations 2 4
Conifer plantations 2 2
Sessile oak, downy oak and pedunculate oak forests 2 4
Turkey oak, Hungarian oak, Macedonian oak and Valonia oak forests 3 4
Hop-hornbeam and hornbeam forests 3 3
Chestnut forests 4 4
Beech forests 4 3
Hygrophilous forests 4 2
Other deciduous broad-leaved forests 3 3
Holm oak forests 3 4
Cork oak forests 5 4
Mediterranean pine forests 2 4
Black pine, Corsican pine and Bosnian pine forests 2 4
Other conifer forests 2 4
Wooded pastures 1 4
Natural grasslands, meadows and uncultivated land 1 5
Temperate climate shrublands 3 4
Maquis and Mediterranean shrublands 3 4
Other evergreen broad-leaved forests 3 4
Table 3. Index of the economic score assigned to each forest type. A score of 5 represents greater economic value.
Forest TypeEconomic Score
Artificial poplar plantations 2
Other broadleaved plantations 2
Conifer plantations 2
Sessile oak, downy oak, and pedunculate oak forests 5
Turkey oak, Hungarian oak, Macedonian oak and Valonia oak forests 5
Hop-hornbeam and hornbeam forests 4
Chestnut forests 3
Beech forests 3
Hygrophilous forests 2
Other deciduous broad-leaved forests 3
Holm oak forests 4
Cork oak forests 2
Mediterranean pine forests 4
Black pine, Corsican pine and Bosnian pine forests 3
Other conifer forests 3
Wooded pastures 3
Natural grasslands, meadows and uncultivated land 2
Temperate climate shrublands 3
Maquis and Mediterranean shrublands 3
Other evergreen broad-leaved forests 4
Table 4. Area (in hectares and as a percentage) for each risk class.
Ha%
Low 1,703,05788.00
Medium 177,057.69.15
High 47,111.22.43
Very High 7962.520.41
Tot 1,935,188100
Table 5. Area (in hectares and as a percentage) burned during the 2022–2024 period for each risk class.
Ha %
Low 9262.32 53.62
Medium 6242.48 36.14
High 1569.96 9.09
Very High 198.88 1.15
Total17,273.64 100
Disclaimer/Publisher’s Note: The statements, opinions and data contained in all publications are solely those of the individual author(s) and contributor(s) and not of MDPI and/or the editor(s). MDPI and/or the editor(s) disclaim responsibility for any injury to people or property resulting from any ideas, methods, instructions or products referred to in the content.