Review

Artificial Intelligence and Total Electron Content in Earthquake-Related Seismo-Ionospheric Analysis: A Mapping Review


1
Facultad de Ingeniería y Arquitectura, Escuela Profesional de Ingeniería de Sistemas, Universidad Autónoma del Perú, Lima 15842, Peru
2
Facultad de Ingeniería, Universidad Tecnológica del Perú, Lima 150101, Peru
3
Escuela de Posgrado, Universidad Continental, Lima 15113, Peru
4
Departamento Académico de Cursos Básicos, Universidad Científica del Sur, Lima 15067, Peru
*
Author to whom correspondence should be addressed.
Geomatics 2026, 6(4), 74; https://doi.org/10.3390/geomatics6040074
Submission received: 15 May 2026 / Revised: 23 June 2026 / Accepted: 29 June 2026 / Published: 3 July 2026

Abstract

Artificial intelligence is increasingly applied to earthquake-related seismo-ionospheric analysis with total electron content (TEC), but whether this literature is converging methodologically remains unresolved. We conducted a mapping review of 56 English-language journal articles retrieved from Scopus and Web of Science to characterize how artificial intelligence and computational intelligence methods are used with TEC in seismo-ionospheric and multi-precursor frameworks. The corpus shows recent growth in scientific production, strong concentration in a limited set of countries, institutions, and journals, and a stable conceptual backbone centered on earthquake, ionosphere, TEC, GPS-TEC, precursors, prediction-related terminology, anomaly detection, machine learning, and deep learning. However, full-text synthesis of the included studies shows that this thematic coherence coexists with substantial methodological divergence. We identified a transition from classical TEC anomaly detection toward AI-assisted decision systems, including models that forecast expected TEC behavior, flag candidate anomalies, classify precursor-like or disturbance-related states, and support monitoring-oriented outputs. We also identified a distinct operational strand focused on near-real-time detection of coseismic and tsunami-related ionospheric disturbances rather than deterministic earthquake prediction. Across these formulations, anomaly definitions, TEC representations, confounder control, baselines, uncertainty handling, and validation strategies remain pipeline-dependent, which limits cumulative comparability and physical interpretability across studies. These findings indicate that the field is thematically focused but not yet methodologically unified. Future progress will depend less on adding isolated case studies and more on clearer anomaly criteria, stronger control of solar and geomagnetic effects, explicit baselines, event-wise and region-wise validation, systematic false-alarm reporting, uncertainty-aware outputs, and transparent documentation of preprocessing and modeling decisions.

1. Introduction

Total electron content (TEC) is an ionospheric observable derived from Global Navigation Satellite Systems (GNSS). It is commonly represented as time series and spatial products, including vertical and slant TEC as well as gridded global ionospheric maps used for regional and event-centered analysis [1,2,3,4]. In the literature, TEC is produced through heterogeneous measurement and processing chains, spanning global products, regional receiver networks, station subsets, spaceborne GNSS receiver measurements, and near-real-time slant TEC streams [1,2,4,5,6,7]. This diversity supports both retrospective assessment and monitoring scenarios [2,6,7,8]. Other ionospheric sounding techniques, including low-frequency spaceborne polarimetric SAR and Faraday rotation retrieval, may provide complementary high-resolution information on ionospheric propagation effects [9,10].
Earthquakes motivate this line of work because ionospheric disturbances have been reported in TEC for major seismic events when measurement geometry and data quality are suitable [11,12,13,14,15,16]. Accordingly, TEC is often treated as a candidate signal within seismic monitoring workflows, ranging from event-centered analyses that examine precursor-like behavior to pipelines designed to identify post-event ionospheric disturbances with short latency [13,17].
The proposed relationship between earthquakes and TEC is commonly framed through seismo-ionospheric and lithosphere–atmosphere–ionosphere coupling (LAIC) frameworks [16,18]. Within these narratives, pre-earthquake processes are discussed as plausible drivers of localized ionospheric perturbations, whereas coseismic disturbances are attributed to upward-propagating waves that modify ionospheric electron content [11,12,14,15,16,18]. Since TEC variability is also strongly influenced by nonseismic forcing, many studies prioritize confounder control to preserve physical interpretability [13]. Typical choices include quiet-condition screening and checks based on geomagnetic and solar indices and, in some cases, external-station controls or geometry-based filters [13,19].
Artificial intelligence has been used to operationalize these hypotheses by enabling data-driven detection of atypical TEC behavior and, in some cases, supervised discrimination between earthquake-related and non-event conditions [19,20,21,22,23]. Reported approaches include support vector machine classifiers, prediction-based anomaly detection using regressors and multilayer perceptrons, and deep learning models centered on sequential neural architectures [19,20,21,23,24]. Across these studies, task formulations span anomaly detection, binary classification, and near-real-time disturbance flagging [17,19,20,21,22,23,24].
Several reviews synthesize parts of this landscape from different perspectives. A broader remote sensing review approaches earthquake research as a multi-signal problem and describes how satellite observations have been used to examine deformation, thermal behavior, gas and aerosol variability, and ionospheric electromagnetic disturbances, while also emphasizing limitations related to resolution, sensitivity, and data availability [25]. Within the ionospheric domain, reviews of GNSS ionospheric seismology and natural hazard-generated traveling ionospheric disturbances show that earthquakes and tsunamis can produce acoustic and gravity waves that propagate upward and perturb ionospheric electron density, making these disturbances observable in GNSS-derived TEC under suitable geometric and measurement conditions [16,26]. In parallel, a precursor-oriented review interprets ionospheric anomalies during earthquake preparation through the Global Electric Circuit framework and discusses electromagnetic coupling as a conceptual basis for persistent pre-earthquake ionospheric variability [27]. A review focused specifically on TEC-based precursor studies further emphasizes that candidate TEC anomalies may be obscured or mimicked by solar and geomagnetic forcing, which motivates quiet-condition screening, interpretive checks based on standard indices, and locality-based arguments when attributing anomalies to earthquakes [28].
Adjacent surveys also document data-driven methods relevant to TEC processing without organizing their synthesis around earthquake-related discrimination. A deep learning review on ionospheric modeling and prediction summarizes neural approaches for TEC forecasting and related map-based products, emphasizing performance gains of data-driven models in ionospheric prediction tasks [29]. A GNSS machine learning survey focuses on positioning and signal-related use cases, including anomaly detection and prediction within GNSS applications, but it is organized around GNSS performance rather than seismo-ionospheric inference [30]. At the application level, a machine learning case study demonstrates supervised detection of TEC signatures in a combined earthquake and tsunami scenario using GNSS-derived time series and discusses integration into an early warning context [31]. Complementarily, a satellite-data earthquake prediction review synthesizes advances and challenges and states that reliable, low-uncertainty public earthquake prediction has not yet been achieved, while documenting ongoing work on anomaly detection and multi-parameter fusion [32].
These contributions indicate that the evidence base relevant to artificial intelligence with TEC for earthquakes remains distributed across partially disconnected strands. Remote sensing reviews situate ionospheric disturbances as one component among multiple satellite-observable phenomena [25]. Ionospheric seismology and natural hazard disturbance reviews primarily systematize coseismic and postseismic signatures and their wave-driven coupling interpretations [16,26]. Seismo-ionospheric precursor reviews emphasize physical plausibility and coupling narratives, with attention to background variability and electromagnetic pathways [27,28]. Machine learning and deep learning surveys consolidate methods for GNSS and TEC prediction, but they do not provide a structured synthesis of how artificial intelligence is used to support earthquake-related inference from TEC, aligning anomaly definitions, confounder handling, and validation logic across studies [29,30].
A focused synthesis is therefore needed because the literature varies in operational definitions of TEC anomalies, in the construction of positive and negative evidence under different task formulations, in handling solar and geomagnetic influences, and in evaluation logic for inference beyond event-centered contexts [16,26,27,28]. This heterogeneity means that similar claims can rely on different experimental choices, leaving key questions only partly consolidated. These questions concern not only the conceptual and methodological structure of the field, but also how individual studies implement anomaly criteria, apply screening and controls to support physical interpretability, and validate AI-based TEC analyses for potential transfer toward monitoring settings rather than retrospective demonstration [26,28,31].
Accordingly, this manuscript conducts a two-part review of artificial intelligence-based earthquake-related studies in which TEC, including GNSS-derived TEC, is used as an operational variable within seismo-ionospheric or multi-precursor analytical frameworks. First, a bibliometric analysis is used to characterize the structure and evolution of the field, including annual production, country-level contribution, international collaboration, institutional affiliations, relevant sources, and keyword-based thematic patterns. Second, a systematic mapping of the final corpus is conducted to examine how the eligible studies operationalize TEC, define earthquake-related ionospheric anomalies, incorporate artificial intelligence methods, control for nonseismic influences, design validation strategies, and report evidence relevant to generalization, operational utility, and reproducibility.
The remainder of this manuscript is organized as follows. Section 2 details the review design, data sources, search strategy, eligibility criteria, bibliometric procedures, and systematic mapping workflow. Section 3 reports the bibliometric results and the article-level mapping findings, including scientific production patterns, country and institutional contributions, source structures, keyword-based science mapping, and the structured synthesis of the final corpus. Section 4 discusses the implications of the mapped evidence base for methodological comparability, physical interpretability, validation practice, and future research on artificial intelligence with TEC for seismo-ionospheric analysis.

2. Methodology

2.1. Review Design, Scope, and Reporting Framework

We conducted a two-part mapping review of artificial intelligence-based earthquake-related studies in which TEC was used as an operational variable within seismo-ionospheric or multi-precursor analytical frameworks. The first part consisted of a bibliometric analysis aimed at characterizing the scientific structure of the field. The second part consisted of a systematic mapping of the final corpus through full-text methodological extraction.
This review should be interpreted as an evidence-mapping synthesis rather than as a formal quality appraisal or meta-analysis. Its purpose is to characterize how AI-based TEC studies are distributed, designed, validated, and interpreted across the literature. Accordingly, statements about methodological limitations, validation gaps, reproducibility, and operational readiness are made at the corpus level and refer to reported design features, not to formal study-level risk-of-bias scores. The review therefore identifies whether key methodological elements are present, absent, heterogeneous, or insufficiently reported, but it does not rank individual studies, estimate pooled performance, or establish the diagnostic accuracy of TEC-based AI models for deterministic earthquake prediction.
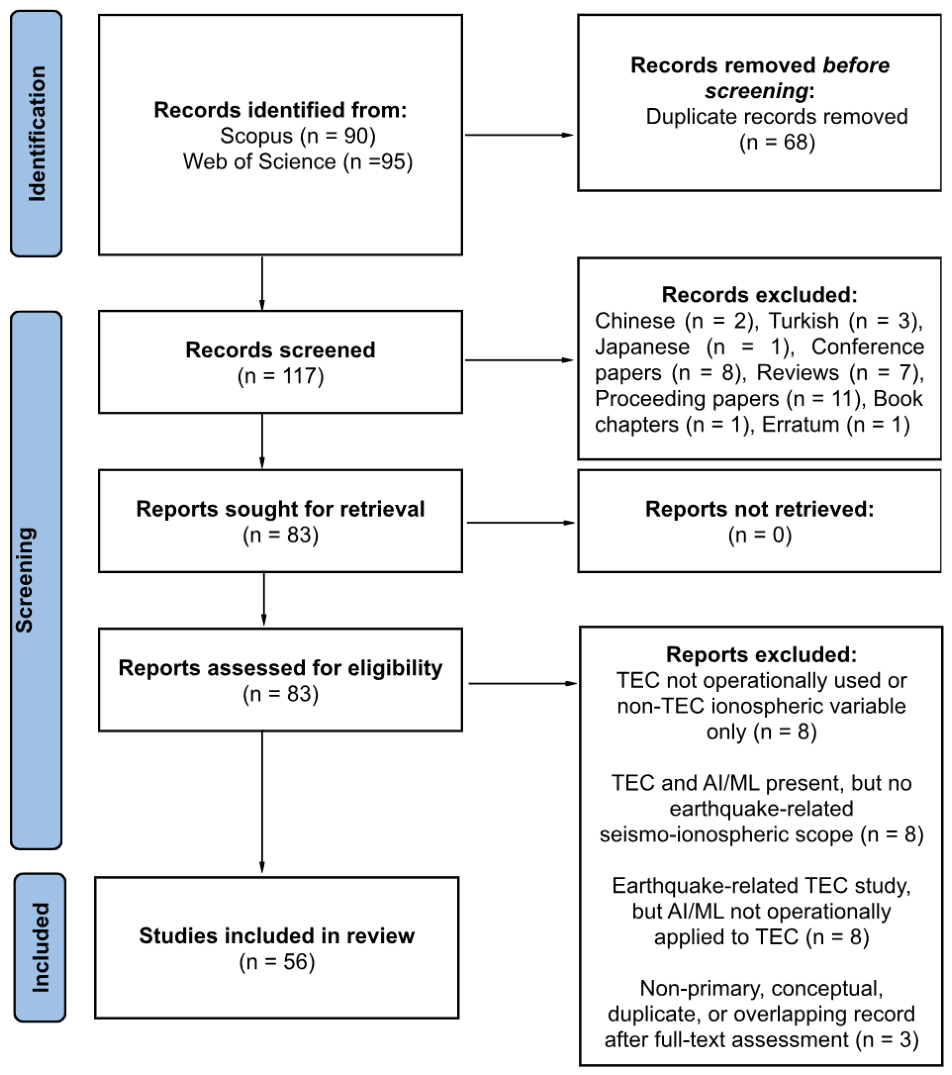
Throughout the manuscript, we distinguish pre-seismic TEC anomaly detection, candidate precursor identification, TEC forecasting, and earthquake-related classification from deterministic operational earthquake prediction. To ensure transparency and traceability, we documented study identification, screening, eligibility assessment, and inclusion using a flow diagram, as summarized in Figure 1. The minimally processed dataset supporting the bibliometric and mapping analyses is provided as Supplementary File S1. A supplementary review protocol and descriptive data-extraction matrix with study-level methodological feature fields are provided as Supplementary File S2 to improve transparency and auditability of the mapping workflow. This review was not registered in a public registry; therefore, Supplementary File S2 should be interpreted as a transparency document for the final review workflow rather than as a preregistered protocol.

2.2. Data Sources and Search Strategy

We retrieved records from Scopus and Web of Science on 30 April 2026. No restrictions were imposed on the publication year to cover the total temporal evolution in the databases. In Scopus, the search targeted the Title, Abstract, and Keywords fields, while in Web of Science, the query was applied to the Topic field.
The search equation comprised the following Boolean groups. G1 to G3 defined the TEC signal, seismic domain, and artificial intelligence dimensions, while G4 identified noise terms for exclusion:
  • G1: TEC signal
    (TEC OR “total electron content” OR STEC OR “slant TEC” OR VTEC OR “vertical TEC” OR “GNSS-TEC” OR “GPS-TEC” OR “TEC anomaly” OR “GNSS TEC” OR “GPS TEC” OR “ionospheric TEC” OR “TEC variation*” OR “TEC perturbations”)
  • G2: Seismic domain
    (earthquake* OR “earthquake monitoring” OR “earthquake precursor*” OR “earthquake prediction” OR “earthquake forecasting” OR seismogenic OR “earthquake-related” OR preseismic OR “pre-seismic” OR coseismic OR “co-seismic” OR postseismic OR “post-seismic” OR “seismo-ionospheric” OR seismoionospheric OR “seismo-ionospheric coupling” OR seismic* OR seismology OR “seismic event*”)
  • G3: Artificial intelligence
    (“artificial intelligence” OR “machine learning” OR “deep learning” OR “neural network*” OR “artificial neural network*” OR ANN OR “convolutional neural network*” OR CNN OR “recurrent neural network*” OR RNN OR LSTM OR GRU OR “gated recurrent unit*” OR “graph neural network*” OR GNN OR “support vector machine*” OR SVM OR “one-class SVM” OR “random forest*” OR “gradient boosting” OR XGBoost OR LightGBM OR CatBoost OR “autoencoder*” OR “variational autoencoder*” OR VAE OR “generative adversarial network*” OR GAN* OR K-NN OR “Artificial Bee Colony” OR “Firefly Algorithm”)
  • G4: Noise
    (“TEC-2007/TBEC-2018” OR “Turkish Earthquake Code” OR “Sichuan-Tibet Engineering Corridor” OR TBEC OR “TBEC-2018” OR “TBEC 2018” OR “Sichuan-Tibet Engineering Corridor” OR “Turkish Earthquake Codes” OR “TEC - 98” OR “tec-tonically”)
The final Boolean expression required simultaneous inclusion of the three scope dimensions and exclusion of noise terms: G1 AND G2 AND G3 AND NOT G4. The four-block framework was used to retrieve records at the intersection of TEC, seismic phenomena, and artificial intelligence while reducing known sources of noise. Final topical eligibility was not determined solely by the search equation, but rather by a full-text assessment according to the inclusion and exclusion criteria described below.

2.3. Screening and Eligibility Criteria

The updated search identified 185 records, including 90 records from Scopus and 95 records from Web of Science. The Scopus results were exported as a CSV file, whereas the Web of Science results were exported as a BibTeX file. After merging both datasets, 68 duplicate records were removed using Bibliometrix, leaving 117 unique records for screening. During the screening stage, 34 records were excluded because they did not meet the predefined language or document-type criteria. Specifically, six records were excluded due to language restrictions: Chinese (n = 2), Turkish (n = 3), and Japanese (n = 1). In addition, 28 records were excluded due to document type: conference papers (n = 8), reviews (n = 7), proceeding papers (n = 11), book chapters (n = 1), and erratum (n = 1).
After this screening process, 83 reports were sought for retrieval, and all were successfully obtained. These 83 full-text reports were then assessed for eligibility according to the inclusion and exclusion criteria of the review. At this stage, 27 reports were excluded because they did not meet the substantive scope of the review. In Figure 1, these full-text exclusions are disaggregated into four eligibility-based categories: TEC not operationally used or non-TEC ionospheric variable only; TEC and AI/ML present, but no earthquake-related seismo-ionospheric scope; earthquake-related TEC study, but AI/ML not operationally applied to TEC; and non-primary, conceptual, duplicate, or overlapping records after full-text assessment. Consequently, the final corpus comprised 56 studies included in the review.

2.3.1. Inclusion Criteria

We included records if they met all of the following conditions:
  • Language: The record was written in English.
  • Document type: The record was a journal article presenting original empirical, observational, computational, or methodological results.
  • Earthquake-related scope: The study explicitly addressed earthquakes, earthquake precursors, preseismic anomalies, coseismic disturbances, postseismic disturbances, tsunami-related ionospheric perturbations, or lithosphere–atmosphere–ionosphere coupling processes associated with seismic events.
  • Operational use of TEC: Total Electron Content was used as an operational variable in the analysis. This included GPS-TEC, GNSS-TEC, GIM-TEC, VTEC, STEC, dTEC, TEC maps, TEC images, TEC-derived indicators, or TEC time series.
  • Artificial intelligence component: The study applied artificial intelligence, machine learning, deep learning, or computational intelligence methods, such as artificial neural networks, NARX networks, long short-term memory networks, support vector machines, random forests, Gaussian process regression, regression trees, convolutional neural networks, hybrid learning models, ant colony optimization, particle swarm optimization, or comparable data-driven approaches.
  • Analytical link between AI and TEC: The artificial intelligence or machine learning method was applied directly to TEC data, or to a multiparameter analytical model in which TEC was included as an input variable, output variable, target variable, predictor, anomaly indicator, or model-derived feature within the earthquake-related analysis. Studies in which TEC was used only for secondary comparison, contextual interpretation, or post hoc corroboration were not considered to meet this criterion.
  • Extractable information: The study reported sufficient methodological information to extract, at minimum, the type of TEC used, the TEC data source, the seismic event or study region, the artificial intelligence or machine learning method, the analytical task, and the main earthquake-related finding.

2.3.2. Exclusion Criteria

We excluded records if they met any of the following conditions:
  • Language: The record was not written in English.
  • Document type: The record was indexed or presented as a conference paper, proceeding paper, review, book chapter, editorial, commentary, perspective article, erratum, or non-primary research contribution.
  • No operational use of TEC: Studies were excluded when TEC was only mentioned in the introduction, background, or discussion, but was not used as a dataset, variable, indicator, map, image, time series, model input, model output, or anomaly measure. This criterion applied to studies focused on atmospheric, thermal, or surface variables such as land surface temperature, outgoing longwave radiation, relative humidity, air temperature, air pressure, aerosols, ozone, or chlorophyll without operational TEC analysis [33,34,35,36,37,38,39].
  • Use of non-TEC ionospheric parameters only: Studies were excluded when they investigated ionospheric variables other than TEC, such as foF2, NmF2, electron density, electron temperature, VLF/LF propagation, ULF/ELF signals, or electric field perturbations, without operational use of TEC in the analysis [40].
  • TEC and AI without an earthquake-related component: Studies were excluded when they used TEC and artificial intelligence or machine learning methods, but focused on general ionospheric forecasting, GNSS correction, space weather, geomagnetic storms, solar activity, or non-seismic ionospheric variability rather than earthquake-related seismo-ionospheric analysis [41,42,43,44,45,46,47].
  • TEC prediction without seismo-ionospheric anomaly analysis: Studies were excluded when they predicted GPS-TEC or IONOLAB-TEC using regression or machine learning models, but did not operationally analyze TEC anomalies as earthquake-related, preseismic, coseismic, or postseismic disturbances [48].
  • Earthquake-related TEC studies without AI/ML/DL: Studies were excluded when they analyzed TEC in relation to earthquakes but relied only on conventional statistical, signal-processing, or deterministic techniques, such as interquartile range analysis, standard deviation thresholds, ARIMA, wavelet analysis, Hotelling’s T 2 test, median-based anomaly detection, or visual interpretation, without applying artificial intelligence, machine learning, or deep learning to TEC [49,50,51,52].
  • AI applied to non-TEC variables: Studies were excluded from the main synthesis when TEC was used only as a complementary or corroborative precursor, while the artificial intelligence, machine learning, or computational intelligence method was applied primarily to another variable, such as aerosol optical depth, precipitable water vapor, land surface temperature, or VLF/LF propagation [53,54,55,56].
  • Non-primary studies indexed as articles: Records were excluded when full-text assessment showed that, despite being indexed as journal articles, they were reviews, conceptual papers, or methodological discussions rather than primary AI-based TEC studies [32,57].
  • Duplicate or overlapping publications: Records were excluded when they reported the same study, event, method, and findings as another included article; in these cases, only the most complete version was retained [58].
Several borderline studies were excluded from the 56-study corpus despite their close relationship with the topic of this review. These records addressed TEC modeling, multiparameter LAIC processes, or AI-based analysis of earthquake-related precursors, but they did not fully meet the core inclusion requirement: AI/ML/DL applied operationally to TEC within an earthquake-related seismo-ionospheric framework. In some cases, TEC was used only as a complementary variable while AI was applied to aerosol optical depth, precipitable water vapor, land surface temperature, or VLF/LF propagation [53,54,55,56]; in others, the study focused on TEC prediction without earthquake-related anomaly interpretation [48], or used conventional wavelet–ARIMA methods rather than AI/ML/DL [50]. Therefore, these studies were not included in the primary corpus, the bibliometric analysis, or the systematic mapping, although they may be cited as contextual evidence when discussing adjacent methodological approaches.

2.4. Data Extraction, Coding Scheme, and Analysis Workflow

We analyzed the final eligible corpus in two complementary stages. First, we conducted a bibliometric analysis using the curated bibliographic metadata of the 56 included studies. Second, we performed a systematic mapping based on full-text extraction to characterize how each study operationalized TEC, artificial intelligence methods, anomaly definitions, confounder controls, validation procedures, and earthquake-related interpretation.
Bibliometric processing was performed in RStudio (version 2026.04.0+526) using Bibliometrix and its graphical interface, Biblioshiny (version 5.3.0). The bibliographic metadata included authors, affiliations, sources, publication year, abstracts, keywords, and citation information. These fields were used to quantify annual scientific production, country-level contribution, international collaboration, institutional affiliations, relevant sources, and keyword-based thematic patterns. Country production was calculated from country occurrences in author affiliations using full counting. Therefore, the reported frequencies represent affiliation-country occurrences rather than unique articles per country. During country-name standardization, Taiwan was harmonized under China. This harmonization was applied only to country-level bibliometric production and collaboration indicators; institutional names and affiliation-level labels were preserved when reporting the most relevant affiliations.
For the systematic mapping component, we extracted methodological and analytical information from the full text of each included study. The coding scheme covered the study purpose, earthquake-related phenomenon, role of TEC, type of TEC, TEC data source, temporal and spatial resolution when available, seismic event or study region, number and magnitude of events, artificial intelligence or machine learning method, task formulation, input and output variables, anomaly definition, reference window, geomagnetic and solar controls, validation strategy, evaluation metrics, baseline comparisons, false-alarm considerations, model interpretability or XAI reporting, and reported limitations. For included studies that used TEC maps, gridded TEC products, TEC images, or spatially reconstructed ionospheric fields, we also recorded whether spatial mapping, gridding, interpolation, or reconstruction steps were reported, including approaches such as nearest-neighbor or natural-neighbor interpolation, spline interpolation, inverse-distance weighting, Kriging, tomographic reconstruction, or neural-network-assisted spatial reconstruction. This extraction allowed the bibliometric structure of the field to be interpreted alongside the methodological content of the eligible studies.
To make these methodological features auditable at the study level, the descriptive extraction matrix provided in Supplementary File S2 includes specific fields indicating whether each included study reported geomagnetic screening or control, solar indices, external control stations or regions, baseline or model comparisons, false-alarm analysis, independent validation or non-event evaluation, and uncertainty estimation or predictive bounds. These fields were used as descriptive mapping variables and should not be interpreted as formal quality scores or risk-of-bias ratings.
Finally, science mapping analyses were conducted in Bibliometrix using indexed keywords, incorporating both Author Keywords and Keywords Plus. These analyses included a word cloud, a keyword co-occurrence network, and a thematic map. The co-occurrence network was generated in Biblioshiny using association normalization, the Louvain clustering algorithm, and an automatic layout. Visualization and sparsification settings were fixed before interpretation, using a repulsion force of 0.5 and a minimum edge threshold of 2. This approach was used to reduce post hoc adjustment and to ensure that the semantic structure of the field was derived from consistent analytical settings.

3. Results

3.1. Overview of the Included Corpus

The final corpus comprised 56 studies that operationally combined TEC-related information with artificial intelligence, machine learning, deep learning, or computational intelligence methods within earthquake-related seismo-ionospheric or multi-precursor frameworks. Table 1 groups these studies according to AI methodology family and main application scenario. This grouped synthesis summarizes the methodological orientation of each subset of studies, the principal analytical task, and the corresponding application context. The table shows that the corpus is not methodologically homogeneous, but is organized around several recurring analytical purposes: TEC anomaly detection, TEC forecasting, precursor classification, multi-parameter precursor integration, spatial or spatiotemporal anomaly recognition, and near-real-time detection of coseismic or tsunami-induced ionospheric disturbances.
Overall, the corpus indicates a field that has expanded from event-centered anomaly detection using classical intelligent methods toward more diverse AI-based formulations, including recurrent forecasting models, convolutional architectures, graph-based approaches, ensemble classifiers, optimization algorithms, semi-supervised anomaly detection, hybrid multi-method procedures, and real-time disturbance identification. At the same time, the grouped structure also highlights important differences in earthquake-related focus, ranging from preseismic candidate precursor detection to coseismic disturbance monitoring and multi-parameter LAIC-oriented analyses. This methodological overview provides the empirical basis for interpreting the broader bibliometric structure of the field, which is examined in the next subsection.

3.2. Bibliometric Profile of the Field

3.2.1. Annual Scientific Production

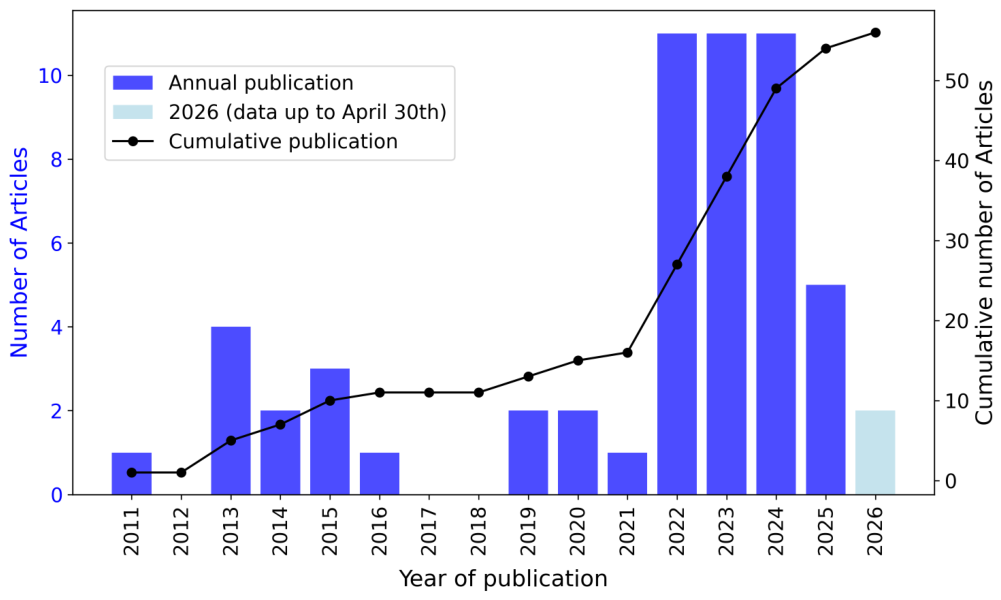
Figure 2 presents the annual and cumulative publication counts for the final corpus (n = 56) across 2011–2026. The annual series shows a sparse and intermittent early phase. The corpus begins with 1 article in 2011, followed by no records in 2012. A local increase is observed in 2013, with 4 articles, after which production remained limited, with 2 articles in 2014, 3 in 2015, and 1 in 2016. No records were identified in 2017 or 2018.
After 2018, annual production became more regular but remained modest between 2019 and 2021, with 2 articles in 2019, 2 in 2020, and 1 in 2021. A marked expansion is observed from 2022 onward, when annual output increased to 11 articles. This level was sustained in both 2023 and 2024, with 11 articles in each year, indicating the main period of consolidation of the field. Production then decreased to 5 articles in 2025, while 2026 includes 2 records up to 30 April 2026, as indicated in Figure 2.
Overall, the temporal profile suggests that AI-based TEC research in earthquake-related seismo-ionospheric analysis remained marginal and episodic during the first decade of the series, but expanded substantially after 2021. This recent growth motivates a closer examination of where this production is concentrated and how cross-country linkages shape the corpus, which is addressed next in Section 3.2.2.

3.2.2. Geographic Distribution and International Collaboration

Contributions by Countries
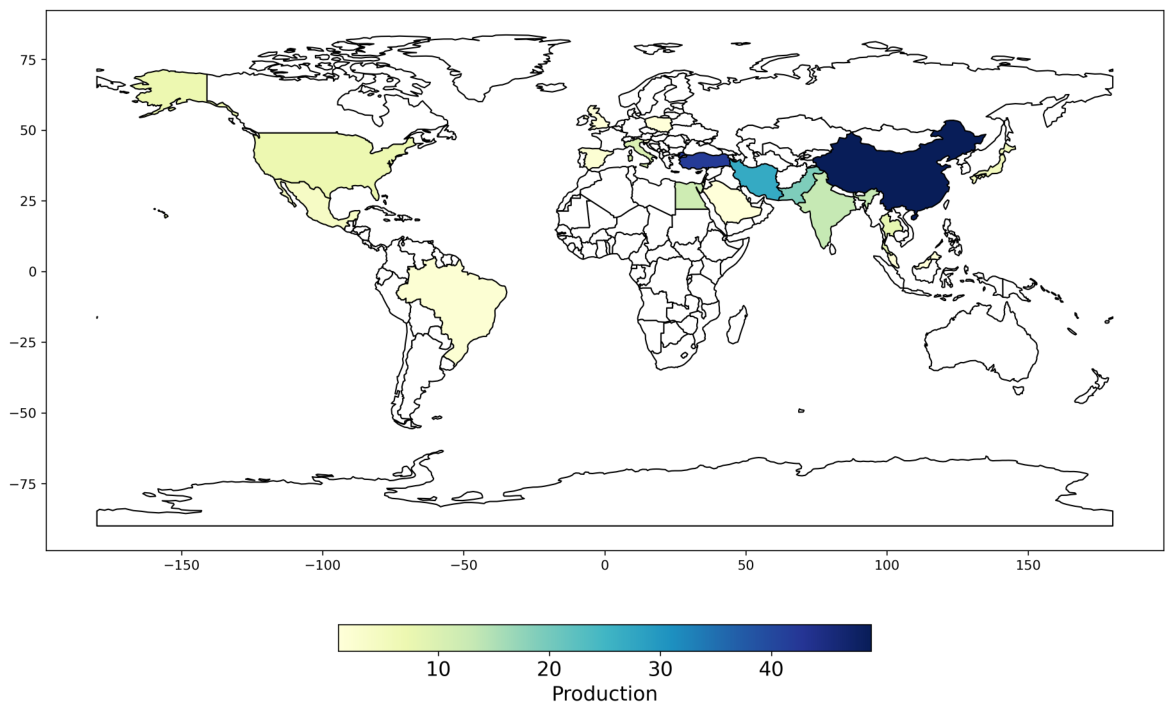
Figure 3 reports the geographical distribution of scientific production estimated using author-affiliation full counting, following the procedure described in Section 2.4. Country production was calculated from country occurrences in author affiliations. Therefore, frequencies represent affiliation-country occurrences rather than unique articles per country. During country-name standardization, Taiwan was harmonized under China. Under this counting approach, each country represented in the author affiliations receives one contribution; therefore, the total number of country-level contributions exceeds the number of articles in the final corpus. Overall, contributions were identified from 21 countries, with a clearly concentrated pattern and a strong predominance of Asian countries.
China shows the highest number of contributions (49), followed closely by Turkey (42). Iran (27) and Pakistan (19) form a second high-contribution group, while India (13), Egypt (12), Israel (10), Italy (10), and Thailand (8) represent an intermediate tier. The United States (7), Japan (5), and Mexico (4) also appear as recurrent contributors, although at lower levels. The remaining countries show more limited participation, including Brazil (2), Spain (2), United Arab Emirates (2), Malaysia (1), Poland (1), Saudi Arabia (1), Singapore (1), Slovenia (1), and the United Kingdom (1).
This distribution indicates that the field is geographically broad but unevenly developed. Most contributions are concentrated in a limited group of countries, particularly China, Turkey, Iran, Pakistan, and India, suggesting that research on AI-based TEC analysis for earthquake-related applications has been especially active in regions with strong seismic exposure, established GNSS or ionospheric research capacity, or both. At the same time, the presence of countries from Europe, North America, South America, Africa, and Southeast Asia indicates that the topic has acquired an international scope, although with markedly asymmetric levels of participation.
Country Collaboration Network
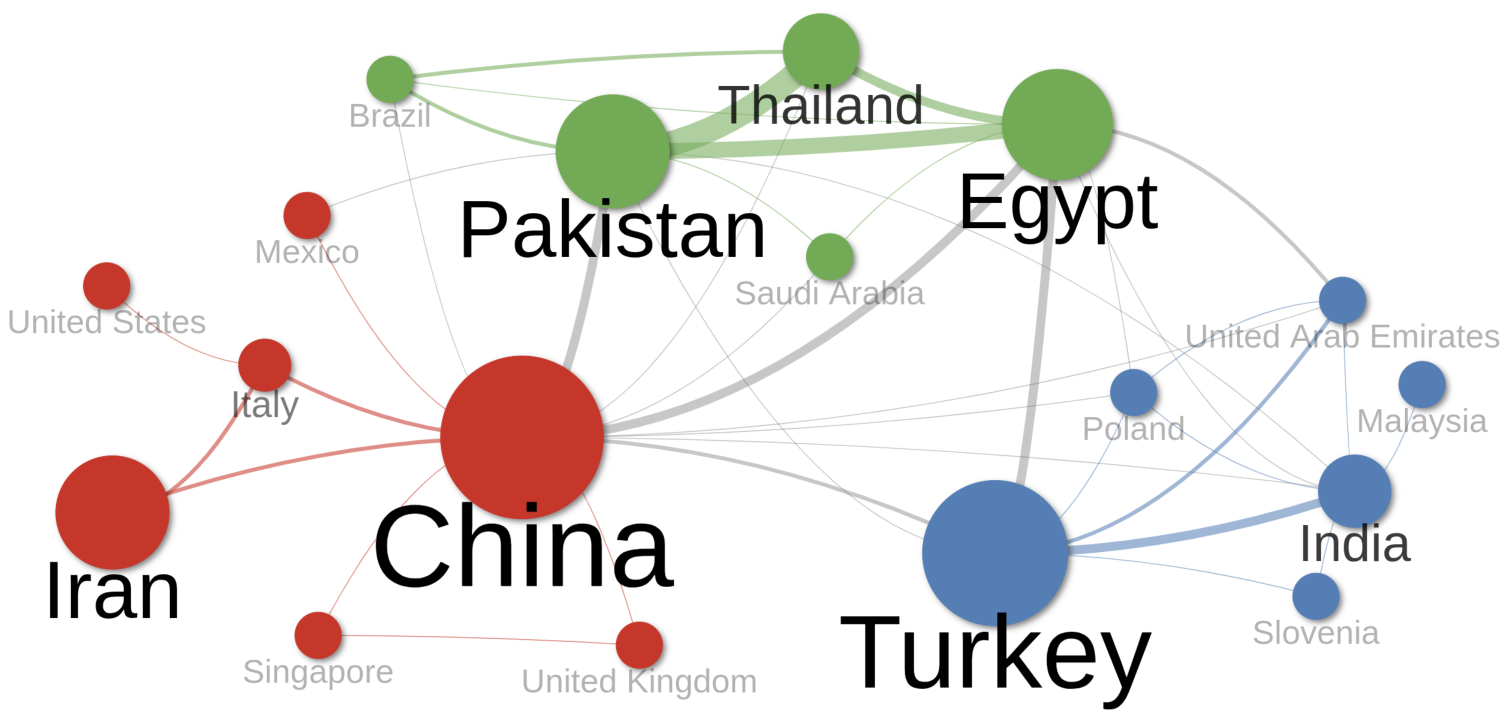
Figure 4 visualizes the country collaboration network derived from coauthorship links in the affiliation data. Consistent with the production concentration reported in Figure 3, the network depicts China as the main hub, linking the highest-output country to a set of partners across Asia, Europe, and the Americas. The most prominent connection is with Pakistan and additional links connect China with Iran and Singapore in Asia, with Italy and the United Kingdom in Europe, and with the USA and Mexico in North America. Pakistan also shows several connections beyond China, including visible ties to Egypt in Africa and to Thailand in Asia, while Egypt connects to multiple partners within the same structure. A second collaboration structure is organized around India, which is among the higher-output countries and connects with Japan, Turkey, and Malaysia, while also linking to China. Taken together, the production profile in Figure 3 and the collaboration structure in Figure 4 indicate that the corpus is shaped by a dominant Asian production base and by recurrent cross-regional collaboration pathways rather than isolated national research streams.

3.2.3. Most Relevant Affiliations

After characterizing the geographic distribution and country collaboration patterns, we examined which institutions appear most frequently in the normalized affiliation metadata. Table 2 reports the most relevant affiliations according to the number of articles associated with each normalized institutional name. This analysis highlights the organizational anchors that recur across the corpus and helps identify where the field is institutionally concentrated.
The most recurrent affiliation is the University of Tehran, which appears in 27 articles, indicating a particularly strong institutional presence in the corpus. A second prominent affiliation is the Institute of Space Technology, with 12 articles, followed by Firat University with 10 articles. The next tier includes King Mongkut’s Institute of Technology Ladkrabang and Nanjing University of Information Science and Technology, each with 8 articles, as well as Kastamonu University with 7 articles. Additional recurrent affiliations include Ariel University and Southern Taiwan University of Science and Technology, with 6 articles each.
A broader group of institutions appears with 5 or 4 articles, including Benha University, Dicle University, the Indian Institute of Technology (ISM)/Indian School of Mines, Kocaeli University, Central South University, Oregon State University, Tongji University, and Wuhan University. Most of the remaining affiliations listed in Table 2 appear in 3 articles each. Overall, the affiliation profile complements the country-level findings by showing that the field is not only geographically concentrated, but also institutionally anchored in a relatively small set of universities and research centers that recur across the AI-based TEC and earthquake-related literature.
With the institutional anchors of the corpus identified, the subsequent analysis examines the publication venues that concentrate this work and influence its dissemination patterns.

3.2.4. Most Relevant Sources

To complement the country and affiliation profiles, we examined the publication sources that concentrate the output of the corpus. Table 3 lists the journals by number of articles and reports their SCImago quartile. When a journal was assigned to more than one subject category in SCImago, the highest available quartile was used to provide a single source-level indicator.
Advances in Space Research is the leading source, with 15 articles, followed by Remote Sensing with 9 articles. A second group of recurrent journals includes Journal of Atmospheric and Solar-Terrestrial Physics with 3 articles, and Atmosphere, Earth Science Informatics, Geomagnetism and Aeronomy, IEEE Access, IEEE Journal of Selected Topics in Applied Earth Observations and Remote Sensing, Journal of the Earth and Space Physics, and Radio Science, each with 2 articles. The remaining sources contribute 1 article each, indicating a long-tail distribution after the two dominant publication venues.
Overall, the source profile shows that dissemination is concentrated in a small set of space science, remote sensing, atmospheric physics, geophysics, and hazard-oriented journals. At the same time, the presence of engineering, computational, and multidisciplinary venues reflects the hybrid character of the field, where TEC-based seismo-ionospheric analysis intersects with artificial intelligence, signal processing, GNSS remote sensing, and natural hazard monitoring.
Having identified the main publication venues, we next examine the keyword landscape to clarify the conceptual structure and thematic orientation of the corpus.

3.2.5. Keyword Landscape

We examined the keyword landscape using the combined set of Keywords Plus and Author Keywords to capture both author-specified framing and index-derived descriptors. This analysis provides a term-level view of how the corpus describes its signals, methodological choices, and interpretive aims.
Keyword Frequency and Word Cloud
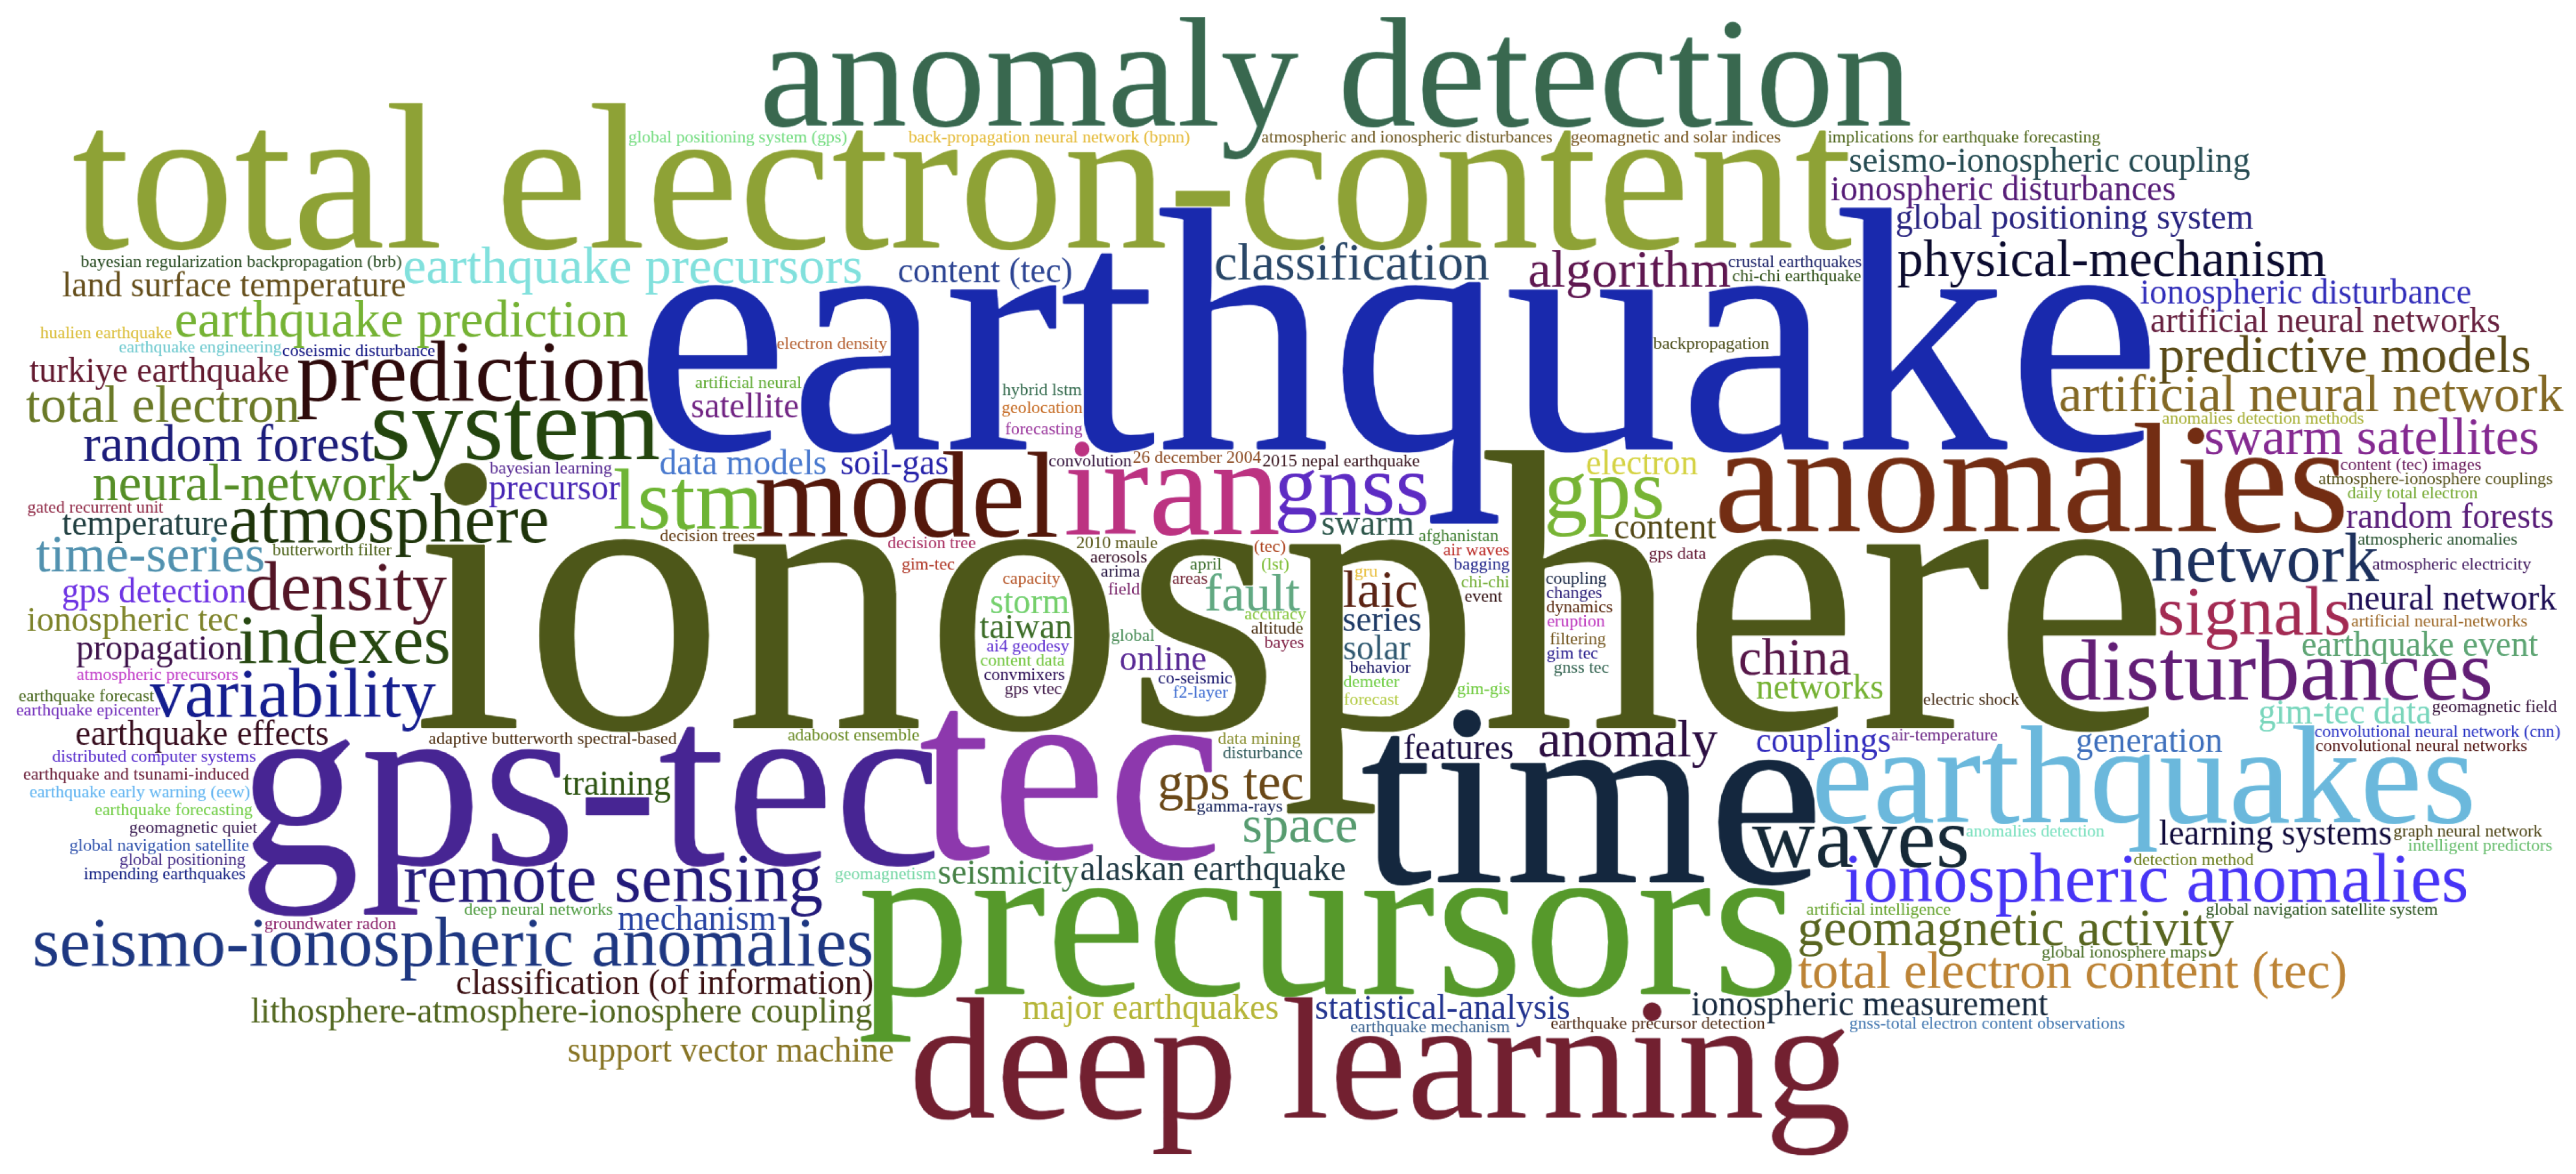
Figure 5 visualizes the most frequent terms in the combined keyword set. The highest-frequency terms are directly aligned with the scope of the review, led by ionosphere (23), earthquake (20), tec (15), time (15), gps-tec (14), precursors (13), and total electron-content (12). This confirms that the conceptual core of the corpus is organized around ionospheric analysis, TEC-based measurements, earthquake-related phenomena, and precursor-oriented interpretations.
Method-related terms are also prominent. Deep learning (10), anomaly detection (9), machine learning (8), model (7), system (6), lstm (5), prediction (5), network (4), algorithm (3), artificial neural network (3), classification (3), neural-network (3), predictive models (3), random forest (3), neural network (2), random forests (2), and support vector machine (2) indicate that the field is strongly oriented toward data-driven modeling, classification, forecasting, and anomaly detection. These terms suggest that artificial intelligence is not peripheral in the corpus, but constitutes one of the main methodological axes through which TEC signals are interpreted.
The keyword structure also reflects the geophysical and physical framing of the field. Terms such as anomalies (9), disturbances (5), waves (5), atmosphere (4), density (4), ionospheric anomalies (4), seismo-ionospheric anomalies (4), signals (4), variability (4), geomagnetic activity (3), laic (3), physical-mechanism (3), ionospheric disturbance (2), ionospheric disturbances (2), lithosphere-atmosphere-ionosphere coupling (2), seismo-ionospheric coupling (2), solar (2), storm (2), and temperature (2) show that many studies situate TEC variability within broader lithosphere–atmosphere–ionosphere coupling, space-weather, and disturbance-propagation frameworks.
Several terms also reveal event- and place-specific anchoring in the literature. Iran (8) appears prominently, followed by China (3), Taiwan (2), Alaskan earthquake (2), and Turkiye earthquake (2), while additional terms with lower frequency refer to specific events or regions, including 2010 Maule, 2015 Nepal earthquake, Afghanistan, Chi-Chi earthquake, Hualien earthquake, and other earthquake-centered case studies. This pattern suggests that the literature remains partly structured around selected seismic events and regional case studies, even though the methodological vocabulary increasingly points toward more generalizable AI-based analytical frameworks.
Keyword Co-Occurrence Network
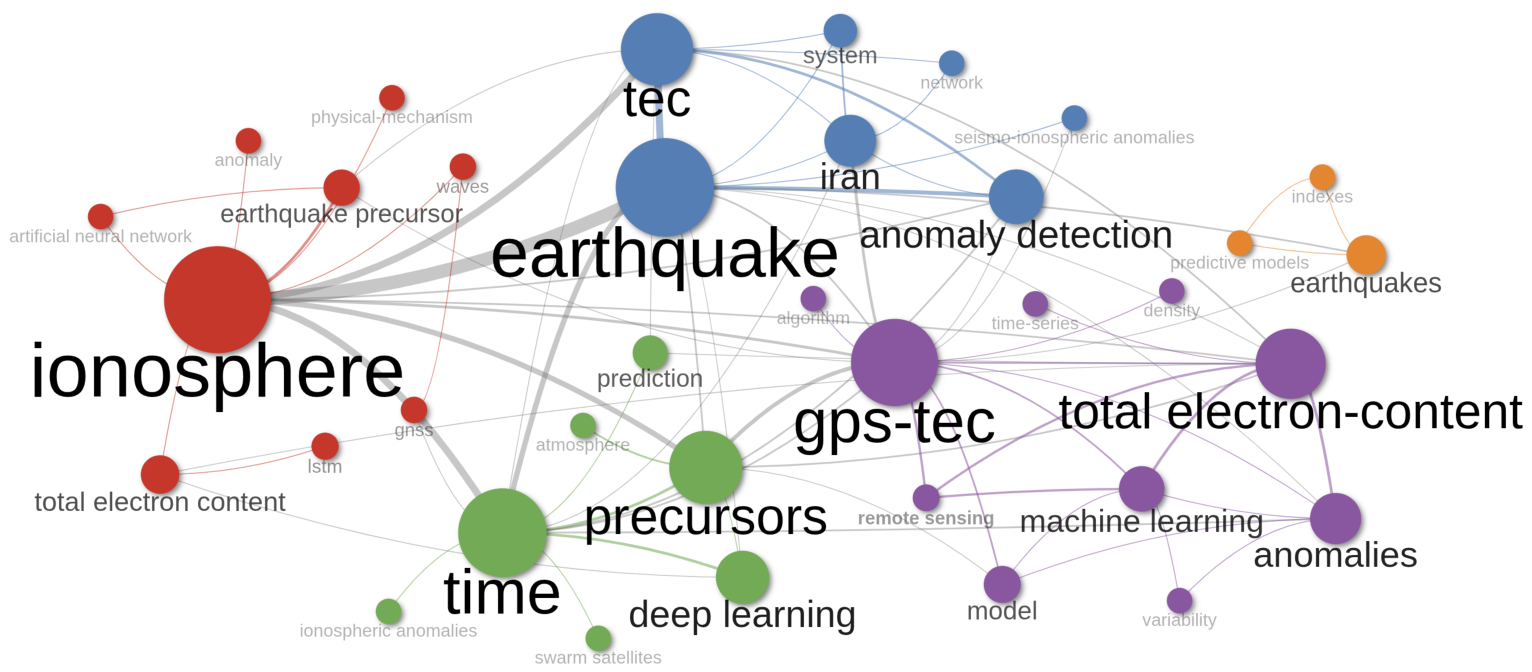
Figure 6 complements the frequency profile by visualizing the co-occurrence structure of the combined keyword set. The network shows a central backbone organized around ionosphere, earthquake, tec, gps-tec, time, and precursors, which appear as the most prominent and highly connected terms. This structure indicates that the conceptual organization of the corpus is strongly anchored in the relationship between ionospheric variability, TEC-based measurements, and earthquake-related precursor analysis.
The network also reveals several thematic neighborhoods. One cluster is centered on ionosphere and connects with earthquake precursor, anomaly, waves, physical-mechanism, artificial neural network, lstm, and total electron content, suggesting a strand focused on seismo-ionospheric interpretation and precursor-oriented anomaly analysis. A second cluster links earthquake, tec, iran, system, network, gnss, and anomaly detection, reflecting studies where TEC and GNSS-derived information are embedded in detection systems or event-centered analytical frameworks. A third cluster is organized around time, precursors, deep learning, prediction, atmosphere, ionospheric anomalies, and swarm satellites, indicating a temporal and predictive orientation associated with precursor detection and multi-source ionospheric analysis.
In addition, gps-tec occupies a bridging position between the central earthquake–TEC terms and a method-oriented cluster that includes machine learning, model, anomalies, remote sensing, variability, density, time-series, and predictive models. This suggests that GPS-TEC functions as a key operational variable through which AI-based modeling, anomaly detection, and geophysical interpretation are connected. Overall, Figure 5 and Figure 6 indicate that the corpus is thematically coherent around TEC-based seismo-ionospheric analysis, but methodologically diverse, combining precursor detection, anomaly modeling, prediction, classification, and physical interpretation. Network construction and visualization parameters are reported in Section 2.4.
To move from term prevalence and co-occurrence structure to higher-level thematic organization, the next subsection synthesizes these keywords using the thematic map.
Thematic Map
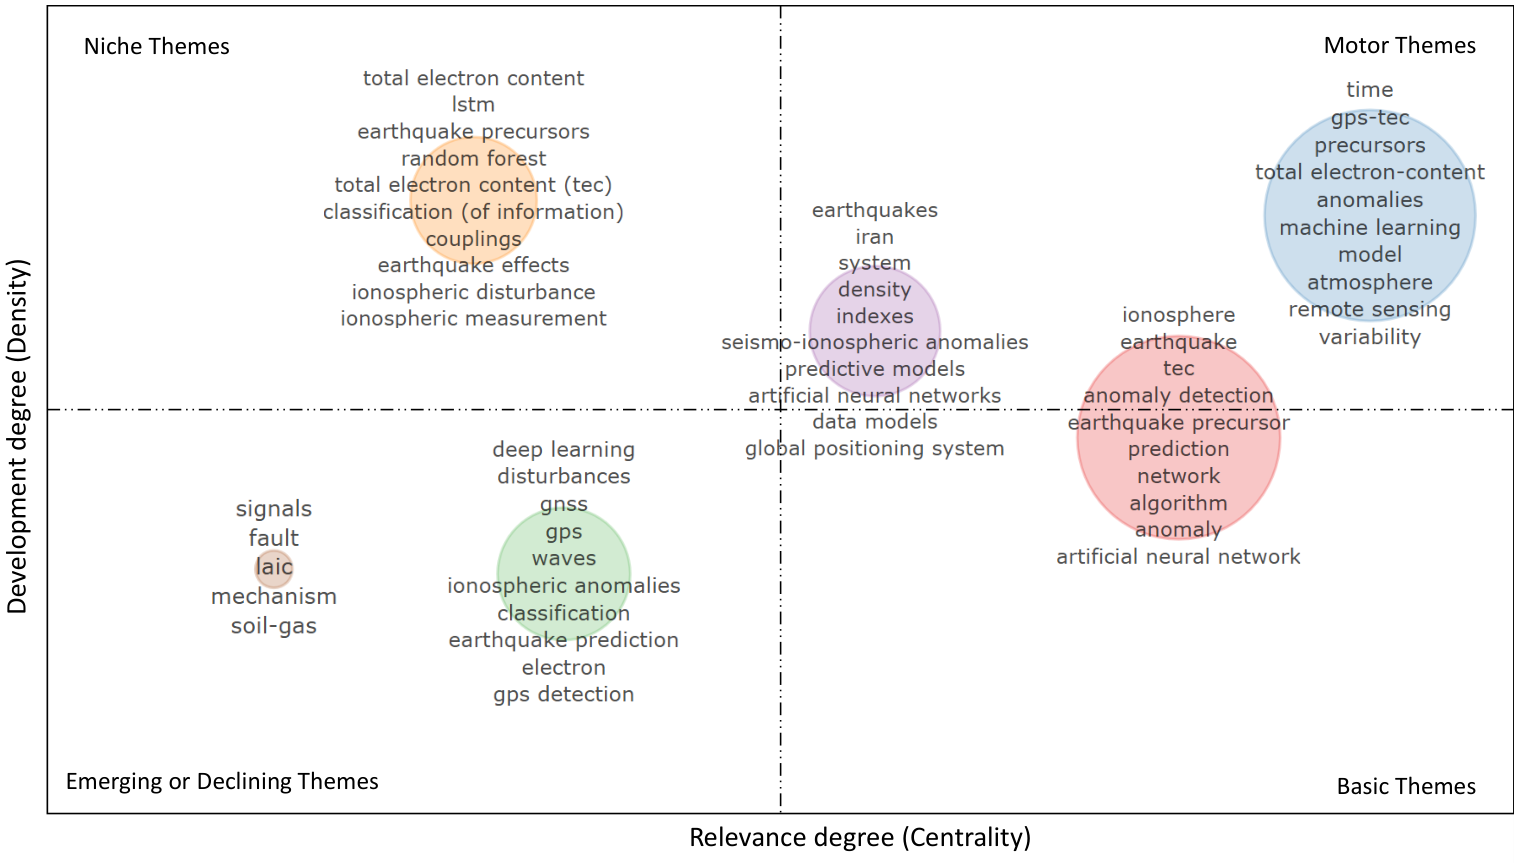
We synthesized the keyword space into higher-level themes using the thematic map shown in Figure 7, which positions clusters according to their relevance degree (centrality) and development degree (density). This representation complements the frequency and co-occurrence results by distinguishing themes that are structurally central, internally developed, specialized, or weakly consolidated.
In the motor-themes quadrant, the map highlights a well-developed cluster organized around time, gps-tec, precursors, total electron-content, anomalies, machine learning, model, atmosphere, remote sensing, and variability. This configuration suggests that one of the most developed thematic cores of the corpus links TEC-based precursor analysis with machine-learning-oriented modeling and remote-sensing perspectives. A second group, located close to the central region of the map, includes earthquakes, iran, system, density, indexes, seismo-ionospheric anomalies, predictive models, artificial neural networks, data models, and global positioning system. Its intermediate position suggests a thematic bridge between regional case-study framing, ionospheric anomaly analysis, and predictive or model-oriented terminology.
In the basic-themes quadrant, the map shows a broad and central cluster around ionosphere, earthquake, tec, anomaly detection, earthquake precursor, prediction, network, algorithm, anomaly, and artificial neural network. These terms are highly relevant to the corpus but comparatively less developed than the motor themes, suggesting that they form the shared conceptual vocabulary of the field. In other words, they connect a large part of the literature, even when their internal thematic specialization is more moderate.
In the niche-themes quadrant, the map identifies a more specialized and internally cohesive cluster composed of total electron content, lstm, earthquake precursors, random forest, total electron content (tec), classification (of information), couplings, earthquake effects, ionospheric disturbance, and ionospheric measurement. This grouping appears well developed but less central to the overall structure, suggesting a specialized subdomain focused on specific methodological combinations and measurement-oriented formulations within TEC-based earthquake-related research.
In the emerging-or-declining quadrant, two low-centrality and low-density groupings can be observed. One combines deep learning, disturbances, gnss, gps, waves, ionospheric anomalies, classification, earthquake prediction, electron, and gps detection, while another smaller cluster links signals, fault, laic, mechanism, and soil-gas. These themes may correspond either to lines of work that are still consolidating or to topics that remain marginal within the present corpus. Their position suggests that, although they are visible in the field, they do not yet occupy a strongly connected or fully developed place in the thematic structure.
Overall, the thematic map confirms that the corpus is organized around a central TEC–earthquake–ionosphere backbone, while the most developed themes extend this core toward machine learning, remote sensing, anomaly detection, and precursor-oriented analysis. At the same time, more specialized or weakly consolidated clusters indicate that the field retains thematic diversity and continues to evolve across both methodological and physical-interpretive directions.
Finally, the bibliometric profile shows that the field has expanded rapidly in recent years and is organized around a coherent conceptual core linking ionosphere, TEC, earthquakes, precursors, anomaly detection, and machine learning. However, bibliometric patterns alone do not reveal how individual studies operationalize TEC, define anomalies, incorporate artificial intelligence methods, or validate earthquake-related interpretations. Therefore, the next subsection moves from metadata-level evidence to article-level synthesis, focusing on the methodological, analytical, and interpretive features of the included studies.

3.3. Synthesis of the Included Studies

3.3.1. From TEC Anomaly Detection to AI-Based Decision Systems

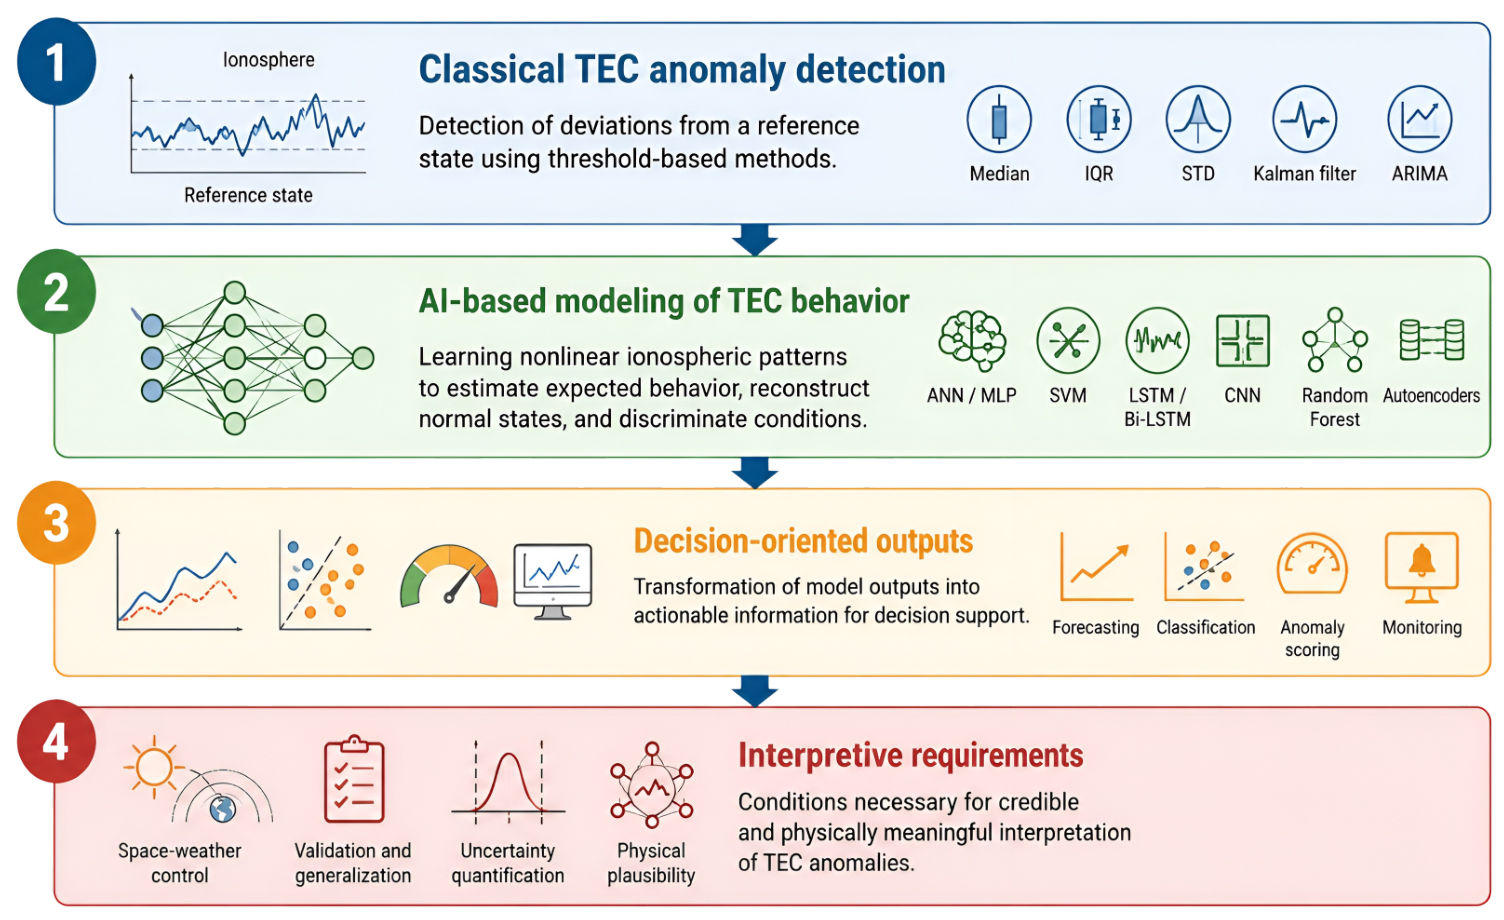
At the article level, the corpus reveals a clear methodological transition: the field is moving from the detection of isolated TEC deviations toward AI-based systems that classify, forecast, discriminate, and support decisions based on learned ionospheric patterns. Earlier studies generally estimated a reference TEC state and then flagged deviations from that background using median, IQR, standard deviation thresholds, Kalman filtering, ARIMA, or related classical procedures [20,21,63,68,90]. This threshold-centered logic was essential for establishing TEC anomaly detection as a research problem, but it was limited by the intrinsically variable nature of the ionosphere. Since TEC responds to local time, season, latitude, solar forcing, geomagnetic activity, and regional ionospheric dynamics, the relevant task has gradually expanded from identifying deviations to interpreting their possible physical and operational meaning. This methodological progression is conceptually summarized in Figure 8.
The first step beyond this logic was the incorporation of computational intelligence methods able to model nonlinear TEC behavior. MLP, SVM, ANFIS, genetic algorithms, Firefly Algorithm, Artificial Bee Colony, ANN-based models, and ANN–PSO hybrid systems were used to compare observed and predicted TEC, detect discordant patterns, or integrate thermal and TEC anomaly detection around selected earthquakes [20,60,83,87,88,90,92,93]. These studies did not yet solve the attribution problem, but they established an important methodological basis: TEC anomaly detection could be treated as a learning-based forecasting, classification, or optimization problem rather than only as threshold crossing.
Recent studies increasingly address this challenge by learning nonlinear TEC behavior instead of relying only on predefined anomaly bounds. Several families of models have been used to estimate expected TEC behavior, reconstruct normal patterns, classify ionospheric states, or discriminate seismic from non-seismic conditions. Classical neural architectures (MLP, ANFIS, Bayesian regularization backpropagation) and kernel-based learners (SVM) have been applied to TEC sequences around selected events [19,22,59,81,90]. Recurrent architectures (LSTM, NARX) and autoencoders have been used to learn temporal regularities and reconstruction errors [65,66,102]. Convolutional and mixer architectures (CNN, ConvMixer) handle TEC images and spatiotemporal representations [76]. Tree-based and instance-based classifiers (Random Forest, AdaBoost, KNN) have been applied to discriminate seismic and non-seismic states [84,85,86]. The complementary role of these families is also visible in studies that compare multiple architectures directly, including BPNN-based prediction frameworks and multi-model forecasting designs [61,62]. In this sense, AI is not merely replacing classical statistics. In several studies, it operates as a decision layer that translates TEC variability into classification, TEC forecasting, anomaly scoring, or monitoring outputs.
This transition is especially visible in classification-oriented studies. Some models distinguish precursor days from normal days using multi-input CNN or ConvMixer architectures that combine TEC sequences or TEC-derived images with space weather indices [74,76]. Other studies classify seismic and non-seismic periods using SVM-based frameworks, or separate ionospheric observations into geomagnetically quiet, geomagnetically disturbed, pre-earthquake, and earthquake-related classes through KNN, Random Forest, or AdaBoost approaches [81,84,85,86]. These designs move beyond asking whether TEC crossed a statistical threshold; they ask whether the observed pattern can support a decision about the likely context of the disturbance.
The forecasting branch reinforces the same shift. ARIMA, RNN, LSTM, GRU, encoder–decoder LSTM, Bayesian LSTM, autoencoder, and hybrid LSTM frameworks estimate expected TEC values and then use forecast errors, dynamic bounds, reconstruction errors, or anomaly intensity to identify candidate disturbances [23,64,65,67,68,70,71,72,91]. In these studies, an anomaly is no longer only a raw departure from a median or standard deviation band. It becomes a mismatch between the observed TEC and a model-learned representation of the expected ionospheric state. Comparisons with empirical models or alternative predictors, such as IRI-2020 or baseline machine learning models, further indicate that forecasting performance has become part of the methodological evaluation [64,78,104].
A parallel development expands the decision input beyond univariate TEC. Several studies integrate TEC with space weather indices, atmospheric variables, radon-related information, gamma-ray observations, Swarm parameters, or other ionospheric measurements to evaluate multivariate anomaly patterns [69,94,95,96,97,98,100,101,102,103,104,105,106]. This does not eliminate interpretive uncertainty, but it changes the analytical unit of the field: the decision is increasingly based on the consistency of multiple signals rather than on a single TEC excursion.
This broader decision-oriented logic also appears in operationally oriented studies, where neural network or deep learning frameworks process TEC data for real-time, near-real-time, or monitoring-oriented purposes [24,61,107,108]. These studies do not convert AI into deterministic earthquake prediction. Rather, they show that AI can reduce the gap between retrospective anomaly analysis and decision support for identifying ionospheric disturbances.
Overall, the corpus shows a transition from threshold-based TEC anomaly detection toward AI-assisted decision systems. Earlier models mainly asked whether TEC exceeded a predefined background level. More recent models estimate expected TEC behavior, classify ionospheric states, distinguish seismic from non-seismic contexts, and support monitoring-oriented outputs. This development expands the analytical scope of the field, but it also makes confounder control indispensable: even sophisticated decision systems remain vulnerable to misattribution when solar, geomagnetic, seasonal, and regional ionospheric drivers are not explicitly modeled.

3.3.2. Controlling Solar and Geomagnetic Confounding

The control of solar and geomagnetic activity is one of the central methodological requirements of the corpus. TEC is not a seismic-specific signal. It varies with solar activity, geomagnetic storms, local time, season, latitude, solar cycle phase, and regional ionospheric conditions. Therefore, anomaly detection and anomaly attribution must be treated as distinct analytical steps. A statistical threshold, reconstruction error, forecast residual, or classifier output may indicate unusual TEC behavior, but it does not by itself establish a seismic interpretation.
The reviewed studies commonly address this problem through geomagnetic and solar indices. The most frequent controls include Dst, Kp, Ap, F10.7, solar wind speed, geomagnetic storm information, and sunspot number [59,64,74,76,81,83,84,85,86]. Some studies also incorporate additional descriptors of solar or ionospheric activity, including Lyman- α , or combine external indices with TEC-derived spatiotemporal features [69]. These controls help distinguish periods of relatively quiet ionospheric behavior from intervals affected by external forcing.
Across the corpus, these variables are used in three main ways. First, several studies use them as exclusion or filtering criteria. TEC anomalies are interpreted more cautiously when they occur during disturbed geomagnetic conditions, and some cases are treated as ambiguous when Dst, Kp, Ap, or F10.7 indicate strong external forcing [63,68,87,89]. Second, other studies incorporate the indices directly as input variables in machine learning models. Multi-input CNN, RNN, and ConvMixer frameworks, for example, combine TEC representations with Kp, Dst, Ap, F10.7, solar wind speed, geomagnetic storm information, or sunspot number to help the model separate possible seismic-related patterns from space weather effects [64,74,76]. Third, some studies use these indices to define classes, distinguishing geomagnetically quiet days, geomagnetically disturbed days, pre-earthquake days, and earthquake days [84,85,86].
The most rigorous designs are those in which solar and geomagnetic controls are embedded in the analytical structure rather than added as a descriptive check after anomaly detection. This includes studies that train models with space weather indices, classify geomagnetic disturbance as a separate state, compare seismic and non-seismic periods, or explicitly use quiet and disturbed geomagnetic conditions as competing classes [76,81,83,84,85,86]. Such approaches move the field beyond simple TEC thresholding and toward discrimination between possible seismic signatures and ordinary ionospheric variability.
Thus, solar and geomagnetic control is not an optional refinement. It is a necessary condition for any earthquake-related interpretation of TEC anomalies. Once this condition is recognized, the next methodological question is whether models are evaluated only around selected earthquakes or whether they are exposed to broader periods that include non-events, negative cases, and competing sources of variability.

3.3.3. From Retrospective Case Studies to Systematic Validation

A second major transition concerns validation design. Many studies still examine one earthquake, or a small set of known events, and then search for TEC anomalies in the days before, during, or after the seismic occurrence [20,21,23,60,63,68,87,88,89,90,95,105]. Although such designs are useful for exploring possible seismo-ionospheric signatures and comparing anomaly detection procedures, they provide limited evidence of generalizability because they rarely expose the method to negative cases, inactive periods, or independent events.
The key limitation of retrospective event-centered analysis is that it begins from a known earthquake and then evaluates whether a TEC disturbance can be found around that event. This logic can generate plausible associations, but it does not fully address false alarms, periods without seismic activity, or the possibility that similar anomalies occur under non-seismic conditions. Finding an anomaly before a known earthquake is therefore not equivalent to showing that the same method can operate systematically under real monitoring conditions.
More robust studies extend the evaluation design by including control periods, non-seismic periods, long time series, or explicit validation partitions. The EQ-PD framework, for example, formulates precursor detection as a machine learning task over a regional time span and evaluates detections across training, validation, and test periods while reporting false alarms [22]. The SVM-based study in Mexico similarly includes seismic and non-seismic periods, constructs statistical features, applies dimensionality reduction, and evaluates classification through cross-validation [81]. Studies based on KNN, Random Forest, and AdaBoost also define multiple ionospheric states, including quiet geomagnetic days, disturbed geomagnetic days, precursor days, and earthquake days, allowing the model to be tested against competing non-seismic explanations [84,85,86].
Long-term validation represents another important step. Studies that analyze multi-year TEC series and include periods of seismic inactivity are especially valuable because they test whether anomaly detection methods identify patterns that are unusual within a broader ionospheric background, not only within a narrow event window [82,97]. This design contributes more directly to the question of robustness because it evaluates both active and inactive conditions.
Out-of-sample evaluation is also becoming more visible. Several machine learning and deep learning studies divide available data into training and testing subsets, or use validation and test partitions to estimate classification performance [66,74,76,81]. Others use cross-validation to reduce dependence on a single data split and to assess stability under limited sample conditions [61,81,82,84,85,86]. These strategies do not remove all uncertainty, but they are methodologically stronger than evaluating a model only on the same event used to tune or illustrate the approach.
Comparisons with baseline methods further strengthen the evidence. Several studies compare AI models against classical procedures such as median, IQR, Kalman filtering, ARIMA, wavelet, running-median methods, or earlier intelligent methods [20,21,68,71,87,89,90,92,93]. Other works compare neural or recurrent models with empirical ionospheric models, such as IRI-2020, or with alternative machine learning classifiers [64,74,76,78]. These comparisons clarify whether the proposed AI method adds value beyond established TEC prediction or anomaly detection approaches.
Overall, the corpus does not yet support a uniform claim of generalization for the whole field. A substantial part of the evidence remains retrospective and event-specific. Nevertheless, the strongest methodological progress appears in studies that move from finding anomalies around known earthquakes toward testing whether models can operate across seismic and non-seismic periods, quantify false alarms, use independent validation, and compare performance against baselines. This progression leads directly to another requirement: models must not only detect anomalies, but also express how reliable those detections are. Table 4 summarizes selected methodological strengthening strategies identified across the corpus, including the validation practices discussed above and the confounding-control, uncertainty-aware, multiprecursor, representational, and operational strategies developed in the following subsections. Model interpretability and XAI reporting are discussed separately in Section 3.3.8, because they represent a cross-cutting issue rather than a single validation or representation strategy.

3.3.4. Uncertainty-Aware Anomaly Detection and False-Alarm Control

Uncertainty quantification and false-alarm control are essential for strengthening the interpretation of TEC anomalies. Several studies report anomalous TEC behavior, but not all of them quantify how strong, reliable, or distinguishable the anomaly is from background ionospheric variability. This is a critical limitation because a TEC departure may reflect seismic forcing, space weather, local ionospheric dynamics, or ordinary noise. The methodological value of an anomaly therefore depends on how its uncertainty and false-alarm risk are evaluated. These issues are reflected in several of the methodological strengthening strategies summarized in Table 4, particularly false-alarm reporting, uncertainty-aware anomaly bounds, and anomaly intensity estimation.
The corpus shows a progression from fixed thresholds toward model-based and uncertainty-aware anomaly definitions. Classical approaches usually compare observed TEC with a reference background and flag values outside fixed or statistical bounds, commonly based on median and IQR, standard deviation limits, running medians, Kalman filtering, ARIMA residuals, or related procedures [21,63,68,89,90]. Metaheuristic and optimization-based studies also define anomalies through prediction errors or departures from allowable bounds, showing an early attempt to handle nonlinear and massive precursor time series with adaptive predictors [87,92,93]. These methods are transparent, but their results can depend strongly on the selected reference window, threshold value, local time, and regional background behavior.
Forecasting-based approaches define anomalies through residuals between observed and expected TEC. In these studies, ANN, ARIMA, RNN, LSTM, GRU, encoder–decoder LSTM, Bayesian LSTM, or related models estimate the expected TEC state, and anomalies are identified when deviations exceed a defined limit [23,59,60,64,67,68,70,71,72,91]. This formulation is more informative because it links anomaly detection to prediction error. Its reliability, however, depends on whether the model also reports uncertainty, uses adaptive bounds, or evaluates residual behavior under non-seismic conditions.
The most explicit uncertainty-aware approaches move beyond a simple anomalous or non-anomalous label. Bayesian LSTM models forecast TEC and use confidence intervals, uncertainty boundaries, and anomaly intensity to reduce possible false alarms [70]. Other hybrid LSTM approaches define upper and lower bounds around expected TEC behavior and compare observed values against dynamic limits [72]. Multi-precursor integration studies also attempt to reduce uncertainty by combining anomaly estimates from different precursors or by integrating parameters extracted from several remote sensing observations [96]. These designs are important because they do not treat every threshold crossing as equally meaningful; instead, they allow stronger anomalies or more coherent anomaly patterns to be distinguished from weaker deviations.
False-alarm evaluation is closely connected to this uncertainty layer. Studies such as EQ-PD report false alarms during validation and test periods, making their evaluation more rigorous than retrospective event-only analyses [22]. Classification studies based on SVM, KNN, Random Forest, and AdaBoost also contribute to false-alarm control by separating seismic-related classes from geomagnetically quiet and disturbed conditions [81,84,85,86]. This design tests whether models confuse possible pre-earthquake patterns with ordinary ionospheric or geomagnetic disturbances.
In our mapping extraction, at least six of the 56 included studies, corresponding to a minimum of 10.7% of the corpus, explicitly incorporated false-alarm reporting or false-alarm-oriented evaluation. This figure should be interpreted descriptively because false alarms were not reported using a common definition, time window, metric, or validation protocol. Some studies reported spurious detections during validation or test periods, whereas others addressed false-alarm risk indirectly through classification designs that included quiet, disturbed, or non-seismic ionospheric conditions. Therefore, a pooled false-alarm rate could not be calculated. Nevertheless, the limited and heterogeneous reporting of false alarms highlights an important methodological risk: high detection or classification performance around known earthquakes may overstate operational reliability when models are not evaluated over extended non-seismic periods.
An additional reporting asymmetry should be considered when interpreting these results. Because the corpus is composed of published journal articles, successful anomaly detections and positive precursor-like findings are likely to be more visible than null results, failed detections, or unsuccessful applications of the same methods. Therefore, the frequency of reported TEC anomalies or high model performance in the reviewed literature should not be interpreted as evidence that such outcomes occur with the same frequency under unconstrained monitoring conditions. This possible publication and reporting bias reinforces the need for systematic non-event evaluation, explicit reporting of missed detections, and documentation of negative or null results.
A useful distinction therefore emerges between binary anomaly detection and decision-oriented confidence assessment. Some studies generate a binary output: anomalous or normal, precursor or non-precursor, seismic or non-seismic. Other studies report richer outputs: residual magnitude, anomaly intensity, confidence limits, class-specific metrics, cross-validation, or counts of spurious detections [22,61,70,84,85,86]. The latter group offers stronger methodological evidence because it indicates not only whether an anomaly was detected, but also how reliable the decision was under competing sources of variability.
The field is therefore beginning to move from binary TEC anomaly detection toward uncertainty-aware anomaly assessment. A robust monitoring-oriented model should not only flag deviations but also estimate their intensity, uncertainty, sensitivity to solar and geomagnetic controls, and likelihood of being false alarms. This perspective clarifies why the most defensible applications of TEC-based AI may lie in anomaly assessment and disturbance monitoring rather than deterministic earthquake prediction.

3.3.5. Operational Shift Toward Near-Real-Time Coseismic and Tsunami-Related Monitoring

An important operational shift is visible in the corpus: TEC is not used only to search for pre-seismic anomalies, but also to monitor ionospheric disturbances generated during or after earthquakes and tsunamis. This distinction is methodologically important. A pre-seismic precursor is interpreted as a possible signal of earthquake preparation before rupture, whereas a coseismic or postevent signal is a response to an event that has already occurred. The latter does not require deterministic prediction and can be linked more directly to earthquake-induced acoustic waves, acoustic-gravity waves, traveling ionospheric disturbances, or tsunami-related perturbations. Accordingly, we treat these studies as a separate operational subgroup in the mapping synthesis, rather than as evidence for pre-earthquake prediction.
Several studies move in this direction by focusing on near-real-time or operational detection rather than only on retrospective precursor identification. Deep learning frameworks based on GNSS-derived TEC and VARION real-time TEC estimates have been proposed to detect earthquake- and tsunami-induced traveling ionospheric disturbances, with explicit relevance for tsunami early warning systems [107]. GUARDIAN-based approaches similarly use GNSS-TEC streams to detect anomalous ionospheric behavior in simulated near-real-time settings after major earthquakes [24]. In these studies, the research question changes from whether TEC can predict an earthquake to whether TEC can help detect and monitor an ionospheric response rapidly enough to support warning or situational awareness. The aforementioned operational use of TEC corresponds to the near-real-time coseismic and tsunami-related monitoring strategy summarized in Table 4.
This operational orientation is particularly relevant for sparse or oceanic monitoring contexts. Open-ocean events are difficult to observe with dense ground instrumentation, and tsunami warning systems may have limited coverage in remote regions. GNSS-TEC monitoring can complement this gap because satellite-receiver links can detect ionospheric perturbations produced by seismic or tsunami-related atmospheric waves. Recent work using sparse GNSS networks over open-ocean regions combines deep learning anomaly detection with source geolocation, suggesting that TEC can support both disturbance identification and approximate localization of the generating event [108].
These approaches also broaden the role of AI. Instead of only assigning a pre-earthquake label to a TEC pattern, AI is explored as a tool for detecting anomalous wave-like behavior, classifying disturbance signatures, reducing false detections, and informing near-real-time monitoring-oriented research workflows. VARION contributes real-time TEC estimates, while GUARDIAN provides a framework for rapid ionospheric monitoring based on GNSS observations [24,107,108]. However, most of these systems have been evaluated in retrospective or simulated near-real-time settings. They should therefore be interpreted as proof-of-concept or prototype monitoring frameworks rather than operationally validated systems. Studies that frame neural networks or BPNN models as real-time TEC prediction systems also show how precursor-oriented methods are being translated into monitoring or early-warning narratives, but prospective validation under real monitoring conditions is still required before claims of operational readiness can be made [61].
The corpus also includes studies where anomalies are identified around or after the seismic event, reinforcing the value of TEC for postevent analysis. For example, ensemble methods have been applied to detect TEC anomalies around the time of the Chile earthquake, including postevent ionospheric disturbances [80]. Studies over Pakistan and other earthquake cases also examine pre- and post-seismic TEC behavior from GPS stations or GIM data [95,105]. Although these studies are not always operational systems, they show that TEC analysis can contribute to understanding coseismic and postseismic ionospheric responses.
This line of work is among the most defensible application-oriented contributions of the corpus. It positions GNSS-TEC as a complementary observational layer for detecting coseismic, postevent, and tsunami-related perturbations, especially in regions where conventional instrumental coverage is sparse. It also connects naturally with the broader physical framework of the field, because rapid ionospheric responses are often interpreted through lithosphere–atmosphere–ionosphere coupling and wave-propagation mechanisms.

3.3.6. Multi-Precursor LAIC-Oriented Integration

Multi-precursor integration is a relevant strategy for strengthening the physical plausibility of TEC anomalies. The LAIC framework provides a conceptual basis for interpreting possible coupling from lithospheric processes to atmospheric disturbances and ionospheric variability. However, invoking LAIC is not sufficient. The methodological question is whether a study actually integrates variables representing different layers of the Earth system and whether those variables show temporal, spatial, and physical coherence around the seismic event. This cross-layer logic is also captured in Table 4 as one of the corpus-level strategies for strengthening physical plausibility.
Several studies combine TEC, VTEC, or STEC with atmospheric, surface, and ionospheric parameters. These include LST, SST, OLR, air temperature, relative humidity, air pressure, radon, gamma-ray emissions, electron density, electron temperature, magnetic scalar and vector components, foF2, and Swarm-derived parameters [69,88,89,90,94,95,96,97,98,100,101,102,103,104,105,106]. This broadens the analysis beyond TEC-only detection. Surface and atmospheric variables are used to evaluate possible lower-atmosphere or near-surface disturbances, whereas TEC, VTEC, STEC, Ne, Te, foF2, and magnetic field measurements represent ionospheric or near-Earth plasma responses.
The strongest contribution of these studies is not the accumulation of variables, but the search for coherence among them. Some works examine whether atmospheric and ionospheric anomalies occur within comparable temporal windows, whether they are spatially close to the epicentral region or earthquake preparation area, and whether their signs are compatible with a LAIC-type interpretation [95,97,98,100,102,103,105]. A single TEC anomaly may remain ambiguous, but a temporally aligned disturbance involving TEC, atmospheric variables, and satellite-based ionospheric parameters can make the interpretation more physically plausible.
The corpus also shows two different uses of LAIC. In some studies, it functions mainly as a general explanatory framework. In others, it becomes an organizing criterion for evidence across layers: lithospheric or near-surface indicators, atmospheric parameters, and ionospheric variables are evaluated together to assess whether the anomaly sequence is coherent [96,97,101,102,103,104]. This distinction is important because a LAIC-oriented synthesis should not only name the mechanism, but also examine whether the observed variables behave in a way that is compatible with it.
At the same time, multi-parameter integration does not automatically reduce uncertainty. If variables are simply added without clear temporal alignment, spatial correspondence, or control of solar and geomagnetic confounding, the approach may increase complexity rather than improve interpretation. Its value depends on whether the combined signals help distinguish a physically coherent disturbance pattern from unrelated variability.
The LAIC-oriented multi-precursor approach is therefore conceptually important because it shifts the analysis from isolated TEC anomalies to cross-layer evidence. It does not prove causality, and it should not be framed as deterministic prediction. Nevertheless, when surface, atmospheric, and ionospheric signals are temporally synchronized, spatially consistent with the seismic zone, and interpreted under explicit confounding controls, multi-precursor integration offers stronger support than TEC-only analysis. This need for richer evidence is also reflected in the technical evolution of the field, where TEC itself is increasingly represented as an image, map, graph, or spatiotemporal structure rather than as a single time series.

3.3.7. Advanced TEC Representations: Images, Graphs, 3D Matrices, and Attention-Based Models

A further technical shift concerns how TEC is represented before entering a model. Earlier studies mainly treated TEC as a univariate time series, where the central task was to detect deviations from a statistical background or forecast the next TEC value. Recent studies increasingly transform TEC into richer structures, including time–frequency images, TEC maps, GIM-based spatial grids, latitude–longitude–time matrices, graph-based representations, GADF images, multichannel inputs, tomographic reconstructions, and spatiotemporal sequences [23,73,74,75,76,77,78,79,99,107,108].
Image-based representations are one of the clearest examples of this transition. Some studies convert TEC signals into time–frequency images and then use multi-input CNN architectures to classify precursor and normal days [74]. Other studies build daily TEC images and apply CNN models after filtering operations to detect precursors [73]. Others transform TEC time series into GADF images and combine them with CNNs for the detection of earthquake- and tsunami-induced ionospheric perturbations [107]. In these cases, the representation is designed to expose morphological, temporal, or spectral patterns that may not be captured by a single threshold applied to the original TEC curve.
Spatial representations expand the analytical scope further. GIM-based studies use TEC maps or GIM subgrids to represent the spatial distribution of ionospheric variability. One approach builds three-dimensional matrices in which latitude, longitude, and time are jointly encoded, allowing CNN models to process TEC as a spatiotemporal object rather than as an isolated sequence [75]. Other studies use GIM-TEC star, Kriging interpolation, and neural networks to estimate epicentral areas from spatially organized ionospheric precursor information [79]. This is relevant because possible ionospheric disturbances may have spatial structure, regional extent, and temporal evolution. A model based only on one station series or one TEC value may miss such patterns.
Graph-based and tomographic approaches provide additional forms of enrichment. Studies using GIM-gis and spectral-based graph neural networks represent TEC maps as graph structures, where spatial relations among grid elements become part of the input [77]. Tomographic neural network approaches reconstruct electron density structure and use this representation to investigate earthquake-related ionospheric anomalies beyond two-dimensional TEC behavior [78]. These approaches differ from conventional image processing because they emphasize relational or vertical structure rather than only regular grid intensity.
Sequence-based deep learning remains central, but it has also become more structured. LSTM autoencoders, encoder–decoder LSTM models, Bayesian LSTM models, Bi-LSTM models, attention-based LSTM models, and transformer-based time-series models use temporal context to learn expected TEC behavior or detect deviations from typical ionospheric dynamics [23,65,70,99,108]. Attention-based models add another layer by allowing the model to assign different relevance to different time steps or input segments [99,108]. This is useful when diagnostic information is unevenly distributed across a sequence.
ConvMixer and related multichannel designs illustrate how newer architectures combine representation and decision making. The MI-1D-ConvMixer model uses multiple TEC sequences together with space weather indices, while multi-input CNN models combine TEC images and auxiliary geophysical indices [74,76]. These designs do not only classify a TEC value; they learn from several aligned inputs that describe the ionospheric state across consecutive days and under external forcing conditions.
Together, these examples show that TEC representation has become an analytical decision in itself, because each representation emphasizes different aspects of the ionospheric signal. Table 5 summarizes the main representation strategies identified in the corpus, the associated AI model families, their analytical purposes, and the studies in which they appear.
The main advantage of these representations is that they allow models to capture spatial, temporal, morphological, spectral, vertical, or relational information that classical thresholding cannot represent. However, richer representations do not automatically improve physical interpretation. A complex representation can reveal patterns, but the meaning of those patterns still depends on solar and geomagnetic controls, spatial consistency, temporal plausibility, and validation design.
There is also a methodological risk. Complex representations and deep architectures can overfit when the number of earthquakes, control periods, or independent validation cases is small. Therefore, the strongest contribution comes from studies that combine advanced TEC representations with explicit validation, comparison against simpler models, and control of confounding factors. The technical frontier is no longer defined only by choosing between SVM, CNN, LSTM, or Random Forest. It is increasingly defined by the joint design of TEC representation and learning architecture, which allows the field to model spatiotemporal ionospheric patterns beyond the reach of classical anomaly detection.

3.3.8. Model Interpretability and XAI Reporting

Model interpretability represents one of the main methodological gaps in the corpus. Most studies provide physical or contextual interpretation of detected TEC anomalies, but they rarely explain the internal decision process of the AI models. In other words, the field has advanced substantially in TEC anomaly detection, forecasting, classification, and multiparameter integration, but it has advanced much less in explainable artificial intelligence. This distinction is important because a model can flag an anomaly without showing whether the decision was driven by a physically meaningful TEC structure, a specific station, a spatial region, a temporal window, a space-weather variable, or an artifact introduced by preprocessing or data partitioning.
Across the mapped studies, interpretability is usually external to the model. Detected anomalies are interpreted through LAIC-oriented reasoning, coseismic or tsunami-related disturbance mechanisms, acoustic or gravity wave propagation, geomagnetic and solar controls, residual behavior, spatial proximity to the epicentral region, or comparison with classical anomaly detection methods. This form of physical interpretation is valuable, but it is not equivalent to model-level explainability. The gap is especially relevant for studies based on CNNs, LSTMs, Bi-LSTMs, autoencoders, graph neural networks, ConvMixer models, transformer-type architectures, and hybrid neural networks, where nonlinear and high-dimensional representations can improve detection performance while reducing transparency [23,65,73,74,75,76,77,94,107,108].
Only a small subset of studies moves toward explicit model explanation. Attention-based architectures, feature-importance analysis, station-importance reporting, or tree-based explanatory outputs provide partial evidence about which temporal inputs, stations, or predictors contribute most to model decisions [86,91,99]. These studies are methodologically important because they begin to connect classification or anomaly-detection outputs with interpretable decision evidence. Nevertheless, explicit XAI methods such as SHAP, LIME, saliency maps, Grad-CAM, permutation importance, systematic ablation, and sensitivity analysis remain uncommon in the corpus.
It is also important to distinguish uncertainty-aware modeling from XAI. Bayesian LSTM models, confidence intervals, dynamic bounds, anomaly intensity, and residual-based thresholds can improve the reliability of anomaly interpretation and false-alarm control [70,72]. However, these approaches mainly quantify how strong or uncertain an anomaly is; they do not necessarily explain which input features or TEC structures caused the model to identify that anomaly. Thus, uncertainty reporting and XAI should be treated as complementary requirements.
Overall, the corpus suggests a clear interpretability boundary. Current AI-based TEC studies increasingly operate as decision-support systems, but their decisions remain only weakly explainable in most cases. Future operational use will require models that not only detect TEC anomalies, but also explain why those anomalies were flagged, which variables or spatial-temporal structures supported the decision, and why alternative non-seismic explanations were rejected.

3.3.9. Interpretive Boundary: Promising Evidence, but Not Deterministic Earthquake Prediction

The corpus provides evidence of methodological progress, but not proof that TEC or AI can predict earthquakes in a deterministic, prospective, and generalizable way. The reviewed studies show that TEC-based models can detect anomalous ionospheric behavior, forecast expected TEC values, classify precursor-like periods, separate seismic and non-seismic classes, estimate epicentral or event-related parameters, and integrate atmospheric and ionospheric variables under LAIC-oriented frameworks [74,75,76,79,81,83,84,85,86,96]. These are important advances, but they are better described as progress in anomaly detection, signal classification, monitoring support, and multiparameter interpretation than as operational earthquake prediction.
The strongest claim supported by the corpus is that AI methods can learn patterns in TEC and related variables that are associated with selected seismic contexts. This includes retrospective identification of TEC anomalies near known events, classification of pre-event and normal days, comparison between seismic and non-seismic periods, and detection of coseismic or tsunami-related ionospheric disturbances [22,24,81,105,107,108]. These findings suggest that TEC can provide useful information for studying ionospheric responses to seismic activity. They do not establish that earthquakes can be predicted reliably in advance across regions, magnitudes, ionospheric regimes, and space weather conditions.
Several limitations define this interpretive boundary. A substantial part of the corpus remains retrospective and event-centered: studies begin with a known earthquake and search for anomalies in a temporal window around it [20,21,23,60,63,68,87,88,89,90,92,93]. This design is valuable for exploration, but it is vulnerable to case selection, postevent window definition, and confirmation bias. Small event sets further weaken generalization claims. High classification accuracy is therefore not enough on its own. Reported performance can depend on multiple choices: the selected region, the station distribution, the earthquake sample, the feature design, and the control period.
Another limitation is the difficulty of separating seismic-related TEC variability from space weather and natural ionospheric dynamics. Solar activity, geomagnetic storms, local time, season, latitude, solar cycle, and regional ionospheric behavior can produce TEC disturbances that resemble candidate seismic anomalies. The most rigorous studies address this problem by using Dst, Kp, Ap, F10.7, solar wind speed, sunspot number, or related indices as inputs, filters, or class definitions [64,69,74,76,81,83,84,85,86]. Nevertheless, confounding control remains a core challenge, especially when anomalies occur during disturbed geomagnetic conditions.
The corpus also shows that anomaly criteria are not yet uniform. Some studies define anomalies through median or IQR bounds, others through standard deviation thresholds, Kalman or ARIMA residuals, forecast errors, reconstruction errors, confidence bands, anomaly intensity, or classifier labels [21,59,68,70,72,89,90]. This methodological diversity supports innovation, but it complicates direct comparison across studies. Without standardized anomaly definitions, independent validation, and explicit false-alarm evaluation, a detected TEC anomaly cannot be treated as a robust earthquake prediction signal.
Thus, most studies in the corpus should be interpreted as contributions to TEC modeling, anomaly detection, classification, precursor-like pattern recognition, or disturbance monitoring. Even when prediction terminology is used, the predicted quantity is often TEC, an anomaly class, a precursor label, or an event-related parameter, rather than the deterministic occurrence of an earthquake with reliable time, location, and magnitude.
For the field to move toward operational applications, future studies need prospective validation, predefined anomaly windows, independent test events, systematic non-event periods, explicit false-alarm reporting, uncertainty-aware outputs, and stronger cross-regional evaluation. They also need consistent control of solar and geomagnetic forcing and comparisons with simpler baseline models. These requirements are essential because an operational system must perform not only when a known earthquake is examined retrospectively, but also when no earthquake occurs and the ionosphere remains naturally variable.
Overall, the corpus should not be presented as evidence for deterministic earthquake prediction. Its real contribution is more defensible and scientifically stronger: it shows a transition toward more sophisticated systems for monitoring, anomaly detection, classification, TEC forecasting, coseismic disturbance detection, and multiparameter analysis of ionospheric signals associated with seismic activity.

4. Discussion

This mapping review shows that research on artificial intelligence, TEC, and earthquake-related seismo-ionospheric analysis has expanded markedly in recent years, but the field remains methodologically heterogeneous and geographically concentrated. The final corpus of 56 studies reveals a coherent conceptual backbone organized around ionosphere, TEC, GPS-TEC, earthquakes, precursors, anomaly detection, prediction-related terminology, and machine learning. However, this semantic coherence does not imply methodological standardization. Across the reviewed studies, TEC anomalies are defined through different statistical thresholds, residuals, forecast errors, uncertainty bounds, classifier labels, and multiparameter coherence rules. Consequently, the field has reached a stage in which its conceptual vocabulary is relatively stable, but its operational definitions, validation strategies, and interpretive standards remain uneven.
Prior reviews provide complementary perspectives that help contextualize this pattern. Mechanism-oriented syntheses have emphasized lithosphere–atmosphere–ionosphere coupling and the plausibility of earthquake-related precursor processes [27,28]. Observation-centered reviews have consolidated evidence on coseismic and hazard-driven ionospheric signatures and their detectability through GNSS-derived TEC [16,26], whereas broader remote sensing overviews have placed ionospheric disturbances alongside other earthquake-related satellite observables [25]. Machine learning-oriented reviews and surveys in related GNSS and ionospheric domains further show how algorithmic methods can be incorporated into disturbance detection, prediction, and classification workflows [29,30,31]. Building on these perspectives, the present review contributes by mapping how artificial intelligence and computational intelligence methods are operationalized specifically in earthquake-related studies that use TEC, and by identifying the methodological conditions that determine whether such studies support exploratory analysis, monitoring-oriented interpretation, or stronger claims of generalization.

4.1. Field Maturity Versus Methodological Standardization

The temporal pattern described in Section 3.2.1 indicates that the field is shaped more by recent acceleration than by gradual accumulation. Annual production remained sparse between 2011 and 2021, but increased sharply from 2022 onward, with 11 studies in each year from 2022 to 2024. This recent concentration is important because rapid expansion can create the appearance of maturity while the field is still consolidating its definitions, validation practices, and reporting standards. Earlier reviews were not designed to quantify this acceleration using a database-defined corpus, as their primary aim was usually narrative consolidation of mechanisms, signatures, or observational modalities [16,25,26,27]. The present results therefore show that the field is not only growing, but also diversifying in its computational strategies, ranging from classical anomaly detection and early computational intelligence to deep learning, graph-based models, uncertainty-aware forecasting, and near-real-time monitoring frameworks. The apparent decline in 2025 should be interpreted cautiously, because recent records may be affected by publication timing, indexing delays, and database update cycles rather than by a definitive contraction of the field.
The coexistence of rapid expansion and methodological dispersion raises a deeper question about how maturity should be defined in this field. Conceptual stability is necessary but insufficient. A field can share a vocabulary without sharing reporting conventions, anomaly criteria, validation logic, or benchmarking practices. In such a state, citation counts and publication volume grow faster than cumulative comparability. The risk is that thematic coherence may be mistaken for methodological consensus, leading external readers, policy actors, and adjacent communities to overestimate how settled the operational claims of the field actually are. The keyword backbone documented in Section 3.2.5 (ionosphere, earthquake, TEC, GPS-TEC, time, precursors, anomaly detection, machine learning, deep learning) is consistent with broader remote sensing and ionospheric seismology reviews [16,25,26], but the present synthesis shows that, within the AI-oriented TEC literature, these shared terms are realized through highly heterogeneous experimental designs. Recognizing this gap is, in our view, the precondition for any cumulative progress agenda.

4.2. Epistemic Implications of the Shift Toward Learned Decision Systems

The transition from threshold-based detection to learned decision systems, documented in Section 3.3.1, has implications beyond methodological diversification. It signals a change in the epistemic status of a TEC anomaly. Under threshold-based logic, an anomaly is a statistical fact: the observed value crossed a predefined bound. Under decision-system logic, an anomaly is a model-mediated inference: it depends on the learned representation of expected behavior, the input features, the training distribution, and the loss function. This shift creates new opportunities, because models can capture nonlinear and multivariate structure invisible to thresholds. But it also introduces new failure modes that the field has not yet collectively addressed: representation bias, distributional shift across regions and solar cycles, and overfitting to small event samples.
This change of epistemic status reframes the central interpretive challenge of the field: anomaly detection and anomaly attribution are not equivalent. TEC is influenced by solar activity, geomagnetic storms, local time, season, latitude, solar cycle phase, and regional ionospheric dynamics. Therefore, an anomalous TEC value near an earthquake cannot be interpreted as potentially seismic unless non-seismic drivers are explicitly considered. The most rigorous studies in the corpus address this by embedding standard space-weather indices into the model itself, either as filters, as direct inputs, or as class-defining variables. This is a meaningful methodological advance because it moves confounding control from a descriptive post hoc check toward the analytical structure of inference. At the same time, the uneven application of these controls across the corpus remains a major source of non-comparability and weakens the credibility of attribution claims in studies where confounding is only partially handled.
A further epistemic consequence concerns model interpretability. Once anomalies become model-mediated inferences, the question of why a model flagged a particular event becomes geophysically meaningful, not merely computational. Yet, as discussed in Section 3.3.8, explicit explainability tools remain rare in the corpus. In a field that aspires to operational monitoring, this absence is consequential: an unexplained detection cannot be audited by domain experts, cannot be challenged on physical grounds, and cannot easily be ruled out as an artifact of representation or sampling. Interpretability is therefore not an optional refinement, but a necessary condition for the integration of AI-based TEC analysis into credible monitoring workflows.

4.3. Geographic Concentration and Its Consequences for Transferability

The geographic and institutional findings in Section 3.2.2 show that scientific production is concentrated in a limited set of recurrent hubs. Under the affiliation-country counting logic adopted here, China, Turkey, Iran, Pakistan, India, Egypt, Israel, Italy, Thailand, and a smaller group of additional countries structure the country-level distribution. The affiliation profile in Section 3.2.3 reinforces this interpretation, and the venue profile in Section 3.2.4 shows that dissemination is concentrated in a small group of journals, especially Advances in Space Research and Remote Sensing.
This concentration has interpretive consequences that go beyond bibliometric description. Many studies are anchored in seismic regions and GNSS infrastructures located in middle and lower-middle northern latitudes. The resulting evidence may therefore be biased toward four overlapping factors: the represented earthquakes, the available receiver geometries, the sampled ionospheric regimes, and the dominant latitude bands. As a consequence, equatorial regions, where the Equatorial Ionization Anomaly strongly modulates TEC variability, and high-latitude regions, where geomagnetic forcing exhibits distinct signatures, remain comparatively underrepresented. Reported model performance may therefore not transfer directly to regions with different GNSS density, geomagnetic latitude, space-weather exposure, seismic mechanisms, or background ionospheric variability.
The implications extend further. Preprocessing conventions, anomaly thresholds, reference windows, and choices of confounding control are not neutral methodological decisions: they are partly shaped by the ionospheric environments and GNSS networks where the contributing groups operate. When such conventions circulate as if they were universal, the field risks treating regionally-tuned procedures as transferable standards. Addressing this requires deliberate cross-regional validation, benchmark datasets that span multiple latitude bands, GNSS network configurations, and tectonic settings, and a more explicit acknowledgment in individual studies of the ionospheric and infrastructural conditions under which their claims are expected to hold.

4.4. The Validation–Modeling Gap

A persistent tension in the corpus is the asymmetric development between modeling sophistication and validation practice. Recent studies adopt advanced architectures (LSTM, Bi-LSTM, CNN, ConvMixer, graph neural networks, Bayesian LSTM, autoencoders, tree ensembles) and increasingly rich TEC representations (Section 3.3.7). Yet many of these models continue to be evaluated under retrospective event-centered designs: a known earthquake is selected, and TEC anomalies are searched for in windows before, during, or after rupture. Such designs are useful for hypothesis generation and method illustration, but they do not fully address false alarms, negative cases, periods without seismicity, or transfer to independent events.
The structural problem is that the modeling culture of the field has advanced faster than its validation culture. Studies adopt sophisticated representations and learning algorithms, but they often validate them using designs originally developed for descriptive precursor analysis. This mismatch produces a recognizable pattern: high reported performance under retrospective conditions, combined with limited evidence about how the same model would behave under streaming operation, in regions different from the training area, or across full solar cycles. Stronger designs already documented in the corpus, such as non-seismic control periods, event-wise temporal splits, cross-validation, multi-year evaluation, explicit reporting of missed detections and false alarms, and comparisons with classical baselines or empirical ionospheric models, point toward the alternative. Table 4 summarizes these strategies. The methodological priority for the field is therefore not the adoption of further architectures, but the systematic application of these validation practices to the architectures already in use.
Publication and reporting bias may further amplify the validation–modeling gap. A literature dominated by successful detections, positive anomaly reports, or high classification performance can make the field appear more mature and more predictive than it actually is. Conversely, null results, ambiguous cases, failed detections, and unsuccessful transfer to new regions or non-event periods are less visible in the published corpus. This imbalance limits the ability to estimate the true reliability, false-alarm behavior, and generalizability of AI-based TEC methods. Future studies should therefore report not only successful detections but also null periods, missed detections, negative controls, failed cases, and cases in which candidate TEC anomalies were rejected after solar, geomagnetic, or validation checks.
Uncertainty-aware reporting belongs to the same agenda. A useful monitoring system should not only flag a deviation; it should estimate how strong the deviation is, how robust it is under exogenous ionospheric drivers, and how likely it is to represent a spurious detection. Bayesian and hybrid LSTM approaches that introduce confidence intervals, dynamic bounds, and anomaly-intensity outputs are early but important steps in this direction. Without such outputs, binary anomaly labels cannot meaningfully support operational decisions in a naturally variable ionosphere.

4.5. Operational Reframing: From Prediction to Monitoring

The corpus contains a distinct strand of work that addresses some of the tensions discussed above by redefining the operational target. Preseismic precursor studies attempt to identify signals before rupture, whereas coseismic and post-event monitoring aims to detect ionospheric responses to events that have already occurred. The latter can be linked more directly to acoustic waves, acoustic-gravity waves, traveling ionospheric disturbances, and tsunami-related perturbations. Studies using VARION, GUARDIAN, sparse GNSS networks, deep learning detection, and source geolocation suggest that TEC may provide a complementary observational layer for rapid monitoring, especially over oceans or regions with limited ground instrumentation. This is one of the most application-relevant directions in the corpus because it does not require claiming that earthquakes can be predicted deterministically before rupture. Nevertheless, the current evidence should be interpreted as monitoring-oriented and, in several cases, simulated near-real-time research rather than as proof of operational readiness. Demonstrating operational readiness would require prospective evaluation under real monitoring conditions, with predefined detection rules, latency constraints, missing-data handling, variable network geometry, and systematic reporting of false detections and missed events.
This interpretation is reinforced by complementary studies that shift the analytical target from deterministic earthquake prediction to rapid detection of ionospheric responses after rupture. One study showed that Random Forest models can support automatic CID classification, arrival-time picking, and association across satellite networks in a near-real-time framework [17]. Another study demonstrated a VARION-based machine learning workflow for detecting TEC signatures associated with the 2015 Illapel earthquake and tsunami [31]. Together, these studies support one of the most application-relevant directions of the field: using GNSS-TEC as a complementary monitoring layer for coseismic and tsunami-related disturbances rather than as a stand-alone earthquake prediction tool.
The operational reframing also has communicative implications. Public expectations around earthquake science are highly sensitive to the language of prediction, and the rhetorical drift from “anomaly detection” to “earthquake prediction” in some study framings is a concrete risk for the field. A monitoring framing is both scientifically more defensible and easier to integrate with existing hazard-response infrastructures, because it positions TEC-based AI as a complement to, rather than a replacement for, seismic and tsunami warning systems. The LAIC-oriented multiprecursor studies further support this framing, but only when they meet a strict condition: the value of cross-layer evidence depends on whether variables from different layers of the Earth system show temporal, spatial, and physical coherence around the seismic event, evaluated under explicit confounding control. Accumulating variables without this discipline increases complexity without improving interpretation.

4.6. The Strongest Defensible Claim of the Field

The strongest claim supported by the evidence is specific and scientifically defensible: AI and computational intelligence methods can learn patterns in TEC and related variables that are associated with selected seismic, coseismic, or tsunami-related contexts. These methods can support TEC forecasting, anomaly detection, classification of precursor-like periods, discrimination between seismic and non-seismic states, multiparameter interpretation, and near-real-time disturbance monitoring. However, moving from retrospective association to operational earthquake prediction would require prospective validation, predefined anomaly windows, independent test events, systematic non-event periods, explicit reporting of spurious detections, uncertainty-aware outputs, cross-regional evaluation, and consistent control of exogenous ionospheric drivers. Thus, the main contribution of the field lies not in deterministic prediction, but in the progressive development of decision-support systems for interpreting ionospheric variability in earthquake-related contexts.

4.7. Limitations of This Review

Several limitations follow from the review design described in Section 2. First, the search covered only Scopus and Web of Science and was executed on 30 April 2026. The resulting corpus is therefore a database- and time-specific snapshot, not an exhaustive inventory. Eligibility filters reinforce this constraint. Only English-language journal articles were retained. Conference papers, proceeding papers, reviews, book chapters, editorials, commentaries, perspectives, and errata were excluded as non-primary contributions.
Second, this manuscript reports a mapping review rather than a registered systematic review with a preregistered protocol. The review was not registered in a public registry before screening; therefore, readers cannot compare the final workflow against a preregistered plan. To improve transparency and auditability, Supplementary File S2 provides the review objective, data sources, search date, search logic, eligibility criteria, screening workflow, extraction fields, bibliometric procedures, mapping synthesis strategy, and a descriptive extraction matrix with study-level methodological feature fields. In addition, because the review aimed to map methodological and analytical patterns rather than estimate intervention effects or synthesize effect sizes, no formal risk-of-bias tool was applied.
Third, the search strategy depended on the coverage and indexing practices of Scopus and Web of Science. Although the four-block search equation was designed to retrieve studies combining TEC, earthquake-related scope, and artificial intelligence or computational intelligence methods, relevant articles may have been missed if their titles, abstracts, or indexed keywords did not use the target terminology. Conversely, the eligibility process required full-text assessment because some records retrieved by the search equation did not operationally use TEC, did not apply AI/ML/DL directly to TEC or TEC-containing models, or did not include a substantive earthquake-related seismo-ionospheric component.
Fourth, bibliometric indicators depend on metadata quality and standardization decisions. Country production was calculated from country occurrences in author affiliations using full counting, so the frequencies represent affiliation-country occurrences rather than unique articles per country. During country-name standardization, Taiwan was harmonized under China for country-level bibliometric production and collaboration indicators. This decision improves consistency in the country-level analysis but should be considered when interpreting country frequencies and when comparing them with affiliation-level results, where institutional names and locations were preserved descriptively.
Fifth, science mapping outputs depend on indexed terms and keyword normalization. The keyword frequency analysis, word cloud, co-occurrence network, and thematic map were based on the combined keyword set available in the bibliographic metadata. This approach supports consistent corpus-level mapping, but it can propagate inconsistencies in author keyword choices, index-derived descriptors, spelling variants, abbreviations, and partial term normalization. Consequently, semantic proximity in the co-occurrence network and thematic map should be interpreted as a descriptive organization of term usage rather than as evidence that studies sharing terms use equivalent methodological designs.
Sixth, although the article-level synthesis covered the full corpus of 56 studies, the depth and comparability of extracted information depended on the reporting quality of each article. Some studies provided detailed descriptions of anomaly definitions, model inputs, validation settings, performance metrics, false-alarm handling, and geomagnetic or solar controls, whereas others reported these elements only partially. As a result, the synthesis could identify methodological patterns and gaps, but it could not standardize all pipelines retrospectively or recalculate performance under common benchmarks.
A further limitation concerns possible publication bias. Studies reporting successful detection of TEC anomalies or precursor-like patterns may be more likely to be published than studies reporting null, ambiguous, or unsuccessful detections. This may inflate the apparent effectiveness of TEC-based AI methods and may contribute to an overly optimistic perception of the field. Therefore, the concentration of positive anomaly reports should not be interpreted as evidence of operational predictive reliability unless prospective validation, non-event periods, and explicit reporting of spurious detections are systematically included.
Finally, reproducibility of the mapping workflow is partially constrained by data access and reporting limits. While the minimally processed dataset used for mapping is shared as Supplementary Materials, raw bibliographic exports and extended metadata may be restricted by database access and licensing conditions. This limits full external re-execution of the complete bibliometric workflow from the original exports, although the reported counts, search date, filters, eligibility criteria, and workflow steps support auditability at the level of decisions and transformations.

4.8. Future Perspectives for Artificial Intelligence with TEC in Seismo-Ionospheric Analysis

The mapped evidence base supports a research agenda focused on comparability, physical and model interpretability, uncertainty-aware outputs, and validation under monitoring-like conditions. A first priority is the operational standardization of anomaly definitions and baselines. The synthesis shows that TEC anomalies are defined through median and IQR bounds, standard deviation thresholds, Kalman filtering, ARIMA residuals, forecast errors, reconstruction errors, confidence bands, anomaly intensity, and classifier labels. Future studies should specify anomaly criteria in replicable form, justify reference windows and thresholds, and report baseline performance under matched conditions so that improvements attributed to AI can be separated from preprocessing, detrending, windowing, and threshold choices.
A related methodological issue concerns spatial mapping and interpolation in TEC-based anomaly analysis. Although the final corpus was not expanded beyond the predefined eligibility criteria, established TEC mapping studies provide important contextual baselines for interpreting AI-based spatial representations. Prior work has compared interpolation and surface-fitting approaches such as polynomial surfaces, Kriging, radial basis functions, thin plate splines, natural-neighbor interpolation, and regional harmonic modeling for VTEC or TEC anomaly mapping. These studies show that the choice of interpolation or reconstruction method can affect the resulting TEC surface, anomaly intensity, spatial localization, and comparison with reference ionospheric products. Therefore, future AI-assisted TEC studies that operate on TEC maps, gridded TEC products, TEC images, or spatial anomaly fields should explicitly report the mapping or interpolation procedure used before model training or inference and, when possible, compare AI-based spatial representations against established interpolation or reconstruction baselines under matched spatial resolution, validation protocol, and performance metrics [109,110,111,112,113,114].
A second priority is stronger validation design. Future studies should move beyond retrospective event-centered analysis by adopting event-wise temporal splits, external regional validation, predefined anomaly windows, independent test events, systematic non-event periods, and explicit reporting of missed detections and false alarms. This is especially important because the keyword backbone of the field emphasizes prediction, anomaly detection, and classification, yet these terms currently correspond to heterogeneous experimental designs that are not directly comparable. Validation should also become more explicitly distance-dependent by reporting epicentral distance criteria, receiver–epicenter geometry, ionospheric pierce-point distribution, the spatial domain used to define candidate earthquake-related TEC disturbances, and, when available, the spatial decay of anomaly intensity. Spatial plausibility frameworks, such as the Dobrovolsky radius when appropriate, may provide useful contextual criteria, but they should be combined with empirical validation against non-event periods, geomagnetically disturbed intervals, and independent regional test cases.
A third priority is the integration of confounding control into model design and interpretation. Space-weather variables such as Dst, Kp, Ap, F10.7, solar wind speed, geomagnetic storm indicators, and sunspot number should be treated as first-class components of the inference chain rather than optional post hoc checks. Future pipelines should report how each control affects anomaly prevalence, model decisions, class assignments, and false-alarm behavior. This would help align physical interpretation with operational decisions and reduce ambiguity when non-seismic forcing is active. Beyond these standard indices, future studies should also account for more complex sources of ionospheric variability, including substorm-related disturbances, equatorial ionization anomaly dynamics, seasonal effects, local-time dependence, and geomagnetic-latitude effects. These factors should not be treated as secondary background noise, because they can generate TEC structures that resemble candidate earthquake-related anomalies and may therefore increase the risk of false alarms if not explicitly modeled or controlled.
A fourth priority concerns model interpretability and explainable artificial intelligence (XAI). Future studies should incorporate explainability tools, including feature-importance analysis, SHAP, LIME, saliency maps, Grad-CAM, attention visualization, ablation analysis, and sensitivity tests, particularly when using deep learning or multichannel TEC representations. In this field, XAI is not only a computational refinement, but a requirement for linking model outputs with geophysical interpretation and operational credibility.
A fifth priority is uncertainty-aware and risk-aware reporting. Future models should not only classify anomalies or forecast TEC, but also communicate uncertainty, anomaly intensity, confidence bounds, and the risk of spurious detection. These outputs are necessary for any monitoring-oriented system because a binary anomalous/non-anomalous label is insufficient in a naturally variable ionosphere. Reporting uncertainty would also make it easier to distinguish weak deviations from strong candidate disturbances and to compare models under common decision thresholds.
A sixth priority is operational testing under near-real-time constraints. The studies using VARION, GUARDIAN, sparse GNSS networks, and deep learning anomaly detection show that TEC may contribute to rapid monitoring of coseismic or tsunami-related ionospheric disturbances. Future work should test these approaches under realistic streaming conditions, including missing data, station dropout, variable network geometry, local time effects, preprocessing latency, and degraded signal quality. Such testing should also evaluate performance across different earthquake magnitudes, source depths, focal mechanisms or rupture styles, tsunamigenic potential, and source–receiver geometries, because the detectability of coseismic ionospheric disturbances may vary with source strength, rupture dynamics, and propagation geometry. This direction is particularly promising because it frames TEC as a complementary monitoring layer rather than as a deterministic earthquake prediction tool.
Future AI-based seismo-ionospheric studies could also explore whether complementary ionospheric sounding observations, such as low-frequency spaceborne polarimetric SAR or Faraday-rotation-derived information, can be integrated with GNSS-derived TEC to improve the spatial characterization of ionospheric disturbances.
A final priority concerns transparency and cumulative evidence. Future studies should provide complete and internally consistent descriptions of training, validation, and testing periods; deterministic sampling rules where applicable; model hyperparameters; preprocessing steps; anomaly definitions; and access to code or reproducible artifacts when licensing permits. The field already shows semantic coherence and increasing methodological sophistication. Its next stage should focus on shared benchmarks, transferable validation designs, and reporting standards that allow results to accumulate across regions, events, models, and observational conditions.

5. Conclusions

This mapping review examined how artificial intelligence and computational intelligence methods are used with TEC in earthquake-related seismo-ionospheric studies. Based on a final corpus of 56 English-language journal articles retrieved from Scopus and Web of Science, the review shows that the field has expanded markedly since 2022 and is organized around a coherent conceptual core linking ionosphere, TEC, GPS-TEC, earthquakes, precursors, anomaly detection, prediction-related terminology, and machine learning. However, this conceptual coherence does not imply methodological standardization. The evidence base remains geographically and institutionally concentrated, and the reviewed studies differ substantially in how they define anomalies, represent TEC, control confounding factors, validate models, and interpret earthquake-related signals.
A central finding is that the field is moving from classical TEC anomaly detection toward AI-assisted decision systems. Earlier approaches mainly identified deviations from reference TEC states using median, IQR, standard deviation thresholds, Kalman filtering, ARIMA, or related procedures. More recent studies increasingly use machine learning, deep learning, hybrid models, graph-based methods, and other computational intelligence approaches to forecast expected TEC behavior, classify ionospheric states, detect precursor-like patterns, estimate anomaly intensity, or support monitoring-oriented decisions. This transition changes the analytical target of the field: the question is no longer only whether TEC deviates from a background level, but whether that deviation can be interpreted within a broader geophysical, statistical, and operational context.
The synthesis also shows that solar and geomagnetic confounding is one of the most important methodological issues in this literature. TEC is highly sensitive to non-seismic drivers: solar activity, geomagnetic storms, local time, season, latitude, and regional ionospheric dynamics. The most rigorous studies handle these through standard space-weather indices, using them as filters, as model inputs, or as class-defining variables. Nevertheless, these controls are not applied uniformly across the corpus, which limits comparability and weakens claims of physical interpretation in studies where confounding is only partially addressed.
Another major finding is that the field is still transitioning from retrospective event-centered studies toward more systematic validation. Many studies examine known earthquakes and search for TEC anomalies within predefined temporal windows, which is useful for hypothesis generation but insufficient for demonstrating generalizability. Stronger contributions include non-seismic periods, control intervals, training–validation-test partitions, cross-validation, long-term series, baseline comparisons, false-alarm reporting, and uncertainty-aware anomaly definitions. These practices are essential because a method intended for monitoring must perform not only when a known earthquake is examined retrospectively, but also when no earthquake occurs and the ionosphere remains naturally variable.
The review further identifies two important directions of methodological maturation. First, several studies now move beyond binary anomaly labeling by incorporating predictive bounds, confidence intervals, anomaly intensity, residual magnitude, and false-alarm evaluation. Second, TEC is increasingly represented through richer data structures, including images, time–frequency maps, GADF images, GIM grids, three-dimensional matrices, graph-based representations, tomographic reconstructions, multichannel inputs, and near-real-time TEC streams. These representations allow models to capture temporal, spatial, spectral, vertical, and relational patterns that classical thresholding cannot represent. However, richer representations and more complex models do not automatically guarantee physical interpretability or transferability; their value depends on validation design, baseline comparison, confounding control, and transparent reporting. Explicit XAI reporting should therefore become part of the minimum methodological expectations for future AI-TEC studies, particularly when models are intended to support earthquake-related monitoring or decision-making.
The corpus also shows that TEC-based AI research should not be framed only around earthquake prediction. A distinct and scientifically defensible strand focuses on near-real-time detection of coseismic, postevent, and tsunami-related ionospheric disturbances. This operational orientation is especially relevant for sparse or oceanic monitoring contexts, where GNSS-TEC observations may complement conventional networks. In parallel, multiprecursor LAIC-oriented studies strengthen physical plausibility by combining TEC with atmospheric, surface, ionospheric, satellite-derived, or geochemical variables. Such integration can support interpretation when signals are temporally synchronized, spatially consistent, and evaluated under explicit solar and geomagnetic controls, but it does not by itself prove causality.
Overall, this review does not support the conclusion that TEC or AI can currently predict earthquakes in a deterministic, prospective, and generalizable manner. The strongest evidence supports a more cautious and scientifically defensible interpretation: artificial intelligence can help model TEC behavior, detect anomalous ionospheric patterns, classify precursor-like or disturbance-related states, integrate multiparameter evidence, and support monitoring of earthquake- or tsunami-induced ionospheric disturbances.
Therefore, the main priorities for future AI-assisted TEC studies can be summarized as follows: (1) inclusion of systematic non-seismic periods and control intervals; (2) prospective and cross-regional validation using predefined anomaly windows and independent test events; (3) explicit reporting of false alarms and missed detections; (4) uncertainty-aware outputs for TEC forecasting and anomaly assessment; (5) integration of explainable artificial intelligence tools; and (6) consistent control of solar, geomagnetic, seasonal, local-time, and latitude-dependent ionospheric variability.
By summarizing these methodological requirements, this review provides a structured basis for a more cumulative, transparent, and operationally credible research agenda in AI-assisted TEC analysis for earthquake-related seismo-ionospheric studies.

Supplementary Materials

The following supporting information can be downloaded at https://www.mdpi.com/article/10.3390/geomatics6040074/s1, File S1: Minimal processed CSV dataset used to support the bibliometric and mapping review analyses; File S2: XLSX file containing the supplementary review protocol and descriptive data-extraction matrix with study-level methodological feature fields.

Author Contributions

Conceptualization, F.D.; methodology, F.D. and N.C.; software, F.D. and N.C.; validation, R.L. and B.M.; formal analysis, F.D., R.L. and B.M.; investigation, F.D., R.L., N.C. and B.M.; resources, N.C. and B.M.; data curation, F.D. and R.L.; writing—original draft preparation, F.D., N.C. and B.M.; writing—review and editing, F.D. and R.L.; visualization, N.C. and B.M.; supervision, F.D. and N.C.; project administration, F.D. All authors have read and agreed to the published version of the manuscript.

Funding

This research received no external funding.

Data Availability Statement

The minimal processed dataset used to support the bibliometric and mapping analyses is provided in the Supplementary Materials (File S1, CSV). A supplementary review protocol and descriptive data-extraction matrix are provided as Supplementary File S2 (XLSX). File S1 contains curated bibliographic descriptors derived from the merged and deduplicated corpus generated in RStudio using bibliometrix from Scopus and Web of Science exports. Raw bibliographic exports and extended metadata are not publicly shared due to database access and licensing restrictions.

Conflicts of Interest

The authors declare no conflicts of interest.

Abbreviations

The following abbreviations are used in this manuscript:
ACOAnt Colony Optimization
AIArtificial Intelligence
ANNArtificial Neural Network
ANFISAdaptive Neuro-Fuzzy Inference System
ApPlanetary geomagnetic index
ARIMAAutoregressive Integrated Moving Average
ATAir Temperature
Bi-LSTMBidirectional Long Short-Term Memory
BPNNBack-Propagation Neural Network
CNNConvolutional Neural Network
CWTContinuous Wavelet Transform
DLDeep Learning
DstDisturbance Storm Time index
EIAEquatorial Ionization Anomaly
F10.710.7 cm Solar Radio Flux
GADFGramian Angular Difference Field
GIMGlobal Ionospheric Map
GIM-TECGlobal Ionospheric Map Total Electron Content
GNSSGlobal Navigation Satellite System
GPSGlobal Positioning System
GPS-TECGlobal Positioning System Total Electron Content
GRUGated Recurrent Unit
IQRInterquartile Range
IRIInternational Reference Ionosphere
KNNK-Nearest Neighbors
KpPlanetary K-index
LAICLithosphere–Atmosphere–Ionosphere Coupling
LSTMLong Short-Term Memory
LSTLand Surface Temperature
MLMachine Learning
MLPMultilayer Perceptron
MODISModerate Resolution Imaging Spectroradiometer
NARXNonlinear Autoregressive Network with Exogenous Inputs
NeElectron Density
OLROutgoing Longwave Radiation
PSOParticle Swarm Optimization
RHRelative Humidity
RMTNNRadio Tomography Neural Network
RNNRecurrent Neural Network
STECSlant Total Electron Content
STDEVStandard Deviation
SSTSea Surface Temperature
SVMSupport Vector Machine
SVRSupport Vector Regression
TECTotal Electron Content
TeElectron Temperature
VARIONVariometric Approach for Real-Time Ionosphere Observation
VLF/LFVery Low Frequency/Low Frequency
VTECVertical Total Electron Content
XAIExplainable Artificial Intelligence

References

  1. Zhang, Q.; Zhao, Q. Global Ionosphere Mapping and Differential Code Bias Estimation during Low and High Solar Activity Periods with GIMAS Software. Remote Sens. 2018, 10, 705. [Google Scholar] [CrossRef] [Scilit]
  2. Erdogan, E.; Schmidt, M.; Goss, A.; Görres, B.; Seitz, F. Real-Time Monitoring of Ionosphere VTEC Using Multi-GNSS Carrier-Phase Observations and B-Splines. Space Weather 2021, 19, e2021SW002858. [Google Scholar] [CrossRef] [Scilit]
  3. Wielgosz, P.; Milanowska, B.; Krypiak-Gregorczyk, A.; Jarmołowski, W. Validation of GNSS-derived global ionosphere maps for different solar activity levels: Case studies for years 2014 and 2018. GPS Solut. 2021, 25, 103. [Google Scholar] [CrossRef] [Scilit]
  4. Brack, A.; Männel, B.; Wickert, J.; Schuh, H. Operational Multi-GNSS Global Ionosphere Maps at GFZ Derived from Uncombined Code and Phase Observations. Radio Sci. 2021, 56, e2021RS007337. [Google Scholar] [CrossRef] [Scilit]
  5. Park, J.; Lühr, H.; Kervalishvili, G.; Rauberg, J.; Stolle, C.; Kwak, Y.S.; Lee, W.K. Morphology of high-latitude plasma density perturbations as deduced from the total electron content measurements onboard the Swarm constellation. J. Geophys. Res. Space Phys. 2017, 122, 1338–1359. [Google Scholar] [CrossRef] [Scilit]
  6. Bergeot, N.; Chevalier, J.M.; Bruyninx, C.; Pottiaux, E.; Aerts, W.; Baire, Q.; Legrand, J.; Defraigne, P.; Huang, W. Near real-time ionospheric monitoring over Europe at the Royal Observatory of Belgium using GNSS data. J. Space Weather Space Clim. 2014, 4, A31. [Google Scholar] [CrossRef] [Scilit]
  7. Sezen, U.; Arikan, F.; Arikan, O.; Ugurlu, O.; Sadeghimorad, A. Online, automatic, near-real time estimation of GPS-TEC: IONOLAB-TEC. Space Weather 2013, 11, 297–305. [Google Scholar] [CrossRef] [Scilit]
  8. Jin, X.; Song, S. Near real-time global ionospheric total electron content modeling and nowcasting based on GNSS observations. J. Geod. 2023, 97, 27. [Google Scholar] [CrossRef] [Scilit]
  9. Guo, W.; Wang, C.; Zhao, H.; Zhang, S.; Cao, L.; Xiao, P.; Liu, L.; Chen, L.; Zhang, Y. Ionospheric Sounding Based on Spaceborne PolSAR in P-Band. Atmosphere 2022, 13, 524. [Google Scholar] [CrossRef] [Scilit]
  10. Wang, X.; Zhang, Y.; Li, D. Estimation of ionospheric Faraday rotation over ocean areas using L-band spaceborne PolSAR data. Int. J. Remote Sens. 2024, 45, 3054–3074. [Google Scholar] [CrossRef] [Scilit]
  11. Galvan, D.A.; Komjathy, A.; Hickey, M.P.; Stephens, P.; Snively, J.; Tony Song, Y.; Butala, M.D.; Mannucci, A.J. Ionospheric signatures of Tohoku-Oki tsunami of March 11, 2011: Model comparisons near the epicenter. Radio Sci. 2012, 47, RS4003. [Google Scholar] [CrossRef] [Scilit]
  12. Occhipinti, G.; Rolland, L.; Lognonné, P.; Watada, S. From Sumatra 2004 to Tohoku-Oki 2011: The systematic GPS detection of the ionospheric signature induced by tsunamigenic earthquakes. J. Geophys. Res. Space Phys. 2013, 118, 3626–3636. [Google Scholar] [CrossRef] [Scilit]
  13. Komjathy, A.; Galvan, D.A.; Stephens, P.; Butala, M.D.; Akopian, V.; Wilson, B.; Verkhoglyadova, O.; Mannucci, A.J.; Hickey, M. Detecting ionospheric TEC perturbations caused by natural hazards using a global network of GPS receivers: The Tohoku case study. Earth Planets Space 2012, 64, 1287–1294. [Google Scholar] [CrossRef] [Scilit]
  14. Tsugawa, T.; Saito, A.; Otsuka, Y.; Nishioka, M.; Maruyama, T.; Kato, H.; Nagatsuma, T.; Murata, K.T. Ionospheric disturbances detected by GPS total electron content observation after the 2011 off the Pacific coast of Tohoku Earthquake. Earth Planets Space 2011, 63, 66. [Google Scholar] [CrossRef] [Scilit]
  15. Astafyeva, E.; Lognonné, P.; Rolland, L. First ionospheric images of the seismic fault slip on the example of the Tohoku-oki earthquake. Geophys. Res. Lett. 2011, 38, L22104. [Google Scholar] [CrossRef] [Scilit]
  16. Jin, S.; Occhipinti, G.; Jin, R. GNSS ionospheric seismology: Recent observation evidences and characteristics. Earth-Sci. Rev. 2015, 147, 54–64. [Google Scholar] [CrossRef] [Scilit]
  17. Brissaud, Q.; Astafyeva, E. Near-real-time detection of co-seismic ionospheric disturbances using machine learning. Geophys. J. Int. 2022, 230, 2117–2130. [Google Scholar] [CrossRef] [Scilit]
  18. Pulinets, S.; Ouzounov, D. Lithosphere–Atmosphere–Ionosphere Coupling (LAIC) model—An unified concept for earthquake precursors validation. J. Asian Earth Sci. 2011, 41, 371–382. [Google Scholar] [CrossRef] [Scilit]
  19. Asaly, S.; Gottlieb, L.A.; Inbar, N.; Reuveni, Y. Using Support Vector Machine (SVM) with GPS Ionospheric TEC Estimations to Potentially Predict Earthquake Events. Remote Sens. 2022, 14, 2822. [Google Scholar] [CrossRef] [Scilit]
  20. Akhoondzadeh, M. A MLP neural network as an investigator of TEC time series to detect seismo-ionospheric anomalies. Adv. Space Res. 2013, 51, 2048–2057. [Google Scholar] [CrossRef] [Scilit]
  21. Akhoondzadeh, M. Support vector machines for TEC seismo-ionospheric anomalies detection. Ann. Geophys. 2013, 31, 173–186. [Google Scholar] [CrossRef] [Scilit]
  22. Akyol, A.A.; Arikan, O.; Arikan, F. A Machine Learning-Based Detection of Earthquake Precursors Using Ionospheric Data. Radio Sci. 2020, 55, e2019RS006931. [Google Scholar] [CrossRef] [Scilit]
  23. Xiong, P.; Long, C.; Zhou, H.; Zhang, X.; Shen, X. GNSS TEC-Based Earthquake Ionospheric Perturbation Detection Using a Novel Deep Learning Framework. IEEE J. Sel. Top. Appl. Earth Obs. Remote Sens. 2022, 15, 4248–4263. [Google Scholar] [CrossRef] [Scilit]
  24. Luhrmann, F.; Park, J.; Wong, W.K.; Martire, L.; Krishnamoorthy, S.; Komjáthy, A. Detection of ionospheric disturbances with a sparse GNSS network in simulated near-real time Mw 7.8 and Mw 7.5 Kahramanmaraş earthquake sequence. GPS Solut. 2025, 29, 54. [Google Scholar] [CrossRef] [Scilit] [PubMed]
  25. Tronin, A. Remote sensing and earthquakes: A review. Phys. Chem. Earth Parts A/B/C 2006, 31, 138–142. [Google Scholar] [CrossRef] [Scilit]
  26. Astafyeva, E. Ionospheric Detection of Natural Hazards. Rev. Geophys. 2019, 57, 1265–1288. [Google Scholar] [CrossRef] [Scilit]
  27. Pulinets, S.; Davidenko, D. Ionospheric precursors of earthquakes and Global Electric Circuit. Adv. Space Res. 2014, 53, 709–723. [Google Scholar] [CrossRef] [Scilit]
  28. Zulhamidi, N.F.I.; Abdullah, M.; Abdul Hamid, N.S.; Yusof, K.A.; Bahari, S.A. Investigating short-term earthquake precursors detection through monitoring of total electron content variation in ionosphere. Front. Astron. Space Sci. 2023, 10, 1166394. [Google Scholar] [CrossRef] [Scilit]
  29. Zhang, R.; Li, H.; Shen, Y.; Yang, J.; Li, W.; Zhao, D.; Hu, A. Deep Learning Applications in Ionospheric Modeling: Progress, Challenges, and Opportunities. Remote Sens. 2025, 17, 124. [Google Scholar] [CrossRef] [Scilit]
  30. Mohanty, A.; Gao, G. A survey of machine learning techniques for improving Global Navigation Satellite Systems. EURASIP J. Adv. Signal Process. 2024, 2024, 73. [Google Scholar] [CrossRef] [Scilit]
  31. Fuso, F.; Crocetti, L.; Ravanelli, M.; Soja, B. Machine learning-based detection of TEC signatures related to earthquakes and tsunamis: The 2015 Illapel case study. GPS Solut. 2024, 28, 106. [Google Scholar] [CrossRef] [Scilit]
  32. Akhoondzadeh, M. Earthquake prediction using satellite data: Advances and ahead challenges. Adv. Space Res. 2024, 74, 3539–3555. [Google Scholar] [CrossRef] [Scilit]
  33. Khalid, Z.; Shah, M.; Riaz, S.; Ghaffar, B.; Jamjareegulgarn, P. Atmospheric precursors associated with two Mw > 6.0 earthquakes using machine learning methods. Nat. Hazards 2024, 120, 7871–7895. [Google Scholar] [CrossRef] [Scilit]
  34. Shah, M.; Qureshi, R.U.; Khan, N.G.; Ehsan, M.; Yan, J. Artificial Neural Network based thermal anomalies associated with earthquakes in Pakistan from MODIS LST. J. Atmos. Sol.-Terr. Phys. 2021, 215, 105568. [Google Scholar] [CrossRef] [Scilit]
  35. Qasim, M.; Shah, M.; Shahzad, R.; Jamjareegulgarn, P. Atmospheric precursors from multiple satellites associated with the 2020 Mw 6.5 Idaho (USA) earthquake. Adv. Space Res. 2024, 73, 440–455. [Google Scholar] [CrossRef] [Scilit]
  36. Hafeez, A.; Ehsan, M.; Abbas, A.; Shah, M.; Shahzad, R. Machine learning-based thermal anomalies detection from MODIS LST associated with the Mw 7.7 Awaran, Pakistan earthquake. Nat. Hazards 2022, 111, 2097–2115. [Google Scholar] [CrossRef] [Scilit]
  37. Khan, M.M.; Ghaffar, B.; Shahzad, R.; Khan, M.R.; Shah, M.; Amin, A.H.; Eldin, S.M.; Naqvi, N.A.; Ali, R. Atmospheric Anomalies Associated with the 2021 Mw 7.2 Haiti Earthquake Using Machine Learning from Multiple Satellites. Sustainability 2022, 14, 14782. [Google Scholar] [CrossRef] [Scilit]
  38. Akhoondzadeh, M. Advances in Seismo-LAI anomalies detection within Google Earth Engine (GEE) cloud platform. Adv. Space Res. 2022, 69, 4351–4357. [Google Scholar] [CrossRef] [Scilit]
  39. Hayakawa, M.; Hirooka, S.; Michimoto, K.; Potirakis, S.M.; Hobara, Y. Meteorological Anomalies During Earthquake Preparation: A Case Study for the 1995 Kobe Earthquake (M = 7.3) Based on Statistical and Machine Learning-Based Analyses. Atmosphere 2025, 16, 88. [Google Scholar] [CrossRef] [Scilit]
  40. Zhou, C.; Wang, R.; Lou, W.; Liu, J.; Ni, B.; Deng, Z.; Zhao, Z. Preliminary investigation of real-time mapping of foF2 in northern China based on oblique ionosonde data. J. Geophys. Res. Space Phys. 2013, 118, 2536–2544. [Google Scholar] [CrossRef] [Scilit]
  41. Shi, S.; Sun, P.; Song, F.; Wu, H.; Shi, Y. Data-Driven Modeling of Storm-Time Total Electron Content Using the Random Forest and Deep Learning Methods. IEEE Trans. Geosci. Remote Sens. 2025, 63, 411011. [Google Scholar] [CrossRef] [Scilit]
  42. Swati; Gupta, P.; Dubey, N.; Agarwal, S.; Singh, D.; Pundhir, D. Performance analysis of IRI-2016 and IRI-2020 models, and GPS and GLONASS-TEC variations, and their predictions using Artificial Neural Networks (ANNs) at low latitude station Agra, India. J. Atmos. Sol.-Terr. Phys. 2025, 267, 106412. [Google Scholar] [CrossRef] [Scilit]
  43. Zhou, R.; Wu, Y.; Cai, J.; Liu, H.; Le, H.; Xiao, J.; Ma, Y. Spatiotemporal prediction of ionospheric TEC based on denoising wavelet transform convolution. GPS Solut. 2025, 29, 131. [Google Scholar] [CrossRef] [Scilit]
  44. Tang, J.; Ding, M.; Yang, D.; Fan, C.; Khonsari, N.; Mao, W. Different data-driven prediction of global ionospheric TEC using deep learning methods. Int. J. Appl. Earth Obs. Geoinf. 2024, 130, 103889. [Google Scholar] [CrossRef] [Scilit]
  45. Shakir, M.M.; Othman, Z.; Bakar, A.A. TEC Forecasting using Optimized Variational Mode Decomposition and Elman Neural Networks. Int. J. Adv. Comput. Sci. Appl. 2022, 13, 482–491. [Google Scholar] [CrossRef] [Scilit]
  46. Chen, Y.; Yue, D.; Zhai, C. Forecasting 3-dimensional ionospheric disturbances during Hurricane Matthew using ConvLSTM neural network. Astrophys. Space Sci. 2023, 368, 99. [Google Scholar] [CrossRef] [Scilit]
  47. Li, D.; Jin, Y.; Wu, F.; Zhao, J.; Min, P.; Luo, X. A hybrid model for TEC prediction using BiLSTM and PSO-LSSVM. Adv. Space Res. 2024, 74, 303–318. [Google Scholar] [CrossRef] [Scilit]
  48. Akyuz, B.; Karatay, S.; Erken, F. Comparison of the Performance of the Regression Models in GPS-Total Electron Content Prediction. J. Polytech. 2023, 26, 321–328. [Google Scholar] [CrossRef] [Scilit]
  49. Sadeghi, Z.; Mashhadi-Hossainali, M. Application of the T2-Hotelling test for investigating ionospheric anomalies before large earthquakes. J. Atmos. Sol.-Terr. Phys. 2019, 185, 7–21. [Google Scholar] [CrossRef] [Scilit]
  50. Mandrikova, O.V.; Fetisova (Glushkova), N.V.; Al-Kasasbeh, R.T.; Klionskiy, D.M.; Geppener, V.V.; Ilyash, M.Y. Ionospheric parameter modelling and anomaly discovery by combining the wavelet transform with autoregressive models. Ann. Geophys. 2015, 58, A0550. [Google Scholar] [CrossRef] [Scilit]
  51. Ouzounov, D.; Pulinets, S.; Davidenko, D.; Rozhnoi, A.; Solovieva, M.; Fedun, V.; Dwivedi, B.N.; Rybin, A.; Kafatos, M.; Taylor, P. Transient Effects in Atmosphere and Ionosphere Preceding the 2015 M7.8 and M7.3 Gorkha-Nepal Earthquakes. Front. Earth Sci. 2021, 9, 757358. [Google Scholar] [CrossRef] [Scilit]
  52. Catherine, J.K.; Maheshwari, D.U.; Gahalaut, V.K.; Roy, P.N.S.; Khan, P.K.; Puviarasan, N. Ionospheric disturbances triggered by the 25 April, 2015 M7.8 Gorkha earthquake, Nepal: Constraints from GPS TEC measurements. J. Asian Earth Sci. 2017, 133, 80–88. [Google Scholar] [CrossRef] [Scilit]
  53. Akhoondzadeh, M. Ant Colony Optimization detects anomalous aerosol variations associated with the Chile earthquake of 27 February 2010. Adv. Space Res. 2015, 55, 1754–1763. [Google Scholar] [CrossRef] [Scilit]
  54. Guo, A.; Jiang, N.; Xu, Y.; Liu, T.; Xu, T.; Bastos, L.; Li, Z.; Jia, R. Land surface temperature, tropospheric and ionospheric anomalies analysis and implementation of a co-seismic PWV digital twin for the February 6, 2023 Turkey earthquake. Geomat. Nat. Hazards Risk 2025, 16, 2491470. [Google Scholar] [CrossRef] [Scilit]
  55. Hayakawa, M.; Solovieva, M.; Kopylova, G.; Hirooka, S.; Sasmal, S.; Nanda, K.; Yang, S.S.; Michimoto, K.; Hinata, H. Multi-Parameter and Multi-Layer Observations of Electromagnetic Precursors to a Huge Hokkaido Earthquake (M = 6.7) on 5 September, 2018, and Lithosphere-Atmosphere-Ionosphere Coupling Channel. Atmosphere 2025, 16, 1372. [Google Scholar] [CrossRef] [Scilit]
  56. Li, L.; Ma, H.; Dick, G.; Wickert, J.; Wu, E.; Zhang, M.; Meng, Z.; Huang, Y. Anomalies of land-atmospheric parameters in the 2023 Turkey earthquake (Mw7.8) using GNSS and ERA5. Geomat. Nat. Hazards Risk 2026, 17, 2637789. [Google Scholar] [CrossRef] [Scilit]
  57. Lim, B.J.M.; Leong, E.C. Challenges in the Detection of Ionospheric Pre-Earthquake Total Electron Content Anomalies (PETA) for Earthquake Forewarning. Pure Appl. Geophys. 2019, 176, 2425–2449. [Google Scholar] [CrossRef] [Scilit]
  58. Hirooka, S.; Hattori, K.; Nishihashi, M.; Kon, S.; Takeda, T. Development of Ionospheric Tomography Using Neural Network and Its Application to the 2007 Southern Sumatra Earthquake. Electr. Eng. Jpn. 2012, 181, 9–18. [Google Scholar] [CrossRef] [Scilit]
  59. Karatay, S.; Gul, S.E. Prediction of GPS-TEC on Mw > 5 Earthquake Days Using Bayesian Regularization Backpropagation Algorithm. IEEE Geosci. Remote Sens. Lett. 2023, 20, 1001005. [Google Scholar] [CrossRef] [Scilit]
  60. Akhoondzadeh, M. Investigation of GPS-TEC measurements using ANN method indicating seismo-ionospheric anomalies around the time of the Chile (Mw = 8.2) earthquake of 01 April 2014. Adv. Space Res. 2014, 54, 1768–1772. [Google Scholar] [CrossRef] [Scilit]
  61. Lin, J.W. Predicting ionospheric precursors before large earthquakes using neural network computing and the potential development of an earthquake early warning system. Nat. Hazards 2022, 113, 1519–1542. [Google Scholar] [CrossRef] [Scilit]
  62. Akhoondzadeh, M.; Hosseiny, B.; Ghasemian, N. MLP, Recurrent, Convolutional and LSTM Neural Networks Detect Seismo-TEC Anomalies Potentially Related to the Iran Sarpol-e Zahab (Mw = 7.3) Earthquake of 12 November 2017. J. Earth Space Phys. 2022, 47, 111–124. [Google Scholar] [CrossRef]
  63. Hanzaei, M.A. Kalman filter and Neural Network methods for detecting irregular variations of TEC around the time of powerful Mexico (Mw = 8.2) earthquake of September 08, 2017. J. Earth Space Phys. 2019, 44, 87–97. [Google Scholar] [CrossRef] [Scilit]
  64. Mukesh, R.; Dass, S.C.; Vijay, M.; Kiruthiga, S.; Praveenkumar, M.; Prashanth, M. Analysis of TEC variations and prediction of TEC by RNN during Indonesian earthquakes occurred from 2004 to 2024 and comparison with IRI-2020 model. Adv. Space Res. 2024, 74, 4865–4905. [Google Scholar] [CrossRef] [Scilit]
  65. Muhammad, A.; Külahcı, F. A semi-supervised total electron content anomaly detection method using LSTM-auto-encoder. J. Atmos. Sol.-Terr. Phys. 2022, 241, 105979. [Google Scholar] [CrossRef] [Scilit]
  66. Abri, R.; Artuner, H. LSTM-Based Deep Learning Methods for Prediction of Earthquakes Using Ionospheric Data. Gazi Univ. J. Sci. 2022, 35, 1417–1431. [Google Scholar] [CrossRef] [Scilit]
  67. Budak, C.; Gider, V. LSTM based forecasting of the next day’s values of ionospheric total electron content (TEC) as an earthquake precursor signal. Earth Sci. Inform. 2023, 16, 2323–2337. [Google Scholar] [CrossRef] [Scilit]
  68. Saqib, M.; Şentürk, E.; Sahu, S.A.; Adil, M.A. Comparisons of autoregressive integrated moving average (ARIMA) and long short term memory (LSTM) network models for ionospheric anomalies detection: A study on Haiti (Mw = 7.0) earthquake. Acta Geod. Geophys. 2022, 57, 195–213. [Google Scholar] [CrossRef] [Scilit]
  69. Tsai, T.C.; Jhuang, H.K.; Ho, Y.Y.; Lee, L.C.; Su, W.C.; Hung, S.L.; Lee, K.H.; Fu, C.C.; Lin, H.C.; Kuo, C.L. Deep Learning of Detecting Ionospheric Precursors Associated with M ≥ 6.0 Earthquakes in Taiwan. Earth Space Sci. 2022, 9, e2022EA002289. [Google Scholar] [CrossRef] [Scilit]
  70. Saqib, M.; Şentürk, E.; Adil, M.A.; Freeshah, M. Seismo-ionospheric precursory detection using hybrid Bayesian-LSTM network model with uncertainty-boundaries and anomaly-intensity. Adv. Space Res. 2024, 74, 1828–1842. [Google Scholar] [CrossRef] [Scilit]
  71. Feng, J.; Xiao, Y.; Chen, J.; Sun, S.; Ke, F. A Method for Detecting Ionospheric TEC Anomalies before Earthquake: The Case Study of Ms 7.8 Earthquake, February 06, 2023, Türkiye. Remote Sens. 2023, 15, 5175. [Google Scholar] [CrossRef] [Scilit]
  72. Şentürk, E.; Saqib, M.; Adil, M.A. A Multi-Network based Hybrid LSTM model for ionospheric anomaly detection: A case study of the Mw 7.8 Nepal earthquake. Adv. Space Res. 2022, 70, 440–455. [Google Scholar] [CrossRef] [Scilit]
  73. Lin, J.W.; Chiou, J.S. Detecting Total Electron Content Precursors Before Earthquakes by Examining Total Electron Content Images Based on Butterworth Filter in Convolutional Neural Networks. IEEE Access 2020, 8, 110478–110494. [Google Scholar] [CrossRef] [Scilit]
  74. Uyanık, H.; Şentürk, E.; Akpınar, M.H.; Ozcelik, S.T.A.; Kokum, M.; Freeshah, M.; Sengur, A. A Multi-Input Convolutional Neural Networks Model for Earthquake Precursor Detection Based on Ionospheric Total Electron Content. Remote Sens. 2023, 15, 5690. [Google Scholar] [CrossRef] [Scilit]
  75. Baselga, S. Artificial Intelligence for Earthquake Prediction: A Preliminary System Based on Periodically Trained Neural Networks Using Ionospheric Anomalies. Appl. Sci. 2024, 14, 10859. [Google Scholar] [CrossRef] [Scilit]
  76. Uyanik, H.; Kokum, M.; Senturk, E.; Freeshah, M.; Ozcelik, S.T.A.; Akpinar, M.H.; Celik, S.; Sengur, A. Seismic Foresight: A Novel Multi-Input 1D Convolutional Mixer Model for Earthquake Prediction Using Ionospheric Signals. IEEE Access 2025, 13, 116200–116210. [Google Scholar] [CrossRef] [Scilit]
  77. Lin, J.W. An adaptive Butterworth spectral-based graph neural network for detecting ionospheric total electron content precursor prior to the Wenchuan earthquake on 12 May 2008. Geocarto Int. 2022, 37, 14292–14308. [Google Scholar] [CrossRef] [Scilit]
  78. Hirooka, S.; Hattori, K.; Nishihashi, M.; Takeda, T. Neural network based tomographic approach to detect earthquake-related ionospheric anomalies. Nat. Hazards Earth Syst. Sci. 2011, 11, 2341–2353. [Google Scholar] [CrossRef] [Scilit]
  79. Sompotan, A.F.; Puspito, N.T.; Joelianto, E.; Hattori, K. Analysis of Ionospheric Precursor of Earthquake using GIM-TEC, Kriging and Neural Network. Asian J. Earth Sci. 2015, 8, 32–44. [Google Scholar] [CrossRef] [Scilit]
  80. Akhoondzadeh, M. Decision Tree, Bagging and Random Forest methods detect TEC seismo-ionospheric anomalies around the time of the Chile, (Mw = 8.8) earthquake of 27 February 2010. Adv. Space Res. 2016, 57, 2464–2469. [Google Scholar] [CrossRef] [Scilit]
  81. Melgarejo-Morales, A.; Vazquez-Becerra, G.E.; Millan-Almaraz, J.R.; Martinez-Felix, C.A.; Shah, M. Applying support vector machine (SVM) using GPS-TEC and Space Weather parameters to distinguish ionospheric disturbances possibly related to earthquakes. Adv. Space Res. 2023, 72, 4420–4434. [Google Scholar] [CrossRef] [Scilit]
  82. Colonna, R.; Filizzola, C.; Genzano, N.; Lisi, M.; Tramutoli, V. Optimal Setting of Earthquake-Related Ionospheric TEC (Total Electron Content) Anomalies Detection Methods: Long-Term Validation over the Italian Region. Geosciences 2023, 13, 150. [Google Scholar] [CrossRef] [Scilit]
  83. Swati; Pundhir, D.; Singh, B.; Gupta, S.K. A Critical Investigation on the Reliability of GPS-Derived TEC Data at Agra for Earthquake Predictions by Using the Support Vector Machine (SVM) Algorithm. Geomagn. Aeron. 2024, 64, 1225–1236. [Google Scholar] [CrossRef] [Scilit]
  84. Zorkun, N.G.; Oncul, M.H.M.; Karatay, S.; Erken, F.; Budak, C. Identification of the ionospheric disturbances prior to large earthquakes in Türkiye using Random Forests algorithm. Adv. Space Res. 2026, 78, 263–278. [Google Scholar] [CrossRef] [Scilit]
  85. Budak, C.; Karatay, S.; Erken, F.; Cinar, A. Classification of the Ionospheric Disturbances Caused by Geomagnetic and Seismic Activity with K-Nearest Neighbors Algorithm. Wirel. Pers. Commun. 2024, 134, 1551–1569. [Google Scholar] [CrossRef] [Scilit]
  86. Karatay, S.; Mantaroglu, Z.; Serbetli, E.N. AdaBoost-powered multi-class classification of pre-earthquake ionospheric anomalies using GNSS network in Türkiye: A comparison with random forest. Earth Sci. Inform. 2026, 19, 62. [Google Scholar] [CrossRef] [Scilit]
  87. Akhoondzadeh, M. Genetic algorithm for TEC seismo-ionospheric anomalies detection around the time of the Solomon (Mw = 8.0) earthquake of 06 February 2013. Adv. Space Res. 2013, 52, 581–590. [Google Scholar] [CrossRef] [Scilit]
  88. Akhoondzadeh, M. Thermal and TEC anomalies detection using an intelligent hybrid system around the time of the Saravan, Iran, (Mw = 7.7) earthquake of 16 April 2013. Adv. Space Res. 2014, 53, 647–655. [Google Scholar] [CrossRef] [Scilit]
  89. Akhoondzadeh, M. Kalman Filter, ANN-MLP, LSTM and ACO Methods Showing Anomalous GPS-TEC Variations Concerning Turkey’s Powerful Earthquake (6 February 2023). Remote Sens. 2023, 15, 3061. [Google Scholar] [CrossRef] [Scilit]
  90. Akhoondzadeh, M. An Adaptive Network-based Fuzzy Inference System for the detection of thermal and TEC anomalies around the time of the Varzeghan, Iran, (Mw = 6.4) earthquake of 11 August 2012. Adv. Space Res. 2013, 52, 837–852. [Google Scholar] [CrossRef] [Scilit]
  91. Budak, C. Two-stage modeling of ionospheric TEC for earthquake precursors: Forecasting with LSTM, GRU, RNN and classification via Random Forest based on the 2023 Türkiye earthquakes. Adv. Space Res. 2026, 78, 279–298. [Google Scholar] [CrossRef] [Scilit]
  92. Akhoondzadeh, M. Firefly Algorithm in detection of TEC seismo-ionospheric anomalies. Adv. Space Res. 2015, 56, 10–18. [Google Scholar] [CrossRef] [Scilit]
  93. Akhoondzadeh, M. Application of Artificial Bee Colony algorithm in TEC seismo-ionospheric anomalies detection. Adv. Space Res. 2015, 56, 1200–1211. [Google Scholar] [CrossRef] [Scilit]
  94. Akhoondzadeh, M.; Santis, A.D.; Marchetti, D.; Wang, T. Developing a Deep Learning-Based Detector of Magnetic, Ne, Te and TEC Anomalies from Swarm Satellites: The Case of Mw 7.1 2021 Japan Earthquake. Remote Sens. 2022, 14, 1582. [Google Scholar] [CrossRef] [Scilit]
  95. Hafeez, A.; Shah, M.; Ehsan, M.; Jamjareegulgarn, P.; Ahmed, J.; Tariq, M.A.; Iqbal, S.; Naqvi, N.A. Possible Atmosphere and Ionospheric Anomalies of the 2019 Pakistan Earthquake Using Statistical and Machine Learning Procedures on MODIS LST, GPS TEC, and GIM TEC. IEEE J. Sel. Top. Appl. Earth Obs. Remote Sens. 2021, 14, 11126–11133. [Google Scholar] [CrossRef] [Scilit]
  96. Khoshgoftar, M.M.; Saradjian, M.R. Estimation of the date and magnitude of impending massive earthquakes using the integration of precursors obtainable from remote sensing data. Earth Sci. Res. J. 2024, 28, 447–460. [Google Scholar] [CrossRef] [Scilit]
  97. Fu, C.C.; Jhuang, H.K.; Ho, Y.Y.; Tsai, T.C.; Lee, L.C.; Lin, C.H.; Lin, C.R.; Walia, V.; Lee, I.T. A Study of Lithosphere-Ionosphere Seismic Precursors from Detecting Gamma-Ray and Total Electron Content Anomalies Prior to the 2018 ML6.2 Hualien Earthquake in Eastern Taiwan. Remote Sens. 2025, 17, 188. [Google Scholar] [CrossRef] [Scilit]
  98. Rasheed, R.; Chen, B.; Wu, D.; Wu, L. A Comparative Study on Multi-Parameter Ionospheric Disturbances Associated with the 2015 Mw 7.5 and 2023 Mw 6.3 Earthquakes in Afghanistan. Remote Sens. 2024, 16, 1839. [Google Scholar] [CrossRef] [Scilit]
  99. Bilici, S.; Külahcı, F.; Bilici, A. Predicting the Unpredictable: Advancements in Earthquake Forecasting Using Artificial Intelligence and LSTM Networks. Geomagn. Aeron. 2024, 64, 760–771. [Google Scholar] [CrossRef] [Scilit]
  100. Akhoondzadeh, M.; Santis, A.D.; Marchetti, D.; Piscini, A.; Jin, S. Anomalous seismo-LAI variations potentially associated with the 2017 Mw = 7.3 Sarpol-e Zahab (Iran) earthquake from Swarm satellites, GPS-TEC and climatological data. Adv. Space Res. 2019, 64, 143–158. [Google Scholar] [CrossRef] [Scilit]
  101. Muhammad, A.; Külahcı, F.; Birel, S. Investigating radon and TEC anomalies relative to earthquakes via AI models. J. Atmos. Sol.-Terr. Phys. 2023, 245, 106037. [Google Scholar] [CrossRef] [Scilit]
  102. Draz, M.U.; Shah, M.; Jamjareegulgarn, P.; Shahzad, R.; Hasan, A.M.; Ghamry, N.A. Deep Machine Learning Based Possible Atmospheric and Ionospheric Precursors of the 2021 Mw 7.1 Japan Earthquake. Remote Sens. 2023, 15, 1904. [Google Scholar] [CrossRef] [Scilit]
  103. Haider, S.F.; Shah, M.; Alarifi, N.S.; Abukhadra, M.R. The 2023 Mw 6.8 Morocco earthquake induced atmospheric and ionospheric anomalies. J. Atmos. Sol.-Terr. Phys. 2024, 262, 106323. [Google Scholar] [CrossRef] [Scilit]
  104. Haider, S.F.; Shah, M.; Li, B.; Jamjareegulgarn, P.; de Oliveira-Júnior, J.F.; Zhou, C. Synchronized and Co-Located Ionospheric and Atmospheric Anomalies Associated with the 2023 Mw 7.8 Turkey Earthquake. Remote Sens. 2024, 16, 222. [Google Scholar] [CrossRef] [Scilit]
  105. Shah, M.; Shahzad, R.; Ehsan, M.; Ghaffar, B.; Ullah, I.; Jamjareegulgarn, P.; Hassan, A.M. Seismo Ionospheric Anomalies around and over the Epicenters of Pakistan Earthquakes. Atmosphere 2023, 14, 601. [Google Scholar] [CrossRef] [Scilit]
  106. Shah, M.; Shahzad, R.; Jamjareegulgarn, P.; Ghaffar, B.; de Oliveira-Júnior, J.F.; Hassan, A.M.; Ghamry, N.A. Machine-Learning-Based Lithosphere-Atmosphere-Ionosphere Coupling Associated with Mw > 6 Earthquakes in America. Atmosphere 2023, 14, 1236. [Google Scholar] [CrossRef] [Scilit]
  107. Ravanelli, M.; Constantinou, V.; Liu, H.; Bortnik, J. Exploring AI Progress in GNSS Remote Sensing: A Deep Learning Based Framework for Real-Time Detection of Earthquake and Tsunami Induced Ionospheric Perturbations. Radio Sci. 2024, 59, e2024RS008016. [Google Scholar] [CrossRef] [Scilit]
  108. Luhrmann, F.; Park, J.; Wong, W.K. Ionospheric Anomaly Detection and Source Geolocation Over Open Ocean with GNSS Remote Sensing. J. Geophys. Res. Space Phys. 2026, 131, e2025JA034460. [Google Scholar] [CrossRef] [Scilit]
  109. Doğanalp, S.; Köz, İ. Investigating Different Interpolation Methods for High-Accuracy VTEC Analysis in Ionospheric Research. Atmosphere 2024, 15, 986. [Google Scholar] [CrossRef] [Scilit]
  110. Nayak, K.; Romero-Andrade, R.; Sharma, G.; Zavala, J.L.C.; Urias, C.L.; Soto, M.E.T.; Aggarwal, S.P. A Combined Approach Using b-Value and Ionospheric GPS-TEC for Large Earthquake Precursor Detection: A Case Study for the Colima Earthquake of 7.7 Mw, Mexico. Acta Geod. Geophys. 2023, 58, 515–538. [Google Scholar] [CrossRef] [Scilit]
  111. Nayak, K.; Romero-Andrade, R.; Sharma, G.; López-Urías, C.; Trejo-Soto, M.E.; Vidal-Vega, A.I. Evaluating Ionospheric Total Electron Content (TEC) Variations as Precursors to Seismic Activity: Insights from the 2024 Noto Peninsula and Nichinan Earthquakes of Japan. Atmosphere 2024, 15, 1492. [Google Scholar] [CrossRef] [Scilit]
  112. Nayak, K.; López-Urías, C.; Romero-Andrade, R.; Sharma, G.; Guzmán-Acevedo, G.M.; Trejo-Soto, M.E. Ionospheric Total Electron Content (TEC) Anomalies as Earthquake Precursors: Unveiling the Geophysical Connection Leading to the 2023 Moroccan 6.8 Mw Earthquake. Geosciences 2023, 13, 319. [Google Scholar] [CrossRef] [Scilit]
  113. Perfetti, N.; Taddia, Y.; Pellegrinelli, A. Monitoring of Ionospheric Anomalies Using GNSS Observations to Detect Earthquake Precursors. Remote Sens. 2025, 17, 338. [Google Scholar] [CrossRef] [Scilit]
  114. Dong, L.; Zhang, X.; Cai, G.; Du, X.; Liu, H.; Wang, S.; Zhao, C. Statistical Analysis of Ionospheric TEC Anomalies Prior to Ms ≥ 6.0 Earthquakes in Mainland China During 2012–2022. Remote Sens. 2026, 18, 1450. [Google Scholar] [CrossRef] [Scilit]
Figure 1. Flow diagram of the study selection process.
Geomatics 06 00074 g001
Figure 2. Annual and cumulative publications by year (2011–2026). Blue bars show the annual output; the light-blue bar indicates 2026 records up to 30 April 2026. The black line, plotted on the right axis, shows the cumulative publications.
Geomatics 06 00074 g002
Figure 3. Geographical distribution of the scientific production of the analyzed corpus, estimated by author-affiliation full counting.
Geomatics 06 00074 g003
Figure 4. Country collaboration network.
Geomatics 06 00074 g004
Figure 5. Word cloud of keywords in the analyzed corpus.
Geomatics 06 00074 g005
Figure 6. Keyword co-occurrence network of the analyzed corpus.
Geomatics 06 00074 g006
Figure 7. Thematic map of the keywords in the analyzed corpus.
Geomatics 06 00074 g007
Figure 8. Conceptual transition from classical TEC anomaly detection to AI-assisted decision systems in earthquake-related ionospheric analysis.
Geomatics 06 00074 g008
Table 1. Grouped synthesis of AI methodologies and application scenarios in TEC-based earthquake-related seismo-ionospheric studies.
AI Methodology FamilyMain Application ScenarioMethodological CharacteristicStudies
Feed-forward neural-network modelsTEC forecasting and anomaly detectionThese studies use feed-forward neural-network architectures to model expected TEC behavior or to detect deviations from reference or predicted TEC values. They are mainly oriented toward residual-based anomaly detection and precursor-like pattern identification.[20,59,60,61,62,63]
Recurrent and sequence-learning modelsTemporal TEC forecasting and sequence-based anomaly detectionThese studies model the temporal evolution of TEC using recurrent or sequence-learning architectures. They are commonly applied to daily or sub-daily TEC series to forecast TEC values, identify abnormal deviations, or detect precursor-like temporal patterns.[23,64,65,66,67,68,69,70,71,72]
Image-based and convolutional deep-learning modelsSpatial or spatiotemporal classification of TEC anomaly patternsThese studies transform TEC observations into image-like or matrix-based representations, including TEC maps, TEC images, or spatiotemporal TEC matrices. The main task is to classify precursor-like and normal conditions or to detect spatial TEC anomaly structures.[73,74,75,76]
Graph-based and spatial reconstruction modelsSpatial precursor detection and ionospheric structure reconstructionThese studies emphasize the spatial structure of TEC or electron density fields. They use graph-based, tomographic, or interpolation-assisted neural approaches to detect spatially organized ionospheric anomalies or to estimate earthquake-related spatial patterns.[77,78,79]
Classical machine-learning classifiers and statistical-learning modelsSeismic/non-seismic discrimination and candidate precursor classificationThese studies rely on engineered TEC features, statistical descriptors, or space-weather-related variables to classify seismic and non-seismic periods, discriminate candidate precursor conditions, or validate anomaly detection procedures over longer time intervals.[19,21,22,80,81,82,83,84,85,86]
Hybrid, optimization-based, and fuzzy-intelligence modelsAnomaly detection and multi-method confirmationThese studies combine neural networks, optimization algorithms, fuzzy inference systems, or multiple anomaly detectors. Their main purpose is to improve robustness in TEC anomaly detection by comparing or integrating outputs from different intelligent and classical methods.[87,88,89,90,91,92,93]
Multi-precursor and LAIC-oriented AI frameworksMulti-parameter precursor integrationThese studies combine TEC with other lithosphere–atmosphere–ionosphere coupling indicators, including thermal, atmospheric, magnetic, electron density, electron temperature, radon, gamma-ray, ionosonde, or Swarm satellite variables. Their application scenario is broader than TEC-only anomaly detection and is oriented toward integrated precursor analysis.[94,95,96,97,98,99,100,101,102,103,104,105,106]
Near-real-time coseismic and tsunami-related disturbance detectionNear-real-time post-rupture ionospheric disturbance detectionThese studies focus on rapid detection of coseismic or tsunami-induced ionospheric disturbances using near-real-time GNSS-TEC streams or related operational frameworks. Unlike pre-seismic precursor studies, their main objective is post-rupture disturbance detection and monitoring support.[24,107,108]
Table 2. Most relevant affiliations in the analyzed corpus.
Normalized AffiliationCountryArticles
University of TehranIran27
Institute of Space TechnologyPakistan12
Firat UniversityTurkey10
King Mongkut’s Institute of Technology LadkrabangThailand8
Nanjing University of Information Science and TechnologyChina8
Kastamonu UniversityTurkey7
Ariel UniversityIsrael6
Southern Taiwan University of Science and TechnologyTaiwan6
Benha UniversityEgypt5
Dicle UniversityTurkey5
Indian Institute of Technology (ISM)/Indian School of MinesIndia5
Kocaeli UniversityTurkey5
Central South UniversityChina4
Oregon State UniversityUSA4
Tongji UniversityChina4
Wuhan UniversityChina4
Bandirma Onyedi Eylul UniversityTurkey3
Future University in EgyptEgypt3
Hacettepe UniversityTurkey3
Institute of Earth SciencesTaiwan3
Institute of Earthquake ForecastingChina3
National Central UniversityTaiwan3
National Taiwan UniversityTaiwan3
Seismo Electromagnetics and Space Research LaboratoryJapan3
United Arab Emirates UniversityUnited Arab Emirates2
Table 3. Most relevant sources in the analyzed corpus.
SourceSCImago QuartileArticles
Advances in Space ResearchQ115
Remote SensingQ19
Journal of Atmospheric and Solar-Terrestrial PhysicsQ23
AtmosphereQ22
Earth Science InformaticsQ22
Geomagnetism and AeronomyQ32
IEEE AccessQ12
IEEE Journal of Selected Topics in Applied Earth Observations and Remote SensingQ12
Journal of the Earth and Space PhysicsQ42
Radio ScienceQ22
Acta Geodaetica et GeophysicaQ21
Annales GeophysicaeQ21
Applied SciencesQ21
Asian Journal of Earth SciencesQ41
Earth and Space ScienceQ11
Earth Sciences Research JournalQ31
Gazi University Journal of ScienceQ21
Geocarto InternationalQ21
GeosciencesQ21
GPS SolutionsQ11
IEEE Geoscience and Remote Sensing LettersQ11
Journal of Geophysical Research: Space PhysicsQ11
Natural HazardsQ11
Natural Hazards and Earth System SciencesQ11
Wireless Personal CommunicationsQ21
Note: Quartiles correspond to SCImago Journal Rank classifications. For journals assigned to multiple subject categories, the highest available quartile was retained as a single source-level indicator.
Table 4. Methodological strengthening strategies identified in the corpus.
Methodological StrategyPurposeContribution to RobustnessRepresentative Studies
Retrospective event-centered analysisExploratory detection of TEC anomalies around known earthquakes.Useful for hypothesis generation and method illustration, but limited for generalization because the event is already known and the anomaly window is often defined retrospectively.[20,21,60,63,68,87,90,92,93]
Classical reference-state anomaly detectionDefine anomalous TEC as a departure from a background state estimated with median, IQR, standard deviation, Kalman filtering, ARIMA, or related procedures.Provides transparent and reproducible baseline procedures against which AI-based models can be compared. However, robustness depends on the selected reference window, threshold, and geomagnetic conditions.[20,21,63,68,89,90]
Solar and geomagnetic filteringControl non-seismic ionospheric forcing before interpreting TEC anomalies as potentially seismic.Reduces the risk of misattributing solar, geomagnetic, or space-weather-driven disturbances to earthquake-related processes.[63,68,80,87,89]
Space weather variables as model inputsIncorporate external drivers such as Dst, Kp, Ap, F10.7, solar wind speed, sunspot number, or related indices into the learning model.Moves confounding control from a post hoc descriptive check to the analytical structure of the model, allowing the classifier or predictor to learn under external forcing conditions.[64,69,74,76]
Seismic versus non-seismic classificationTest whether models can distinguish precursor-like or earthquake-related periods from quiet, disturbed, or non-seismic ionospheric conditions.Improves discriminative validity because the model is evaluated against competing non-seismic classes rather than only around known earthquakes.[81,84,85,86]
Training, validation, and test partitionsEvaluate model performance outside the data used to fit or tune the algorithm.Reduces dependence on illustrative cases and provides stronger evidence than applying a model only to the event used to design it.[22,66,74,76,81,85]
Cross-validation and repeated evaluationAssess the stability of classification or prediction performance under different data splits.Reduces the risk that reported performance is driven by a single favorable partition, especially in small geophysical datasets.[61,81,84,85,86]
False-alarm reportingMeasure how often a method flags anomalies or precursor-like states when the target seismic condition is absent.Strengthens interpretive credibility and operational relevance because it quantifies the cost of incorrect alarms.[22,81,84,85,86,107]
Uncertainty-aware anomaly boundsUse confidence intervals, predictive bounds, dynamic upper and lower limits, or related uncertainty estimates to define anomalies.Distinguishes stronger deviations from weaker threshold crossings and supports confidence-based interpretation rather than purely binary anomaly labeling.[70,72]
Anomaly intensity estimationQuantify the relative strength of the detected anomaly after it exceeds a model-based or statistical boundary.Helps separate strong candidate disturbances from weak deviations and can support false-alarm reduction.[70]
Multi-precursor LAIC-oriented integrationCombine TEC with surface, atmospheric, ionospheric, or satellite-derived variables such as LST, SST, OLR, AT, RH, AP, radon, gamma rays, Ne, Te, magnetic field, foF2, or Swarm parameters.Strengthens physical plausibility when anomalies are temporally synchronized, spatially consistent, and compatible with a cross-layer LAIC interpretation. It does not by itself prove causality.[94,95,96,97,98,100,102,103,104,106]
Advanced TEC representationsRepresent TEC as images, time–frequency maps, GIM grids, 3D matrices, graphs, GADF images, tomographic structures, or multichannel sequences.Allows models to capture spatial, temporal, morphological, spectral, vertical, or relational patterns that are not accessible through simple thresholding of a univariate time series.[73,74,75,76,77,78,79,107,108]
Near-real-time coseismic and tsunami-related monitoringDetect TIDs, acoustic-gravity wave signatures, coseismic disturbances, or tsunami-related ionospheric perturbations in real-time or near-real-time TEC streams.Provides a more application-relevant use of TEC because it supports rapid monitoring after an event rather than deterministic earthquake prediction before rupture.[24,107,108]
Table 5. Advanced TEC representations and associated AI modeling strategies.
TEC RepresentationModel FamilyAnalytical PurposeStudies
Univariate or station-based TEC time seriesANN, ARIMA, RNN, LSTM, GRU, Bayesian LSTM, hybrid LSTMForecast expected TEC behavior and detect anomalies through residuals, prediction errors, or deviations from learned temporal patterns.[64,67,68,70,72,91]
TEC images or time–frequency representationsCNN, multi-input CNNTransform TEC variability into image-like structures to classify precursor and normal days, or to expose temporal and spectral patterns not directly visible in raw time series.[73,74]
GADF-transformed TEC imagesCNN, ResNet-type CNNConvert TEC time series windows into Gramian Angular Difference Field images to detect earthquake- and tsunami-induced traveling ionospheric disturbances.[107]
GIM-TEC spatial maps or gridsCNN, neural networks, Kriging-based neural network workflowsCapture spatial anomaly patterns, regional TEC gradients, and epicentral information using gridded or interpolated TEC fields.[75,79]
Graph-based GIM-GIS representationsSpectral graph neural networksModel spatial relations among TEC grid elements and represent ionospheric anomalies as relational structures rather than only as regular maps or images.[77]
Tomographic electron density representationTomographic neural networkReconstruct three-dimensional ionospheric electron density structure and examine vertical anomaly patterns that cannot be inferred from two-dimensional TEC alone.[78]
Multichannel TEC plus space weather inputsConvMixer, multi-input CNNIntegrate TEC sequences or TEC-derived images with external forcing indices such as Dst, Kp, Ap, F10.7, solar wind speed, or sunspot number.[74,76]
Sequential TEC representations with attentionAttention-based LSTM, transformer-type time-series modelsAssign different relevance to temporal segments in TEC-related sequences and support anomaly detection when diagnostic information is unevenly distributed over time.[99,108]
Spatiotemporal TEC matricesCNN, deep learning classifiersEncode latitude, longitude, and time jointly so that the model can learn spatial distribution and temporal evolution of TEC anomalies in a unified input structure.[75]
Near-real-time TEC streamsDeep learning anomaly detection, transformer-based sequence modelingDetect anomalous ionospheric behavior in operational or simulated near-real-time GNSS-TEC streams for monitoring of earthquake- or tsunami-induced disturbances.[24,107,108]
Disclaimer/Publisher’s Note: The statements, opinions and data contained in all publications are solely those of the individual author(s) and contributor(s) and not of MDPI and/or the editor(s). MDPI and/or the editor(s) disclaim responsibility for any injury to people or property resulting from any ideas, methods, instructions or products referred to in the content.