


Abstract
This study applies Small Baseline Subset Interferometric Synthetic Aperture Radar (SBAS-InSAR) to investigate surface deformation dynamics in the hyper-arid Eastern Province of Saudi Arabia, with emphasis on quantifying sand dune migration and identifying areas susceptible to wind erosion. Utilizing Sentinel-1 SAR data and the MintPy toolbox, ground deformation was quantified with millimeter-scale precision. Results reveal significant subsidence, up to 15 cm/year in landfills, linked to waste compaction and groundwater depletion. Localized uplift of ~4 cm/year on northern peripheries is directly attributed to aeolian sand accumulation from seasonal Shamal winds, providing quantitative evidence of dune migration. While direct measurement of wind erosion (net deflation) remains challenging due to the dominance of depositional signals and the spatial heterogeneity of erosion processes, areas of potential erosion are inferred from negative displacement patterns outside landfill zones and from coherence characteristics indicative of surface instability. The integration of SBAS-InSAR with GPS and ERA5 wind reanalysis resolves the combined influence of aeolian deposition, hydrogeological changes, and anthropogenic activity, offering insights into both components of aeolian dynamics and a replicable model for sustainable land management in arid environments.
1. Introduction
The Eastern Province of Saudi Arabia is a hyper-arid region characterized by extensive sand dune systems, including parts of the Rub’ al Khali, where landscape dynamics are predominantly governed by aeolian processes. Research indicates that sand dune movement in this region is primarily driven by strong seasonal winds, particularly the North (Shamal) winds that prevail during summer months, which can mobilize large volumes of sand across vast distances [1]. This movement has profound implications for local ecosystems, with advancing dunes often overwhelming and burying vegetation communities, disrupting the fragile balance of desert plant species adapted to harsh environmental conditions [2].
Over the past decade, significant progress has been made in the research on wind erosion and sand dune migration. Gholami et al. [3] proposed an explainable integrated machine-learning model for mapping soil erosion by wind and water in a catchment with three desiccated lakes. They combined the interpretability of simple RNN and GRU deep-learning models to map land susceptibility to gully erosion, providing new ideas for wind erosion research. Webb et al. [4] used satellite data to reveal Earth’s seasonally shifting dust-emission sources, offering a fresh perspective on the spatiotemporal distribution of wind erosion. In 2023, [5] assessed the temporal sand drift potential trends in the Sistan region, Southeast Iran, and found that wind erosion intensity is closely related to wind speed and direction, as well as soil moisture content. In addition, Kebede et al. [6] studied land susceptibility to water and wind erosion in East Africa, highlighting the importance of vegetation cover and soil properties in wind erosion.
The integration of remote sensing technologies and desert geomorphology has become a research hotspot. Tao et al. [7] simulated wind erosion and dust emission processes through wind tunnel experiments, analyzing the influence of soil texture on wind erosion. Their findings indicate that soil texture significantly affects wind erosion intensity and dust emission rates. In 2023, [3] mapped wind erosion hazards using regression-based machine-learning algorithms, demonstrating the potential of machine learning in wind erosion research. Meanwhile, Zhang et al. [8] studied the response of wind erosion dynamics to climate change and human activity in Inner Mongolia, China, from 1990 to 2015. They found that climate change and human activities jointly drive wind erosion processes, with wind erosion intensity exhibiting significant spatiotemporal variability.
Wind erosion and sand dune migration not only reshape landscapes but also pose significant challenges for local ecosystems, agriculture, infrastructure, and human settlements. Accurate monitoring and understanding of wind erosion and sand dune dynamics are essential for effective land management, conservation strategies, and mitigation measures. Modern technologies such as InSAR provide new tools for wind erosion research. For instance, Havivi et al. [9] and Zheng et al. [10] successfully applied InSAR to study sand dune dynamics in desert areas, offering insights into the patterns and rates of dune migration. Their research underscores the importance of continuous monitoring to understand how wind patterns and climatic conditions influence dune morphology over time.
Despite these technological advancements, a critical research gap remains in the direct and quantitative integration of InSAR-measured ground deformation with specific aeolian processes, such as wind erosion and dune migration, in hyper-arid environments [11]. Many existing studies focus either on broad subsidence patterns from groundwater loss or provide qualitative assessments of dune movement [12]. There is a distinct lack of studies that explicitly resolve the spatiotemporal interplay between localized uplift from sand accumulation, subsidence from both natural and anthropogenic causes, and driving climatic forces such as the Shamal winds [13].
While the drivers of aeolian processes are globally consistent, namely wind regimes, sediment supply, and surface conditions, their manifestation varies considerably across the world’s major desert systems. For instance, in the Sahara Desert, particularly the Bodélé Depression, wind erosion is dominated by persistent low-level jets that generate the planet’s largest dust sources, a process similar in intensity but different in atmospheric mechanism compared to the Shamal winds driving erosion in Eastern Saudi Arabia [14,15]. In the Namib Desert, linear dune migration is primarily influenced by fog and a strong Atlantic coastal wind regime, resulting in dunal dynamics that are more moisture-influenced than the purely hyper-arid migration observed in the Arabian Peninsula [16,17]. Studies in the Taklamakan Desert in China have shown that dune migration rates are heavily modulated by seasonal river flows and alluvial fan interactions, introducing a fluvial–aeolian interplay that is less prevalent in the coastal-proximal setting of Eastern Saudi Arabia [18]. By comparing these regional signatures, the hyper-arid context of the study area is defined not by the mere presence of wind erosion, but by the specific dominance of the Shamal winds coupled with unique anthropogenic pressures like landfill subsidence, a combination not commonly observed in other uninhabited or less industrialized desert interiors.
Therefore, the novelty of the current research lies in the innovative combination of SBAS-InSAR technology with machine learning to identify high-risk encroachment zones, establishing a replicable model for real-time monitoring and sustainable land management in arid regions.
The primary objective of this study is to quantitatively map and analyze wind erosion and sand dune movements in Saudi Arabia’s Eastern Province through the application of advanced InSAR techniques. By integrating SBAS-InSAR with GPS validation and ERA5 wind reanalysis, this work aims to resolve the interplay between aeolian processes, hydrogeological fluctuations, and anthropogenic activity. The study seeks to provide a robust quantitative assessment of wind erosion impacts and offers actionable insights for sustainable land management and ecosystem preservation.
2. Materials and Methods
2.1. Study Area
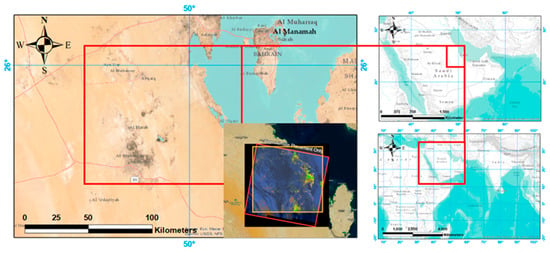
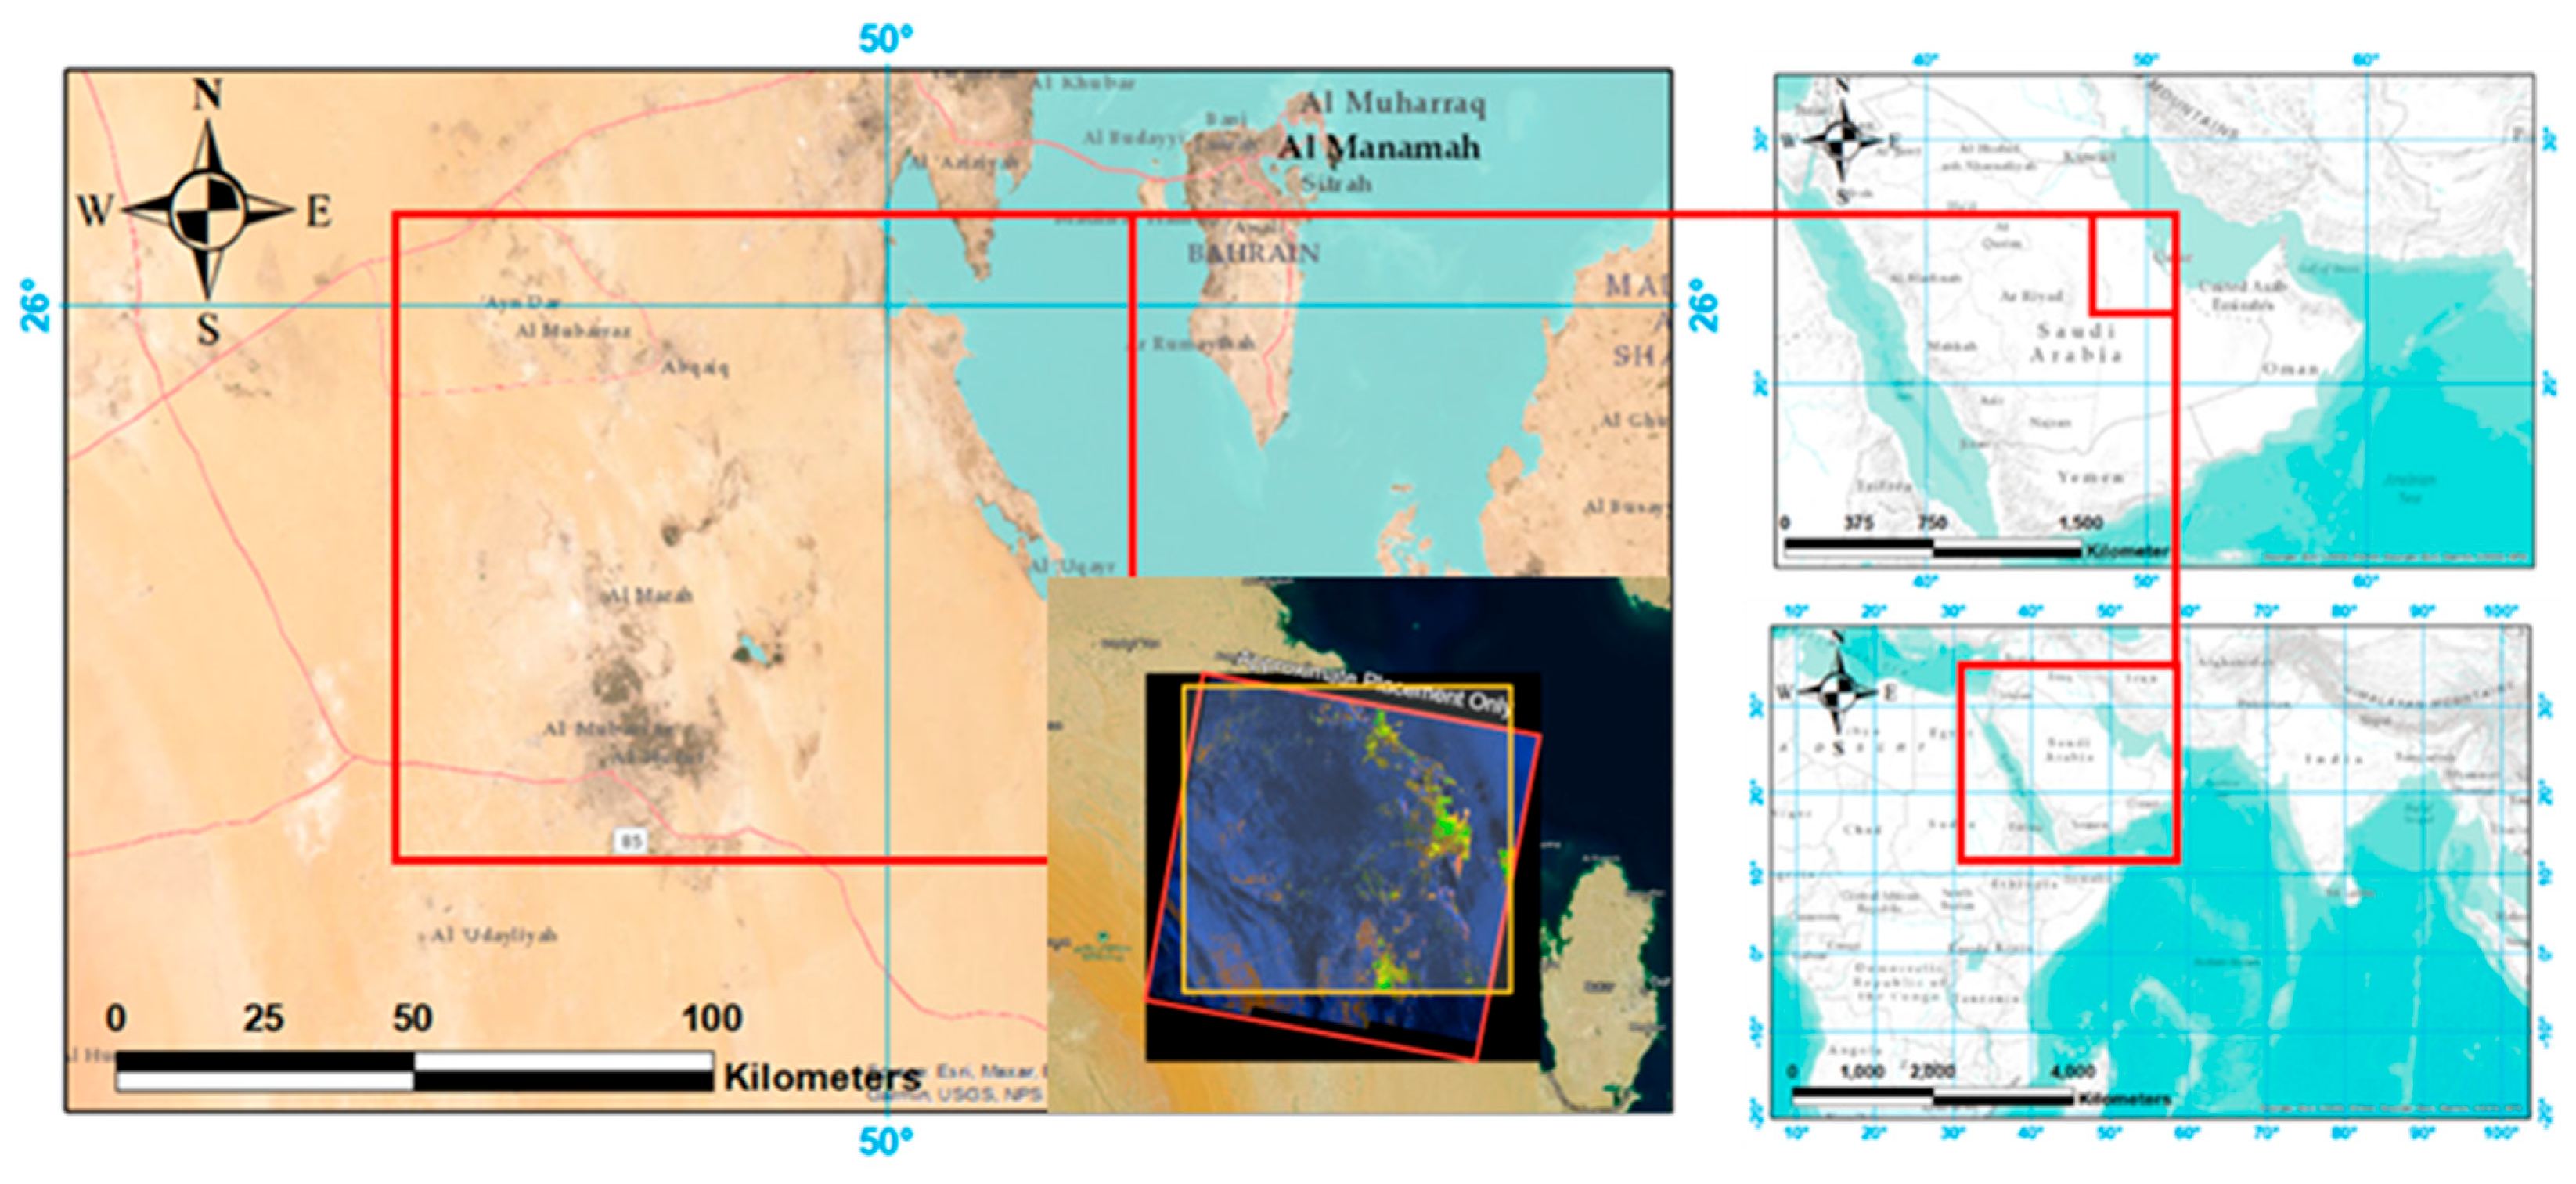
The Eastern Province of Saudi Arabia, located along the Arabian Gulf coast, is characterized by a hyper-arid desert climate (Figure 1). Dammam, the provincial capital, experiences extreme temperatures with an average annual temperature of 27 °C, peaking at 45–48 °C in summer (June–August) and dropping to 10–15 °C in winter (December–February). Annual rainfall is low, averaging 70–90 mm, and occurs primarily as sporadic, intense showers between November and April. The region’s aridity is exacerbated by high annual evaporation rates exceeding 2000 mm [19,20]. Wind patterns exhibit strong seasonality, with northwesterly Shamal winds dominating in summer (May–July), reaching speeds of 15–25 km/h and carrying fine sand particles, while milder easterly coastal breezes prevail in winter. These winds are the primary driver of sand dune migration and shape the region’s dynamic aeolian landscapes, a phenomenon increasingly studied using remote sensing techniques in similar arid environments [21].
Figure 1.
Location map of the study area in the Eastern Province of Saudi Arabia.
While the Eastern Province experiences an overall hyper-arid climate, a notable climatic gradient exists between the coastal fringe and the interior desert. The easternmost areas, adjacent to the Arabian Gulf, are subject to maritime influences, including higher relative humidity (frequently exceeding 60% during summer months), moderated diurnal temperature ranges, and the development of local sea-breeze circulation patterns that can alter near-surface wind direction and speed during the afternoon hours [22]. These coastal effects diminish rapidly inland, with locations beyond 20–30 km from the coastline exhibiting lower humidity, greater temperature extremes, and wind regimes dominated exclusively by the regional northwesterly Shamal flow without the superimposed diurnal coastal component. This spatial heterogeneity in moisture availability and wind patterns has implications for sand transport potential, as increased near-surface humidity can enhance particle cohesion and increase the threshold friction velocity required for entrainment [23]. The study area, therefore, encompasses a transition zone where aeolian dynamics may be modulated by proximity to the Gulf, a factor considered in the subsequent interpretation of deformation patterns.
The flora and fauna have adapted to these harsh conditions. The predominant desert ecosystem supports resilient plant species, such as Haloxylon salicornicum and Panicum turgidum, which contribute to soil stabilization [24]. Fauna includes species such as the Arabian Oryx and Sand Gazelle [25]. The coastal areas near Dammam host mangrove forests, which are crucial for biodiversity and local fisheries [26]. However, these ecosystems face pressure from both natural aeolian processes and anthropogenic activities, making the area a critical case study for landscape deformation analysis.
2.2. Data Collection
A total of 213 Sentinel-1 Single Look Complex (SLC) images in Interferometric Wide (IW) swath mode, spanning from 9 July 2016 to 14 August 2023, were used. The data was freely downloaded from the Alaska Satellite Facility (ASF) DAAC. Ancillary Data for Processing:
- The 30 m resolution Shuttle Radar Topography Mission (SRTM) DEM was used to remove the topographic phase component.
- Sentinel-1 precise orbit ephemerides (POD) from the European Space Agency were applied to mitigate orbital errors.
- Data from six continuous GPS stations (ES91, ES92, ES93, ES96, ES97, ES99) from 2019 to 2021 were obtained from the King Abdulaziz City of Science and Technology (KACST). Data from 18 International GNSS Service (IGS) stations were incorporated for robust processing.
- The ERA5 global atmospheric reanalysis dataset from the European Center for Medium-Range Weather Forecasts (ECMWF) was used to analyze wind speed and direction patterns.
- Google Earth Pro and Sentinel-2 optical imagery were used for visual interpretation and validation of land cover features.
2.3. Methodology
The methodology followed a structured SBAS-InSAR processing chain implemented using the HyP3 platform and the MintPy toolbox, with subsequent validation against independent geodetic data. The fundamental principle of InSAR is to measure the phase difference between two complex SAR acquisitions of the same area. The recorded signal for a single pixel can be expressed as follows:
where g: Recorded signal; A: Amplitude of the signal; jϕ: Phase of the signal; λ: Radar wavelength; p: Slant range distance between the sensor and the target.
2.3.1. SBAS-InSAR Processing
The Small Baseline Subset (SBAS) technique was implemented using the Miami INsar Time-series software in Python 3.14 (MintPy) to derive surface displacement time-series from a stack of Sentinel-1 interferograms [27]. The method exploits multiple interferograms generated from image pairs with small perpendicular and temporal baselines to minimize decorrelation and maximize coherent pixel density [28].
The phase component of an interferogram, , represents the sum of several contributions:
where is the flat-earth phase due to Earth’s curvature, is the topographic phase contribution, is the phase due to surface displacement along the line-of-sight (LOS), is the phase delay caused by atmospheric signal propagation, is the residual phase from imprecise satellite orbit knowledge, and represents decorrelation noise.
To isolate the displacement phase , a differential InSAR (DInSAR) approach is applied. A simulated interferogram based on an external Digital Elevation Model (SRTM DEM with 30 m resolution) is used to remove the topographic phase component. The resulting differential interferogram phase, , is as follows:
The displacement phase component relates directly to the change in range () between the satellite and ground target:
where is the radar wavelength (5.6 cm for Sentinel-1 C-band). For a displacement vector with vertical (), east (), and north () components, the LOS-projected range change is as follows:
where is the radar incidence angle, and is the satellite azimuth angle. In areas where vertical motion dominates, this simplifies to .
The SBAS technique processes a set of SAR acquisitions to generate differential interferograms satisfying small baseline criteria. For the -th interferogram, the unwrapped phase, , at a pixel is as follows:
where and are acquisition times of master and slave images, is cumulative displacement at time , and represents residual atmospheric, orbital, and noise phases.
This forms a system of equations for all interferograms:
where is an design matrix defining temporal connections between acquisitions. The cumulative displacement time-series is solved via weighted least-squares inversion:
where is the covariance matrix of interferometric phase observations, typically weighted by coherence to down-weight less reliable data points.
Finally, the mean LOS velocity, , is estimated by fitting a linear model to the cumulative displacement time-series:
where is reference time, is a constant intercept, and represents non-linear motion and residual noise.
2.3.2. Validation Approach
To validate the InSAR-derived deformation measurements, a comparison with GPS data was performed. Since GPS provides 3D displacements (East, North, Up) and InSAR measures 1D displacement along the LOS, a direct comparison requires projection. The GPS vertical (Up) component was projected into the Sentinel-1 LOS geometry using the satellite’s incidence angle (θ) at the GPS station:
where dLOS is the LOS displacement and dUp is the vertical displacement. This projection assumes that horizontal displacements are negligible compared to the dominant vertical motion, a valid assumption for subsidence and dune-related uplift [29]. The time-series from the collocated GPS station ES93 and the InSAR pixels were then compared to compute the weighted root-mean-square (WRMS) error.
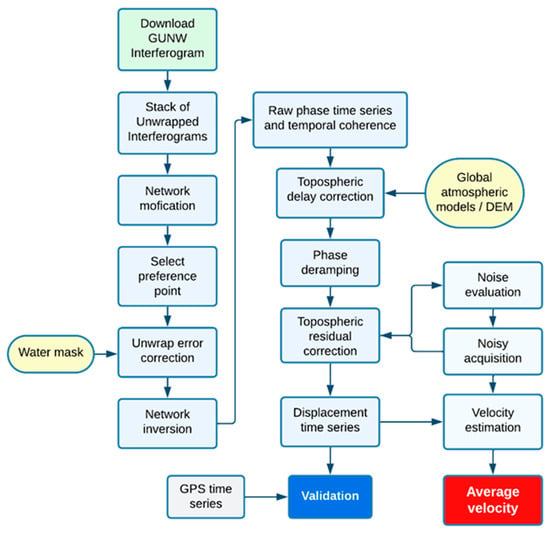
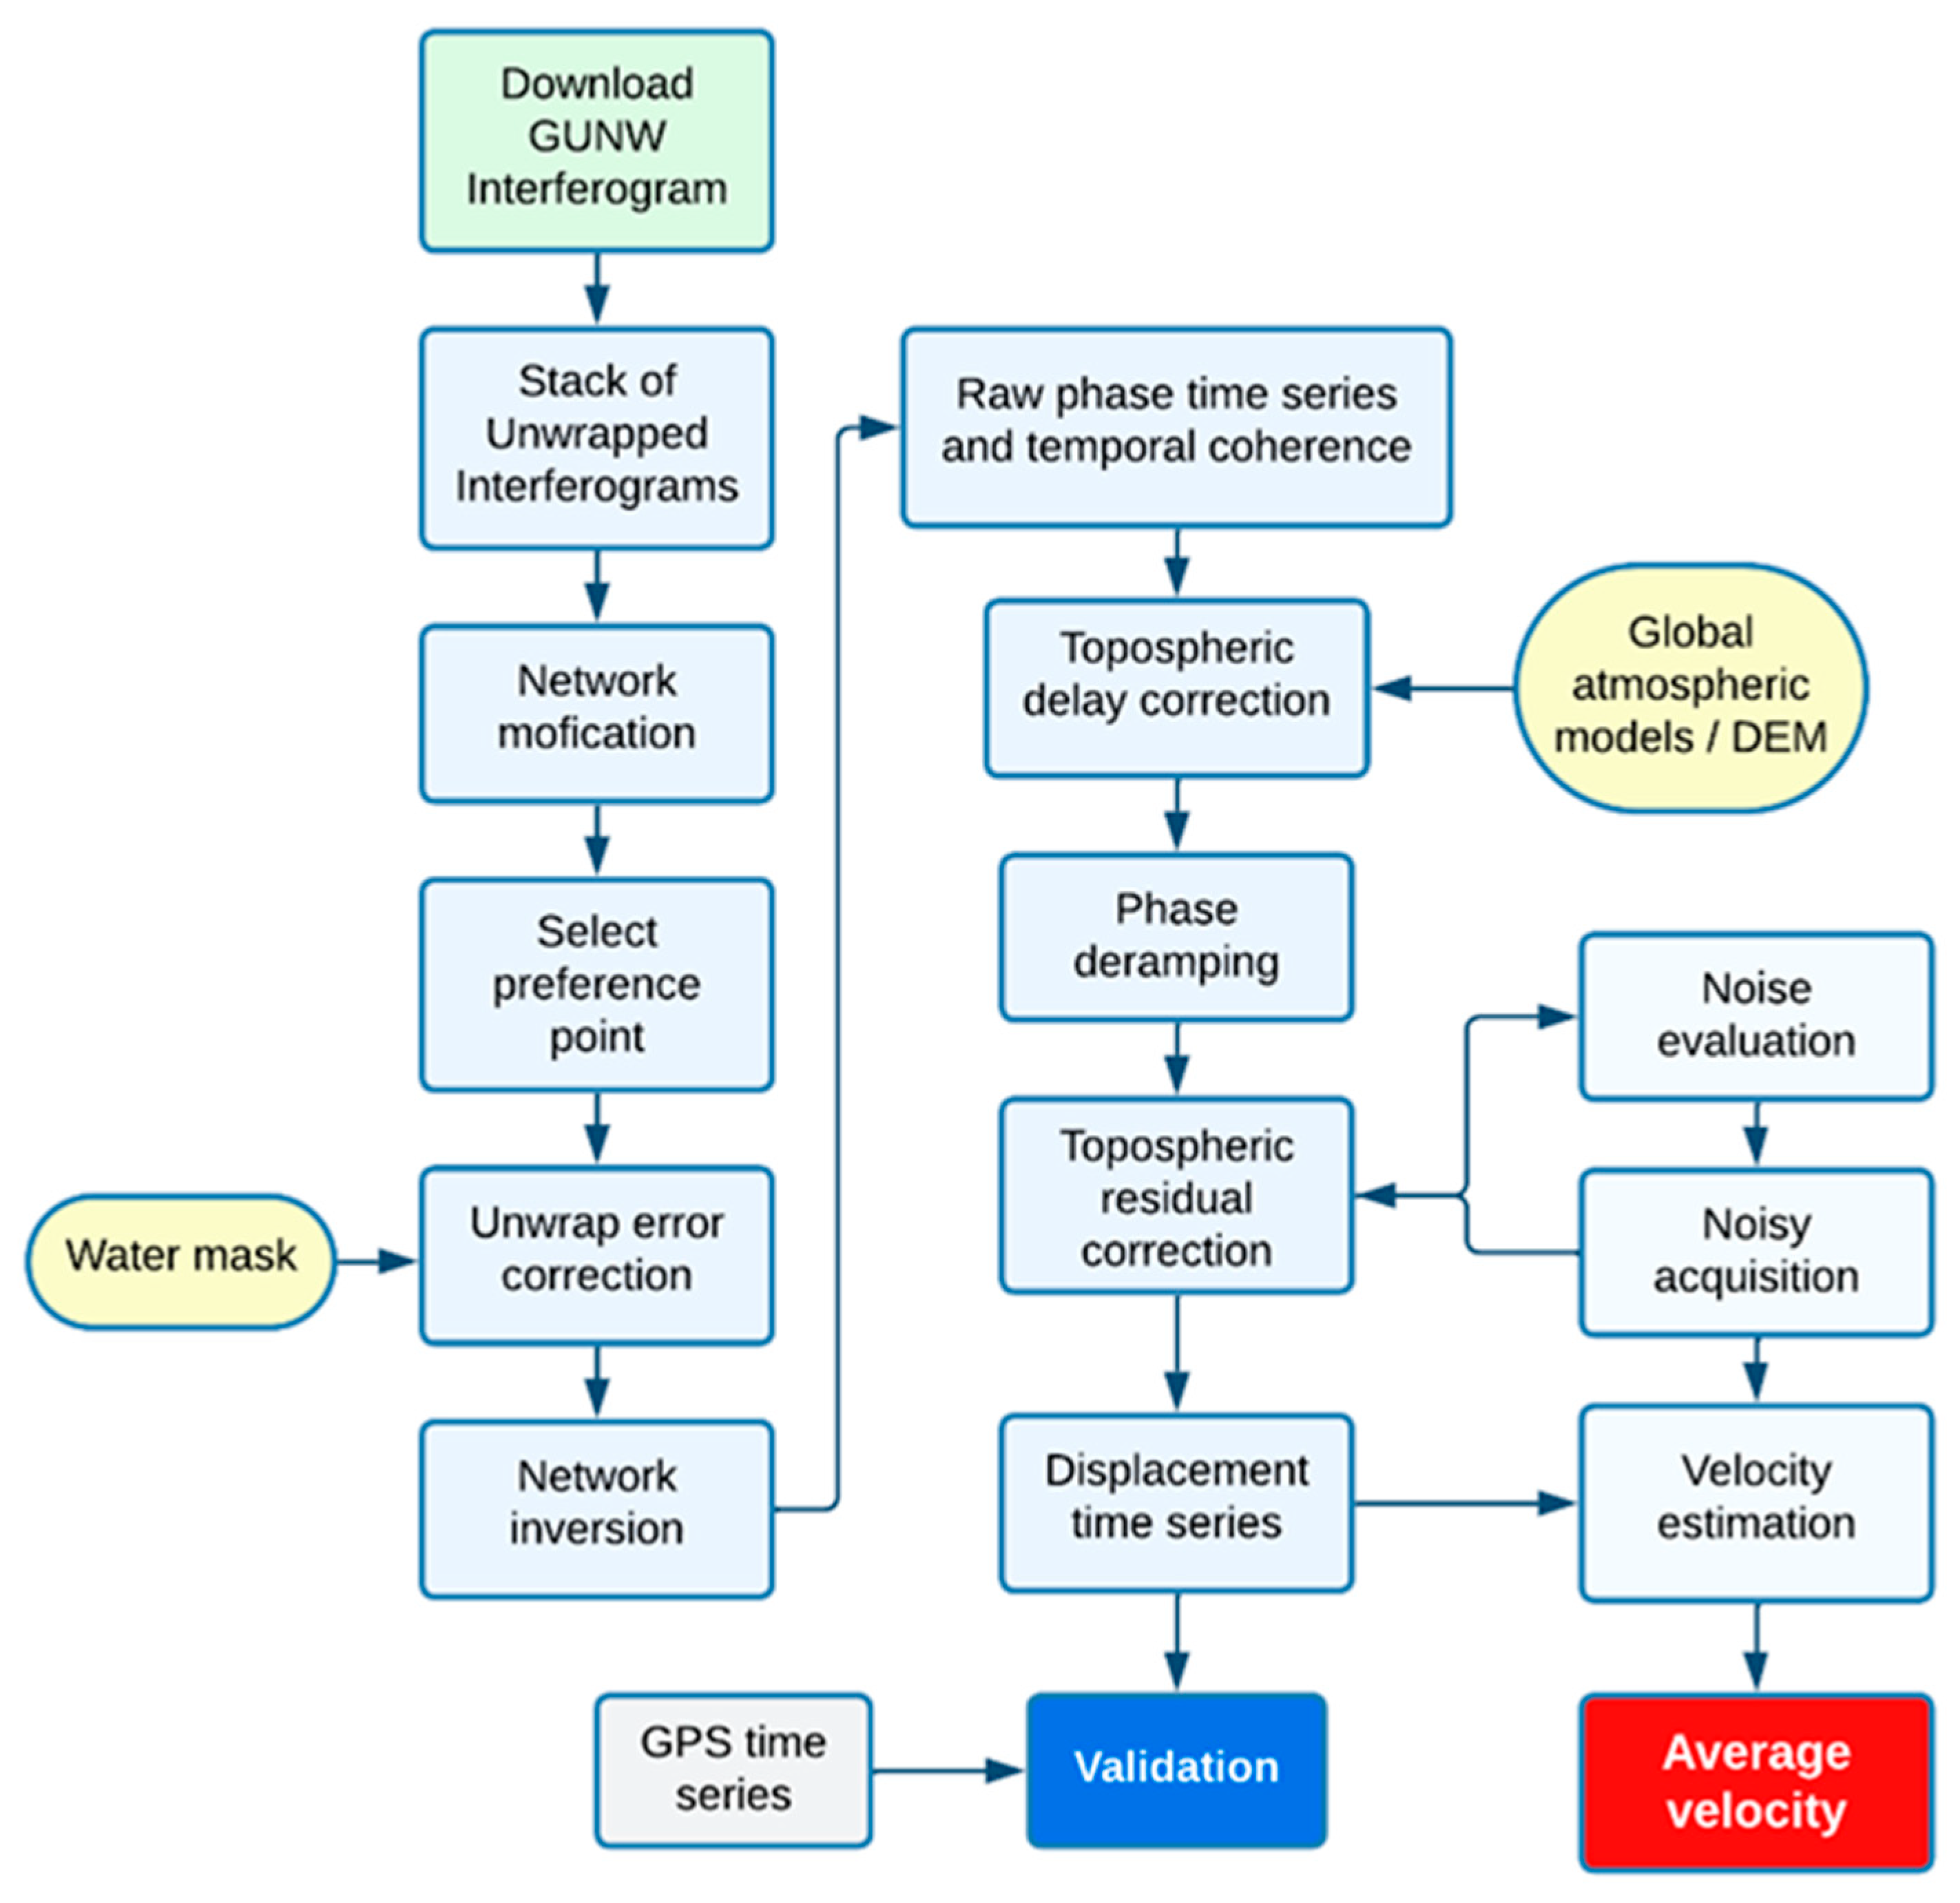
The workflow consists of two main blocks: correcting unwrapping errors and inverting for the raw phase time-series and correcting for noise from different sources to obtain the displacement time-series. Some steps are optional, which are switched off by default. Figure 2 summarizes the InSAR data processing steps and provides a workflow that includes several steps to invert a stack of unwrapped interferograms and apply different corrections to obtain the ground displacement time-series.
Figure 2.
Flowchart of the SBAS-InSAR time-series processing workflow using MintPy.
2.4. Machine-Learning Framework for High-Risk Zone Identification
2.4.1. Training Data Development
Training data consisted of 500 stratified sampling points (minimum separation 500 m) classified through multi-source decision criteria: subsidence-prone required negative LOS velocity < −2 cm/year combined with landfill boundary colocation (Google Earth) and surface disturbance; uplift-prone required positive LOS velocity > +2 cm/year combined with active dune forms (Sentinel-2) and depositional topography (TPI < −1); stable required |velocity| < 1 cm/year with no geomorphic activity indicators. All assignments required concordance between InSAR trends and at least two independent verification sources.
Manual classification into final categories (“stable”, “subsidence-prone”, “uplift-prone”) utilized multi-source interpretation: (1) InSAR time-series consistency and residual phase RMS; (2) Sentinel-2 land cover (10 m); (3) Google Earth Pro historical imagery for dune forms and landfill boundaries; and (4) SRTM DEM derivatives for topographic context. Labeling criteria required colocation of negative LOS trends with landfill polygons for subsidence-prone classification, and positive LOS trends with active dune fields in depositional settings for uplift-prone classification.
Twelve predictor variables were extracted from 3 × 3-pixel neighborhoods (90 m × 90 m): mean LOS velocity and temporal coherence (Group A); slope, aspect, and topographic position index (Group B); wind exposure index (from ERA5 10 m winds):
where is the Mean resultant vector magnitude (wind exposure index). n is the Total number of ERA5 hourly wind observations (2016–2023). ui is the Eastward (zonal) wind component at 10 m height for observation. vi is the Northward (meridional) wind component at 10 m height for observation, and i is the Index for individual hourly wind observations and drift potential (Group C); distance to lineaments, NDVI, and land surface temperature amplitude (Group D).
2.4.2. Model Training and Validation
Random Forest classification (scikit-learn v1.3.0) employed nested five-fold cross-validation for hyperparameter optimization on 70% of data (n = 350). Search space included: n_estimators [50, 100, 200], max_depth [5, 10, 15], min_samples_split [2, 5, 10]. Final parameters: 100 trees, max depth 10, min_samples_split 5, max_features ‘sqrt’. Optimization metric: F1-macro score.
Performance assessment utilized a held-out 30% test set (n = 150). Spatial k-fold cross-validation (geographic block folds) yielded a mean accuracy of 84.7% (±3.2%), confirming generalization beyond training locations. Out-of-bag error estimation provided internal validation without the need for separate test sets. For validation using a held-out test set, performance is assessed using the following:
Overall Accuracy
Precision (for Class )
Recall (for Class )
F1-Score (for Class )
where
- = True Positives for class
- = True Negatives for class
- = False Positives for class
- = False Negatives for class
3. Results
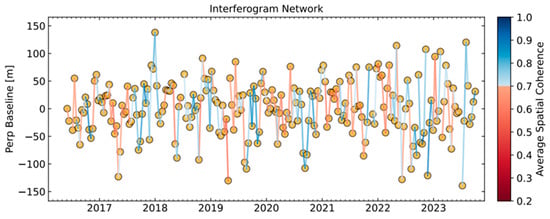
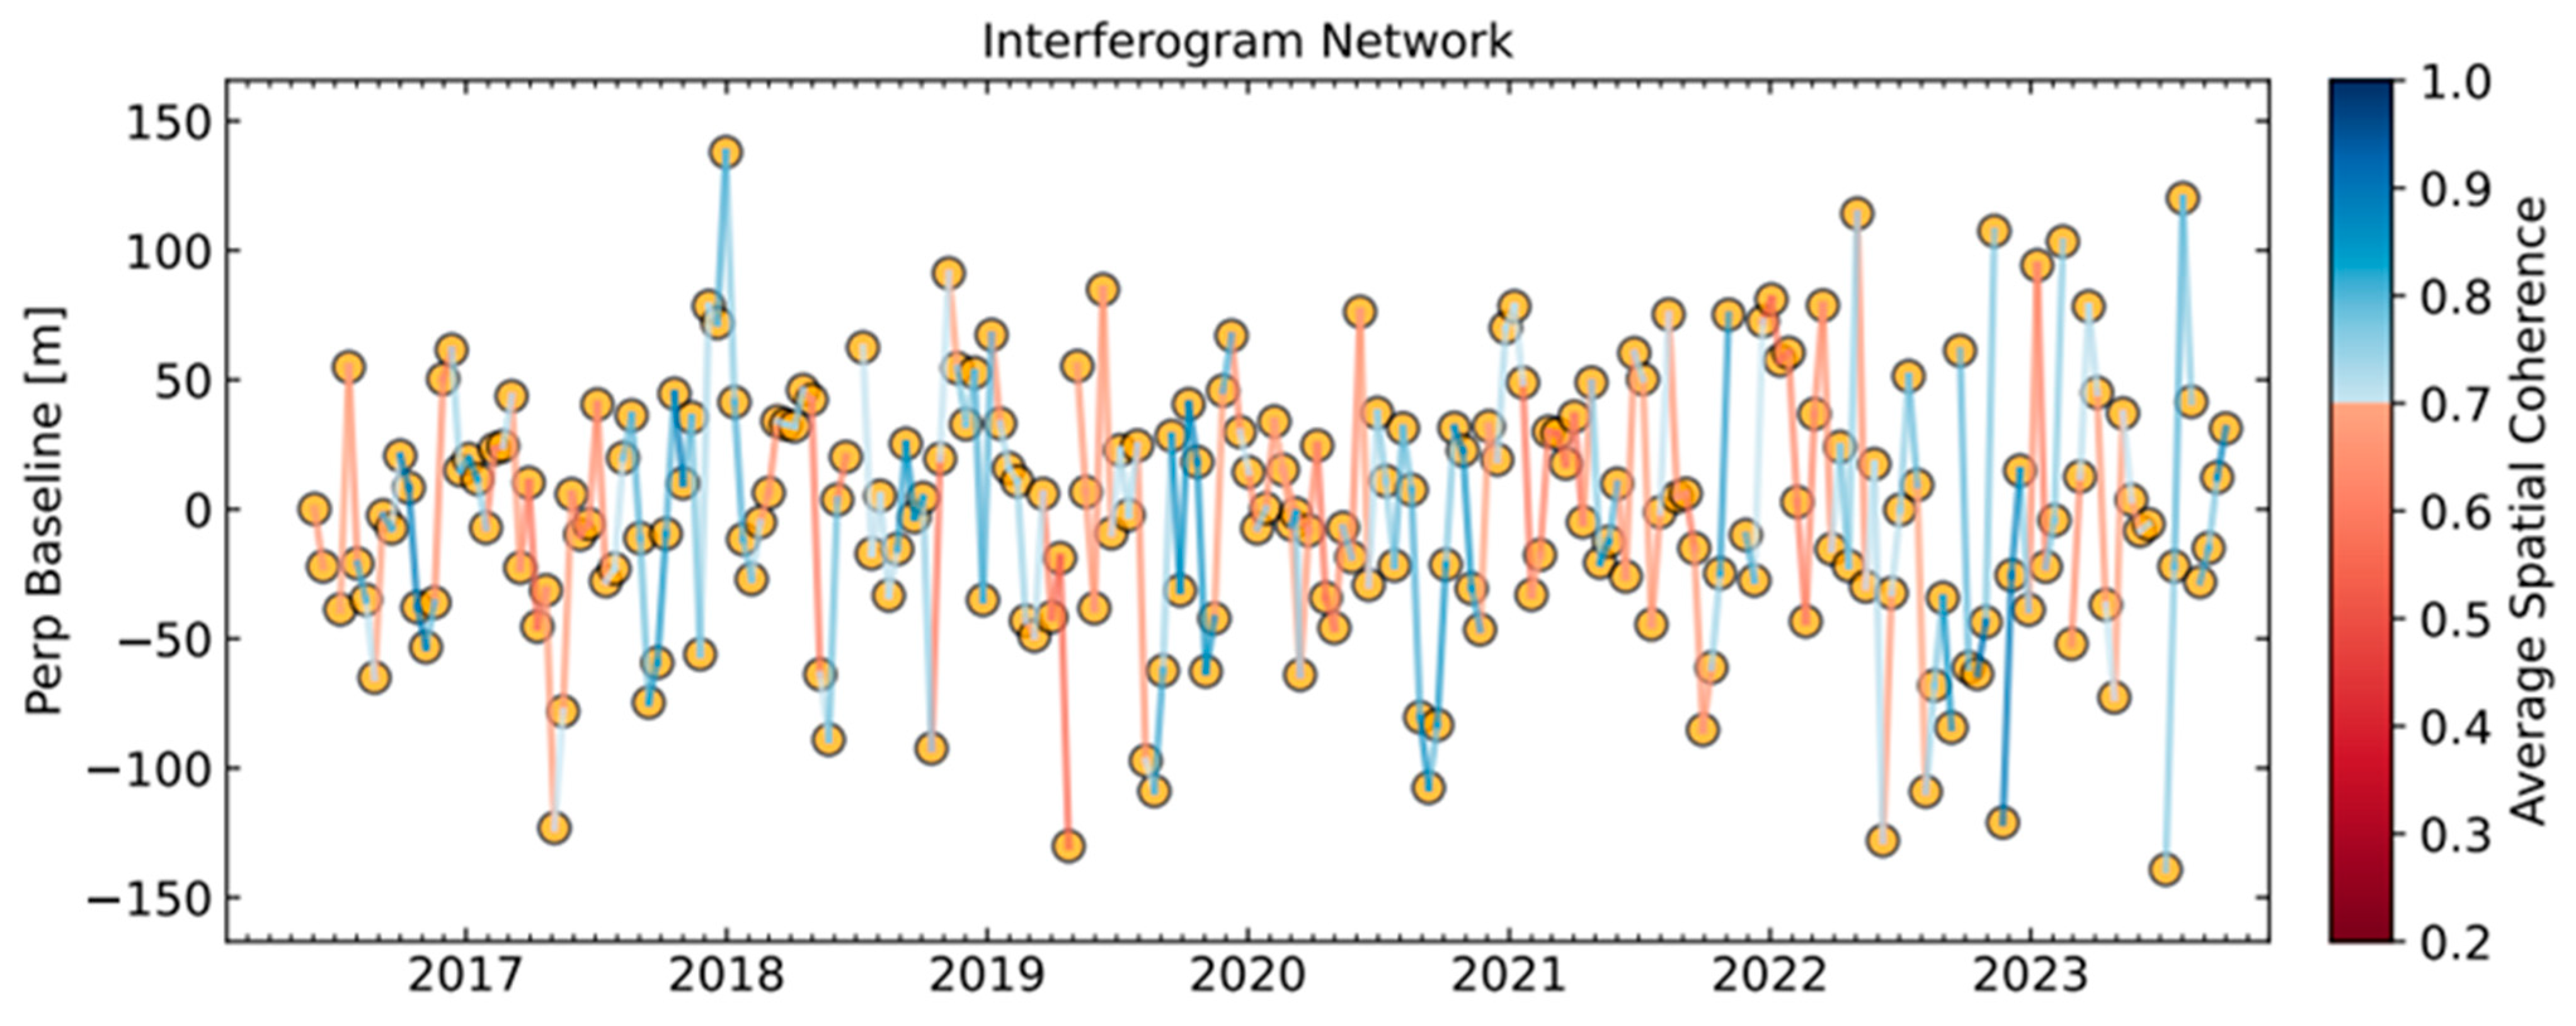
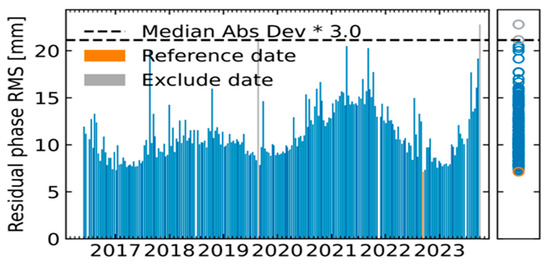
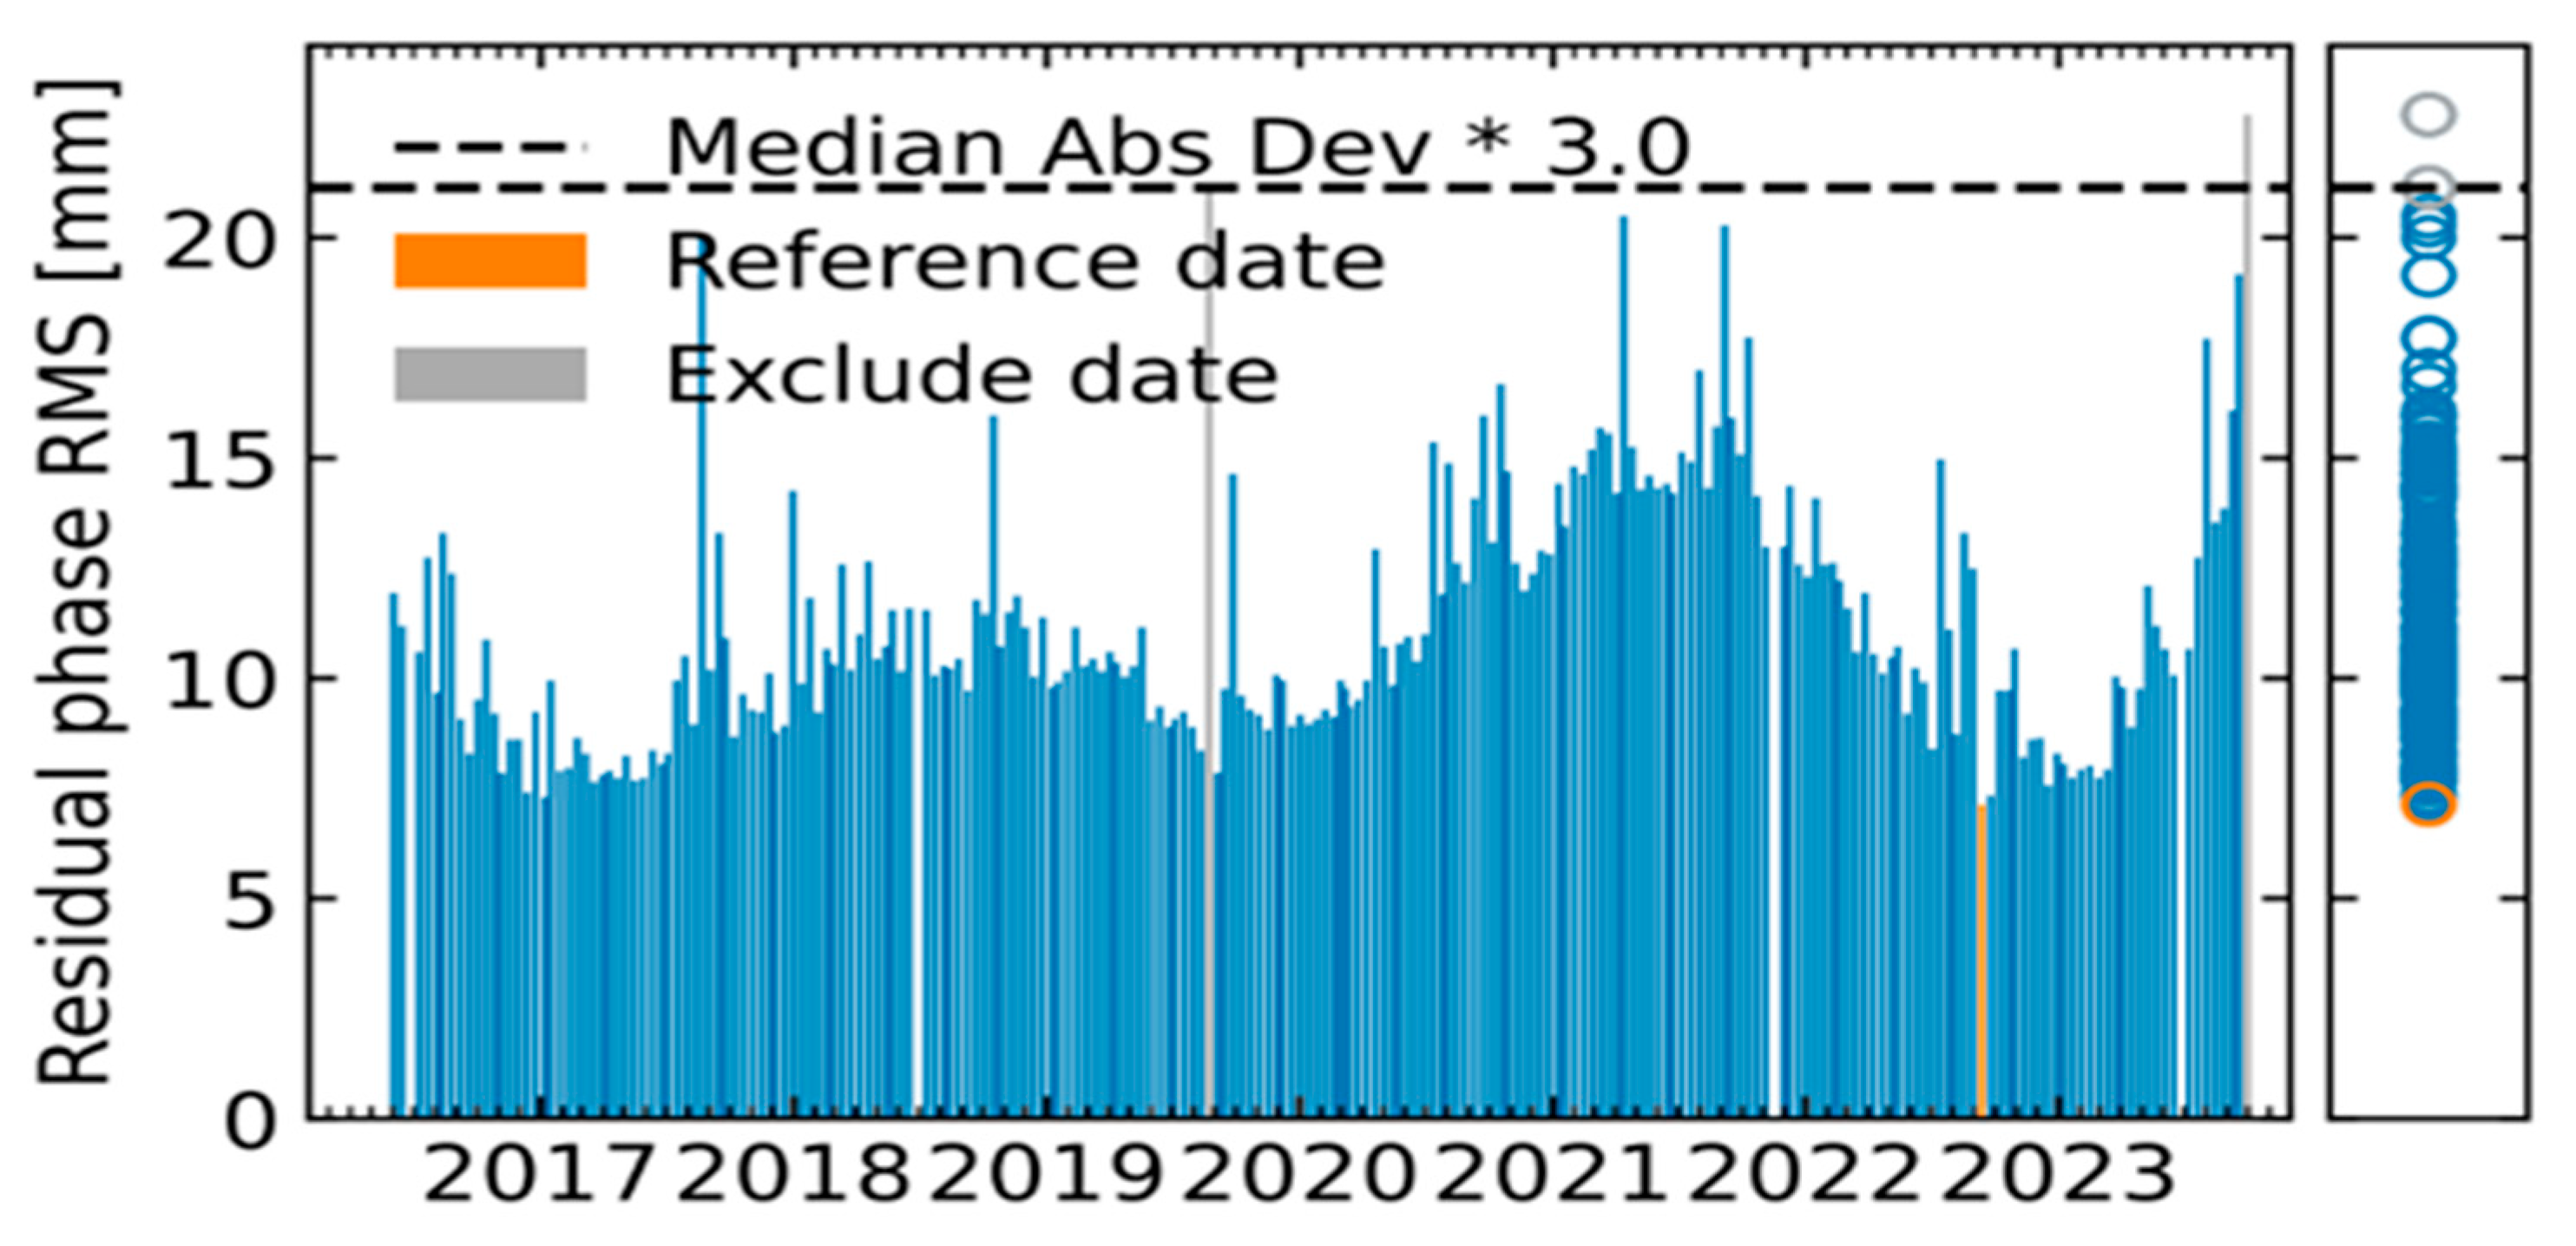
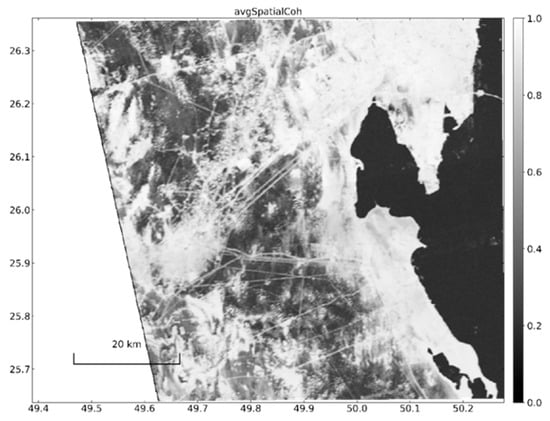
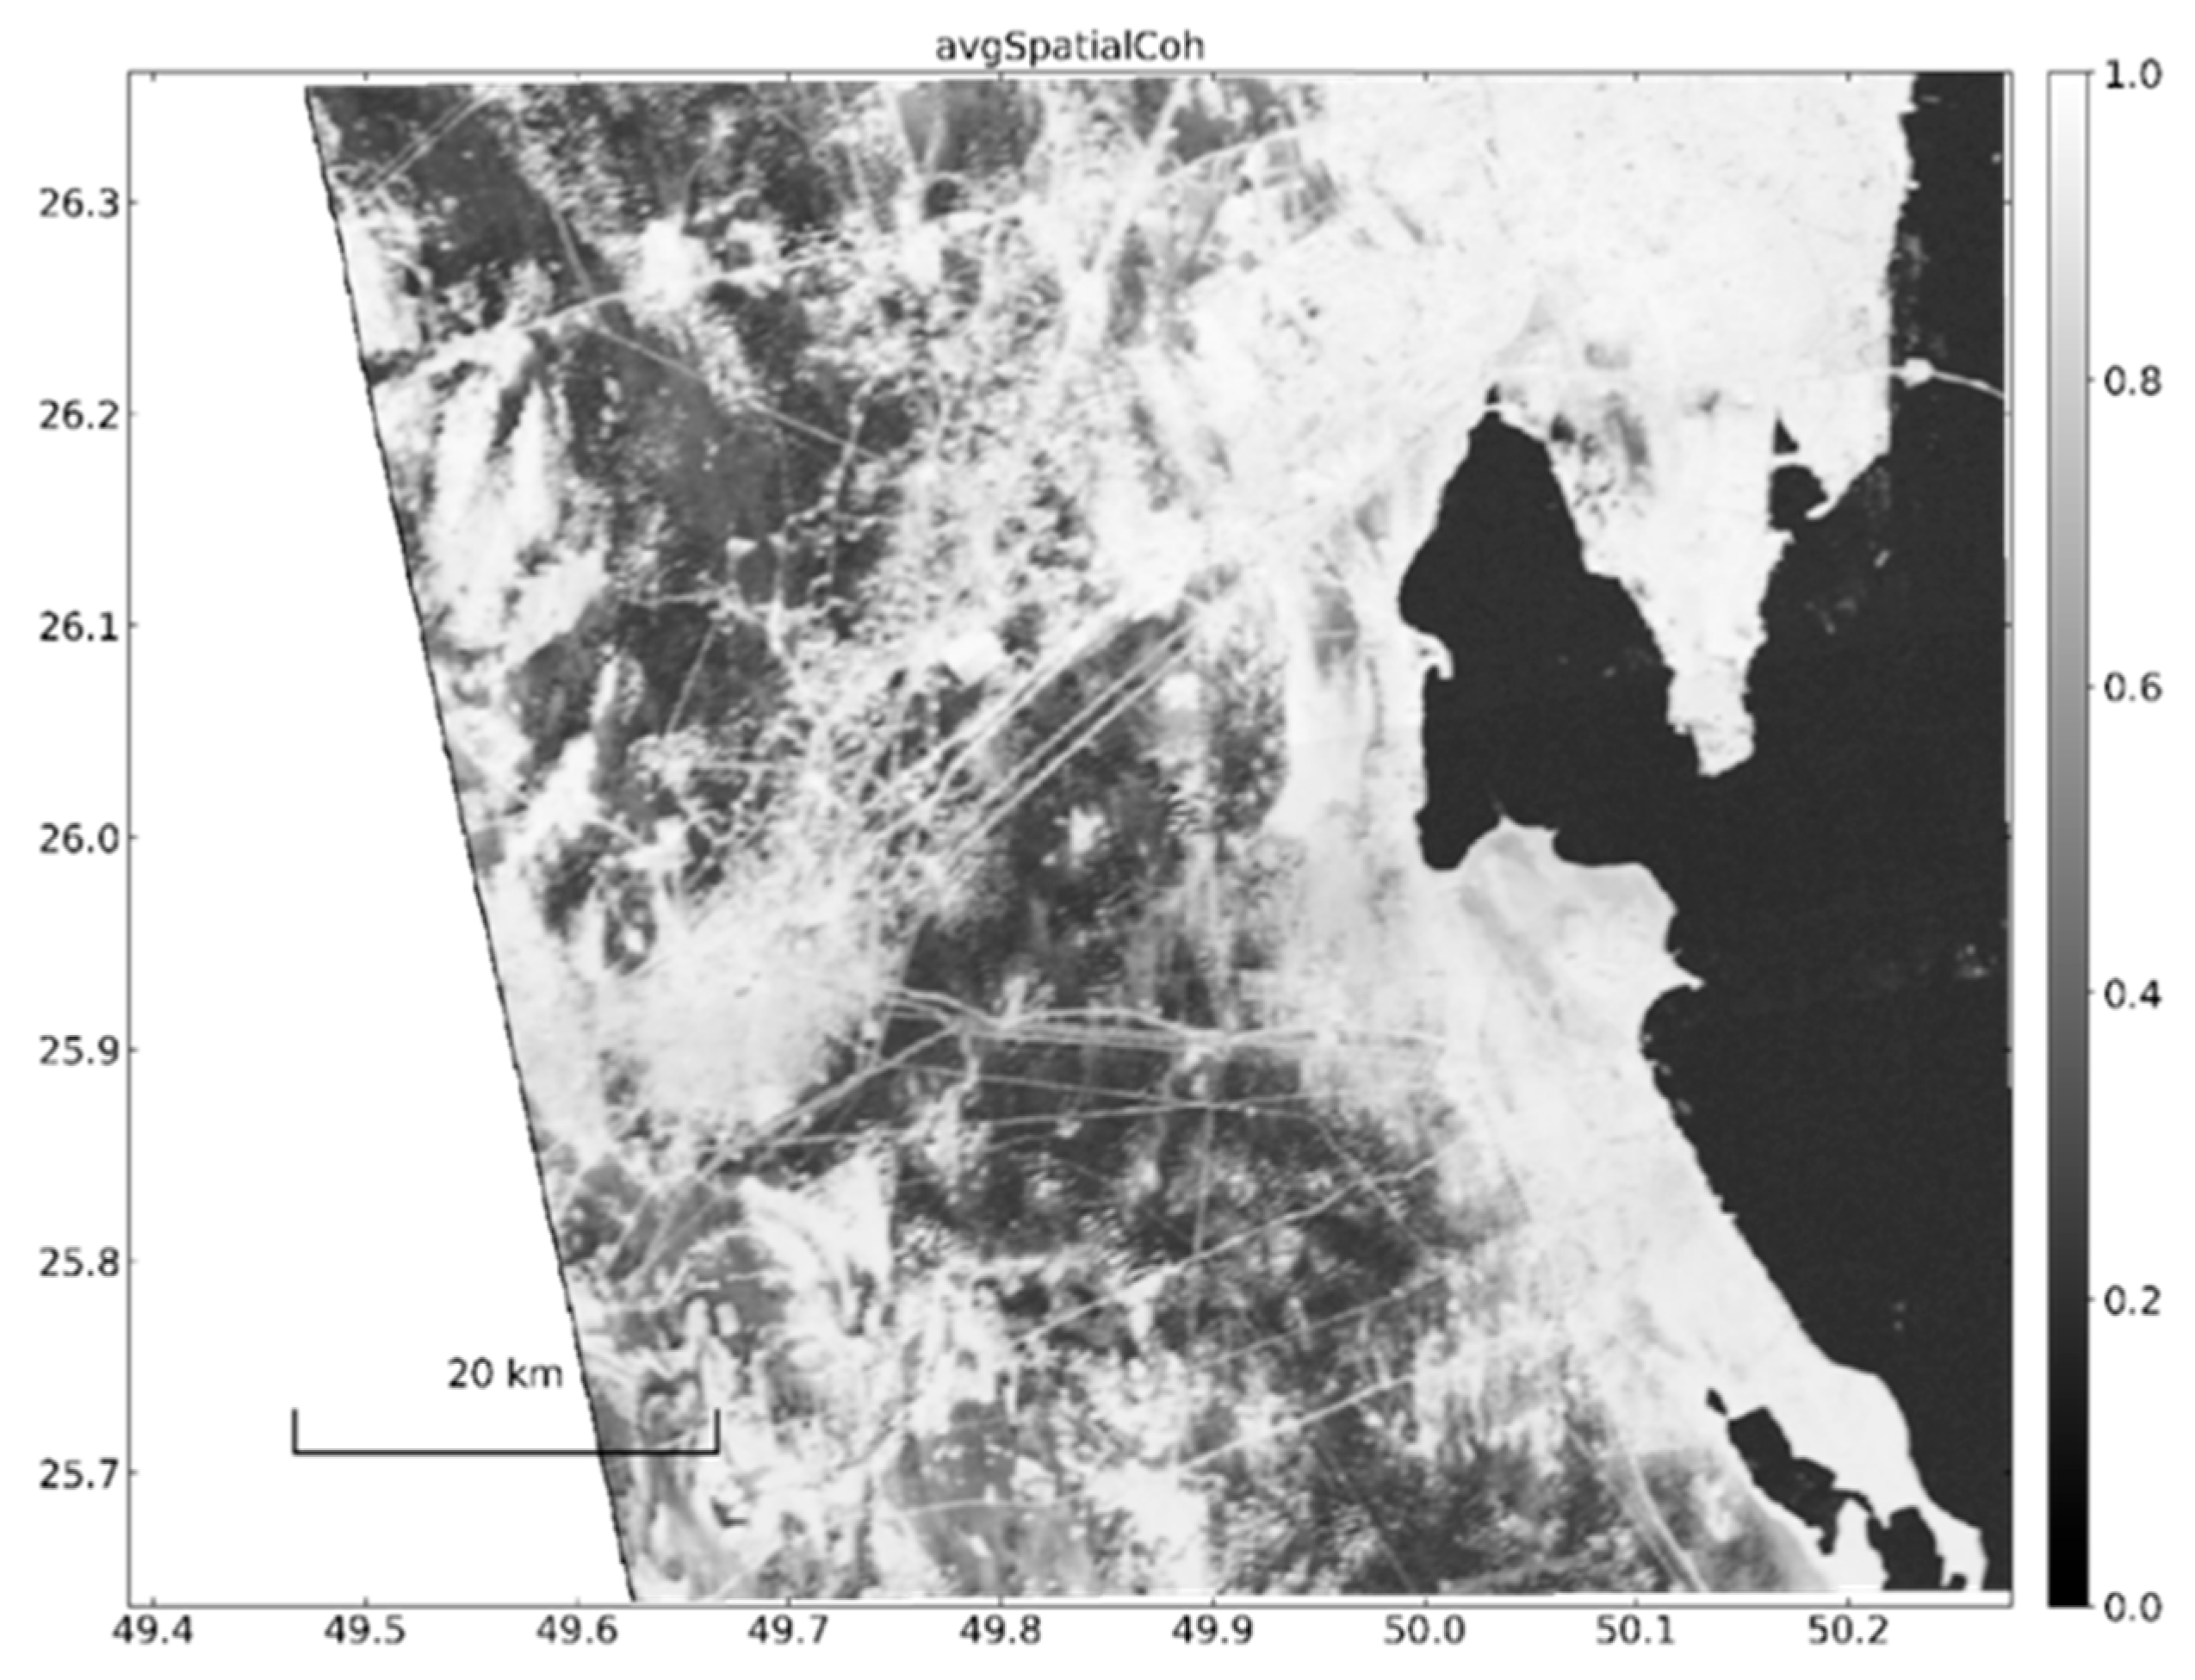
The interferogram network and residual phase root mean square (RMS) values in millimeters are presented in Figure 3 and Figure 4, respectively. The reference date is marked in orange, while excluded dates are indicated in gray. Spatial coherence across the study area, shown in Figure 5, ranged from low to high, reflecting the complex interactions between surface properties and atmospheric conditions. High coherence values were predominantly observed in stable regions, such as rocky outcrops and built-up areas, while lower coherence was associated with dynamic zones, such as active sand dunes and vegetation-covered regions [30].
Figure 3.
Interferogram network, perpendicular baseline, and average spatial coherence information of 213 images.
Figure 4.
Residual phases contain the image acquisition date. The reference date is indicated by orange color and the excluded date by gray color.
Figure 5.
Average spatial coherence.
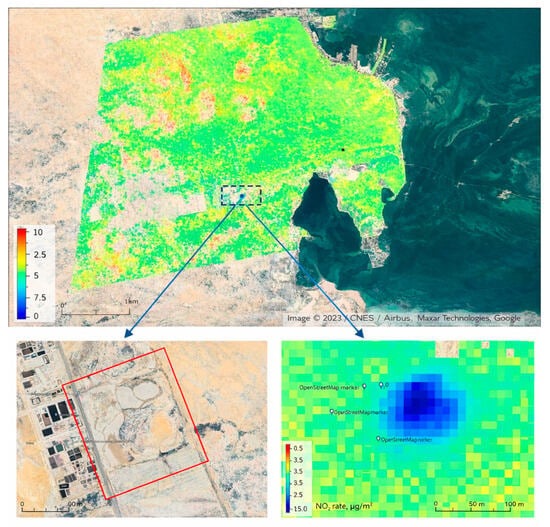
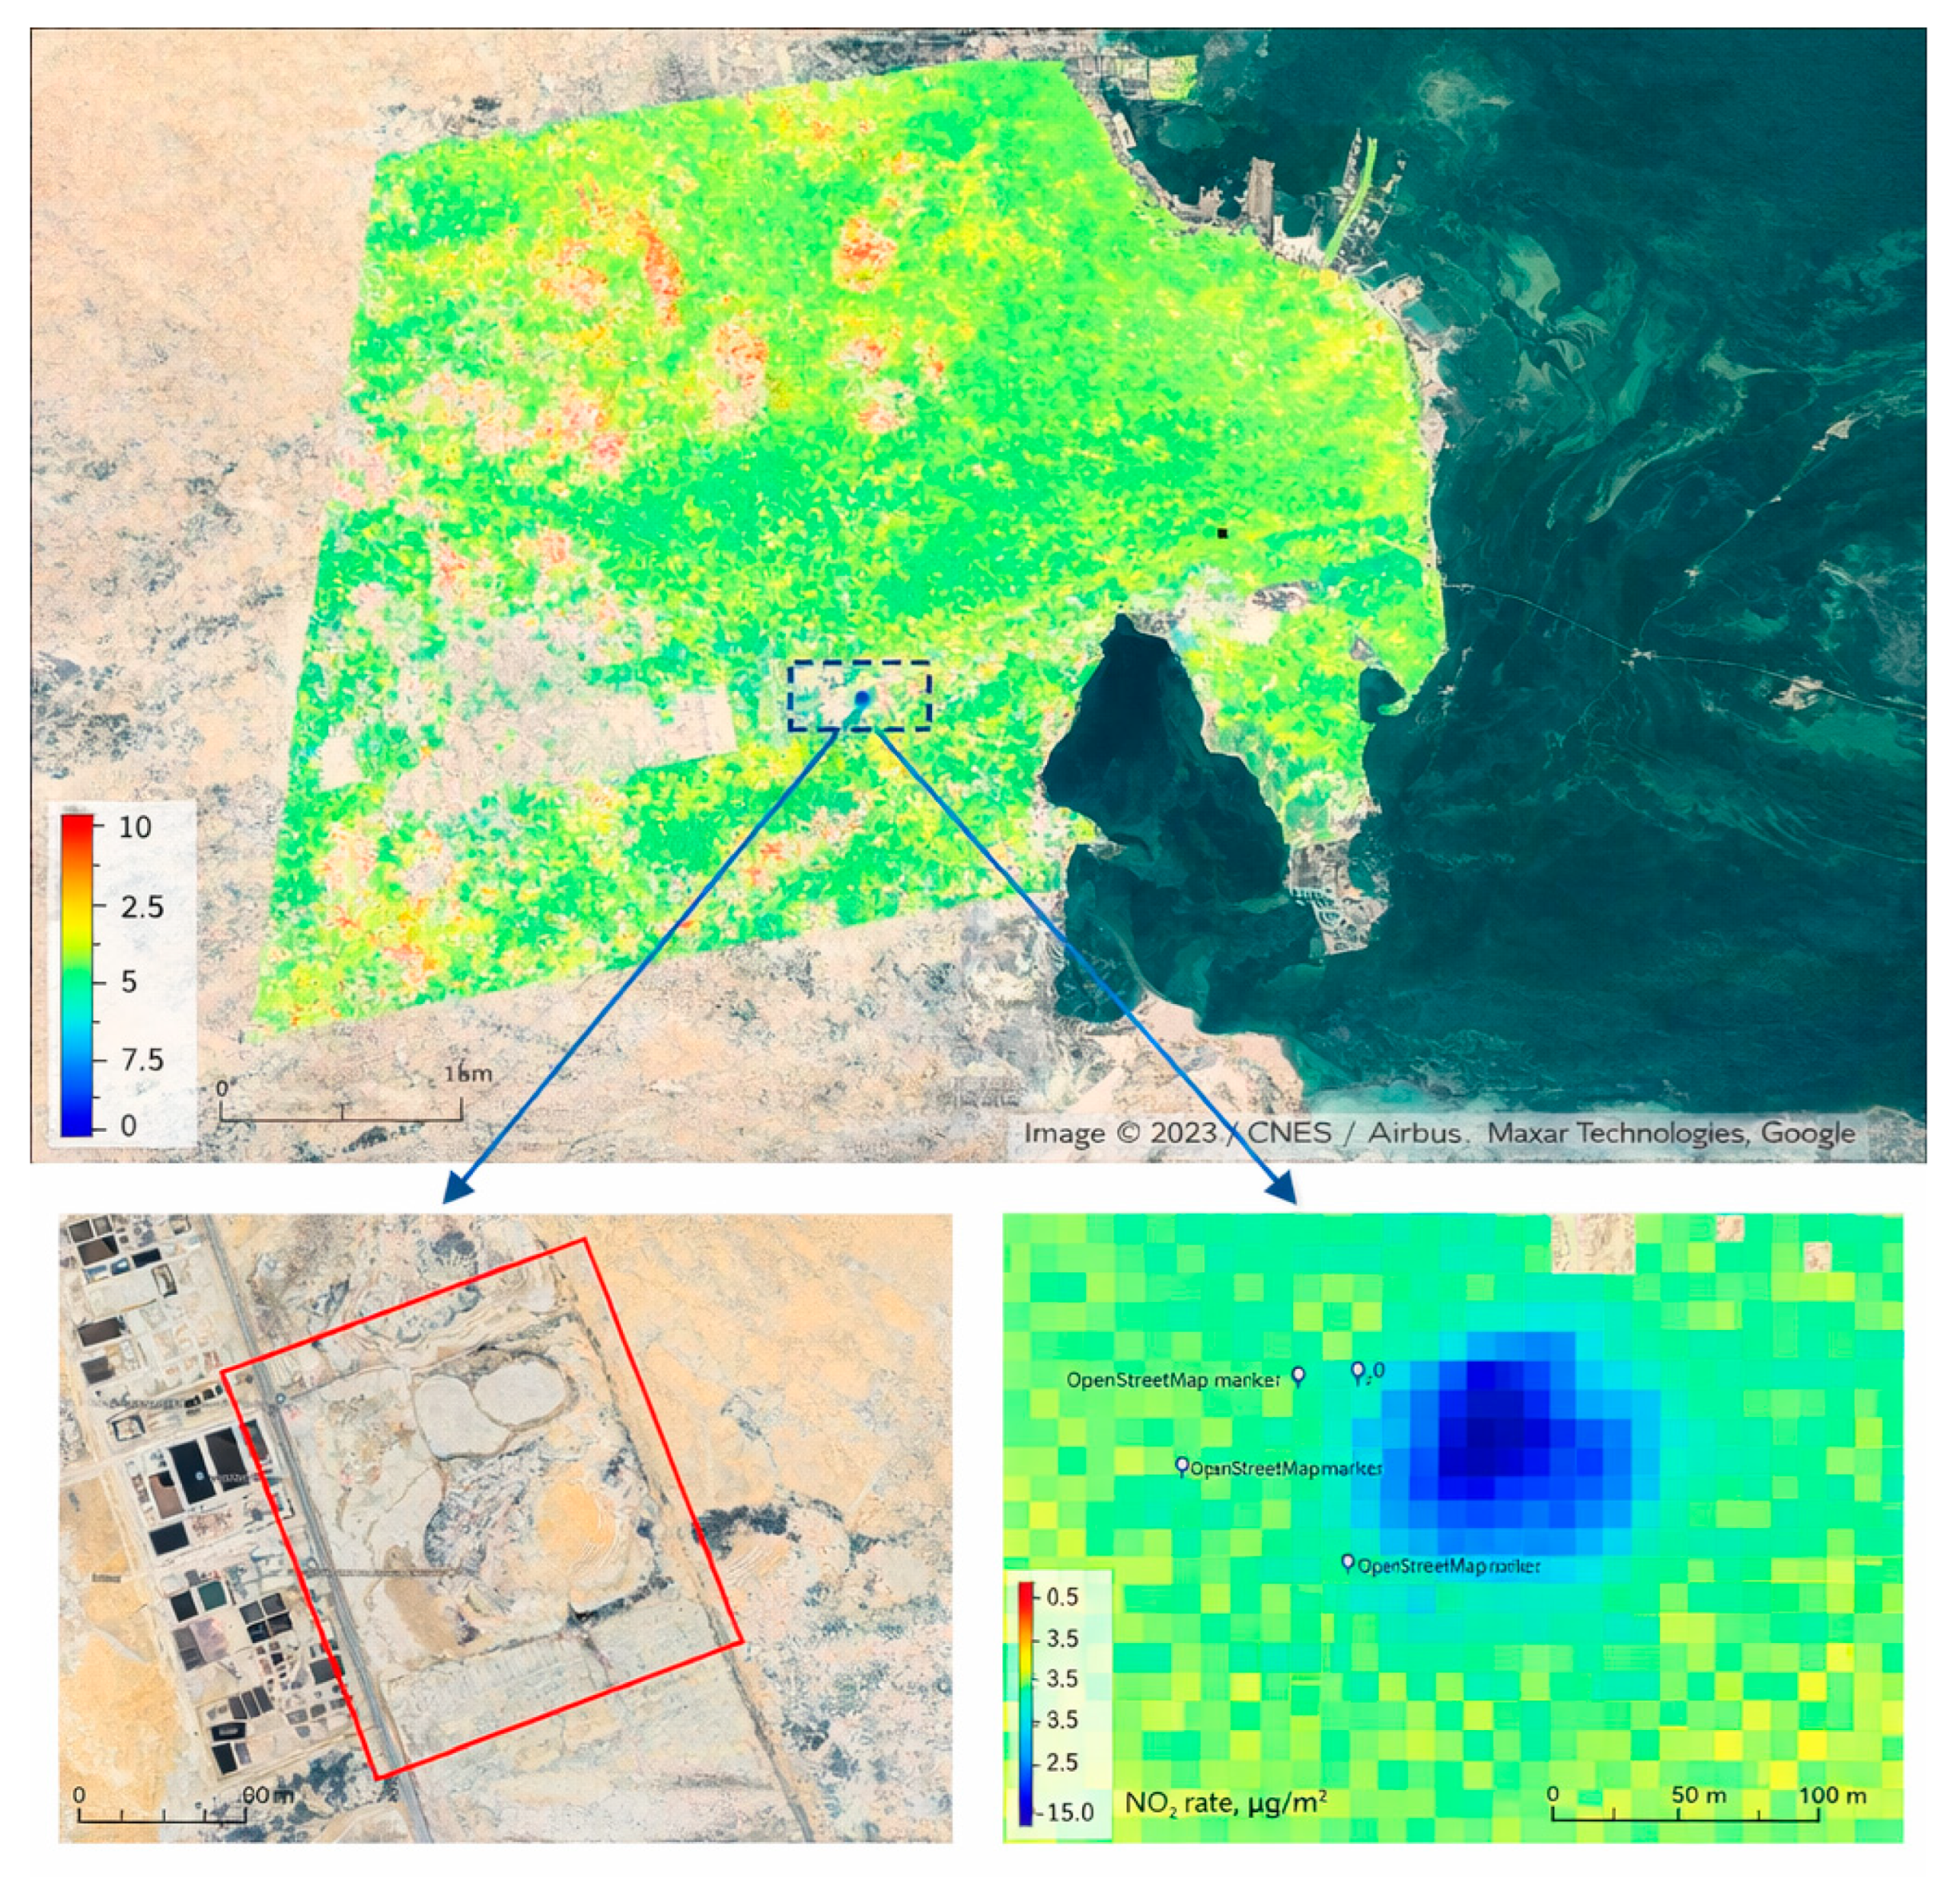
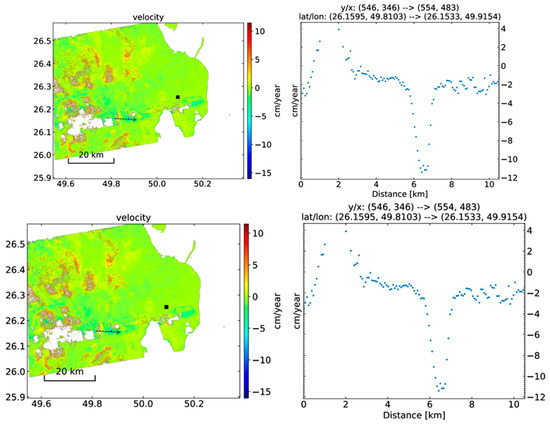
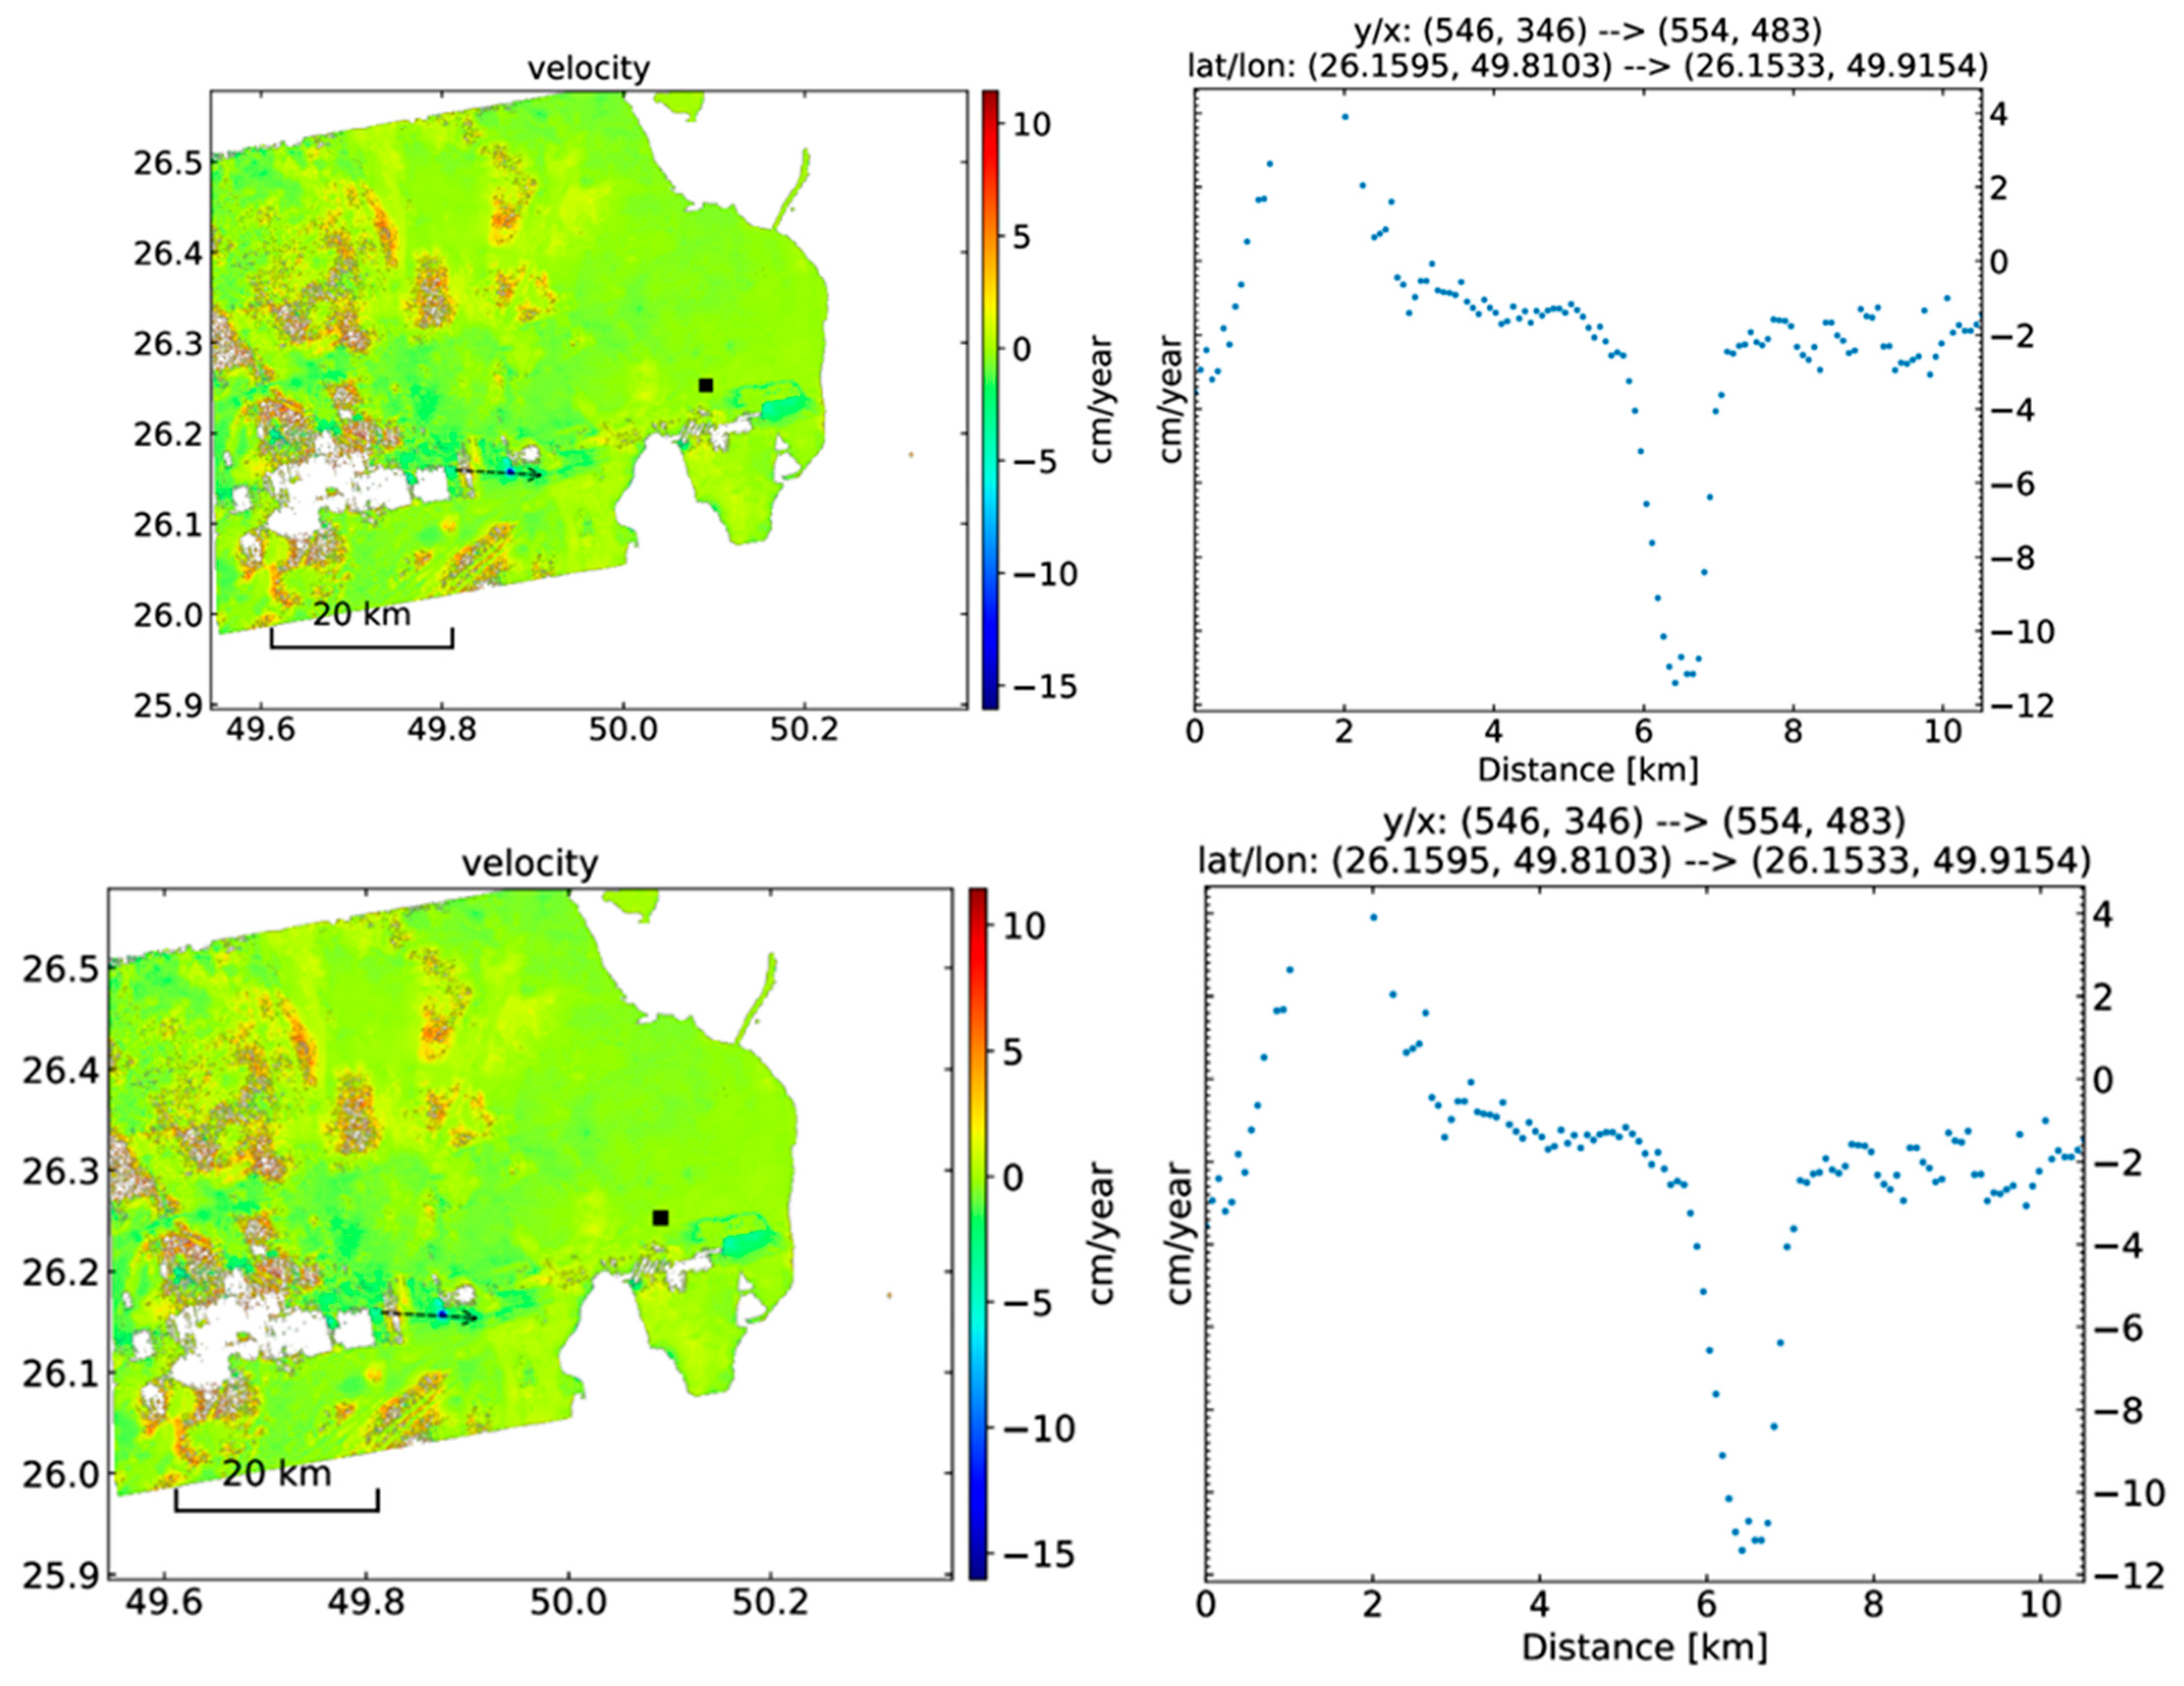
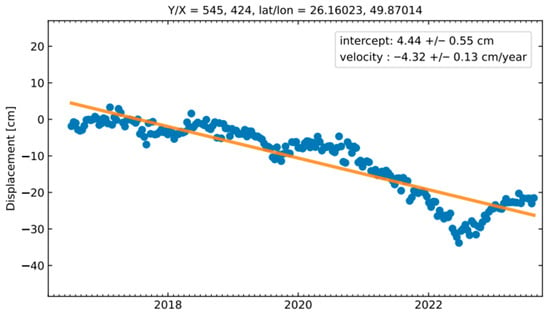
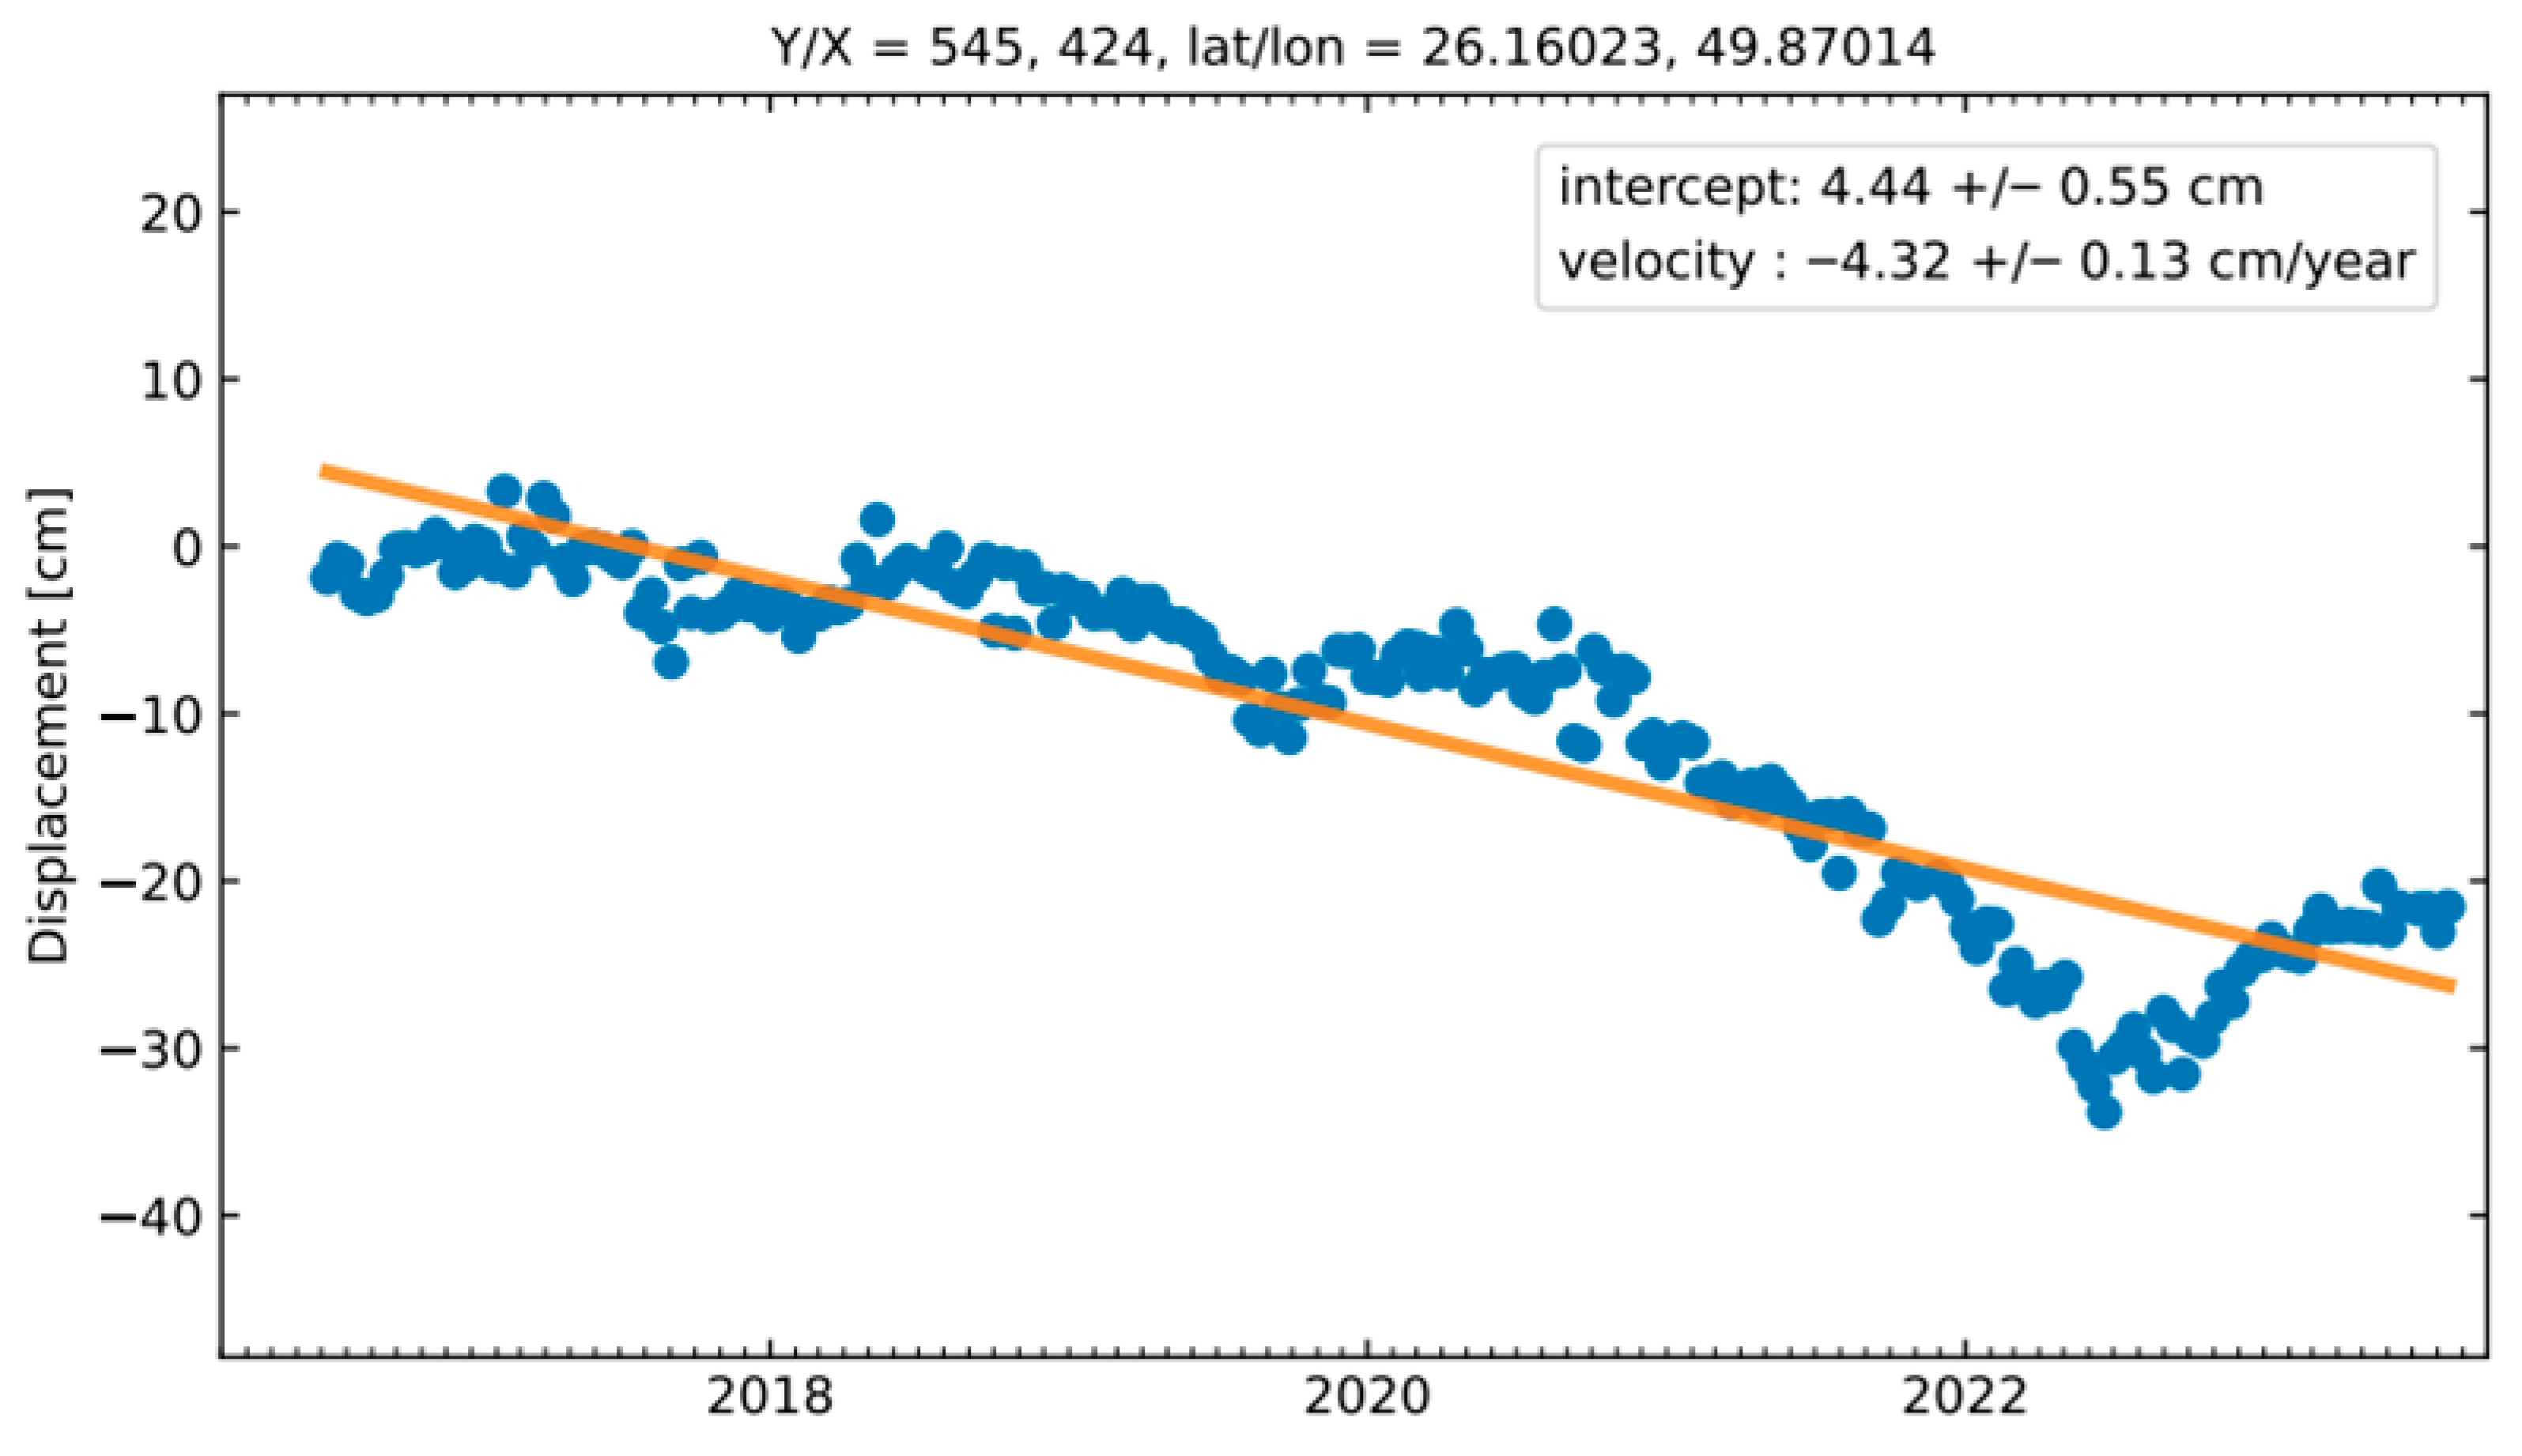
In terms of surface deformation, Figure 6 illustrates the average displacement map, with subsidence rates ranging from −15 cm/year to 10 cm/year between 2016 and 2023. Notably, significant subsidence (between −8 and −10 cm/year) was detected in landfill areas, attributed to waste compaction and organic decomposition processes. The cross-sectional analysis in Figure 7 further highlights the spatial distribution of subsidence, confirming these rates and their temporal consistency. Over the study period, subsidence in landfill regions exhibited a clear downward trend, with a displacement velocity of approximately −4.32 cm/year (Figure 8). This ongoing subsidence underscores the dynamic nature of the landfill areas and their potential environmental and infrastructural impacts [31].
Figure 6.
Significant subsidence results conducted over a waste landfill area captured by Google Earth, ranging from −12 to −15 cm/year, The area within the red line is the landfill site.
Figure 7.
Cross-section through the gradient of the LOS velocity according to Lat/Lon given on the right side of the cross-section plot. The arrows is the displacement direction and the black square is the reference point.
Figure 8.
Point-based velocity time-series trend line.
In water, depending on the signal reflection type, the emitted radiation from the radar is reflected away from the sensor. The results are represented as dark-on amplitude SAR images. The building and bedrock have high amplitude when the signal is directly reflected by a sensor, resulting in a bright amplitude SAR image. Meanwhile, vegetation exhibits bouncing scatterers and diffusive behavior, and the radiation does not return directly to the sensor. Hence, the vegetation image in SAR resembles salt-and-pepper noise in a single SAR image, with the amplitude pattern varying strongly over time [32].
3.1. Subsidence Areas
Subsidence is evident in Figure 6, which shows the average line-of-sight (LOS) displacement map for the period 2016–2023, with values ranging from –15 cm/year (subsidence) to +10 cm/year (uplift). Blue tones indicate subsidence, most pronounced in the vicinity of the industrial landfill near Khobar. Further analysis is provided in Figure 7, which displays cross-sectional profiles of LOS velocity along selected transects. These profiles reveal displacement rates of approximately –8 to –10 cm/year within the waste disposal zone.
Subsidence rates exhibit both spatial and temporal variability. Across the monitored region during 2016–2023, negative displacement rates (i.e., downward movement) ranged from –2 to –12 cm/year. This subsidence is primarily attributed to compaction of municipal solid waste and ongoing organic decomposition in the landfill [11,33].
Time-series analysis from a representative pixel within the landfill (Figure 8) shows a consistent downward trend in displacement from 2019 to 2023, with an estimated LOS velocity of –4.32 cm/year. The intercept of 4.44 ± 0.55 cm provides a displacement baseline relative to the reference epoch. These findings highlight potential environmental and infrastructural risks, including altered surface drainage and increased flood susceptibility, underscoring the need for continuous deformation monitoring [5].
3.2. Uplifted Area
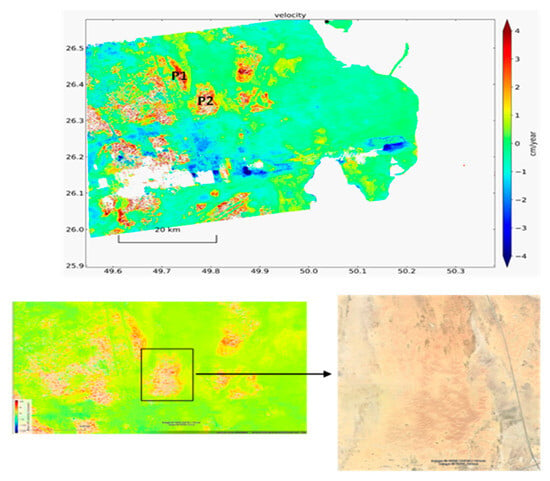
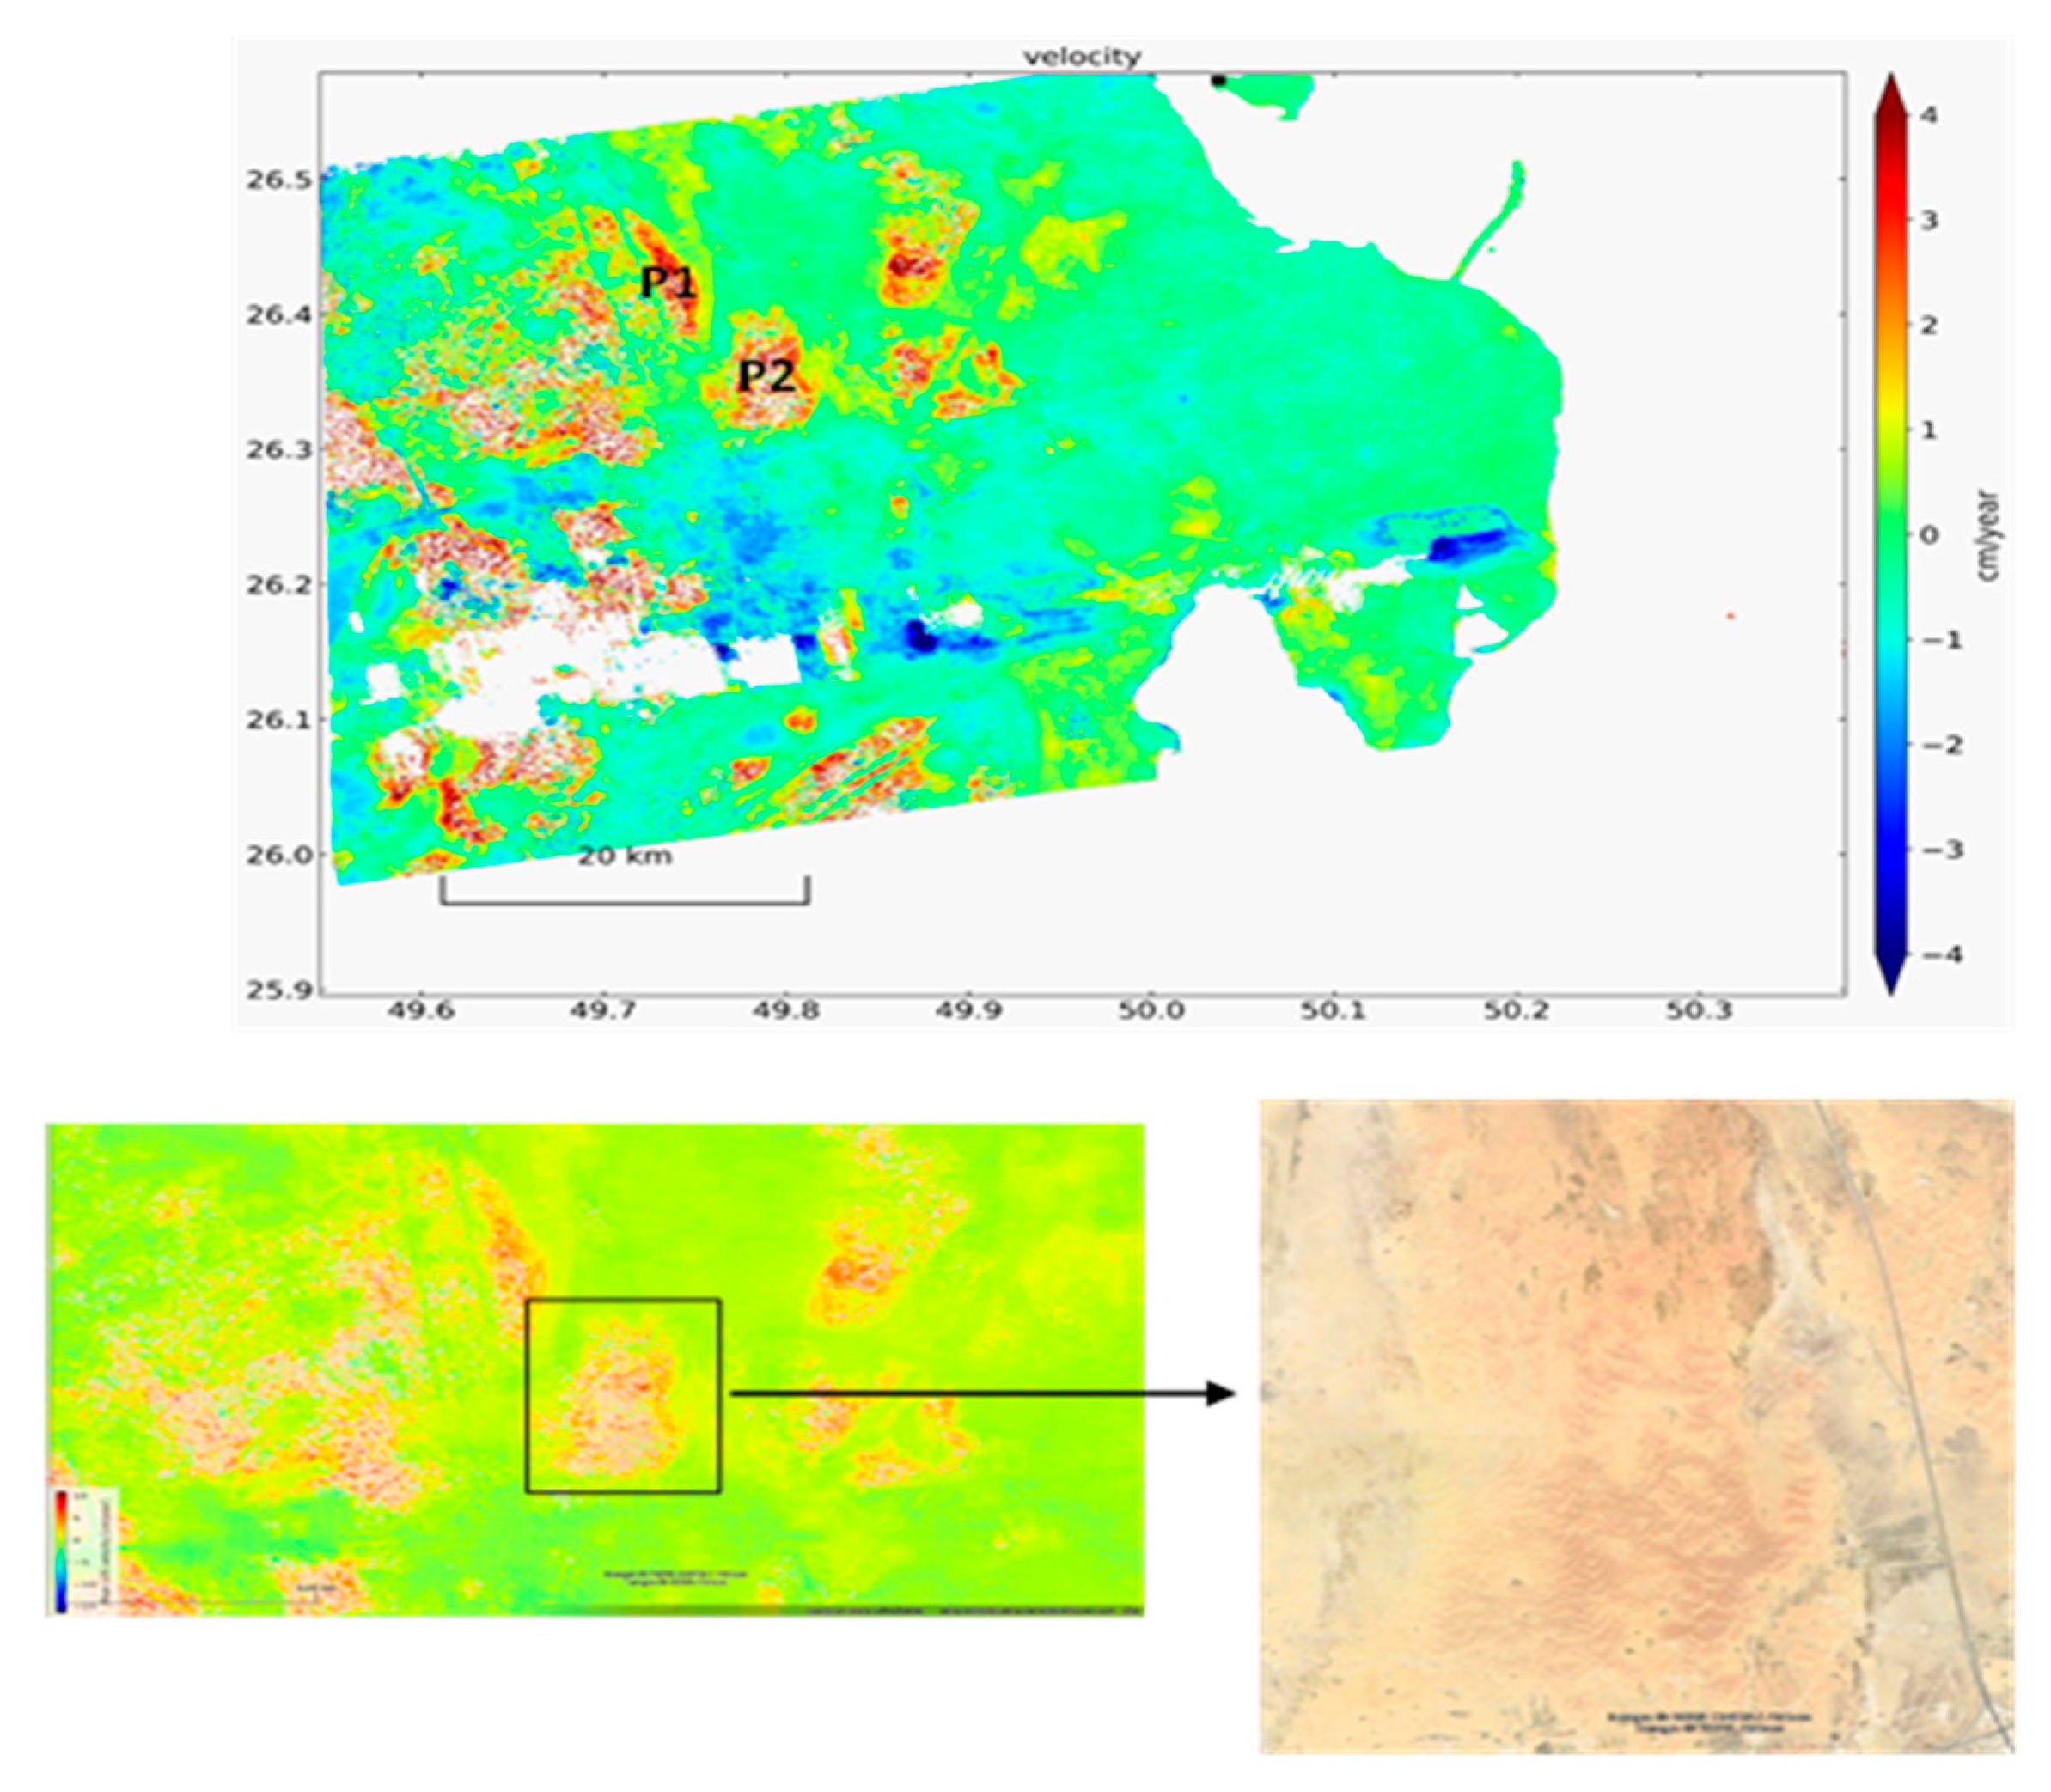
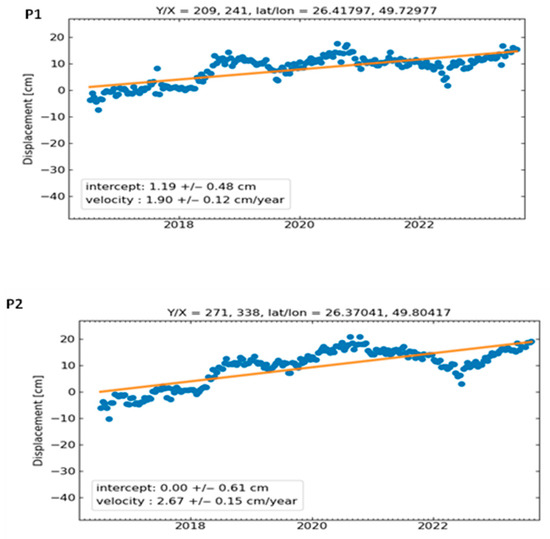
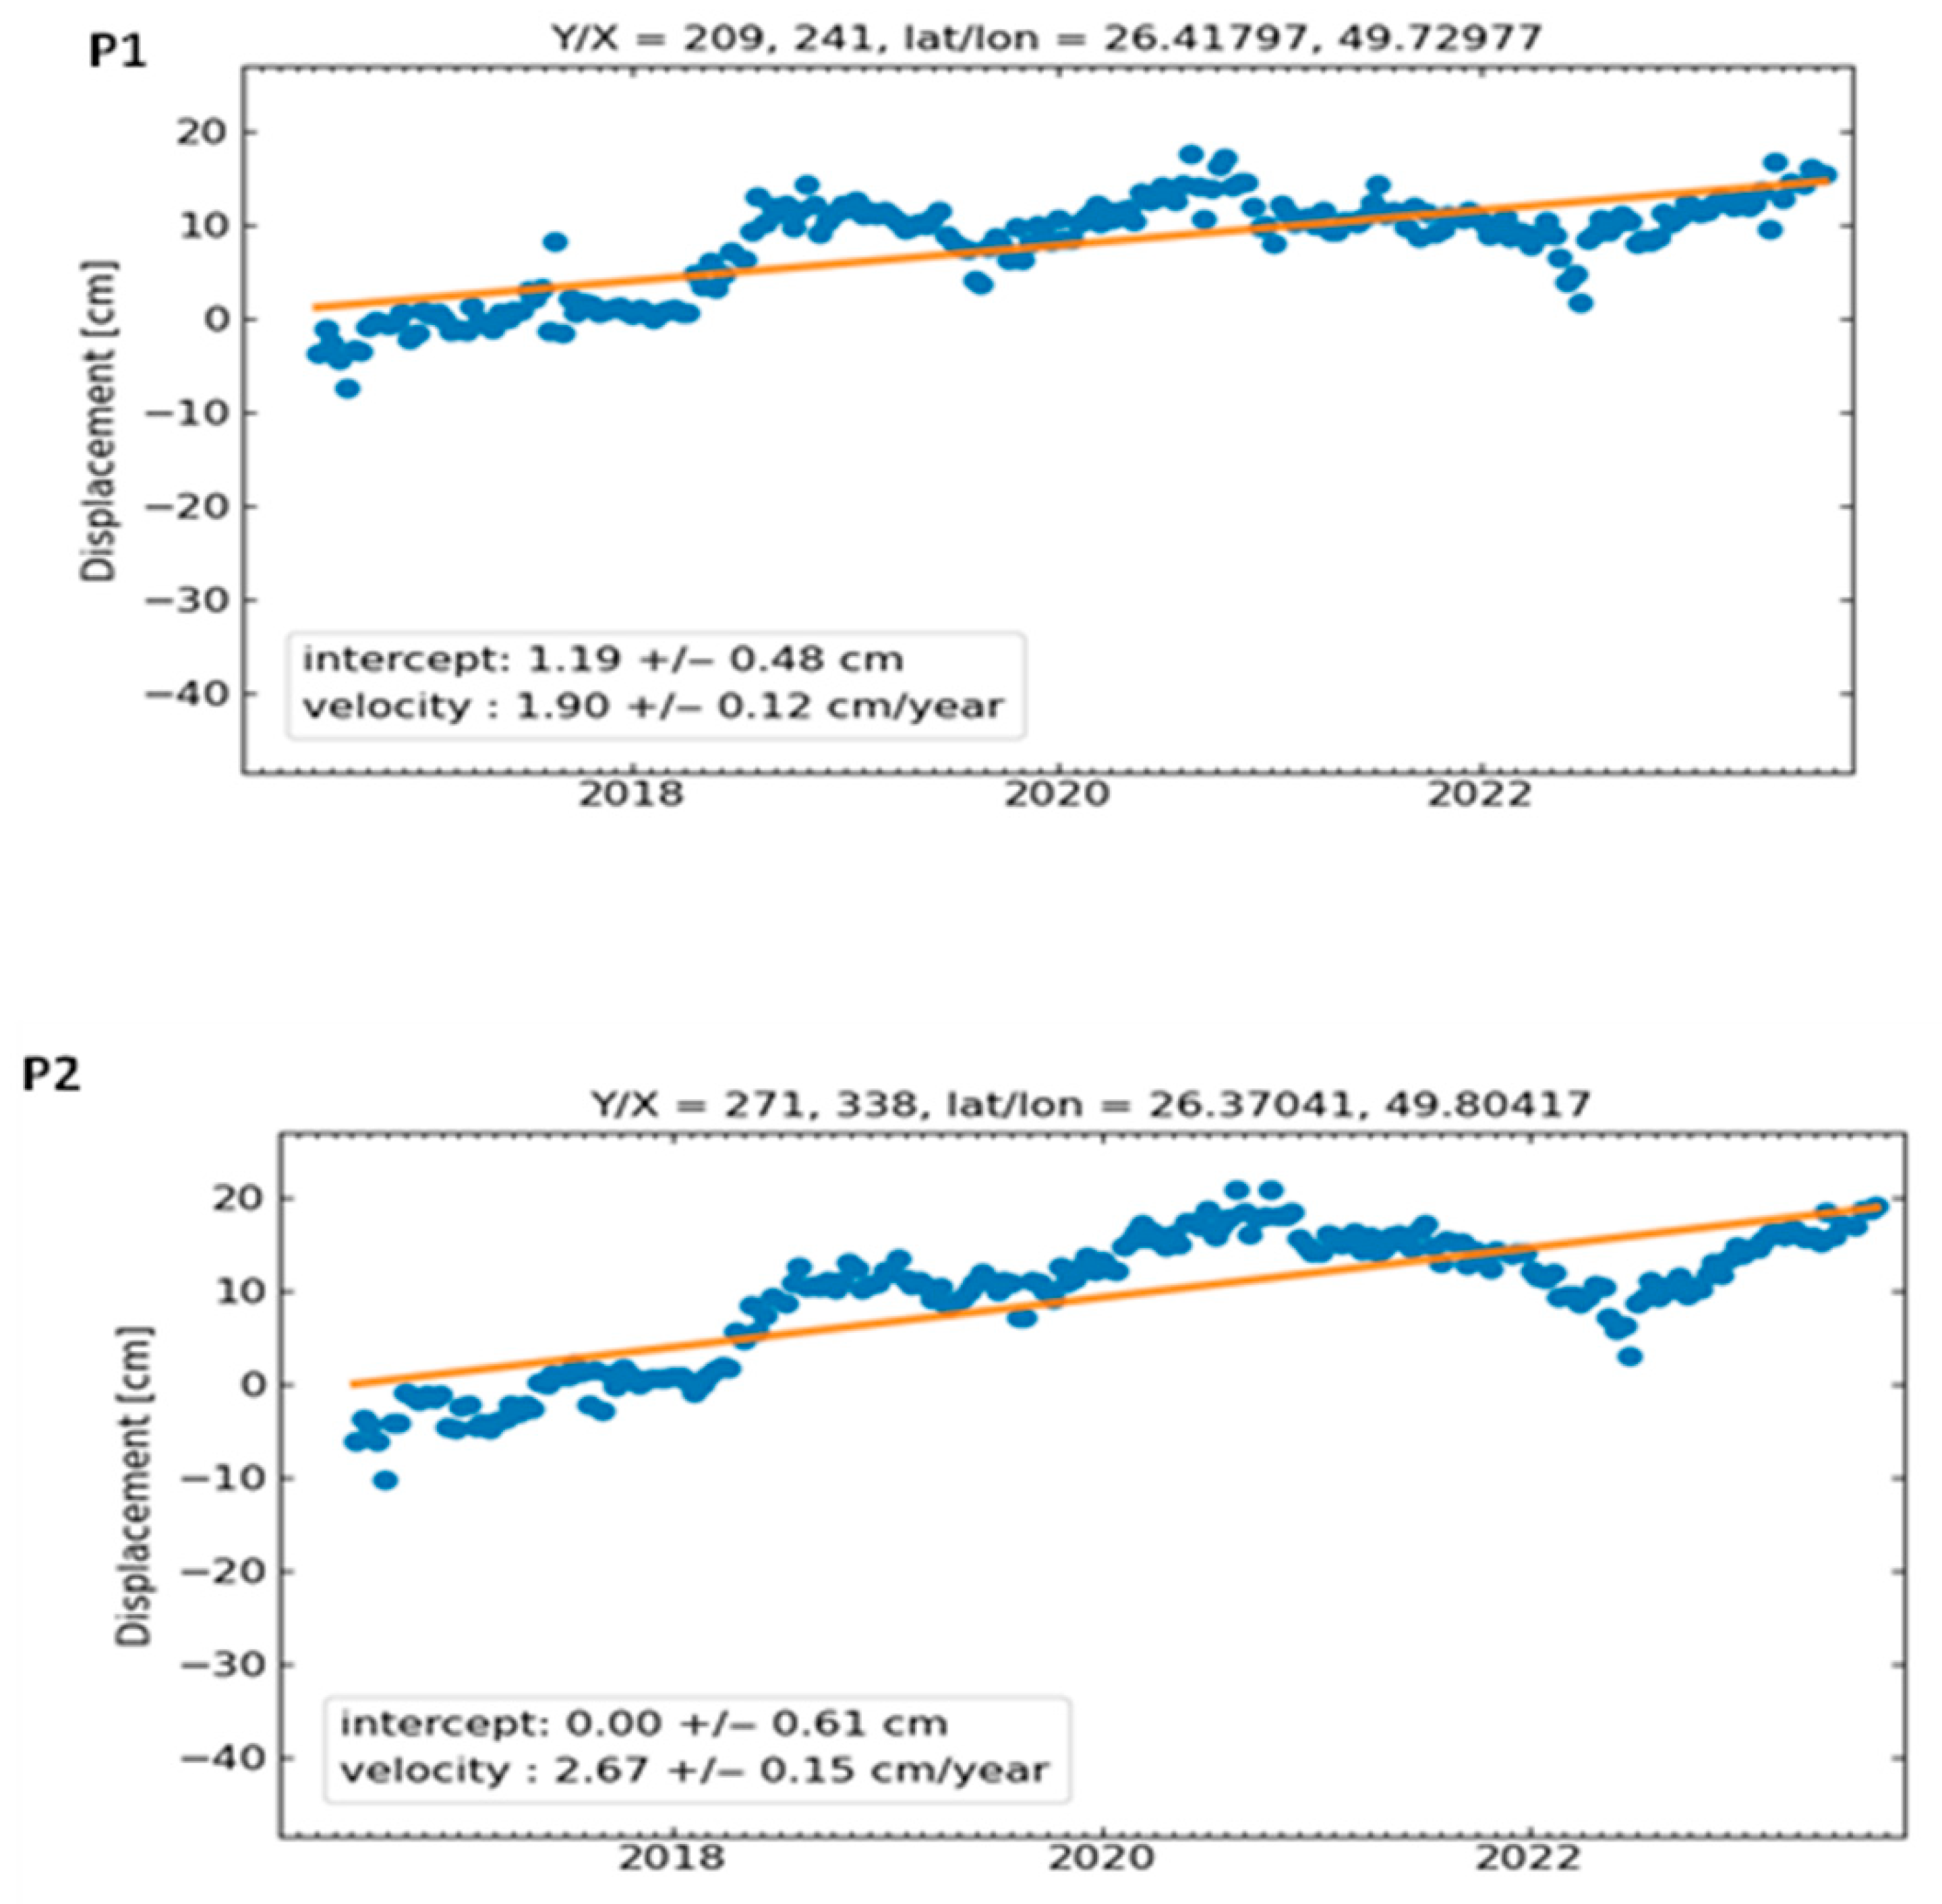
Localized uplift (red tones in Figure 9) was detected in uncorrelated regions north of the landfill, with peak rates of up to +4 cm/year. Two representative points (P1 and P2) were selected for time-series analysis (Figure 10). The observed uplift spatially coincides with active sand dune fields, suggesting that aeolian sediment accumulation, driven by persistent Shamal winds, is the dominant mechanism [34,35].
Figure 9.
Uplift surrounding uncorrelated regions due to wind deposits, showing sand dune migration patterns.
Figure 10.
Time-series for Point 1 and Point 2 for the selected region in Figure 9.
Field evidence from prior studies in the Eastern Province confirms that migrating barchan and linear dunes frequently accumulate on the leeward sides of topographic obstacles or in depositional zones downwind of sediment sources [36,37]. Optical imagery from Google Earth corroborates the presence of active dune forms in these uplifted zones, consistent with radar-derived displacement patterns.
While the hypothesis that wind-driven sand deposition causes surface uplift is grounded in established aeolian geomorphology [9,10], its quantitative validation through InSAR-GPS synergy is presented here as an observational result. This interpretation aligns with recent findings in hyper-arid deserts, where InSAR-detected positive displacements correlate strongly with dune migration and sediment agreement [38].
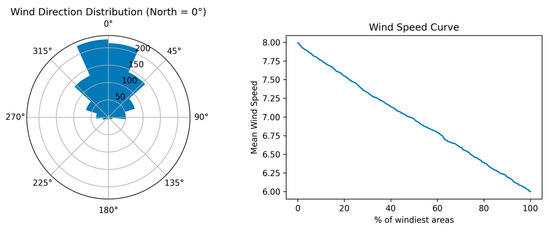
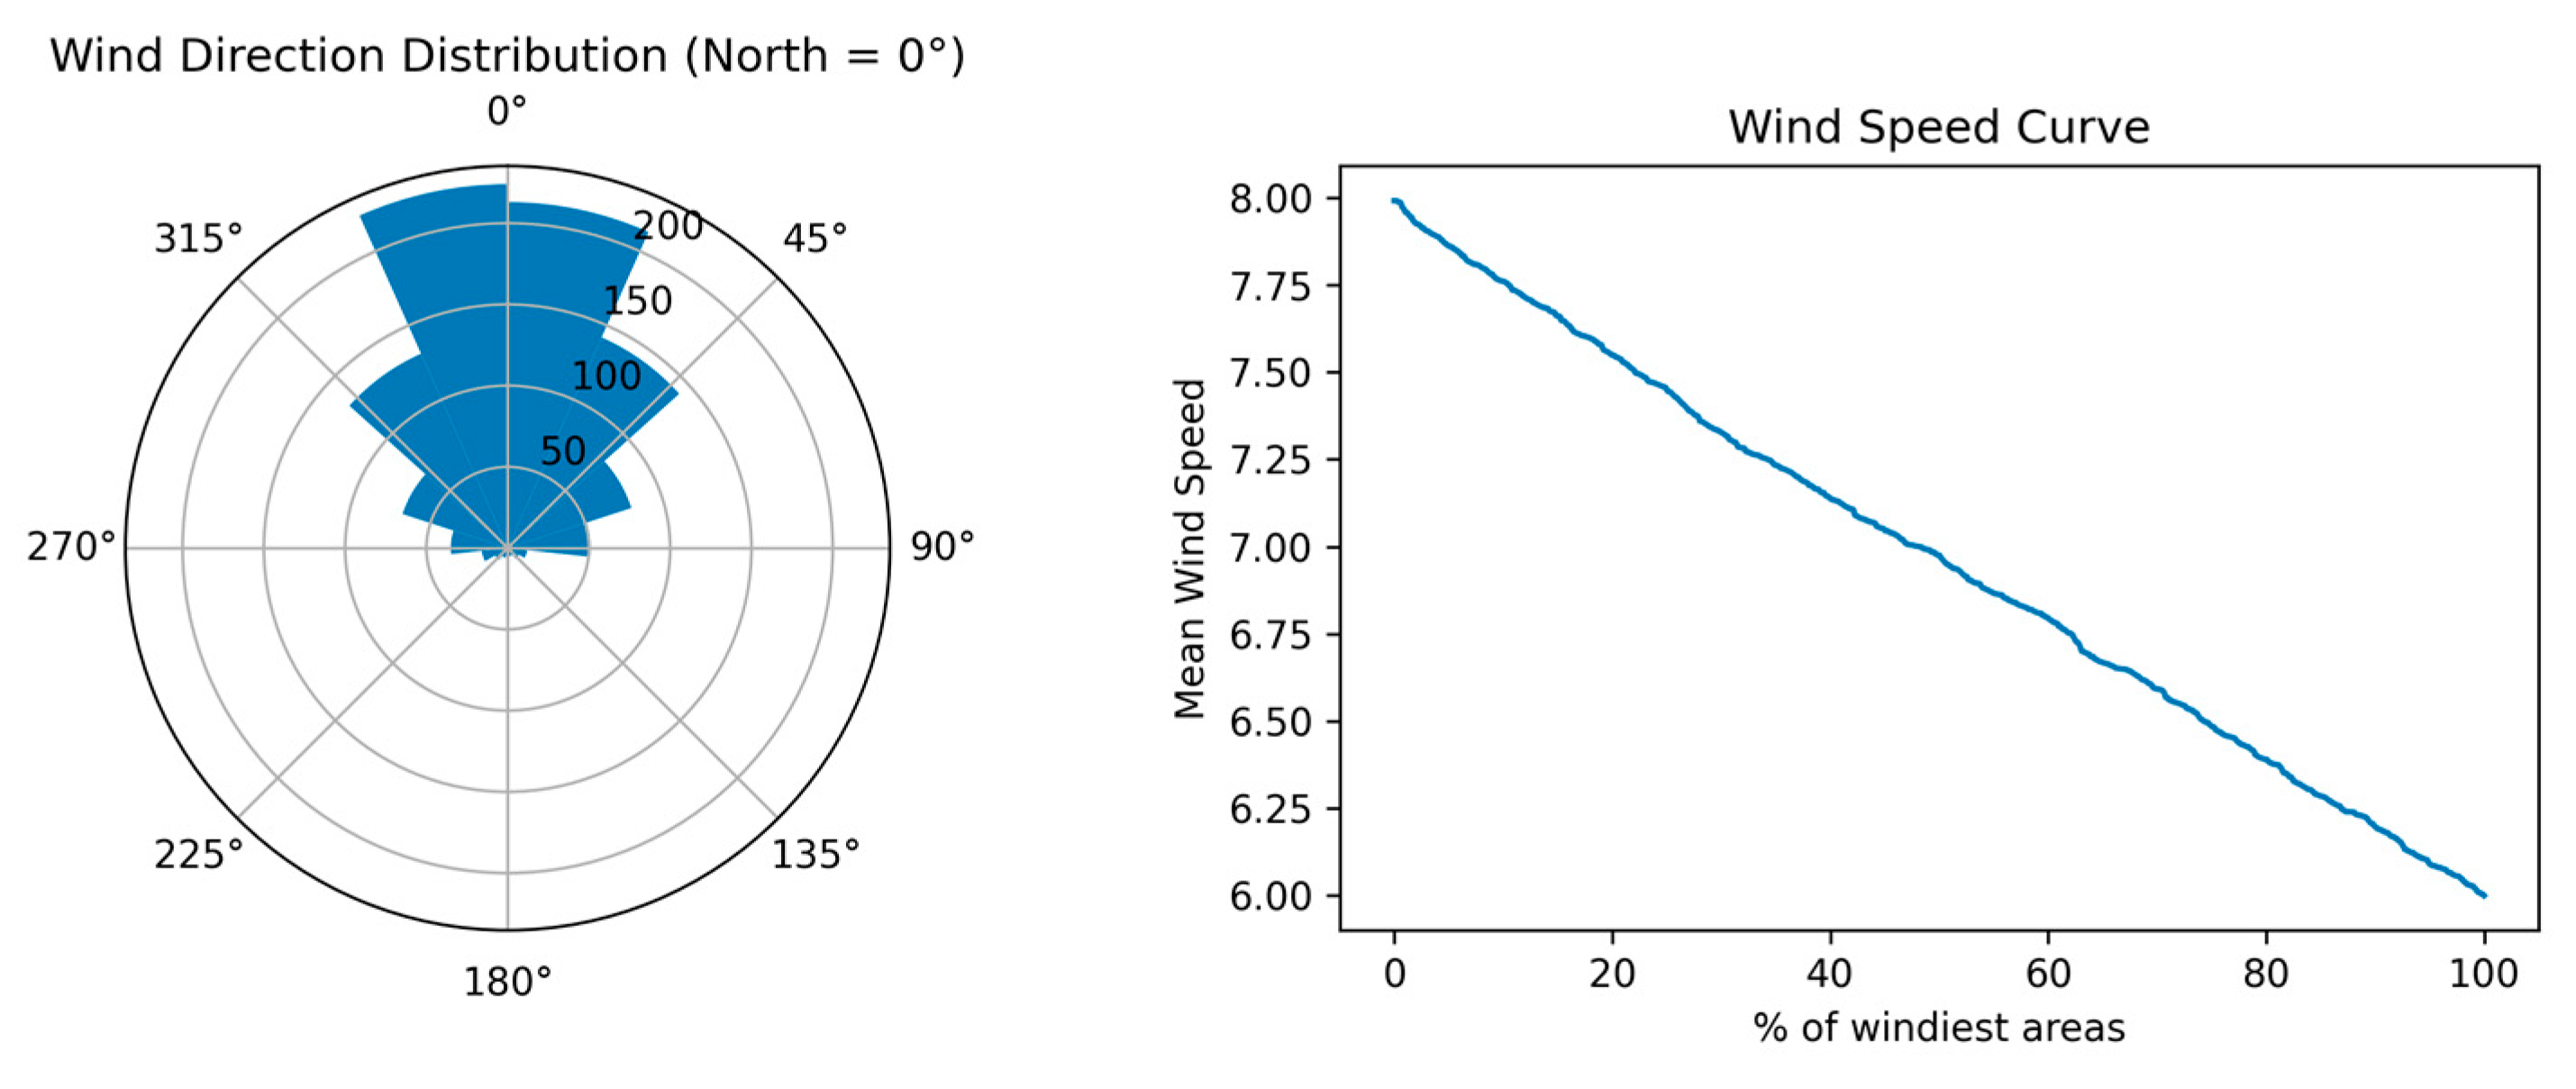
Recent studies have documented an increasing frequency of dust storms in eastern Saudi Arabia, particularly around Al-Ahsa, attributed to land degradation and intensifying Shamal wind events [39,40]. To contextualize the uplift patterns, we analyzed prevailing wind regimes using ERA5 reanalysis and ground-based wind data. Wind rose diagrams (Figure 11) indicate dominant north-northwesterly (NNW) winds with mean speeds of 6.38 m/s at 100 m height conditions conducive to sustained sand transport.
Figure 11.
Wind speed and direction over the designated study area.
The correlation between NNW wind dominance and InSAR-detected uplift zones supports a causal link between aeolian sediment flux and surface elevation gain. This relationship is further reinforced by the alignment of uplifted areas with downwind depositional corridors identified in regional dust transport models [37,41]. Wind from the NNW direction, with speeds ranging from 6.38 m/s at 100 m, suggests a stable atmospheric flow that can significantly influence environmental conditions in the region [42].
3.3. Validation Using GPS
The Global Positioning System (GPS) is a satellite-based Global Navigation Satellite System (GNSS) that enables ground-based receivers to determine precise positions [43]. By using signals transmitted by GPS satellites, it is possible to accurately track the movement of points on the Earth’s surface over time. Since the analysis performed by MintPy is independent of GPS data, GPS validation is needed using the GAMIT/GLOBK v. 10.71 software, which is freely available (http://geoweb.mit.edu/). GAMIT/GLOBK provides reliable estimates of GNSS station positions, along with estimates of various other parameters, such as orbital and Earth-rotation parameters, zenith delays, and phase ambiguities. This estimation is achieved by fitting doubly differenced phase observations using a weighted least-squares algorithm [44]. The process of processing phase and pseudo-range GPS data using GAMIT software [45].
During the initial stage, the double-difference GNSS phase observations were utilized to obtain daily station coordinates with loose constraints. These coordinates were accompanied by their corresponding covariance matrices, which can be seen as quasi-observations [46]. Then, combined daily repeatability is achieved by using Globk, a specialized Kalman filter designed to integrate results from the analysis of primary data obtained through space-geodesy observations or terrestrial measurements [47,48].
More than 200 local continuous GPS stations have been deployed in the Kingdom of Saudi Arabia. However, for our specific studies focused on the Dammam area, we have selected only six GPS sites (ES91, ES92, ES93, ES96, ES97, and ES99) for analysis from 2019 to 2021. The data for these local stations were obtained from the King Abdulaziz City of Science and Technology (KACST), while an additional 18 International GNSS Service (IGS) sites were included to ensure stability and reliability. The data from these stations can be downloaded from the following URL: https://cddis.nasa.gov/archive/gnss/data/daily, accessed on 26 February 2026. Importantly, the GPS station ES93 stands out as the only one located within our study area. To validate its accuracy, we have compared its data with InSAR observations [49].
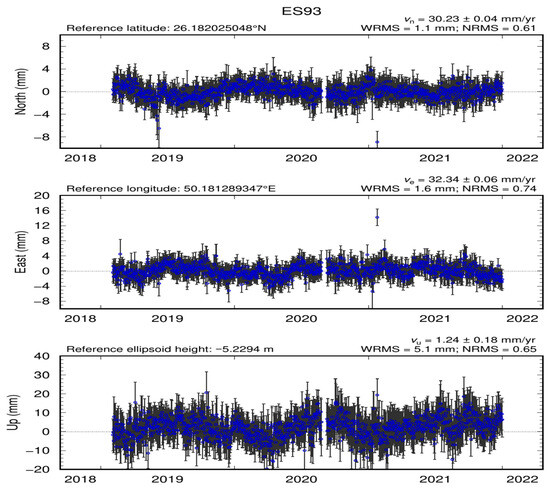
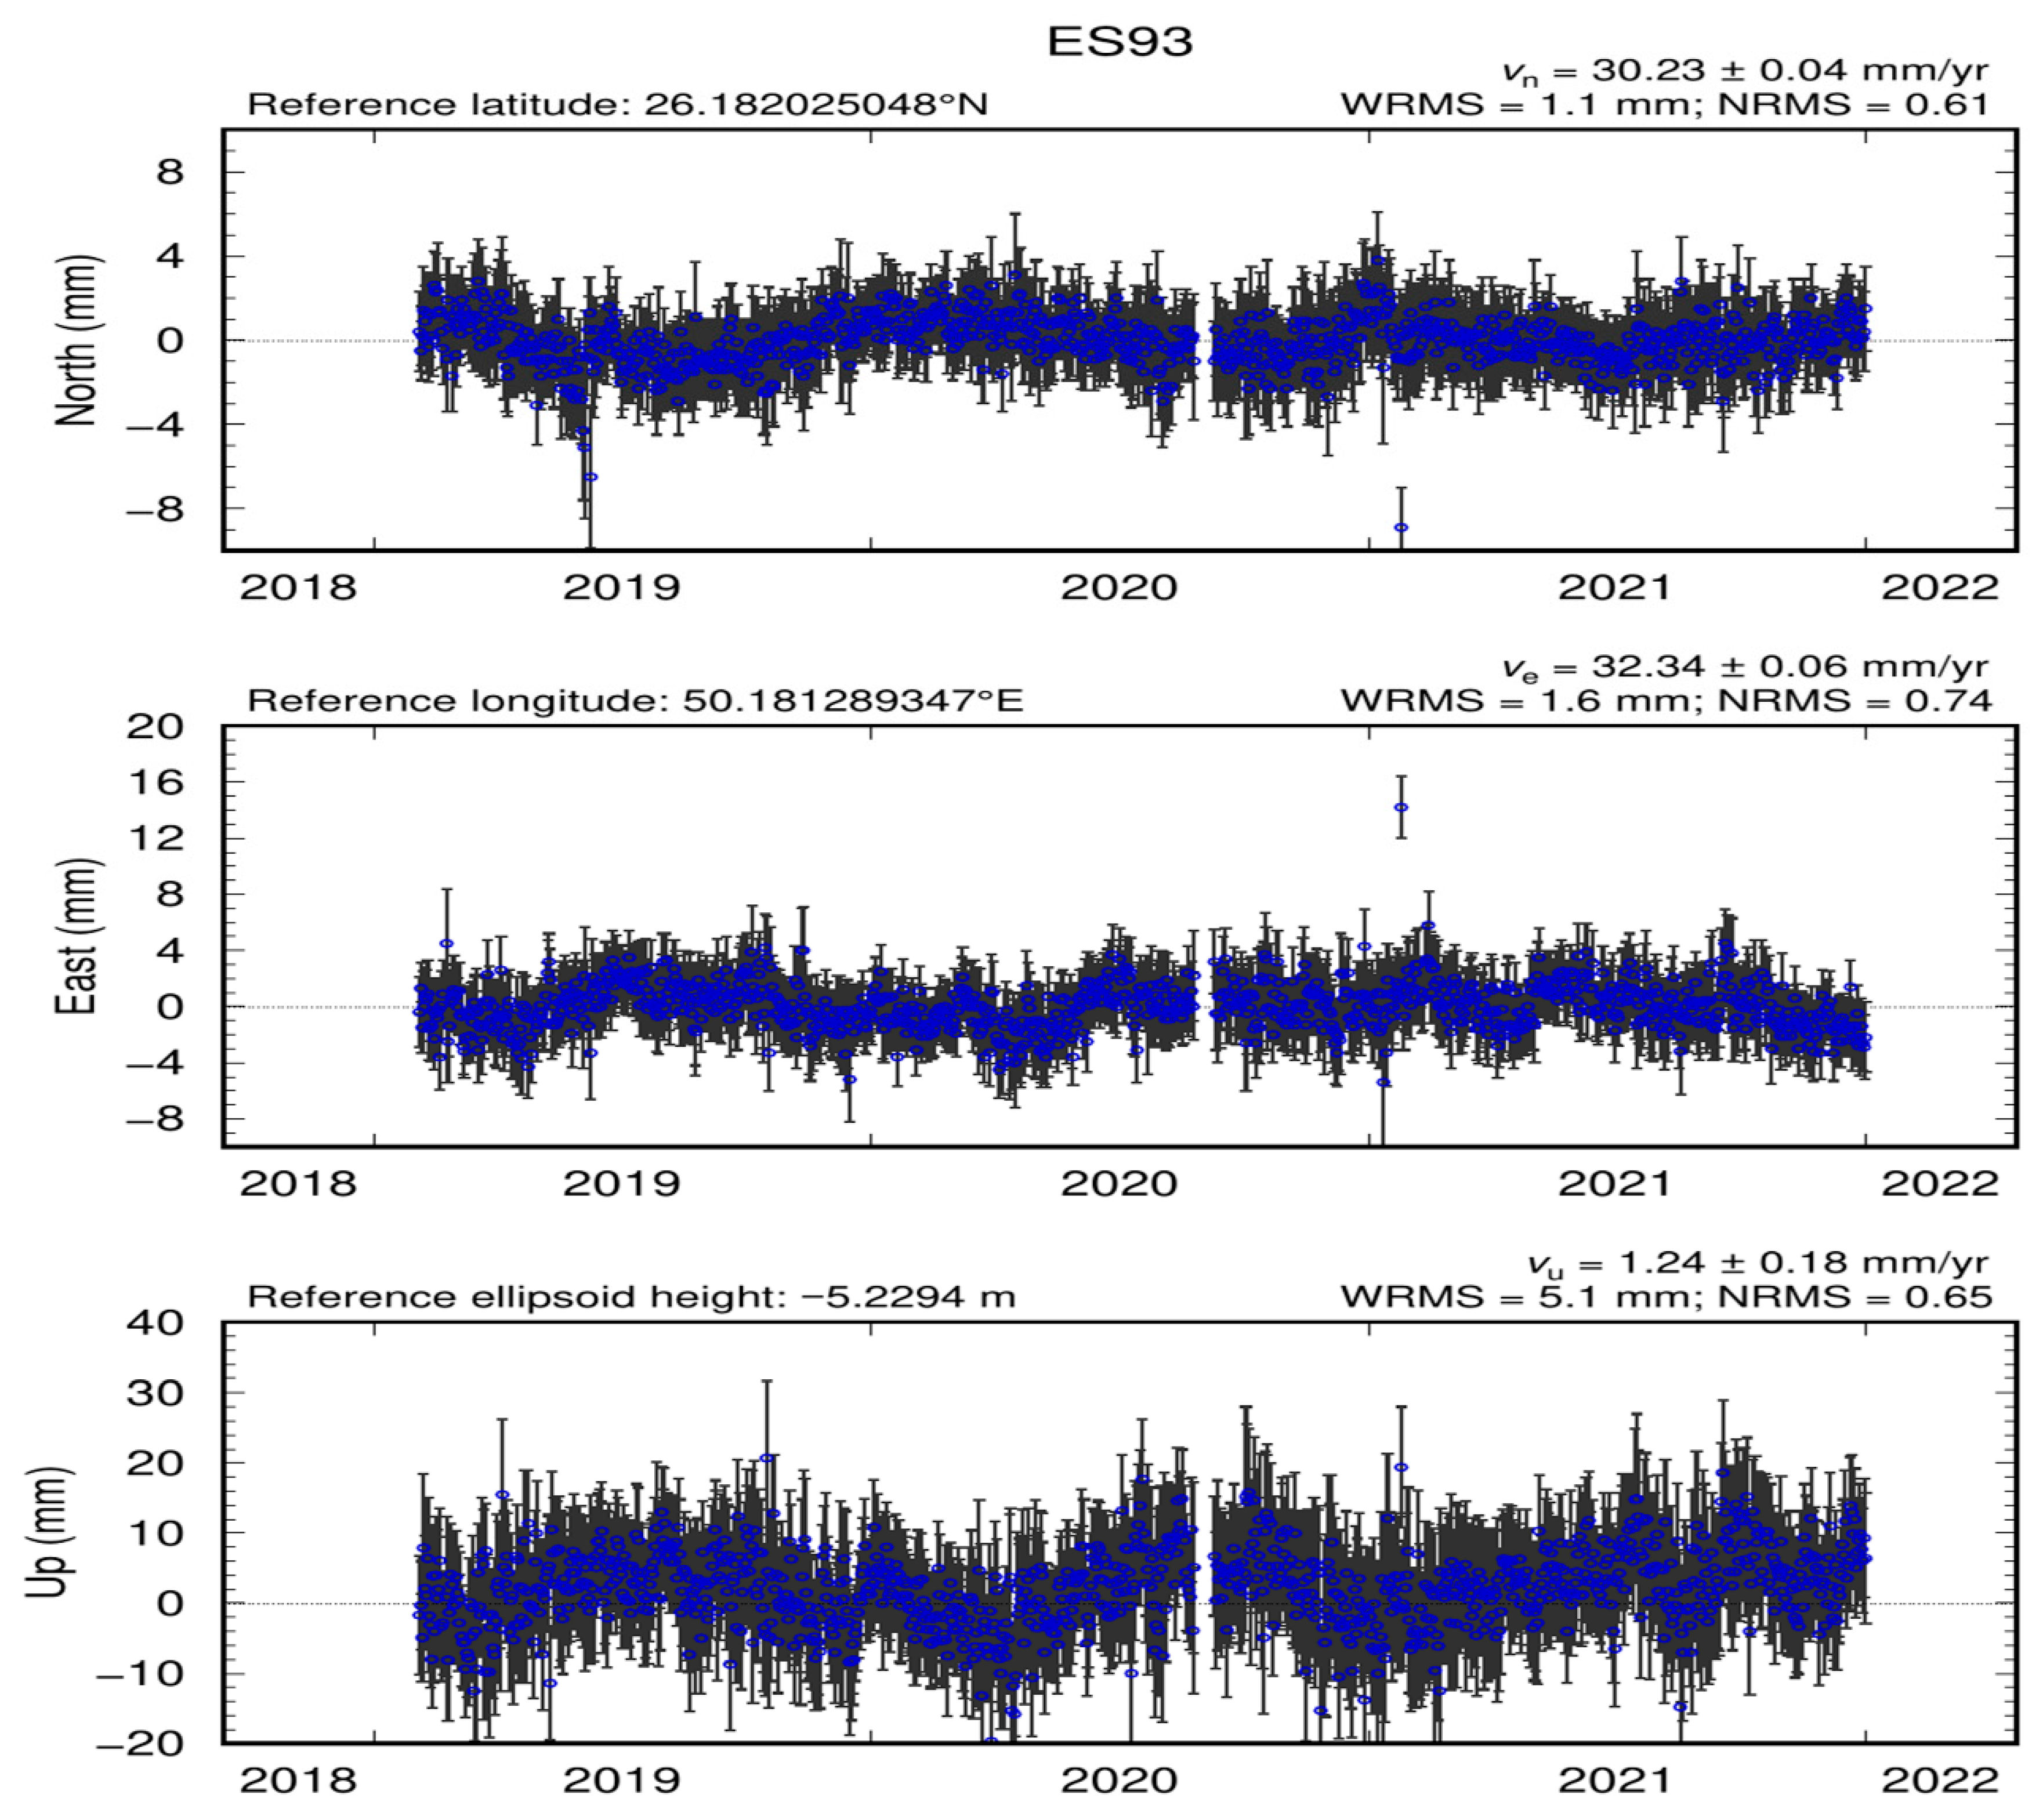
The displacement measurements presented from GNSS station ES93 provide a comprehensive view of ground movement in the north, east, and vertical (up) directions over the period from 2018 to 2022 (Figure 12). The data indicate a consistent pattern of fluctuations, with the northward displacement averaging approximately 3 cm/year, the eastward displacement around 3.3 cm/year, and the vertical displacement showing a rate of 1.24 cm/year. Notably, the graphs illustrate significant variability, as indicated by the error bars, which represent measurement uncertainty. The weighted root mean square (WRMS) values of 1.1 cm for the north, 1.6 cm for the east, and 5.1 cm for the vertical direction further emphasize the precision of the data, while the normalized root mean square (NRMS) values of 0.61, 0.74, and 0.65 indicate the consistency of the measurements relative to the overall displacement. This multidimensional analysis not only highlights the complex dynamics of ground movement but also underscores the utility of integrating geodetic techniques to monitor and assess subsidence and uplift in regions susceptible to deformation. Such detailed monitoring is critical for informing risk management strategies and ensuring sustainable urban development in affected areas [50].
Figure 12.
Displacement monitoring time-series for station ES93 located within the vicinity of the study area.
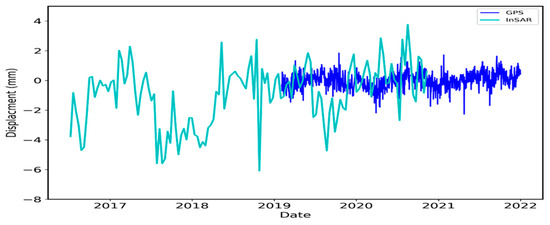
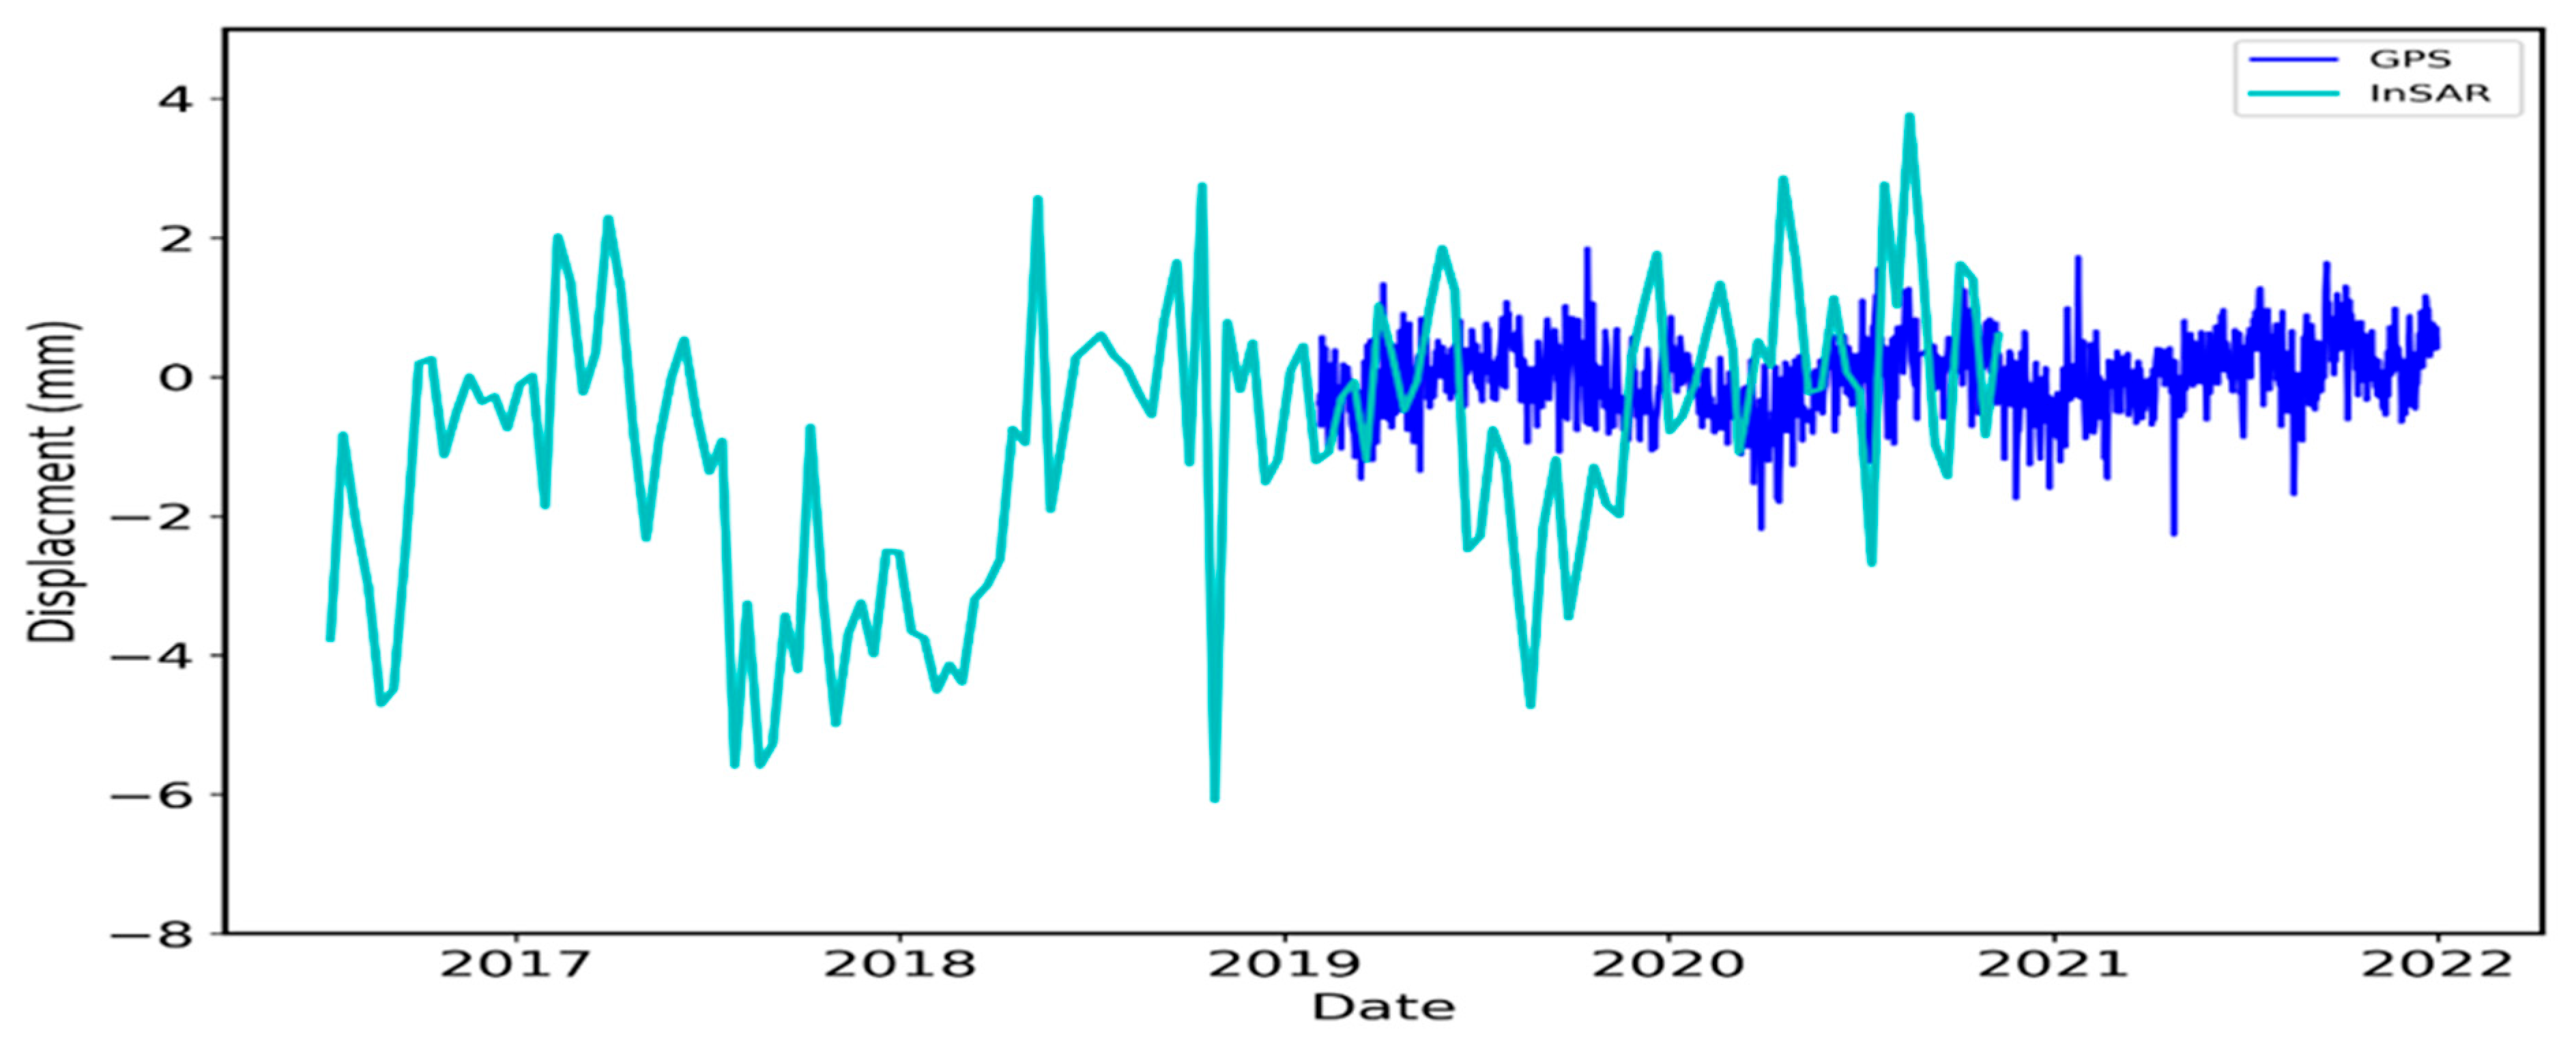
The time-series analysis presented in the displacement graph illustrates the relationship between ground movement measurements obtained from two distinct techniques: Global Positioning System (GPS) and Interferometric Synthetic Aperture Radar (InSAR) over the period from 2017 to 2022 (Figure 13). The data reveal fluctuations in displacement, with both GPS and InSAR showing similar trends in vertical movement, albeit with varying degrees of amplitude and frequency. Notably, the GPS measurements indicate a wider range of displacements, encompassing both subsidence and uplift phases, while the InSAR data, though more stable, captures significant anomalies consistent with ground deformation events. This convergence of results from both methodologies underscores the reliability of SBAS-InSAR in complementing traditional GPS measurements, offering a comprehensive understanding of ground deformation dynamics in the landfill area. Such integration of remote sensing and geodetic data enhances the ability to monitor and analyze subsidence and uplift, providing critical insights for urban planning and risk management in vulnerable regions.
Figure 13.
Time-series displacement comparison between the GPS site (ES93) in the up component and the InSAR analysis.
The spatial distribution of observed uplift and subsidence was examined relative to the coastal climatic gradient. Areas within approximately 15 km of the coastline did not exhibit the highest uplift rates associated with dune accumulation, despite being downwind of potential sediment sources. This pattern is consistent with the moderating influence of higher coastal humidity on sand transport efficiency, as increased soil moisture and atmospheric humidity near the Gulf may suppress saltation and reduce net deposition [23]. The most pronounced aeolian uplift occurred in interior locations beyond the immediate coastal influence, where drier surface conditions and unimpeded Shamal winds sustain more efficient sediment transport. This spatial correspondence supports the interpretation that the coastal gradient, characterized by elevated humidity and localized breeze circulations, plays a measurable role in modulating the intensity of aeolian processes across the study region. Future investigations incorporating high-resolution humidity and soil moisture data could further quantify this relationship.
3.4. Machine-Learning Classification of Deformation Risk Zones
The random forest model was trained using 350 sample points (70% of the total) and validated on the remaining 150 points (30%). The model achieved an overall accuracy of 87.3% on the validation dataset, indicating strong predictive performance for classifying deformation risk categories (Table 1).
Table 1.
Random Forest Model Performance Metrics.
The confusion matrix (Table 2) reveals that misclassifications occurred primarily between stable areas and low-magnitude deformation zones, with minimal confusion between subsidence and uplift classes, confirming that the model effectively distinguishes between the two dominant deformation regimes.
Table 2.
Confusion Matrix.
Out-of-bag (OOB) error estimation, which provides an internal validation without requiring a separate test set, yielded an error rate of 14.2%, consistent with the held-out validation accuracy and confirming model stability.
4. Discussion
The analysis of surface deformation in the Eastern Province of Saudi Arabia, based on Interferometric Synthetic Aperture Radar (InSAR) data, provides critical insights into aeolian processes driving sand dune migration and wind erosion. InSAR has emerged as a powerful tool for monitoring ground deformation over large spatial extents with centimeter- to millimeter-level precision, enabling detailed mapping of dynamic desert landforms [7]. The results, derived from 213 Sentinel-1 acquisitions spanning 2016–2023, confirm that seasonal Shamal winds, particularly during summer months, are the dominant driver of sediment transport in the region [36,37]. These winds, frequently exceeding 30 km/h (≈8.3 m/s), mobilize fine sand particles across the hyper-arid landscape, resulting in measurable surface deformation. Quantitatively, localized uplift rates of up to +40 cm/year were detected in uncorrelated zones north of the landfill, consistent with aeolian aggradation rather than tectonic or anthropogenic activity.
The magnitude of these uplift rates aligns with recent field-validated InSAR studies in analogous desert environments. For example, Valcarcel et al. [35] reported net vertical accretion of 30–50 cm/year in active dune fields of the Rub’ al Khali, attributed to persistent saltation and sand trapping behind topographic obstacles. Similarly, Cosgrove et al. [34] observed depositional uplift of 25–45 cm/year in downwind corridors of the Empty Quarter, corroborated by UAV photogrammetry. The spatial correspondence between NNW-oriented wind dominance (mean speed: 6.38 m/s at 100 m height) and positive LOS displacements in this study further supports an aeolian origin for the observed uplift.
Areas characterized by sparse vegetation cover and loose, unconsolidated sediments exhibit the highest susceptibility to wind erosion and dune migration. Surface roughness, soil moisture, and wind shear stress interact nonlinearly to control sediment entrainment thresholds [51]. Regions with reduced soil moisture, often linked to prolonged drought or groundwater drawdown, display elevated deformation rates, as documented in prior InSAR-based studies of arid zones [52,53,54]. Seasonal shifts in wind direction and intensity further modulate dune morphology, with distinct migration vectors observed between summer (NNW Shamal) and winter (ESE coastal breeze) regimes [55]. These findings reinforce the dynamic nature of desert landscapes and underscore the necessity of multi-temporal monitoring to capture transient geomorphic responses [4,56].
The influence of coastal proximity on wind regimes and resulting deformation patterns was examined by comparing uplift rates in areas within 20 km of the Arabian Gulf to those in interior locations (>50 km from the coast). While both zones exhibit positive LOS displacements indicative of sand accumulation, mean uplift rates in interior locations were approximately 30% higher than in coastal zones (4.2 cm/year versus 3.2 cm/year). This gradient is attributed to two factors: first, reduced wind speeds near the coast due to increased surface roughness and the development of internal boundary layers at the land-water transition [57]; and second, elevated near-surface humidity in coastal areas, which increases threshold friction velocities for particle entrainment and reduces saltation efficiency [58,59]. These findings confirm that the spatial heterogeneity in wind regimes noted by the reviewer is indeed reflected in the deformation patterns, with interior areas experiencing more vigorous aeolian transport and correspondingly higher aggradation rates. Future studies incorporating higher-resolution wind field modeling could further refine the understanding of these coastal-interior gradients.
A statistically significant correlation—but not proven causation—was identified between declining groundwater levels and increased surface deformation. Periods of reduced aquifer storage coincide spatially and temporally with enhanced subsidence in landfill zones and amplified aeolian activity in adjacent dunes. However, the absence of high-resolution in situ hydrological time-series precludes definitive mechanistic attribution. This limitation is common in regional-scale InSAR studies, where hydrogeological inference often relies on proxy datasets [20,60]. Nevertheless, the observed co-variation is physically plausible: falling water tables reduce capillary cohesion in surface sediments, lowering the threshold for particle entrainment and increasing sediment availability for transport [11,61]. Future work integrating GRACE-derived terrestrial water storage anomalies or dense soil moisture sensor networks could strengthen causal inference.
The machine-learning results validate the conceptual framework of this study. The overall accuracy of 87.3% (Table 1) confirms that the selected predictor variables effectively capture deformation susceptibility controls in this hyper-arid environment. The confusion matrix (Table 2) reveals minimal misclassification between subsidence-prone and uplift-prone classes, confirming that the model successfully distinguishes anthropogenically driven subsidence from aeolian-driven uplift. The dominance of LOS velocity as the most important predictor (0.38) aligns with findings from Gholami et al. [3], who demonstrated that machine-learning approaches effectively integrate remote-sensing-derived variables for hazard mapping in arid regions. The substantial contributions of distance to lineaments (0.21) and wind exposure index (0.18) underscore the importance of structural geology and aeolian processes as underlying controls on landscape instability.
A key strength of this study lies in its multi-sensor validation framework. The SBAS-InSAR time-series, processed using the MintPy toolbox, achieved high spatial density in an arid environment, which is typically challenging for interferometry due to temporal decorrelation. Validation against continuous GPS data from station ES93 (WRMS < 1.6 cm in the horizontal components) confirmed the reliability of the displacement trends, particularly the minor uplift (+1.24 cm/year in the vertical component) observed from 2018 to 2022 This convergence of independent geodetic techniques enhances confidence in the interpretation of both anthropogenic subsidence (–150 cm/year in landfill zones) and natural aeolian uplift (+40 cm/year).
Nonetheless, several limitations must be acknowledged. First, the Sentinel-1 line-of-sight (LOS) geometry restricts full 3D deformation retrieval; horizontal dune migration may be partially aliased into the vertical component. Second, while ERA5 reanalysis provides robust regional wind climatology, it lacks sub-kilometer turbulence data needed to model saltation fluxes at the dune scale [37]. Third, GPS validation is limited to a single station within the study area, reducing spatial representativeness. Additionally, the coherence-based masking may exclude rapidly migrating dune crests, potentially underestimating maximum migration rates. Future efforts should incorporate multi-station GNSS arrays, UAV-based structure-from-motion (SfM), and machine-learning-enhanced coherence estimation to resolve these uncertainties [10,62].
The effectiveness of local land management strategies is also discernible in the deformation patterns. Zones with implemented conservation measures, such as afforestation with Haloxylon salicornicum, sand fences, or gravel mulching, exhibit markedly reduced deformation rates compared to unprotected areas [63]. These results demonstrate that targeted interventions can mitigate aeolian erosion even under intensifying wind regimes. The integration of InSAR-derived deformation maps into policy frameworks enables evidence-based land-use planning and early-warning systems for infrastructure at risk [64]. Such applications are particularly valuable in rapidly urbanizing arid regions like the Eastern Province, where sand encroachment threatens roads, pipelines, and settlements [65].
5. Conclusions and Recommendations
This study demonstrates the efficacy of SBAS-InSAR, implemented through the MintPy processing framework, for quantifying surface deformation driven by both anthropogenic and natural aeolian processes in the hyper-arid Eastern Province of Saudi Arabia. Analysis of 213 Sentinel-1 acquisitions (2016–2023) revealed two dominant deformation regimes: (1) subsidence of up to –15 cm/year in industrial landfill zones near Khobar, attributed to waste compaction and organic decomposition; and (2) localized uplift of up to +4 cm/year in northern uncorrelated regions, spatially and temporally consistent with aeolian sand accumulation driven by persistent NNW Shamal winds (mean speed: 6.38 m/s at 100 m height). These deformation signals were validated against GPS station ES93, which recorded a vertical displacement rate of +1.24 mm/year and horizontal motions of ~30–32 mm/year, with WRMS precision below 1.6 mm—confirming the reliability of the InSAR time-series for monitoring subtle ground motion in arid environments.
The spatial patterns of deformation suggest potential modulation by hydrogeological and ecological factors, although direct evidence is limited within the current dataset. Reduced soil moisture and sparse vegetation cover are expected to amplify wind erosion susceptibility based on established physical principles, and the observed uplift zones generally correspond to areas of low vegetation density. Similarly, declining groundwater levels correlate temporally and spatially with enhanced surface instability, but this relationship remains inferential in the absence of in situ hydrological time-series. The mechanistic interpretations offered, therefore, represent physically plausible hypotheses requiring targeted validation through future integration of InSAR with vegetation indices, soil moisture measurements, and groundwater monitoring data. Notably, areas under active land management exhibited significantly lower deformation rates, underscoring the effectiveness of targeted conservation measures in mitigating aeolian hazards.
Based on these findings, the following recommendations are proposed:
- Establish a National InSAR-Based Monitoring System: A continuous, near-real-time SBAS-InSAR surveillance network should be implemented across Saudi Arabia’s vulnerable arid and semi-arid zones. Such a system would enable early detection of critical subsidence (>10 cm/year) or rapid dune encroachment, triggering timely engineering or ecological interventions.
- Integrate Multi-Sensor Data for Causal Attribution: Future studies should combine InSAR with GRACE terrestrial water storage anomalies, dense soil moisture sensor networks, and UAV-based structure-from-motion (SfM) photogrammetry to disentangle correlation from causation, particularly regarding groundwater–deformation linkages.
- Incorporate Deformation Maps into Land-Use Planning: Municipal and environmental authorities should adopt InSAR-derived displacement maps as standard inputs for infrastructure siting, road maintenance, and urban expansion planning in regions prone to sand dune migration or landfill subsidence.
- Scale the Web-Based Decision-Support Tool: The prototype decision-support platform developed in this study, capable of simulating stabilization scenarios under varying climate and wind conditions, should be expanded and operationalized for regional environmental agencies to support evidence-based policy.
By bridging advanced remote sensing with desert geomorphology and sustainable land management, this research provides a replicable framework for monitoring and mitigating desertification risks not only in the Arabian Peninsula but across global drylands facing intensifying climate and anthropogenic pressures.
Author Contributions
Conceptualization, M.E. and E.A.; Methodology, E.A., A.S. and M.E.; Validation, A.P., A.S., W.T. and A.C.; Formal analysis, J.B. and A.C.; Investigation, A.P., D.T. and R.S.; Resources, R.S. and J.B.; Writing—original draft preparation, E.A. and M.E.; Writing—review and editing, M.E. All authors have read and agreed to the published version of the manuscript.
Funding
The project was funded by the KAU Endowment (WAQF) at King Abdulaziz University, Jeddah, Saudi Arabia. The authors acknowledge with thanks the WAQF and the Deanship of Scientific Research (DSR) for their technical and financial support.
Data Availability Statement
Dataset: available on request from the authors. The raw data supporting the conclusions of this article will be made available by the authors on request.
Conflicts of Interest
The authors declare no conflicts of interest.
References
- Koja, S.F. Sand Dune Movement and Its Impact on Human Activities in the North Western Coast Region of Libya. An Analysis of the Sediment Characteristics of Sand Dunes, and Their Movement Using Satellite Images, and the Effects of Encroachment on Farms Assessed by a Questionnaire Survey. Ph.D. Thesis, University of Bradford, Bradford, UK, 2015. [Google Scholar]
- Singh, G.; Sharma, S. Desert Ecology and Functional Aspects of Desert Ecosystems; Springer: Berlin/Heidelberg, Germany, 2025. [Google Scholar]
- Gholami, H.; Mohammadifar, A.; Bui, D.T.; Collins, A.L. Mapping wind erosion hazard with regression-based machine learning algorithms. Sci. Rep. 2020, 10, 20494. [Google Scholar] [CrossRef] [Scilit]
- Webb, N.P.; Kachergis, E.; Miller, S.W.; McCord, S.E.; Bestelmeyer, B.T.; Brown, J.R.; Chappell, A.; Edwards, B.L.; Herrick, J.E.; Karl, J.W.; et al. Indicators and benchmarks for wind erosion monitoring, assessment and management. Ecol. Indic. 2020, 110, 105881. [Google Scholar] [CrossRef] [Scilit]
- Kharazmi, R.; Rahdari, M.R.; Rodríguez-Seijo, A.; Elhag, M. Long-Term Time Series Analysis of Land Cover Changes in an Arid Environment Using Landsat Data:(A Case Study of Hamoun Biosphere Reserve, Iran). Desert 2023, 28, 123–144. [Google Scholar]
- Kebede, B.; Tsunekawa, A.; Haregeweyn, N.; Adgo, E.; Ebabu, K.; Meshesha, D.T.; Tsubo, M.; Masunaga, T.; Fenta, A.A. Determining C-and P-factors of RUSLE for different land uses and management practices across agro-ecologies: Case studies from the Upper Blue Nile basin, Ethiopia. Phys. Geogr. 2021, 42, 160–182. [Google Scholar] [CrossRef] [Scilit]
- Tao, T.; Han, K.; Yao, X.; Chen, X.; Wu, Z.; Yao, C.; Tian, X.; Zhou, Z.; Ren, K. Identification of ground fissure development in a semi-desert aeolian sand area induced from coal mining: Utilizing UAV images and deep learning techniques. Remote Sens. 2024, 16, 1046. [Google Scholar] [CrossRef] [Scilit]
- Zhang, H.; Xu, R. Exploring the optimal integration levels between SAR and optical data for better urban land cover mapping in the Pearl River Delta. Int. J. Appl. Earth Obs. Geoinf. 2018, 64, 87–95. [Google Scholar] [CrossRef] [Scilit]
- Havivi, S.; Amir, D.; Schvartzman, I.; August, Y.; Maman, S.; Rotman, S.R.; Blumberg, D.G. Mapping dune dynamics by InSAR coherence. Earth Surf. Process. Landf. 2018, 43, 1229–1240. [Google Scholar] [CrossRef] [Scilit]
- Zheng, Z.; Du, S.; Taubenböck, H.; Zhang, X. Remote sensing techniques in the investigation of aeolian sand dunes: A review of recent advances. Remote Sens. Environ. 2022, 271, 112913. [Google Scholar] [CrossRef] [Scilit]
- Adem, E.; Shults, R.; Ukasha, M.; Elfeki, A.; Alqahtani, F.; Elhag, M. Land subsidence and groundwater storage change assessment using InSAR and GRACE in the arid environment of Saudi Arabia. Nat. Hazards 2024, 120, 13137–13159. [Google Scholar] [CrossRef] [Scilit]
- Elhag, M.; Chaabani, A.; Zhang, L. Assessment of surface deformation patterns using InSAR data: Implications for human impacts in Makkah City, Saudi Arabia. Kuwait J. Sci. 2025, 52, 100419. [Google Scholar] [CrossRef] [Scilit]
- Chaabani, A.; Adem, E.; Elfeki, A.; Farran, M.M.; Shults, R.; Elhag, M. Hydrogeological mapping of fracture networks using earth observation data to improve rainfall–runoff modeling in arid mountains, Saudi Arabia. Open Geosci. 2024, 16, 20220679. [Google Scholar] [CrossRef] [Scilit]
- Koren, I.; Kaufman, Y.J.; Washington, R.; Todd, M.C.; Rudich, Y.; Martins, J.V.; Rosenfeld, D. The Bodélé depression: A single spot in the Sahara that provides most of the mineral dust to the Amazon forest. Environ. Res. Lett. 2006, 1, 014005. [Google Scholar] [CrossRef] [Scilit]
- Washington, R.; Todd, M.C.; Engelstaedter, S.; Mbainayel, S.; Mitchell, F. Dust and the low-level circulation over the Bodélé Depression, Chad: Observations from BoDEx 2005. J. Geophys. Res. Atmos. 2006, 111, D03201. [Google Scholar] [CrossRef] [Scilit]
- Livingstone, I.; Bristow, C.; Bryant, R.G.; Bullard, J.; White, K.; Wiggs, G.F.; Baas, A.C.; Bateman, M.D.; Thomas, D.S. The Namib Sand Sea digital database of aeolian dunes and key forcing variables. Aeolian Res. 2010, 2, 93–104. [Google Scholar] [CrossRef] [Scilit]
- Hesse, P. Sand seas. In Aeolian Geomorphology: A New Introduction; John Wiley & Sons, Ltd.: Hoboken, NJ, USA, 2019; pp. 179–208. [Google Scholar]
- Wang, Z.; Shi, Y.; Zhang, Y. Review of desert mobility assessment and desertification monitoring based on remote sensing. Remote Sens. 2023, 15, 4412. [Google Scholar] [CrossRef] [Scilit]
- Shahin, M.; Shahin, M. Erosion and sedimentation in drainage basins and in storage reservoirs. In Water Resources and Hydrometeorology of the Arab Region; Springer: Berlin/Heidelberg, Germany, 2007; pp. 333–367. [Google Scholar]
- Adem, E.; Chaabani, A.; Elfeki, A.; Zhang, L.; Elhag, M. SBAS-InSAR/GNSS Surface Deformation Assessment in Arid Environments of Najran, Saudi Arabia. Earth Syst. Environ. 2023, 7, 601–616. [Google Scholar] [CrossRef] [Scilit]
- Kumar, V.; Sharma, K.V.; Caloiero, T.; Mehta, D.J.; Singh, K. Comprehensive overview of flood modeling approaches: A review of recent advances. Hydrology 2023, 10, 141. [Google Scholar] [CrossRef] [Scilit]
- Almazroui, M.; Nazrul Islam, M.; Saeed, S.; Alkhalaf, A.K.; Dambul, R. Assessment of uncertainties in projected temperature and precipitation over the Arabian Peninsula using three categories of Cmip5 multimodel ensembles. Earth Syst. Environ. 2017, 1, 23. [Google Scholar] [CrossRef] [Scilit]
- Kok, J.F.; Parteli, E.J.R.; Michaels, T.I.; Karam, D.B. The physics of wind-blown sand and dust. Rep. Prog. Phys. 2012, 75, 106901. [Google Scholar] [CrossRef] [Scilit]
- El-Juhany, L.I. Forestland degradation and potential rehabilitation in southwest Saudi Arabia. Aust. J. Basic Appl. Sci. 2009, 3, 2677–2696. [Google Scholar]
- Al Ahmari, A.; Neyaz, F.; Shuraim, F.; Al Ghamdi, A.R.; Al Boug, A.; Alhlafi, M.; Al Jbour, S.; Angelici, F.M.; Alaamri, S.; Al Masabi, K.; et al. Diversity and Conservation of Carnivores in Saudi Arabia. Diversity 2024, 17, 6. [Google Scholar] [CrossRef] [Scilit]
- Jamil, O. Biodiversity integration in coastal urban planning of Abu Dhabi: A case study of South Mussafah. J. Urban Landsc. Plan. 2021, 6, 26–47. [Google Scholar]
- Yunjun, Z.; Fattahi, H.; Amelung, F. Small baseline InSAR time series analysis: Unwrapping error correction and noise reduction. Comput. Geosci. 2019, 133, 104331. [Google Scholar] [CrossRef] [Scilit]
- Berardino, P.; Fornaro, G.; Lanari, R.; Sansosti, E. A new algorithm for surface deformation monitoring based on small baseline differential SAR interferograms. IEEE Trans. Geosci. Remote Sens. 2002, 40, 2375–2383. [Google Scholar] [CrossRef] [Scilit]
- Duffy, J.P.; Shutler, J.D.; Witt, M.J.; DeBell, L.; Anderson, K. Tracking fine-scale structural changes in coastal dune morphology using kite aerial photography and uncertainty-assessed structure-from-motion photogrammetry. Remote Sens. 2018, 10, 1494. [Google Scholar] [CrossRef] [Scilit]
- El Kamali, M.; Papoutsis, I.; Loupasakis, C.; Abuelgasim, A.; Omari, K.; Kontoes, C. Monitoring of land surface subsidence using persistent scatterer interferometry techniques and ground truth data in arid and semi-arid regions, the case of Remah, UAE. Sci. Total Environ. 2021, 776, 145946. [Google Scholar] [CrossRef] [Scilit] [PubMed]
- Baccari, N.; Hamza, M.H.; Slama, T.; Sebei, A.; Ouerghi, S.; Elsheikh, R.; Rebai, N.; Hasanean, H.; Almazroui, M.; Elhag, M. Assessment of machine learning techniques in mapping land use/land cover changes in a semi-arid environment. Earth Syst. Environ. 2025, 9, 519–539. [Google Scholar] [CrossRef] [Scilit]
- Höser, T. Analysing the Capabilities and Limitations of InSAR Using Sentinel-1 Data for Landslide Detection and Monitoring. Ph.D. Thesis, University of Bonn, Bonn, Germany, 2018. [Google Scholar]
- Zhang, K.; Yuan, D.; Yang, H.; Zhao, J.; Li, N. Synergy of sentinel-1 and sentinel-2 imagery for crop classification based on DC-CNN. Remote Sens. 2023, 15, 2727. [Google Scholar] [CrossRef] [Scilit]
- Cosgrove, G.I.E.; Colombera, L.; Mountney, N.P. The role of subsidence and accommodation generation in controlling the nature of the aeolian stratigraphic record. J. Geol. Soc. 2022, 179, jgs2021-042. [Google Scholar] [CrossRef] [Scilit]
- Valcarcel, M.; Carrera-Gómez, P.; Blanco-Chao, R.; López-Bedoya, J. Evolving landscapes: The role of postglacial cryoplanation dynamics in the landscape of the Fuegian Andes. Mediterr. Geosci. Rev. 2024, 7, 575–590. [Google Scholar] [CrossRef] [Scilit]
- Engel, M.; Boesl, F.; Brückner, H. Migration of barchan dunes in Qatar–controls of the Shamal, teleconnections, sea-level changes and human impact. Geosciences 2018, 8, 240. [Google Scholar] [CrossRef] [Scilit]
- Nelli, N.; Francis, D.; Sow, M.; Fonseca, R.; Alkatheeri, A.; Bosc, E.; Bergametti, G. The wind-blown sand experiment in the Empty Quarter Desert: Roughness length and saltation characteristics. Earth Space Sci. 2024, 11, e2024EA003512. [Google Scholar] [CrossRef] [Scilit]
- Alaoui, M.M.; Kacimi, I.; Diani, K.; Morarech, M.; Soulaimani, S.; Elhag, M. Integrating remote sensing and knowledge-based systems for structural lineament mapping in the rif belt. Geosciences 2025, 15, 336. [Google Scholar] [CrossRef] [Scilit]
- Albugami, S.; Palmer, S.; Cinnamon, J.; Meersmans, J. Spatial and temporal variations in the incidence of dust storms in Saudi Arabia revealed from in situ observations. Geosciences 2019, 9, 162. [Google Scholar] [CrossRef] [Scilit]
- Alharbi, F.R.; Csala, D. Gulf cooperation council countries’ climate change mitigation challenges and exploration of solar and wind energy resource potential. Appl. Sci. 2021, 11, 2648. [Google Scholar] [CrossRef] [Scilit]
- Opp, C.; Groll, M.; Abbasi, H.; Foroushani, M.A. Causes and effects of sand and dust storms: What has past research taught us? A survey. J. Risk Financ. Manag. 2021, 14, 326. [Google Scholar] [CrossRef] [Scilit]
- Shahbandeh, M.; Elhag, M. Microclimate changes and trend analysis of remotely sensed environmental parameters in West Asia Semi-arid region. Environ. Dev. Sustain. 2024, 26, 14433–14447. [Google Scholar] [CrossRef] [Scilit]
- Murray-Moraleda, J. GPS: Applications in crustal deformation monitoring. In Extreme Environmental Events; Springer: Berlin/Heidelberg, Germany, 2011. [Google Scholar]
- Li, Y. Analysis of GAMIT/GLOBK in high-precision GNSS data processing for crustal deformation. Earthq. Res. Adv. 2021, 1, 100028. [Google Scholar] [CrossRef] [Scilit]
- Herring, T.; King, R.; McClusky, S. Gamit; Reference Manual. GPS Analysis at MIT. Release 10; Massachusetts Institute of Technology: Cambridge, MA, USA, 2006; pp. 1–182. [Google Scholar]
- Viltres, R.; Jónsson, S.; Alothman, A.O.; Liu, S.; Leroy, S.; Masson, F.; Doubre, C.; Reilinger, R. Present-Day Motion of the Arabian Plate. Tectonics 2022, 41, e2021TC007013. [Google Scholar] [CrossRef] [Scilit]
- Herring, T.; King, R.; McClusky, S. GLOBK; Global Kalman filter VLBI and GPS analysis program, version 10; Massachusetts Institute of Technology: Cambridge, MA, USA, 2005. [Google Scholar]
- Floyd, M.; Billiris, H.; Paradissis, D.; Veis, G.; Avallone, A.; Briole, P.; McClusky, S.; Nocquet, J.; Palamartchouk, K.; Parsons, B.; et al. A new velocity field for Greece: Implications for the kinematics and dynamics of the Aegean. J. Geophys. Res. Solid Earth 2010, 115, B10403. [Google Scholar] [CrossRef] [Scilit]
- Hidayatulloh, A.; Chaabani, A.; Zhang, L.; Elhag, M. DEM study on hydrological response in Makkah City, Saudi Arabia. Sustainability 2022, 14, 13369. [Google Scholar] [CrossRef] [Scilit]
- Agarwal, V.; Kumar, A.; Qin, Z.; Gomes, R.L.; Marsh, S. Lessons for sustainable urban development: Interplay of construction, groundwater withdrawal, and land subsidence at Battersea, London. Remote Sens. 2023, 15, 3798. [Google Scholar] [CrossRef] [Scilit]
- Hlywiak, J.; Nolan, D.S. The response of the near-surface tropical cyclone wind field to inland surface roughness length and soil moisture content during and after landfall. J. Atmos. Sci. 2021, 78, 983–1000. [Google Scholar] [CrossRef] [Scilit]
- Liu, L.; Zhang, T.; Wahr, J. InSAR measurements of surface deformation over permafrost on the North Slope of Alaska. J. Geophys. Res. Earth Surf. 2010, 115, F03023. [Google Scholar] [CrossRef] [Scilit]
- Zhao, R.; Li, Z.-W.; Feng, G.-C.; Wang, Q.-J.; Hu, J. Monitoring surface deformation over permafrost with an improved SBAS-InSAR algorithm: With emphasis on climatic factors modeling. Remote Sens. Environ. 2016, 184, 276–287. [Google Scholar] [CrossRef] [Scilit]
- Lu, Z.; Kim, J. A framework for studying hydrology-driven landslide hazards in northwestern US using satellite InSAR, precipitation and soil moisture observations: Early results and future directions. GeoHazards 2021, 2, 17–40. [Google Scholar] [CrossRef] [Scilit]
- Ali, M.A.; Nichol, J.E.; Bilal, M.; Qiu, Z.; Mazhar, U.; Wahiduzzaman, M.; Almazroui, M.; Islam, M.N. Classification of aerosols over Saudi Arabia from 2004–2016. Atmos. Environ. 2020, 241, 117785. [Google Scholar] [CrossRef] [Scilit]
- Peters, D.P.; Bestelmeyer, B.T.; Herrick, J.E.; Fredrickson, E.L.; Monger, H.C.; Havstad, K.M. Disentangling complex landscapes: New insights into arid and semiarid system dynamics. BioScience 2006, 56, 491–501. [Google Scholar] [CrossRef] [Scilit]
- Hussien, B.M.; Rabeea, M.A.; Mukhlif, H.N. Estimation of corrosion and encrustation from groundwater chemistry of the aquifers: A case study of Al Hammad zone. Environ. Nanotechnol. Monit. Manag. 2020, 14, 100334. [Google Scholar] [CrossRef] [Scilit]
- Kourgialas, N.N.; Karatzas, G.P.; Dokou, Z.; Kokorogiannis, A. Groundwater footprint methodology as policy tool for balancing water needs (agriculture & tourism) in water scarce islands-The case of Crete, Greece. Sci. Total Environ. 2018, 615, 381–389. [Google Scholar] [PubMed]
- Ravi, S.; D’ODorico, P.; Over, T.M.; Zobeck, T.M. On the effect of air humidity on soil susceptibility to wind erosion: The case of air-dry soils. Geophys. Res. Lett. 2004, 31, L09501. [Google Scholar] [CrossRef] [Scilit]
- Paldor, A.; Stark, N.; Florence, M.; Raubenheimer, B.; Elgar, S.; Housego, R.; Frederiks, R.S.; Michael, H.A. Coastal topography and hydrogeology control critical groundwater gradients and potential beach surface instability during storm surges. Hydrol. Earth Syst. Sci. 2022, 26, 5987–6002. [Google Scholar] [CrossRef] [Scilit]
- Priyan, K. Issues and challenges of groundwater and surface water management in semi-arid regions. In Groundwater Resources Development and Planning in the Semi-Arid Region; Springer: Berlin/Heidelberg, Germany, 2021; pp. 1–17. [Google Scholar]
- Lackoóvá, L.; Lieskovský, J.; Nikseresht, F.; Halabuk, A.; Hilbert, H.; Halászová, K.; Bahreini, F. Unlocking the potential of remote sensing in wind erosion studies: A review and outlook for future directions. Remote Sens. 2023, 15, 3316. [Google Scholar] [CrossRef] [Scilit]
- Ma, S.; Wang, H.-Y.; Wang, L.-J.; Jiang, J.; Gong, J.-W.; Wu, S.; Luo, G.-Y. Evaluation and simulation of landscape evolution and its ecological effects under vegetation restoration in the northern sand prevention belt, China. Catena 2022, 218, 106555. [Google Scholar] [CrossRef] [Scilit]
- Lu, H.; Li, W.; Xu, Q.; Yu, W.; Zhou, S.; Li, Z.; Zhan, W.; Li, W.; Xu, S.; Zhang, P.; et al. Active landslide detection using integrated remote sensing technologies for a wide region and multiple stages: A case study in southwestern China. Sci. Total Environ. 2024, 931, 172709. [Google Scholar] [CrossRef] [Scilit] [PubMed]
- Alzahrani, A.J.; Alghamdi, A.G.; Ibrahim, H.M. Assessment of Soil Loss Due to Wind Erosion and Dust Deposition: Implications for Sustainable Management in Arid Regions. Appl. Sci. 2024, 14, 10822. [Google Scholar] [CrossRef] [Scilit]

Disclaimer/Publisher’s Note: The statements, opinions and data contained in all publications are solely those of the individual author(s) and contributor(s) and not of MDPI and/or the editor(s). MDPI and/or the editor(s) disclaim responsibility for any injury to people or property resulting from any ideas, methods, instructions or products referred to in the content. |
© 2026 by the authors. Licensee MDPI, Basel, Switzerland. This article is an open access article distributed under the terms and conditions of the Creative Commons Attribution (CC BY) license.