


Abstract
Geological hazard data exhibits high-volume and multi-type characteristics, specifically characterized by inherent complexity; measurement uncertainty; cross-source heterogeneity; underdeveloped semantic organization; and fragile inter-entity associations. Consequently, advanced modeling techniques coupled with robust extraction frameworks become imperative for effective unstructured data governance. To address this challenge, we propose a content–knowledge representation framework that decomposes and reconstructs disaster data using fine-grained content entities as base units. This approach allows for a unified description, objectification, ordering, hierarchical storage, and indexed categorization of unstructured information. Furthermore, we develop specialized text extraction algorithms tailored to document imagery and vector maps—facilitating the systematic application of information retrieval techniques while efficiently targeting specific thematic content. Our method outperforms two representative deep learning architectures (Fast CNN and FCN), demonstrating superior performance in segmenting target regions and precisely detecting textual elements, tables, and geographic features within complex datasets. By studying the modeling and extraction technology of unstructured geologic data, this paper establishes the value chain of geologic result data, which can provide strong support for digital management of geologic disaster data and improve work efficiency.
1. Introduction
Geological hazard investigation data are characterized by diversity, uncertainty, and complexity, featuring multiple forms of information expression, various data formats, and voluminous quantities. These data consist of both unstructured and structured components, with unstructured data accounting for a significant proportion. Additionally, geohazard data exhibit multi-class, multi-source, heterogeneous, multi-dimensional, multi-temporal, and multi-topic characteristics. The sources of geohazard information span multiple disciplines and territories, notably including a large number of fragmented and dispersed textual and graphical unstructured data resources covering stratigraphy, tectonics, geomorphology, hydrology, and other specialties. Due to the lack of a unified description standard, these data are stored in a disorganized manner, with underdeveloped semantic organization and fragile inter-entity associations, which severely restrict their effective utilization.
In recent years, the integration and rapid development of big data and artificial intelligence technologies have provided new avenues for the research and development of intelligent geohazard prevention and control models. In the field of data modeling, the Hadoop platform is renowned for its scalability, security, and efficiency. Numerous scholars have leveraged the Hadoop platform for related research, particularly focusing on the integration of Hadoop with databases to address the storage limitations of traditional databases and enhance computational capabilities [1]. Regarding big data modeling algorithms for the Hadoop platform, two primary research types have emerged: hierarchical clustering analysis algorithms based on MapReduce [2] and iterative clustering analysis algorithms with parallel processing [3]. These algorithms have shown promising results in big data clustering and possess good scalability, but they lack feedback mechanisms, making validation challenging. Condie et al. introduced the concept of a pipeline based on MapReduce [4], which facilitates transactions through relatively independent pipelines. This approach not only enhances real-time data processing but also enables multitask concurrency. However, all the aforementioned methods focus on optimizing storage and computing capabilities, failing to address the unique problems of geohazard data: “lack of semantic organization and broken spatial associations”. They are unable to achieve a unified semantic description of multi-source heterogeneous data or effectively capture the spatial relationships between geological entities.
In terms of information extraction, the advent of ACL and CoNLL conferences has significantly advanced the field of information extraction, evolving it into a critical subfield within natural language processing (NLP) [5]. Domestic scholars started their research on information extraction relatively late; initially focused on named entity recognition, they later extended to entity–relationship extraction and event extraction [6,7]. Since the rise of natural language pre-training models represented by Transformer, a number of large-scale pre-training language models such as Baidu ERNIE have emerged, which can handle various tasks of textual information extraction in an end-to-end mode. In recent years, with the explosive development of deep learning, natural language processing and text information extraction technologies have advanced rapidly, and a variety of deep learning techniques (e.g., convolutional neural networks, recurrent neural networks, graph neural networks, attention mechanisms, etc.) have been used to solve the problem of unstructured data extraction. Nanehkaran et al. conducted a systematic review demonstrating that artificial neural networks (ANNs) can effectively integrate multi-source geospatial data, such as remote sensing images, digital elevation models (DEMs), and geological information, to achieve high-precision assessments of riverbank landslide susceptibility. This approach provides a critical technical paradigm for intelligent modeling and risk extraction in geological disaster big data [8]. Cemiloglu et al. successfully generated landslide susceptibility maps by integrating multi-source geospatial data, including elevation, lithology, and meteorological parameters, using logistic regression algorithms. Their study confirmed the reliability of structured modeling methods in predicting geological disasters [9]. For the complex failure mechanism analysis of rock slopes, Mao et al. innovatively proposed a secondary toppling stability analysis method based on block theory (BTSTSA). By coupling limit equilibrium analysis with geometric modeling, this method enables quantitative safety factor assessment of composite failure mechanisms, offering a representative example for the intelligent extraction of engineering analysis models in geological disaster studies [10]. However, these methods generally lack adaptation to the core characteristics of geological documents: geological data are dense in professional terminology and exhibit strong coupling between text, tables, and graphics (e.g., the correspondence between stratigraphic lithology tables and cross-sectional diagrams in geological maps). Existing general NLP models and deep learning algorithms have not been optimized for these characteristics, leading to insufficient accuracy in professional content extraction and broken cross-modal information associations.
In summary, current research has three core gaps: (1) the lack of a unified semantic modeling framework adapted to the characteristics of geohazard data such as semantic organization and spatial associations; (2) general information extraction algorithms fail to consider the domain specificity of geological documents (dense professional terminology, strong coupling of text–tables–graphics) and geological vector maps (spatial association characteristics); (3) the failure to realize a full-process closed loop of “data modeling–information extraction–knowledge association”, leading to disconnection between data processing and knowledge discovery. Specifically, existing big data platforms such as Hadoop focus on distributed storage and computation but lack semantic mechanisms to link spatial features in vector maps with their textual descriptions. General-purpose NLP models, while effective for open-domain text, struggle to associate stratigraphic columns in tables with their descriptions in the main text due to strong cross-modal coupling. Furthermore, current approaches typically stop at data integration, failing to construct a queryable knowledge network. These gaps motivate our work. Consider a typical scenario: a geologist needs to identify potential landslide sites based on lithological and slope conditions. The required information is scattered across PDF reports, vector maps, and embedded tables—stored as isolated files with no semantic linkages. The system cannot correlate textual descriptions with spatial features or retrieve relevant tabular data. Consequently, the geologist must manually browse through multiple documents, a process that can take hours for a single region. This scenario illustrates how the lack of semantic organization and broken spatial associations impede efficient data utilization—precisely the core problem this paper addresses. This study focuses on geohazards such as landslides and debris flows, which are representative of the geological phenomena documented in survey reports, maps, and tables. Key parameters—including lithology, slope gradient, stratigraphic structure, and hydrological conditions—are embedded in these unstructured sources. In our UDM framework, these parameters are formalized as content entities: lithological descriptions in Chapter.paragraphs, slope gradients in GeoMap.mapContent, and hydrological data in Table entities, thereby enabling semantic querying across various geohazard types.
To address these challenges, this paper proposes an integrated technical framework comprising three interconnected modules: semantic modeling, data extraction, and collaborative integration. First, a Unified Data Model (UDM) is established to decompose multi-source heterogeneous data (e.g., documents, vector maps) into fine-grained content entities. With these entities as the fundamental unit, the UDM enables unified description, objectification, ordering, hierarchical storage, classification, and indexing of unstructured geohazard data, thereby addressing the lack of domain-adapted semantic modeling. Second, for textual data, a Block embedding-enhanced LSTM algorithm is developed, which employs hybrid feature sequencing (stylistic + textual) to identify structural elements such as titles, paragraphs, and tables in geological documents. This approach specifically overcomes the limitations of generic algorithms in handling domain-specific terminology density and multi-modal coupling. Third, for graphical data, a hybrid layout segmentation algorithm is designed, integrating projection analysis, connected domain processing, and a specialized CNN architecture. This method effectively isolates text, table, and figure regions in vector maps while leveraging spatial coordinate relationships and legend–main map mappings—improvements that are critical to addressing the shortcomings of general-purpose layout algorithms in geological contexts. Together, these three modules form a cohesive pipeline that transforms unstructured data into reusable knowledge structures, providing foundational technical support for the digital management of geohazard data.
2. Materials and Methods
Data modeling addresses the heterogeneity and multi-sourcing of geohazard data due to diverse storage formats (e.g., documents, vector graphics, record forms). The core objective is to organize and describe data in a simplified manner without information loss, enabling more accurate extraction of impact factors near the target area and facilitating the discovery of embedded knowledge. The model emphasizes semantically clear splitting, description, and structural reconstruction of various information types containing influencing factors. It provides an access structure that supports efficient localization of massive sparse information, laying the foundation for subsequent application of mature knowledge extraction techniques.
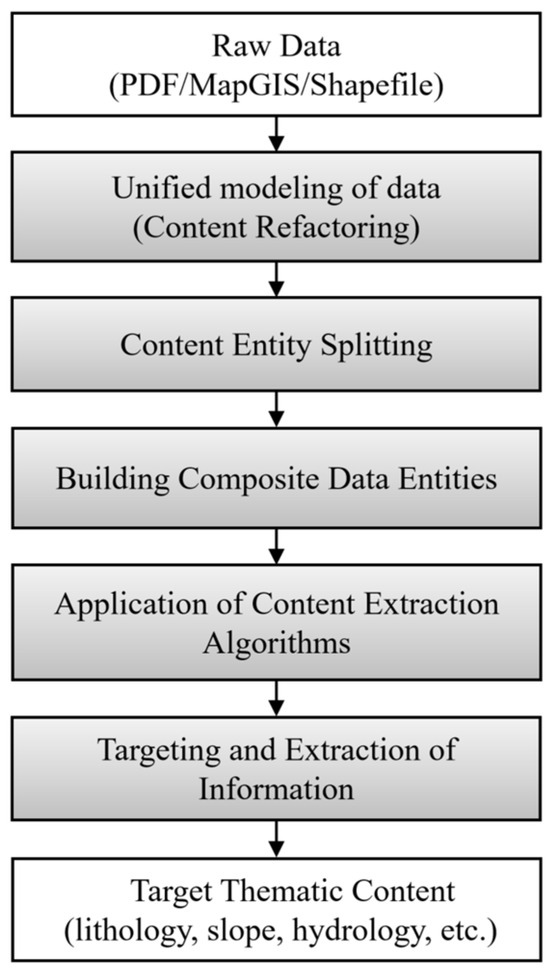
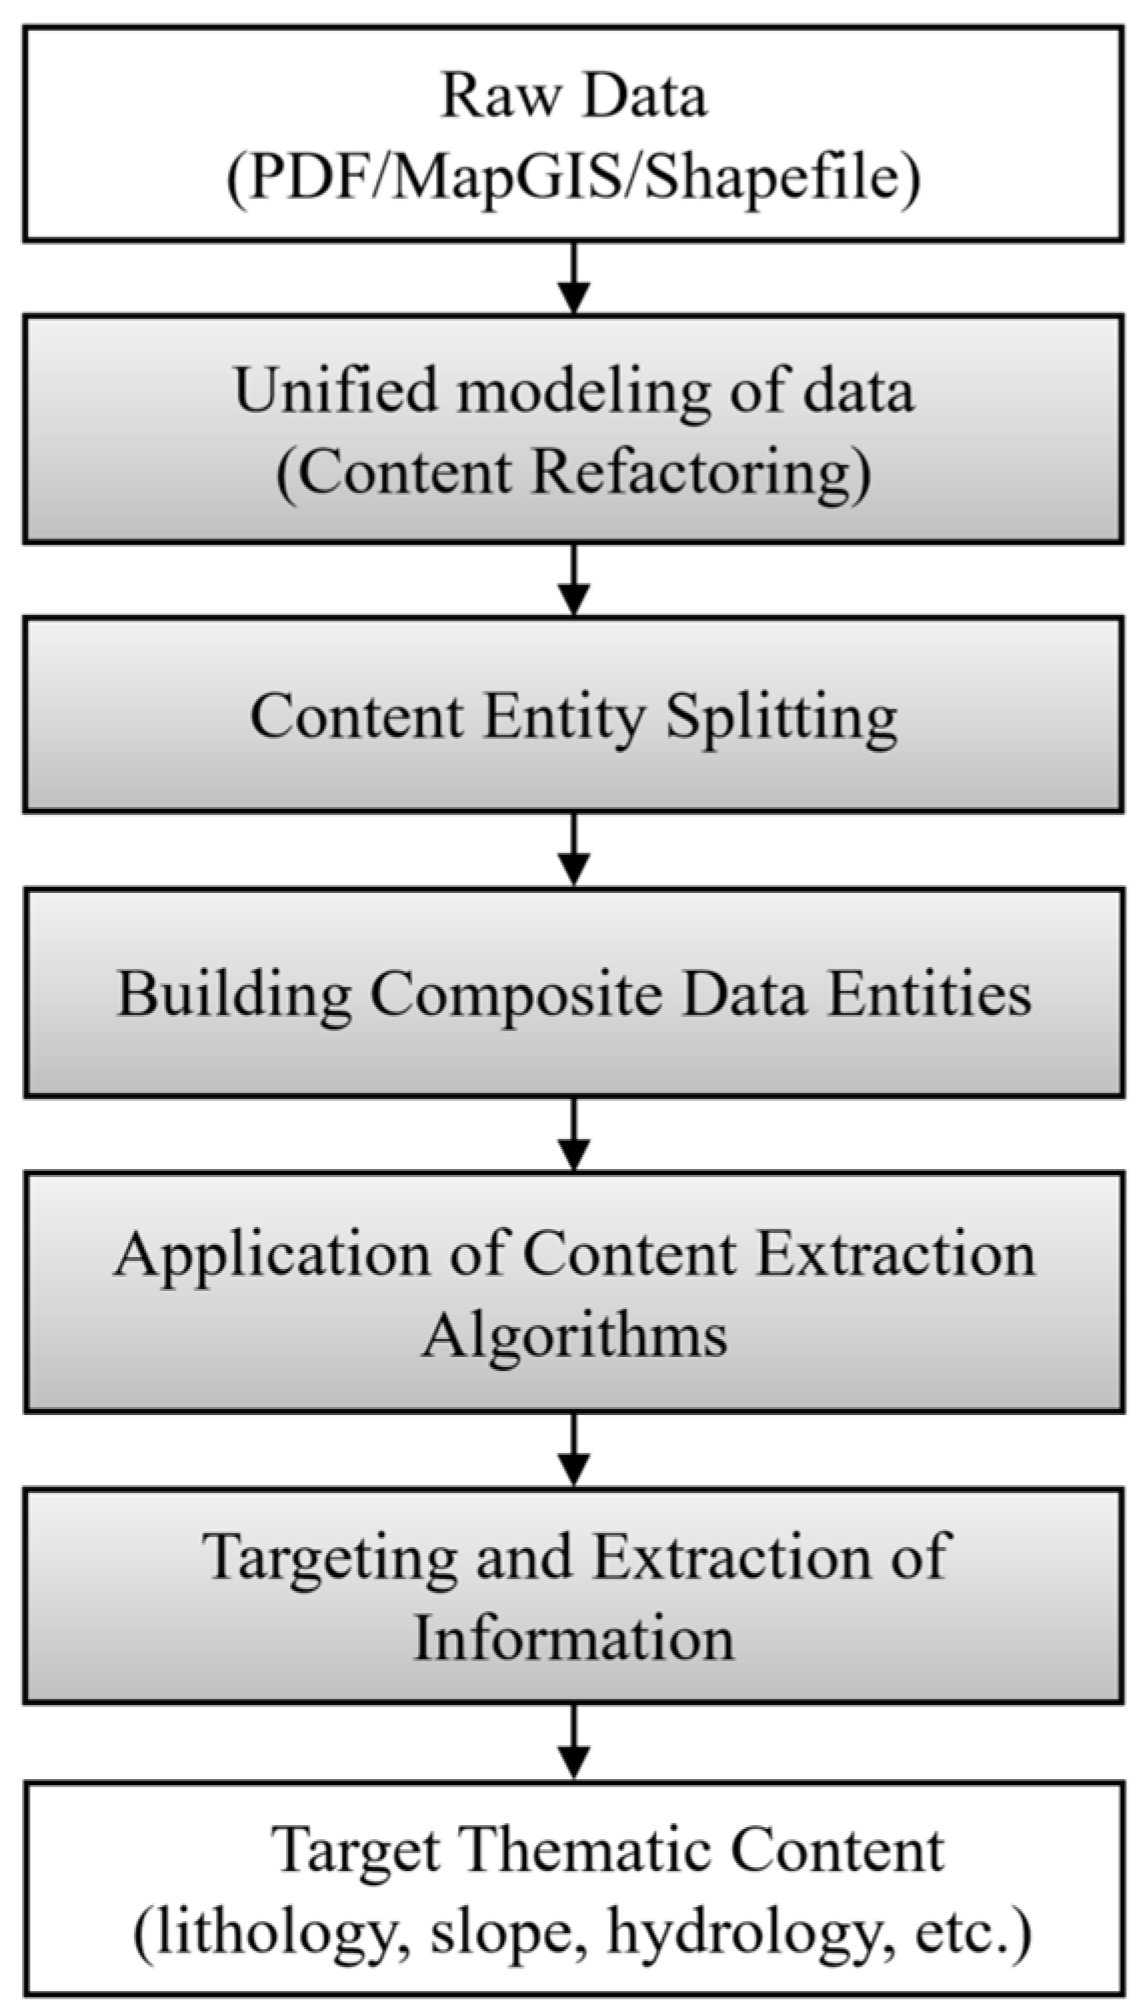
This paper adopts the content-knowledge expression model to organize data, focusing on its splitting and reconstruction. A unified content expression model is constructed with content entities as the smallest unit, achieving unified description, objectification, ordering, hierarchical storage, and classification/indexing of unstructured data. Since key information about influencing factors is often implicit in unstructured data such as graphs and tables, their unified description is crucial for effective information expression, acquisition, and subsequent knowledge extraction. The model overcomes limitations of dataset segmentation and file boundaries due to regional characteristics of geohazard investigations, integrating isolated information into a unified framework. This enhances information linkage, simplifies acquisition methods, and improves positioning efficiency. Figure 1 illustrates the process of converting unstructured data into content entities, outlining the five main stages from raw data to target thematic content. Detailed specifications of inputs, outputs, and queryable elements at each stage will be introduced in the following sections.
Figure 1.
High-level workflow of the proposed pipeline.
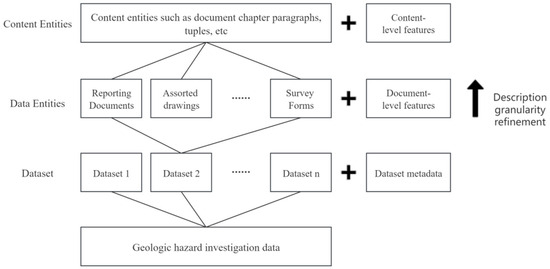
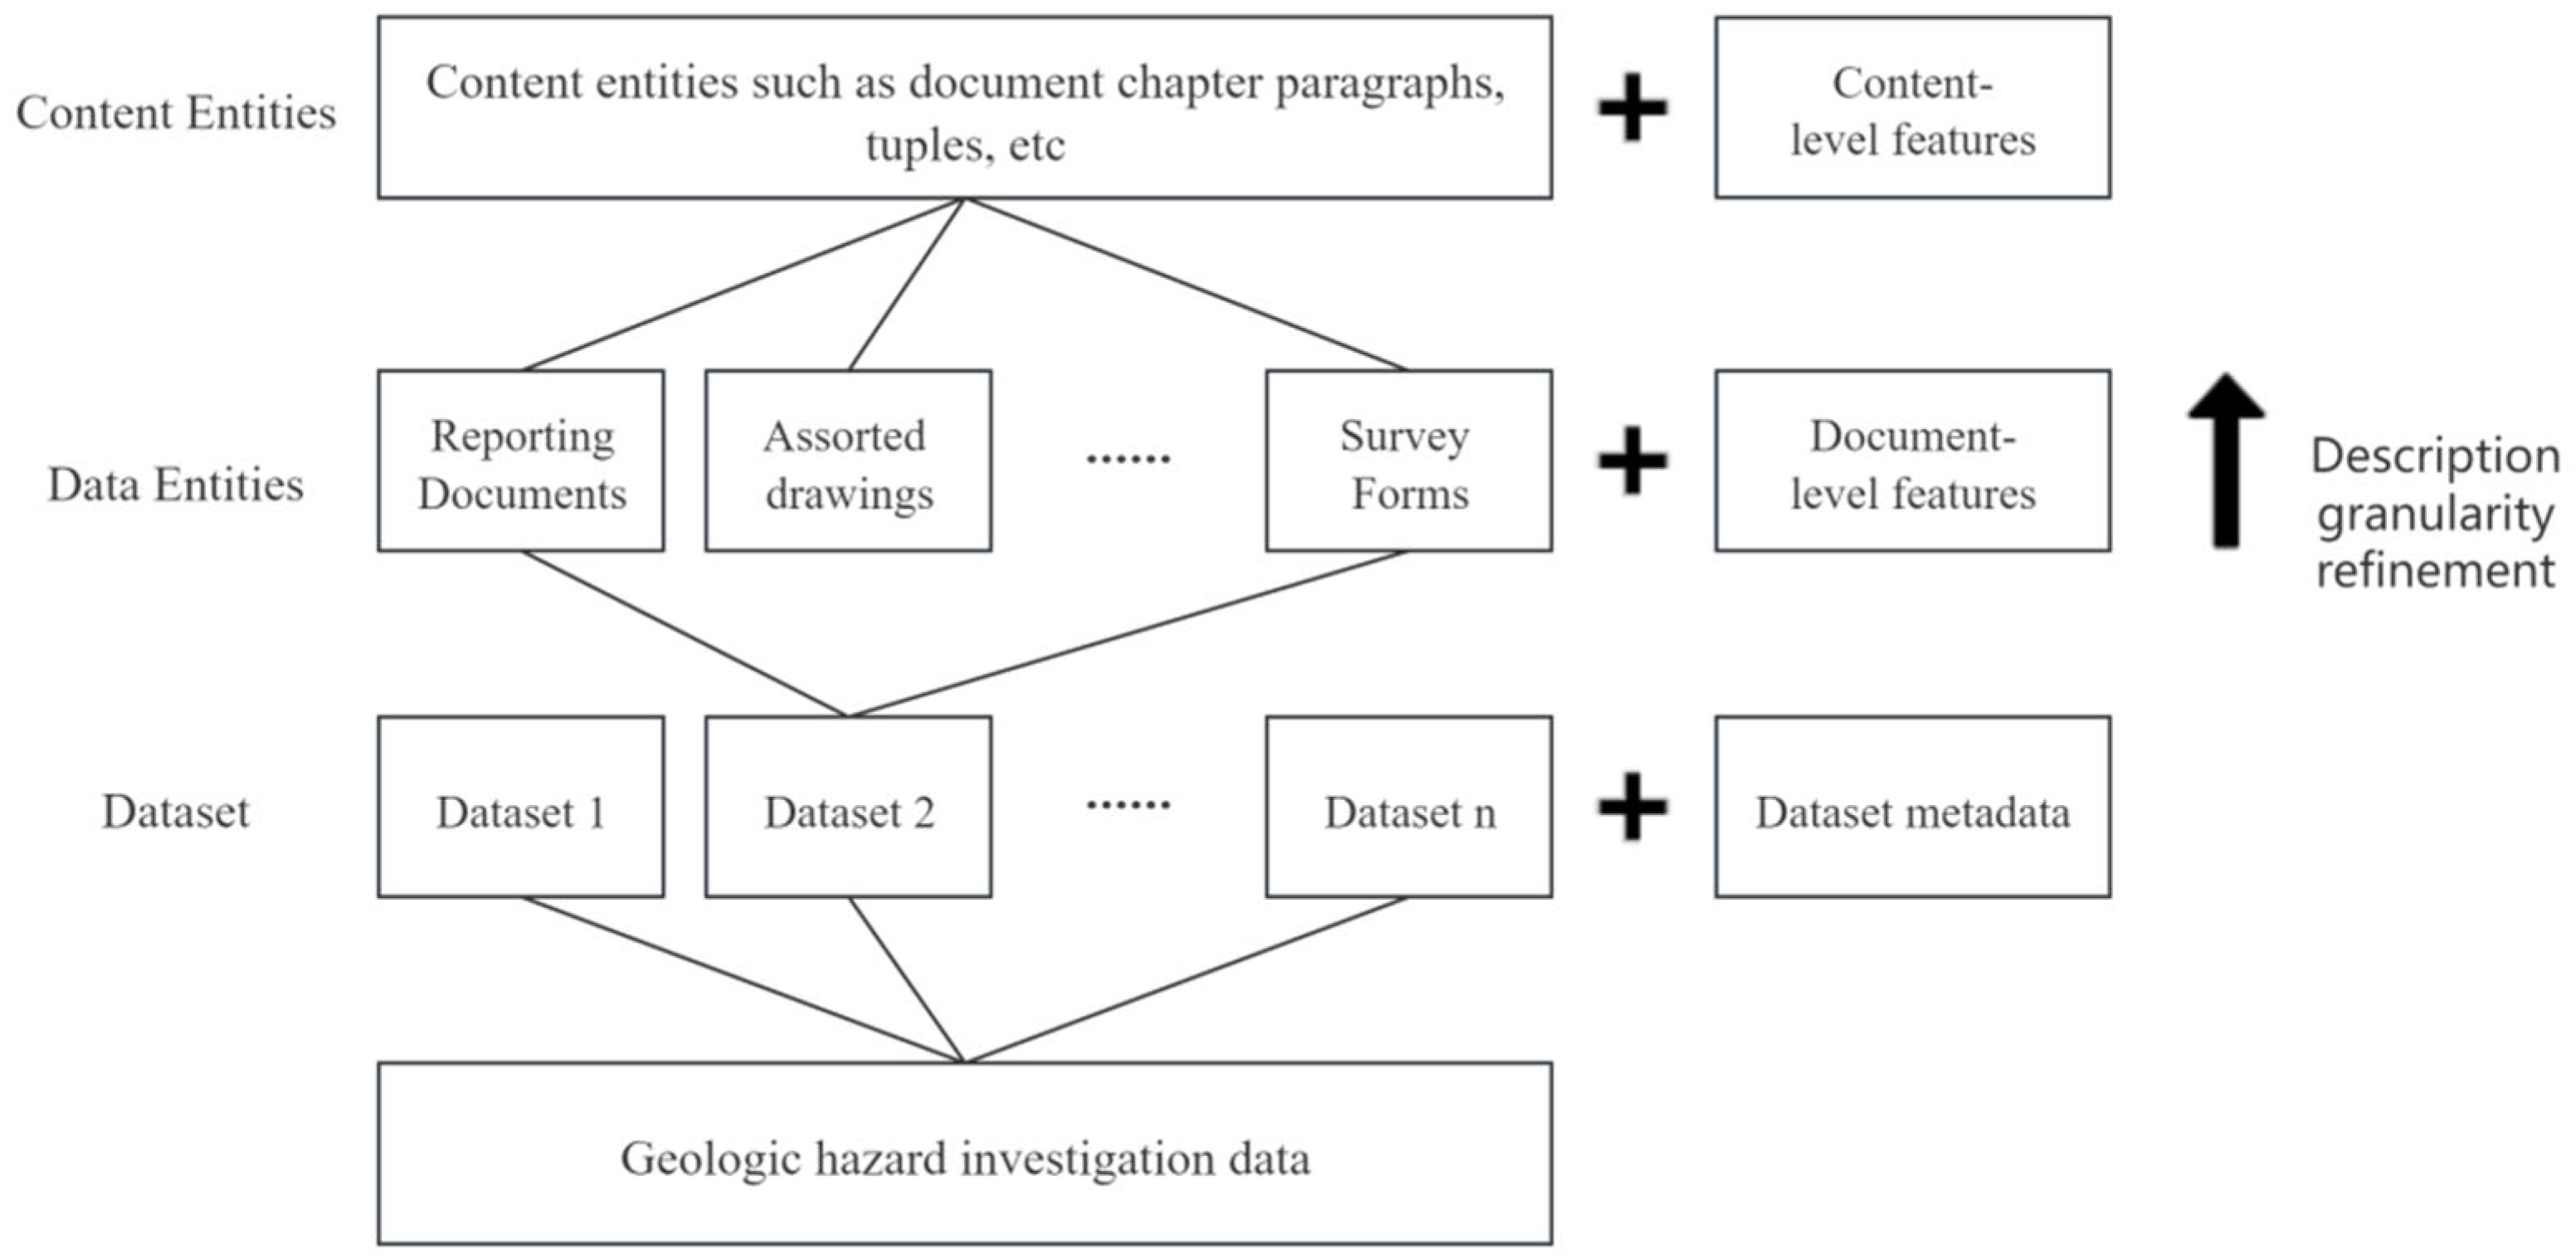
The model employs a pyramidal granularity division, as shown in Figure 2: the top level consists of dataset (catalog) metadata (e.g., name, identification number, and scope), the middle level involves document-level descriptions (spatial elements, document metadata, and various index tables), and the bottom level comprises content entities and relationships after disassembling data entities (e.g., chapters and paragraphs of documents, illustrated tables, main diagrams of maps, and elemental elements of diagrams). The first two levels are based on existing data organization, while content-level entities represent the minimum granularity objects and serve as the core of model operations.
Figure 2.
Hierarchical management of geohazard survey data.
Table 1 maps the concepts in the model to the hierarchical relationships and data composition of the data that now need to be modeled.
Table 1.
Correspondence between geohazard survey data and data model concepts.
Geohazard investigation data can be modeled with a generic model, so the Root-set contains only one type of dataset, i.e., the geohazard investigation result dataset. Each Data-set represents one file of geohazard investigation results dataset; for example, if there are 5000 files of data, then the Root-set contains 5000 Data-sets, which can be represented in the following form:
If the relationship between Root-set and Data-set is represented according to the tree structure, Root-set may have a large number of child nodes, which will be done in the actual data structure similarly to the tree structure optimization of Huffman coding without letting a node exist too many child nodes, but observing it from the logical viewpoint, it can be assumed for the time being that all the Data-sets all are Root-set’s direct child nodes. Each class of content entities such as paragraphs, tables, pictures, vector diagrams, etc., will be reasonably expressed by the model, and data entities are composites combined into content entities, which can be divided into three categories of documents, diagrams, and schedules according to different data types, so that the Geodetic Hazard Survey results dataset will contain multiple document data entities (Z), zero to more than one diagram data entity (T), and zero to more than one schedule data entity (B). Thus, the dataset can be formalized into the following form:
Based on the object-oriented nature of the model, any kind of data entity can be represented using content entities through object-oriented thinking. This process, known as data reconstruction, involves unifying complex and heterogeneous result data using content entities. From this perspective, the current model can also be referred to as a “unified description model for geohazard result data.” There are two general approaches to modeling data entities: (1) splitting and reconstructing the data before it enters the model, and (2) treating the data as a file, depositing it into the model, and then reading and parsing the contents as needed. We have chosen the first approach. The reason is that the purpose of refactoring is to enable the machine to understand the structure of the content in the data. Among the valuable aspects of document data is the textual information it carries. Although it is possible to directly use big data technology to handle multi-source heterogeneous text data in geological data archives, the number of subsequent calculations and analyses, as well as the complexity of the process, are unpredictable. Furthermore, the system overhead of direct processing will exceed the overhead saved by not carrying out refactoring. Currently, the storage and exchange of geo-disaster data typically utilize traditional centralized file systems, with CD-ROMs and hard disks as the primary storage media. Since this part of the data cannot participate in high-level computations (as it belongs to offline storage), it is essential to dump the data into a storage system with sufficient computational power. Adding the data reconstruction process seems natural and will actually reduce the overall complexity of data processing and improve the overall performance of the system. Based on the above general idea, the following sections discuss the reconstruction of various types of data entities and the use of content entities for object-oriented expression. The explanation will be carried out in an intuitive manner using the Unified Modeling Language (UML).
2.1. Representation of Relevant Content Entities
2.1.1. Basic Content Entities
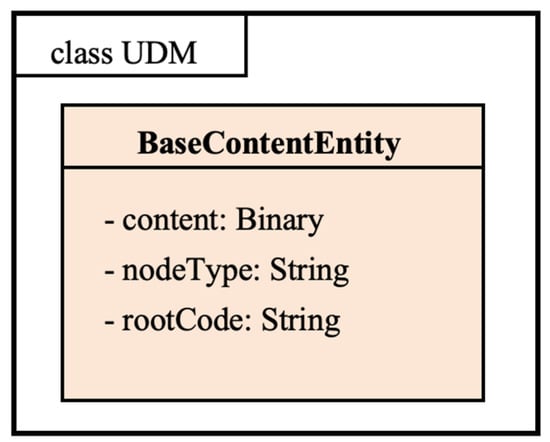
BaseContentEntity serves as the foundational class for all content entities. This schema-lagged base class allows for the addition of an unlimited number of attributes beyond the basic ones illustrated in Figure 3. Each materialized content entity in the UDM is derived from BaseContentEntity, which includes only three essential attributes. The specific meanings and roles of these attributes are detailed below.
Figure 3.
BaseContentEntity base content entity.
2.1.2. Table Entities
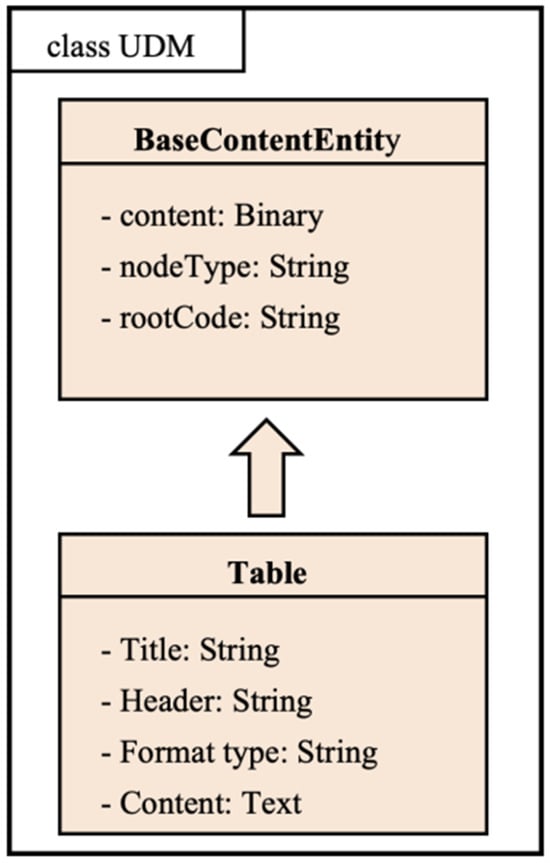
The table is a pivotal information carrier within disaster data, structured by specific rows and columns that intersect to form cells. The content encapsulated in these tables constitutes the primary focus of our modeling efforts. In the context of unstructured data, standard entity modeling for tables does not apply; instead, we consider only the fundamental attributes of the table. These basic attributes include the title, header, and table content (which redundantly encompasses the header). The table class’s nodeType is designated as “de.nt:tab”. The title of a table is typically identified by its distinct formatting (e.g., bold, centered) and proximity to the table content, while the tabular data itself is structured by detecting row and column boundaries through layout analysis. Figure 4 illustrates the content entity model of a table.
Figure 4.
Table entity.
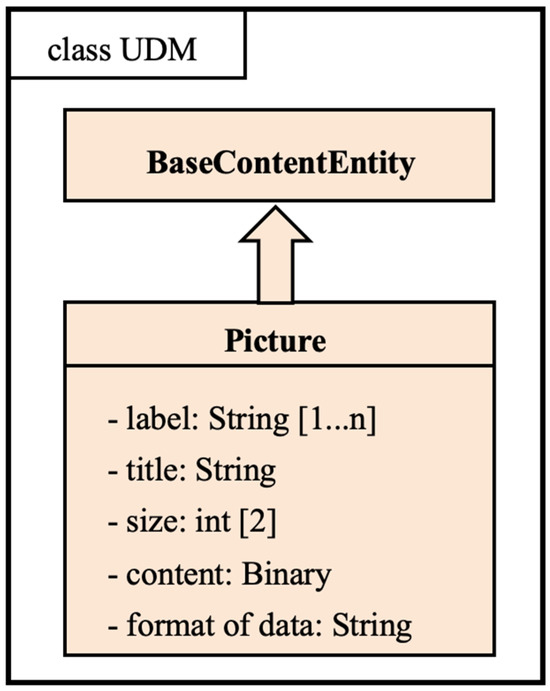
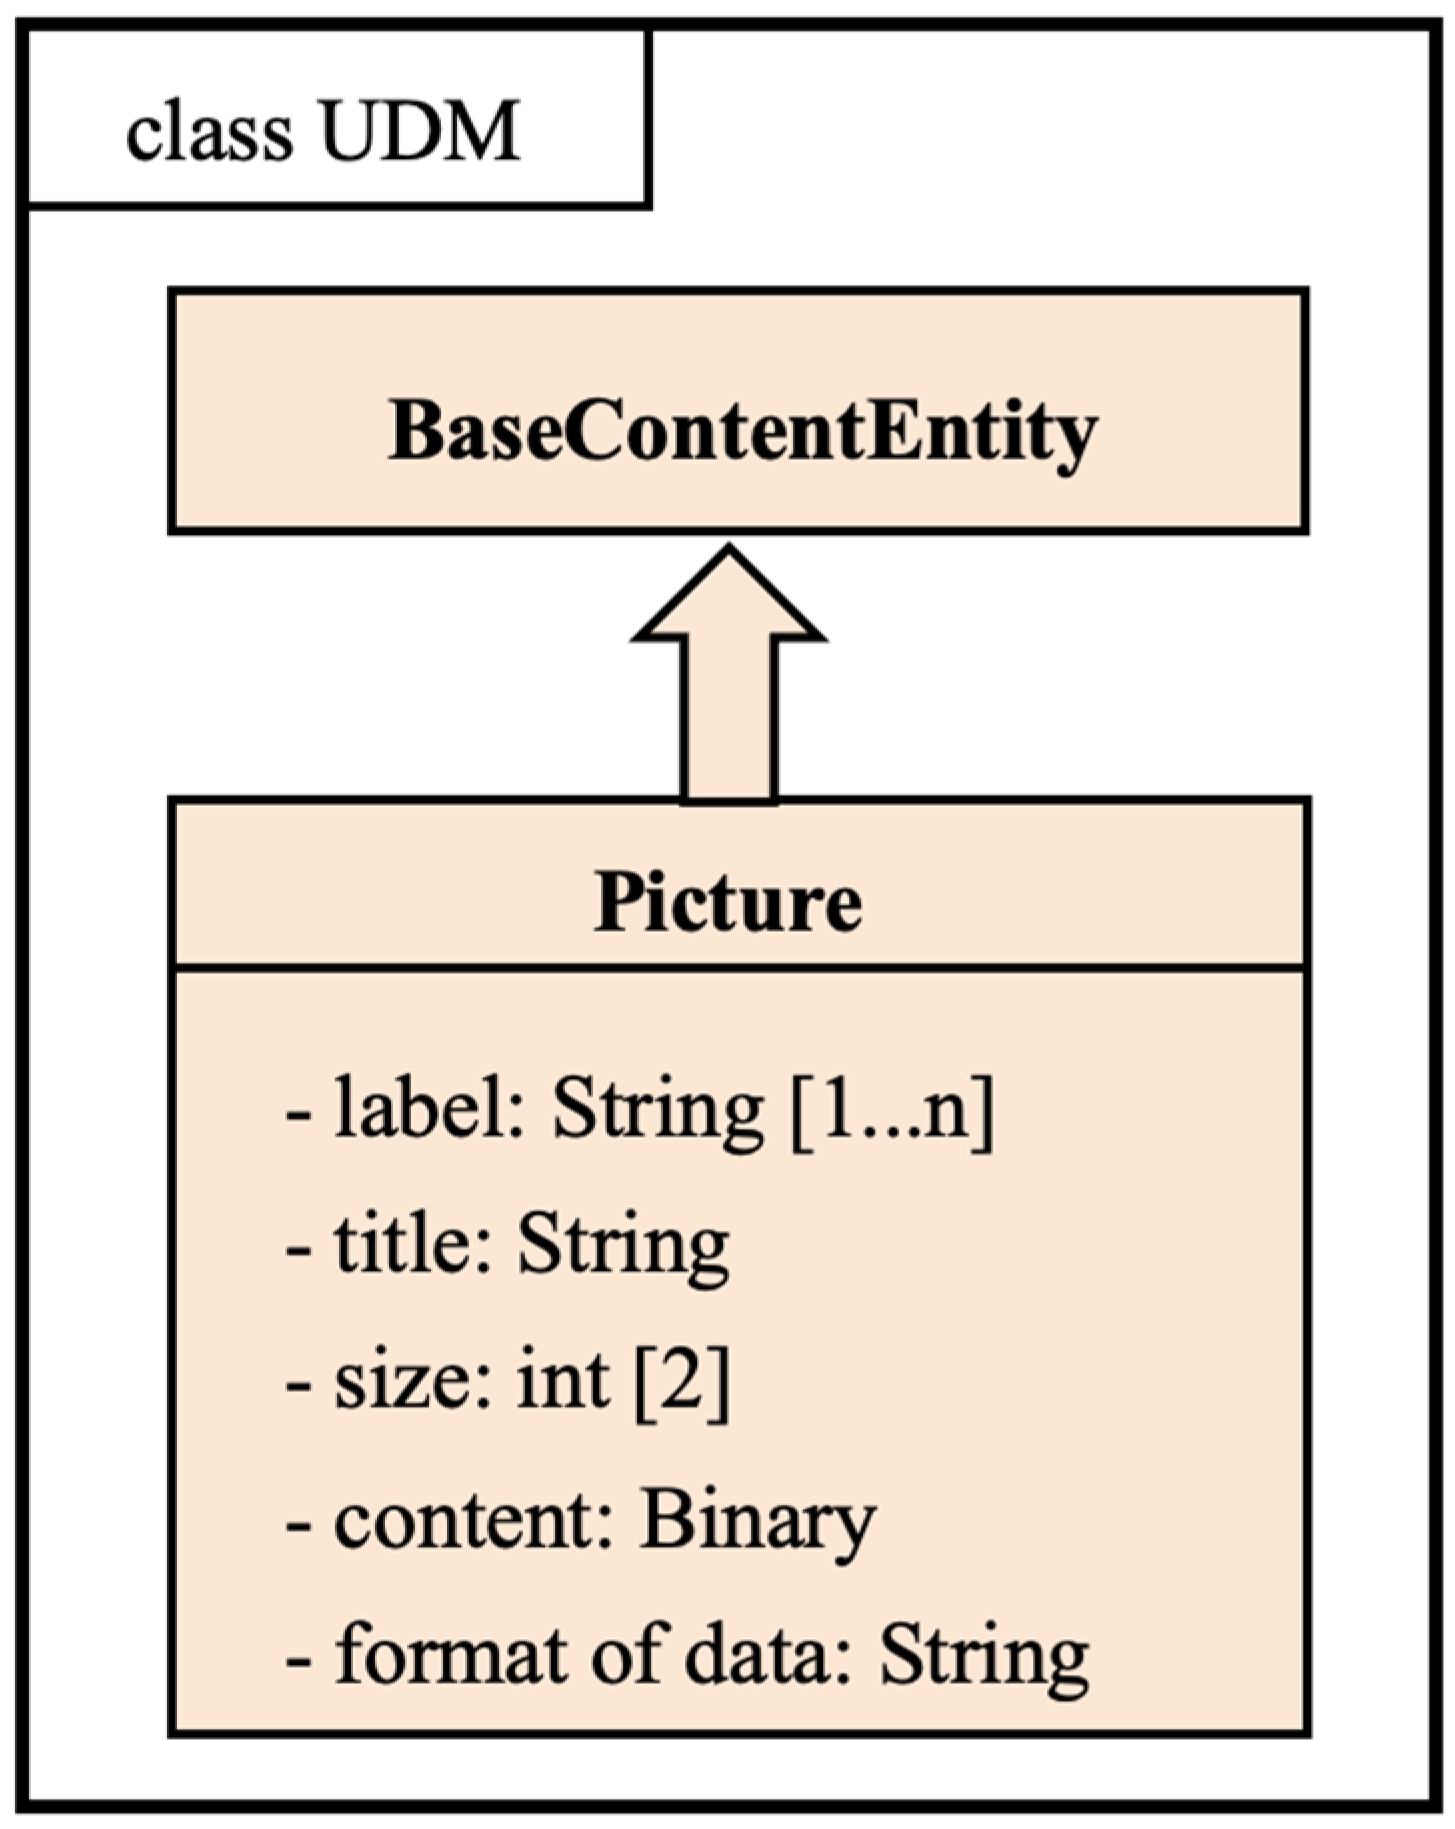
2.1.3. Picture Entities
The picture is the plane media composed of graphics, images, etc. There are many formats of pictures, but on the whole, they can be divided into two categories, raster and vector; the commonly used BMP, JPG and other formats are dot matrix raster, while mapgis, CDR, shapefile and other formats of graphics belong to vector graphics. Pictures can be self-contained files or illustrations embedded in the document. The entity modeling of the image is shown in Figure 5. The initial state of the model contains only the native attributes, and other feature descriptions will be added in the later evolution. A picture’s title is usually recognized as the nearest text block with specific formatting (e.g., “Figure X”), and its content is stored as binary data with format metadata extracted from the document. The native attributes are defined as follows.
Figure 5.
Picture entity.
Title: The title is a short statement indicating the main content of the image. The attribute name of the title in the image entity is title, and its type is String, which can be an empty string or just null. The value of the title may change in the later evolution.
Label: Tags are a kind of categorization of images; an image can have zero or more tags. The attribute name of the tag is tags, which is of type String array and can be null. Tags are manually pre-labeled or can be automatically labeled during the evolution of the model.
Size: The length and width of the image can be in pixels, centimeters, inches, etc. The default is pixels.
2.1.4. Chapter Entities
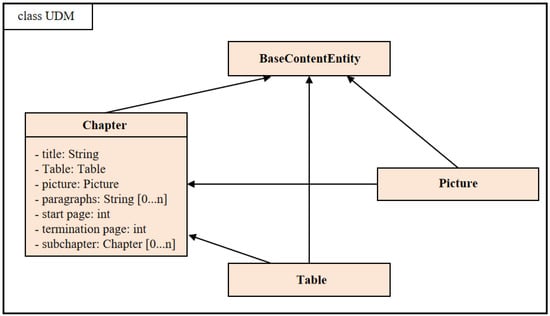
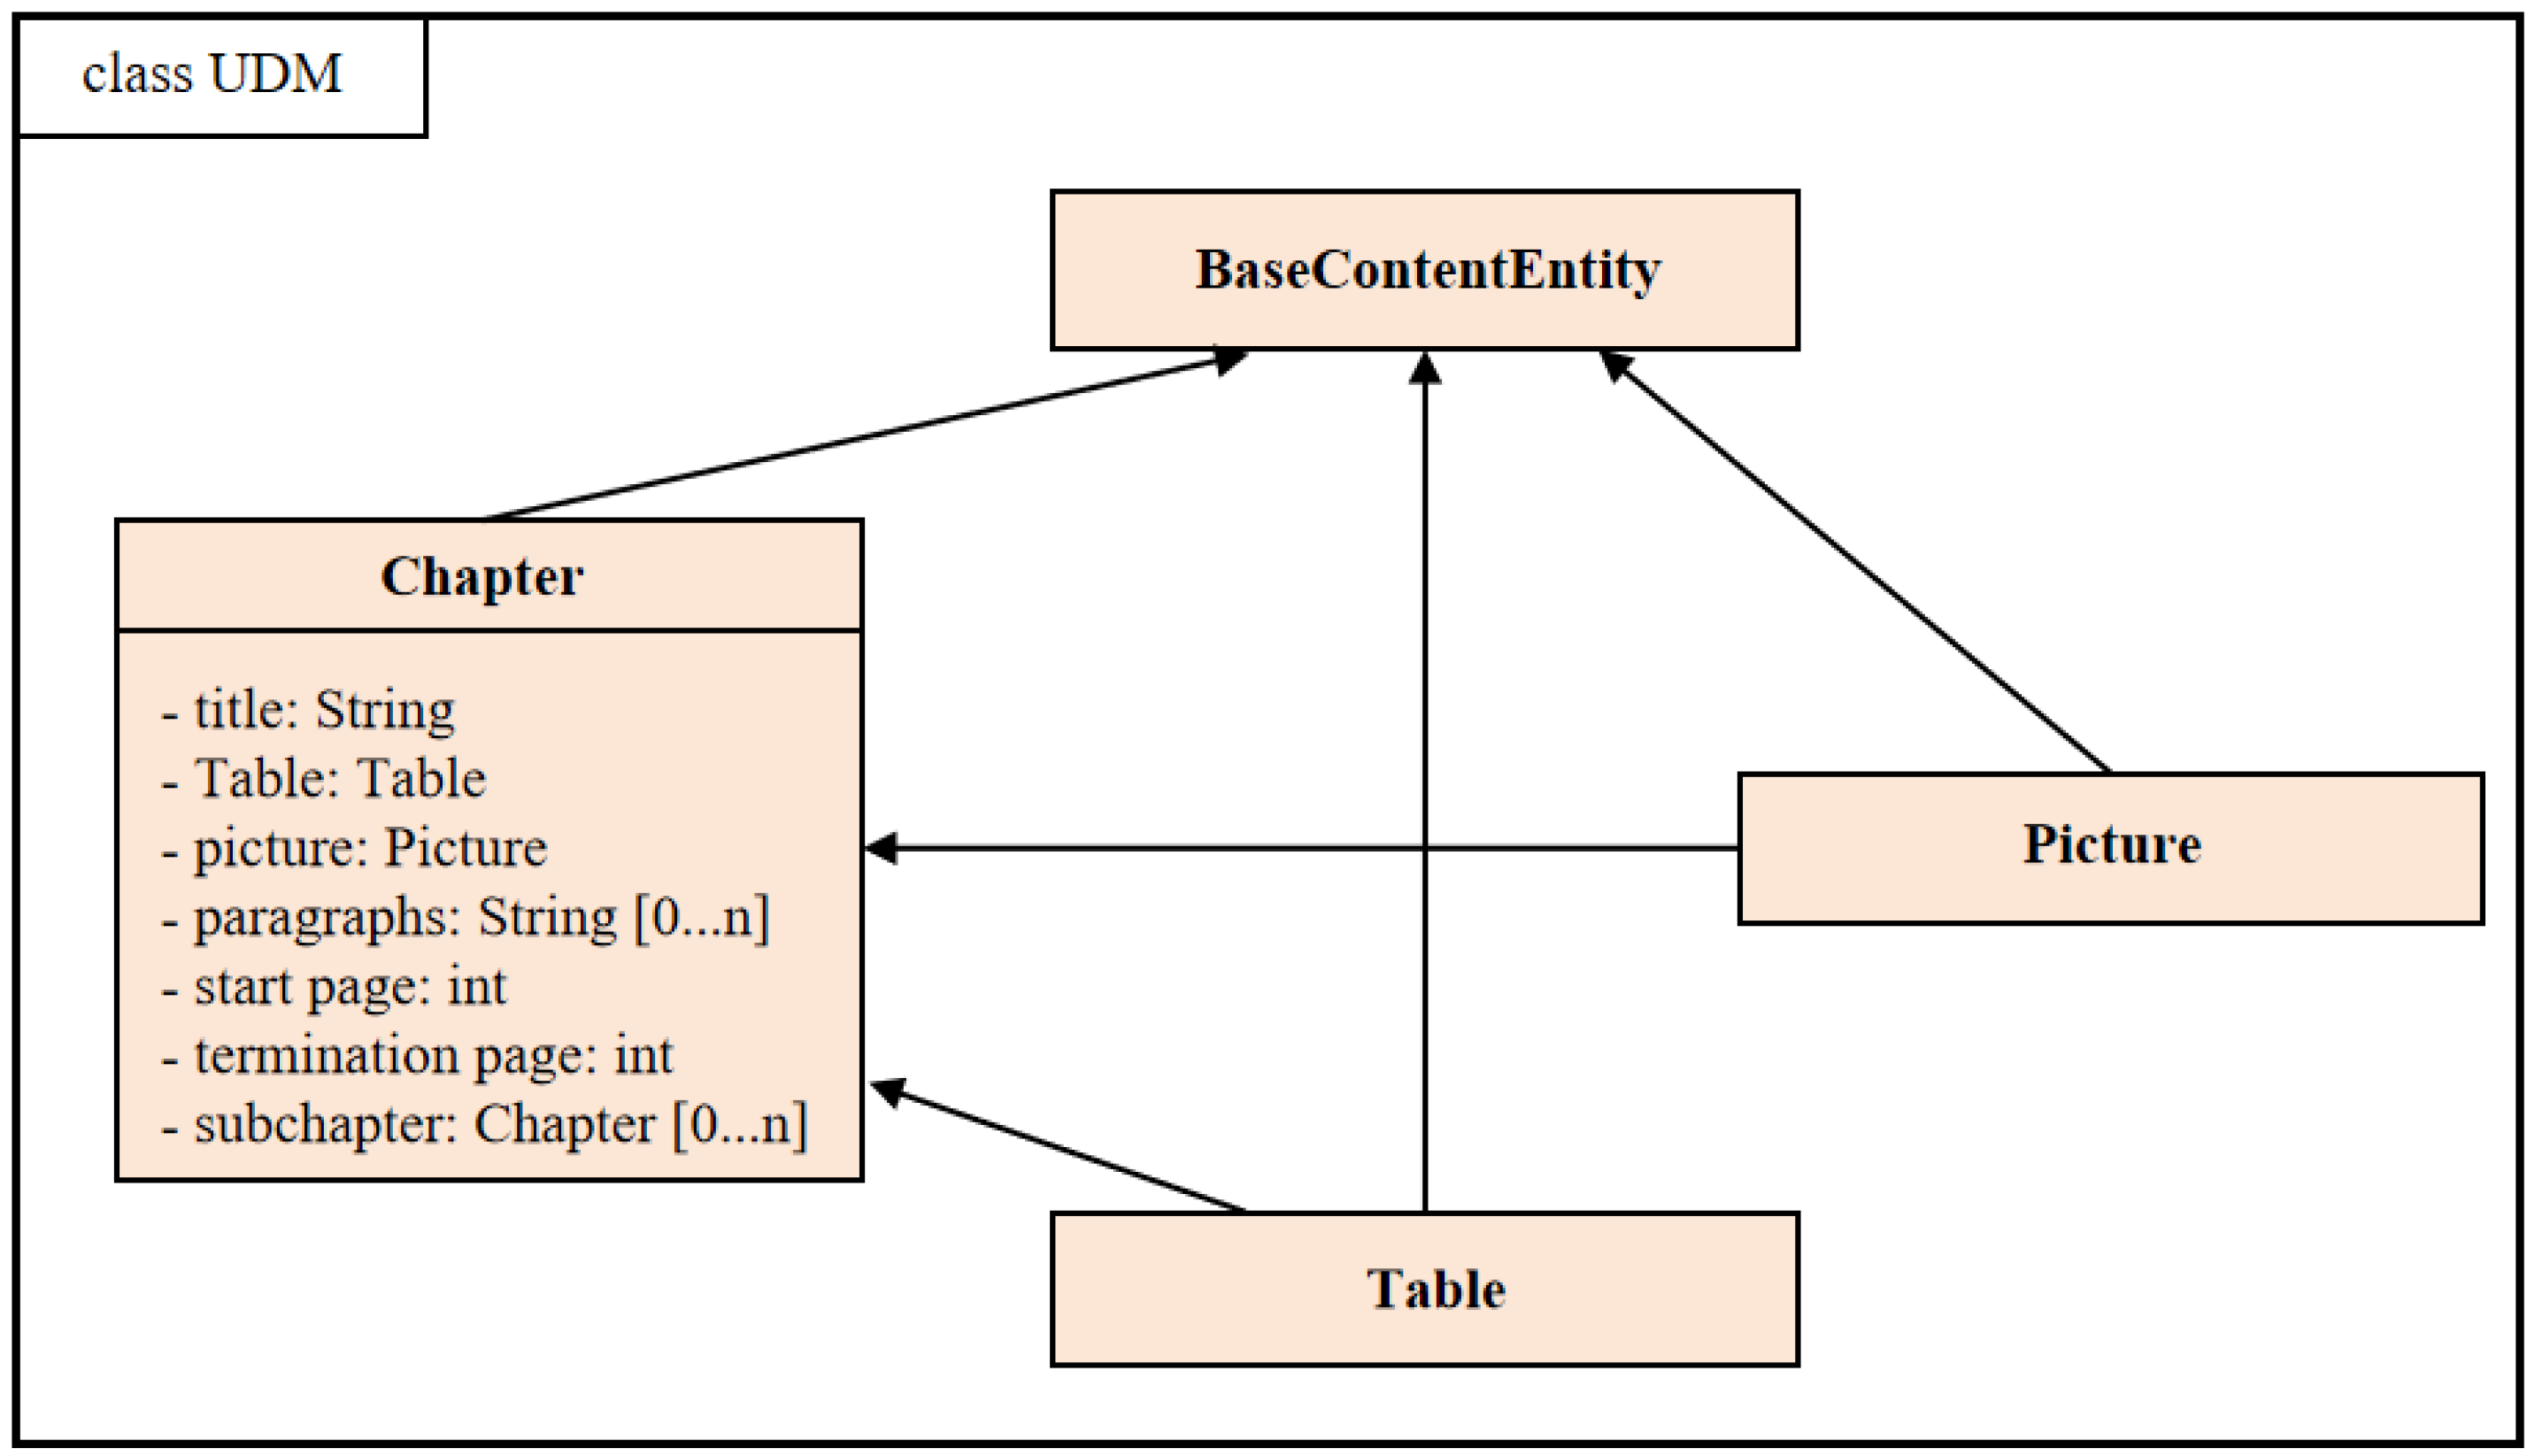
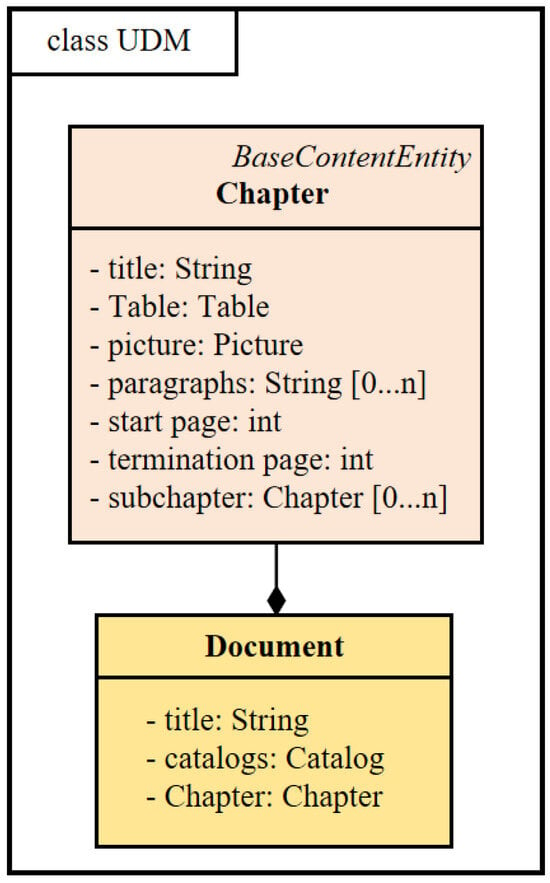
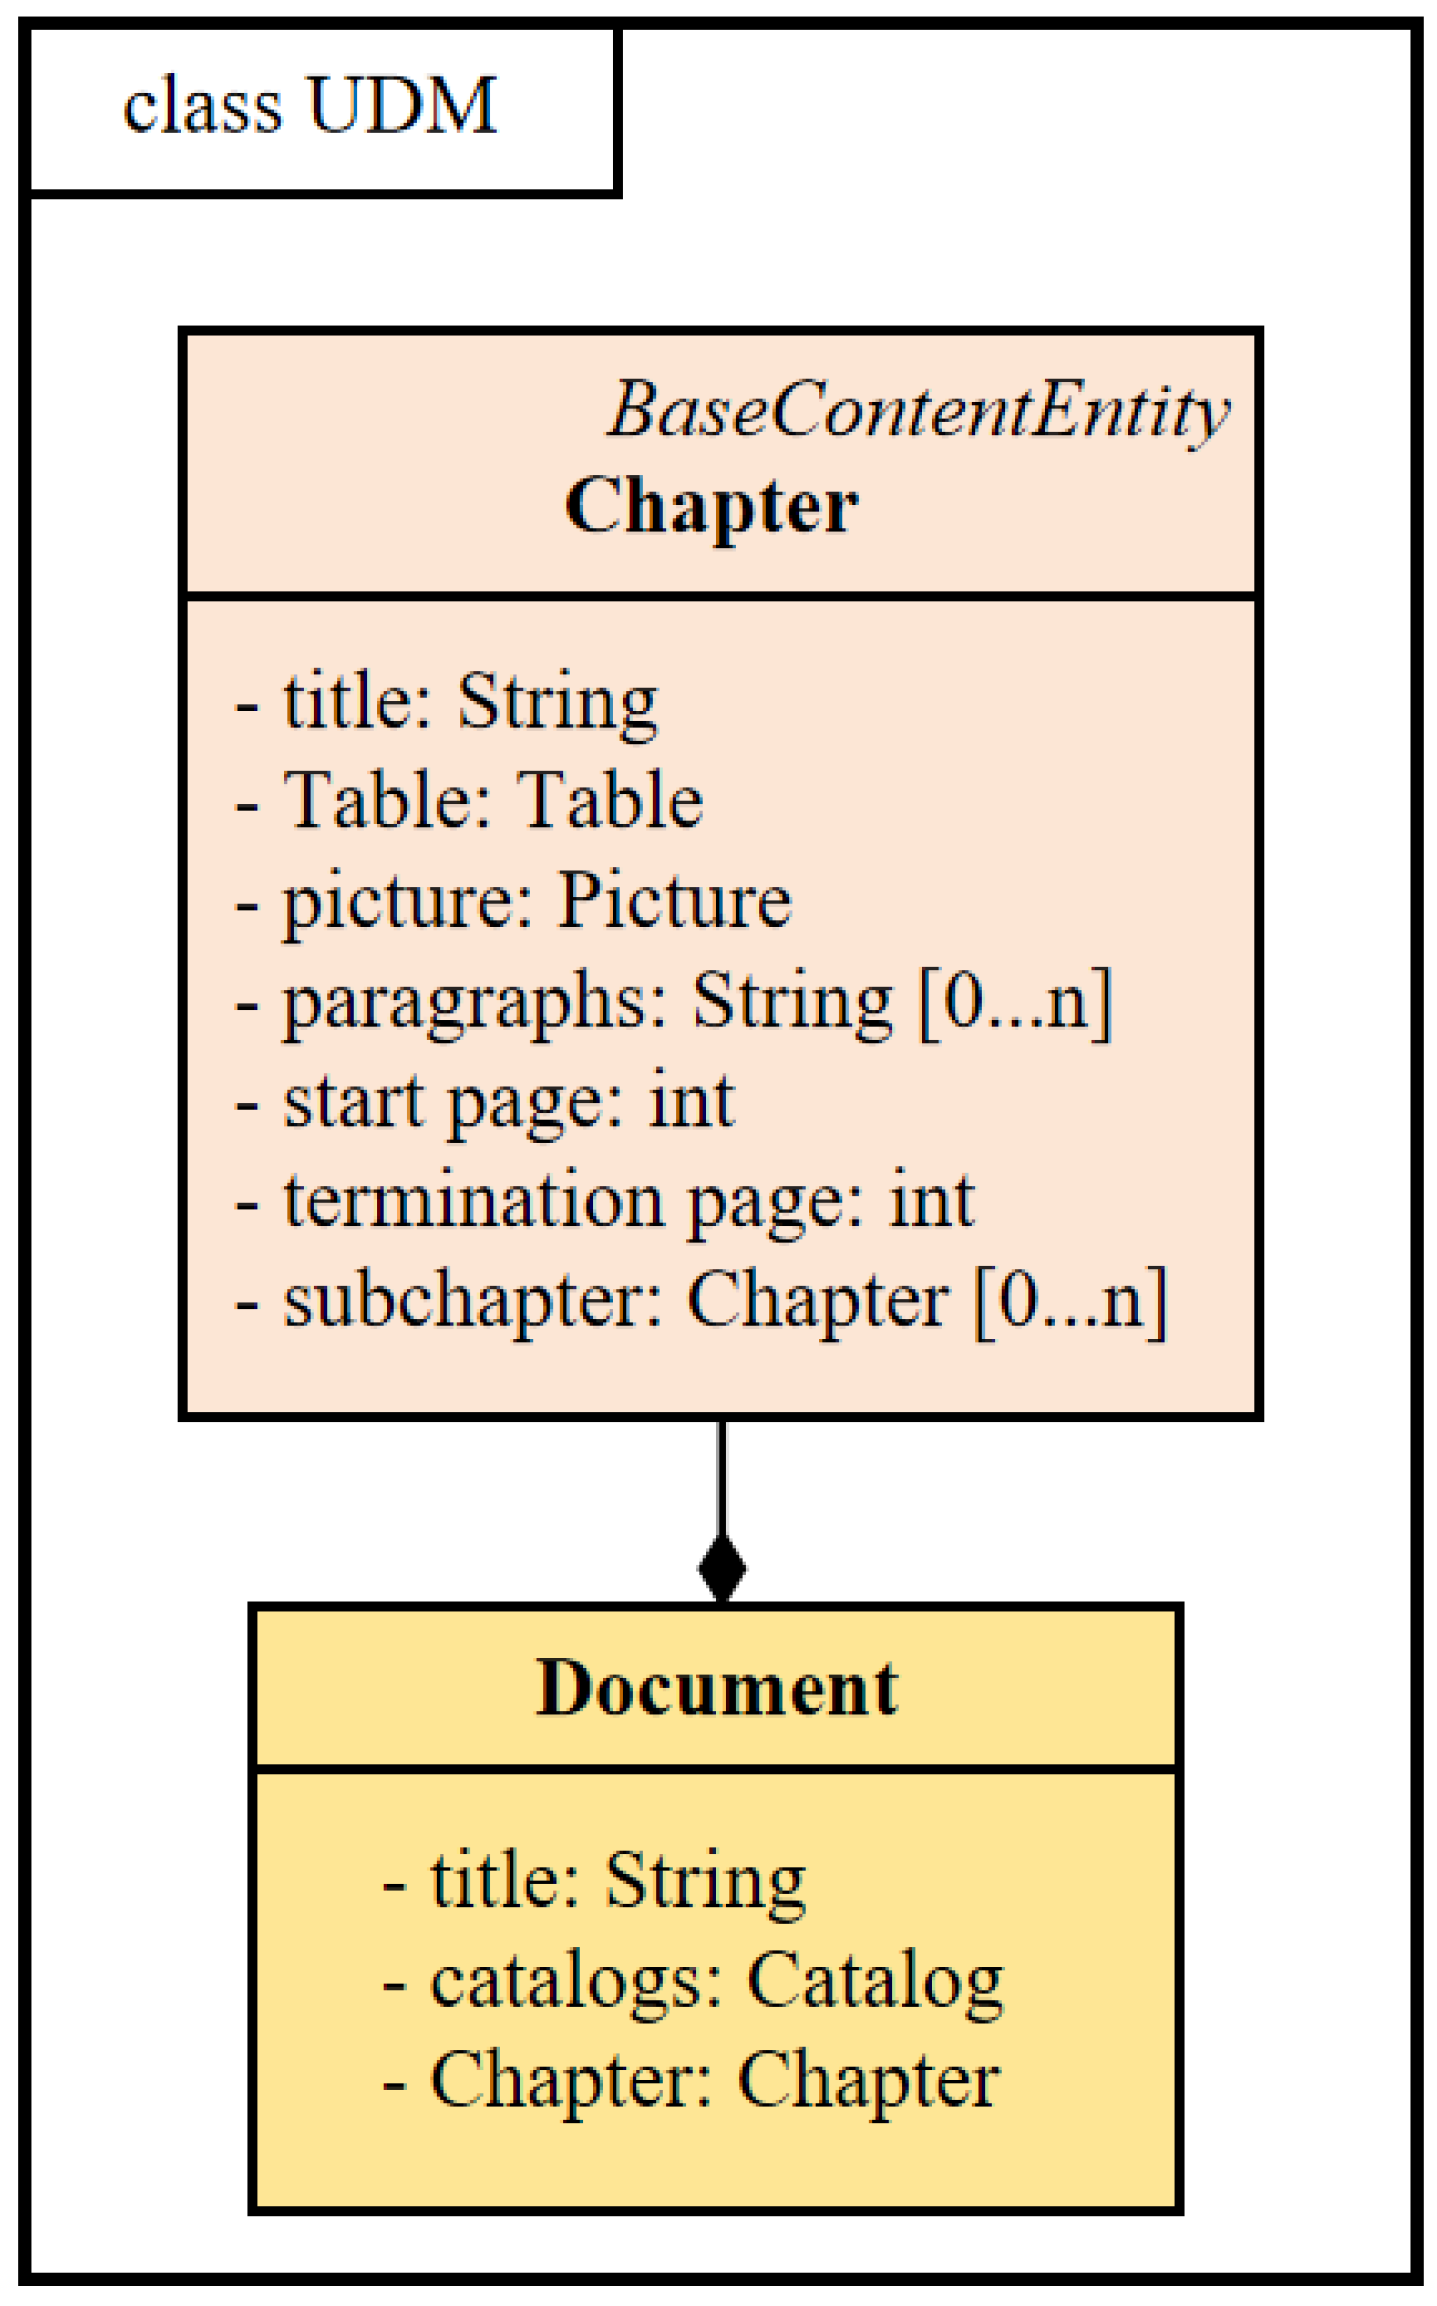
The chapter is the content of the document organization unit. Here, the definition of the chapter is by a title, zero or more paragraphs, zero or more illustrations, zero or more tables and zero or more sub-chapters composing the composite content entity, see Figure 6. The pictures, tables and forms have been defined in the previous section of the definition; sub-chapters and chapters are the same. Chapter titles are identified by their hierarchical position and stylistic features such as font size and boldness, with the hierarchical relationships inferred from numbering or indentation patterns. The following other properties are defined and described.
Figure 6.
Chapter entity.
Paragraphs: A paragraph is the document’s constituent element, and is the basic unit of the article. Its content has a relatively complete meaning. In the article, the paragraph is composed of sentences or groups of sentences, so the paragraph can be simply expressed as an array of strings, with each natural paragraph as an array of strings. The attribute name of paragraphs is paragraph, and the default type is String array.
Start page and end page: If the chapter is divided into multiple pages, the start page is the page number at the beginning of the paragraph, not the page number. If the chapter is divided into multiple pages, the end page is the page number at the end of the paragraph, not the page number. In the case of scanned documents, see the rules related to the start page.
Anchors for illustrations and tables: Illustrations and table categories in a paragraph add a marker called an anchor, which is placed between paragraphs to mark where the picture or table originally appeared.
2.1.5. Vector Map Entities
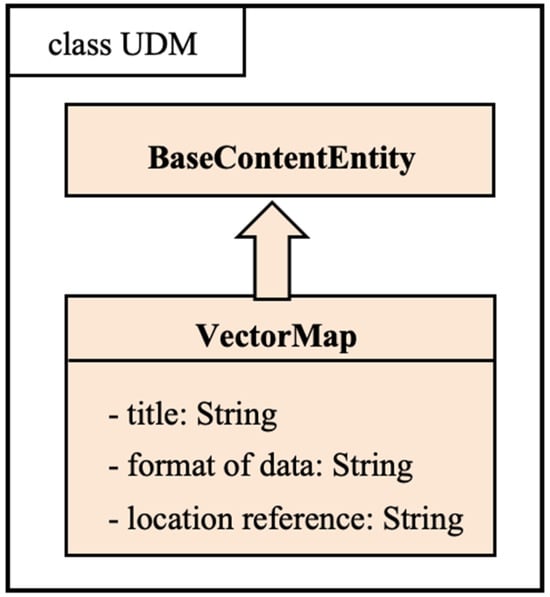
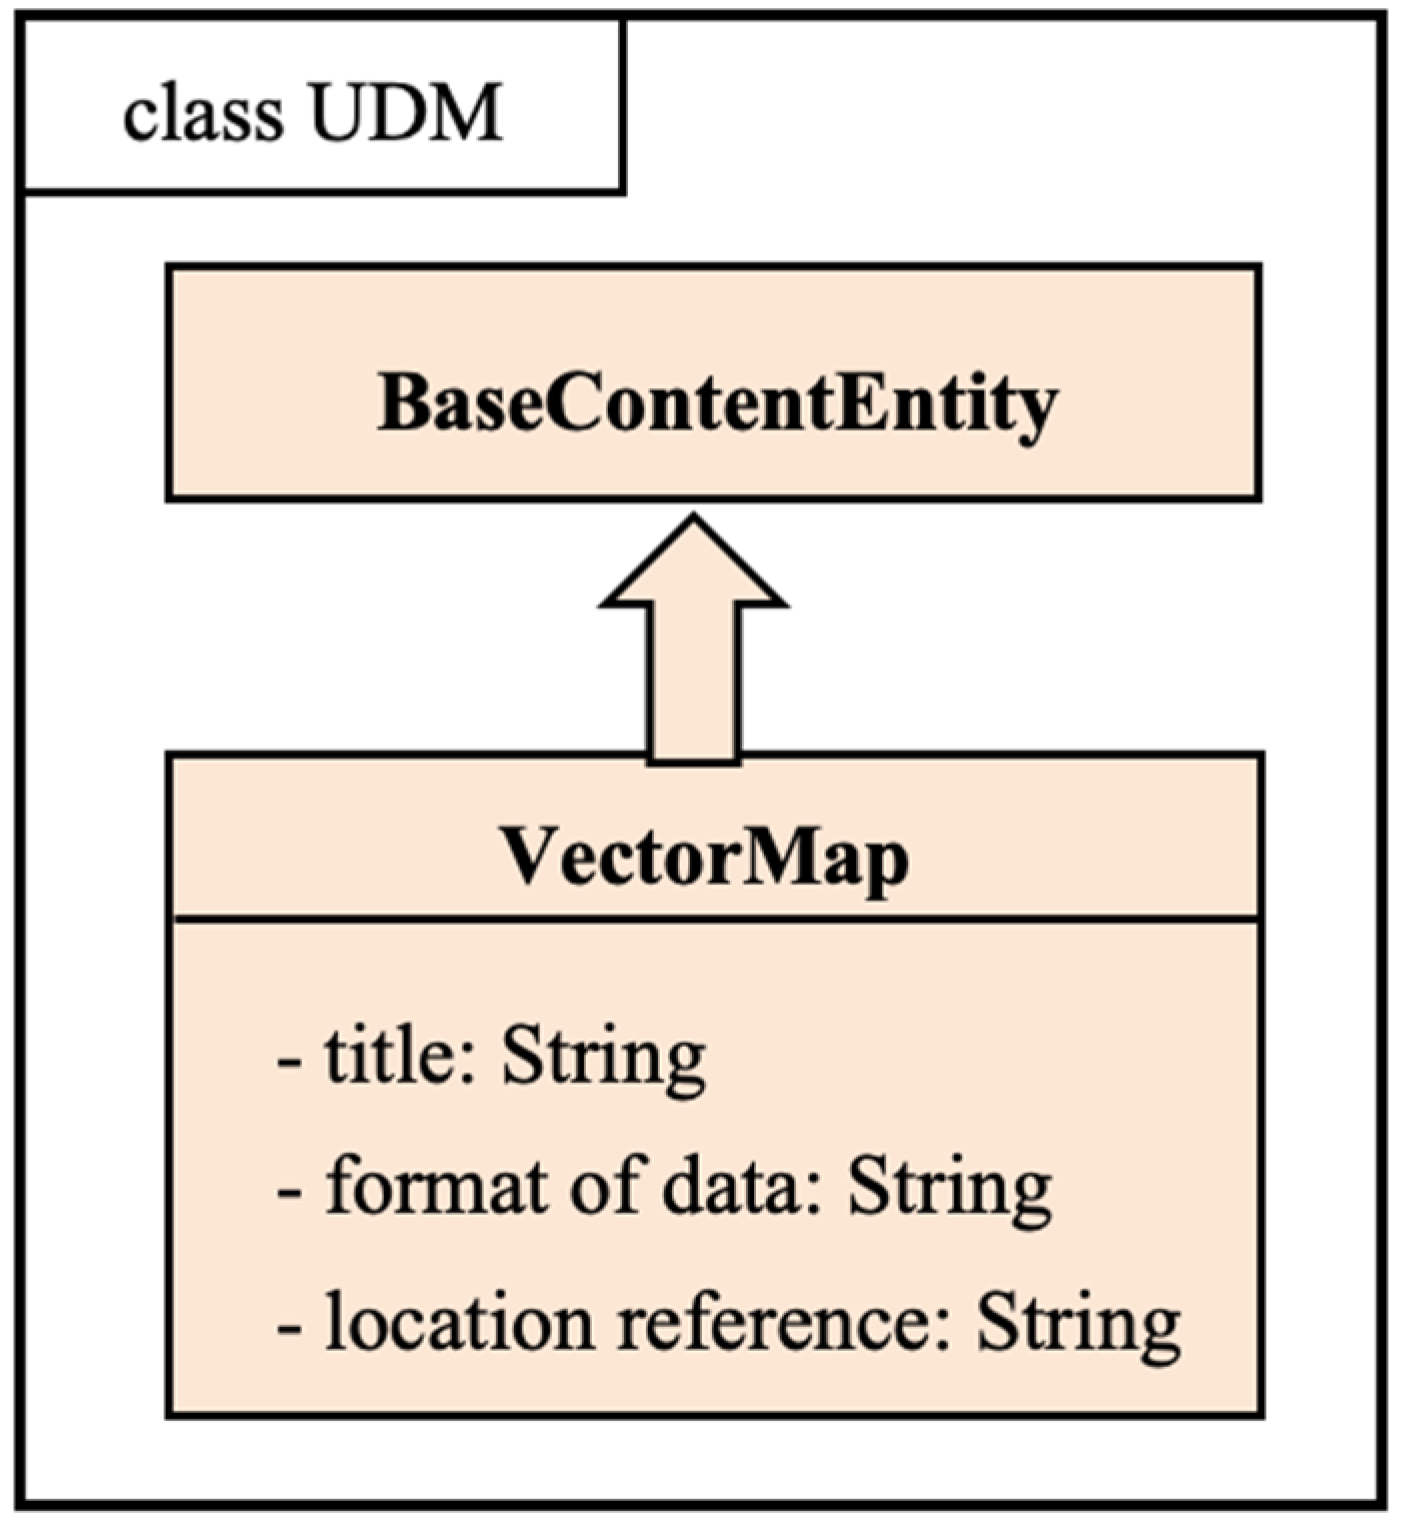
The vector map class represents most GIS data, which contain a great variety of files, but the initial state of this data model does not split the specific content of these data but treats them as a specific-format binary data, as a data source for the content extraction algorithms of the later drawings. The class has three basic attributes, title, anchor and format, as shown in Figure 7, which are defined in the same way as in the classes introduced earlier. Map titles, legends, scales, and spatial features are extracted by analyzing the layout and symbology of vector map files, with spatial coordinates encoded in the mapContent attribute.
Figure 7.
VectorMap entity.
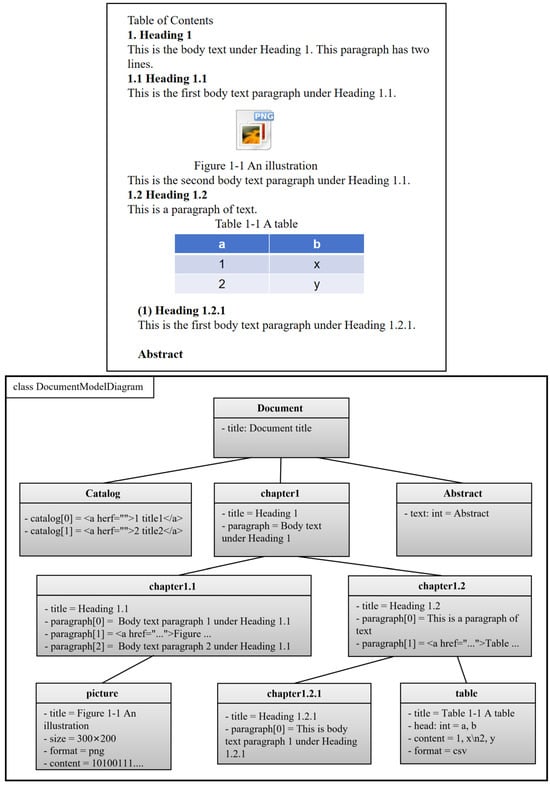
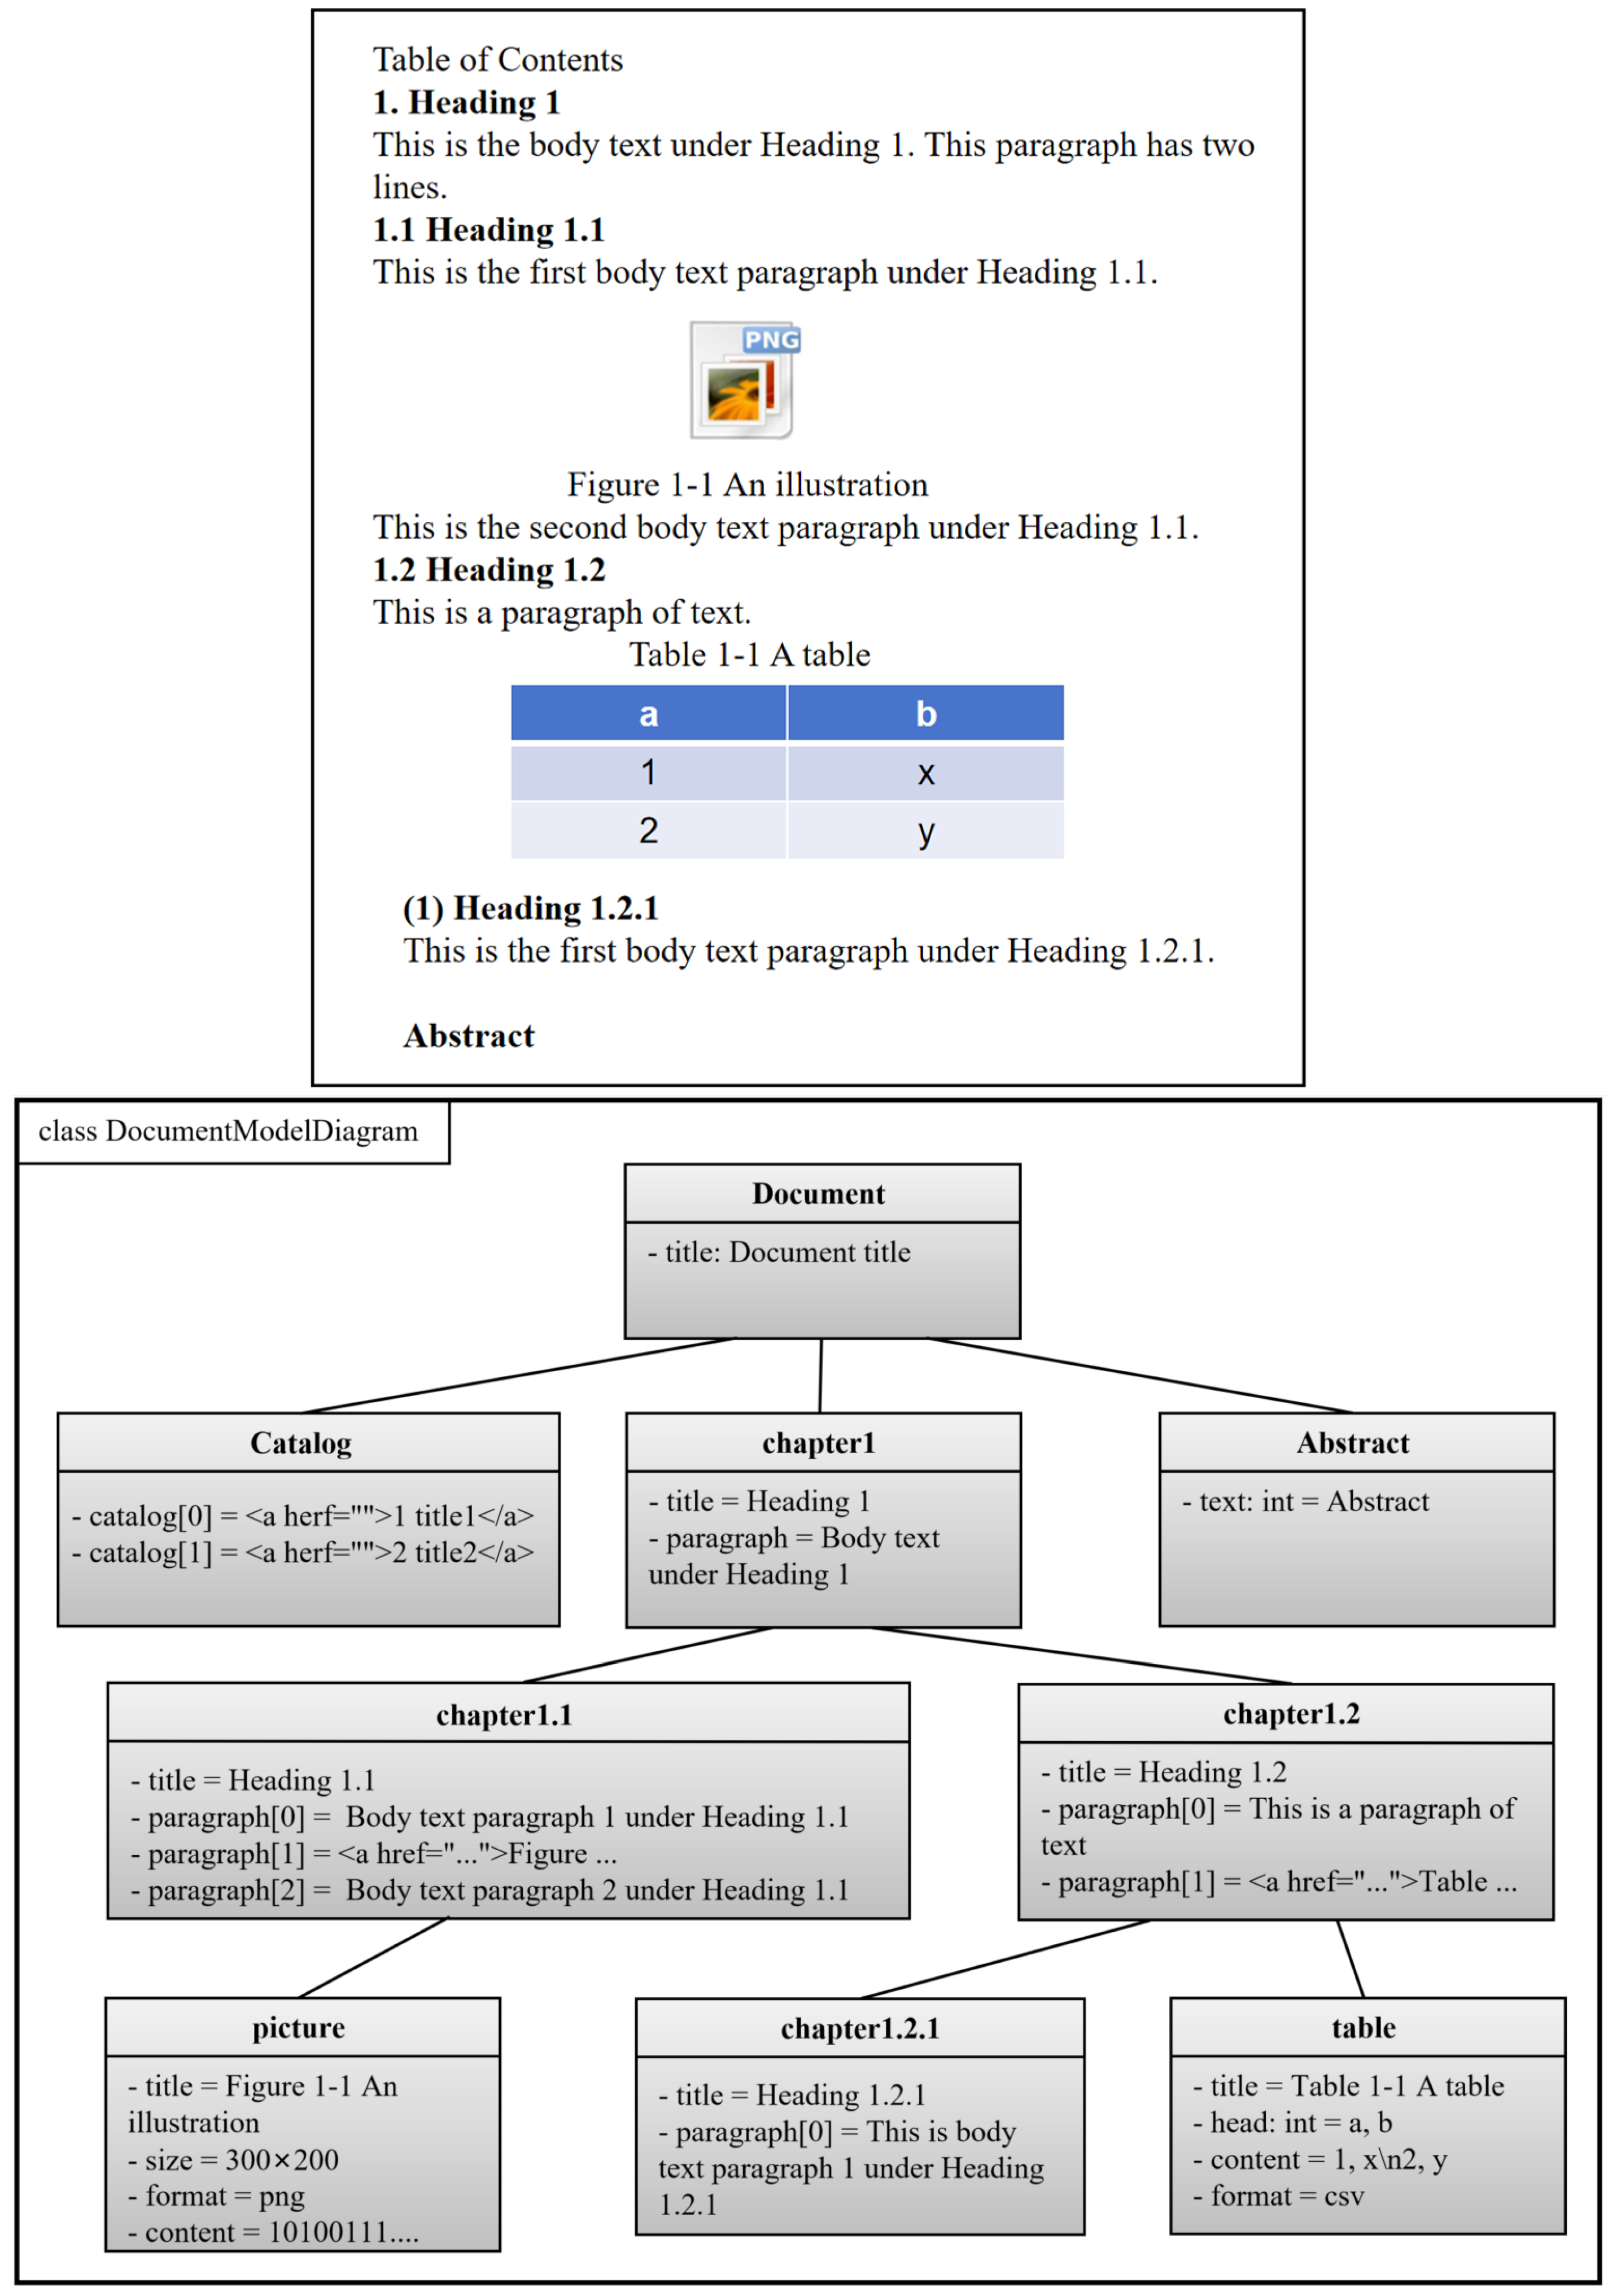
To illustrate how the UDM framework achieves hierarchical storage, we use a typical geological report as an example. Figure 8 presents the entity tree of an instantiated document. As shown, the report is organized hierarchically: the ZDoc entity contains chapters, each chapter contains paragraphs, and paragraphs may include anchors pointing to embedded content entities such as illustrations and tables. This tree structure preserves the logical organization of the original document, allowing it to be fully reconstructed from its constituent content entities. In addition, each content entity is assigned a unique rootCode and a nodeType, enabling global indexing and efficient retrieval across the entire dataset. These content entities are automatically identified and instantiated from raw documents using the extraction algorithms described in Section 2.3 and Section 2.4.
Figure 8.
Materialized representation of the report document.
2.2. Representation of Data Entities
In this paper, geohazard data are divided into two categories of basic data entities, documents and diagrams, and the diagrams only study the content extraction in vector format. Data entities are composites composed of content entities that can be modeled with object-oriented ideas. The previous section has modeled the expression of commonly used content entities, and this section will use these content entities to construct more complex data entities.
2.2.1. Basic Data Entities
Document Data Entity (Document Class)
A document data entity consists of the basic item paragraphs. The document is defined in addition to the mandatory basic item paragraphs, but also can contain titles, chapters, directories, summaries, and other optional.
Map Data Entity (GeoMap Class)
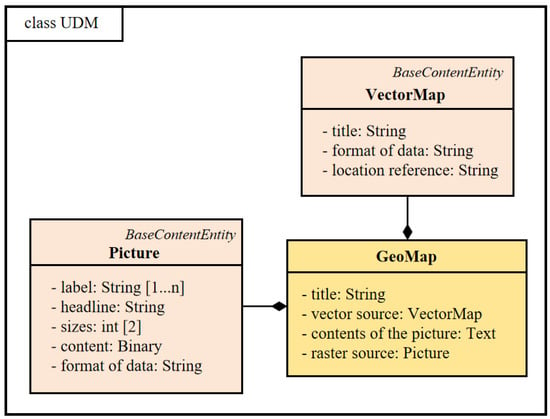
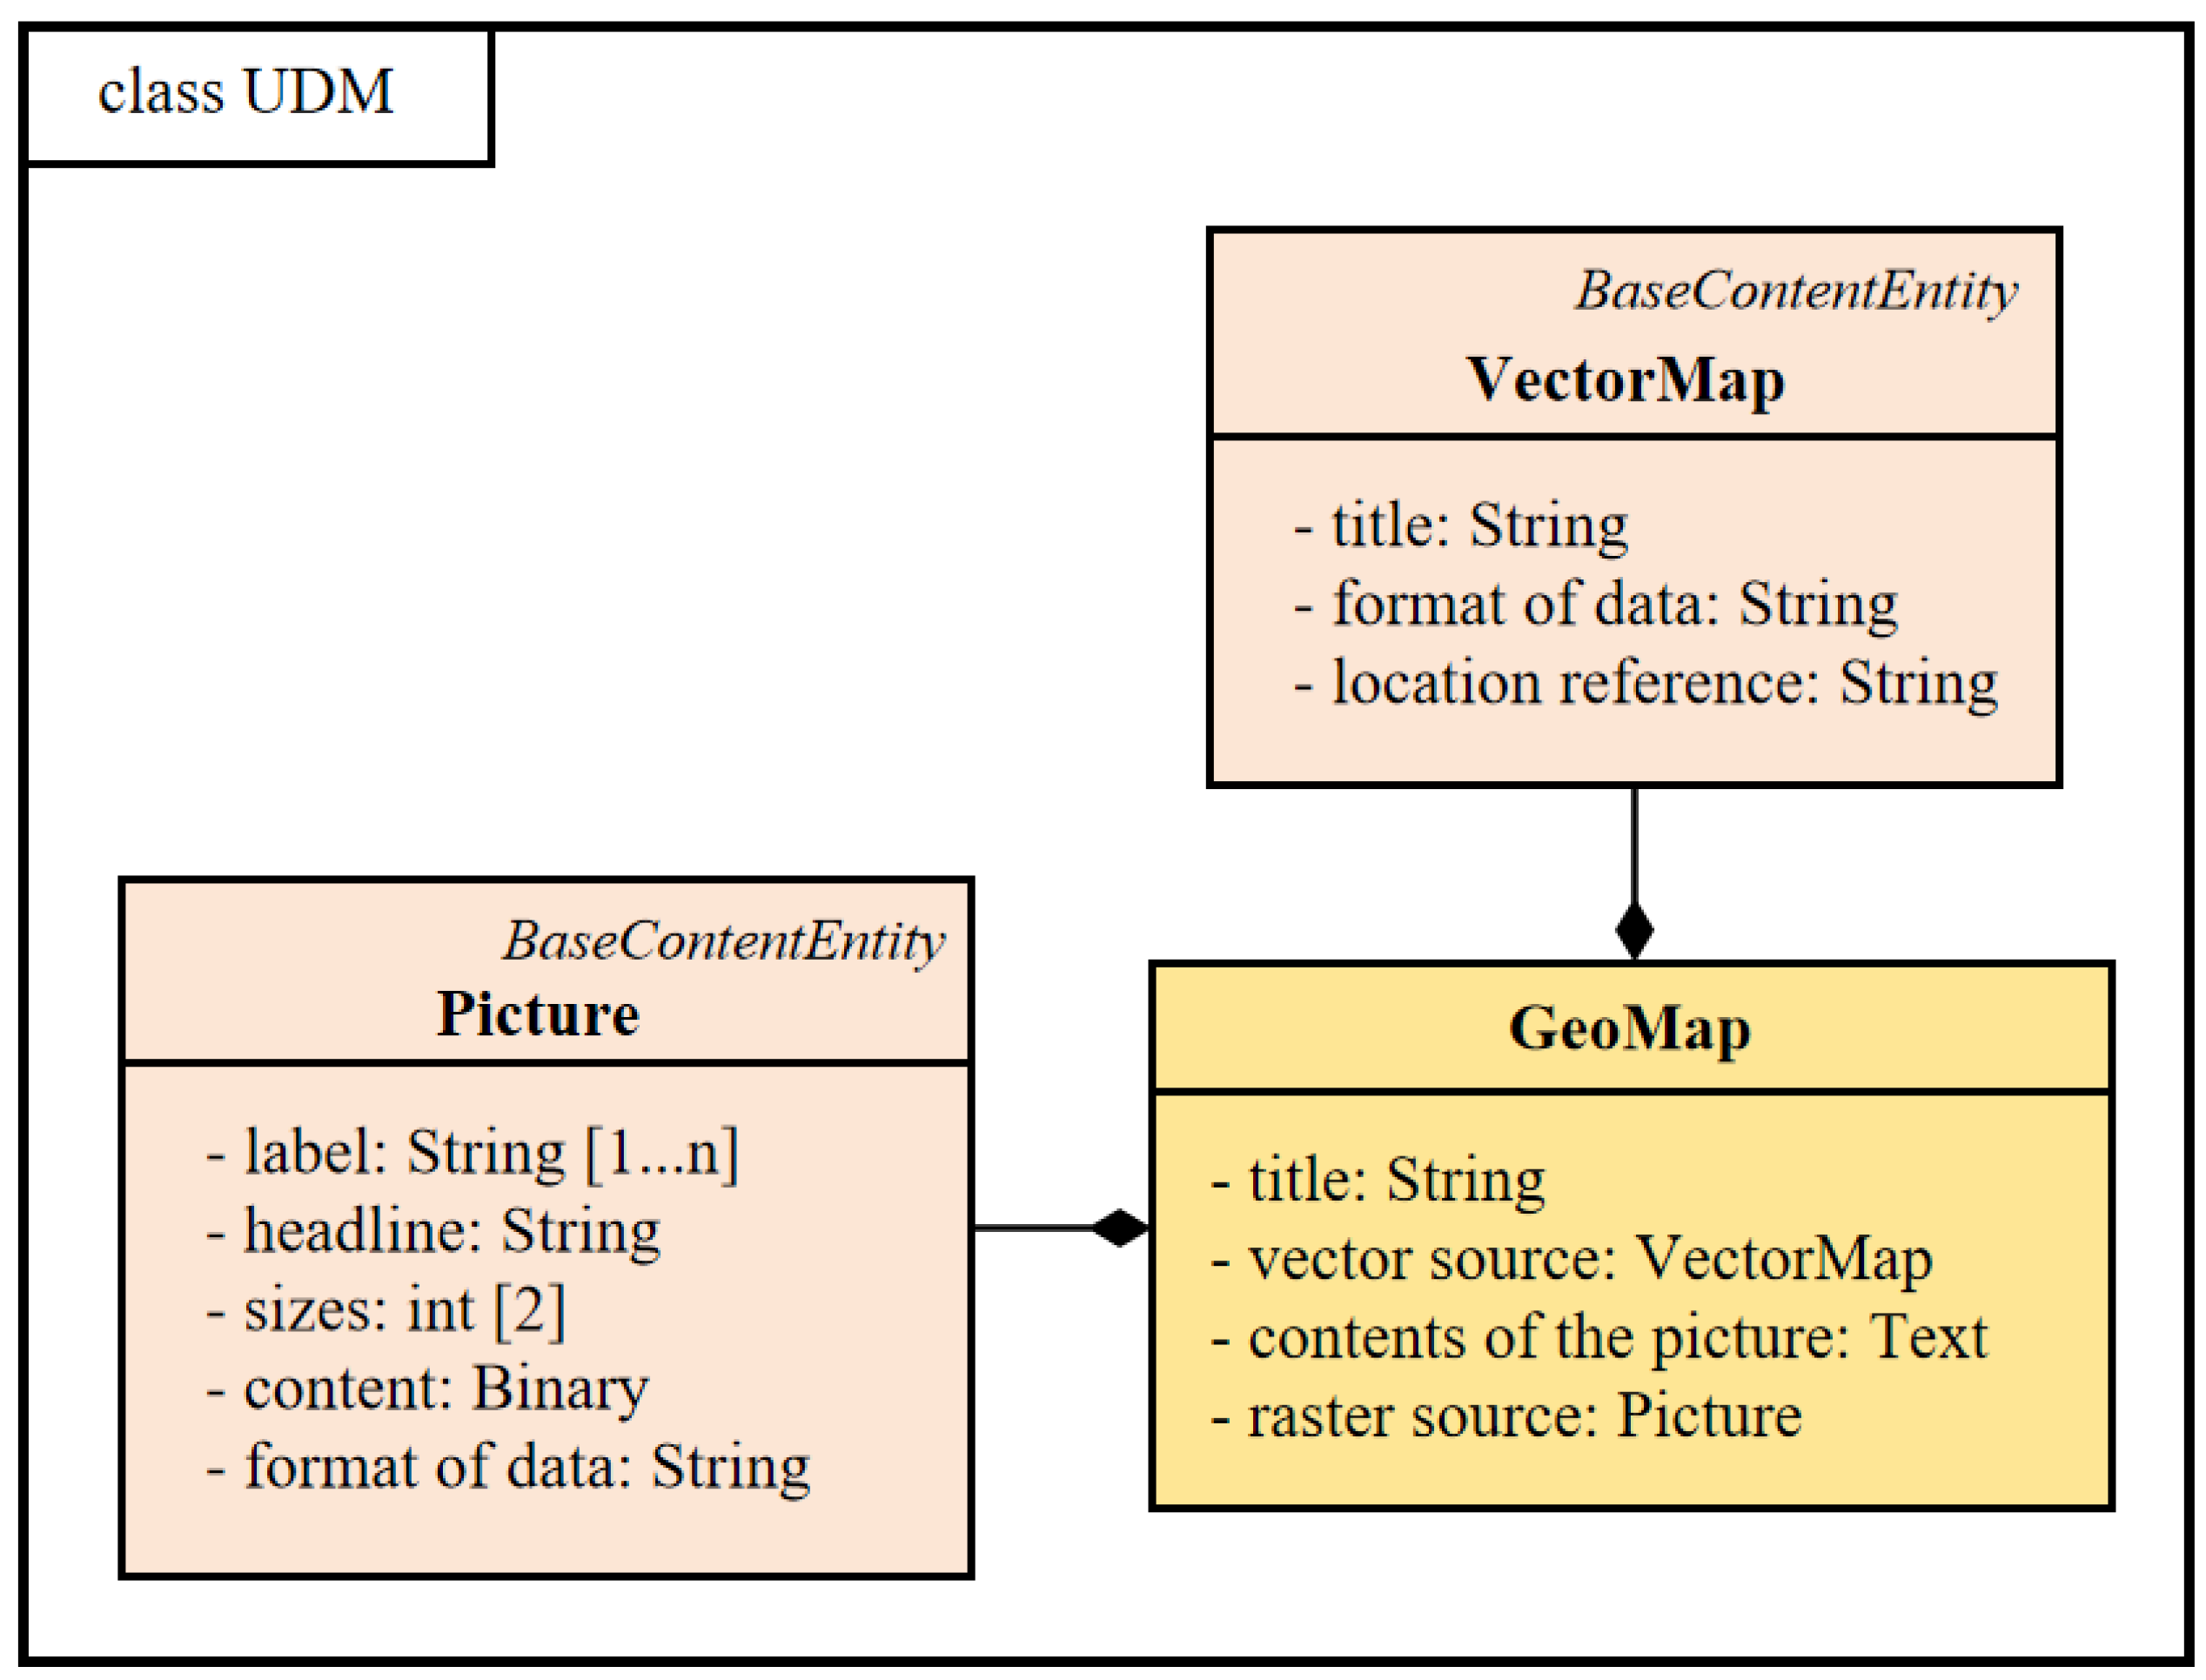
This paper defines that geological maps have a combination of browsable images and corresponding vector data; see Figure 9 and Figure 10 for details. The accompanying figure and some illustrations of the document can be regarded as instances of the map entity.
Figure 9.
Document data entity representation model.
Figure 10.
Picture entity representation model.
GeoMap contains four basic attributes: title, raster source, vector source, and drawing content.
Title: String type, a short statement indicating the main content of the map, is generally available from the original data summary; in the case of being unable to obtain it, it can be empty.
Raster source: The picture type indicates the raster file corresponding to the artwork (illustration), which must be instantiated.
Vector source: The VectorMap type represents the GIS vector data (point, line, surface, project file) corresponding to the artifact (illustration).
Map content: String type text data. Initially, the map content defaults to storing the information of all point elements of the point. Take Mapgis as an example; the format is defined as follows:
Each line of text data represents all the information on the map. Formatting rules in each line:
{file rootCode}@@{x coordinate}##{y coordinate}##{content1};;{x coordinate2}##{y coordinate2}##{content2};;.... ;;@@{diagram range}
Here, rootCode follows the encoding rules defined in Section 2.1.1. Coordinates and content are separated by ##, multiple entries by ;;, and the diagram range is specified as an EXTENT polygon (e.g., POLYGON((−216.546 −213.297, 756.663 −213.297, 756.663 497.234, −216.546 497.234, −216.546 −213.297))).
The graphical content is actually an abstraction of the information described by the graphical component, a way of expressing information that is easily understood by the machine, and this expression is varied; the current graphical content is one of the simplest ways, and the later model evolution will produce a more advanced expression of the graphical content.
2.2.2. Document Data Entity
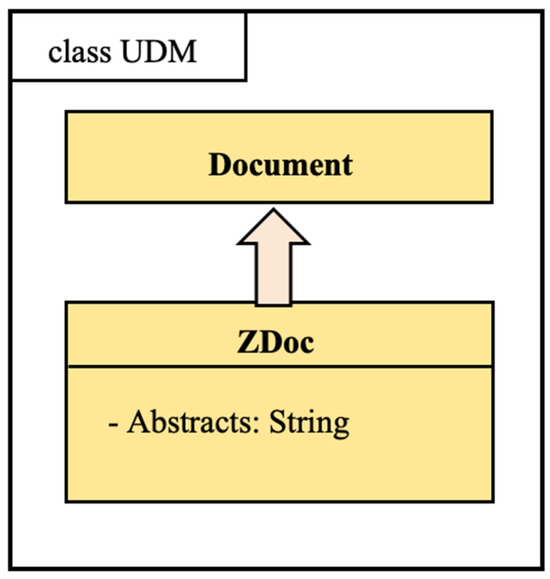
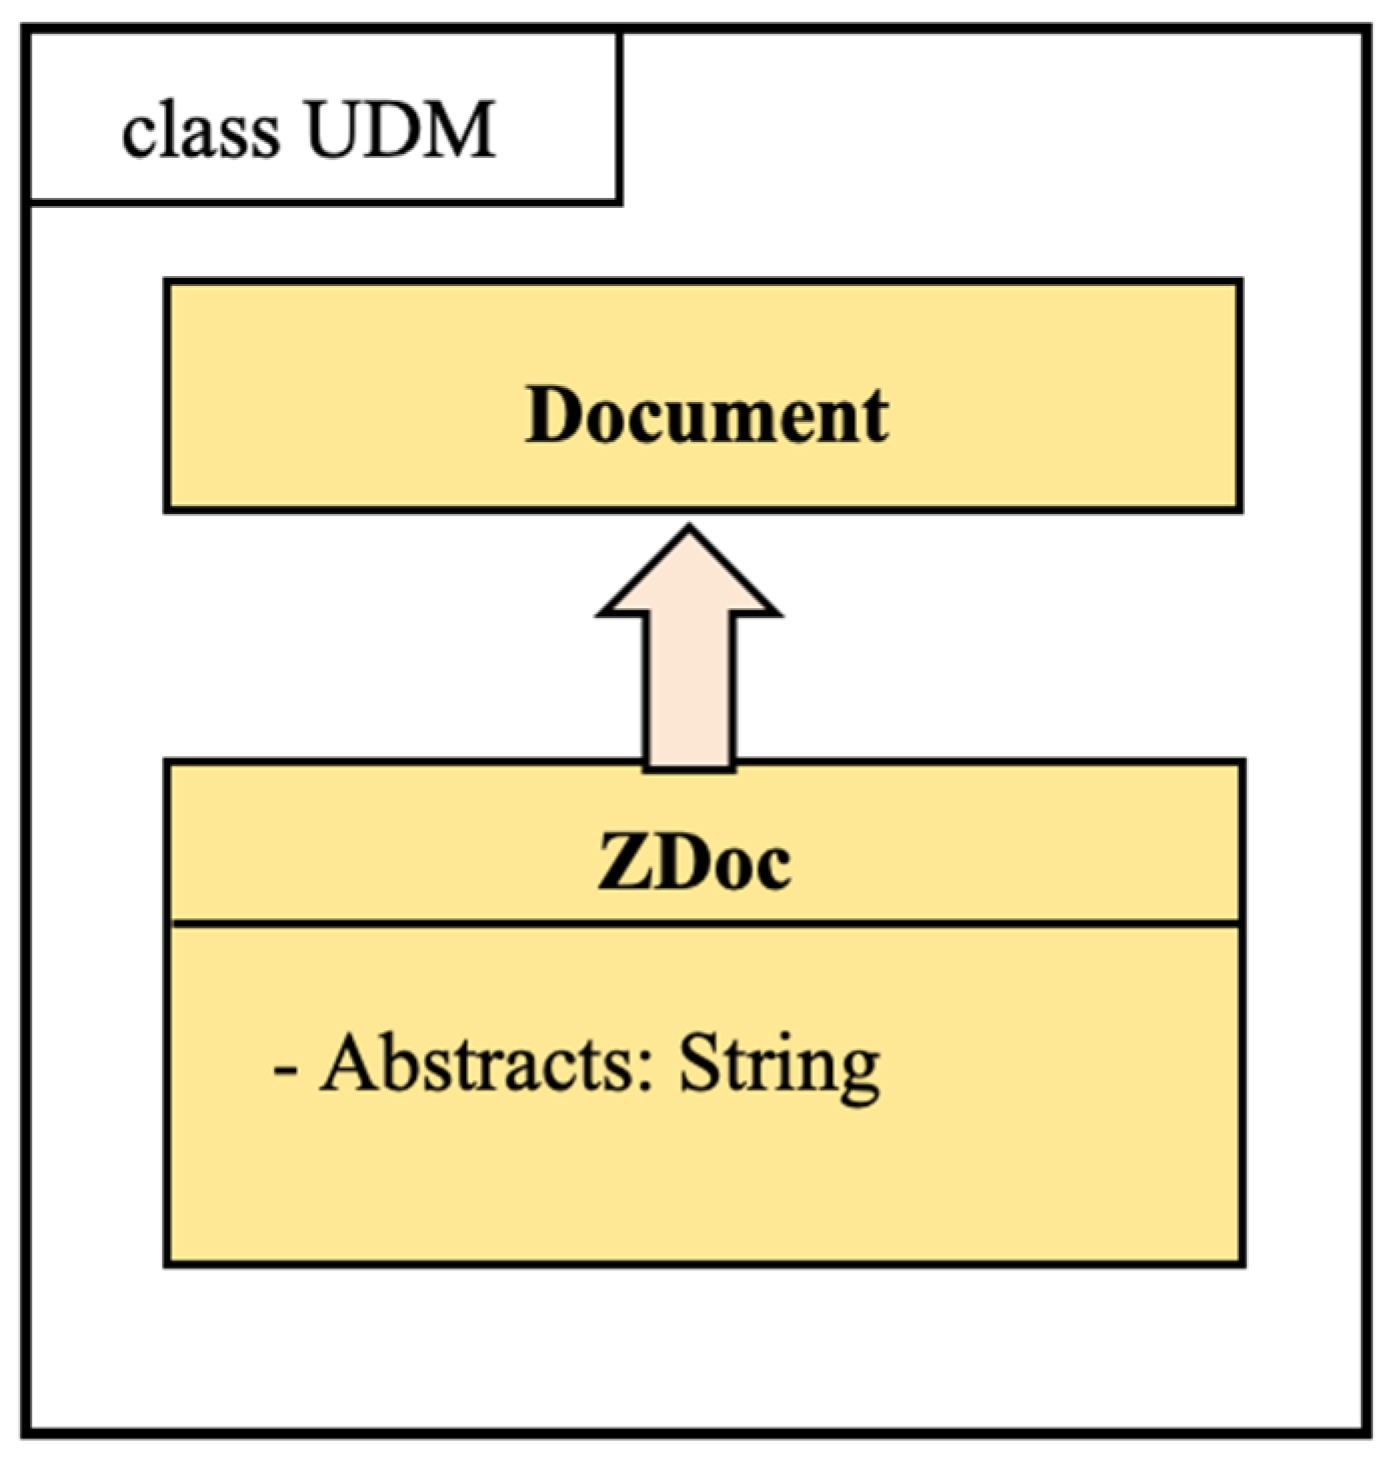
The document (ZDoc) is the main body of a geological survey result dataset. ZDoc derives from the Document class.
By definition, Title, Table of Contents, Chapter, and Abstract are mandatory. As an extension, ZDoc evolves at a later stage with a subject feature field, and classification at the content level. The class diagram of the initial state of the document model is shown in Figure 11.
Figure 11.
Entity representation model of a document.
2.2.3. Vector Artifact Data Entities
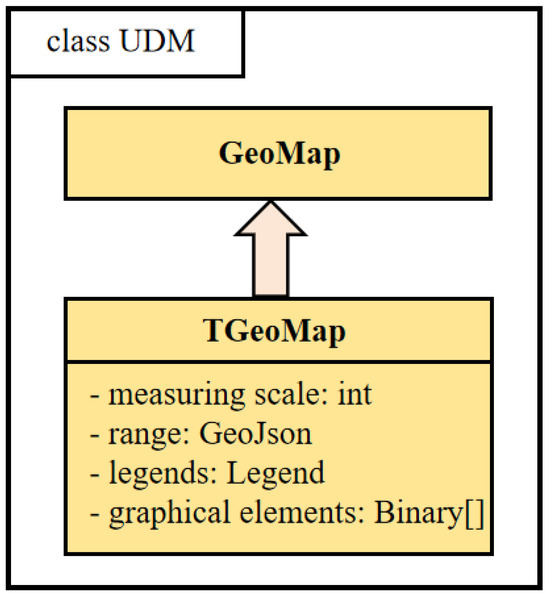
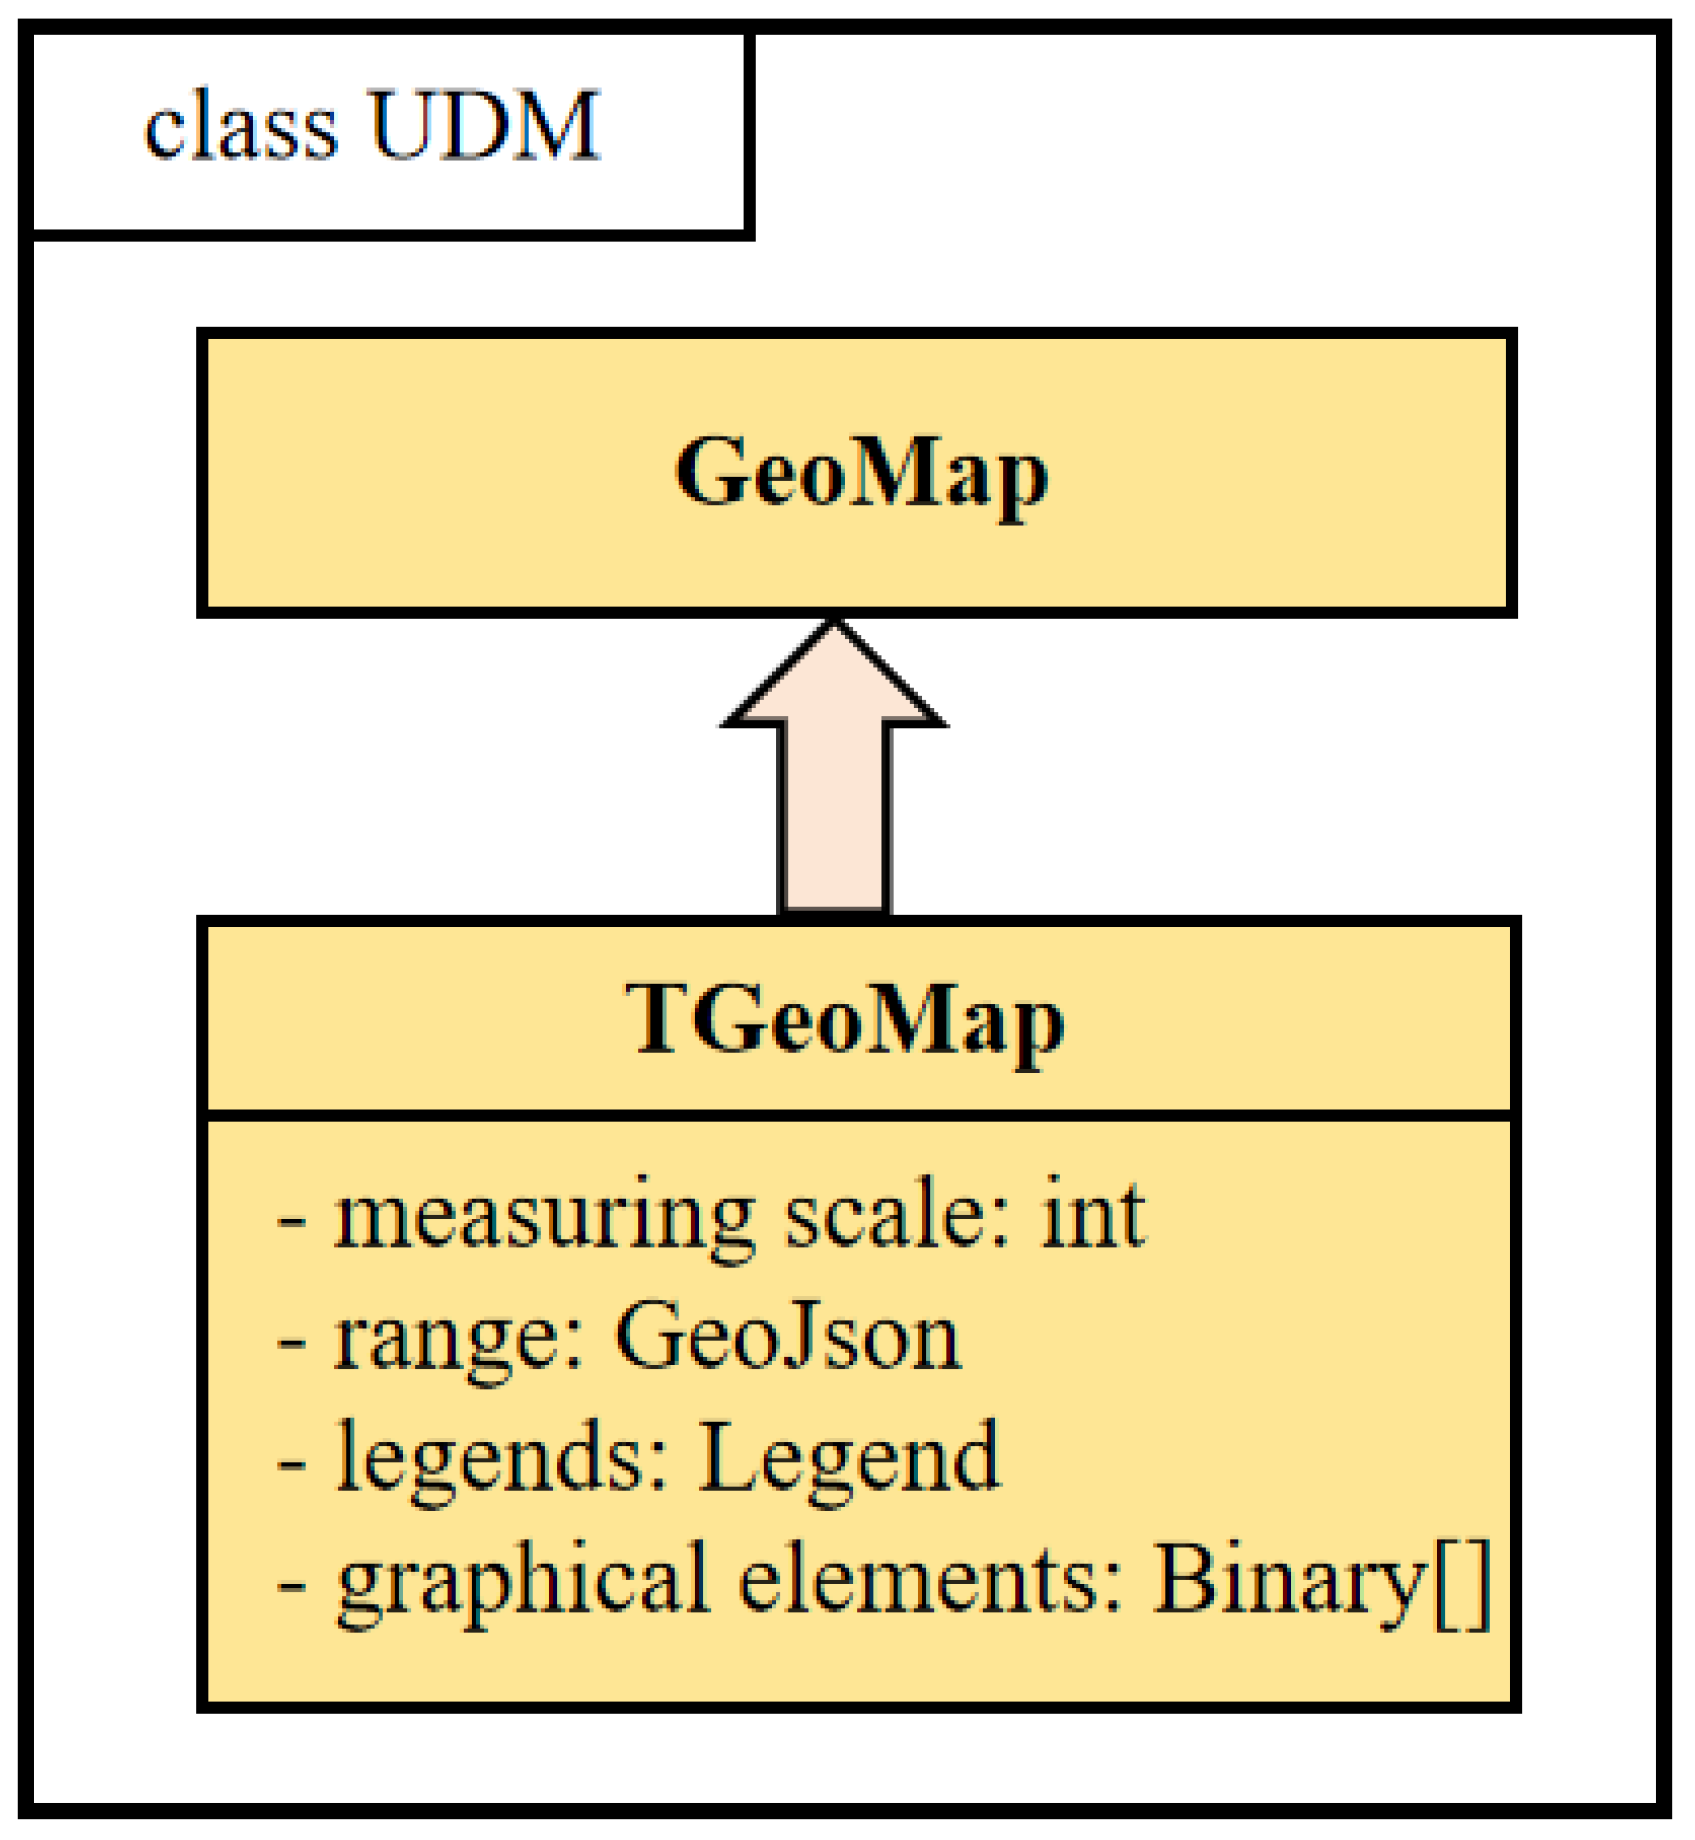
Vector artifacts are the various geologic maps in the geohazard data other than the textual illustrations. The vector artifact data entity table is shown in Figure 12.
Figure 12.
Vector artifact entity.
As shown in Figure 12, most of the attributes are inherited from the parent class GeoMap, and four attributes are added—scale, range legend, and map elements—and only the expression of legend and map elements is discussed here.
Table 2 provides a detailed breakdown of each stage of the pipeline, summarizing the inputs, processing steps, outputs, and queryable elements within the Unified Data Model (UDM). This table complements the high-level workflow illustrated in Figure 1.
Table 2.
Detailed pipeline breakdown: inputs, processing, outputs, and UDM queryability.
2.3. Document Content Data Splitting and Structure Extraction Algorithm
According to the modeling expression described in Section 2.2.2, a document can be abstracted into content entities such as chapter headings, paragraphs, diagrams, and tables. Chapter headings form the skeleton of the document structure, and this hierarchical nested tree structure establishes the semantic relationships within the document. The algorithm automatically analyzes this hierarchical logical relationship as a key to extracting document content and constructing the model.
The extraction of document structures varies significantly in complexity depending on the document format. The levels of difficulty, from low to high, are as follows: HTML and other semi-structured documents, Word and other streaming formats, PDF and other fixed-layout documents, and unstructured plain text such as TXT. Among these, extracting logical structures from fixed-layout formats like PDF and OFD remains particularly challenging, despite notable advances in recent years (e.g., LayoutLMv3 [11], document parsing techniques [12]). While these methods have achieved promising results on general-domain documents, their direct application to geological documents is hindered by domain-specific characteristics—namely, dense terminology and strong coupling between text, tables, and graphics. Since PDF is the standard format for geological survey documents, this work specifically targets PDFs and proposes a structure extraction algorithm tailored to the geological domain.
In contrast to streaming documents, PDF (Portable Document Format) files offer a structured format where the retrieval of layout and style information is feasible. The primary text elements allow for the extraction of character-specific details, including their coordinates, dimensions (height and width), font type, and formatting attributes such as boldness and italicization. Additionally, line metrics—comprising height and the overall page dimensions—can be inferred indirectly. For image objects, direct access includes the image content and its anchor position. Forms, however, present a more complex scenario; while one can obtain line lengths, page positioning, and textual composition, they necessitate further parsing due to their composite nature. This process, though intricate, is well-established in existing technologies. Consequently, this paper assumes that forms have undergone such parsing and are treated as discrete entities. Furthermore, document headers and footers can also be isolated using currently available, sophisticated analysis algorithms. Building upon these capabilities, this study streamlines the definition of a PDF document to encompass the following fundamental components:
Text line: A line of text in the Pdf. As an extension, chapter headings, paragraphs, and chart titles are derived from the text line;
Picture: The Pdf total corresponding to the image object, existing independently, from which illustrations and formulas are derived;
Table: Objects that have been pre-parsed.
In order to facilitate classification, this paper defines seven types of labels, as shown in Table 3.
Table 3.
Label description sheet.
First of all, the text lines with the same layout style are merged to form a number of text Blocks; the text Block can be obtained as following style features are noted:
Block text (style) = {number of lines, font, height of single word, bold or not, range of block coordinates, information about the previous Block, information about the next Block, page, type = “text”}
Similarly, illustrations, formulas, and tables also use a version of the segmentation algorithm to split out their respective types of Blocks. They have the same characteristics, distinguished by type, and can be recorded as:
Block diagram(style) = {block coordinate range, spacing from previous block, spacing from next block, page, type = “fig”}
Block table(style) = {block coordinate range, spacing from previous Block, spacing from next Block, page, type = “tab”}
In this way, a Pdf document can be split into a sequence of more than one type of Block, and the structure extraction problem is converted into a sequence annotation problem. The input to this problem is a sequence of Blocks (observations), and the output is a labeled sequence with labels as defined in Table 3. The goal of solving this type of problem is to learn a model that gives predictions of the labeled sequence for the observed sequence. Before solving the problem, we need to filter out the Blocks of graph and table types and label the sequence only for the Blocks of text type and then restore the blocks of graph and table types according to the index position of the sequence after labeling.
Then, for the linear observation sequence:
Eventually, the labeling sequence Y needs to be given to label each Block:
The annotation set used here is:
2.3.1. Block Embedding
Block’s multi-hot encoding consists of two parts; the first part is the one-hot encoding of the first five characters of the text, and the second part is the one-hot encoding of each style feature. Then the encoding of any in the input OS can be expressed as:
where is the number of Block style features; for there is one and only one that is 1, and the rest are 0. For any , there is one and only one that is 1, and the rest are 0. Let .
Subsequently, we use the CBOW [13] model to generate the embedding of the Block and establish the weight matrix W from the input layer to the hidden layer:
Since the N-dimensional vector representation of associated with the input layer is a multi-hot vector, the hidden layer here is a matrix multiplication N-dimensional vector of and , and the hidden layer is computed as:
where C is the window size of the context, typically set to 2. We denote the input vector of by , and the loss function can be defined as:
Similarly, build the weight matrix from the hidden layer to the output layer:
It can be calculated for each through :
Similarly, using to denote the output vector of , we can then use cross-entropy to define the loss function as [14]:
The mature and effective implementations of learning and matrices in the model are hierarchical softmax and Negative Sampling [15]; since this problem does not involve a large body of word lists, and compared to the hierarchical softmax in the process of each iteration, a large number of output vectors need to be updated. The Negative Sampling approach proposes an algorithm to update only a portion of these output vectors, so in this paper, we use the Negative Sampling approach to train the model. The study of Rong et al. proposes the following objective function [14]:
where denotes the Output Block, is the Input Vector, is the Hidden Layer, and is the Prediction Result. Rong et al. also demonstrated that this function is able to produce reliable and high-quality embedding. The feature vectors we generate will be directly used as input to the Block sequence labeling algorithm in the next step.
Essentially, each paragraph or diagram is converted into a vector that captures its content and formatting styles (e.g., font size, boldness, and layout), making it easy for the model to recognize semantic patterns.
2.3.2. Document Structure Labeling Network Structure
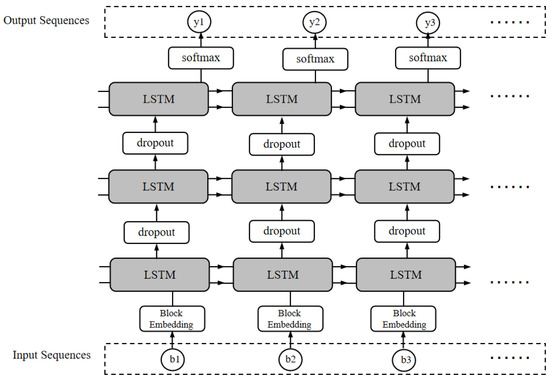
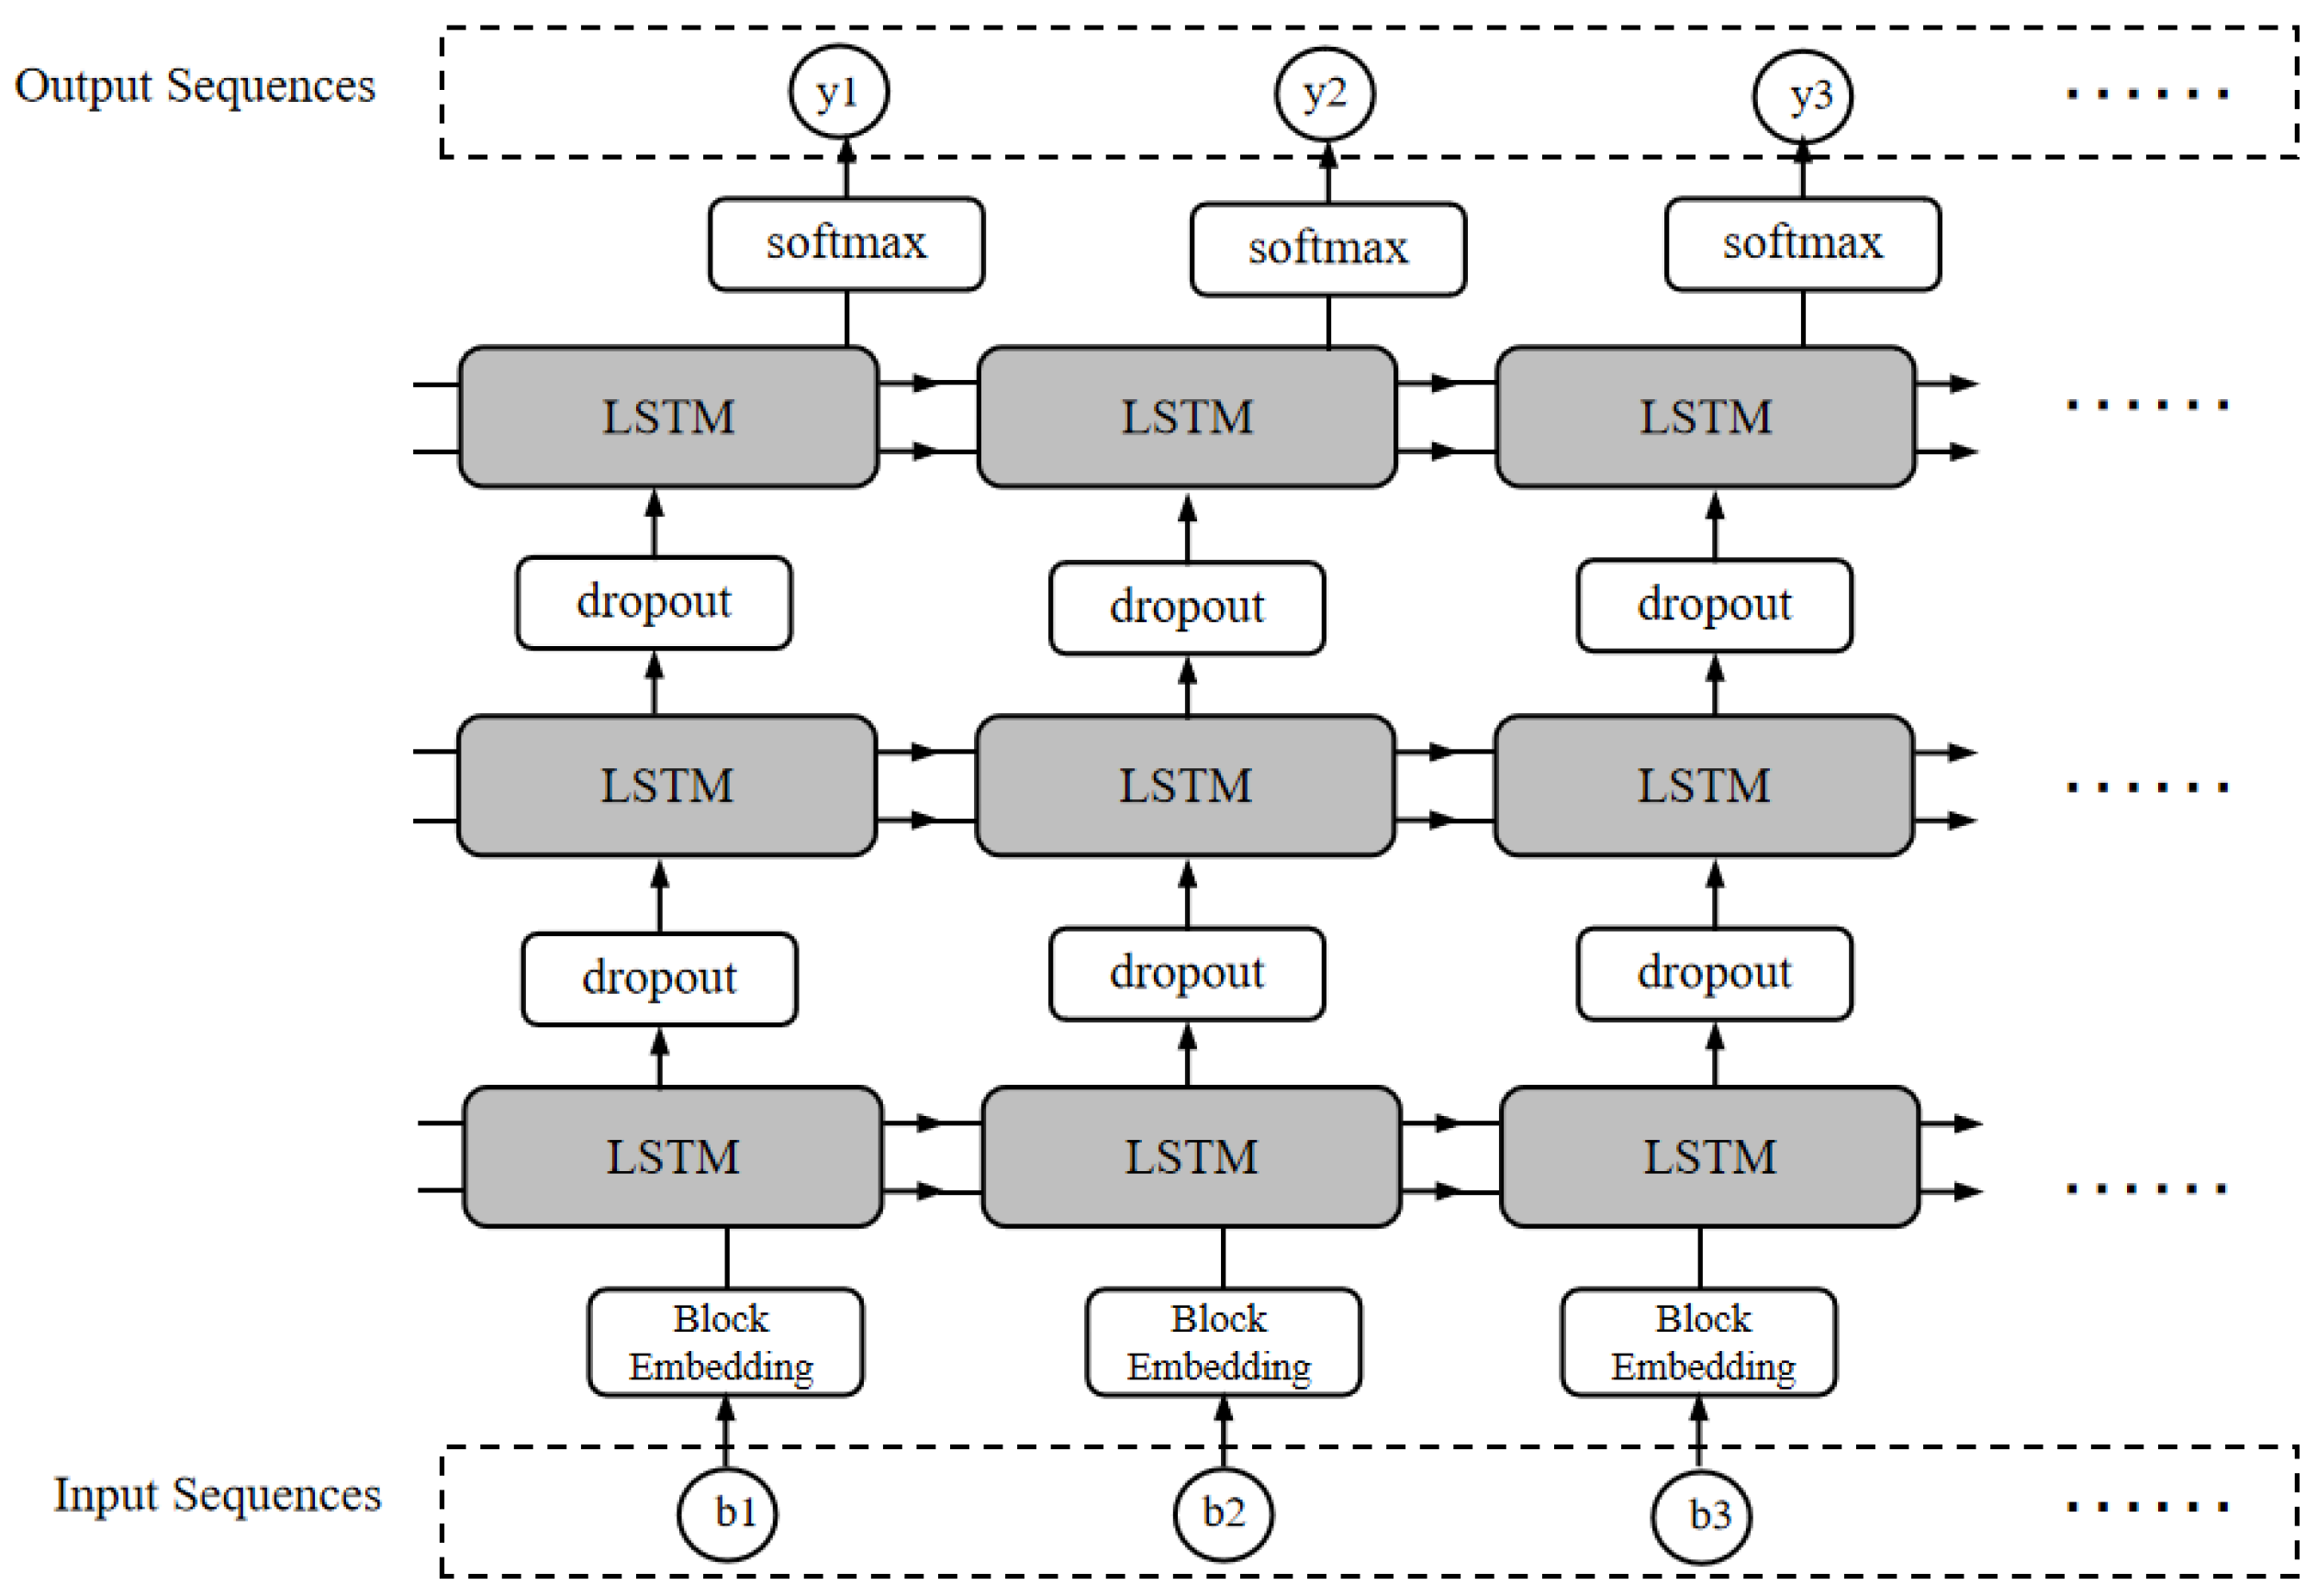
In this paper, we employ a recurrent neural network (RNN) with LSTM as the annotation model. The primary advantage of this kind of network is its capability to learn the before-and-after state constraints such as “the title cannot be ordered across levels.” The architecture of the network, depicted in Figure 13, comprises a multi-layer RNN structure with three hidden layers. Additionally, dropout is integrated into the model to prevent overfitting. The input to the model is the Block’s embedding vector, which is transformed into a 128-dimensional vector representation. Each of the three hidden layers is an LSTM-based RNN with 256 nodes. The output from the third hidden layer is fed into a softmax layer, which generates the final output, specifically, the labeled sequence LS.
Figure 13.
RNN architecture for block sequence.
2.4. Algorithms for Drawing Analysis and Drawing Element Extraction of Vector Artifact Data
Geohazard maps encompass a variety of themes, including basic geological maps, geomorphological and Quaternary geological maps, hydrogeological maps, engineering geological maps (geohazard maps), tectonic outline maps, columnar maps, and sectional maps. Each type of map expresses different themes and contains distinct graphic units, meaning that each geohazard map is composed of multiple graphic units arranged in a specific layout. We have summarized all the influencing factors and their positions in geological maps in Table 4. The primary goal of map layout analysis is to accurately delineate map units into regions based on content and appropriately categorize and label these units. This process provides a clear targeting guide for information extraction and is an essential prerequisite for subsequent information extraction tasks. By understanding the characteristics of different map units, we can design more targeted and efficient information extraction methods.
Table 4.
Various types of influences and their locations in the geological map.
The information types listed in Table 4 are automatically extracted from geohazard maps using the layout segmentation and classification algorithms described in this section. For example, stratigraphic lithology is identified from the main map area and the stratigraphic column, while slope patterns are extracted from profile diagrams. Once extracted, these factors are stored as attributes of the corresponding TGeoMap entities (e.g., legend, scale, and mapContent), thereby enabling semantic queries that integrate textual, spatial, and tabular criteria.
The problem of map layout analysis is akin to traditional document layout analysis and can be tackled using similar methodologies. It can be decomposed into two primary subproblems: region segmentation and target classification. Prior to the advent of deep learning-based layout analysis techniques, the prevailing approach involved employing a set of rules for object segmentation, discrimination, and classification. This conventional method boasts lower computational complexity compared to deep learning algorithms and performs adequately for simple layouts. However, in the context of complex layouts, deep learning’s advanced feature extraction and model generalization capabilities make it more appropriate for intricate target detection tasks. The application of classical proposal-based networks such as Faster R-CNN, R-FCN, and proposal-based networks such as YOLO [16] and SSD [17] has led to a breakthrough in layout analysis. Representative studies include Viana et al. [18], a fast-CNN-based algorithm for detecting and classifying layout content blocks, Hao et al. [19], using convolutional networks for the extraction of tables in a layout, and the recursive multilevel homogeneous layout structure analysis algorithm proposed by Tran et al. [20]. Although the layout analysis of the map has its own characteristics and the targeted research is relatively limited, comparative analysis summarizes that the above layout analysis is mainly solved by the detection and classification extraction of tables, illustrations and other objects, which are also very common in geological maps, so this method of version analysis of illustrations and tables has a certain degree of reference significance.
The map units in geohazard maps have well-defined boundaries and seldom overlap or cover one another. As a result, the primary methods for region segmentation include horizontal and vertical projection algorithms and segmentation based on connectivity domains. However, these methods are predominantly designed for raster data, focusing on the regularity between individual pixels. In contrast, our study involves vector geologic maps, necessitating the consideration of feature differences under the segmentation algorithm.
This paper introduces a layout segmentation algorithm specifically for vector map pieces. This method integrates the strengths of transverse and longitudinal projection as well as segmentation methods based on connected domains, enabling an effective and efficient segmentation of complex map layouts. The main process of the algorithm is described as follows:
- Step 1:
- First of all, the vector graphics in the point–line–surface file are processed as a point cloud, and each point is given a point–line–surface-type label, that is, if the point belongs to a surface element, the type label is “pnt”.
- Step 2:
- Grid processing, the entire map is divided into grids with a fixed row width (such as the length of the map/100,000, the width of the map/100,000). This heuristic value is scale-adaptive and reflects the typical point density and layout characteristics of geohazard vector maps, balancing segmentation accuracy with computational efficiency. Each grid cell stores information about the number of various types of points falling within it, as well as the total number of points.
- Step 3:
- Horizontal segmentation, the purpose of horizontal segmentation is to obtain the lateral separation region of the figure, the segmentation is divided into the region to determine and calculate the connectivity set of 2 sub-steps;
- Step 3.1:
- Region determination. Region determination needs to go through a pooling process, using a certain step size to compute segmented statistics of the total grid cell point values and drawing a line region according to the threshold value. After this operation, the outline of the lateral region can be obtained. The specific implementation method is to first convolve the whole grid after preprocessing using an all-1 matrix with kernel of 2 × 128 and step size of 1 × 32. The pooled mesh is then binarized using a threshold value of 32 × 255, i.e., values less than this value set the total number of points to 0, and values greater than or equal to this value are set to 255. Remember that the array is denoted as B1. The convolution kernel width and the step size together achieve the transformation of the point cloud within the transverse region into a connected region. A two-dimensional array R is used to record all transverse connected regions, and points in the same row region in R are labeled with the same value.
- Step 3.2:
- Compute the connected set. The connected branches of the image are computed using the concatenated set algorithm for the pooled grid. That is, for each grid cell point, the points above, below, left, and right that are the same as their cell belong to the same connectivity branch. The connectivity set is computed using the above method for the horizontally pooled array B1. Each connected set obtained in this step is roughly a horizontal region, the boundary is not necessarily correct, and the penetration between regions is only given as an approximate partition first.
- Step 4:
- Vertical segmentation. After the previous step of horizontal segmentation, the figure obtains the horizontal connectivity region. In this step, the entire vertical segmentation will be done, and the segmentation of sub-steps follows the same the same idea as line segmentation.
- Step 5:
- The horizontal and vertical connectivity results are merged in the upper two-dimensional merger to get the regions separated from each other in the picture area.
After solving the layout segmentation problem, the next segmented region is classified, that is, the final completion of the classification and extraction task of the graphical units. In this paper, the following classification labeling system is established. Table 5 presents the classification names and labels of various units in the region.
Table 5.
Map area category names and labeling sheet.
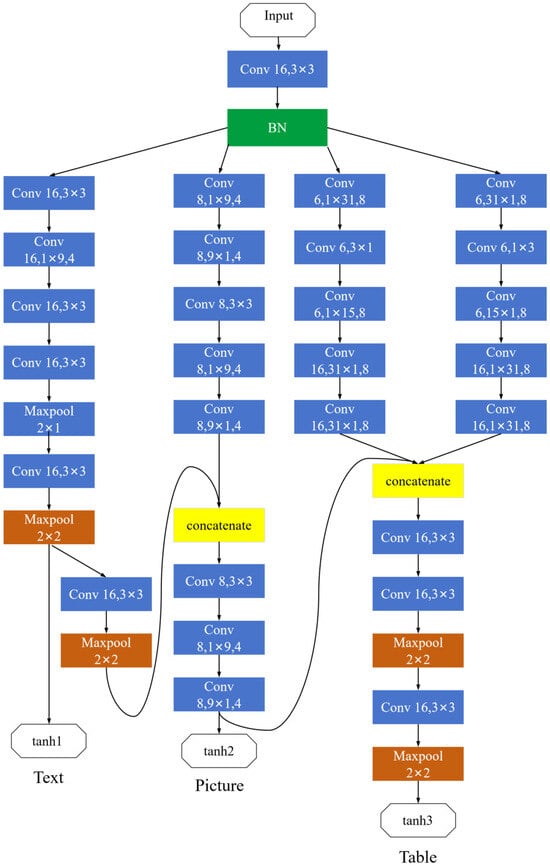
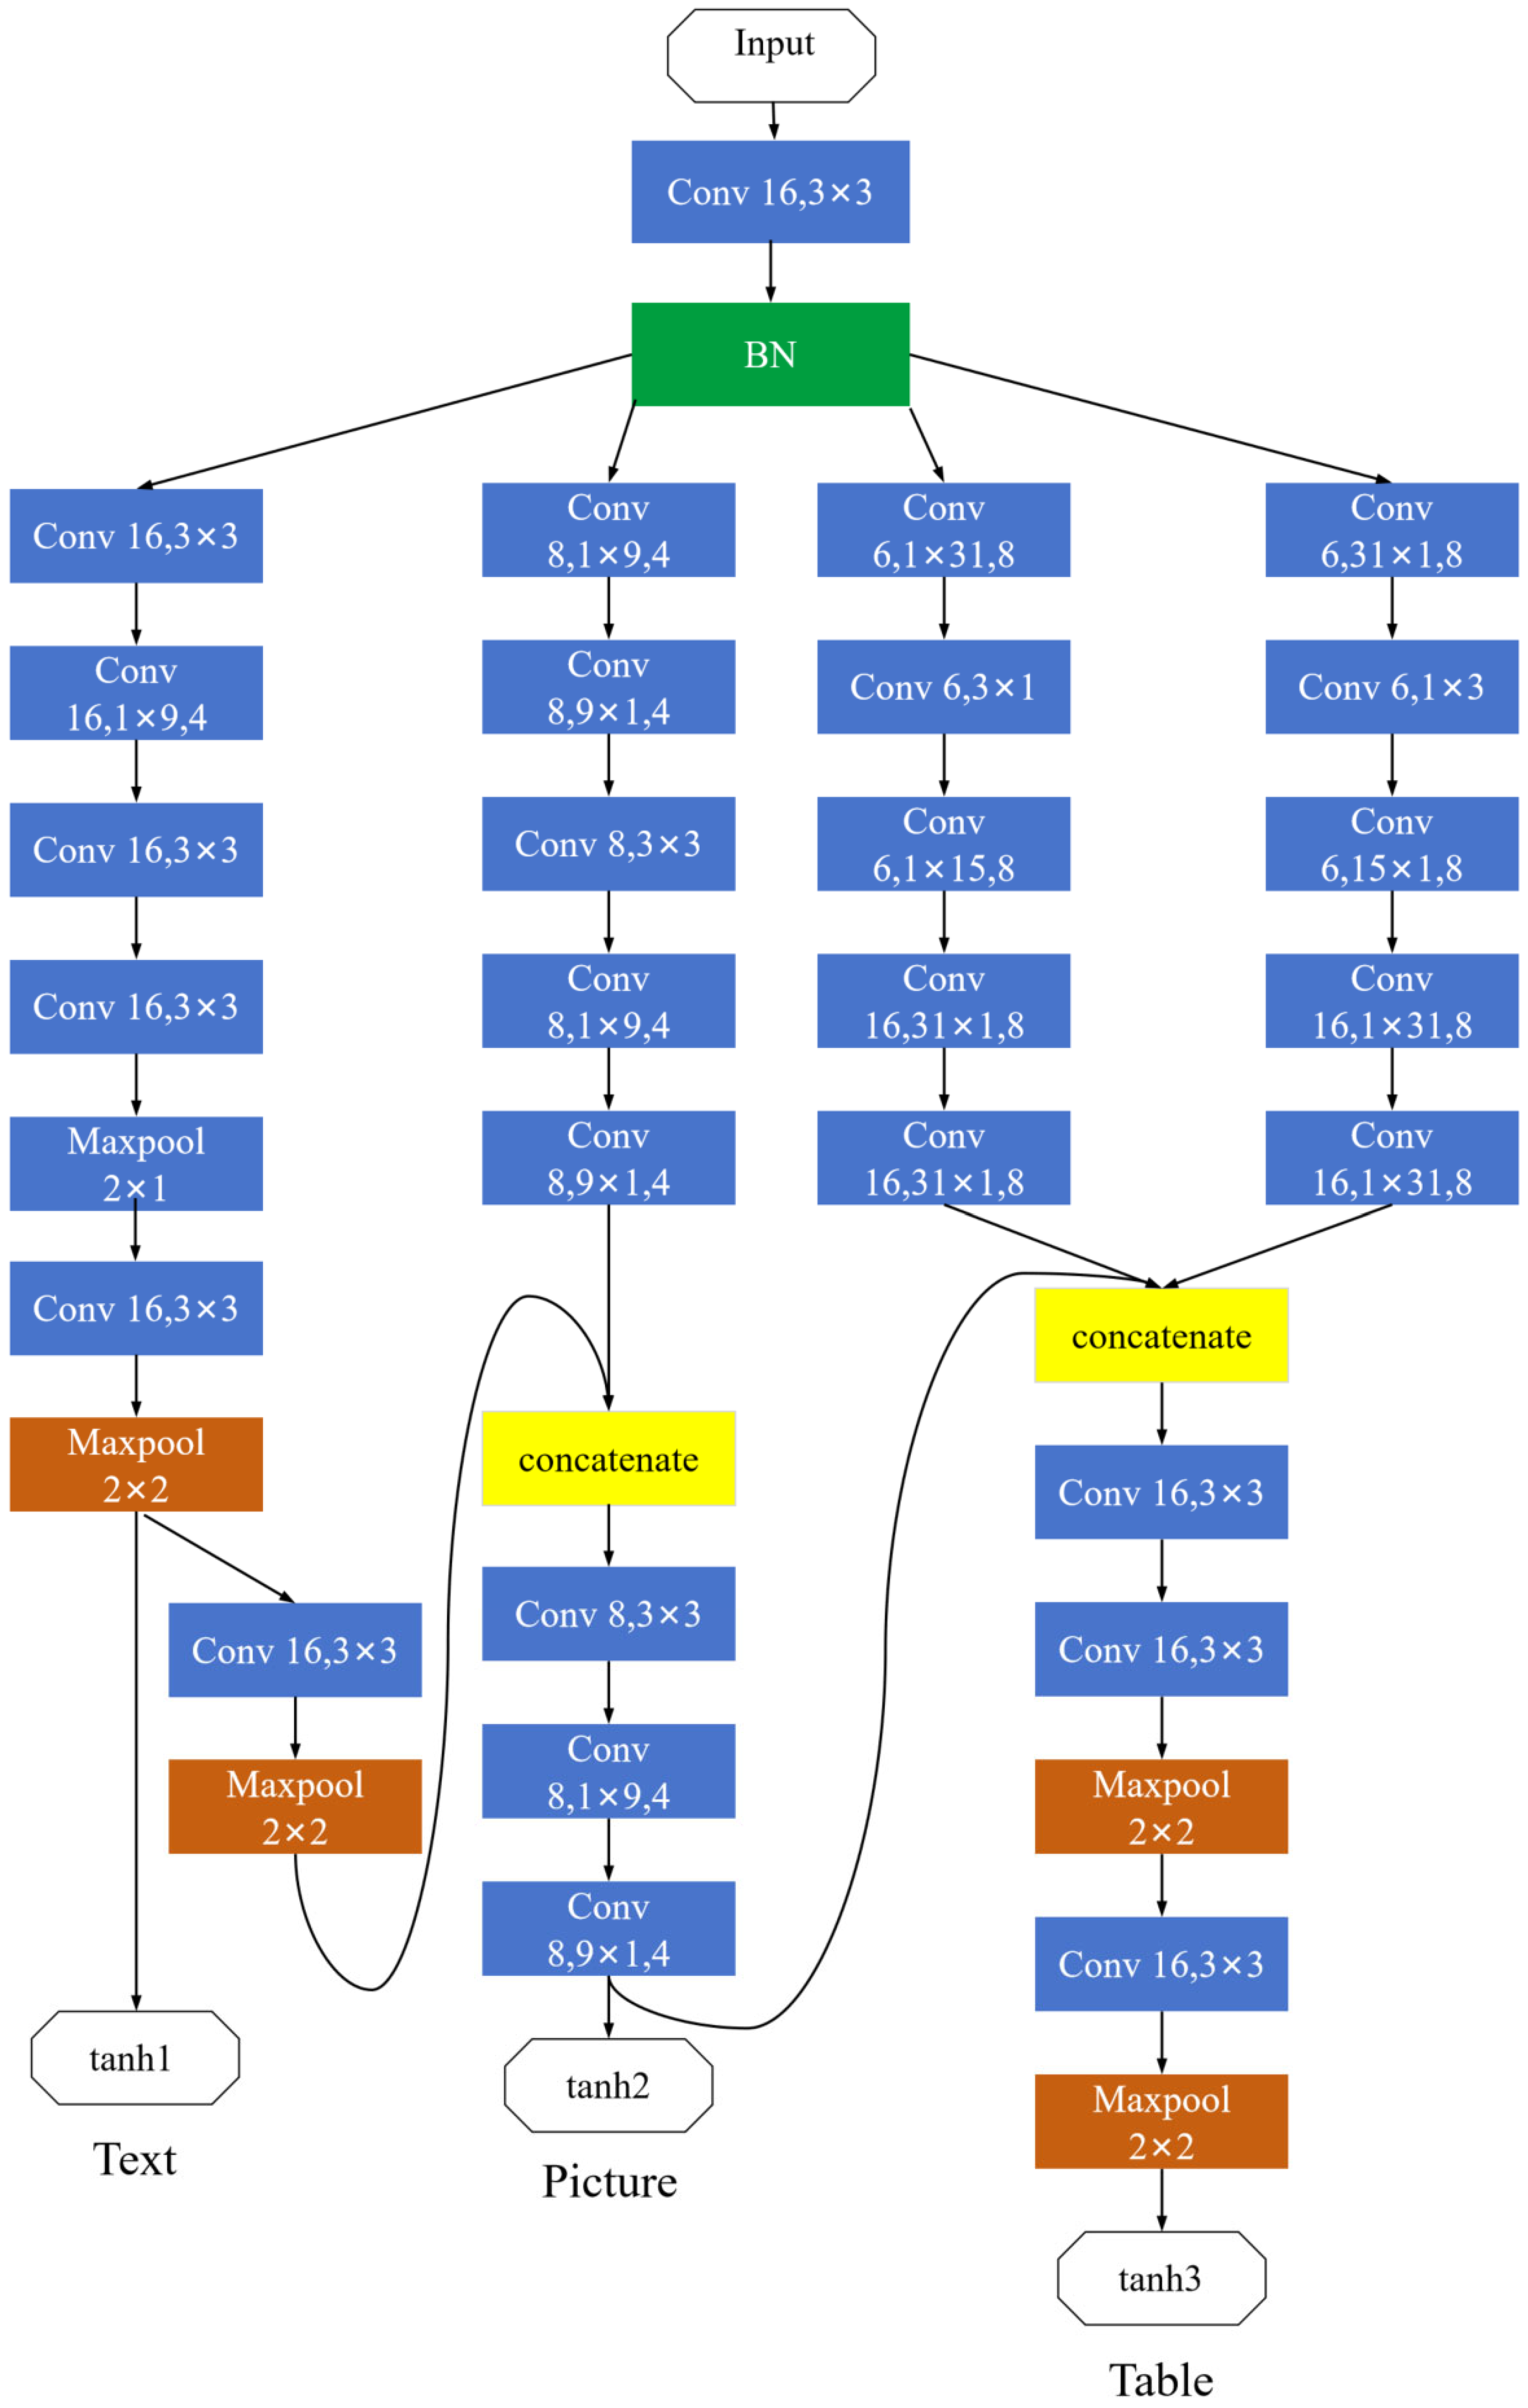
Most of the layout analysis algorithms are proposed based on network structures such as VGG [21]; such network structures are mostly used to obtain better classification effects by increasing the number of layers of the network, but this also brings many negative effects, such as overfitting, gradient vanishing, and gradient explosion. In view of the fact that most geological maps are large in size and the size of the recognition area is not uniform, this paper proposes a new network model to realize the content classification of the map elements. The network structure is shown in Figure 14. The input to the model is the map area separated in the previous step and grayed out to form a channel.
Figure 14.
Content classification network for graphic elements.
The network architecture depicted in Figure 13 includes a multilayer RNN structure with three hidden layers, which enables the model to learn hierarchical dependencies in the document structure. In addition, dropout is integrated into the model to prevent overfitting. Recent advances in physically constrained deep learning, such as VIF-Net [22] and RNN [23], as well as tensor-based networks for geophysical interpretation [24], have shown that embedding domain knowledge or structural priors can significantly improve learning robustness and model interpretability in complex geoscience applications.
The initial convolution kernel in the network is defined by a tuple representing the channel, followed by the kernel size, and finally the stride (default is 1). The network commences with a convolutional layer (conv(16, 3 × 3)) for dimensionality reduction and feature extraction. This is succeeded by a batch normalization layer (BN) to standardize the data, which expedites training convergence and mitigates issues such as gradient vanishing and overfitting. The architecture for recognizing text regions is tailored to the dispersed pixel arrangement characteristic of characters within those areas. Conversely, figure regions are distinguished by continuous pixel patterns. To accommodate images that intersperse text, the network integrates features from both text and figure regions through convolution, subsequently applying three distinct convolutional layers for further feature extraction. Given the unique boundary attributes of tables and their exclusion from graphical content, additional horizontal and vertical convolutions are employed for edge-focused feature extraction. These features are then concatenated with the outputs of the figure recognition network to unify the three extracted sets of characteristics. A combination of convolution and max-pooling operations constructs the final feature matrix. All three classification categories employ the tanh activation function for the conclusive task of binary classification (yes or no).
As defined in Table 5, map regions are classified into three categories: text area, table area, and figure area. This three-category scheme aligns with the label taxonomy used for document analysis (Table 3), ensuring consistent indexing and querying across different data types. Special attention is given to mixed regions such as legends, which contain both textual descriptions and graphical symbols. In our approach, these regions are classified as ‘figure’ areas, with their textual components extracted separately via OCR and linked to the corresponding symbols through the legend mapping mechanism described in Section 2.2.3. This ensures that both visual and textual information are preserved for semantic querying, even in complex composite regions.
3. Results
3.1. Experiment Data
The experimental data used in this study are derived from geological hazard detailed survey projects conducted in the Loess Plateau region (Shaanxi, Gansu, Ningxia, etc.), covering 88 counties. The dataset comprises field survey data (notebooks, survey forms, drilling records), document data (reports, manuals, explanations), and vector map data (ArcGIS/MapGIS), including actual material maps, hazard geological maps, and susceptibility zoning maps.
Document data include various types of geological reports and documents sourced from regional geological survey projects of the China Geological Survey. These documents encompass:
(1) Regional geological survey reports (e.g., geological hazard assessment reports);
(2) Thematic research reports (e.g., rock and soil testing reports, seismic hazard zonation reports);
(3) Map sheet explanations;
(4) Field notebooks.
Map data consist of vector geological maps in ArcGIS and MapGIS formats, covering scales of 1:50,000 (standard sheets), 1:10,000 (key investigation areas), and supplemented by 1:2000 airborne LiDAR data for selected areas. Specific map types include:
(1) Actual material maps (1:50,000);
(2) Engineering geological maps/hazard geological maps (1:50,000);
(3) Geological hazard susceptibility zoning maps (1:50,000/1:10,000);
(4) Borehole logs and measured profile maps;
(5) Tectonic outline maps and hydrogeological maps.
For document structure labeling, a corpus of approximately 530 K characters and 10.2 K sentences was extracted from field records and reports, from which 3000 slope hazard cases were annotated.
For document structure labeling, a corpus of approximately 530 K characters and 10.2 K sentences was extracted from field records, reports, and map annotations, from which 3000 representative slope hazard cases (landslides, collapses, and unstable slopes) were annotated. The annotation follows the taxonomy defined in Table 3: headings are labeled as H1–H4 based on stylistic features such as font size, boldness, and hierarchical position inferred from numbering or indentation patterns; paragraphs are labeled as ‘p’; tables and figures are identified by their spatial boundaries and captions and annotated as ‘Tab’ and ‘Fig’ respectively. For map layout analysis, regions are classified into three categories—text, table, and figure—according to the definitions in Table 5.
In the document labeling experiment, 1400 geological reports and academic papers were selected as sample data, and these documents were randomly divided into test set and training set in the ratio of 3:1, and the training set was firstly Block-split and then labeled with the annotation set shown in Table 6. As a result, the Block sequence shown in Figure 14 is:
Table 6.
Document structure markup effectiveness indicator table.
The corresponding labeling sequence is:
The OS sequences in the training set are embedded and then the network is trained using the network shown in Figure 13. The network implementation is built using pytorch 1.6, which defines the sequence length of the network as 128, the number of training steps as 50, the number of LSTM nodes in each layer as 256, and the number of layers as 3; the learning rate is set to 0.005, the maximum number of training steps is set to 10,000, and gradient trimming is set to 5 to prevent gradient explosion during the training process. The sampling preset is set to False, and the training retention probability is set to 0.4.
The training retention probability is set to 0.4, the word embedding dimension is 128, and the loss function is defined by the cross-entropy loss function and the average loss. The optimization algorithm adopts the Adam algorithm [25], which is based on the RMSProp algorithm to do an exponentially weighted average shift in the stochastic gradient of a small batch, which is more suitable for solving this problem. Table 6 shows the evaluation of the labeled results, and the accuracy, recall, and F1 value are selected as the evaluation indexes.
The neural network built according to the model structure above is read into the training set for training. In order to make better use of the hardware setup to improve training efficiency, the training is usually done with small batches of samples at a time; here, each batch is 100 samples. The optimization method uses the RMSprop algorithm, which uses the following formula to adjust the weights:
where is the parameter to be trained, g is the gradient, is the exponential smoothing of the square of the gradient, is the exponential smoothing coefficient that takes values from 0 to 1 and is usually set to <0.3, is the constant that prevents it from being added by dividing by 0, and takes value 1 × 10⁻⁸, and is the learning rate parameter. Unlike the normal momentum term, this momentum term is preceded by coefficients, making the weight adjustment an adaptive algorithm; the larger the gradient, the smaller the learning rate. The coefficients of the momentum term are determined by the sum of squares of the historical momentum term and are not simple sums of squares, but exponential smoothing, with the previous gradient having less and less weight in the coefficients of the momentum term. The model is trained by the RMSprop [26] algorithm, after which prediction can be accomplished.
For map layout analysis, 198 × 3 thematic geological maps (engineering geological maps, actual material maps, and hazard distribution maps) from the 88 counties were collected, yielding 7729 samples after region segmentation, with text, table, and figure regions accounting for 40%, 27%, and 33%, respectively.
In order to compare the advantages and disadvantages of our method with the traditional layout analysis methods, we used exactly the same training and test sets and the test environment (NVidia Tesla A100 GPU, pytorch 1.6) with Fast CNN [18] and FCN [27] as a comparison. Fast CNN is a fast target detection algorithm, and the FCN network is based on the improvement of VGG16’s fully connected layer; the two methods are chosen as representative methods.
3.2. Experiment Results
From Table 6, it can be seen that the labeling effectiveness of each label is maintained at a high level, so the method of using Block embedding + recurrent neural network with LSTM as a unit can better solve the problem of document structure annotation.
Table 7 compares the correctness of the multi-target detection results of this paper’s method with Fast CNN and FCN for text, table, and map areas of vector geologic maps, and the time consumed is less than that of FCN and higher than that of Fast CNN in terms of accuracy, because this network does not have too many network layers stacked compared to FCN.
Table 7.
Comparison of the correctness of target detection results of vector geologic maps.
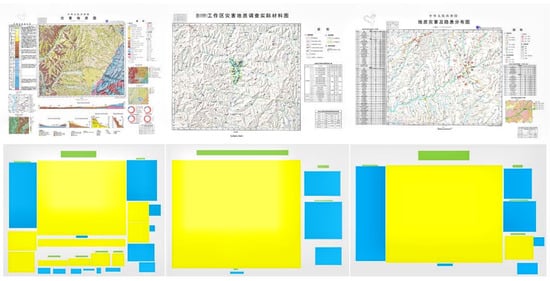
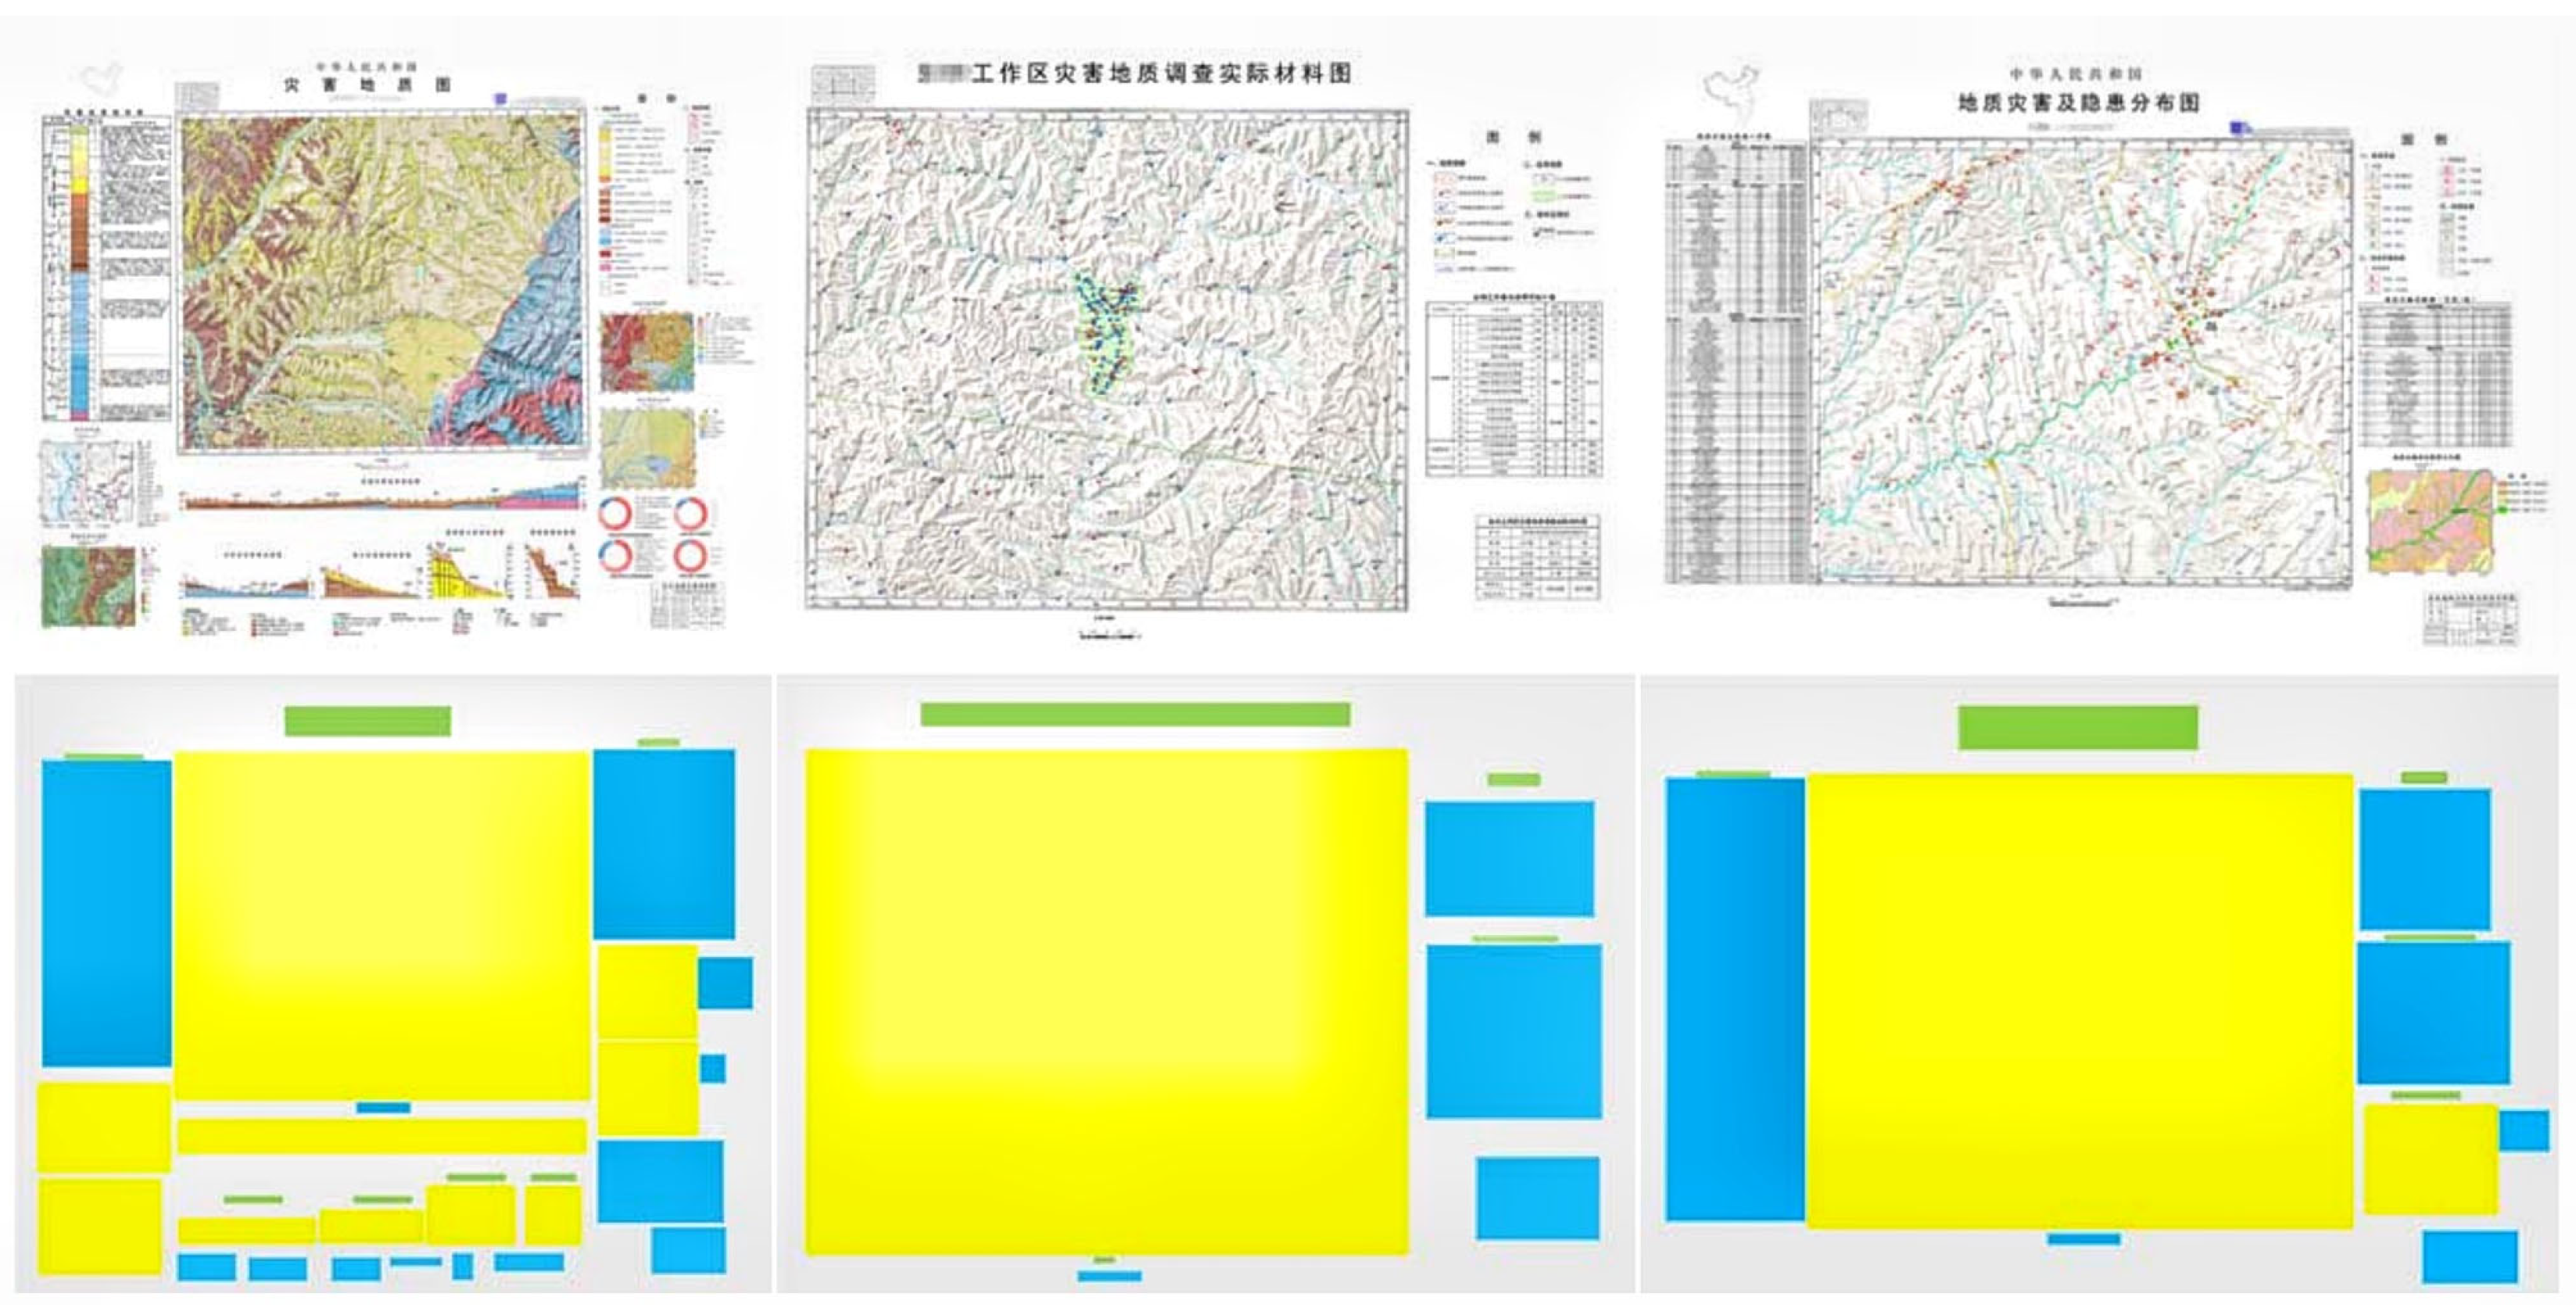
Figure 15 demonstrates the results of the layout analysis of the three types of geological maps of this paper’s method, with multi-target categorization of the target regions by text (green), table (blue), and figure (yellow) regions. The analysis can be seen from the three types of typical geological maps, and this paper’s method can accurately segment the target regions and achieve an accurate detection of text, table, and figure regions in the maps.
Figure 15.
Graphical analysis and content extraction result of various types of geohazard maps. Text, table, and figure regions are highlighted in green, blue, and yellow, respectively.
The experimental results presented above collectively demonstrate the effectiveness of the proposed methods on both document and map data. The consistently high F1 scores in Table 6 indicate that the Block embedding-enhanced LSTM algorithm reliably captures the hierarchical structure of geological documents, even in the presence of dense terminology and complex layouts. Meanwhile, the comparative results in Table 7 show that the hybrid layout segmentation algorithm not only achieves superior accuracy on text and figure regions but also maintains competitive performance on tables, where boundary detection is inherently more challenging. These findings, obtained on a diverse dataset covering multiple formats (PDF, MapGIS, Shapefile) and real-world geological reports, provide strong empirical support for the proposed modeling and extraction framework.
4. Discussion
This study addresses the challenges of unstructured geohazard data—including complex semantics, diverse formats, and weak inter-entity associations—by developing targeted solutions for digital management through advanced modeling and extraction technologies. Its core contributions are threefold: (1) a Unified Data Model (UDM) framework tailored to geohazard data, which decomposes unstructured documents and vector maps into fine-grained entities, integrates domain-specific characteristics, and enables unified semantic description, hierarchical storage, and indexed classification, thereby resolving the “physical aggregation yet logical dispersion” issue in conventional data integration; (2) a domain-informed dual-extraction algorithm that enhances accuracy by applying Block embedding with LSTM for geological documents (characterized by dense terminology and coupled text–table–graphics) and horizontal–vertical projection with a customized convolutional neural network for spatially associated vector maps, outperforming general-purpose alternatives; and (3) a closed-loop workflow integrating “modeling–extraction–knowledge association,” which establishes a technical pipeline from semantic modeling to structured extraction and reusable knowledge generation, bridging the gap between data processing and knowledge discovery while enabling cross-modal retrieval and efficient digital management of geohazard data.
Compared to existing big data platforms such as Hadoop, which focus primarily on distributed storage and computation, our UDM framework introduces semantic modeling capabilities essential for cross-modal queries and knowledge discovery from unstructured geohazard data. For text processing, the proposed Block embedding-enhanced LSTM achieves superior accuracy on geological documents by incorporating domain-specific layout and terminology features—an advantage over general-purpose NLP models, which typically struggle with dense terminology and multi-modal coupling. In layout analysis, our hybrid segmentation algorithm tailored for vector maps outperforms conventional methods such as Fast CNN and FCN in both accuracy and efficiency, owing to its design for vector geological data rather than generic raster-based document images.
This study has limitations that warrant further optimization. First, the UDM framework exhibits suboptimal adaptability to certain specialized unstructured data formats (e.g., historical scanned documents, non-standard vector formats), as it primarily achieves efficient modeling for mainstream data formats. Second, the extraction algorithm demonstrates reduced accuracy in identifying semantic correlations when processing highly fragmented short text, and its feature representation capabilities in such scenarios require enhancement. Finally, the experimental dataset is limited to geohazard data from specific regions and disaster types. Due to data availability constraints, the validation conducted in this study is primarily based on data from the Loess Plateau region. It is worth noting that our experiments have been conducted on multiple formats commonly used in geological surveys (e.g., PDF reports, MapGIS and Shapefile vector maps), and the proposed method achieves strong performance across these varied formats, as reported in Section 3. Nevertheless, the generalizability to other geological settings, different report templates, varying map scales, diverse scan qualities, and additional vector formats requires further investigation. Future work will focus on collecting a more diverse dataset encompassing multiple provinces, agencies, map scales, and data formats to systematically assess the robustness and transferability of our method across these dimensions.
Future research directions to address the aforementioned optimization space include: (1) extending the format adaptability range of the UDM framework through optimized splitting and reconstruction logic for special-format data to enhance model compatibility; (2) exploring refined feature extraction strategies to improve semantic correlation capture in fragmented text and algorithm performance in specialized scenarios; and (3) expanding experimental data coverage with cross-regional, multi-type geohazard datasets for validation while investigating integration pathways between this technical system and geohazard risk assessment models to increase practical application value; (4) systematically comparing the proposed approach with more recent Transformer-based layout analysis models to further validate its effectiveness.
5. Conclusions
This paper presents a Unified Data Model (UDM) and domain-specific extraction algorithms designed to address the challenges of managing unstructured geohazard data. The UDM framework decomposes heterogeneous data sources—including documents and vector maps—into fine-grained content entities, each assigned a unique rootCode identifier and nodeType tag, thereby enabling hierarchical storage and indexed retrieval. For geological document processing, a Block embedding-enhanced LSTM algorithm achieves high-precision structural labeling, with F1 scores of 98.1% for titles and 98.6% for paragraphs. For vector map analysis, a hybrid layout segmentation algorithm combined with a custom CNN classifies text, table, and figure regions with accuracies of 94.6%, 88.1%, and 93.2%, respectively—outperforming conventional methods such as Fast CNN and FCN while maintaining competitive computational efficiency (2.53 s on average). The empirical advantage of our approach lies in its tailored design for the dense terminology and strong text-table-graphics coupling characteristic of geological documents—challenges that general-purpose models fail to address—resulting in substantial performance gains over conventional methods. These results demonstrate the effectiveness of the proposed approach in transforming unstructured geohazard data into structured, queryable knowledge representations. The framework offers practical support for digital data management, cross-modal retrieval, and subsequent risk assessment tasks. Future work will focus on cross-regional validation and systematic comparison with Transformer-based architectures to further enhance the generalizability of the method.
Author Contributions
Writing—review and editing, W.O. and W.H.; Writing—original draft, Y.Z.; Data analysis, W.O. and H.G.; Methodology, W.H. and J.L.; Conceptualization, D.W. All authors have read and agreed to the published version of the manuscript.
Funding
This research was funded by the Key R&D Program of Ningxia Hui Autonomous Region (Grant Number: 2024BEG01005) and Research grants from National Institute of Natural Hazards, Ministry of Emergency Management of China (Grant Number: ZDJ2024-14 and ZDJ2024-11).
Institutional Review Board Statement
Not applicable.
Informed Consent Statement
Not applicable.
Data Availability Statement
All data are in the manuscript and can be cited by the reader.
Acknowledgments
The authors would like to thank the editors and anonymous reviewers for their useful comments and suggestions on the manuscript.
Conflicts of Interest
The authors declare that they have no known competing financial interests or personal relationships that could have appeared to influence the work reported in this paper.
References
- Kalia, K.; Gupta, N. Analysis of hadoop MapReduce scheduling in heterogeneous environment. Ain Shams Eng. J. 2021, 12, 1101–1110. [Google Scholar] [CrossRef] [Scilit]
- Hui, G.; Jiang, J.; Li, S.; Fu, Y. A New Agglomerative Hierarchical Clustering Algorithm Implementation based on the Map Reduce Framework. Int. J. Digit. Content Technol. Its Appl. 2010, 4, 95–100. [Google Scholar]
- Yan, W.; Brahmakshatriya, U.; Xue, Y.; Gilder, M.; Wise, B. p-PIC: Parallel power iteration clustering for big data. J. Parallel Distrib. Comput. 2013, 73, 352–359. [Google Scholar] [CrossRef] [Scilit]
- Condie, T.; Conway, N.; Alvaro, P.; Hellerstein, J.M.; Elmeleegy, K.; Sears, R. MapReduce Online. In Proceedings of the 7th USENIX Symposium on Networked Systems Design and Implementation, NSDI 2010, 28–30 April 2010; USENIX Association: San Jose, CA, USA, 2010. [Google Scholar]
- Chinese Information Processing Society of China. Chinese Information Processing Development Report (2016); Chinese Information Processing Society of China: Beijing, China, 2021; pp. 2–3. [Google Scholar]
- Zhang, Y.; Liu, Z.; Zhou, W. Event Recognition Based on Deep Belief Network. Chin. J. Electron. 2017, 6, 1415–1423. [Google Scholar]
- Qiu, Q.; Zhou, S.; Liu, C.; Chen, H. Emergency Information Extraction Based on Style and Terminology. J. Chin. Inf. Process. 2018, 32, 56–65+74. [Google Scholar]
- Nanehkaran, Y.A.; Chen, B.; Cemiloglu, A.; Chen, J.; Anwar, S.; Azarafza, M.; Derakhshani, R. Riverside Landslide Susceptibility Overview: Leveraging Artificial Neural Networks and Machine Learning in Accordance with the United Nations Sustainable Development Goals. Water 2023, 15, 2707. [Google Scholar] [CrossRef] [Scilit]
- Cemiloglu, A.; Zhu, L.; Mohammednour, A.B.; Azarafza, M.; Nanehkaran, Y.A. Landslide Susceptibility Assessment for Maragheh County, Iran, Using the Logistic Regression Algorithm. Land 2023, 12, 1397. [Google Scholar] [CrossRef] [Scilit]
- Mao, Y.; Azarafza, M.; Masoud, H.B.; Nanehkaran, Y.A. Innovative Stability Analysis of Complex Secondary Toppling Failures in Rock Slopes Using the Block Theory. Landslides 2025, 22, 2037–2054. [Google Scholar] [CrossRef] [Scilit]
- Huang, Y.; Lv, T.; Cui, L.; Lu, Y.; Wei, F. LayoutLMv3: Pre-training for Document AI with Unified Text and Image Masking. In Proceedings of the 30th ACM International Conference on Multimedia; Association for Computing Machinery: New York, NY, USA, 2022; pp. 4083–4091. [Google Scholar]
- Zhang, Q.; Wang, B.; Huang, V.S.; Zhang, J.; Wang, Z.; Liang, H.; Zhang, W. Document Parsing Unveiled: Techniques, Challenges, and Prospects for Structured Information Extraction. arXiv 2024, arXiv:2410.21169. [Google Scholar] [CrossRef] [Scilit]
- Le, Q.; Mikolov, T. Distributed representations of sentences and documents. In Proceedings of the 31st International Conference on International Conference on Machine Learning, Beijing, China, 22–24 June 2014; pp. 1188–1196. [Google Scholar]
- Rong, X. word2vec Parameter Learning Explained. arXiv 2014, arXiv:1411.2738. [Google Scholar]
- Mikolov, T.; Chen, K.; Corrado, G.; Dean, J. Efficient Estimation of Word Representations in Vector Space. Comput. Sci. 2013, 215, 238. [Google Scholar]
- Redmon, J.; Farhadi, A. YOLO9000: Better, Faster, Stronger. In Proceedings of the 2017 IEEE Conference on Computer Vision and Pattern Recognition (CVPR), Honolulu, HI, USA, 21–26 July 2017; pp. 6517–6525. [Google Scholar]
- Liu, W.; Anguelov, D.; Erhan, D.; Szegedy, C.; Reed, S.; Fu, C.Y.; Berg, A.C. SSD: Single shot multibox detector. In Proceedings of the 14th European Conference on Computer Vision, Amsterdam, The Netherlands, 11–14 October 2016; pp. 21–37. [Google Scholar]
- Borges Oliveira, D.A.; Viana, M.P. Fast CNN-Based Document Layout Analysis. In Proceedings of the 2017 IEEE International Conference on Computer Vision Workshops (ICCVW), Venice, Italy, 22–29 October 2017; pp. 1173–1180. [Google Scholar]
- Hao, L.; Gao, L.; Yi, X.; Tang, Z. A Table Detection Method for PDF Documents Based on Convolutional Neural Networks. In Proceedings of the 2016 12th IAPR Workshop on Document Analysis Systems (DAS), Santorini, Greece, 11–14 April 2016; pp. 287–292. [Google Scholar]
- Tran, T.A.; Oh, K.; Na, I.S.; Lee, G.S.; Yang, H.J.; Kim, S.H. A robust system for document layout analysis using multilevel homogeneity structure. Expert Syst. Appl. 2017, 85, 99–113. [Google Scholar] [CrossRef] [Scilit]
- Simonyan, K.; Zisserman, A. Very Deep Convolutional Networks for Large-Scale Image Recognition. arXiv 2014, arXiv:1409.1556. [Google Scholar]
- Deng, Z.; Xu, Q.; Min, F.; Xiang, Y. VIF-Net: Interface completion in full waveform inversion using fusion networks. Comput. Geosci. 2025, 196, 105834. [Google Scholar] [CrossRef] [Scilit]
- Zhan, W.; Chen, Y.; Liu, Q.; Li, J.; Sacchi, M.D.; Zhuang, M.; Liu, Q.H. Simultaneous prediction of petrophysical properties and formation layered thickness from acoustic logging data using a modular cascading residual neural network (MCARNN) with physical constraints. J. Appl. Geophys. 2024, 224, 105362. [Google Scholar] [CrossRef] [Scilit]
- Liu, D.; Wang, Q.; You, N.; Sacchi, M.D.; Chen, W. Filling the Gap: Enhancing Borehole Imaging with Tensor Neural Network. Geophysics 2025, 90, D71–D83. [Google Scholar] [CrossRef] [Scilit]
- Kingma, D.; Ba, J. Adam: A Method for Stochastic Optimization. arXiv 2014, arXiv:1412.6980. [Google Scholar]
- Tieleman, T.; Hinton, G. Lecture 6. 5-rmsprop: Divide the Gradient by a Running Average of Its Recent Magnitude. COURSERA Neural Netw. Mach. Learn. 2012, 4, 26–31. [Google Scholar]
- Barakat, B.K.; El-Sana, J. Binarization Free Layout Analysis for Arabic Historical Documents Using Fully Convolutional Networks. In Proceedings of the IEEE International Workshop on Arabic and Derived Script Analysis and Recognition (ASAR), London, UK, 12–14 March 2018; pp. 151–155. [Google Scholar]

Disclaimer/Publisher’s Note: The statements, opinions and data contained in all publications are solely those of the individual author(s) and contributor(s) and not of MDPI and/or the editor(s). MDPI and/or the editor(s) disclaim responsibility for any injury to people or property resulting from any ideas, methods, instructions or products referred to in the content. |
© 2026 by the authors. Licensee MDPI, Basel, Switzerland. This article is an open access article distributed under the terms and conditions of the Creative Commons Attribution (CC BY) license.