


Abstract
This study investigates how an internal PCM–gypsum plaster lining modifies orientation-dependent heat transfer through lightweight model house envelopes over a full spring season. Two identical container houses (reference and PCM plastered) were monitored for 105 days under free-floating conditions, and surface temperatures of all opaque elements were processed into characteristic temperature differences and corresponding heat flux densities at daily extrema. The analysis showed that wall and roof orientation strongly governed both the magnitude and variability of these characteristic heat fluxes. West-facing façades and the roof exhibited the highest values due to solar gains and radiative exchanges, while the floor and north wall remained comparatively stable. Under conditions of nearly constant mean wall temperature, the characteristic flux framework revealed that the PCM lining systematically reshaped the temporal distribution of heat transfer and reduced the effective net energy exchange between indoor space and outdoor environment, most notably on solar-exposed west and south walls and on the roof. These orientation-resolved heat flux indicators provided a physically transparent basis for deciding on which envelope surfaces PCM integration could be most advantageous and where its application could be omitted without significantly compromising thermal performance under similar climatic conditions.
1. Introduction
Improving building energy performance is a key priority in mitigating climate change, with particular emphasis on reducing heating and cooling loads through passive design strategies. Among these, modifying the thermal behavior of the building envelope—walls, roofs, and floors—offers one of the most direct and effective means to reduce operational energy use. Phase change materials (PCMs) have gained attention as latent heat storage systems that can be integrated into building components to moderate indoor temperature swings by absorbing and releasing thermal energy during phase transitions. When strategically placed within the envelope, PCMs can shift heating and cooling loads away from peak demand hours, thereby enhancing both energy efficiency and occupant comfort. Numerous simulation and experimental studies report reduced heat flux entering the interior spaces due to PCM application, typically assessed via surface heat flow measurements or cumulative energy transmission over time. These evaluations often rely on dynamic simulation models or laboratory-based thermal testing. However, while the general benefits of PCMs are well documented, the actual in situ performance—especially in response to varying wall orientations and real outdoor conditions—remains an open research area.
1.1. Energy Performance Challenges in Buildings
Improving the energy performance of buildings is one of the most effective strategies to mitigate climate change. In both new constructions and retrofitting projects, attention has been shifted toward materials and envelope systems that can passively regulate indoor temperatures, thereby reducing the need for active heating and cooling systems [1,2]. Lightweight buildings—such as modular structures, container houses, or panel-based systems—pose a particular challenge in this regard due to their low thermal inertia [3,4]. These structures are highly responsive to outdoor weather changes, leading to high peak temperatures during hot periods and rapid cooling during colder spells.
Traditional insulation methods alone are often insufficient to address these problems. Studies show that despite good U-values, thermal comfort is not always ensured in dynamic climates [5,6]. This is particularly relevant in regions with high solar radiation and wide diurnal temperature swings, where heat gain and loss processes fluctuate rapidly [3,7]. To improve thermal stability and reduce energy loads in such conditions, researchers have explored various passive solutions, including ventilated façades, thermal buffering zones, and advanced wall assemblies. One promising avenue is the use of latent heat storage materials integrated into wall structures.
1.2. Role and Benefits of Phase Change Materials (PCMs)
Phase change materials (PCMs) have emerged as a passive technology with significant potential in building energy optimization. These materials absorb and release large amounts of latent heat at a specific phase transition temperature, typically between 20–28 °C for building applications [2,8]. When applied within building envelopes, they can delay heat transfer and stabilize indoor temperatures by smoothing out fluctuations over the course of a day [9,10].
A large body of research, both numerical and experimental, has shown that PCM systems integrated into wall elements reduce peak heat fluxes and indoor temperature swings and contribute to energy savings by shifting cooling and heating loads [11,12,13]. The benefits of PCMs include improved thermal comfort, especially during transitional seasons, as well as the potential to support load shifting and reduce energy peaks in heating, ventilation, and air conditioning (HVAC) systems [13,14]. However, the effectiveness of these materials depends on several critical parameters. These include the phase change temperature range, the total latent heat capacity, the encapsulation technique used, and the position of the PCM layer within the wall assembly [15,16,17].
Simulations and measurements suggest that PCM is most effective when placed toward the interior side of the wall, where temperature fluctuations are highest. Zhang showed significant reductions in thermal peaks when PCMs were placed next to the gypsum board layer [10], while Izquierdo-Barrientos found that varying the PCM’s location within a wall significantly alters its seasonal effectiveness [11]. Jin’s modeling confirmed that placing PCMs roughly one-fifth from the interior surface produces optimal heat attenuation [16]. Arıcı demonstrated that applying two thin PCM layers at different depths can enhance performance, reducing energy demand by more than 17% [12]. In a real-scale relevant environment in Valladolid (Spain), plaster involving microencapsulated PCMs with different operating temperature ranges was applied as an indoor coating to the envelope of lightweight constructions [17]. In a 1-year monitoring campaign, the indoor temperature fluctuations were analyzed under free-floating operation, while the energy consumption of HVAC equipment was measured under controlled temperature. Lower temperature fluctuations due to PCMs were experienced from May to September, decreasing indoor temperature peaks by 1–2 °C and exerting a time delay of 1–1.5 h in the temperature wave.
Buildings involving PCMs require numerical modeling and simulation (e.g., EnergyPlus, TRNSYS, RadCool, CoDyBa, BSim, PCM Express, and WUFI) to investigate and optimize the parameters for improving thermal management [18]. Material-level modeling of PCMs helps design efficient thermal storage systems within buildings. The thermal performance of PCMs (e.g., temperature distribution, heat flux in buildings) can be predicted by mathematical simulation of heat transfer mechanisms. Mathematical modeling can be used to determine the appropriate quantity of PCMs and select their optimal location within building components like walls or roofs. Building performance simulation is applied to calculate thermal comfort and energy consumption. TRNSYS and EnergyPlus are used for simulating dynamic indoor changes and energy consumption on a large scale. The accuracy and comprehensiveness of these building-level simulations are dependent on the results of material-level modeling. Computational fluid dynamics analyses (such as ANSYS Fluent) validate material behavior models including PCM panels in roofs or walls [19].
Recent reviews confirm that PCM performance is highly context-specific. Factors such as geographic location, seasonal climate, wall structure, and interior use patterns all play a role in determining effectiveness [1,8]. This leads to growing interest in adaptive PCM deployment—i.e., tuning the PCM type and configuration to specific environmental conditions.
1.3. Impact of Wall Orientation on PCM Performance
Among all contextual variables, wall orientation has emerged as a particularly influential factor in PCM effectiveness. The amount and timing of solar radiation vary drastically between north-, east-, south-, and west-facing walls, especially in mid-latitude climates. As a result, the thermal behavior of PCM-containing wall systems is direction-dependent [20,21].
For example, Lee showed that PCMs applied to a south-facing wall could reduce peak fluxes by over 50%, while west-facing walls also demonstrated strong performance depending on the time of day and PCM placement [9]. Similarly, Liu found that PCMs could reduce heat transfer in east and west façades by over 60% under summer conditions [7]. These findings highlight the importance of façade-specific strategies. Optimizing PCM layers without considering orientation can lead to underperformance or even negative outcomes in energy savings.
Several studies have gone further by linking solar load data with PCM phase change dynamics. Ferster tested different wall orientations in a hot Texas climate and found that the west façade yielded the greatest benefits, with potential energy savings up to 31% [22]. Tunçbilek confirmed that applying PCMs to all envelope surfaces, including the roof, maximized annual gains [13]. These studies emphasize that wall orientation is not a secondary factor but a primary design criterion when deploying PCMs.
Parametric studies and reviews continue to support this view. Al-Absi proposed climate-specific PCM location strategies for maximum benefit [15,23].
Despite the promising simulations, there is a relative lack of full-season, real-weather experimental studies comparing all major wall orientations in PCM-equipped buildings. While transient heat transfer and short-term tests are common, long-term field data are rare, particularly in lightweight structures with limited thermal mass [24,25].
Notable exceptions include a study by Puskás, which measured indoor temperatures and surface heat fluxes over a transitional season in a PCM test house [26], and orientation-focused studies that assessed cooling performance with respect to wall direction and PCM-related design parameters [17,27]. Karlessi compared north- and south-facing test façades and found asymmetrical thermal buffering, while Karkri used scale models to demonstrate orientation-specific gains [6,28].
Gounni and El Alami analyzed lightweight systems and found improved stability for west-facing façades under PCM use [21]. Childs and Stovall extended this with a cross-climate dataset showing that PCM integration consistently benefits solar-loaded walls [24]. Pomianowski concluded in a review that simulations must be validated with field measurements that consider directionality and seasonal effects [29].
1.4. Motivation and Aim of Study
Despite the growing literature, gaps remain. Most comparative studies focus on either simulation-based outputs or limited-duration experiments [4,30]. Few of them address long-term, multi-orientation measurements under free-running conditions with fully operational PCM systems in real environments [26,31]. Especially in lightweight modular houses, the influence of wall orientation on PCM performance has not been adequately quantified using full-scale empirical methods.
Our own recent experiments aimed to fill this gap. In our former studies, the dynamic temperature behavior of PCM-plastered and reference houses under free-running spring conditions was measured. The PCM system, containing approximately 51 kg of paraffin in a microencapsulated plaster matrix, significantly delayed thermal peaks, flattened temperature curves, and extended comfort hours, especially under fluctuating weather [32]. Power demand tests conducted by Németh et al. showed 7–10% energy savings in the PCM house depending on the heating method used, whether an electric radiator or heat pump [31]. In a more recent work, we applied statistical analysis methods, including Poincaré plots, to full-season data, revealing a 42.9% drop in calculated energy use due to PCM integration [33]. These findings demonstrate that PCMs not only moderate short-term thermal loads but also enhance long-term energy performance under variable conditions. However, the orientation-specific behavior of such systems in lightweight buildings remains underreported in the experimental literature. Our study addresses this by monitoring two identical experimental houses—one reference, one PCM-plastered—through a full spring season, with measurements taken across all envelope directions, including walls, floors, and roofs. This allows us to investigate the role of wall orientation in real-time PCM thermal performance, providing validation data to support or challenge simulation assumptions [30,31]. The objective is to clarify how solar directionality interacts with phase change cycles, and how PCM deployment strategies can be optimized for real-world applications [4,26]. The reported field data and orientation-resolved indicators can serve as benchmark reference points for future modeling efforts (e.g., EnergyPlus-based workflows), particularly for orientation-sensitive calibration and validation. In applied PCM research, such benchmark datasets are a prerequisite for meaningful simulation-based generalization.
2. Materials and Methods
2.1. Model Houses and Envelope Build-Up
The experimental study was conducted using two mid-scale model houses designed to represent lightweight modular buildings exposed to real outdoor conditions. The structures, referred to as the reference house and the PCM house, were identical in size and base construction, with the only difference being the application of a phase change material (PCM) plaster layer on the internal wall surfaces of the latter.
The PCM phase change interval is approximately 22–26 °C. During the free-running measurement period, the interior plaster/surface temperatures frequently crossed this interval; however, under naturally varying outdoor forcing, complete melt–freeze cycling does not occur uniformly every day. On colder days, the temperature did not reach the melting range, whereas on the hottest days the temperature could remain above the phase interval long enough that full re-solidification within the same diurnal cycle was not achieved. This indicates predominantly partial and day-dependent activation under realistic operating conditions, while still supporting recurrent charge–discharge behavior during a substantial portion of the campaign
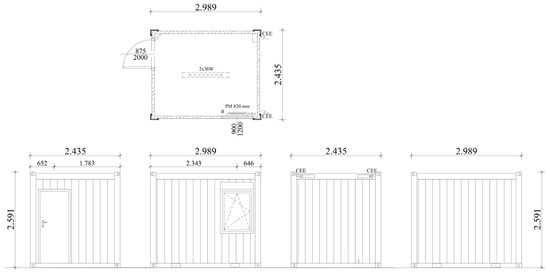
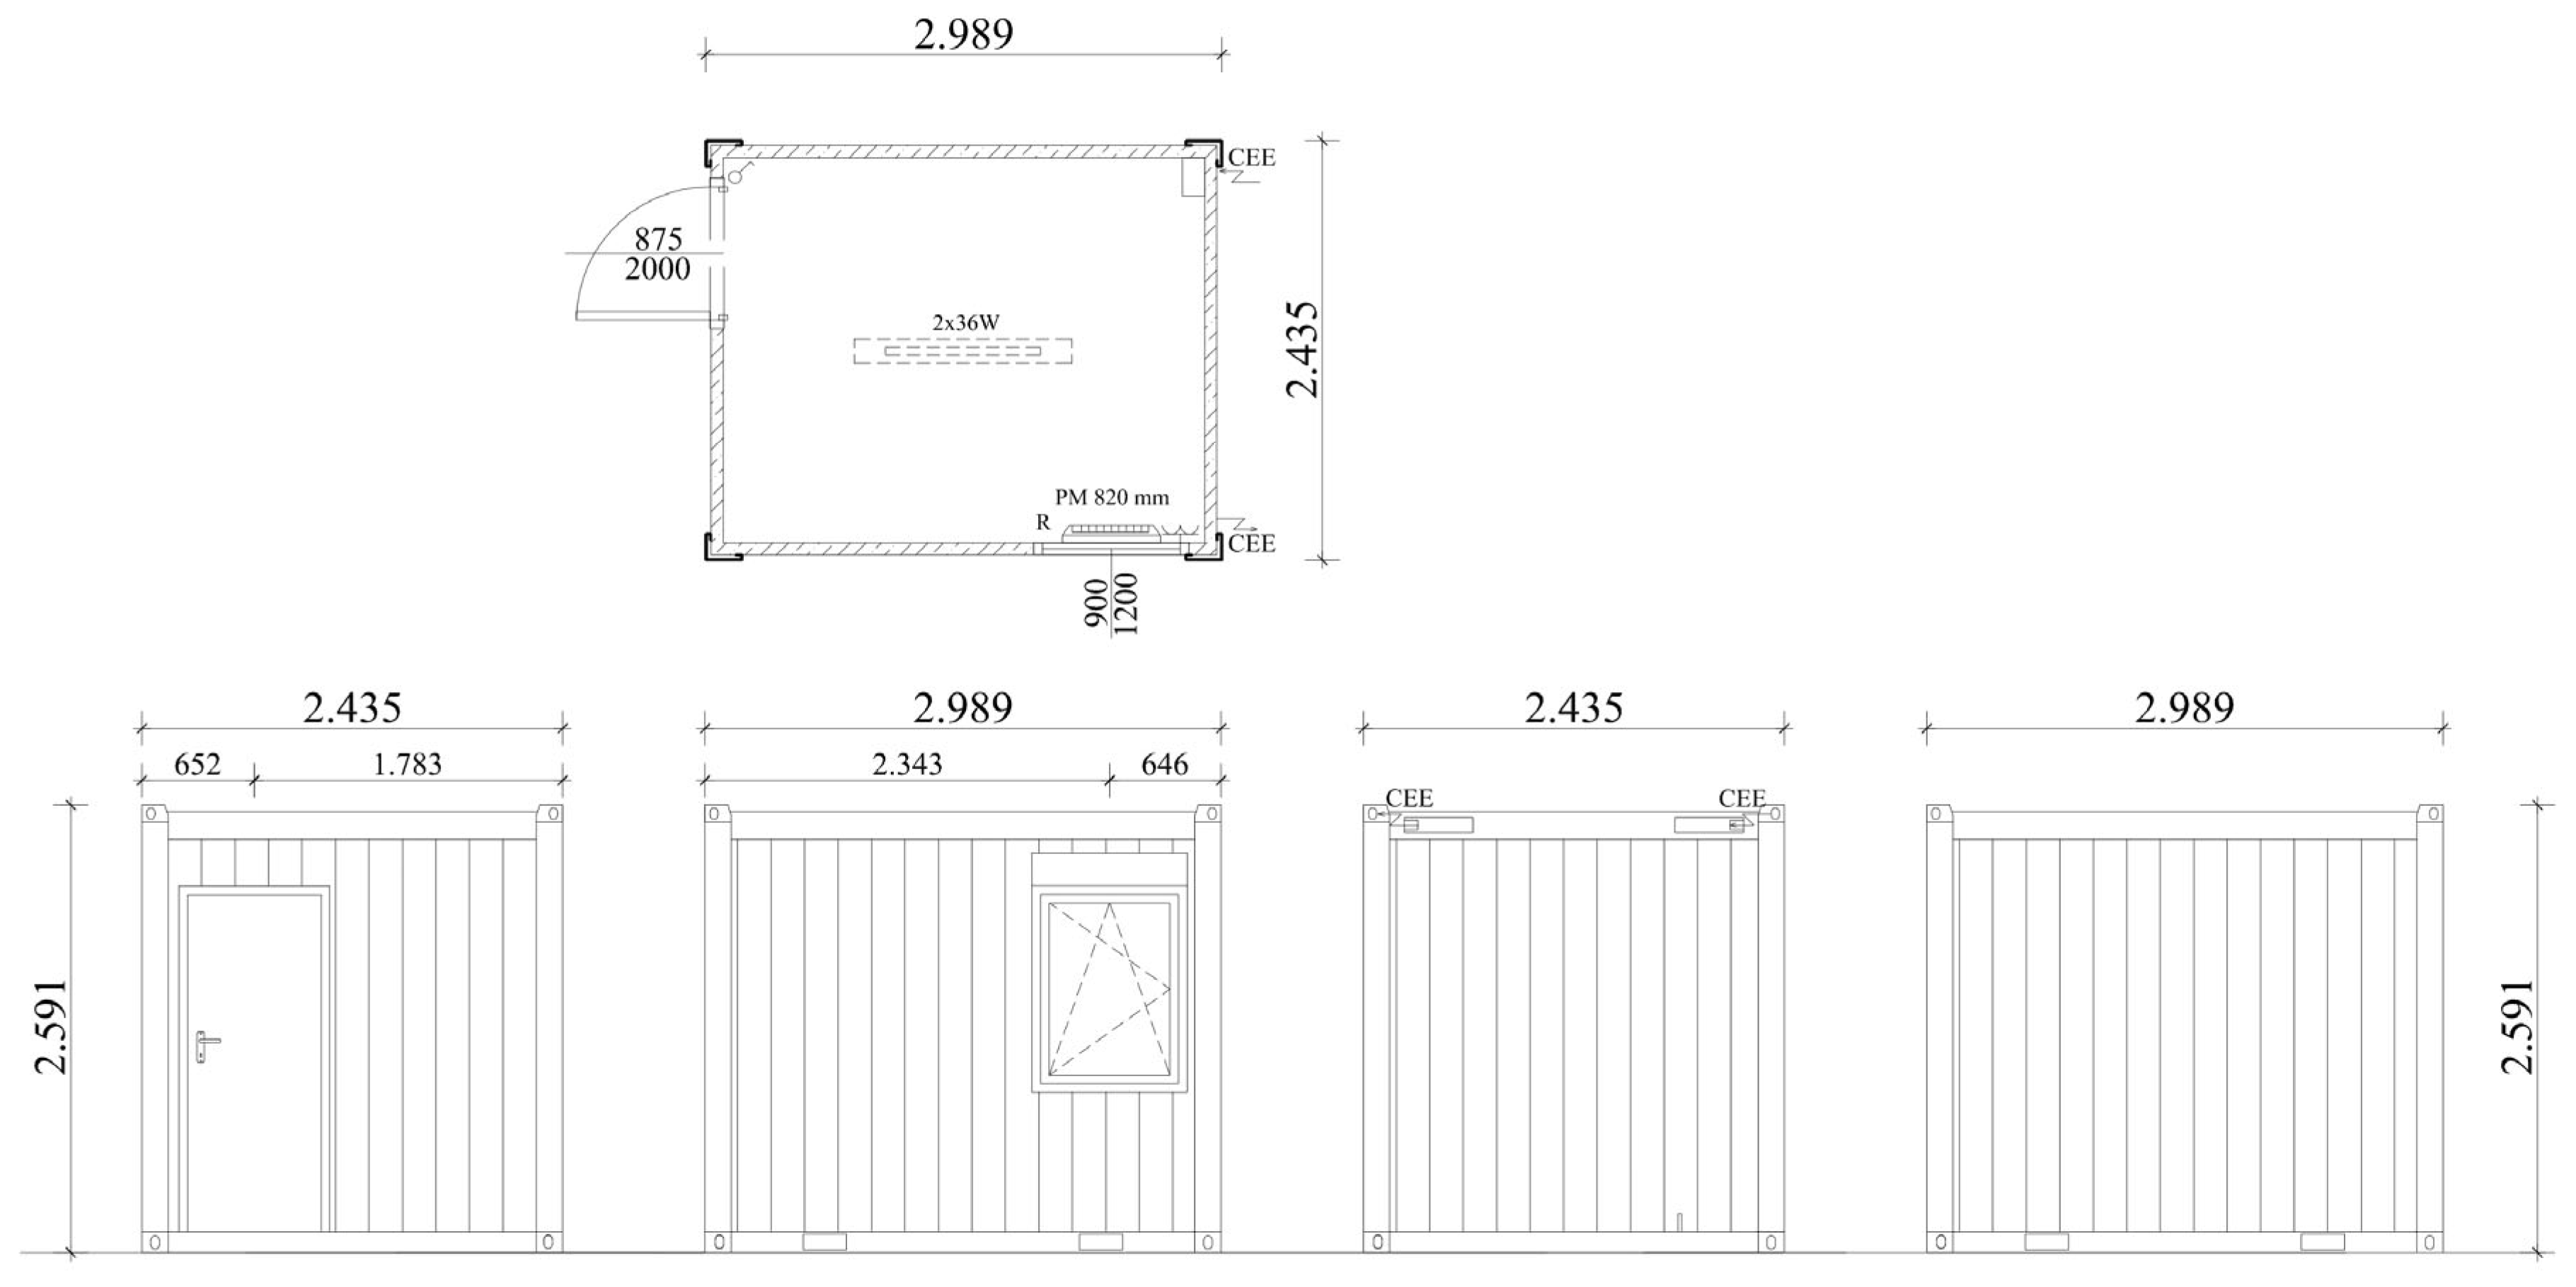
Both model houses were constructed from MB10-type modular office containers, commonly used in prefabricated building applications (Figure 1). Each unit had external dimensions of 3.0 m (length) × 2.4 m (width) × 2.6 m (height), providing an internal floor area of 7.2 m2. The houses were placed side by side in an open-air test field, receiving comparable environmental exposure, including solar radiation and wind. No adjacent structures or shading elements influenced the building envelopes during the measurement period.
Figure 1.
Floor plan and elevations of Mobilbox MB10 container-type model house.
The external wall assembly in both houses consisted of steel sheet cladding on the outside, 50 mm of mineral wool insulation, and an internal 12 mm oriented strand board (OSB) finish. This configuration yielded a thermal transmittance (U-value) of approximately 0.55 W/m2K for the walls. The roof and floor assemblies were also insulated, with respective U-values of 0.32 W/m2K and 0.45 W/m2K, following the same construction approach in both units.
The distinguishing feature of the PCM house was the addition of an internal PCM-modified plaster layer applied to all interior wall surfaces. This plaster was a 25 mm thick gypsum-based finish, homogeneously mixed with RT25 paraffin (from Rubitherm®, Berlin, Germany; RT-line)-based microencapsulated PCM entrapped in a poly (methyl methacrylate) shell [26] at a 15.1% mass fraction. The RT25 paraffin melts and solidifies at 22–26 °C with 180 kJ/kg melting and solidifying enthalpies according to the manufacturer. The resulting PCM specific surface concentration that provided the desired latent heat storage capacity was approximately 1.95 kg/m2 of the PCM, designed to activate within the typical indoor comfort temperature range and enhance thermal stability during daily outdoor fluctuations in the spring season.
The PCM plaster was installed using standard application techniques over the OSBs and was allowed sufficient curing time before the beginning of the monitoring phase. The reference house remained unchanged, with only the exposed OSBs serving as its internal wall finish.
To ensure that the thermal behavior observed during the study reflected passive phenomena alone, both model houses were kept unoccupied and free of any internal heat sources or HVAC systems for the duration of the measurement period. Windows and doors were kept closed and excluded from the analysis, as no surface temperature or heat flux sensors were mounted on them.
This controlled setup ensured that any differences in wall heat fluxes or indoor thermal responses between the two units could be attributed exclusively to the effect of the PCM-enhanced plaster layer.
2.2. Instrumentation and Measurement
To monitor the thermal behavior of the model houses over time, a comprehensive measurement system was installed in both units, focusing on the temperature dynamics of the building envelope and the indoor environment. The aim was to capture surface temperature trends, indoor air temperature fluctuations, and weather conditions under free-running, real-world conditions during the spring season.
Each house was equipped with Type-K thermocouples fixed to the external and internal surfaces of all opaque envelope elements: north-, east-, south-, and west-facing walls, the roof, and the floor. Thermocouples were installed at the center of each bounding surface and near the corners, and wall surface mean temperatures were computed from these measurements. A total of 28 wall surface measurement points per house were used to capture exterior and interior surface temperatures at 5 min resolution; orientation-wise averaging was applied to obtain representative exterior and interior surfacetemperature time series for each façade. Thermocouples were bonded to the surface using thermally conductive adhesive and covered with insulation patches to minimize radiation error. Additional sensors were placed in the center of the indoor air volume, suspended approximately 1.2 m above the floor, to monitor the free-floating indoor air temperature. Indoor air temperature was recorded at two locations per house. Identical sensor arrangements were used in both houses to allow for direct comparison between the reference and PCM-enhanced configurations.
Surface temperatures were recorded at 5 min intervals using a multi-channel data logger system connected to a laptop. Ambient weather conditions were recorded via an independent on-site meteorological station, positioned near the test houses in an unshaded location. The weather station logged outdoor air temperature, global solar radiation, and wind speed at the same 5 min frequency, ensuring synchronized data for boundary condition analysis.
The monitoring period lasted for approximately 105 consecutive days during the spring of 2021 (29 March–11 July), encompassing a variety of solar, ambient, and wind conditions. No heating, cooling, or ventilation systems were operated during this time, and the houses remained unoccupied to isolate the passive thermal effects of the envelope materials.
For post-processing, raw temperature data were smoothed (see details of data processing in Section 2.3) to reduce short-term measurement noise and emphasize diurnal trends. This method was particularly useful for identifying daily temperature peaks and troughs and for comparing trends across wall orientations and surface positions. All measurements were carried out with calibrated sensors, and the error margin of surface temperature readings was within ±0.5 °C.
This high-resolution dataset formed the basis for analyzing surface temperature fluctuations, estimating daily maxima and minima, and calculating thermal performance indicators such as the characteristic heat flux density introduced in later sections.
The experiments were carried out at the outdoor test site in Bácsalmás (SE Hungary; 46.127877° N, 19.332132° E) during a 105-day free-running period in spring–early summer 2021, representative of a temperate continental Central European climate. Site and climate metadata are provided for transparency, together with concise summary statistics of the recorded outdoor boundary conditions over the campaign (including moderate wind conditions monitored by the on-site meteorological station). Both houses were co-located and identically oriented, remained unoccupied, and were operated without HVAC systems or internal heat sources throughout the measurement period; no atypical operating events were observed that could bias the results.
The present study analyzes data from two of four instrumented model houses developed within the wider measurement program. Over the multi-year campaign, the two houses alone generated on the order of 13 million raw records; the present manuscript uses the subset required for the orientation-resolved surface-temperature evaluation and indicator calculations.
2.3. Data Processing and Analytical Approach
The primary objective of data analysis was to evaluate how the presence of phase change material (PCM) influenced the thermal dynamics of the model houses, with particular attention paid to the effect of wall orientation. The analysis focused on quantifying the daily surface temperature fluctuations and characterizing differences between the PCM and reference houses under identical environmental conditions.
To identify overall trends and typical diurnal behavior, the raw surface and air temperature data were smoothed using a 3 h 45 min moving average, applied to the 5 min interval measurements. This corresponds to a window size of 45 data points. The filtering process reduced high-frequency noise, sensor fluctuations, and transient anomalies caused by short-term environmental variations (e.g., wind gusts or passing clouds), while preserving the essential features of daily thermal cycles.
Daily maximum and minimum surface temperatures were extracted for each thermocouple location on all walls, the roof, and the floor. These extrema were computed for both the external and internal surfaces of each element, enabling a comparison of surface temperature amplitudes across the building envelope. For each orientation and house type, a linear trend line was fitted to the series of daily extrema to visualize long-term warming or cooling tendencies throughout the spring season.
To evaluate the day-to-day thermal fluctuation sensitivity, the root mean square error (RMSE) was calculated for each surface temperature signal relative to its linear trend line. The RMSE serves as a statistical measure of how much daily maximum or minimum values deviate from the seasonal trend, reflecting the variability imposed by solar exposure and ambient weather. This metric provided insight into which surfaces were most thermally stable and which were most affected by environmental dynamics.
For comparison between the PCM and reference houses, paired temperature series were plotted and analyzed for each orientation. This enabled direct evaluation of PCM’s effect on damping temperature extremes and shifting heat accumulation. The results were categorized by wall orientation to isolate the directional influence of solar radiation and thermal mass interaction.
In addition to daily amplitude and variability analysis, the processed data served as input for calculating the characteristic temperature differences and heat flux densities, described in the following section. These quantities form the basis of a simplified stationary approximation used to interpret the PCM’s role in mediating directional heat flow.
Data processing and analysis were performed on the basis of a large volume of raw sensor records. Data cleaning, time synchronization, statistical smoothing, and the computation of orientation-resolved indicators were carried out in a Python 3.10.11. environment using widely adopted scientific libraries (e.g., NumPy, Pandas, SciPy). This transparent and reproducible workflow supported consistent evaluation of long, free-running time series and enabled robust quantification of orientation-dependent differences under naturally varying outdoor forcing.
2.4. Characteristic Temperature Difference
Our key question in this paper is to what extent the PCM plaster lining modifies the heat flux densities that enter through the walls during the day and leave it at night.
The effect of the plaster lining manifests itself in that part of the heat flux transmitted through the original wall build-up, which is absorbed by the lining applied to the side walls, so that only the remaining portion reaches the interior of the model house. (An analogous issue is the influence of the PCM plaster on the heat flux leaving the model house through the walls during night-time cooling: only a fraction of the heat flux leaving through the original wall structure originates from the indoor air, while the remainder is provided by changes and release of sensible and latent heat associated with the cooling of the plaster lining.)
In both time periods, this mechanism attenuates and simultaneously delays the temperature fluctuations in the interior of the house (for a detailed discussion, see our previous publications [32,33]).
Over the course of the day, the quasi-periodic variation in the exterior wall surface temperature, together with the interior surface temperature, determines in a time-dependent manner the heat fluxes and corresponding flux densities across the cross-sections of the model house envelope (side walls, roof, and floor).
During daytime warming, the PCM plaster increases the heat flux density through the original wall structure, because its thermal inertia and the possible melting of the PCM exert a cooling effect on the inner wall surface. This leads to a larger temperature difference between the exterior and interior wall surfaces and thus to a higher heat flux density. At the same time, the PCM plaster absorbs heat, so a substantial part of this increased heat flux density does not reach the indoor air volume; in other words, the PCM plaster attenuates indoor temperature swings and lowers the peak indoor temperature.
During night-time cooling, the situation is reversed: owing to the thermal inertia of the PCM plaster and the possible release of latent heat, it slows the cooling of the inner wall surface, which therefore remains warmer than the cold exterior wall surface. As a result, a larger temperature drop occurs across the wall cross-section, slightly increasing the heat flux density in the house with PCM plaster. Despite this somewhat higher heat flux density, the interior of the PCM model house does not cool more than in the house without the plaster lining, because the excess heat flux density is supplied by heat released from the PCM plaster. In fact, the PCM plaster moderates the cooling of the indoor space.
A rigorous comparison of the two model houses—namely, the reference house with the original wall build-up and the PCM house lined with a gypsum plaster containing PCM microcapsules—in terms of heat flux density is only possible if we compare characteristic heat fluxes that occur during periods when the heat content of the original wall structure practically does not change (neither increases nor decreases). No such constraint is imposed on the PCM-containing plaster attached to the inner wall surface; its temperature, and thus its sensible and latent heat content, may vary in response to the incoming and outgoing heat flux. Under these conditions, the interaction between the heat flux densities transmitted through the original wall structure and those associated with the PCM-containing plaster lining can be evaluated.
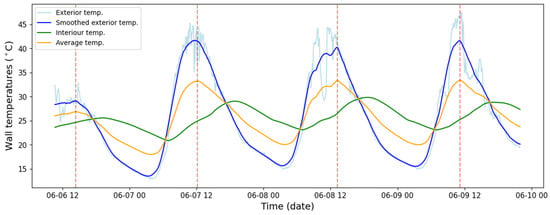
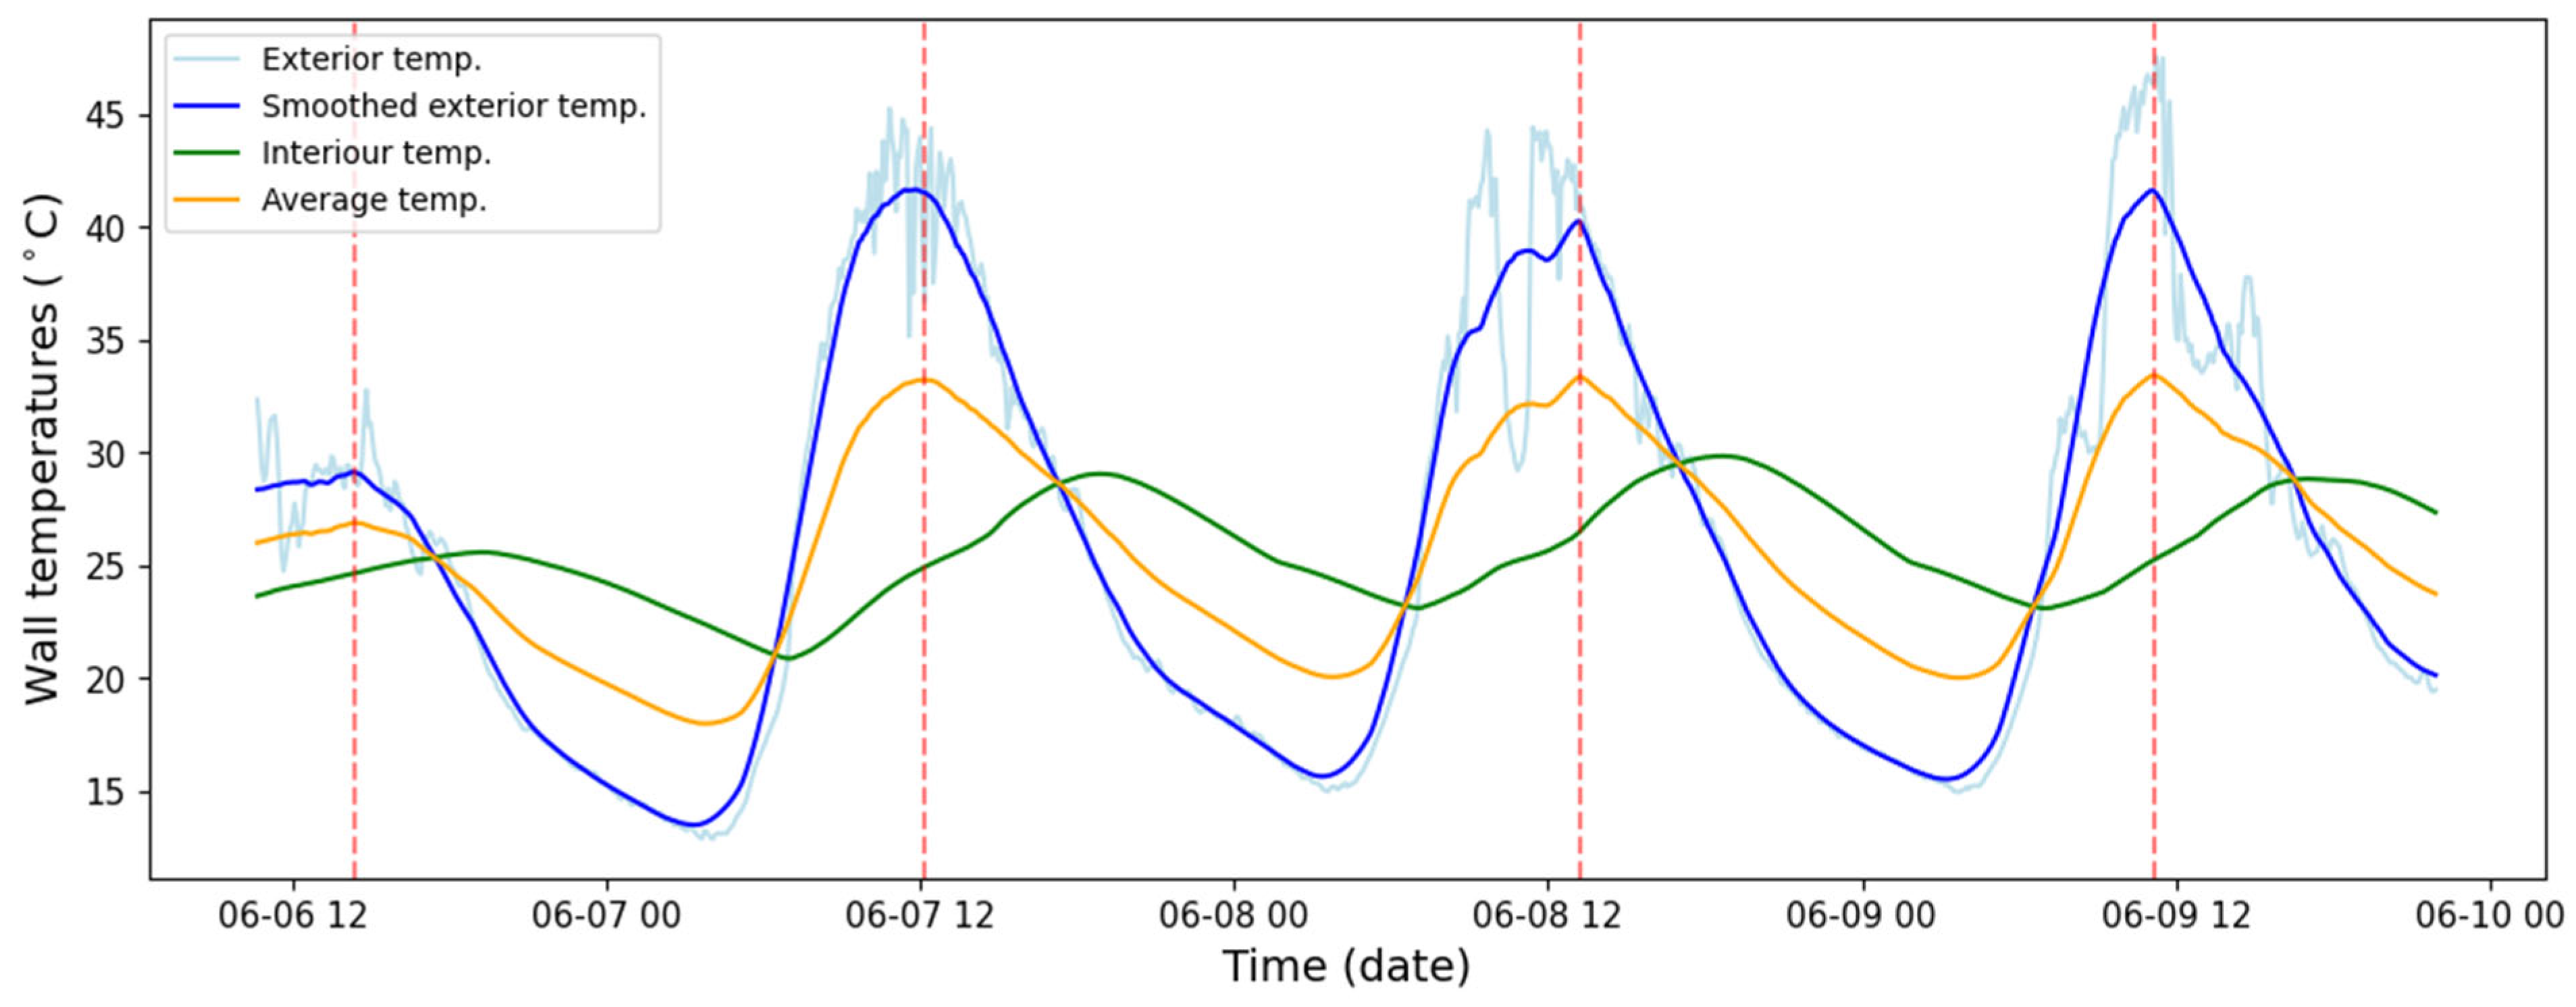
Within a typical day, there are two time intervals in which these conditions are satisfied, that is, when the average temperature and the sensible heat of the wall structures under consideration remain practically constant: a relatively short daytime interval when the average wall temperature reaches a maximum as a function of time, and a night-time interval when the average wall temperature attains a minimum. Our measurements show that these intervals are of appreciable duration—up to roughly one hour—and can therefore be identified reliably (Figure 2).
Figure 2.
Exterior, interior and calculated average temperatures in PCM model houses—The light blue curve shows the raw exterior temperature, the dark blue curve its smoothed form, and the dashed red lines the maxima of the calculated average temperature.
For a homogeneous wall structure (i.e., when the material and specific heat capacity of the wall are uniform across the cross-section), the average temperature is straightforward to determine: it is equal to the arithmetic mean of the exterior and interior wall surface temperatures.
Variations in the exterior wall temperatures strongly influence the interior wall surface temperatures. However, this relationship can be substantially modified by the thermal resistances opposing the heat fluxes within walls of given thickness and multilayer build-up, by changes in the heat content of the wall (changes in sensible heat content and, in the case of the house equipped with a PCM lining, in latent heat content), and by the temporal dynamics of daily heating and cooling. In addition, the evolution of the interior wall temperatures is significantly affected by the interaction of the various interior bounding surfaces, mediated by the indoor air. The latter exerts a certain equalizing effect, particularly in the model houses used in the experiments, whose volume is relatively small (approximately 18 m3).
The substantially lower interior wall temperatures indicate that only a small fraction of the heat flux entering through the exterior wall surfaces actually reaches the indoor air, while a large proportion is used to heat up the wall assemblies and, in the houses with PCM plaster, to melt a portion of the phase change material (i.e., to absorb latent heat). During the night-time hours, the amount of heat leaving through the exterior surfaces corresponds primarily to the cooling of the wall structure, and only a certain fraction is associated with the cooling of the indoor air. This—particularly in the case of the house with PCM plaster—manifests itself as a moderation of the cooling of the indoor space.
2.5. Estimation of Characteristic Heat Flux Density
To approximate the heat transfer across individual envelope elements at key points in the diurnal cycle, a simplified estimate of characteristic heat flux density (qx,s) was calculated based on the previously defined characteristic temperature difference (ΔTx,s).
The heat flux density was computed assuming quasi-steady-state, one-dimensional heat conduction through each opaque surface using the standard form of Fourier’s law:
where:
- qx,s is the estimated heat flux density through surface x at the time of interest (in W/m2);
- ΔTx,s is the characteristic temperature difference between the external surface and the internal reference (in °C);
- Rx is the thermal resistance of the respective envelope element (in m2K/W), computed from the known layer structure.
Thermal resistance values (Rx) were derived from the design specifications of each component (walls, floor, roof), assuming identical geometry and material properties for both the PCM and reference houses. The PCM layer was treated as part of the internal wall lining but did not significantly affect Rx due to its low thickness and high heat capacity rather than low conductivity.
Characteristic heat flux densities were computed separately for daytime and night-time characteristic times for each orientation. This enabled clear comparison of the following:
- The direction and magnitude of heat exchange between each surface and the indoor environment;
- The influence of solar exposure on the outer surface;
- The modifying effect of internal PCM layers.
Although this method does not capture the full dynamic behavior of heat flow or latent heat exchange, it provides a robust comparative framework for evaluating surface-level thermal interactions based on measured data. It also highlights apparent contradictions—such as increased estimated flux in PCM cases—arising from the time lag and buffering effect of latent heat storage. In contrast to a volumetric mean temperature concept for homogeneous slabs, the present work defines characteristic quantities directly from the orientation-wise averaged exterior and interior surface temperatures (computed from multiple sensors per side, typically 2–3) for subsequent ΔT and q evaluation.
3. Results and Discussion
3.1. Daily Temperature Fluctuation Patterns
The external surfaces of the model houses exhibited pronounced diurnal temperature fluctuations with clear orientation-dependent behavior. The west- and south-facing walls showed the highest average daily maximum surface temperatures, while the north wall and the floor remained the coolest throughout the spring period. The roof displayed intermediate behavior, but with the strongest night-time cooling due to its direct view of the sky. The relatively low temperature levels and modest daily amplitudes observed at the floor are consistent with its weaker exposure to solar radiation and stronger thermal coupling to the ground, which also explains why the PCM layer has a less pronounced visible impact there than on sun-exposed vertical façades.
Internal surfaces responded more slowly and with damped amplitudes compared to external surfaces. In the PCM house, the internal wall surfaces showed reduced daily temperature amplitudes and a slight delay in the time of peak temperatures, indicating the buffering effect of latent heat storage in the PCM plaster. This damping was especially visible for the west-facing wall and the roof, which were subjected to the highest afternoon solar gains.
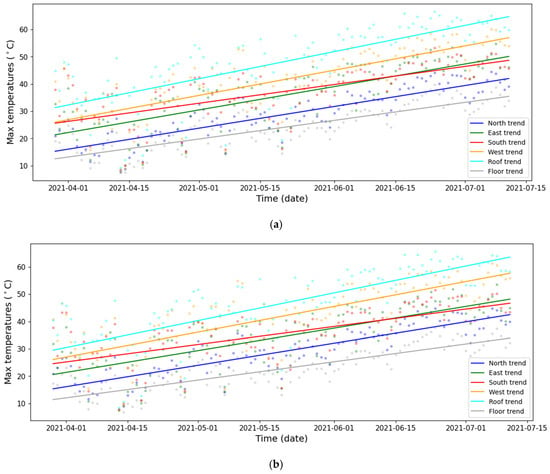
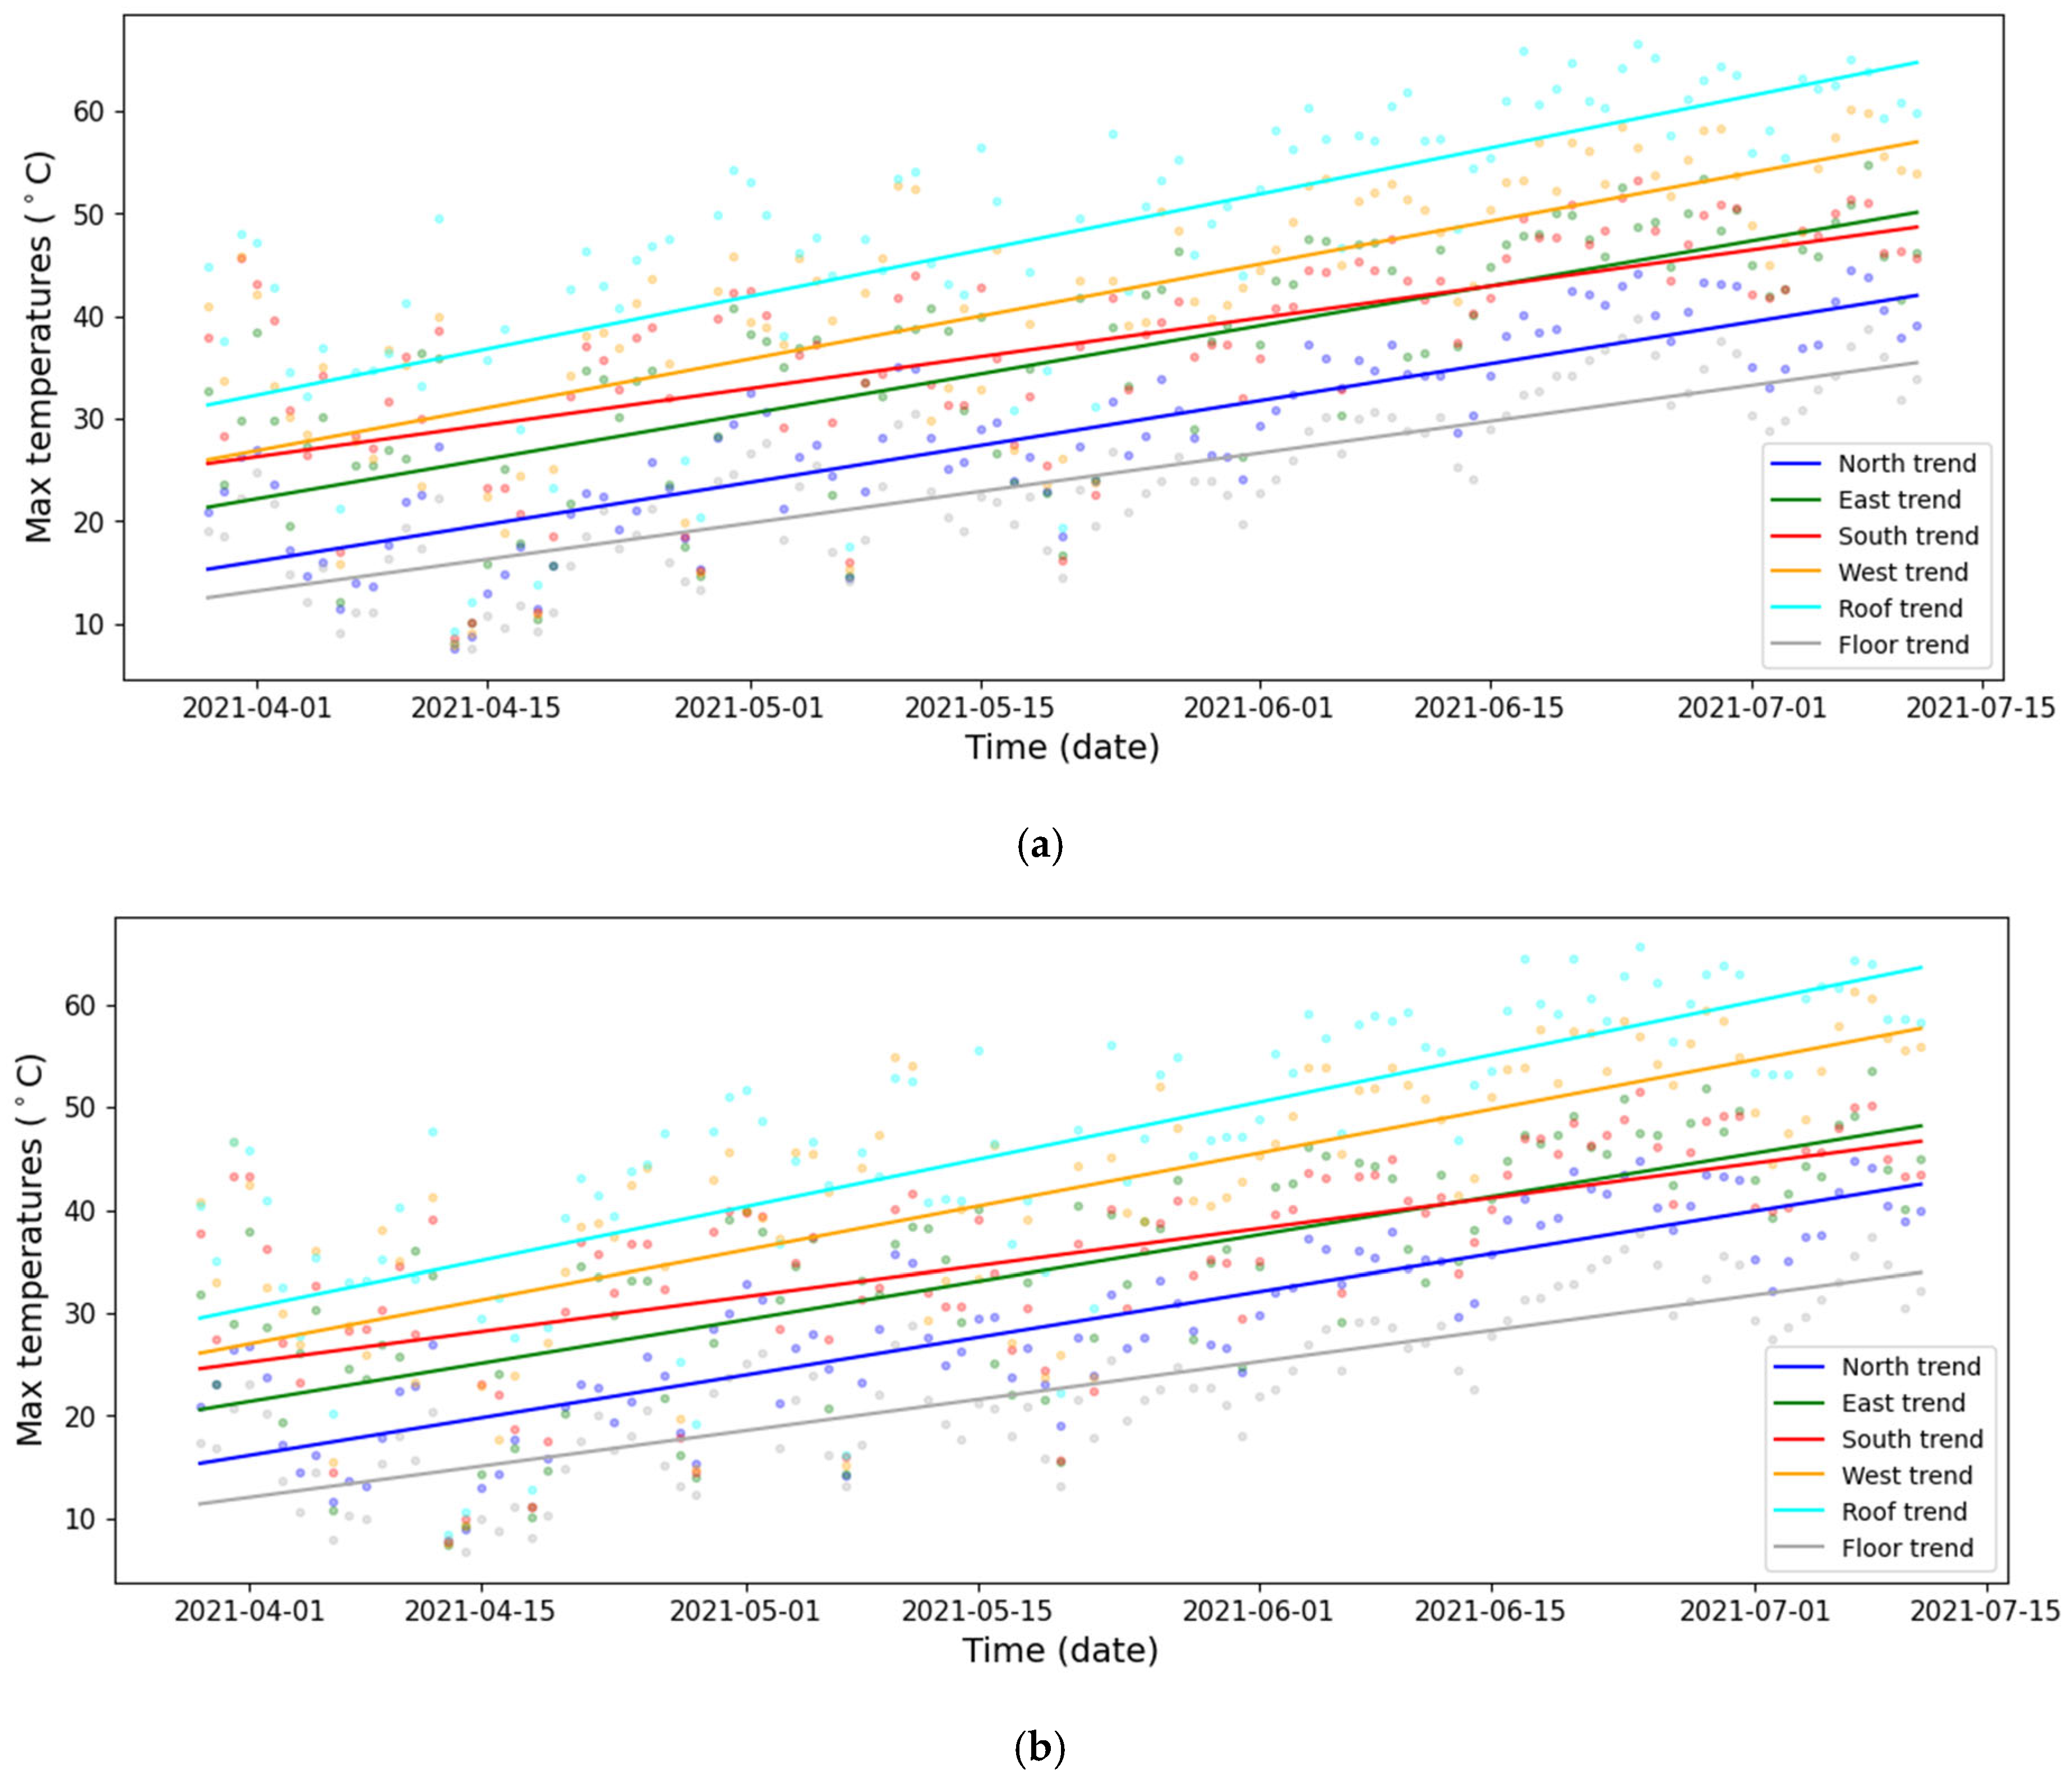
Over the spring measurement period, the trends and deviations in the differing effects of the various wall orientations can be followed most clearly by examining the changes in the daily maximum temperatures of their external surfaces. Figure 3a,b show the daily maxima of the external surface temperatures for each orientation in the reference and PCM houses. Similar trend lines are expected, as both houses were exposed to the same weather conditions and shared the same structural configuration, while the PCM layer was applied on the internal side. Accordingly, these figures are used to establish the orientation-dependent hierarchy and seasonal evolution of external thermal loading under controlled exposure. The quantitative PCM–reference differences are evaluated in the subsequent analysis using orientation-specific characteristic temperature differences and their variability.
Figure 3.
(a) Daily maximum surface temperatures by orientation with trendlines for PCM House. (b) Daily maximum surface temperatures by orientation with trendlines for reference house.
3.2. Long-Term Trends and RMSE Analysis
Over the full spring monitoring period, the daily maximum external surface temperatures showed a general upward trend, reflecting the seasonal progression towards warmer conditions. This trend was strongest on the south- and west-facing walls, where solar exposure increasingly dominated surface heating, while the north wall and floor showed much more moderate changes. The roof followed seasonal warming, but its daily behavior remained strongly influenced by radiative cooling and variable sky conditions.
To quantify the variability around these seasonal trends, the root mean square error (RMSE) of daily maximum surface temperatures from their linear trendline was computed for each orientation. The roof exhibited the highest RMSE in both houses, highlighting its strong sensitivity to short-term weather fluctuations, such as intermittent cloud cover and radiative cooling at night. Among the vertical walls, the west-facing surface generally had the largest RMSE values, indicating stronger day-to-day variations in solar load. The floor, in contrast, showed relatively low RMSE values, in line with its more stable thermal environment and limited direct solar influence (Table 1).
Table 1.
RMSE of daily maximum surface temperatures for all orientations.
Comparing the two houses, the PCM configuration consistently showed lower RMSE values for internal surfaces, particularly on the west wall and roof, confirming the PCM’s role in reducing daily fluctuation intensity. When the RMSE of the outer–inner surface temperature difference was considered, the PCM house also showed reduced variability, suggesting a more stable thermal gradient across the wall due to the PCM’s buffering effect. These long-term statistical indicators underline that the PCM plaster not only affected individual days but also improved the robustness of the envelope’s thermal response over an entire season.
3.3. Estimation of Heat Fluxes Entering and Leaving Model Houses
The exterior and interior surface temperatures, the temperature profiles developing across the wall cross-sections, and the heat fluxes passing through specific surfaces (e.g., exterior and interior) varied from moment to moment and from location to location in the model houses under free-running conditions. Determining these quantities would require highly complex dynamic simulations with verification at many more measurement points, particularly because the model houses investigated had envelope surfaces with different orientations, geometries and layer configurations.
At the same time, at least part of this type of information is required, even if only at an approximate level, for example to decide on which envelope surfaces and with what distribution the phase change heat storage material should be applied.
In principle, the heat flows entering through the exterior surfaces with different orientations could be estimated using the heat loss coefficients specified for the individual walls, the wall area, and the temperature difference between the exterior and interior wall-surface temperatures:
where Qw is the heat flow entering through the given wall (W), Aw is the wall surface (m2), Uw is the heat transfer (heat loss) coefficient of the wall (W/m2K), and ΔT is the temperature difference across the wall. This relationship, however, can be applied without difficulty only under steady-state conditions, when it is assumed that the heat flow entering on one side of the wall is equal to the heat flow leaving on the other side. It is also assumed that neither the exterior and interior surface temperatures nor the temperature profile within the wall change with time; in other words, during the process, no part of the heat flow entering or leaving on either side of the wall is used to change the sensible or latent heat content of the wall.
Qw = Aw × Uw × ΔTw
By introducing the characteristic temperature difference ΔTcar, this condition is almost satisfied from an engineering point of view, because in its evaluation the mean wall temperature changes only negligibly in the vicinity of its maximum. Consequently, the sensible heat content of the original wall structure (between the exterior surface and the interior decorative board or PCM plaster) remains approximately constant.
The heat flux densities refer to a unit wall area; therefore, the area Aw does not appear in their formula.
Qchar = Uw × ΔTcar
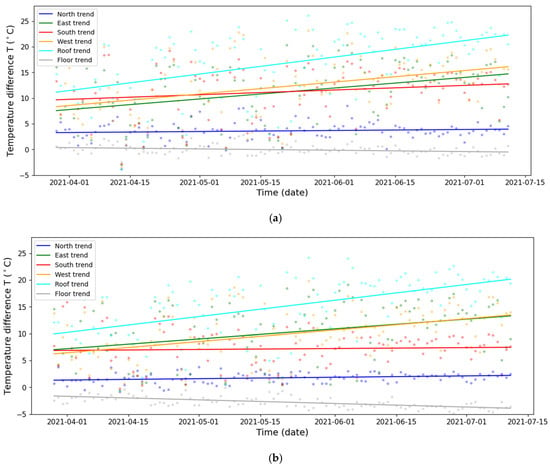
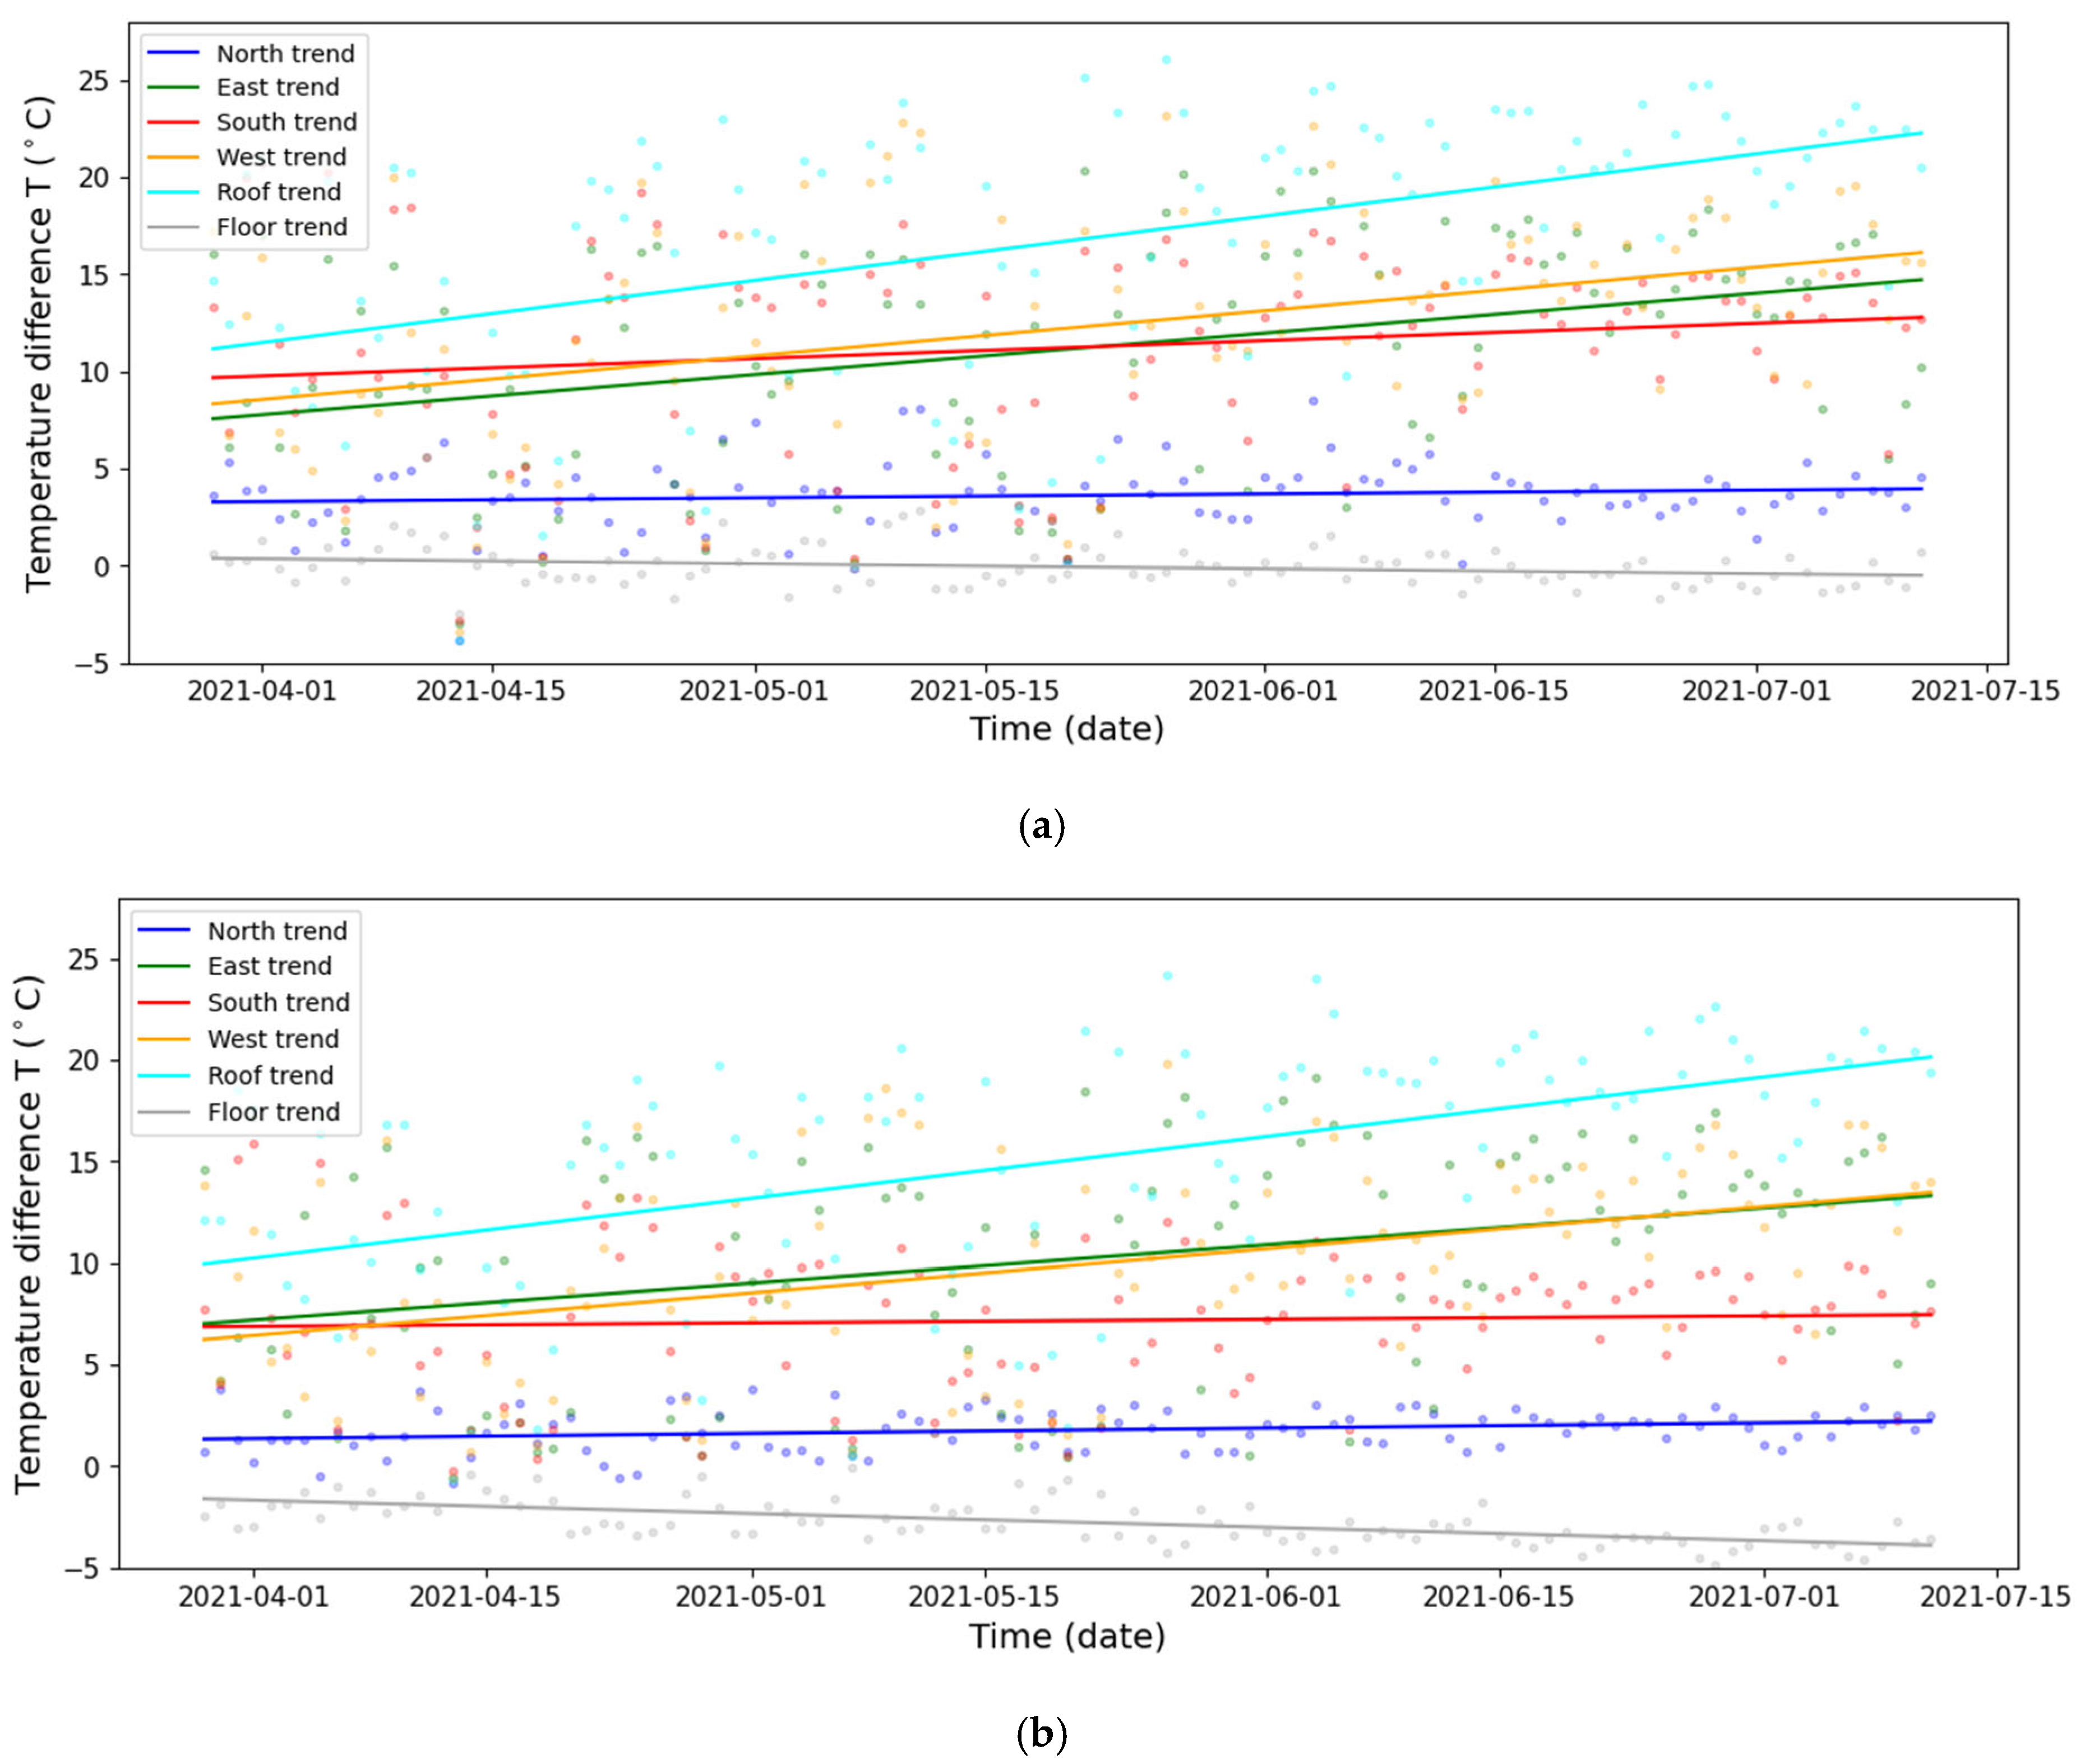
In the case of the model houses examined here, this situation generally did not exist, since the temperatures on both the entering and leaving sides and along the wall cross-section varied continuously. During a given day, however, there were two short time intervals when the conditions were at least partially favorable in the sense that the temperature profile across the cross-section became more or less steady for a short period. Such a state occurred at the times of the wall surface temperature maxima and minima (Figure 4a,b).
Figure 4.
(a) Outer–inner surface temperature differences with trendlines for the PCM house. (b) Outer–inner surface temperature differences with trendlines for the reference house.
3.4. Characteristic Temperature Differences and Heat Flux Densities
Using the concept of characteristic temperature difference defined in Section 2.4, daytime and night-time characteristic temperature differences (ΔTx,s) were derived for each envelope element and for both houses. These were evaluated at moments when the average internal wall surface temperature reached its daily maximum (daytime) and daily minimum (night-time).
The resulting ΔTx,s values showed a clear orientation dependence. During the day, the largest positive characteristic temperature differences were found on the west and south surfaces, consistent with their higher solar exposure. At night, the roof and, to a lesser extent, the floor showed distinct behavior, with the roof cooling rapidly and sometimes becoming cooler than the internal reference, reversing the sign of ΔTx,s. This highlights the different thermal behavior for vertical façades, the roof and floor over the diurnal cycle.
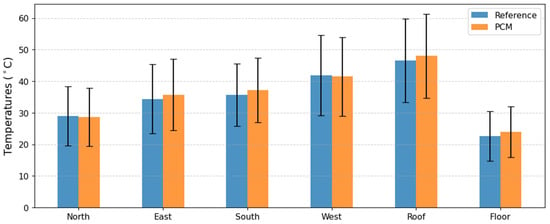
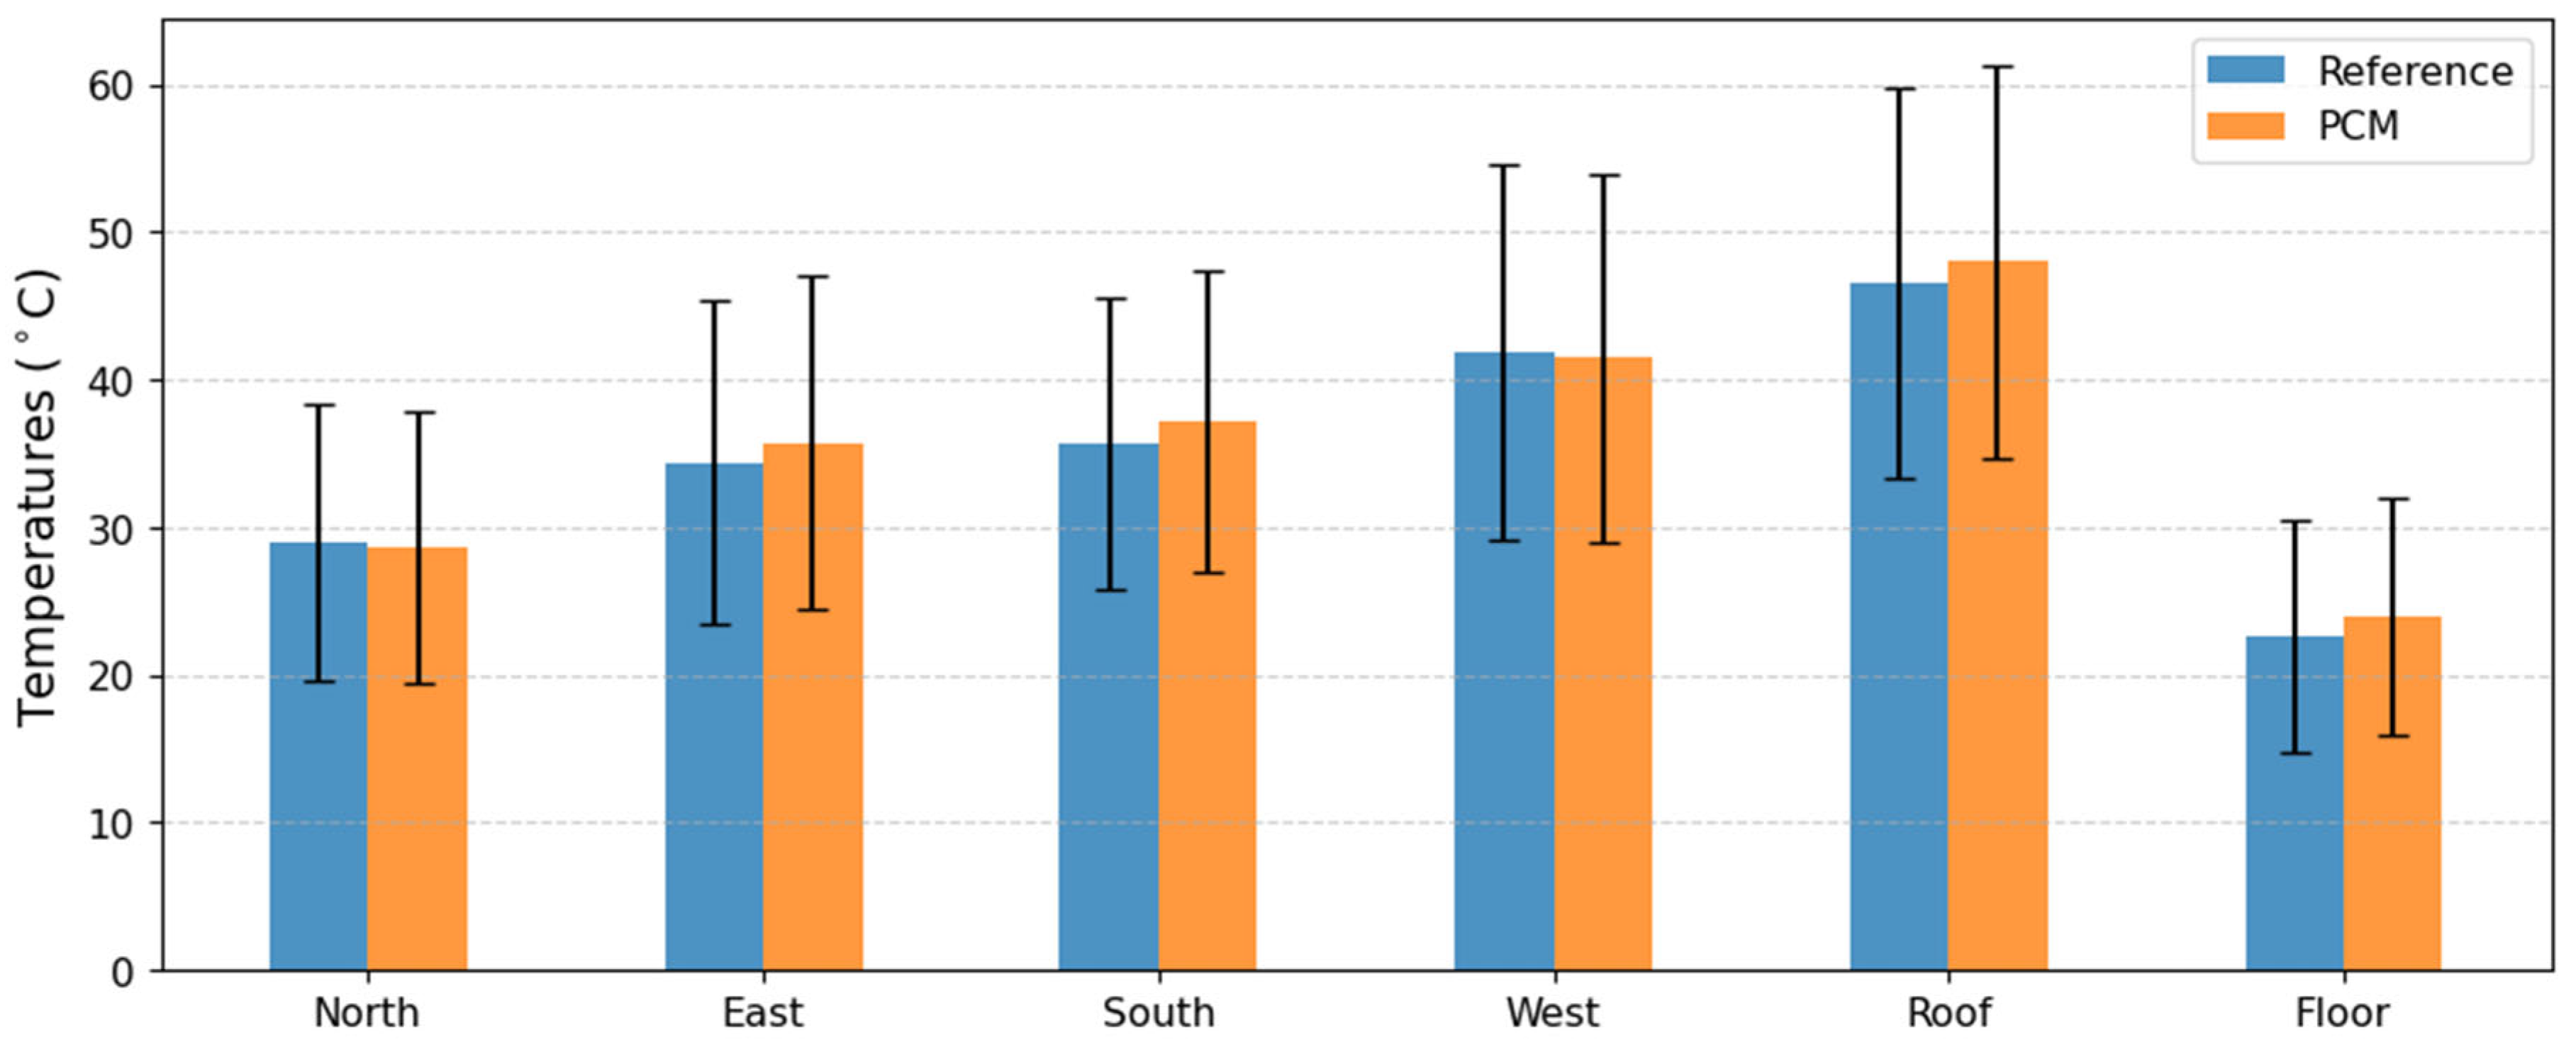
The average exterior wall temperatures were practically identical in all six orientations (Figure 5), indicating that the application of the PCM lining had little influence on the maximum exterior temperatures of the ceiling and floor. However, there were substantial orientation-dependent differences. The scatter bands shown in the figures are not error bars; rather, they represent the magnitude of long-term, trend-like variations. The short-term natural fluctuations were smaller than these (see the dispersion of the data points around the trend lines). The mean values of the temperature maxima, in increasing order, were observed as follows: floor–north–east–south–west–roof.
Figure 5.
Comparison of average outside wall temperatures between the two model houses over the entire 105-day period—at temperature maxima.
A similar description can be given for the minima, but in this case the long-term trends deviated much more strongly from the mean. There, the average values showed that the roof cooled the most, followed by the exterior wall surfaces, while the exterior surface of the floor exhibited the smallest temperature drop.
When comparing the reference and PCM houses, the characteristic temperature differences generally indicate steeper external-to-internal gradients for the PCM walls during daytime peaks, especially on the west façade and the roof. This reflects how the PCM layer absorbed heat and kept the internal surface cooler, thereby increasing the temperature difference across the wall at the characteristic time.
Assuming quasi-steady-state heat conduction, these characteristic temperature differences were then used to estimate characteristic heat flux densities (qx,s). For daytime peak conditions, the PCM house frequently exhibited higher estimated heat flux density from outside to inside compared to the reference house, particularly for the most sun-exposed orientations. This was a direct consequence of the cooler internal surface maintained by the PCM, which increased the instantaneous driving temperature difference across the wall.
However, this higher estimated flux was not translated into higher indoor thermal stress. On the contrary, due to the PCM’s storage and delayed release of heat, the internal exposure to peak heat is reduced and shifted in time. Night-time characteristic fluxes often showed lower or even reversed heat transfer direction, especially as the PCM released stored heat more gradually after sunset. In this sense, the characteristic flux approach reveals the apparently paradoxical situation highlighted in the Section 1: a PCM layer can increase the instantaneous external-side driving potential while still contributing to a net reduction and redistribution of heat load on the inner side (Figure 5).
The diurnal flux patterns underline that the PCM redistributes heat flow over time rather than simply blocking it. Peak values are reduced or time-shifted on the room side, while the external side experiences more concentrated gradients during high solar load periods. These empirical findings provide a physically interpretable dataset that can serve as a benchmark for validating orientation-sensitive PCM simulations reported in previous numerical studies.
3.5. Orientation-Dependent PCM Effect and Overall Performance
The analysis of characteristic fluxes and their daily evolution demonstrated that wall orientation strongly modulated PCM performance. The west-facing wall benefited most from the PCM layer in terms of reduced internal peak temperature rise and delayed heating, owing to the strong afternoon solar gains during the spring period. The south-facing wall also showed clear advantages, while the north-facing wall and the floor exhibited smaller PCM-related differences, consistent with their lower solar load and, in the case of the floor, its more stable boundary conditions.
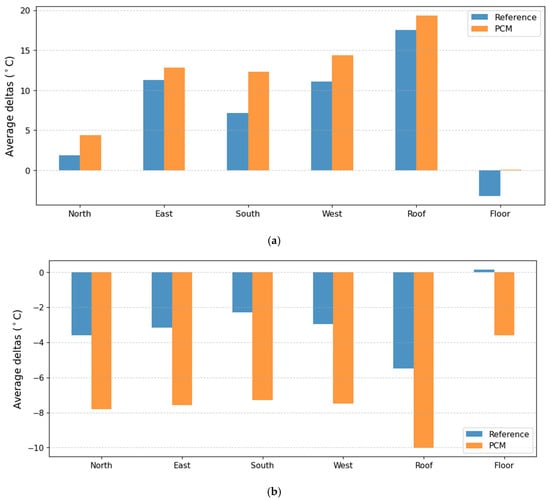
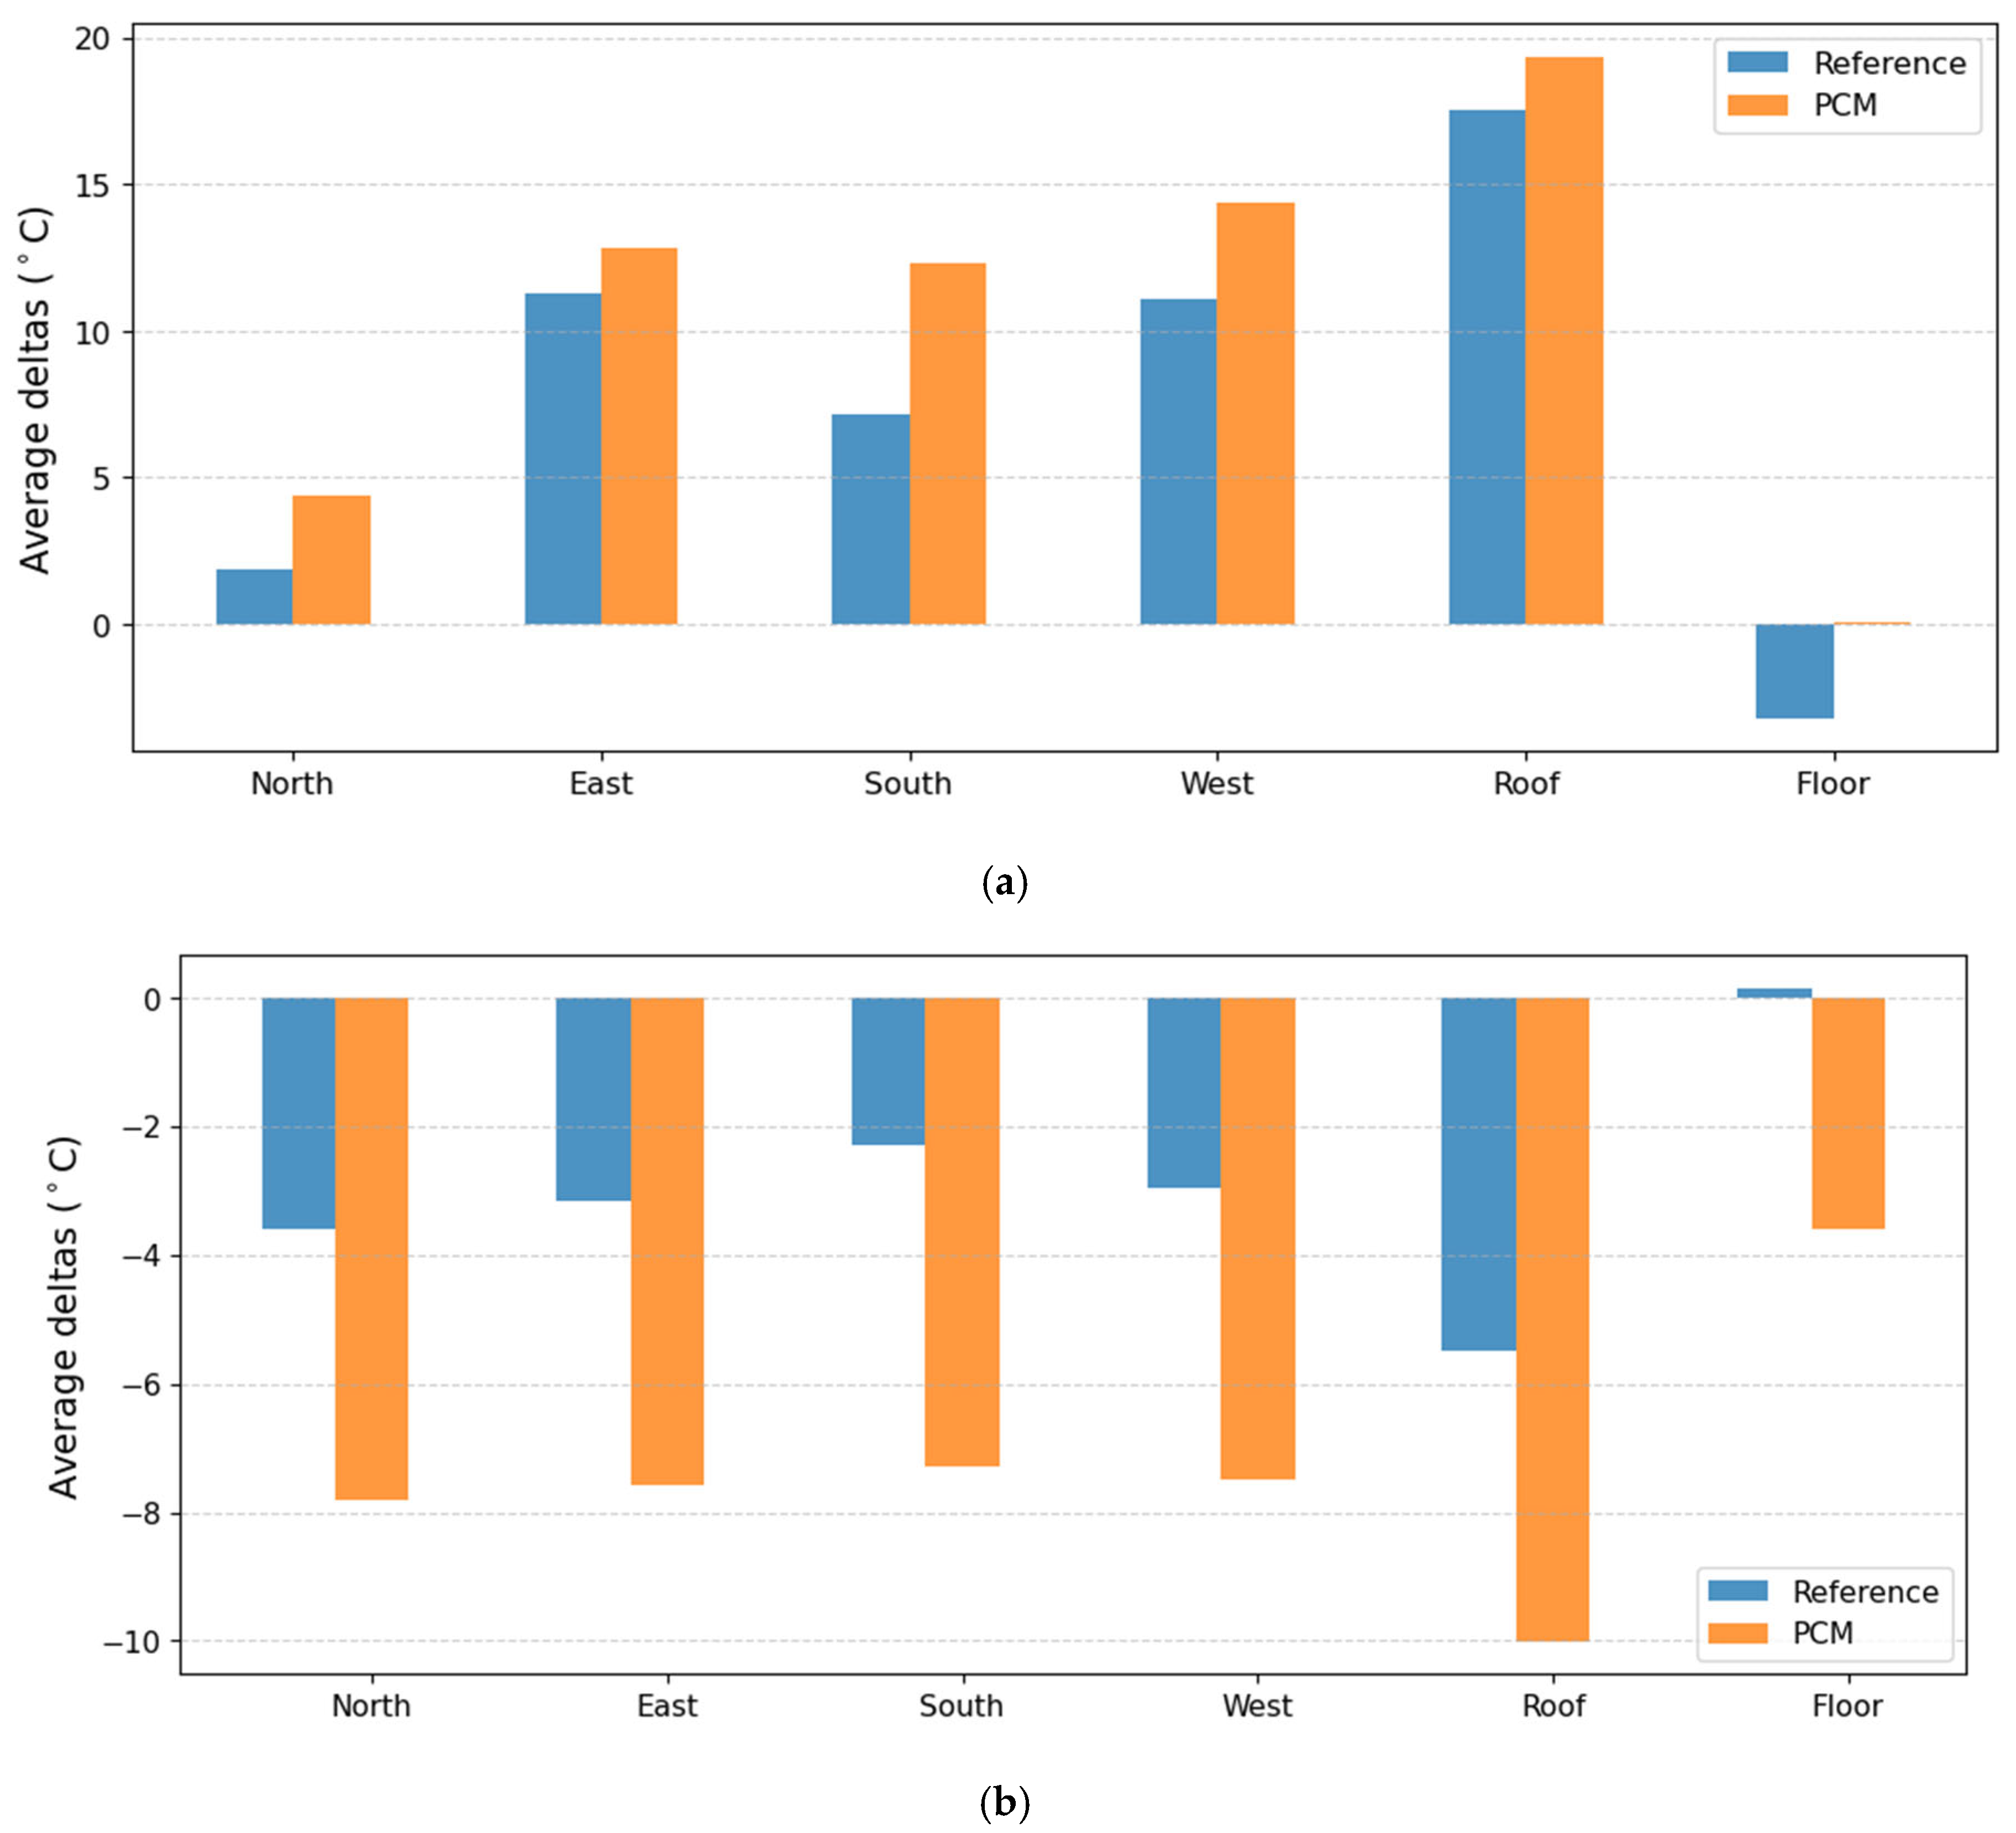
When focusing on the daily maximum heat flux densities, the PCM house generally showed lower maximum values at the internal side compared to the reference configuration for the most exposed orientations (Figure 6a). Even though characteristic external flux estimates could be higher for PCM walls at certain moments, this was compensated by lower and later indoor load peaks, which was more relevant from a comfort and HVAC demand perspective. From a design standpoint, the results indicate that the largest benefits of PCM integration could be expected on west- and south-facing façades and the roof, while the impact on the floor and north façade was more modest.
Figure 6.
(a) Comparison of the average characteristic wall temperature difference (ΔTcar) between the two model houses over the entire 105-day period—at temperature maxima. (b) Comparison of the average characteristic wall temperature difference (ΔTcar) between the two model houses over the entire 105-day period—at temperature minima.
Using a similar calculation procedure, the characteristic temperature difference associated with the minimum temperatures can also be determined for each day of the entire 105-day period. This, in turn, allows the heat flux corresponding to the minimum temperatures to be compared for both houses and for each envelope surface (walls, roof, floor) (Figure 6b).
According to the diagram, on each envelope surface—that is, on the north, east, south and west façades, as well as through the roof and the floor—a larger characteristic temperature difference occurred in the model house with the PCM plaster lining during those daytime hours when the mean temperature of the given wall reached its maximum. In the case of the floor, the daytime characteristic temperature difference in the reference house was negative, so the floor cooled the interior of the house, whereas in the PCM house it was practically zero; consequently, it was larger than in the reference house.
The difference between the two model houses, in terms of the characteristic temperature difference arising in their wall constructions, was substantial.
It can be seen that in the house with the PCM plaster lining, the estimated heat fluxes were always higher than those in the reference house. At first sight, this could seem to contradict the statement that the PCM plaster lining provided thermal protection for the house against overheating or overcooling.
This apparent contradiction is resolved by noting that the heat fluxes are always estimated across the cross-section of the original wall structure, i.e., between the exterior steel frame and the interior decorative board.
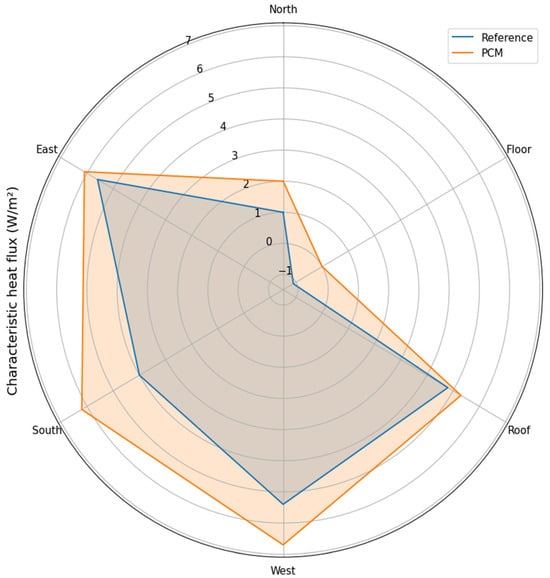
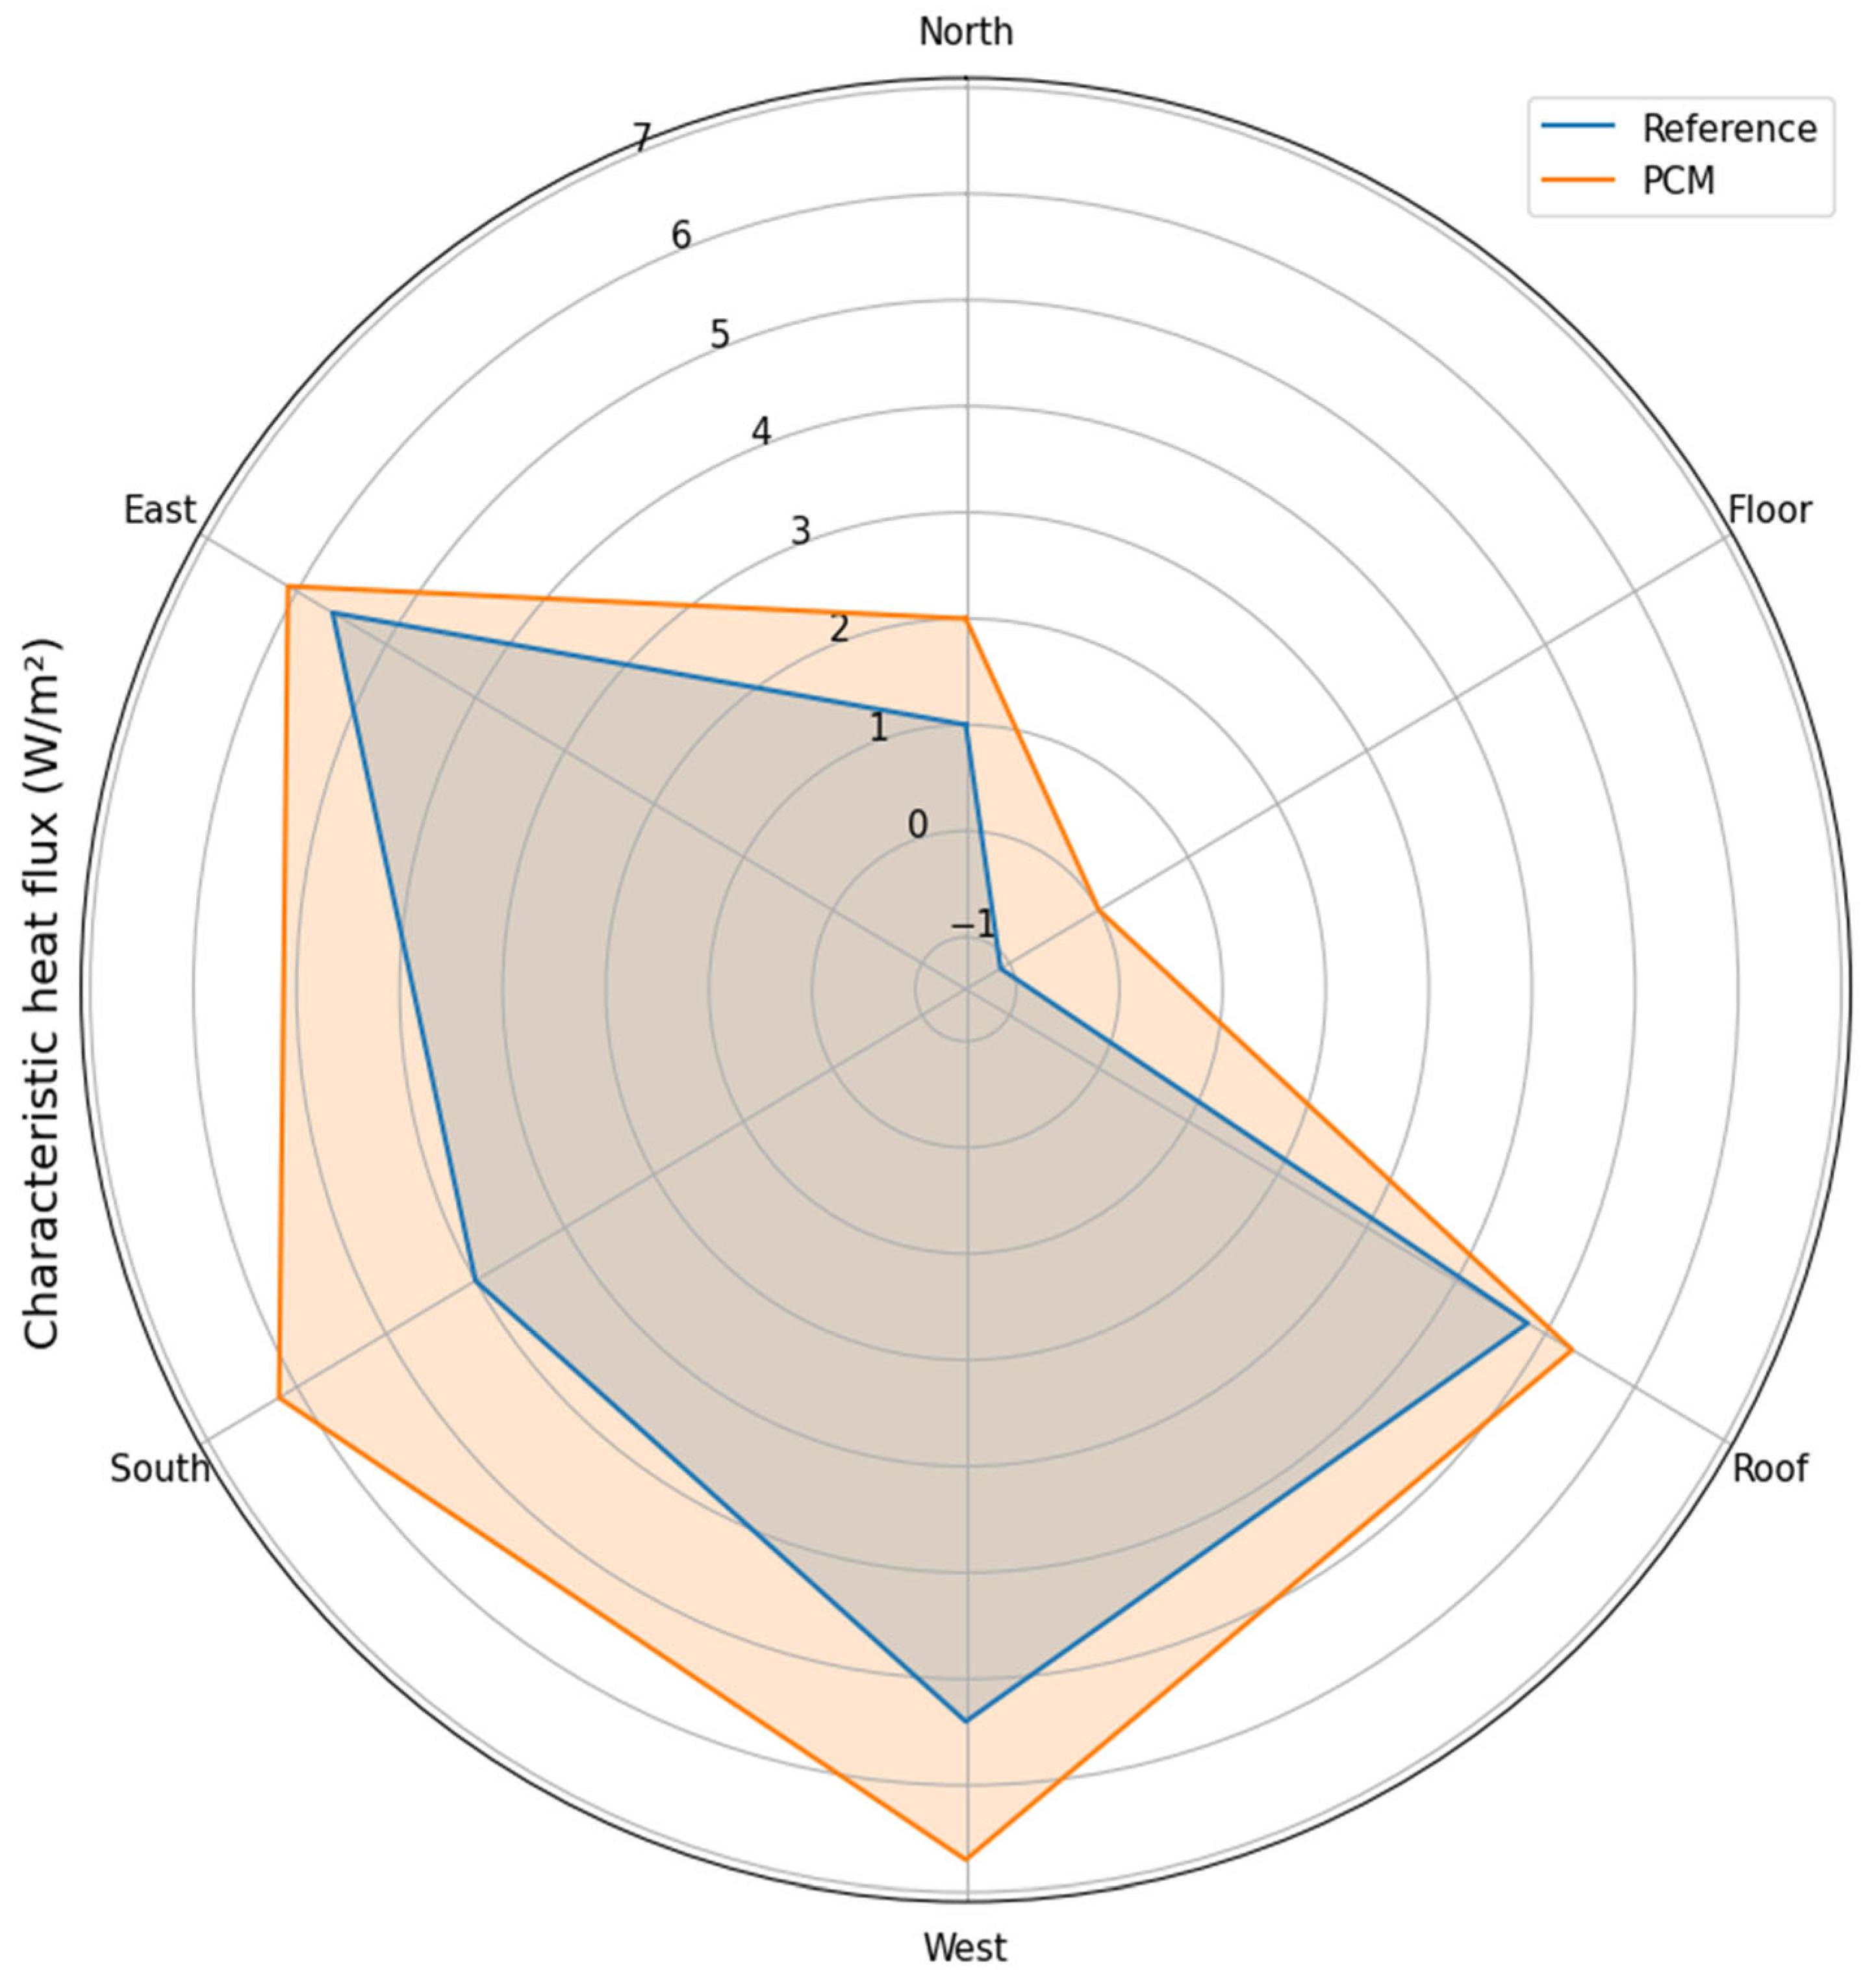
It means that a significant fraction of this heat flux does not reach the inner surface of the plaster layer, because the plaster and its PCM content absorb more heat entering through the exterior surface As shown in Section 3.3, by introducing the characteristic temperature difference ΔTcar, the process can be regarded as quasi-stationary from an engineering point of view because in its evaluation the mean wall temperature changes only negligibly in the vicinity of its maximum. Consequently, the sensible heat content of the original wall structure (between the exterior surface and the interior decorative board or PCM plaster) remains approximately constant. The characteristic heat fluxes for each orientation can therefore be calculated by multiplying ΔTcar by the specified overall heat transfer coefficients (Uw) of the individual wall elements of the mobile houses, which are known and have been verified by the authors through calculations using (3). The result of this calculation is shown in Figure 7.
Figure 7.
Characteristic heat quantities for each orientation in individual model houses.
4. Conclusions
- Orientation controlled the magnitude and exposure of exterior peak surface temperatures, with the most pronounced effects concentrated on the roof and the west-facing façade.
- The roof and west façade exhibited the highest day-to-day variability in daily maxima, identifying them as the most transiently loaded and therefore most responsive targets for latent heat storage.
- The PCM lining reduced short-term room-side thermal swings by attenuating internal surface temperature peaks and delaying their occurrence, improving temporal stability of the indoor-facing surfaces.
- The strongest PCM benefits occurred for west-facing and roof elements, consistent with frequent and intense late-day solar forcing that promotes effective activation of sensible/latent storage.
- Larger instantaneous external–internal temperature gradients can coincide with improved indoor moderation, because the PCM layer functions as a dynamic heat sink that temporarily absorbs part of the transmitted energy.
- Overall, the system redistributes heat transfer in time—trimming and delaying peaks—rather than materially lowering exterior peak temperatures.
- Practically, the results support orientation-prioritized PCM deployment (west/south façades and roof first) to maximize the benefit per treated area in lightweight envelopes.
- Further work should also evaluate external-side PCM placement (PCM located on or near the outer wall surface), which may offer additional thermodynamic advantages by intercepting solar-driven heat earlier in the transfer path, enhancing peak load suppression, and potentially improving the coupling between radiative gains and latent heat storage. Consistent with prior studies, a combined strategy—e.g., PCM plus an exterior reflective surface—is recommended to prevent the higher heat flux reaching the PCM under large outdoor–indoor temperature differences. In practice, the more exposed exterior façades should be protected with a reflective coating to reduce incident solar gains and thereby limit PCM loading.
The full-season measurements indicate that façade orientation strongly affected the thermal loading of the envelope, with the roof and west-facing surfaces showing the most pronounced and variable responses under spring weather. Compared with the reference case, the PCM plaster configuration produced a more moderated internal surface-temperature behavior, with the most evident improvements on the most solar-exposed elements. Overall, this study supports the conclusion that PCM plaster can improve the thermal performance of lightweight envelopes in real outdoor conditions, but its effectiveness is orientation-dependent and should be prioritized accordingly.
Author Contributions
Conceptualization: M.F. and J.G.; methodology: M.F. and J.G.; software: M.F. and B.N.; validation: M.F. and B.N.; resources: T.F.; data curation: M.F. and B.N.; writing—original draft preparation: M.F.; writing—review and editing: J.G. and T.F.; visualization: M.F. and B.N.; supervision: T.F.; project administration: T.F.; funding acquisition: T.F. All authors have read and agreed to the published version of the manuscript.
Funding
This work was funded by the 2020-1.1.2-PIACI-KFI-2021-00287 project provided by the National Research, Development and Innovation Fund of Hungary.
Data Availability Statement
Research data are available to interested researchers upon request.
Acknowledgments
The cooperation and support of Thermofoam Ltd. (Felsőpakony, Hungary) is greatly acknowledged.
Conflicts of Interest
The authors declare no conflicts of interest.
References
- Carlucci, F.; Cannavale, A.; Triggiano, A.A.; Squicciarini, A.; Fiorito, F. Phase Change Material Integration in Building Envelopes in Different Building Types and Climates: Modeling the Benefits of Active and Passive Strategies. Appl. Sci. 2021, 11, 4680. [Google Scholar] [CrossRef] [Scilit]
- Kuznik, F.; David, D.; Johannes, K.; Roux, J.-J. A review on phase change materials integrated in building walls. Renew. Sustain. Energy Rev. 2011, 15, 379–391. [Google Scholar] [CrossRef] [Scilit]
- Sun, X.; Medina, M.A.; Zhang, Y. Potential Thermal Enhancement of Lightweight Building Walls Derived from Using Phase Change Materials (PCMs). Front. Energy Res. 2019, 7, 13. [Google Scholar] [CrossRef] [Scilit]
- Kishore, R.A.; Bianchi, M.V.A.; Booten, C.; Vidal, J.; Jackson, R. Parametric and sensitivity analysis of a PCM-integrated wall for optimal thermal load modulation in lightweight buildings. Appl. Therm. Eng. 2021, 187, 116568. [Google Scholar] [CrossRef] [Scilit]
- Mahmoud, M.; Yousef, B.A.A.; Radwan, A.; Alkhalidi, A.; Abdelkareem, M.A.; Olabi, A.G. Thermal assessment of lightweight building walls integrated with phase change material under various orientations. J. Build. Eng. 2024, 85, 108614. [Google Scholar] [CrossRef] [Scilit]
- Plytaria, M.T.; Tzivanidis, C.; Bellos, E.; Alexopoulos, I.; Antonopoulos, K.A. Thermal behavior of a building with incorporated phase change materials in the south and the north wall. Computation 2019, 7, 2. [Google Scholar] [CrossRef] [Scilit]
- Liu, Z.; Hou, J.; Wei, D.; Meng, X.; Dewancker, B.J. Thermal performance analysis of lightweight building walls in different directions integrated with phase change materials (PCM). Case Stud. Therm. Eng. 2022, 40, 102536. [Google Scholar] [CrossRef] [Scilit]
- Akeiber, H.J.; Wahid, M.A.; Hussen, H.M.; Mohammad, A.T. Review of Development Survey of Phase Change Material Models in Building Applications. Sci. World J. 2014, 2014, 391690. [Google Scholar] [CrossRef] [Scilit]
- Lee, K.O.; Medina, M.A.; Raith, E.; Sun, X. Assessing the integration of a thin phase change material (PCM) layer in a residential building wall for heat transfer reduction and management. Appl. Energy 2015, 137, 699–706. [Google Scholar] [CrossRef] [Scilit]
- Zhang, Y.; Lin, K.; Jiang, Y.; Zhou, G. Thermal storage and nonlinear heat-transfer characteristics of PCM wallboard. Energy Build. 2008, 40, 1717–1723. [Google Scholar] [CrossRef] [Scilit]
- Izquierdo-Barrientos, M.A.; Belmonte, J.F.; Rodríguez-Sánchez, D.; Molina, A.E.; Almendros-Ibáñez, J.A. A numerical study of external building walls containing phase change materials (PCM). Appl. Therm. Eng. 2012, 47, 73–85. [Google Scholar] [CrossRef] [Scilit]
- Arıcı, M.; Bilgin, F.; Krajčík, M.; Nižetić, S.; Karabay, H. Energy saving and CO2 reduction potential of external building walls containing two layers of phase change material. Energy 2022, 252, 124010. [Google Scholar] [CrossRef] [Scilit]
- Tunçbilek, E.; Arıcı, M.; Krajčík, M.; Li, D.; Nižetić, S.; Papadopoulos, A.M. Enhancing building wall thermal performance with phase change material and insulation: A comparative and synergistic assessment. Renew. Energy 2023, 218, 119270. [Google Scholar] [CrossRef] [Scilit]
- Zhang, M.; Medina, M.A.; King, J.B. Phase-Change Frame Walls (PCFWs) for On-Peak Demand Reduction and Energy Conservation in Residential Buildings: Development, Construction, and Evaluation. In Proceedings of the Fourteenth Symposium on Improving Building Systems in Hot and Humid Climates; Texas A&M University: Richardson, TX, USA, 2004. [Google Scholar]
- Al-Absi, Z.A.; Mat, S.; Sopian, K.; Sulaiman, M.Y.; Zaidi, S.H. Phase Change Materials (PCMs) and Their Optimum Position in Building Walls. Sustainability 2020, 12, 1294. [Google Scholar] [CrossRef] [Scilit]
- Jin, X.; Medina, M.A.; Zhang, X. Numerical analysis for the optimal location of a thin PCM layer in frame walls. Appl. Therm. Eng. 2016, 103, 1057–1063. [Google Scholar] [CrossRef] [Scilit]
- Andrés, M.; Rebelo, F.; Corredera, Á.; Figueiredo, A.; Hernández, J.L.; Ferreira, V.M.; Bujedo, L.A.; Vicente, R.; Morentin, F.; Samaniego, J. Real-Scale Experimental Evaluation of Energy and Thermal Regulation Effects of PCM-Based Mortars in Lightweight Constructions. Appl. Sci. 2022, 12, 2091. [Google Scholar] [CrossRef] [Scilit]
- Rahman, I.U.; Manca, O.; Buonomo, B.; Bounib, M.; Rehman, S.U.; Salhab, H.; Caggiano, A.; Nardini, S. Assessment of Phase Change Materials Incorporation into Construction Commodities for Sustainable and Energy-Efficient Building Applications. Buildings 2025, 15, 3109. [Google Scholar] [CrossRef] [Scilit]
- Imafidon, O.J.; Ting, D.S. Retrofitting buildings with phase change materials (PCM)–the effects of PCM location and climatic condition. Build. Environ. 2023, 236, 110224. [Google Scholar] [CrossRef] [Scilit]
- Lagou, A.; Kylili, A.; Šadauskienė, J.; Fokaides, P.A. Numerical investigation of phase change materials (PCM) optimal melting properties and position in building elements under diverse conditions. Constr. Build. Mater. 2019, 225, 452–464. [Google Scholar] [CrossRef] [Scilit]
- Gounni, A.; El Alami, M. The optimal allocation of the PCM within a composite wall for surface temperature and heat flux reduction: An experimental approach. Appl. Therm. Eng. 2017, 127, 1488–1494. [Google Scholar] [CrossRef] [Scilit]
- Ferster, B.; Shen, H.; Rendall, J.D. PCM (Phase Change Material) Optimization Modeling for Passive Cooling in South Texas. In Proceedings of the Building Simulation 2017 (15th IBPSA Conference), San Francisco, CA, USA, 7–9 August 2017; pp. 958–965. [Google Scholar] [CrossRef] [Scilit]
- Al-Absi, Z.A.; Mohd Isa, M.H.; Ismail, M. Experimental study on the thermal performance of PCM-based panels developed for exterior finishes of building walls. J. Build. Eng. 2022, 52, 104379. [Google Scholar] [CrossRef] [Scilit]
- Childs, K.W.; Stovall, T.K. Potential Energy Savings Due to Phase Change Material in a Building Wall Assembly: An Examination of Two Climates (ORNL/TM-2012/6); Oak Ridge National Laboratory: Oak Ridge, TN, USA, 2012. [CrossRef] [Scilit]
- Biswas, K.; Abhari, R. Low-cost phase change material as an energy storage medium in building envelopes: Experimental and numerical analyses. Energy Convers. Manag. 2014, 88, 1020–1031. [Google Scholar] [CrossRef] [Scilit]
- Németh, B.; Ujhidy, A.; Tóth, J.; Gyenis, J.; Feczkó, T. Testing of microencapsulated phase-change heat storage in experimental model houses under winter weather conditions. Build. Environ. 2021, 204, 108119. [Google Scholar] [CrossRef] [Scilit]
- Fateh, A.; Borelli, D.; Devia, F.; Weinläder, H. Summer thermal performances of PCM-integrated insulation layers for light-weight building walls: Effect of orientation and melting point temperature. Therm. Sci. Eng. Prog. 2018, 6, 361–369. [Google Scholar] [CrossRef] [Scilit]
- Lachheb, M.; Younsi, Z.; Naji, H.; Karkri, M.; Ben Nasrallah, S. Thermal behavior of a hybrid PCM/plaster: A numerical and experimental investigation. Appl. Therm. Eng. 2017, 111, 49–59. [Google Scholar] [CrossRef] [Scilit]
- Pomianowski, M.Z.; Heiselberg, P.; Zhang, Y. Review of thermal energy storage technologies based on PCM application in buildings. Energy Build. 2013, 67, 56–69. [Google Scholar] [CrossRef] [Scilit]
- Tabares-Velasco, P.C.; Christensen, C.; Bianchi, M. Verification and validation of EnergyPlus phase change material model for opaque wall assemblies. Build. Environ. 2012, 54, 186–196. [Google Scholar] [CrossRef] [Scilit]
- Németh, B.; Ujhidy, A.; Tóth, J.; Ferencz, M.; Kurdi, R.; Gyenis, J.; Feczkó, T. Power consumption of model houses with and without PCM plaster lining using different heating methods. Energy Build. 2023, 284, 112845. [Google Scholar] [CrossRef] [Scilit]
- Ferencz, M.; Németh, B.; Gyenis, J.; Feczkó, T. Statistical evaluation of PCM plaster lining impact on indoor temperature fluctuation due to variability of outdoor temperature and solar radiation along a whole spring season. J. Build. Eng. 2025, 76, 111626. [Google Scholar] [CrossRef] [Scilit]
- Ferencz, M.; Nagy, B.; Németh, B.; Gyenis, J.; Feczkó, T. Quantifying Thermal Time Lag Due to PCM Plaster in Model Houses. Buildings 2025, 15, 4120. [Google Scholar] [CrossRef] [Scilit]

Disclaimer/Publisher’s Note: The statements, opinions and data contained in all publications are solely those of the individual author(s) and contributor(s) and not of MDPI and/or the editor(s). MDPI and/or the editor(s) disclaim responsibility for any injury to people or property resulting from any ideas, methods, instructions or products referred to in the content. |
© 2026 by the authors. Licensee MDPI, Basel, Switzerland. This article is an open access article distributed under the terms and conditions of the Creative Commons Attribution (CC BY) license.