


Abstract
Shape memory alloy (SMA) knitted fabrics are promising for wearable actuators, but their tensile responses depend on material composition and wire arrangement. This study evaluated eight single-jersey configurations comprising SMA-only, nylon-only, and SMA–nylon hybrid fabrics. Uniaxial tensile tests were conducted on 60 mm-wide specimens under full-width gripping without SMA activation. Segmental and chord tensile slopes, ultimate tensile strength, stresses at specified strains, elongations at specified loads, and tensile energy density were assessed. Welch’s ANOVA and Games–Howell comparisons were applied with multiple-testing adjustments. The nylon-wale configuration showed the highest mean stress at 30% and 50% strain, whereas nylon-course exhibited the highest mean stress at 70% strain and greatest total tensile energy density. Among hybrids, the 30–50% tensile slope was significantly higher in Sample 7 than in Samples 5 and 8, while Sample 8 exhibited significantly greater elongation at 2 N than selected configurations. Relative performance varied across strain intervals and mechanical indicators, revealing distinct combinations of tensile resistance and deformation compliance. These findings support multi-parameter evaluation when selecting SMA–nylon knitted architectures for wearable applications requiring controlled deformation.
1. Introduction
Recent advances in wearable technology have stimulated growing interest in smart textiles and smart garments that extend beyond the passive functions of conventional textile materials by actively changing their shape and functionality in response to environmental stimuli. Smart garments have evolved into systems that integrate sensors, actuators, and functional materials into clothing structures to monitor the wearer’s condition or provide physical responses [1]. Among these materials, shape memory alloy (SMA) has attracted considerable attention as a representative smart actuator material. SMA can recover a predetermined shape when exposed to a specific temperature or mechanical stimulus while offering high energy density and excellent recovery capability (Lagoudas, 2008) [2]. In particular, Nitinol-based SMA wires can be miniaturized and exhibit excellent durability under repeated deformation, making them highly promising not only for aerospace, robotics, and medical devices but also for wearable actuators and smart textile applications (Hartl & Lagoudas, 2007) [3]. Recent attempts have been made to incorporate SMA wires into woven and knitted structures to achieve garment shape transformation, body-conforming adaptation, and active pressure regulation. This approach has emerged as a promising alternative for overcoming the limitations of conventional compression garments based on elastic fibers.
Granberry et al. [4] (2019) have developed a self-fitting garment incorporating nickel–titanium (NiTi)-based SMA knitted actuators that actively conform to the complex three-dimensional contours of the human body, demonstrating a novel strategy for garment fabrication together with the feasibility of controlling actuation temperatures suitable for wearable applications. Subsequently, Granberry et al. [5] (2020) evaluated the feasibility of dynamic compression garments incorporating contractile SMA knitted actuators to mitigate post-spaceflight orthostatic intolerance and predicted the compression performance of single- and double-layer structures as well as the increase in compression induced by SMA activation. Lee et al. [6] (2022) have developed a wearable device that assists hand grasping by incorporating an SMA module knitted with NiTi wire into a flexible glove. Lee and Park [7] (2024) further extended this concept to a soft wearable exoglove for rehabilitation assistance and evaluated its range of motion, grip strength, and wearability. These studies demonstrate that NiTi SMA wires, when integrated into knitted structures, enable substantial structural deformation and active actuation, making them promising actuator materials for a wide range of wearable systems. However, previous studies have primarily focused on implementing specific wearable systems and their actuation performance, deformation capability, compression effects, or motion assistance functions. In contrast, studies that systematically characterize the tensile mechanical behavior of SMA knitted fabrics themselves as textile materials, including their nonlinear deformation characteristics and stiffness evolution during deformation, remain relatively limited. Furthermore, as SMA knitted fabrics are likely to be incorporated into hybrid structures combined with conventional knitted fabrics, woven fabrics, or elastic textile materials in practical wearable products, a fundamental quantitative understanding of their tensile behavior is also essential for evaluating their mechanical compatibility and interactions with other apparel materials.
Moreover, SMA wires possess substantially higher stiffness and lower extensibility than conventional textile materials, which may lead to localized stress concentrations or excessive garment pressure when incorporated into knitted structures. Even at comparable SMA contents, differences in the spatial arrangement and continuity of SMA wires within knitted structures may influence load transfer, tensile resistance, and deformation compliance. Therefore, in practical wearable applications, designing knitted structures that effectively accommodate external forces and body movements, while maintaining an appropriate level of garment pressure, is more important than simply maximizing stiffness. Accordingly, quantitatively characterizing the tensile mechanical properties and deformation behavior associated with different SMA wire arrangements is fundamental to the structural design and performance optimization of SMA-based wearable garments.
This study fabricated eight single-jersey knitted configurations comprising SMA-only, nylon-only, and SMA–nylon hybrid structures and investigated their tensile mechanical behavior under consistent full-width gripping conditions. Particular attention was given to differences in tensile resistance, deformation compliance, and energy absorption associated with material composition and SMA wire arrangement. The segmental tensile slope at 30–50% strain, chord tensile slope at 50–70% strain, ultimate tensile strength, engineering stresses at specified strains, relative elongations at specified loads, and tensile energy density were evaluated. By comparing these complementary mechanical parameters across different deformation stages, this study aimed to identify configuration-dependent tensile-property profiles and clarify the trade-offs between tensile resistance and deformation compliance. The findings provide a quantitative basis for the structural design and selection of SMA–nylon knitted fabrics for future wearable applications requiring controlled deformation and mechanical adaptability.
2. Materials and Methods
2.1. Fabrication of Knitted Specimens
In this study, a total of eight knitted fabric configurations (Samples 1–8) were fabricated using nylon yarn (100% nylon, 210D, 3-ply, Z-twist) and shape memory alloy (SMA) wire (55% Ni, 45% Ti; diameter: 0.16 mm). The nylon yarn served as the base knitting material because of its flexibility, knittability, and stable mechanical properties, whereas the SMA wire was incorporated as a functional material to impart high stiffness and shape memory characteristics. This design enabled a comparative analysis of the tensile responses of knitted structures with different material compositions and SMA wire arrangements. According to ASTM F2516-18 [8], the manufacturer-specified properties of the NiTi wire were a tensile strength of at least 1300 MPa, an upper loading plateau stress of at least 150 MPa, an elongation at fracture of at least 10%, and a residual elongation of less than 0.5%.
The knitted specimens were fabricated in a single-jersey structure using a flat knitting machine (Brother KH-871, Brother Industries, Nagoya, Japan). The machine dial was set to 4.2 to produce a knitted structure of intermediate density that ensured dimensional stability without excessive compactness.
The eight configurations were designed to compare tensile behavior in relation to material composition, knitting orientation, and the spatial arrangement of SMA wires. Samples 1 and 2 were composed entirely of SMA wire, whereas Samples 3 and 4 were composed entirely of nylon yarn. Samples 1 and 3 were tested in the wale direction, while Samples 2 and 4 were tested in the course direction. These single-material specimens served as reference configurations for evaluating the tensile behavior of the SMA–nylon hybrid knitted fabrics.
Four SMA–nylon hybrid configurations (Samples 5–8) were selected to represent different SMA wire arrangements and SMA-to-nylon loop-count ratios. Samples 5 and 8 featured course-dispersed SMA arrangements, in which SMA-containing courses were distributed at intervals along the knitted structure. These two configurations differed in their SMA-to-nylon loop-count ratios, allowing comparison of tensile responses within the same arrangement category. Sample 6 featured a center-wale SMA arrangement with an overall SMA-to-nylon loop-count ratio of 2:3, whereas Sample 7 featured an edge-wale arrangement with a ratio of 3:2. Accordingly, these configurations were compared as structures differing in both SMA proportion and spatial arrangement.
All specimens were prepared with an overall width of 60 mm to match the 60 mm grip contact width of the universal testing machine. Consequently, the entire specimen width was secured by the upper and lower grips during tensile testing, eliminating the ungripped lateral regions associated with partial-width gripping. This consistent specimen geometry and gripping configuration were applied to all eight configurations to facilitate comparisons of their tensile responses under equivalent testing conditions.
The experimental design was intended to characterize differences among the selected knitted configurations rather than to independently isolate the effects of SMA content and arrangement. Because the configurations differed in several structural characteristics, including SMA-to-nylon loop-count ratios and spatial arrangements, the observed tensile responses were interpreted as configuration-dependent behavior. Table 1 summarizes the material composition, knitting orientation, SMA wire arrangement, and structural characteristics of the eight knitted fabric configurations.
Table 1.
Specifications of the SMA–nylon hybrid knitted samples.
2.2. Tensile Property Evaluation
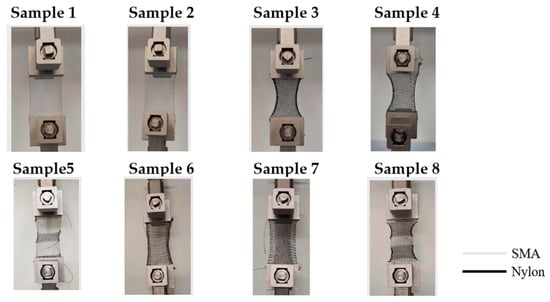
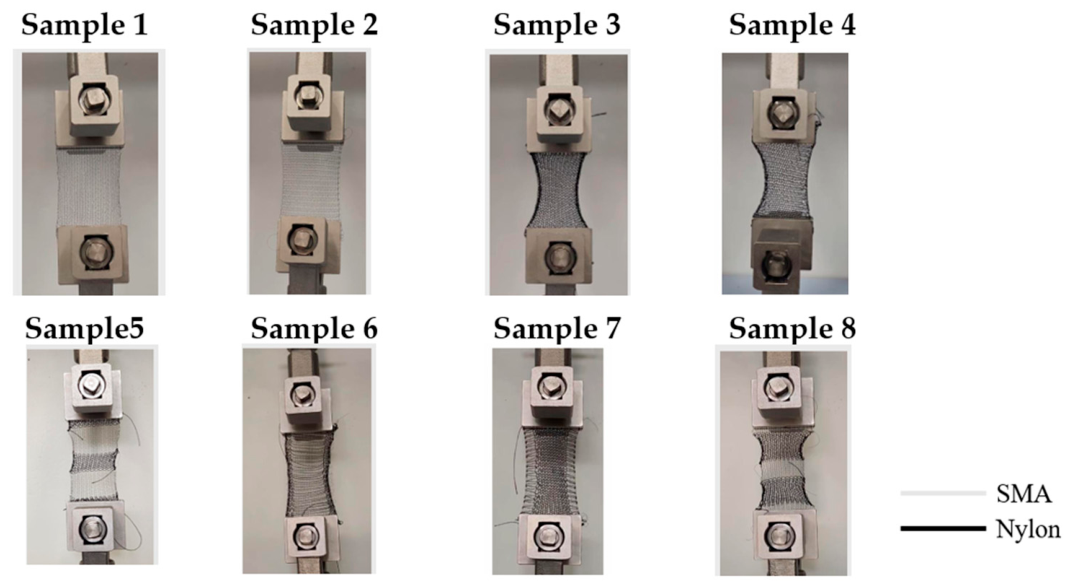
The tensile responses of the knitted specimens were evaluated by uniaxial tensile testing using a universal testing machine (AGS-X, Shimadzu, Kyoto, Japan). The specimens had an overall length of 100 mm and an overall width of 60 mm, matching the grip contact width. The upper and lower grips each engaged 15 mm of the specimen length, leaving an initial distance of 70 mm between the grips. The entire specimen width was secured by both grips, ensuring full-width gripping conditions for all eight configurations. All tensile tests were conducted at a constant crosshead speed of 100 mm/min. Figure 1 presents photographs of the mounted specimens, documenting their positions relative to the grips.
Figure 1.
Knitted specimens with different SMA wire arrangements mounted on a universal testing machine for tensile testing.
The specimen width was matched to the grip contact width to ensure consistent gripping conditions across all configurations. This arrangement eliminated the ungripped lateral regions associated with partial-width gripping and allowed the tensile responses to be evaluated under the same gripping geometry. ASTM D5035 [9] (strip test) and ISO 13934-1:2013 [10] were considered when evaluating the testing configuration. Although the entire specimen width was secured by the grips, the specimen dimensions, grip separation, and crosshead speed did not fully conform to the requirements of these standards. Accordingly, the measurements are reported as uniaxial tensile tests under full-width gripping conditions rather than as tests conducted in full accordance with these standards.
Three independent specimens were tested for each configuration. The use of three specimens per condition has also been reported in the experimental characterization of knitted fabrics; for example, du Pasquier et al. [11] used three specimens for each parameter variation in biaxial cyclic testing. In the present study, three independent replicates were analyzed for each configuration, except for Sample 7, for which two replicate datasets were available (n = 2). The unavailable replicate was not imputed, and results are reported as mean ± sample standard deviation.
2.3. Analysis of Tensile Mechanical Behavior
To characterize the deformation-dependent mechanical behavior of the SMA–nylon hybrid knitted fabrics, tensile stiffness was quantified at different stages of deformation. Shanahan and Postle [12] (1974a) report that the initial tensile response of knitted fabrics is governed primarily by geometric deformation arising from loop rearrangement and loop straightening. Subsequently, after this structural deformation, yarn extension becomes the dominant deformation mechanism, thereby determining the initial elastic response (Shanahan & Postle, 1974b) [13]. Similarly, Dinh et al. (2018) [14] demonstrate that the initial tensile behavior is primarily controlled by loop rotation and geometric deformation, whereas yarn extension and elastic deformation become increasingly dominant as strain increases. The initial tensile response of knitted fabrics is dominated by geometric deformation, including loop rotation, rearrangement, and straightening. With increasing strain, the constituent yarns gradually assume a greater share of the applied tensile load. The 30–50% relative elongation interval was selected to characterize the comparatively steady increase in tensile stress following the pronounced initial nonlinear response observed in the measured curves. Ordinary least-squares regression was used to obtain a representative slope from all data points within this interval, rather than relying only on its endpoints. This parameter, defined as the segmental tensile slope E30–50, was interpreted as an apparent measure of tensile resistance rather than an intrinsic elastic modulus. Its use does not imply purely elastic deformation or complete loop alignment. E30–50 was calculated as follows [15]:
where n is the number of data points within the 30–50% relative elongation interval, ε is the relative elongation expressed as a percentage, and σ is the engineering stress in MPa. Equation (1) gives the ordinary least-squares slope of the linear fit σ = a + E30−50ε where a is the intercept. This expression minimizes the sum of squared stress residuals and uses all data points within the selected interval to obtain a representative tensile slope. Accordingly, E30−50 is expressed in MPa/% and is interpreted as an interval-specific tensile slope rather than an intrinsic elastic modulus.
The adjacent 50–70% strain interval was selected to characterize tensile resistance at greater extension over an interval of the same width. E50–70 was defined as the chord slope between the two endpoints, representing the net stress increase per unit strain across the interval without assuming that the intervening response was linear. Thus, the two calculation methods served different descriptive purposes: regression characterized the overall trend within the 30–50% interval, whereas the chord slope quantified the endpoint-to-endpoint response within the 50–70% interval. Both parameters were expressed in MPa/%, with strain entered as percentage values. These intervals were operational comparison windows rather than experimentally validated stages of garment wear. Comparisons primarily focused on differences among specimens within each interval; comparisons between the two slopes require consideration of both the strain range and the calculation method. E50–70 was calculated as follows [16]:
where ε is the relative elongation, L0 is the initial gauge length, L is the gauge length during loading, ΔL is the change in gauge length, σ is the engineering stress, F is the tensile force, and A0 is the initial cross-sectional area used for stress calculation. The initial cross-sectional area (A0) was calculated as the product of the overall specimen width (60 mm) and the assigned reference thickness (1.5 mm), corresponding to A0 = 90 mm2 for all eight configurations. This nominal gross cross-sectional area was used consistently for engineering stress calculations.
Accordingly, the calculated stresses represent apparent structural properties normalized by the nominal gross cross-sectional area rather than intrinsic stresses of the constituent materials.
The ultimate tensile strength (UTS), defined as the maximum engineering stress recorded for each individual replicate specimen during tensile testing, was determined using Equation (3). The UTS of each replicate specimen was calculated as the maximum tensile force divided by its initial cross-sectional area [17]:
The mean UTS was calculated as the arithmetic mean of the individual replicate values [18]:
where UTSi is the ultimate tensile strength of the ith replicate specimen, σi(ε) is its engineering stress at strain ε, Fmax,i is the maximum tensile force recorded for that specimen, and A0, i is its initial cross-sectional area. denotes the arithmetic mean of the individual UTS values, and m is the number of replicate specimens included in the calculation.
To characterize tensile resistance and deformation under specified loading conditions, both stress–strain- and load–strain-based parameters were analyzed. Engineering stresses at 30%, 50%, and 70% strain were calculated by dividing the tensile force at each specified strain level by the initial cross-sectional area, as shown in Equation (5) [19]. These values characterize the tensile response under the present uniaxial test configuration and do not represent garment–body interface pressure.
where σε is the engineering stress (MPa or N/mm2) at a specified strain level, Fε is the tensile force (N) at that strain level (30%, 50%, or 70%), and A0 is the initial cross-sectional area of the specimen (mm2).
As load-based indices, the relative elongations at tensile forces of 0.5, 1.0, and 2.0 N were extracted from the recorded loading curves. These values were used as operational reference levels to compare deformation at progressively increasing low loads under the present test configuration. All available replicate specimens reached these forces, allowing comparisons at common absolute load levels. The selected forces were not intended to represent specific garment-wearing conditions or compression-pressure levels. Strain at each target force was determined by linear interpolation using Equation (6) [20]:
where Ftarget is the target applied load (0.5, 1.0, or 2.0 N); F1 and F2 are the measured loads immediately before and after the target load, respectively; and ε1 and ε2 are the corresponding relative elongations (%).
Finally, tensile energy density was calculated by integrating the engineering stress–relative elongation curve over the selected interval using the trapezoidal rule, with strain expressed as a dimensionless quantity (Equation (7)) [21]:
where σi and σi+1 are the engineering stresses (MPa) at two adjacent data points, εi and εi+1 are the corresponding dimensionless relative elongations (e.g., 0.50 for 50% strain), and n is the number of data points included in the integration interval. The resulting tensile energy density, W is expressed in MPa, equivalent to MJ/m3. Under the present full-width gripping conditions, tensile energy density was interpreted as an apparent structural property based on the nominal initial cross-sectional area and gauge length used in the calculations. W0–50 and W0–100 were evaluated up to 50% and 100% strain, respectively, whereas Wtotal was evaluated over the complete recorded loading trace for each replicate.
Strain values expressed as percentages were used in Equations (1), (2), and (6), whereas dimensionless strain values were used in Equation (7).
2.4. Statistical Analysis
Statistical analyses were performed on five tensile outcomes: E30–50, E50–70, UTS, relative elongation at 2 N, and Wtotal. Each outcome was calculated separately for each independent specimen. Three independent specimen datasets were analyzed per configuration, except for Sample 7, for which two datasets were available (n = 2), resulting in a total of 23 independent specimen datasets. Missing data were not imputed. Results are presented as mean ± standard deviation. Differences among the eight specimen configurations were assessed using Welch’s one-way ANOVA, which does not assume equal variances. The five omnibus p-values were adjusted using the Holm procedure. Pairwise comparisons were performed using the Games–Howell procedure, with an additional Bonferroni adjustment across the five outcomes. Statistical significance was defined as an adjusted p-value < 0.05. All analyses were performed in Python (version 3.13.2) using SciPy (version 1.15.2). Given the limited number of independent specimens, normality could not be reliably assessed, and the statistical comparisons were interpreted as exploratory. Nonsignificant results were not considered evidence of equivalence between specimen configurations.
3. Results
In this study, the mechanical properties of the specimens were compared by analyzing the segmental tensile slope at 30–50% strain (E30–50), chord tensile slope at 50–70% strain (E50–70), stress–strain behavior, stress at specific strain levels, and tensile energy density derived from the stress–strain curves.
3.1. Stress–Strain Behavior
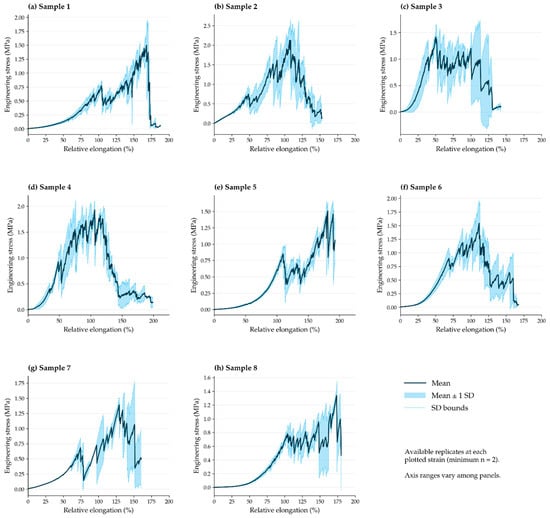
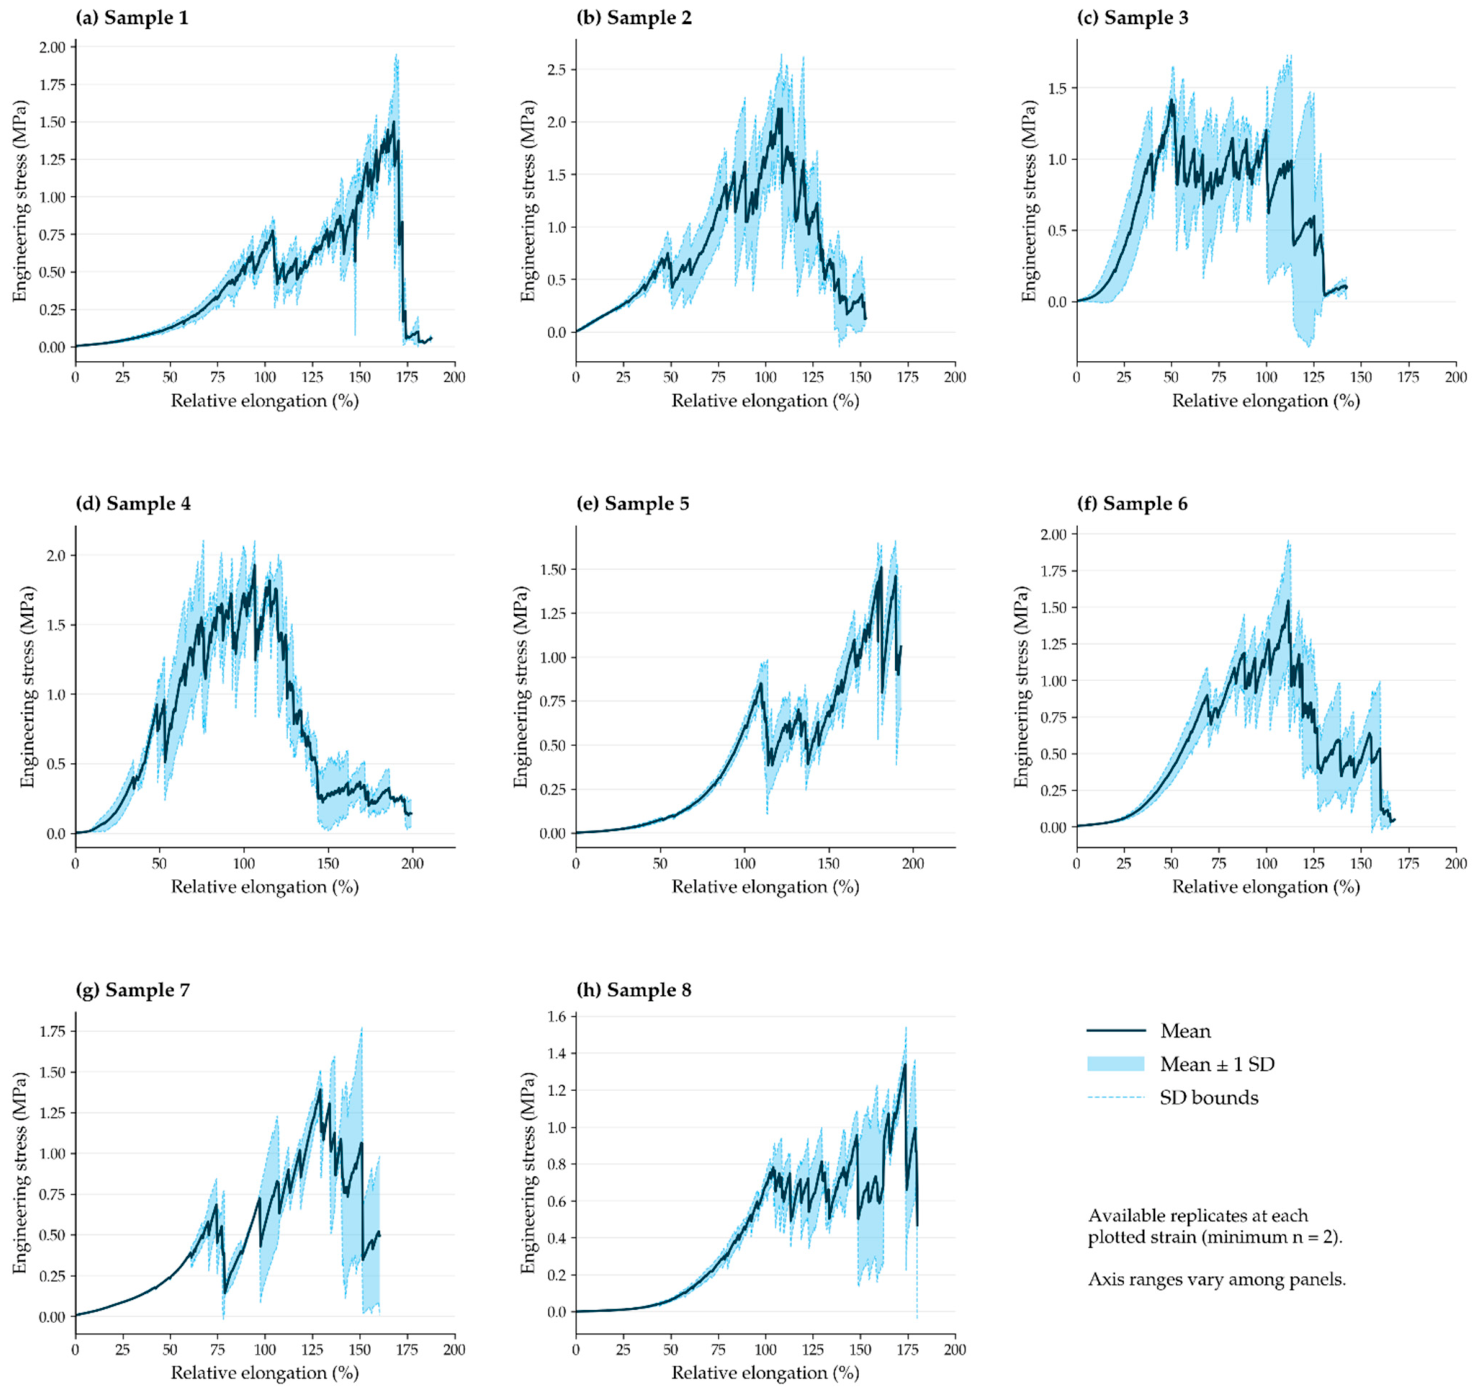
Figure 2 presents the mean stress–strain curves and standard deviations calculated from the available independent replicate tests for each specimen configuration. Differences were observed in peak stress, strain at peak stress, and post-peak response. The peak of an averaged curve may differ from the mean UTS because individual specimens can reach their maximum stresses at different strains. Accordingly, UTS was calculated for each specimen before averaging, as described in Section 2.3.
Figure 2.
Mean engineering stress–strain curves of the eight knitted fabric configurations under full-width gripping conditions: (a) Sample 1, (b) Sample 2, (c) Sample 3, (d) Sample 4, (e) Sample 5, (f) Sample 6, (g) Sample 7, and (h) Sample 8. Solid lines represent mean values, shaded areas indicate mean ± one standard deviation (SD), and dashed lines indicate the SD bounds. Means and SDs were calculated using the available replicate measurements at each strain level (minimum n = 2). Axis ranges vary among panels.
Among the single-material configurations (Samples 1–4), Sample 2 (SMA-course) exhibited the highest peak stress in the averaged curves, reaching approximately 2.1 MPa near 107% strain. Sample 1 (SMA-wale) showed a more gradual increase in stress, reaching its highest mean stress of approximately 1.5 MPa near 168% strain before a sharp decrease. The nylon-only configurations also exhibited distinct tensile responses depending on the loading direction. Sample 3 (Nylon-wale) showed an initial peak near 50% strain, followed by multiple stress fluctuations and a gradual decrease at higher strains. In contrast, Sample 4 (Nylon-course) exhibited a broader region of relatively high stress, reaching a peak of approximately 1.9 MPa near 106% strain before progressively decreasing. These observations indicate differences in tensile behavior between the wale and course loading directions for both SMA-only and nylon-only knitted structures.
The course-dispersed hybrid configurations (Samples 5 and 8) exhibited different stress–strain responses despite having the same general SMA arrangement. Sample 5 showed a gradual increase in stress at lower strains, followed by several local fluctuations and a peak of approximately 1.5 MPa near 181% strain. Sample 8 exhibited a comparatively gradual increase in stress, followed by multiple fluctuations and a peak of approximately 1.3 MPa near 174% strain. Both configurations displayed nonuniform stress development at higher strains, indicating differences in their deformation responses. The longitudinally arranged hybrid configurations (Samples 6 and 7) also exhibited distinct tensile responses. Sample 6 (center-wale) showed a progressive increase in stress, reaching approximately 1.6 MPa near 112% strain, followed by a decrease with multiple local fluctuations. Sample 7 (edge-wale) exhibited several stress peaks and decreases, reaching a maximum mean stress of approximately 1.4 MPa near 129% strain. The center-wale and edge-wale configurations exhibited distinct tensile responses, reflecting differences between the tested structures in which both SMA-to-nylon proportions and spatial arrangements varied.
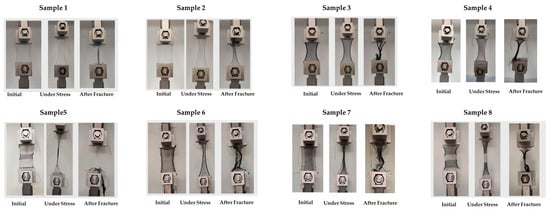
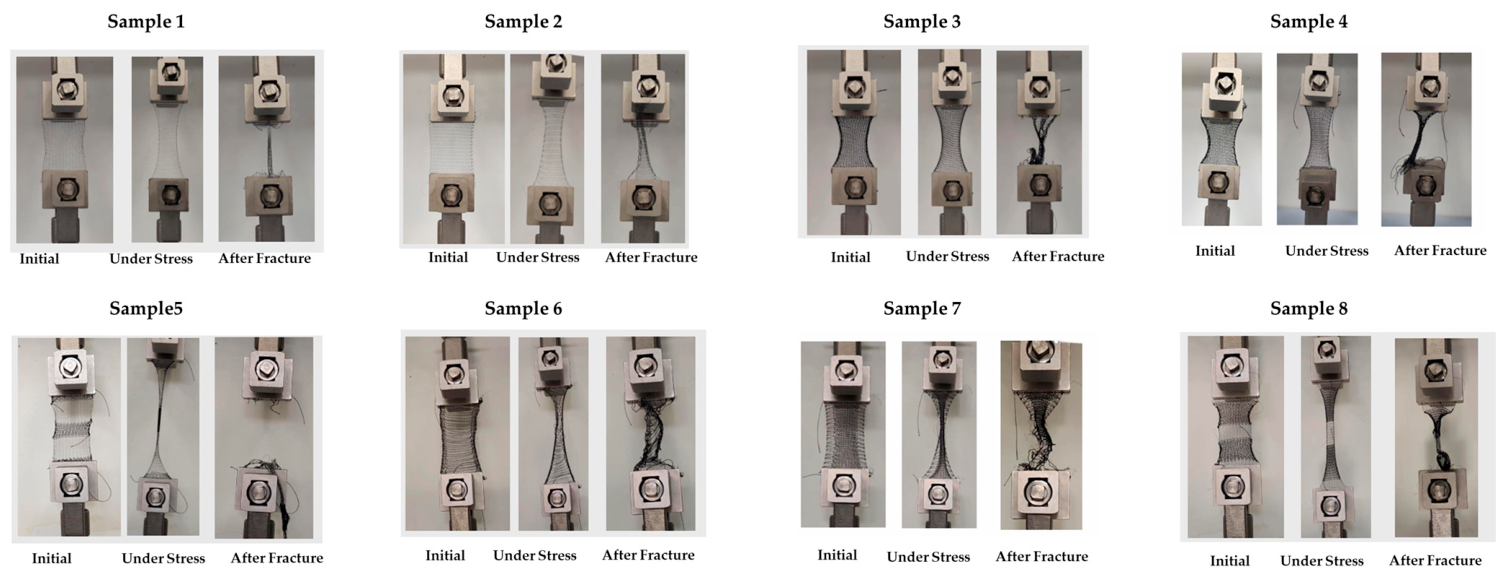
Figure 3 presents representative photographs of the specimens before loading, during loading, and after testing. The photographs illustrate loop straightening, lateral narrowing, and the final appearance of the deformed or damaged structures. These observations complement the stress–strain curves but do not establish the sequence of SMA and nylon failure or quantify load sharing between the constituent materials.
Figure 3.
Representative photographs of the knitted specimens before loading, during tensile loading, and after testing. Sample numbers correspond to the configurations listed in Table 1.
Overall, the eight configurations exhibited different tensile responses under the full-width gripping conditions used in this study. Multiple stress peaks and post-peak fluctuations were observed in several configurations, potentially reflecting structural rearrangement, progressive damage, and continued engagement of knitted loops during deformation. However, the individual contributions of these mechanisms could not be determined from the global tensile measurements alone. The observed differences are therefore interpreted as configuration-dependent tensile responses associated with material composition, knitting orientation, and SMA wire arrangement, rather than as independent effects of individual structural variables.
3.2. Segmental Tensile Slope at 30–50% Strain (E30–50)
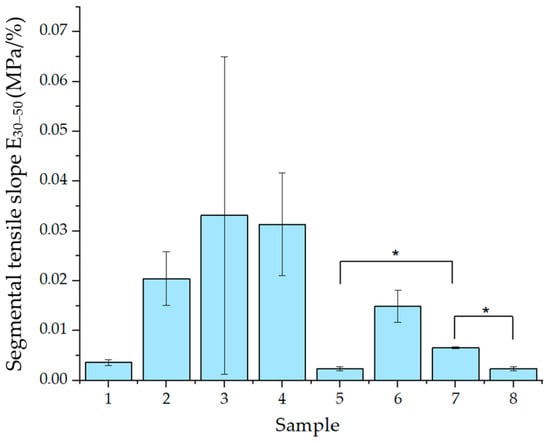
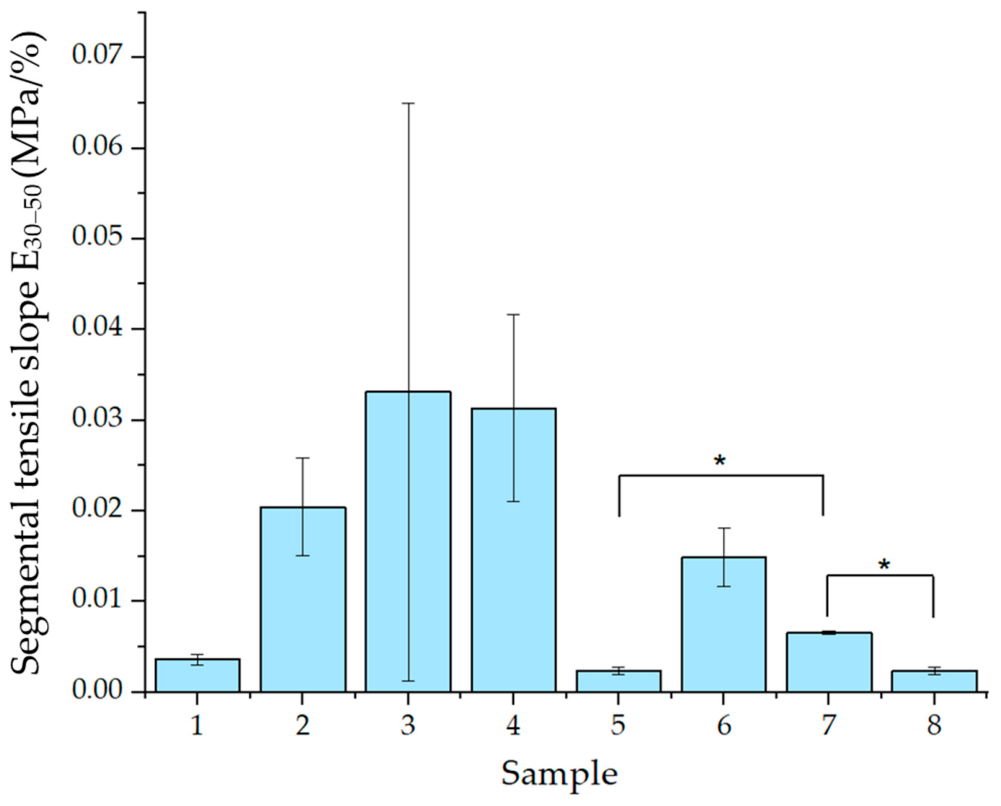
The segmental tensile slope at 30–50% strain (E30–50) was used to characterize the increase in tensile stress within the selected strain interval (Figure 4). The mean E30–50 values ranged from approximately 0.002 to 0.033 MPa/%, with differences observed among the eight knitted fabric configurations.
Figure 4.
Segmental tensile slope (E30–50) of the knitted specimens. Brackets indicate statistically significant pairwise differences based on Games–Howell tests with Bonferroni adjustment (* adjusted p < 0.05).
Among the single-material configurations, Sample 3 (Nylon-wale) exhibited the highest mean E30–50 value (0.033 MPa/%), followed by Sample 4 (Nylon-course, 0.031 MPa/%) and Sample 2 (SMA-course, 0.020 MPa/%). In contrast, Sample 1 (SMA-wale) showed a substantially lower mean value (0.004 MPa/%). Sample 3 also exhibited considerable variability among replicates, as indicated by its relatively large standard deviation. Among the hybrid configurations, Sample 6 (center-wale) exhibited the highest mean E30–50 value (0.015 MPa/%), followed by Sample 7 (edge-wale, 0.007 MPa/%). The course-dispersed configurations, Samples 5 and 8, showed comparatively low mean values of approximately 0.002 MPa/%. These results indicate that the increase in tensile stress within the 30–50% strain interval varied according to the knitted configuration. However, the observed differences represent interval-specific tensile responses and do not independently establish the effects of SMA content or spatial arrangement.
Welch’s ANOVA revealed a significant difference in E30–50 among the eight configurations (F = 49.526, Holm-adjusted p < 0.001). Games–Howell post hoc comparisons with Bonferroni adjustment indicated that Sample 7 exhibited significantly higher E30–50 values than Samples 5 (adjusted p = 0.0113) and 8 (adjusted p = 0.0308). No other pairwise differences remained significant after adjustment for multiple comparisons.
3.3. Chord Tensile Slope at 50–70% Strain (E50–70)
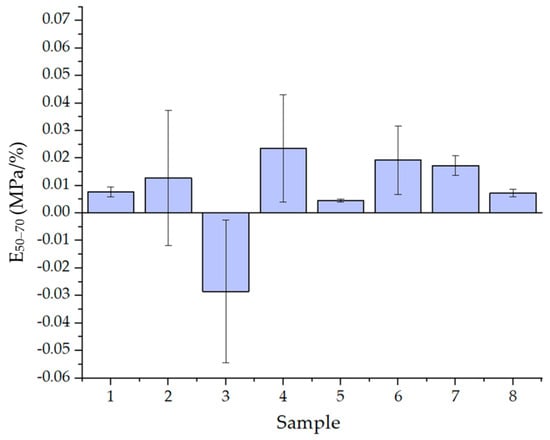
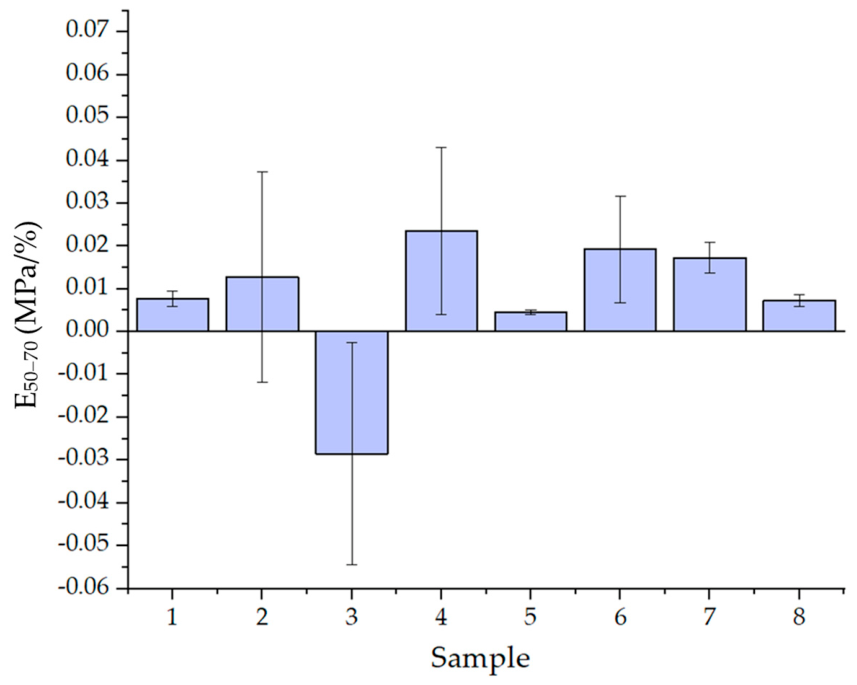
The chord tensile slope at 50–70% strain (E50–70) was used to characterize the net change in tensile stress per unit strain within the selected interval (Figure 5). The mean E50–70 values ranged from approximately −0.028 to 0.023 MPa/%, indicating differences in the tensile responses among the eight knitted fabric configurations.
Figure 5.
Chord tensile slope at 50–70% strain (E50–70) of the eight knitted fabric configurations.
Among the single-material configurations, Sample 4 (Nylon-course) exhibited the highest mean E50–70 value (0.023 MPa/%), followed by Sample 2 (SMA-course, 0.013 MPa/%) and Sample 1 (SMA-wale, 0.008 MPa/%). In contrast, Sample 3 (Nylon-wale) exhibited a negative mean chord slope (−0.028 MPa/%), indicating a net decrease in tensile stress between 50% and 70% strain. Considerable variability among replicates was observed for Samples 2, 3, and 4.
Among the hybrid configurations, Sample 6 (center-wale) exhibited the highest mean E50–70 value (0.019 MPa/%), followed by Sample 7 (edge-wale, 0.017 MPa/%). The course-dispersed configurations, Samples 5 and 8, showed comparatively low mean values of approximately 0.005 and 0.007 MPa/%, respectively. These results describe differences in net stress changes over the selected strain interval among the hybrid configurations.
Welch’s one-way ANOVA did not reveal a statistically significant difference in E50–70 among the eight configurations (F = 4.248, unadjusted p = 0.0556). No pairwise differences were statistically significant after multiple-comparison adjustment. Accordingly, the observed differences in mean values are interpreted descriptively rather than as statistically established differences among configurations.
Notably, E30–50 was calculated by linear regression using all data points within the selected interval, whereas E50–70 was calculated from the stresses at the two interval endpoints. Comparisons therefore focused on differences among specimen configurations within each interval. Differences between E30–50 and E50–70 should be interpreted with consideration of both the strain intervals and the calculation methods.
3.4. UTS
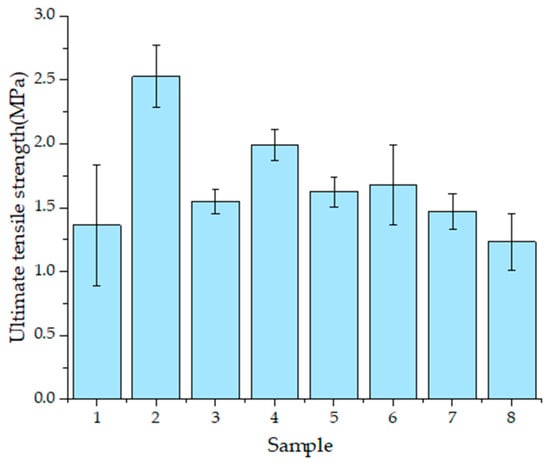
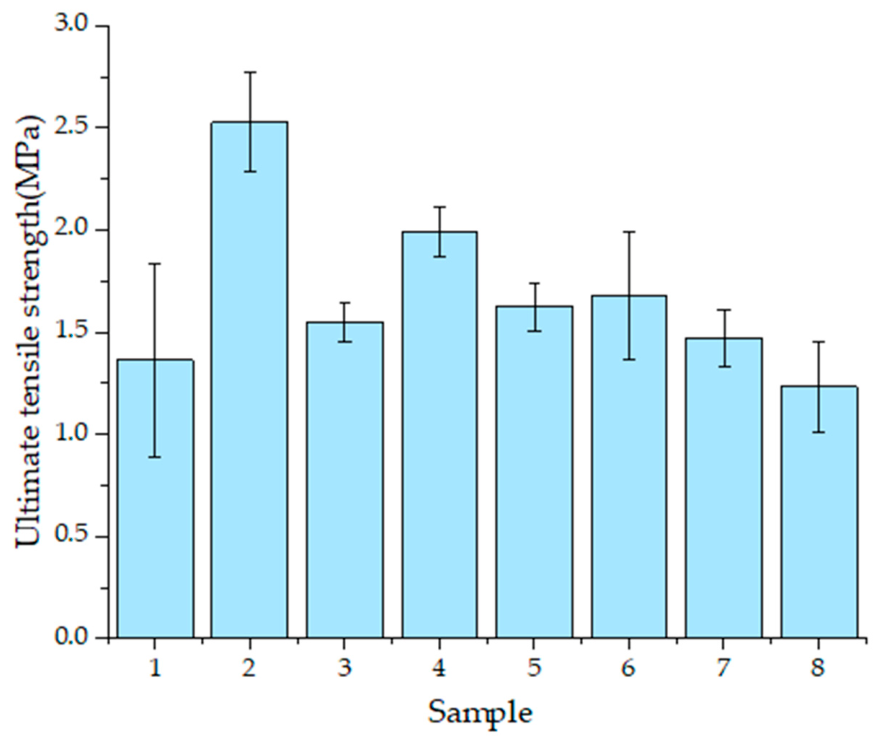
The ultimate tensile strength (UTS) was analyzed to evaluate the maximum tensile stress sustained by each knitted configuration during testing (Figure 6). The mean UTS values ranged from approximately 1.23 to 2.53 MPa, indicating differences in the maximum tensile resistance among the eight configurations.
Figure 6.
Ultimate tensile strength (UTS) of the eight knitted fabric configurations.
Among the single-material configurations, Sample 2 (SMA-course) exhibited the highest mean UTS (2.53 MPa), followed by Sample 4 (Nylon-course, 1.99 MPa). Samples 3 (Nylon-wale) and 1 (SMA-wale) showed lower mean values of approximately 1.55 and 1.36 MPa, respectively. The course-loading configurations exhibited higher mean UTS values than their corresponding wale-loading configurations for both SMA-only and nylon-only knitted structures.
Among the hybrid configurations, Sample 6 (center-wale) exhibited the highest mean UTS (1.68 MPa), followed by Sample 5 (course-dispersed, 1.62 MPa) and Sample 7 (edge-wale, 1.47 MPa). Sample 8 (course-dispersed) showed the lowest mean UTS among all configurations (1.23 MPa). Although differences in mean UTS were observed, Games–Howell post hoc comparisons with Bonferroni adjustment did not identify statistically significant pairwise differences. These results describe configuration-dependent variations in maximum tensile resistance, although the limited number of replicates restricts definitive conclusions regarding differences among individual configurations.
3.5. Stress at Specific Strain Levels
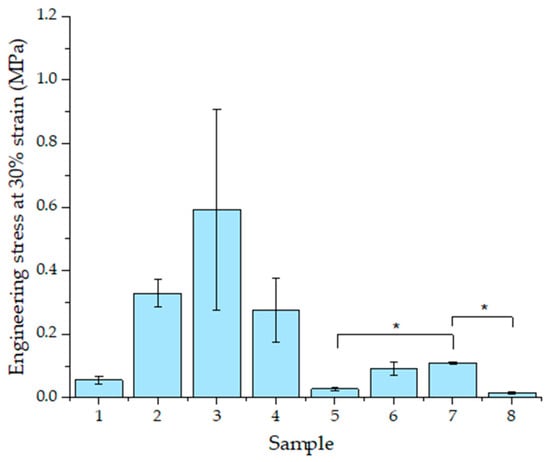
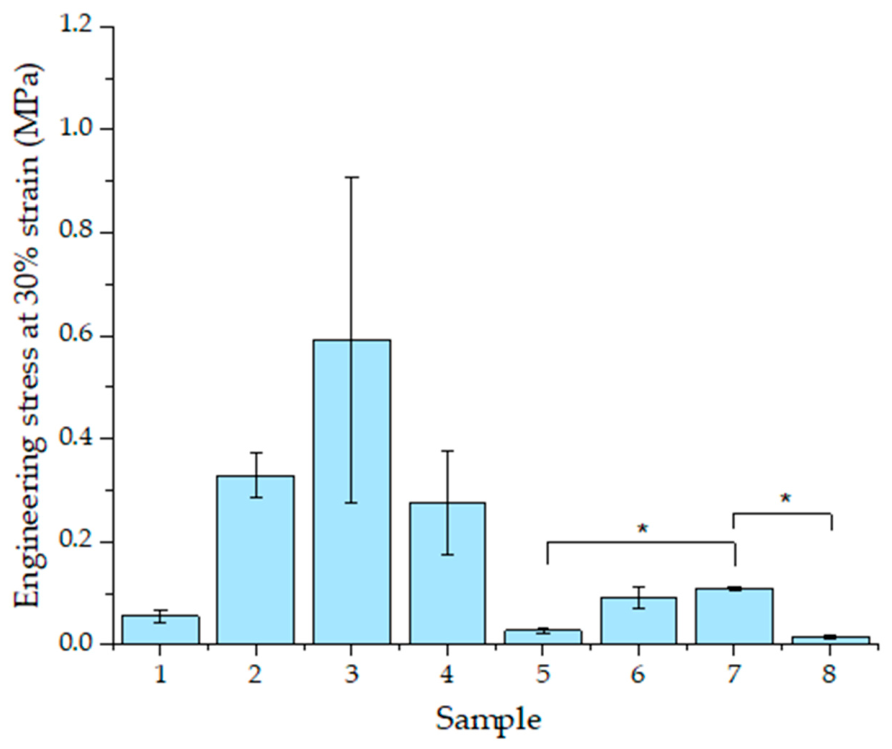
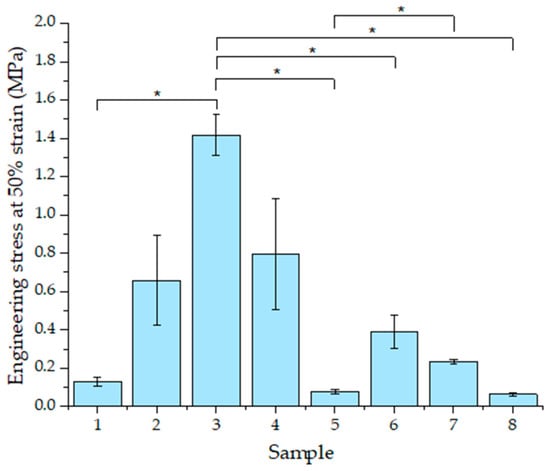
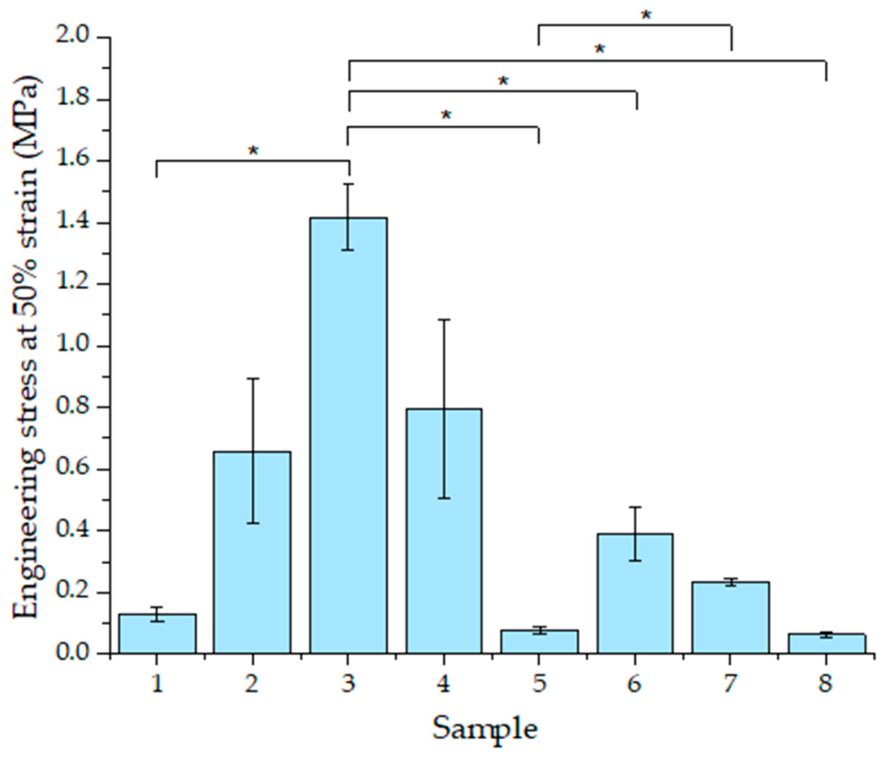
Engineering stresses at 30%, 50%, and 70% strain were compared to characterize tensile resistance at specified extensions (Figure 7, Figure 8 and Figure 9). The specimens exhibited nonlinear tensile behavior, with stress generally increasing as strain increased, although some configurations showed a decrease in stress within the selected strain range. The measured stress values ranged from approximately 0.012 to 1.72 MPa, indicating differences in tensile resistance and deformation behavior among the eight knitted fabric configurations.
Figure 7.
Stress at 30% relative elongation for the eight knitted configurations. * indicates a statistically significant difference between the indicated sample pairs (Games–Howell post hoc test with Bonferroni correction, p < 0.05).
Figure 8.
Stress at 50% relative elongation for the eight knitted configurations. * indicates a statistically significant difference between the indicated sample pairs (Games–Howell post hoc test with Bonferroni correction, p < 0.05).
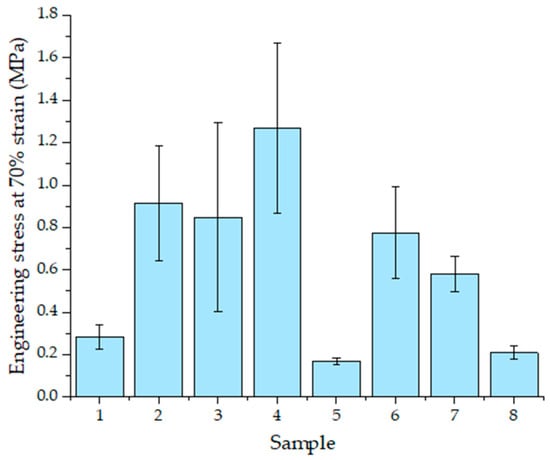
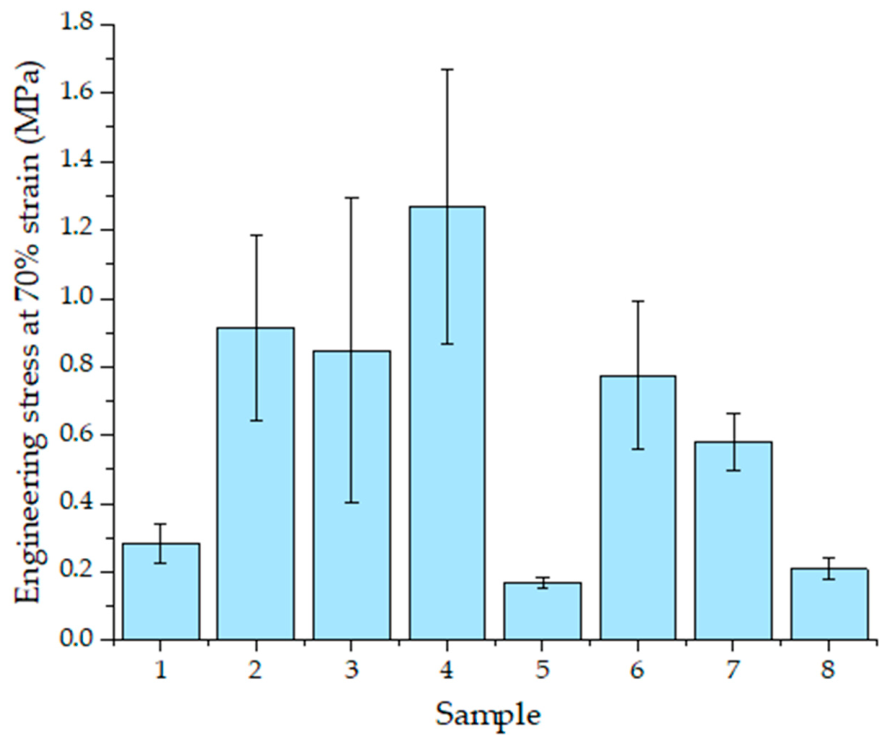
Figure 9.
Stress at 70% relative elongation for the eight knitted configurations.
3.5.1. Stress at 30% Relative Elongation
Engineering stress at 30% relative elongation was compared among the eight specimen configurations (Figure 7). The mean stress values ranged from approximately 0.015 to 0.591 MPa, indicating differences in tensile resistance at the selected strain level.
Among the single-material configurations, Sample 3 (Nylon-wale) exhibited the highest mean stress (0.591 MPa), followed by Sample 2 (SMA-course, 0.329 MPa) and Sample 4 (Nylon-course, 0.275 MPa). Sample 1 (SMA-wale) showed a comparatively low mean stress of approximately 0.055 MPa. Considerable variability among replicates was observed for Sample 3, as indicated by its relatively large standard deviation.
Among the hybrid configurations, Sample 7 (edge-wale) exhibited the highest mean stress (0.108 MPa), followed by Sample 6 (center-wale, 0.092 MPa). In contrast, the course-dispersed configurations, Samples 5 and 8, exhibited relatively low mean stresses of approximately 0.027 and 0.015 MPa, respectively.
Exploratory Welch’s ANOVA indicated significant differences among the eight configurations (F = 88.445, p < 0.001). Games–Howell post hoc comparisons with additional Bonferroni adjustment indicated that Sample 7 exhibited significantly higher stress than Samples 5 (adjusted p = 0.0123) and 8 (adjusted p = 0.0356). No other pairwise differences were statistically significant after this adjustment. These findings indicate differences in tensile resistance at 30% relative elongation, although the contribution of individual structural characteristics cannot be independently determined from these comparisons.
3.5.2. Stress at 50% Strain
Engineering stress at 50% strain was compared among the eight specimen configurations (Figure 8). All configurations exhibited higher mean stress values than at 30% strain, with mean stresses ranging from approximately 0.063 to 1.417 MPa.
Among the single-material configurations, Sample 3 (Nylon-wale) exhibited the highest mean stress (1.417 MPa), followed by Sample 4 (Nylon-course, 0.796 MPa) and Sample 2 (SMA-course, 0.658 MPa). Sample 1 (SMA-wale) showed a comparatively low mean stress of approximately 0.128 MPa. Considerable variability among replicates was observed for Samples 2 and 4.
Among the hybrid configurations, Sample 6 (center-wale) exhibited the highest mean stress (0.388 MPa), followed by Sample 7 (edge-wale, 0.234 MPa). In contrast, the course-dispersed configurations, Samples 5 and 8, exhibited relatively low mean stresses of approximately 0.076 and 0.063 MPa, respectively.
Exploratory Welch’s ANOVA indicated significant differences in stress at 50% strain among the eight configurations (F = 77.081, p < 0.001). Games–Howell post hoc comparisons with additional Bonferroni adjustment indicated that Sample 3 exhibited significantly higher stress than Samples 1 (adjusted p = 0.0350), 5 (adjusted p = 0.0401), 6 (adjusted p = 0.0097), and 8 (adjusted p = 0.0411). Sample 7 also exhibited significantly higher stress than Sample 5 (adjusted p = 0.0417). No other pairwise differences were significant after adjustment.
Compared with the stress at 30% relative elongation, all configurations exhibited increased mean stress at 50% strain. The increase was particularly pronounced in Sample 3, which maintained the highest mean stress among the eight configurations. In contrast, Samples 5 and 8 showed relatively low mean stresses at both strain levels. These results demonstrate configuration-dependent differences in tensile resistance at the selected strain levels, although the independent effects of material composition and SMA arrangement cannot be established from these comparisons.
3.5.3. Stress at 70% Strain
Engineering stress at 70% strain was compared among the eight specimen configurations (Figure 9). The mean stress values ranged from approximately 0.167 to 1.266 MPa, indicating differences in tensile resistance at the selected strain level.
Among the single-material configurations, Sample 4 (Nylon-course) exhibited the highest mean stress (1.266 MPa), followed by Sample 2 (SMA-course, 0.913 MPa) and Sample 3 (Nylon-wale, 0.847 MPa). Sample 1 (SMA-wale) showed a comparatively low mean stress of approximately 0.282 MPa. Considerable variability among replicates was observed for Samples 3 and 4, as indicated by their relatively large standard deviations.
Among the hybrid configurations, Sample 6 (center-wale) exhibited the highest mean stress (0.774 MPa), followed by Sample 7 (edge-wale, 0.580 MPa). In contrast, the course-dispersed configurations, Samples 5 and 8, exhibited relatively low mean stresses of approximately 0.167 and 0.208 MPa, respectively.
Exploratory Welch’s ANOVA indicated significant differences in stress at 70% strain among the eight configurations (F = 10.710, p = 0.0065). However, Games–Howell post hoc comparisons with additional Bonferroni adjustment did not identify statistically significant pairwise differences. Accordingly, the observed differences in mean stress values are interpreted descriptively.
Compared with the stress at 50% strain, most configurations exhibited increased mean stress at 70% strain. However, Sample 3 showed a decrease in mean stress from 1.417 MPa at 50% strain to 0.847 MPa at 70% strain, consistent with its negative chord tensile slope within this interval. Sample 4 exhibited the highest mean stress at 70% strain, whereas Samples 5 and 8 maintained relatively low stress levels. These findings demonstrate that tensile responses varied across the selected strain levels and that higher resistance at an intermediate strain did not necessarily correspond to higher resistance at a greater extension.
3.6. Strain at Applied Loads
The relative elongations at applied loads of 0.5, 1.0, and 2.0 N were analyzed to evaluate the deformation compliance of the eight knitted fabric configurations (Table 2). The initial recorded force was subtracted from each replicate dataset before determining the corresponding strain at each target load. Relative elongation generally increased with increasing applied load, while differences in deformation compliance were observed among the configurations.
Table 2.
Relative elongation (%) at applied loads of SMA–nylon hybrid knitted specimens.
Among the single-material configurations, Sample 2 (SMA-course) exhibited the lowest mean relative elongation at all three applied loads, reaching only 2.68% at 2 N. In contrast, Sample 1 (SMA-wale) exhibited greater deformation, reaching 15.58% at 2 N. The nylon-only configurations, Samples 3 and 4, showed intermediate mean relative elongations of 9.29% and 11.88%, respectively, at 2 N. These observations indicate differences in deformation behavior according to the constituent material and loading direction. Among the hybrid configurations, Sample 8 (course-dispersed) exhibited the highest mean relative elongation at all three applied loads, reaching 15.28%, 25.63%, and 35.36% at 0.5, 1.0, and 2.0 N, respectively. Sample 5 (course-dispersed) also exhibited comparatively high deformation, reaching 27.30% at 2 N. In contrast, Sample 7 (edge-wale) showed the lowest relative elongation among the hybrid configurations, reaching 8.35% at 2 N. Sample 6 (center-wale) exhibited an intermediate value of 15.23% at the same load.
Welch’s ANOVA revealed a significant difference in relative elongation at 2 N among the eight configurations (F = 56.064, Holm-adjusted p < 0.001). Games–Howell post hoc comparisons with additional Bonferroni adjustment indicated that Sample 8 exhibited significantly greater relative elongation than Samples 1 (adjusted p = 0.0277), 2 (adjusted p = 0.0176), 4 (adjusted p = 0.0293), and 6 (adjusted p = 0.0185). No other pairwise differences remained significant after adjustment.
Overall, the results demonstrated configuration-dependent differences in deformation compliance under the selected low-load conditions. In particular, Sample 8 exhibited relatively high deformation at all three applied loads, whereas Sample 2 showed consistently low deformation. These findings suggest that different knitted configurations provide distinct combinations of tensile resistance and deformation compliance under the present testing conditions.
3.7. Tensile Energy Density
The tensile energy density exhibited different trends among the eight knitted fabric configurations depending on the deformation interval (Table 3). Within the 0–50% strain range, Sample 3 (Nylon-wale) exhibited the highest mean tensile energy density (0.24569 MPa), followed by Sample 2 (SMA-course, 0.15244 MPa) and Sample 4 (Nylon-course, 0.13226 MPa). In contrast, the course-dispersed hybrid configurations, Samples 5 and 8, exhibited relatively low values of 0.01318 and 0.00860 MPa, respectively. These results indicate differences in the cumulative tensile work per unit nominal volume within the initial deformation interval.
Table 3.
Tensile energy density of SMA–nylon hybrid knitted specimens.
Within the 0–100% strain range, Sample 4 (Nylon-course) exhibited the highest mean tensile energy density (0.77354 MPa), followed by Sample 3 (Nylon-wale, 0.72504 MPa) and Sample 2 (SMA-course, 0.66692 MPa). Among the hybrid configurations, Sample 6 (center-wale) exhibited the highest value (0.47503 MPa), followed by Sample 7 (edge-wale, 0.26377 MPa). Samples 5 and 8 maintained relatively low values of 0.13650 and 0.15581 MPa, respectively. These observations indicate that the relative ranking of the configurations changed as the deformation interval increased.
When total tensile energy density was considered, Sample 4 (Nylon-course) exhibited the highest mean value (1.44814 MPa), followed by Sample 2 (SMA-course, 1.20014 MPa). Sample 3 (Nylon-wale), which exhibited the highest energy density within the 0–50% strain range, showed an intermediate total energy density of 0.94241 MPa. Among the hybrid configurations, Samples 5, 6, and 7 exhibited similar mean total energy densities of approximately 0.878–0.899 MPa, whereas Sample 8 showed a lower value of 0.73404 MPa.
Welch’s ANOVA revealed a significant difference in total tensile energy density among the eight configurations (F = 13.626, Holm-adjusted p = 0.0090). Games–Howell post hoc comparisons with additional Bonferroni adjustment indicated that Sample 4 exhibited significantly higher total tensile energy density than Sample 6 (adjusted p = 0.0177). No other pairwise differences remained significant after adjustment.
A noteworthy finding is that the relative ranking of the specimens varied depending on the deformation interval. Sample 3 exhibited the highest tensile energy density within the initial 0–50% strain range but did not maintain the highest cumulative energy density over the full loading trace. In contrast, Sample 4 exhibited the highest mean values for both W0–100 and Wtotal. These results indicate that tensile energy density over a selected strain interval does not necessarily correspond to the total energy density accumulated throughout the test. However, because the complete recorded loading traces differed in their maximum strain ranges, comparisons of Wtotal should be interpreted with consideration of the different deformation ranges among specimens.
3.8. Statistical Comparison of Tensile Mechanical Properties
Table 4 summarizes the statistical comparisons among the eight specimen configurations. Welch’s ANOVA identified significant differences among configurations for four of the five outcomes after Holm correction (adjusted p < 0.05), with E50–70 being the only nonsignificant parameter. Following Games–Howell pairwise comparisons with an additional Bonferroni adjustment across the five outcomes, significant differences were identified for E30–50, relative elongation at 2 N, and Wtotal. No individual pairwise differences in E50–70 or UTS remained significant after correction. Given the limited number of independent specimens, these statistical results were interpreted as exploratory.
Table 4.
Summary of statistical comparisons among the 8 specimen configurations.
3.9. Standardized Comparison of Tensile Mechanical Properties
In this study, 12 tensile mechanical parameters with different units and numerical ranges were standardized using Z-scores to compare the relative mechanical profiles of the eight specimen configurations. For each parameter, the mean value of each configuration was standardized relative to the mean and standard deviation of the eight configuration means. Table 5 presents the standardized values, with parameters grouped into four descriptive categories: tensile slopes and stresses, ultimate strength, deformation under applied loads, and tensile energy density. Positive and negative Z-scores indicate values above and below the across-configuration mean for a given parameter, respectively. Higher Z-scores do not necessarily indicate better performance. The heatmap provides a descriptive comparison of tensile-property combinations among the configurations but does not represent a composite performance ranking or indicate statistical significance.
Table 5.
Standardized mechanical-property profiles of the eight knitted configurations expressed as Z-scores.
4. Discussion
4.1. Configuration-Dependent Tensile Resistance and Deformation Compliance
A key finding of this study is that the tensile resistance and deformation compliance of SMA–nylon knitted fabrics varied not only with material composition and structural configuration but also across deformation intervals. The eight knitted configurations exhibited distinct combinations of interval-specific tensile slopes, maximum tensile stress, deformation under applied loads, and tensile energy density. These findings indicate that the mechanical response of knitted fabrics cannot be adequately characterized by a single stiffness or strength parameter. Instead, their tensile behavior should be considered in relation to the deformation range and loading conditions.
The SMA-only and nylon-only knitted fabrics provided reference configurations for examining the influence of knitting orientation on tensile behavior. Among the SMA-only specimens, Sample 2 (SMA-course) exhibited higher mean tensile slopes, stresses at the selected strain levels, and UTS than Sample 1 (SMA-wale). Directional differences were also observed in the nylon-only specimens, although their relative tensile responses changed across deformation intervals. Sample 3 (Nylon-wale) exhibited the highest mean engineering stresses at 30% and 50% strain, whereas Sample 4 (Nylon-course) exhibited the highest mean stress at 70% strain and the highest total tensile energy density. Notably, Sample 3 showed a negative mean chord tensile slope within the 50–70% strain interval, reflecting a decrease in stress after an initial peak. This reversal in the relative tensile responses of the nylon specimens demonstrates that greater resistance at an intermediate strain does not necessarily correspond to greater resistance at higher deformation. Such strain-dependent behavior may be associated with changes in loop geometry, loop reorientation, and the progressive engagement of load-bearing elements, consistent with previous studies emphasizing the structural characteristics of knitted fabrics [4,22,23].
The SMA–nylon hybrid configurations exhibited further differences associated with SMA wire arrangement. Among the hybrid specimens, Sample 7 (edge-wale) exhibited significantly higher E30–50 values than Samples 5 and 8 (course-dispersed). In contrast, Sample 8 exhibited the highest mean relative elongation at the selected applied loads, with significantly greater elongation at 2 N than Samples 1, 2, 4, and 6. Sample 6 (center-wale) showed the highest mean stress at 70% strain and tensile energy density up to 100% strain among the hybrid configurations. These results demonstrate that the selected SMA–nylon arrangements produced different combinations of tensile resistance and deformation compliance rather than a uniform increase or decrease across all mechanical parameters.
The contrasting responses of the hybrid configurations also highlight the importance of considering SMA spatial distribution alongside constituent proportions. Samples 5 and 8 shared a course-dispersed arrangement but exhibited different deformation responses, whereas Samples 6 and 7 represented contrasting center-wale and edge-wale arrangements. The relative tensile responses of these configurations depended on the strain interval and mechanical parameter considered. This suggests that the organization and spatial connectivity of SMA and nylon loops are relevant to the mechanical behavior of hybrid knitted structures. Consequently, the SMA-to-nylon loop-count ratio alone may be insufficient to characterize the tensile properties of the configurations examined.
Tensile energy density provided additional evidence that mechanical performance depends on the deformation interval. Sample 3 exhibited the highest mean tensile energy density within the initial 0–50% strain range, whereas Sample 4 exhibited the highest mean values for both W0–100 and Wtotal. Among the hybrid configurations, Sample 6 showed the highest mean W0–100, while Samples 5–7 exhibited relatively similar mean total tensile energy densities. Furthermore, Sample 4 exhibited significantly greater Wtotal than Sample 6. These results indicate that the resistance developed within a selected strain interval does not necessarily correspond to the cumulative tensile work recorded over the complete loading process. The deformation range over which tensile properties are evaluated is therefore an important consideration when comparing knitted fabric configurations.
Taken together, these findings provide a deformation-dependent perspective on the mechanical behavior of SMA–nylon hybrid knitted fabrics. The relative tensile resistance of knitted structures may change across deformation intervals, while different SMA arrangements exhibit distinct combinations of resistance, compliance, and tensile energy density. Accordingly, the mechanical characteristics of hybrid knitted fabrics are more meaningfully represented by a combination of deformation-dependent properties than by a single stiffness, strength, or SMA-content parameter. This perspective provides a basis for evaluating and selecting SMA–nylon knitted configurations according to specific mechanical requirements.
4.2. Functional Trade-Offs and Implications for Smart Compression Garments
The standardized mechanical profiles presented in Table 5 further illustrate the complementary relationships among tensile resistance, deformation compliance, and tensile energy density. The Z-score comparison revealed that configurations exhibiting relatively high values for one mechanical property did not necessarily show similarly high values for other properties. These findings emphasize the importance of evaluating mechanical-property combinations rather than selecting knitted configurations solely on the basis of maximum tensile strength, SMA-to-nylon loop-count ratio, or an individual standardized parameter.
The observed resistance–compliance relationships suggest different structural design directions for wearable applications. Configurations exhibiting relatively high tensile resistance may be appropriate candidates for applications requiring greater resistance to extension, whereas those showing greater deformation under low applied loads may be useful where flexibility and deformation accommodation are prioritized. For example, Sample 8 exhibited relatively low interval-specific tensile resistance together with high deformation under the selected loads, while Sample 2 combined relatively high tensile resistance with low deformation compliance. These contrasting profiles indicate that the preferred knitted configuration may differ depending on the mechanical demands of the intended application. An additional consideration is that tensile resistance and cumulative tensile energy density do not necessarily follow the same pattern. A knitted structure exhibiting low resistance within a limited strain interval may accumulate substantial tensile work over a broader deformation range. Conversely, high tensile resistance at an intermediate strain does not necessarily indicate high resistance or energy density at greater extension. Therefore, the mechanical evaluation of knitted fabrics intended for wearable systems should consider the deformation ranges encountered during garment application and body movement. The combination of interval-specific tensile slopes, deformation under applied loads, and tensile energy density provides a more comprehensive basis for comparing candidate structures than any individual parameter. For SMA-based smart compression garments, these findings suggest that material selection and knitted architecture should be considered together when designing structures that balance resistance to extension with deformation accommodation. The spatial arrangement of SMA wires may provide a means of developing knitted structures with different passive tensile-property profiles, even when the constituent materials are similar. Rather than identifying a universally superior configuration, the present results provide a basis for selecting contrasting knitted structures for subsequent evaluation under application-specific loading and activation conditions.
The present findings should nevertheless be interpreted within the scope of the experimental conditions. The limited number of independent specimens, the absence of a fully crossed experimental design, and the use of nominal gross cross-sectional areas restrict the interpretation of individual structural effects and intrinsic material properties. In addition, differences in maximum recorded strain affect comparisons of total tensile energy density. Because the SMA wires were not thermally activated, the measured passive tensile properties do not directly establish activation-induced contraction force or garment–body interface pressure. Future studies should therefore incorporate controlled SMA activation, cyclic loading, local deformation measurements, and garment-level pressure evaluation. Systematic variation of SMA proportion and spatial arrangement would further clarify their respective contributions to the mechanical behavior of hybrid knitted fabrics.
Overall, this study contributes a deformation-dependent framework for comparing the mechanical characteristics of SMA–nylon hybrid knitted fabrics. By considering tensile resistance, deformation compliance, and energy density together, the findings provide a structural basis for selecting candidate knitted configurations for smart compression garments and other wearable applications requiring different combinations of mechanical properties.
5. Conclusions
This study investigated the tensile behavior of eight single-jersey knitted configurations comprising SMA-only, nylon-only, and SMA–nylon hybrid fabrics under consistent full-width gripping conditions. The results demonstrated that tensile resistance, deformation compliance, and tensile energy density varied according to material composition, knitting orientation, and SMA wire arrangement. Notably, the relative tensile responses of the knitted structures changed across deformation intervals. Sample 3 (Nylon-wale) exhibited the highest mean tensile stresses at 30% and 50% strain, whereas Sample 4 (Nylon-course) exhibited the highest mean stress at 70% strain and the highest total tensile energy density. These findings demonstrate that greater tensile resistance at an intermediate strain does not necessarily correspond to greater resistance at higher deformation.
The SMA–nylon hybrid configurations exhibited distinct combinations of tensile resistance and deformation compliance associated with their structural arrangements. Sample 7 (edge-wale) showed significantly higher E30–50 values than Samples 5 and 8 (course-dispersed), whereas Sample 8 exhibited significantly greater relative elongation at 2 N than several other configurations. These results suggest that SMA wire arrangement, alongside material composition, is an important consideration in determining the mechanical-property profiles of hybrid knitted fabrics. Furthermore, tensile resistance within a specific strain interval did not necessarily correspond to the cumulative tensile energy density over the complete loading process, highlighting the importance of considering multiple mechanical parameters across different deformation ranges.
Overall, this study demonstrates the value of evaluating SMA–nylon hybrid knitted fabrics through deformation-dependent combinations of tensile resistance, deformation compliance, and tensile energy density rather than relying on a single stiffness, strength, or SMA-content parameter. This approach provides a basis for selecting knitted configurations according to the mechanical requirements of smart compression garments and other wearable applications. Further investigations incorporating controlled SMA activation, cyclic loading, and garment–body interface pressure measurements are needed to determine how these passive tensile-property profiles translate into active compression performance.
Author Contributions
Conceptualization, N.Y.K. and H.L.; methodology, H.L.; validation, N.Y.K.; formal analysis, N.Y.K.; investigation, N.Y.K.; resources, H.L.; data curation, N.Y.K.; writing—original draft preparation, N.Y.K. and H.L.; writing—review and editing, N.Y.K. and H.L.; visualization, N.Y.K. and H.L.; supervision, H.L.; project administration, H.L.; funding acquisition, H.L. All authors have read and agreed to the published version of the manuscript.
Funding
This work was supported by the National Research Foundation of Korea (NRF) grant funded by the Korea government (MSIT) (IRIS- RS-2025-00558547).
Data Availability Statement
The raw data supporting the conclusions of this article will be made available by the authors on request.
Acknowledgments
The authors used ChatGPT-6 (OpenAI) solely for language editing and improving readability. All content was reviewed and verified by the authors.
Conflicts of Interest
The authors declare no conflicts of interest.
References
- Cho, G.; Lee, S.; Cho, J. Review and Reappraisal of Smart Clothing. Int. J. Hum.–Comput. Interact. 2009, 25, 582–617. [Google Scholar] [CrossRef] [Scilit]
- Lagoudas, D.C. (Ed.) Shape Memory Alloys: Modeling and Engineering Applications; Springer: New York, NY, USA, 2008. [Google Scholar] [CrossRef] [Scilit]
- Hartl, D.J.; Lagoudas, D.C. Aerospace applications of shape memory alloys. Proc. Inst. Mech. Eng. Part G J. Aerosp. Eng. 2007, 221, 535–552. [Google Scholar] [CrossRef] [Scilit]
- Granberry, R.; Eschen, K.; Holschuh, B.; Abel, J. Functionally Graded Knitted Actuators with NiTi-Based Shape Memory Alloys for Topographically Self-Fitting Wearables. Adv. Mater. Technol. 2019, 4, 1900548. [Google Scholar] [CrossRef] [Scilit] [PubMed]
- Granberry, R.M.; Eschen, K.P.; Ross, A.J.; Abel, J.M.; Holschuh, B.T. Dynamic countermeasure fabrics for Post-Spaceflight orthostatic intolerance. Aerosp. Med. Hum. Perform. 2020, 91, 525–531. [Google Scholar] [CrossRef] [Scilit] [PubMed]
- Lee, S.-M.; Jung, W.-K.; Park, J.; Ahn, S.-H. Development of a 4D hand gripping aid using a knitted shape memory alloy and evaluation of finger-bending angles in elderly women. Fash. Text. 2022, 9, 11. [Google Scholar] [CrossRef] [Scilit]
- Lee, S.-M.; Park, J. A soft wearable exoglove for rehabilitation assistance: A novel application of knitted shape-memory alloy as a flexible actuator. Fash. Text. 2024, 11, 14. [Google Scholar] [CrossRef] [Scilit]
- ASTM F2516-18; Standard Test Method for Tension Testing of Nickel-Titanium Superelastic Materials. ASTM International: West Conshohocken, PA, USA, 2018. [Google Scholar] [CrossRef] [Scilit]
- ASTM D5035-11(2024); Standard Test Method for Breaking Force and Elongation of Textile Fabrics (Strip Method). ASTM International: West Conshohocken, PA, USA, 2024. [Google Scholar] [CrossRef] [Scilit]
- ISO 13934-1:2013; Textiles—Tensile Properties of Fabrics—Part 1: Determination of Maximum Force and Elongation at Maximum Force Using the Strip Method. ISO: Geneva, Switzerland, 2013.
- du Pasquier, C.; Jeong, S.; Liu, P.; Williams, S.; Mnejja, N.; Okamura, A.M.; Tibbits, S.; Chen, T. Multi-level mechanical modeling and computational design framework for weft knitted fabrics. Extrem. Mech. Lett. 2026, 82, 102423. [Google Scholar] [CrossRef] [Scilit]
- Shanahan, W.J.; Postle, R. 23—A theoretical analysis of the tensile properties of plain-knitted fabrics. Part i: The load-extension curve for fabric extension parallel to the courses. J. Text. Inst. 1974, 65, 200–212. [Google Scholar] [CrossRef] [Scilit]
- Shanahan, W.J.; Postle, R. 28—A theoretical analysis of the tensile properties of plain-knitted fabrics. Part ii: The initial load-extension behaviour for fabric extension parallel to the wales. J. Text. Inst. 1974, 65, 254–260. [Google Scholar] [CrossRef] [Scilit]
- Dinh, T.D.; Weeger, O.; Kaijima, S.; Yeung, S.-K. Prediction of mechanical properties of knitted fabrics under tensile and shear loading: Mesoscale analysis using representative unit cells and its validation. Compos. B Eng. 2018, 148, 81–92. [Google Scholar] [CrossRef] [Scilit]
- NIST/SEMATECH. E-Handbook of Statistical Methods: Linear Least Squares Regression; National Institute of Standards and Technology: Gaithersburg, MD, USA, 2012. Available online: https://www.itl.nist.gov/div898/handbook/pmd/section1/pmd141.htm (accessed on 1 October 2026).
- ASTM E111-17(2025)e1; Standard Test Method for Young’s Modulus, Tangent Modulus, and Chord Modulus. ASTM International: West Conshohocken, PA, USA, 2025. [Google Scholar] [CrossRef] [Scilit]
- Callister, W.D., Jr.; Rethwisch, D.G. Materials Science and Engineering: An Introduction, 10th ed.; John Wiley & Sons: Hoboken, NJ, USA, 2018. [Google Scholar]
- Montgomery, D.C.; Runger, G.C. Applied Statistics and Probability for Engineers, 7th ed.; John Wiley & Sons: Hoboken, NJ, USA, 2018. [Google Scholar]
- Teyeme, Y.; Malengier, B.; Tesfaye, T.; Vasile, S.; Endalew, W.; Van Langenhove, L. Predicting Compression Pressure of Knitted Fabric Using a Modified Laplace’s Law. Materials 2021, 14, 4461. [Google Scholar] [CrossRef] [Scilit] [PubMed]
- Chapra, S.C.; Canale, R.P. Numerical Methods for Engineers, 8th ed.; McGraw-Hill Education: New York, NY, USA, 2021. [Google Scholar]
- Burden, R.L.; Faires, J.D.; Burden, A.M. Numerical Analysis, 10th ed.; Cengage Learning: Boston, MA, USA, 2016. [Google Scholar]
- Eschen, K.; Granberry, R.; Abel, J. Guidelines on the design, characterization, and operation of shape memory alloy knitted actuators. Smart Mater. Struct. 2020, 29, 035036. [Google Scholar] [CrossRef] [Scilit]
- Kim, S.; Kim, J. Analysis of driving forces of 3D knitted shape memory textile actuators using scale-up finite element method. Fash. Text. 2022, 9, 38. [Google Scholar] [CrossRef] [Scilit]



Disclaimer/Publisher’s Note: The statements, opinions and data contained in all publications are solely those of the individual author(s) and contributor(s) and not of MDPI and/or the editor(s). MDPI and/or the editor(s) disclaim responsibility for any injury to people or property resulting from any ideas, methods, instructions or products referred to in the content. |
© 2026 by the authors. Licensee MDPI, Basel, Switzerland. This article is an open access article distributed under the terms and conditions of the Creative Commons Attribution (CC BY) license.