


Abstract
The growing volume of textile waste increases the need for effective chemical recycling methods. The hydrochloric acid-based polycotton recycling process offers a route to valorize polycotton textiles (polyester/cotton blends in any ratio) in two steps. First, cotton is selectively hydrolyzed with superconcentrated hydrochloric acid at ambient temperature, enabling its separation from polyester. The resulting saccharides are then converted and simultaneously extracted at 91 °C as 5-chloromethylfurfural (CMF). This preliminary study examined whether dye molecules present in polycotton waste textiles affect the performance and product of the recycling process. The CMF production was not affected by the presence of dyes; however, the heat required for this step caused dye degradation. To prevent contamination of the product by the dye molecules and their degradation products, two types of activated carbon (AC) were evaluated as dye adsorbents. Both proved effective at removing dye molecules from hydrolysates produced from four types of post-consumer polycotton waste. However, although the use of ACs resulted in decolorized hydrolysates, it resulted in lower CMF yields in the subsequent conversion step. Therefore, the use of AC is not recommended in the current laboratory setup.
1. Introduction
The global textile industry has grown immensely over recent decades due to increased consumption, (ultra) fast fashion trends, and population growth [1,2,3]. Particularly under the current linear model of production and disposal [4], most discarded textiles (80 wt%) end up in landfills or incineration. In total, 12 wt% is reused, 7 wt% is downcycled to lower-value applications such as carpet padding and insulation for cars and merely 1 wt% is recycled into new textiles [5,6].
Despite the increasing interest in recycling, textile recycling remains technically challenging. The complexity of textile materials is one of the main reasons causing these challenges [7,8,9]. Nowadays, fabrics rarely consist of a single fiber type; instead, they often comprise blends of natural fibers (such as cotton) and synthetic polymers (such as polyester, nylon, and elastane) [1,3,7,10]. In addition to fiber blends, textiles contain a wide variety of chemical additives, such as dyes, flame retardants, coatings, pigments (logos and printed graphics) and finishing agents [7]. All these factors limit the efficiency of both mechanical and chemical recycling methods, leading to low recycling rates or down-cycling of these materials as only option.
Although dyes are reported to hamper textile recycling [11,12], they are extensively used in the textile industry. While they typically account for only 1–5% of the fiber weight of the garment [13], over 100,000 commercial dyes are known [14,15]. The general structure of a dye molecule contains two important components—the chromophore and the auxochrome [16,17,18]. The chromophore is a conjugated system able to show absorption in the visible region [16,18,19]. The auxochrome is a functional group attached to the chromophore able to intensify the color, improve solubility and enhance the affinity towards the fiber [17,20,21]. The most common chromophores contain for instance carbon–carbon double bonds (–C=C–), carbon–nitrogen double bonds (–C=N–), carbonyl groups (–C=O), azo groups (–N=N–), nitro groups (–NO2), methine groups (=CH–), and quinoid rings. The available auxochromes include carboxylates (–COOH), amines (–NH2), sulfonates (–SO3H), and hydroxyls (–OH) [22]. Due to the complexity of the color nomenclature based on chemical structures, dyes are often classified according to their application. Common classes include disperse, reactive, direct, vat, basic, acid, and sulfur dyes, of which disperse and reactive dyes are the most widely used for polyester and cotton, respectively [23,24]. The different nature of the two fibers in polycotton requires the use of different dye classes for effective coloration. Polyester, a hydrophobic and non-ionic synthetic fiber, lacks the reactive functional groups required for conventional dyes used on natural fibers [8,25]. As a result, it must be dyed with the water-insoluble disperse dyes applied in aqueous dispersion systems. Effective dyeing of polyester requires high temperatures and pressures to promote deep diffusion of the dyes into the fiber [12,21,26,27]. The disperse dye and polyester fiber interaction is primarily via hydrogen bonding and van der Waals forces [21,28]. In contrast, cotton is typically dyed with reactive dyes, which are capable of forming covalent bonds with the fiber [12]. The electrophilic groups of the dye react with the nucleophilic hydroxyl groups of cotton [24]. Therefore, to achieve properly dyed polycotton materials, a ‘two-bath, two stage’ process is widely used [24,29,30]. In this approach, polyester is first dyed with disperse dyes at 130 °C for 55 min in an acidic environment with acetic acid, after which the cotton component is dyed with reactive dyes at 60 °C for 30 min in an alkaline environment with sodium carbonate [24,31].
The dyes are designed to exhibit high chemical and photolytic stability, and while these properties are desirable during textile use, they can become problematic during recycling processes [8]. In chemical recycling, the dyes can interfere with depolymerization reactions and reduce the purity of the recovered products [7]. Since a single item of clothing already contains multiple different dye molecules [29], the use of post-consumer textile waste as feedstock for chemical recycling results in an immense mixture of different dye embodiments. This makes the recycling of post-consumer textile waste even more challenging. Also, decolorization of the textiles remains challenging, as conventional methods may involve harsh chemicals, generate secondary pollution, leading to degradation of the dyes and the polymer backbone, or result in economically unviable processes.
A common method for dye removal is via adsorption with activated carbon (AC) [32,33,34]. Many textile industries use commercial activated carbon for dye removal and their waste products [35]. ACs are known for their large specific surface, porous structure and are attractive to use due to their simplicity, low cost and easy tailoring of their physical and/or chemical properties [33,34]. The adsorption of dye molecules on activated carbon is affected by many factors, including the interaction between the adsorbate and adsorbent, the AC surface area and pore structure, the AC surface chemistry, the effect of other components, the characteristics of the dye molecule, AC particle size, pH, temperature, adsorbent dosage and contact time [33,35].
With the Dawn Technology®, a large fraction of the post-consumer textile waste can be tackled. Avantium has developed a hydrochloric acid (HCl)-based recycling system to completely valorize polycotton materials [10,36,37]. This process enables full valorization of the cotton component by separating and converting it into 5-(chloromethyl)furfural (CMF). The residual polyester fraction can conveniently be recycled via conventional recycling methods. In previous work, we identified the effects and behavior of different fiber categories (cellulose-based, synthetic, and animal) on the HCl-based polycotton recycling process [38]. However, to date, little information is known to what extent the different dye molecules affect the HCl-based recycling process, thus the cellulolysis reaction and CMF production, their products, and the associated acid and solvent recycles. Therefore, the focus of this research is to obtain initial insights into the effect and behavior of different dye embodiments within the Dawn Technology®. In addition, the removal of dyes from the process in between the first cellulolysis step and the second CMF production step using activated carbon is investigated.
2. Materials and Methods
2.1. Materials
Five different colors of (twisted) mercerized cotton yarn and four different types of post-consumer polycotton textiles were used. Unless otherwise stated, all chemicals and feedstocks were used directly as received (no pretreatment such as washing or size reduction). A 44 wt% hydrochloric acid solution was produced by absorbing gaseous HCl into an aqueous hydrochloric acid solution with an initial concentration of 35–36 wt%. The final acid concentration was verified by titration of a tenfold diluted sample with 0.1 M sodium hydroxide at 25 °C using a 716 DMS Titrando unit (Metrohm AG, Herisau, Switzerland). Chlorobenzene (PhCl) (99.8%) was sourced from Fisher Scientific Solvents (Waltham, MA, USA). Two activated carbons (ACs) in powder form were generously supplied by Norit Activated Carbon (Amersfoort, The Netherlands); Norit DX 1 (AC1) and Norit KB-EV SUPRA (AC2) and their characteristics can be found in Table 1.
Table 1.
General characteristics of the used activated carbon (AC1 and AC2).
2.2. Two-Step Batch Process
The behavior of the dye molecules in the two-step batch process was investigated. Five different colors of mercerized yarn were first subjected to cellulolysis followed by step two, the CMF production. For each experiment, 50 mg of yarn and 1 mL of a 44 wt% hydrochloric acid solution were placed in a 9 mL Ace Glass pressure tube (Ace Glass Inc., Vineland, NJ, USA), together with a rare earth core stirring egg. The dissolution and hydrolysis of cotton, i.e., cellulolysis, was executed for 90 min at room temperature without agitation. After 90 min, PhCl (4 mL) was added and the reaction mixture was heated to 91 °C while stirring at 900 rpm for an additional hour. After the reaction period, the reactor was cooled and the liquid phases were allowed to separate naturally. The chlorobenzene layer was collected with a syringe and the aqueous layer was washed with additional chlorobenzene (three times with 2 mL) to maximize CMF recovery. The initial organic fraction and the organic washings were combined and characterized by gas chromatography (GC). The aqueous layer was diluted before being evaluated using high-performance liquid chromatography (HPLC). All reactions were performed in triplicate.
2.3. Dye Adsorption
The removal of dyes with activated carbon (AC) was tested using four different types of post-consumer polycotton textiles. In these experiments, two different types of AC were used. Three different concentrations of AC were employed: low (±2 mg/mL), medium (±5 mg/mL) and high (±10 mg/mL). The hydrolysate was prepared from 3 g of textile in 40 mL 44 wt% HCl and hydrolyzed for 24 h. Then, the hydrolysate was treated with the desired quantity and type of AC for 60 min at 600 rpm and room temperature. After adsorption, the AC was separated from the hydrolysate via gravity filtration with a glass filter paper (Whatman GF/D, pore size 2.7 μm (Cytiva, Maidstone, UK)). The decolored hydrolysate was analyzed by ultraviolet–visible spectrophotometry (UV–Vis) and HPLC.
2.4. Post-Hydrolysis on Decolored Hydrolysate
A post-hydrolysis was performed on the decolored hydrolysate by diluting the solution to 1 wt% hydrochloric acid and heating it for 60 min at 120 °C while mixing at 1000 rpm. The post-hydrolysate was analyzed by HPLC.
2.5. CMF Production from Decolorized Hydrolysate
For the CMF production from decolorized hydrolysate, the red and green mercerized cotton yarns were used. The material (50 mg) was first subjected to cellulolysis using 1 mL 44 wt% HCl in an Ace Glass pressure reactor for 1.5 h at room temperature. Subsequently, the reactors were cooled in a freezer (−20 °C) for 15 min to promote reabsorption of gaseous HCl into solution. Then, activated carbon (AC2) was added at a high concentration (10 mg/mL) and the mixture was stirred at 600 rpm for 20 min at room temperature. After adsorption, the reactor was again placed in the freezer for 15 min, after which the solution was filtered through a wetted glass filter paper (Whatman GF/D, pore size 2.7 μm). The resulting filtrate (i.e., the decolorized hydrolysate) was combined with 4 mL PhCl in a reactor. The reaction mixture was then heated to 91 °C and stirred magnetically at 900 rpm for 60 min. After the reaction, the reactor was allowed to cool before the chlorobenzene was separated by syringe. The remaining aqueous layer was washed three consecutive times with chlorobenzene (2 mL) to maximize the recovery of CMF. The chlorobenzene reaction layer and the combined PhCl washing liquids were characterized by GC. All reactions were performed in triplicate.
2.6. Analytical Methods
2.6.1. Gas Chromatography
CMF produced in the two-step batch reaction was evaluated through gas chromatography analysis with flame ionization detection. Measurements were performed on a Trace 1310 GC (Thermo Scientific (Waltham, MA USA)) with an Agilent J&W DB-624 UI (30 m × 0.25 mm × 1.4 µm) column (Santa Clara, CA, USA) and operated with helium as carrier gas. A known amount of 1,4-dioxane was added as an internal standard and the reported CMF yields were expressed as a percentage of the initial anhydroglucose quantity in the starting material (Equation (1)).
2.6.2. High-Performance Liquid Chromatography
Residual glucose concentrations were determined using an Agilent 1260 Infinity HPLC system equipped with both diode-array detection and refractive index detection. The characterization was performed with an Aminex HPX-87H (300 × 7.8 mm; particle size 9 µm) separation column (BIO-RAD Laboratories, Hercules, CA, USA), with a column temperature of 50 °C. A 5 mM H2SO4 solution was used as the eluent with a flow of 0.6 mL/min. The measured glucose concentration was subsequently converted into a residual glucose yield based on the initial anhydroglucose content of the starting material according to Equation (2).
2.6.3. Ultraviolet–Visible Spectrophotometry
The dual beam Thermo Scientific Genesys 150 Ultraviolet–visible (UV–Vis) spectrophotometer (Waltham, MA, USA) was used to determine the absorption spectra over a wavelength range of 380–750 nm. Semi-micro cuvettes were used with a length of 1 cm.
3. Results
3.1. Dye Behavior in HCl-Based Polycotton Recycling Process
In the two-step HCl-based recycling process the polycotton material is first subjected to cellulolysis with HCl (>42 wt% HCl, room temperature, 1.5 or 24 h) to dissolve and hydrolyze cotton, which results in separation of the cotton and polyester fibers. After the first step, the residual polyester is removed from the process and the acidic saccharide solution is treated in the second step in which CMF is produced and extracted. Because dyeing polyester requires much harsher conditions to facilitate physical bonding of disperse dyes deep into the polyester fiber, it was not expected that the milder cellulolysis conditions would leach these disperse dyes from the synthetic fibers. In previous experiments, we have also seen that polyester residues after the hydrolysis retained a similar, although slightly faded, color as before treatment [10], whereas all the dyes embodiments of cotton end up in the solution due to the disintegration of the cotton fiber. Therefore, we started focusing on cellulose fibers.
To investigate the behavior of different dye molecules during the polycotton recycling process, a range of colors was selected. Mercerized cotton yarns in five colors (red, purple, green, blue and black (Figure S1)) were used. All yarns were from the same brand to minimize variation in the starting material, in hope of determining the behavior of only the dye molecules. Additionally, a glucose reference was included as a dye-free baseline for the reaction mixture during the reaction. The materials were treated in a two-step batch process, with 1.5 h of cellulolysis and 1 h of CMF production. In the first step, 50 mg material was added to the reactor with 1 mL 44 wt% HCl. The cellulolysis reaction was performed without stirring and at room temperature. In the second step, 4 mL PhCl was added and the reactors were treated at 91 °C and 900 rpm for 1 h. During the cellulolysis step, it was directly observed that the blue yarn turned pink, indicating that this dye molecule is most likely pH-sensitive (Figure S2). All other yarns retained their color and the blank remained colorless.
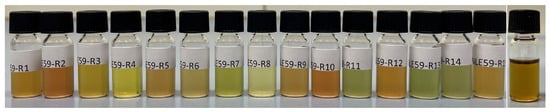
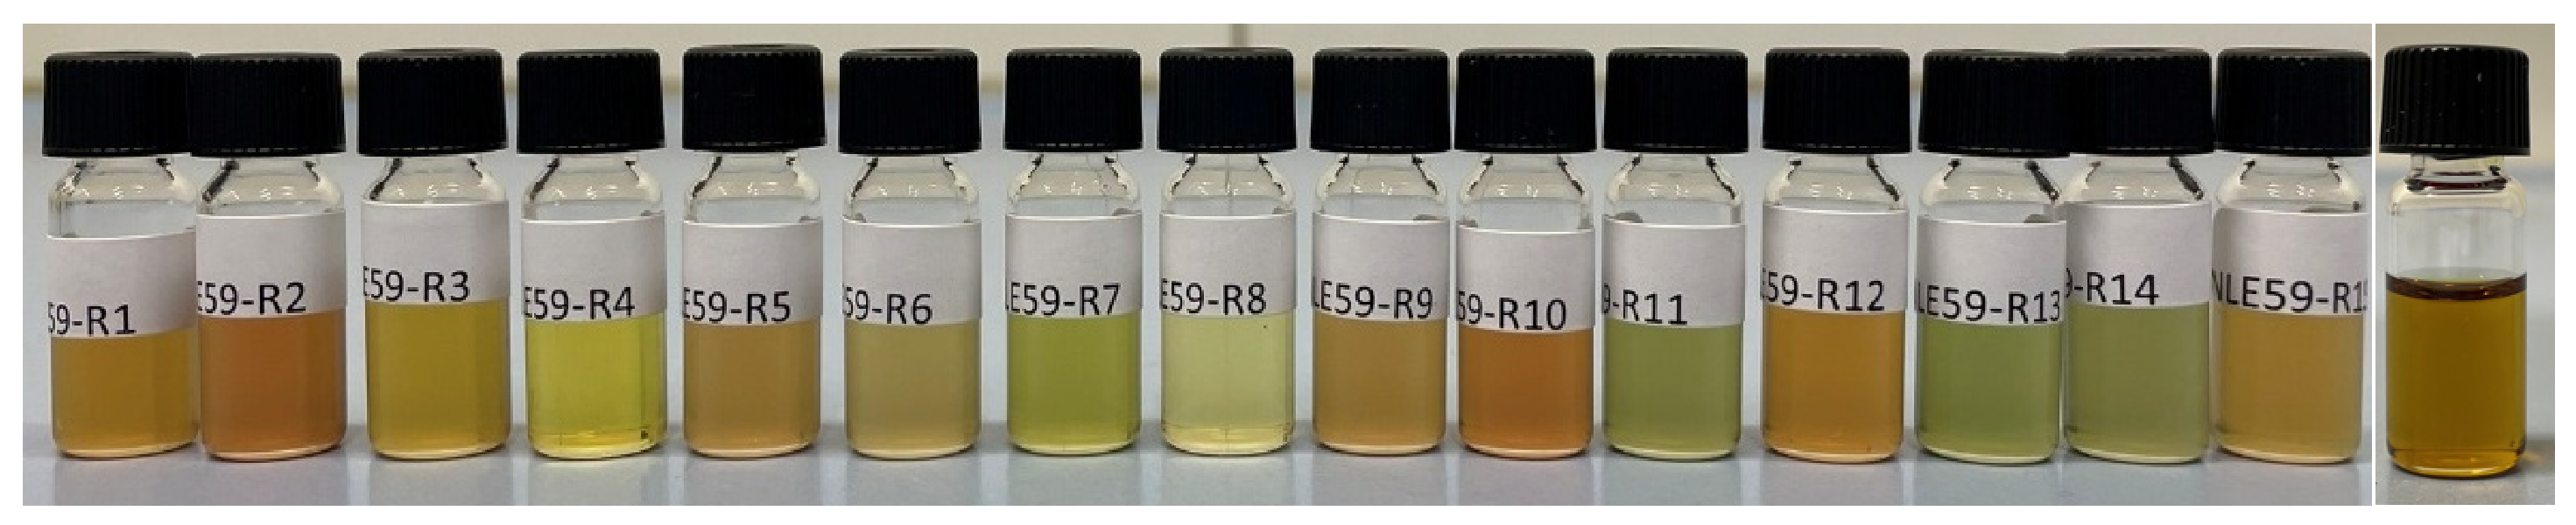
To perform the second step of the valorization process, the conversion to CMF, chlorobenzene was added to extract the CMF out of their acid layer as soon as it is formed. As the dye molecules themselves are polar compounds, a high affinity with the acidic aqueous layer and minimal affinity with the slightly polar PhCl was expected. This was also confirmed when the biphasic mixture was shaken vigorously, as none of the dye embodiments transferred to the organic layer (Figure S3). However, after heating the reaction mixture for 60 min at 91 °C, the obtained organic layers have a variety of colors ranging from yellow to orange to green (Figure 1). A yellow color was expected as CMF is frequently observed as yellow to dark brown [39], which is also visible in the reference sample. The other colors indicate that there might be dye molecules present in the organic layer. Yet, there is no trend whatsoever visible between the initial color of the yarn and the eventual color of the organic layer, as the triplicates of each colored yarn showed no uniform color. Additionally, the measured CMF concentration in the organic layers also showed no correlation with the color of the solution (Table S1).
Figure 1.
Organic reaction layers (all triplicates) from the 5-(chloromethyl)furfural (CMF) production (step 2) of the two-step batch reaction of dyed cotton. Initial colors from left to right: red (R1–R3), purple (R4–R6), green (R7–R9), blue (R10–R12) and black (R13–R15). The unlabeled vial at the far right is the reference sample with glucose.
There was no clear trend observed between the organic washing layer of the tested colored yarns (Figure 1) and the color of the obtained organic solutions after CMF production (Figure S4). Thus, the dye molecules seem to degrade when using higher temperatures, while they were unaffected (except blue) during the cellulolysis step. The higher temperature could lead to the loss of carbon–carbon double bonds and carbon–nitrogen double bonds, reducing the color of dyes [40]. Additionally, these dye degradation products seem to have more affinity with the organic layer compared to the original dye molecules. In principle, the dye molecules could also react with CMF to form covalently bonded macromolecules or crosslinked structures. However, further research would be needed to confirm the production of these compounds.
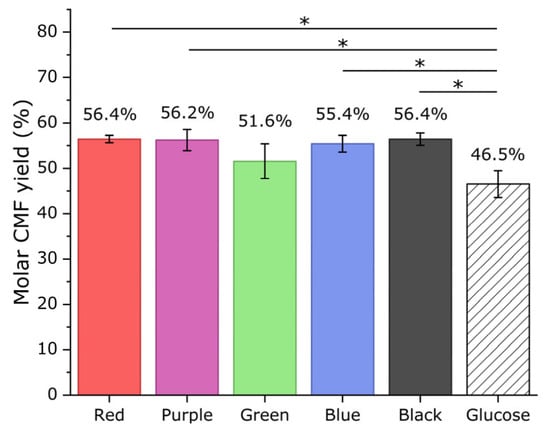
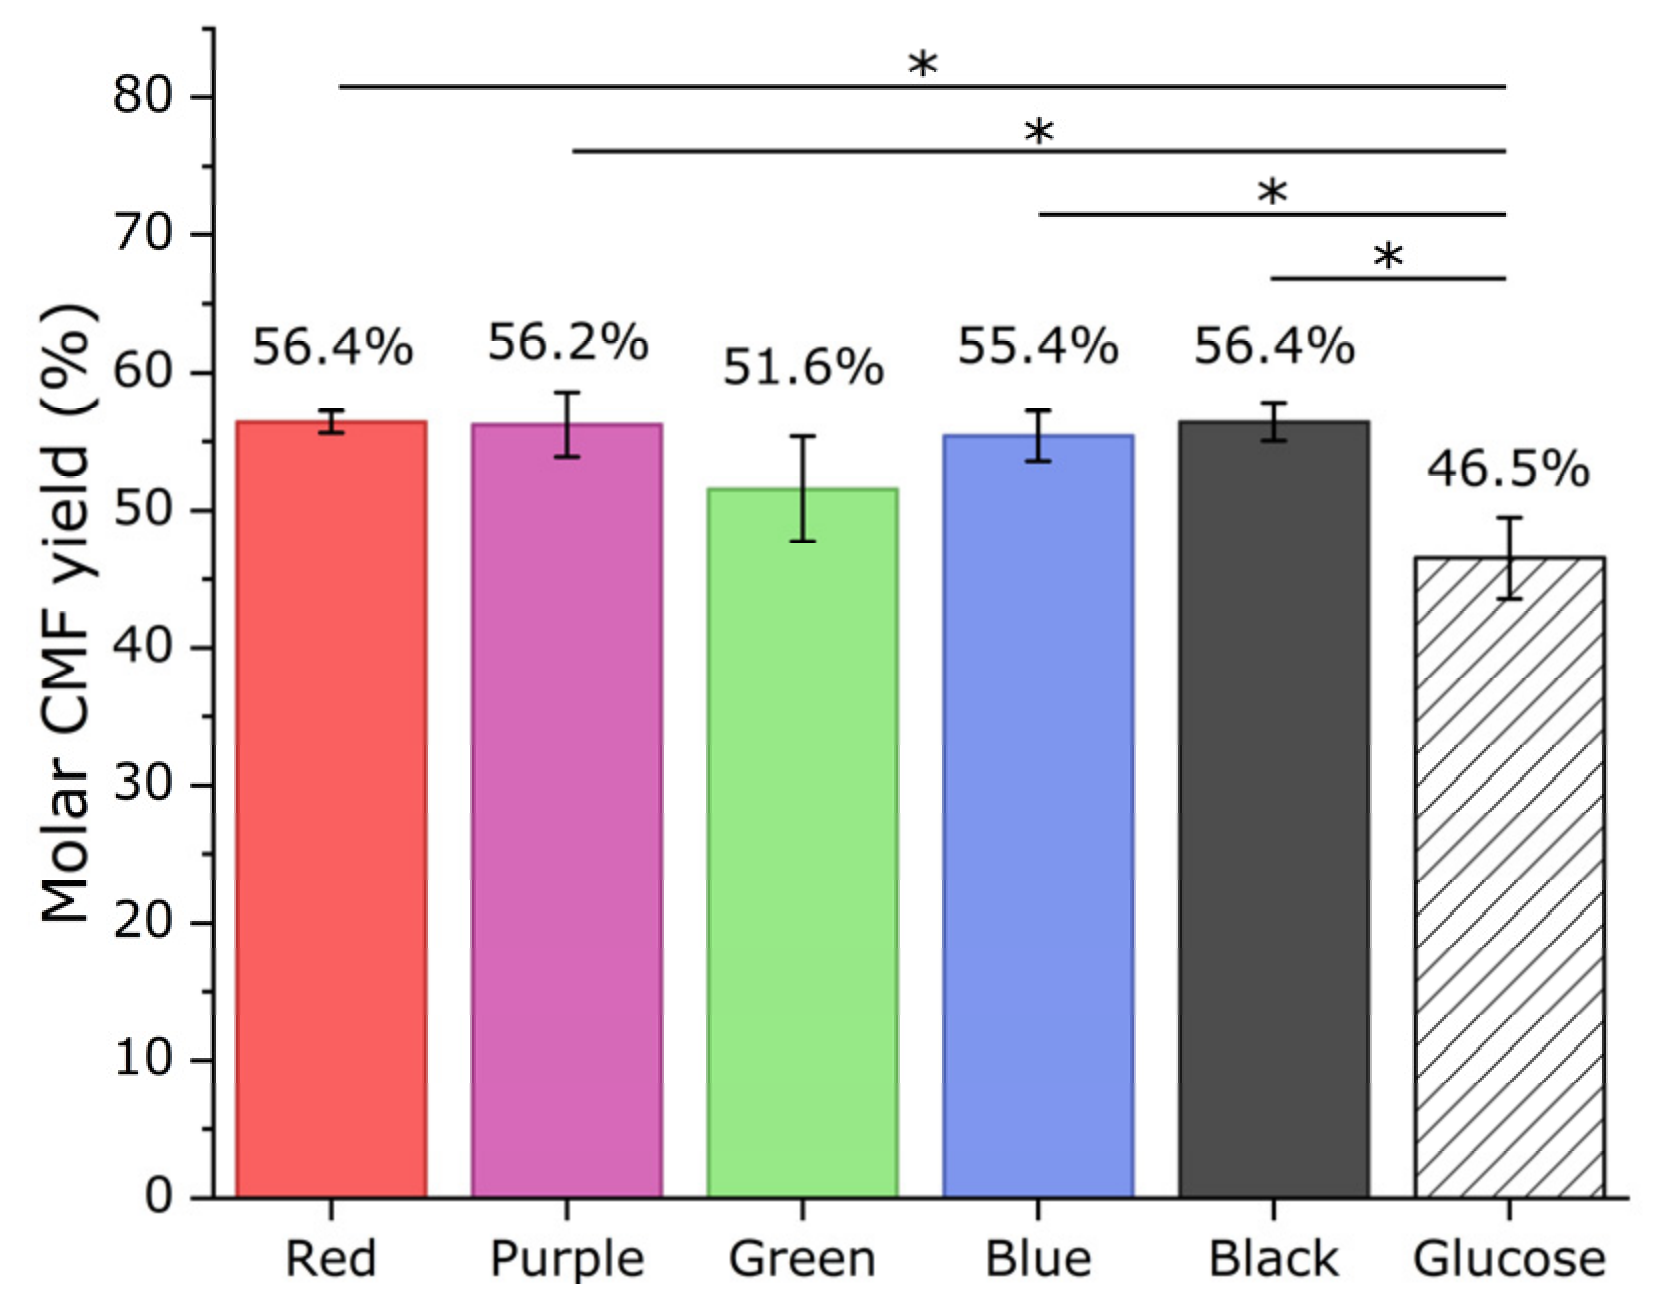
When considering the CMF yield of the different colored yarns (Figure 2), no significant variations in the CMF yield of the different dye embodiments was found. The molar CMF yield varied from 52 to 57% for the colored sample and a one-way analysis of variance (ANOVA) indicates no statistically significant differences between the CMF yields of the different colored yarns. The CMF yield of the dyed samples is significantly higher compared to the dye-free glucose sample, except for the CMF yield of the green sample. This difference is likely not caused by the presence of dyes, but rather by differences in the saccharide composition. The dyed samples contain a high concentration of oligomeric saccharides as a result of the 1.5 h cellulolysis step, whereas the dye-free glucose samples consist of monomeric glucose. The presence of oligomeric saccharides can influence the reaction network by delaying hydrolysis to monosaccharides and thus also delay the formation of degradation products levulinic acid, formic acid and humins. At low saccharide loadings (8 mg/mL) this effect was not observed [37], whereas at higher loadings (50 mg/mL) it becomes more pronounced.
Figure 2.
Molar CMF yield of differently colored mercerized cotton yarns and dye-free glucose reference sample. Reaction conditions two-step batch synthesis: 1. Cellulolysis of 1.5 h with 50 mg yarn and 1 mL hydrochloric acid (HCl) (44 wt%) at ambient temperature, 2. Synthesis of CMF with 4 mL chlorobenzene (PhCl), 91 °C, 1 h, 900 rpm. The dye-free glucose reference was only subjected to step 2. Statistical differences were analyzed with a one-way ANOVA post hoc Tukey test. * p ≤ 0.05.
The aqueous layer after CMF production contains a certain amount of humins, leading to an extremely dark solution (Figure S5) [41]. After filtration of these solutions (Figure S6), all show a yellow/brown color, like the glucose sample. This color is caused by the presence of 5-(hydroxymethyl)furfural in the aqueous layer, which is known for its yellow/brown color [42]. The brown color could also indicate the presence of soluble humins [43]. Overall, the majority of dye molecules seem to degrade as the initial color of the materials disappeared during the course of the reaction.
To conclude, the dye molecules used for cellulose dyeing degraded due to the use of elevated temperatures with possible extraction to the organic layer. This seems not to affect the CMF yield; however, it will lead to a variety of dye degradation products present in both the organic and aqueous layer. Therefore, decoloration of the aqueous layer before CMF production with activated carbon was investigated to prevent the migration of the dye molecules and their degradation products.
3.2. Adsorption of Dyes from the Hydrolysate with Activated Carbon
3.2.1. Effect of Different Dye Molecules and AC Quantities on the Adsorption Performance
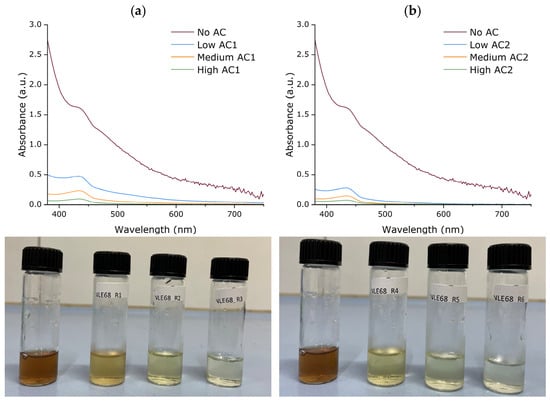
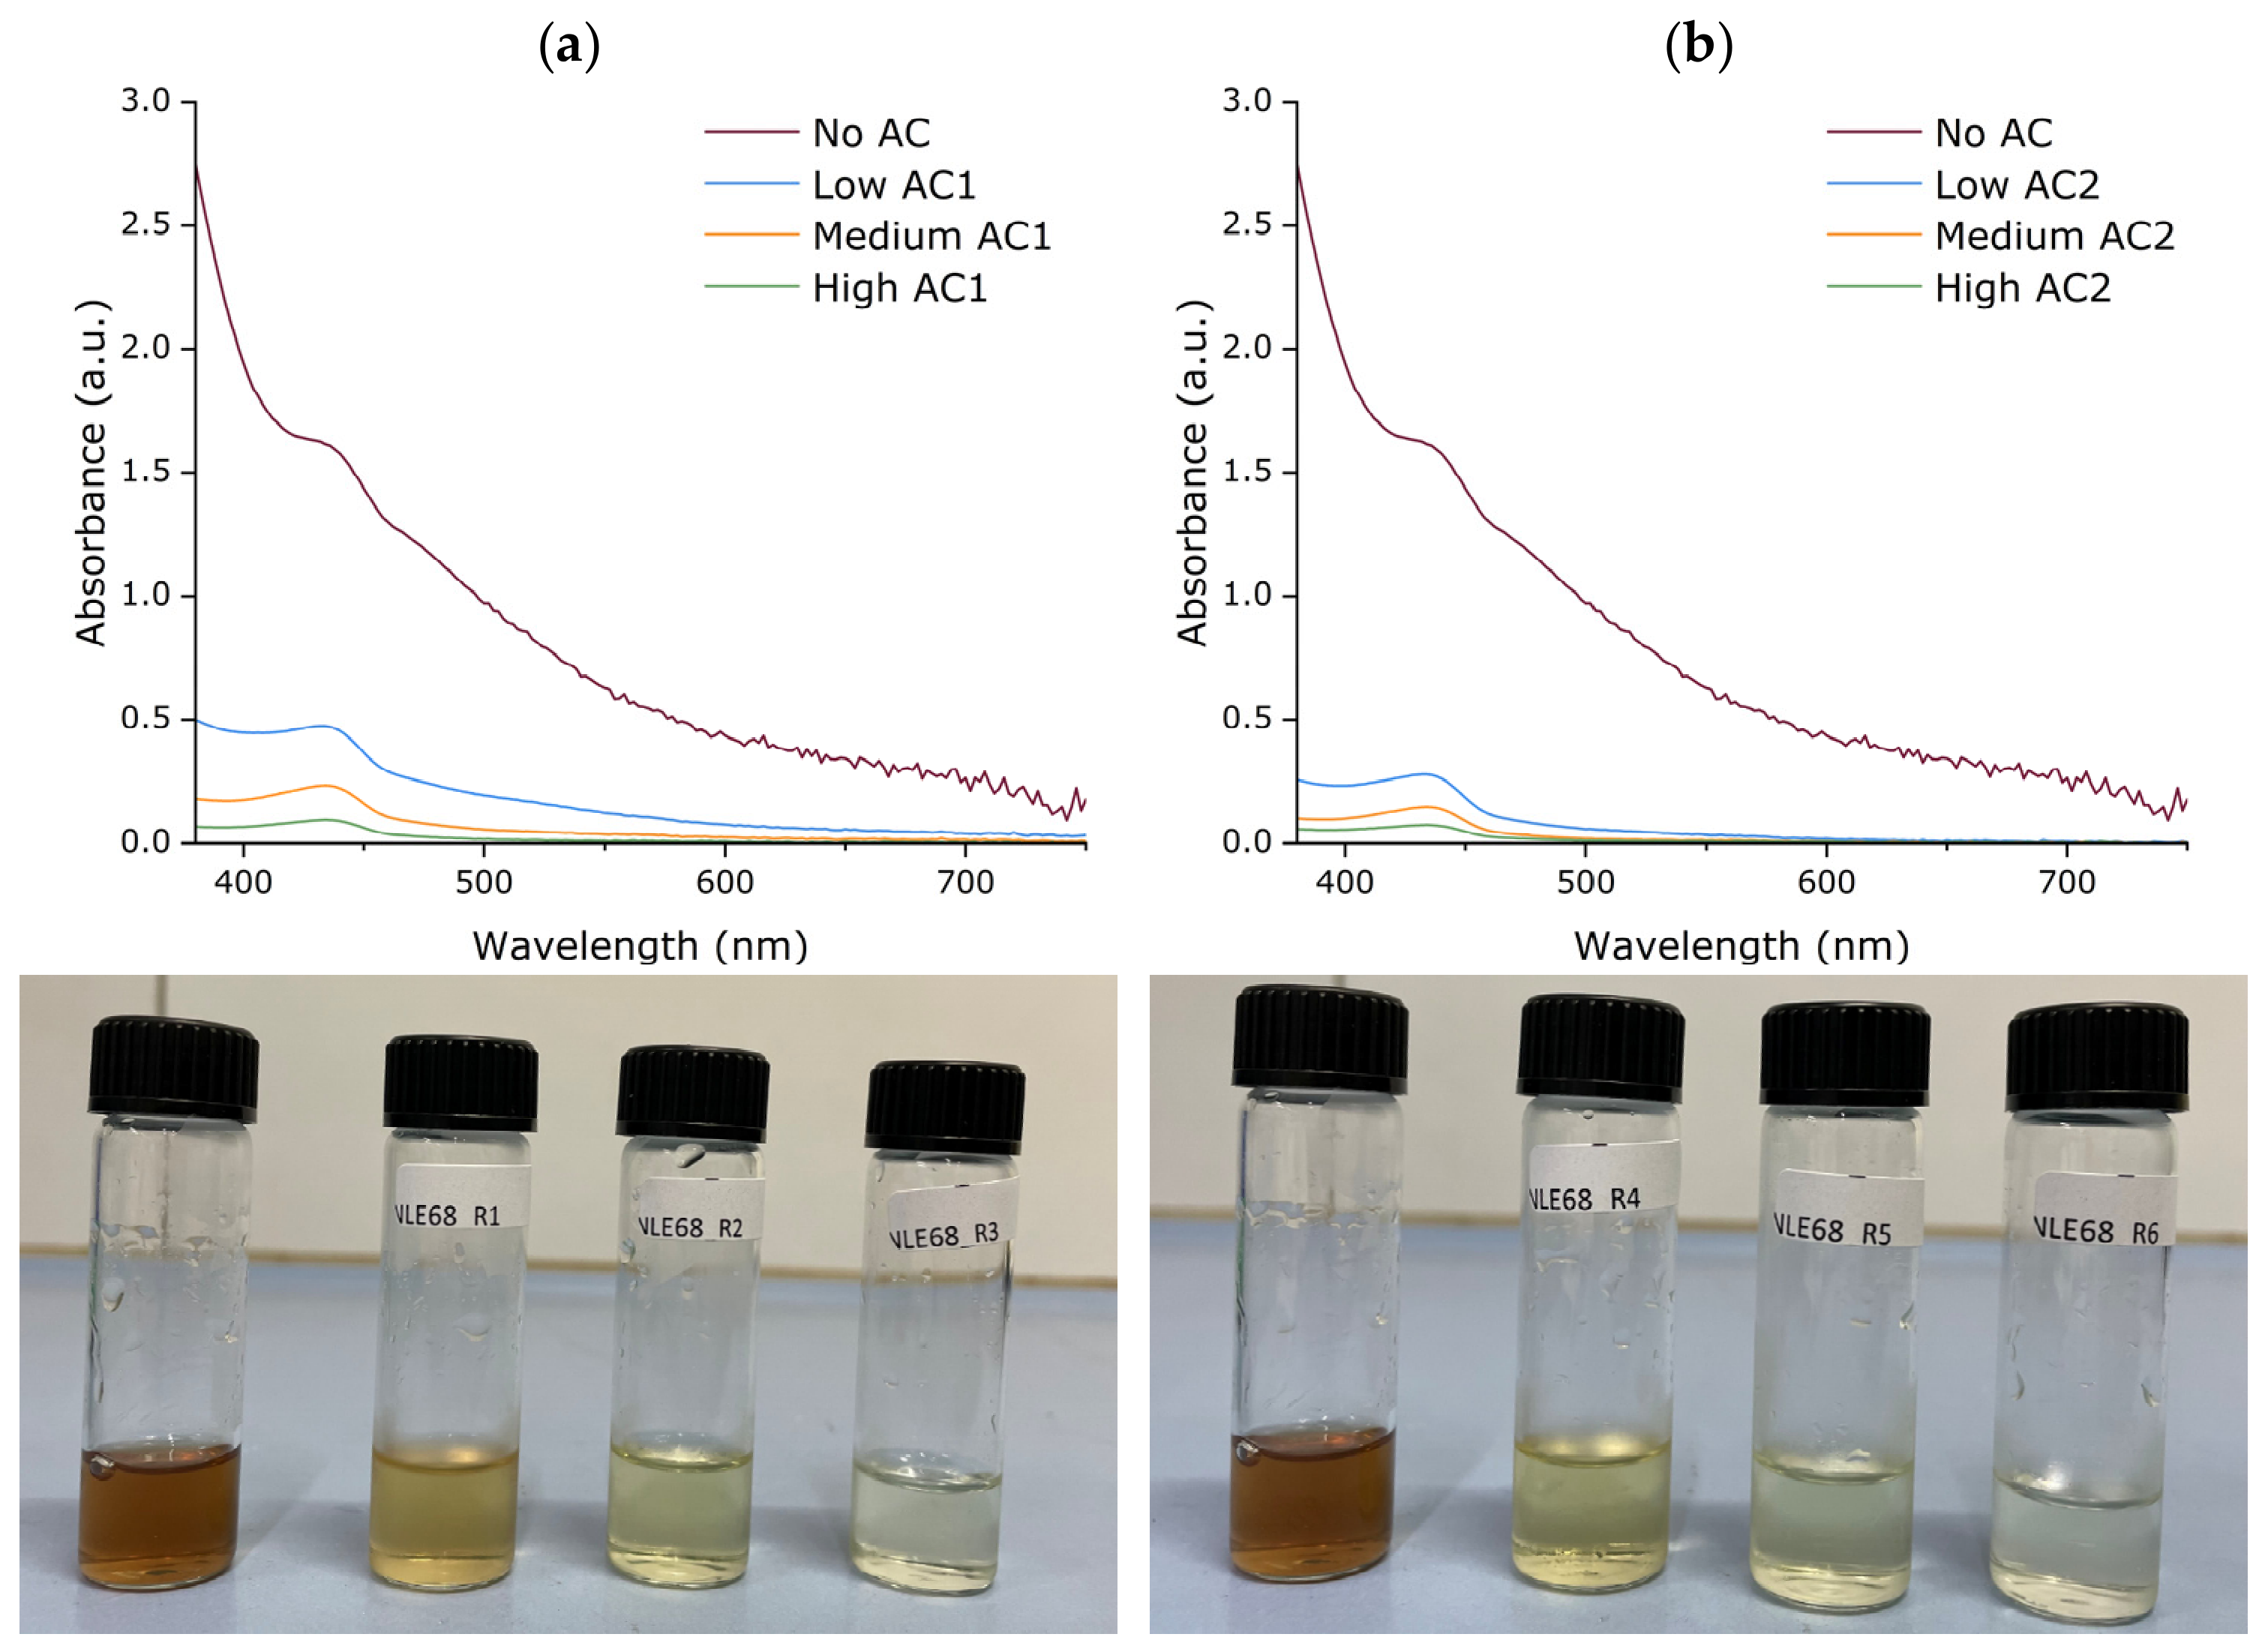
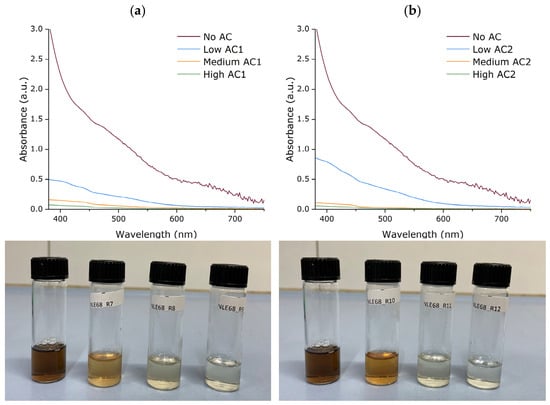
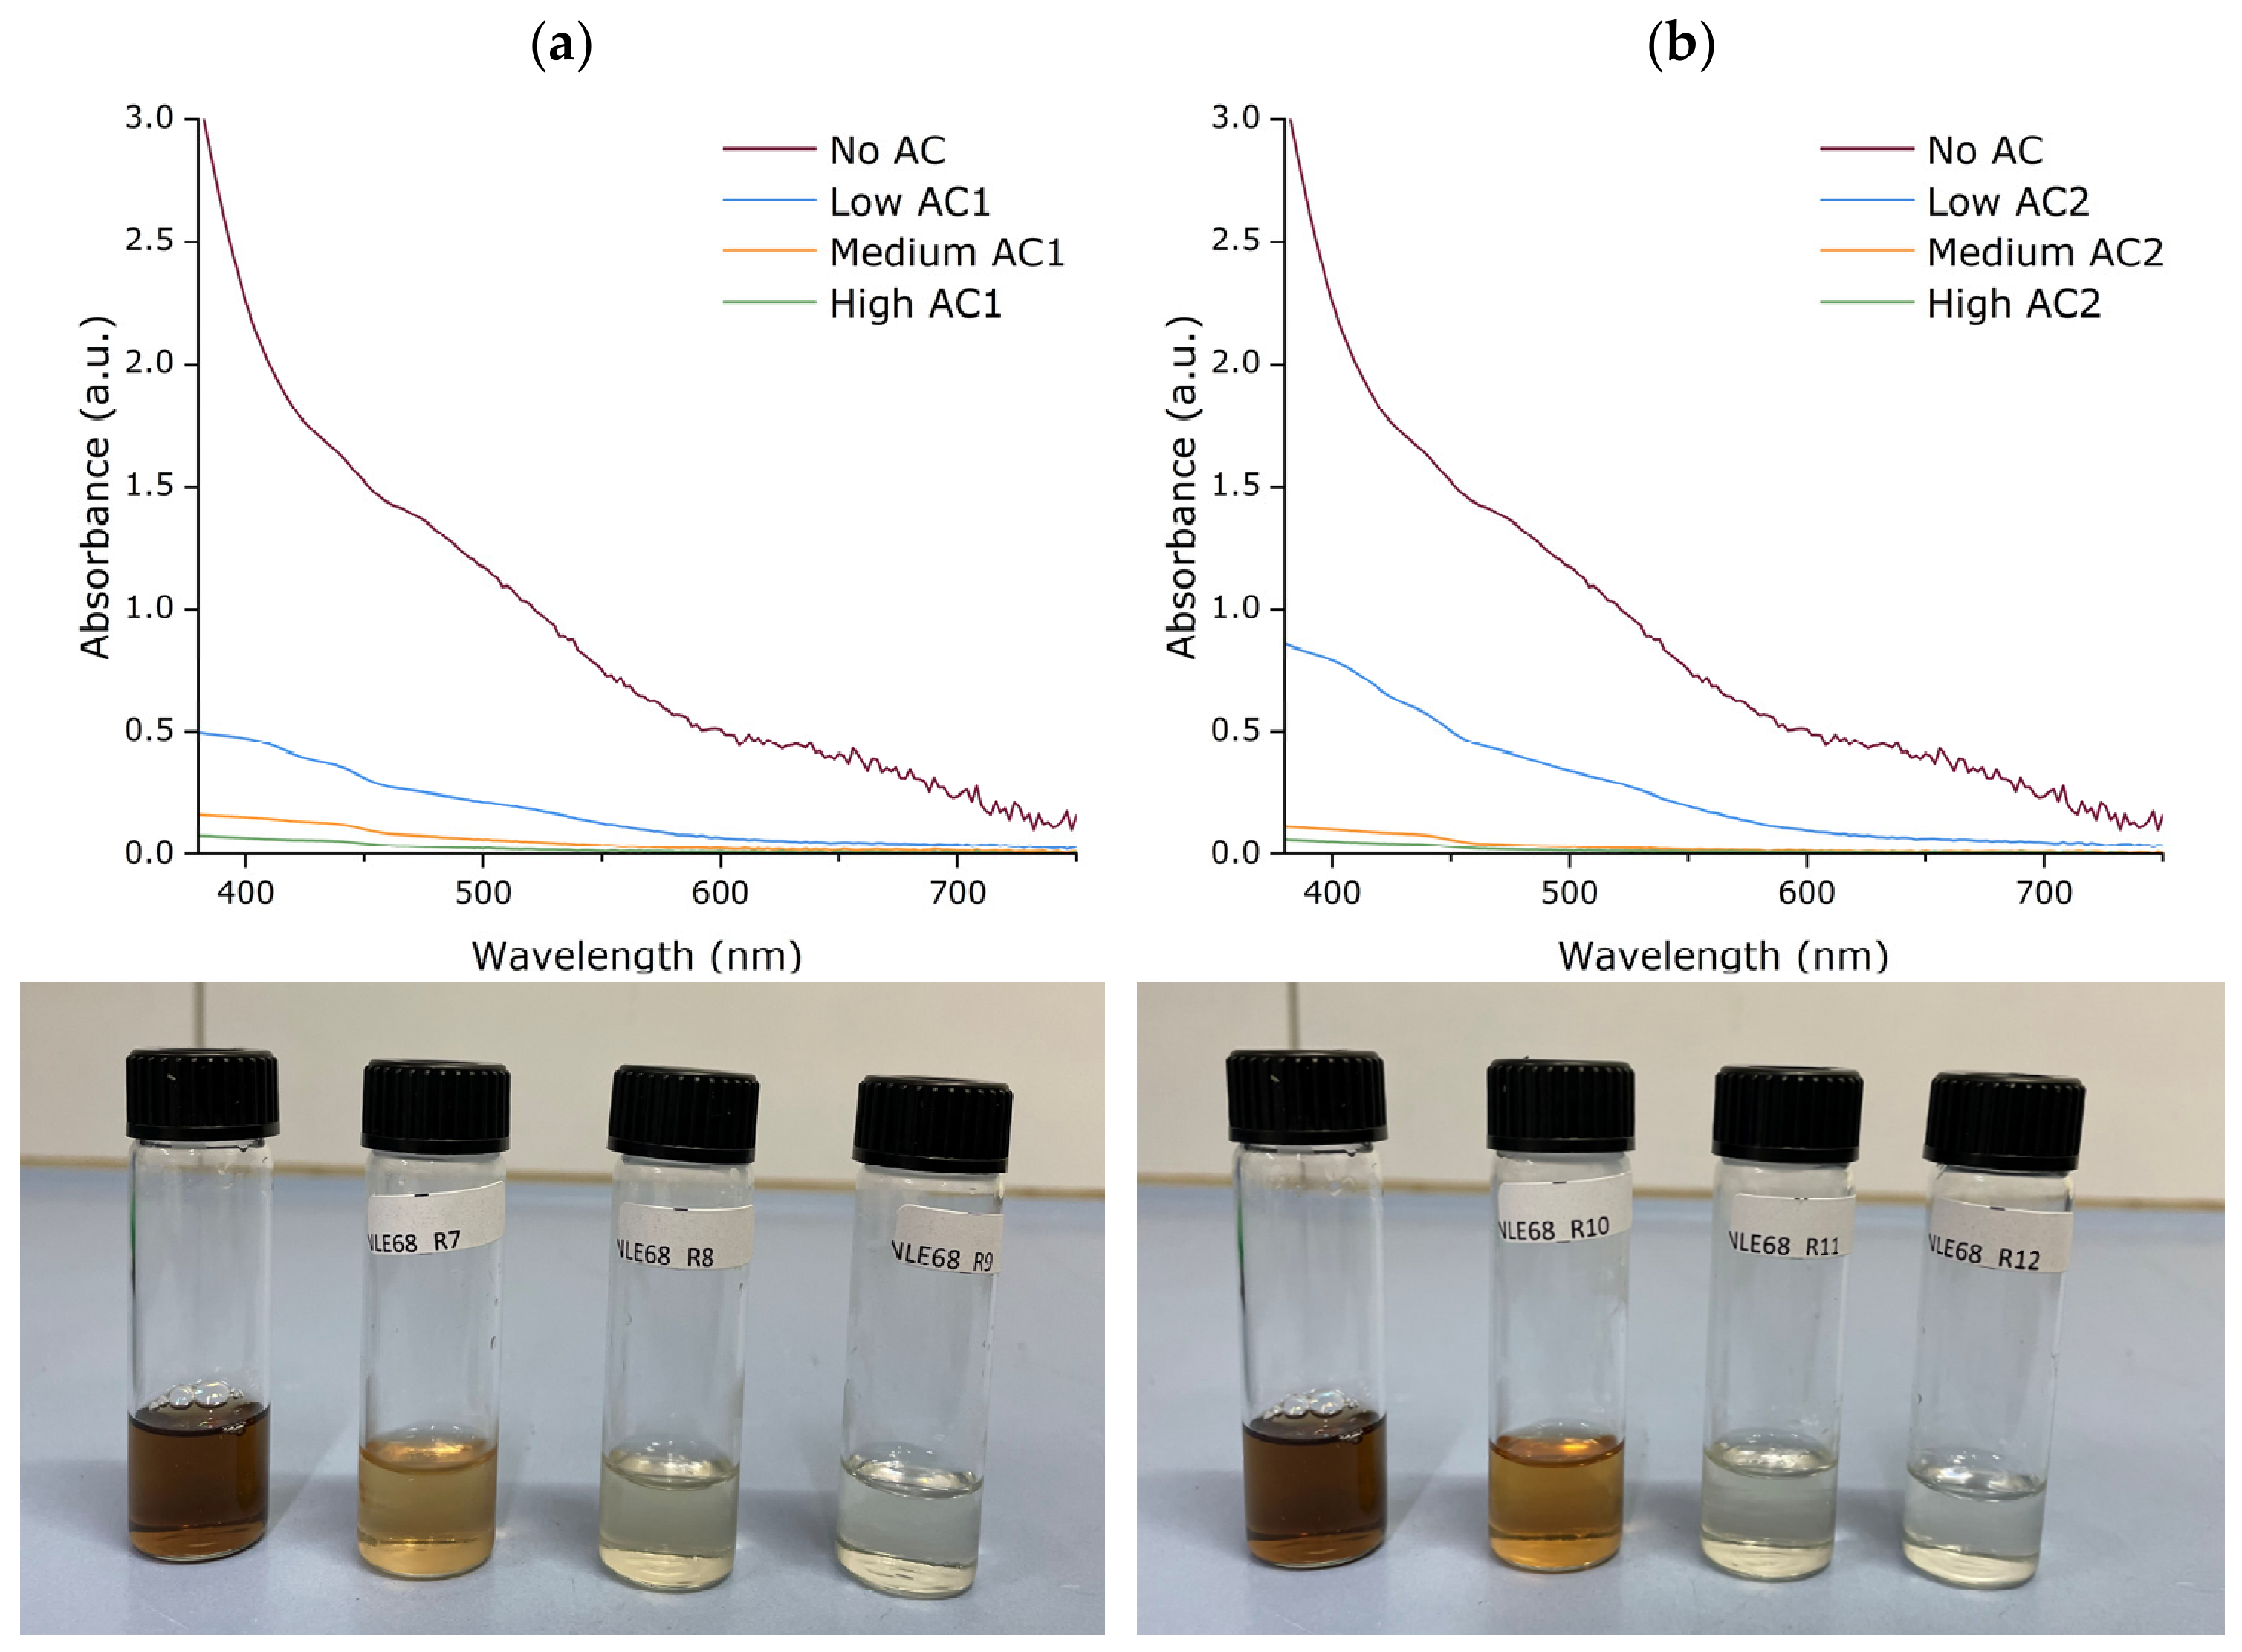
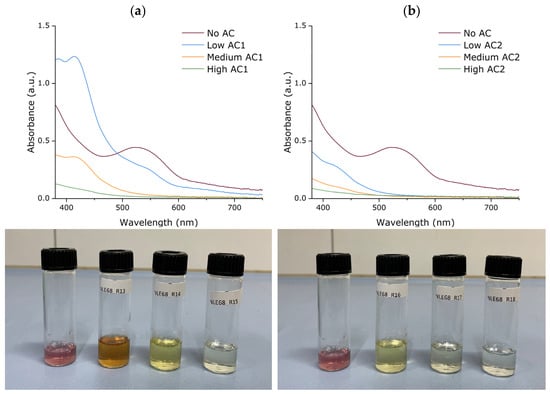
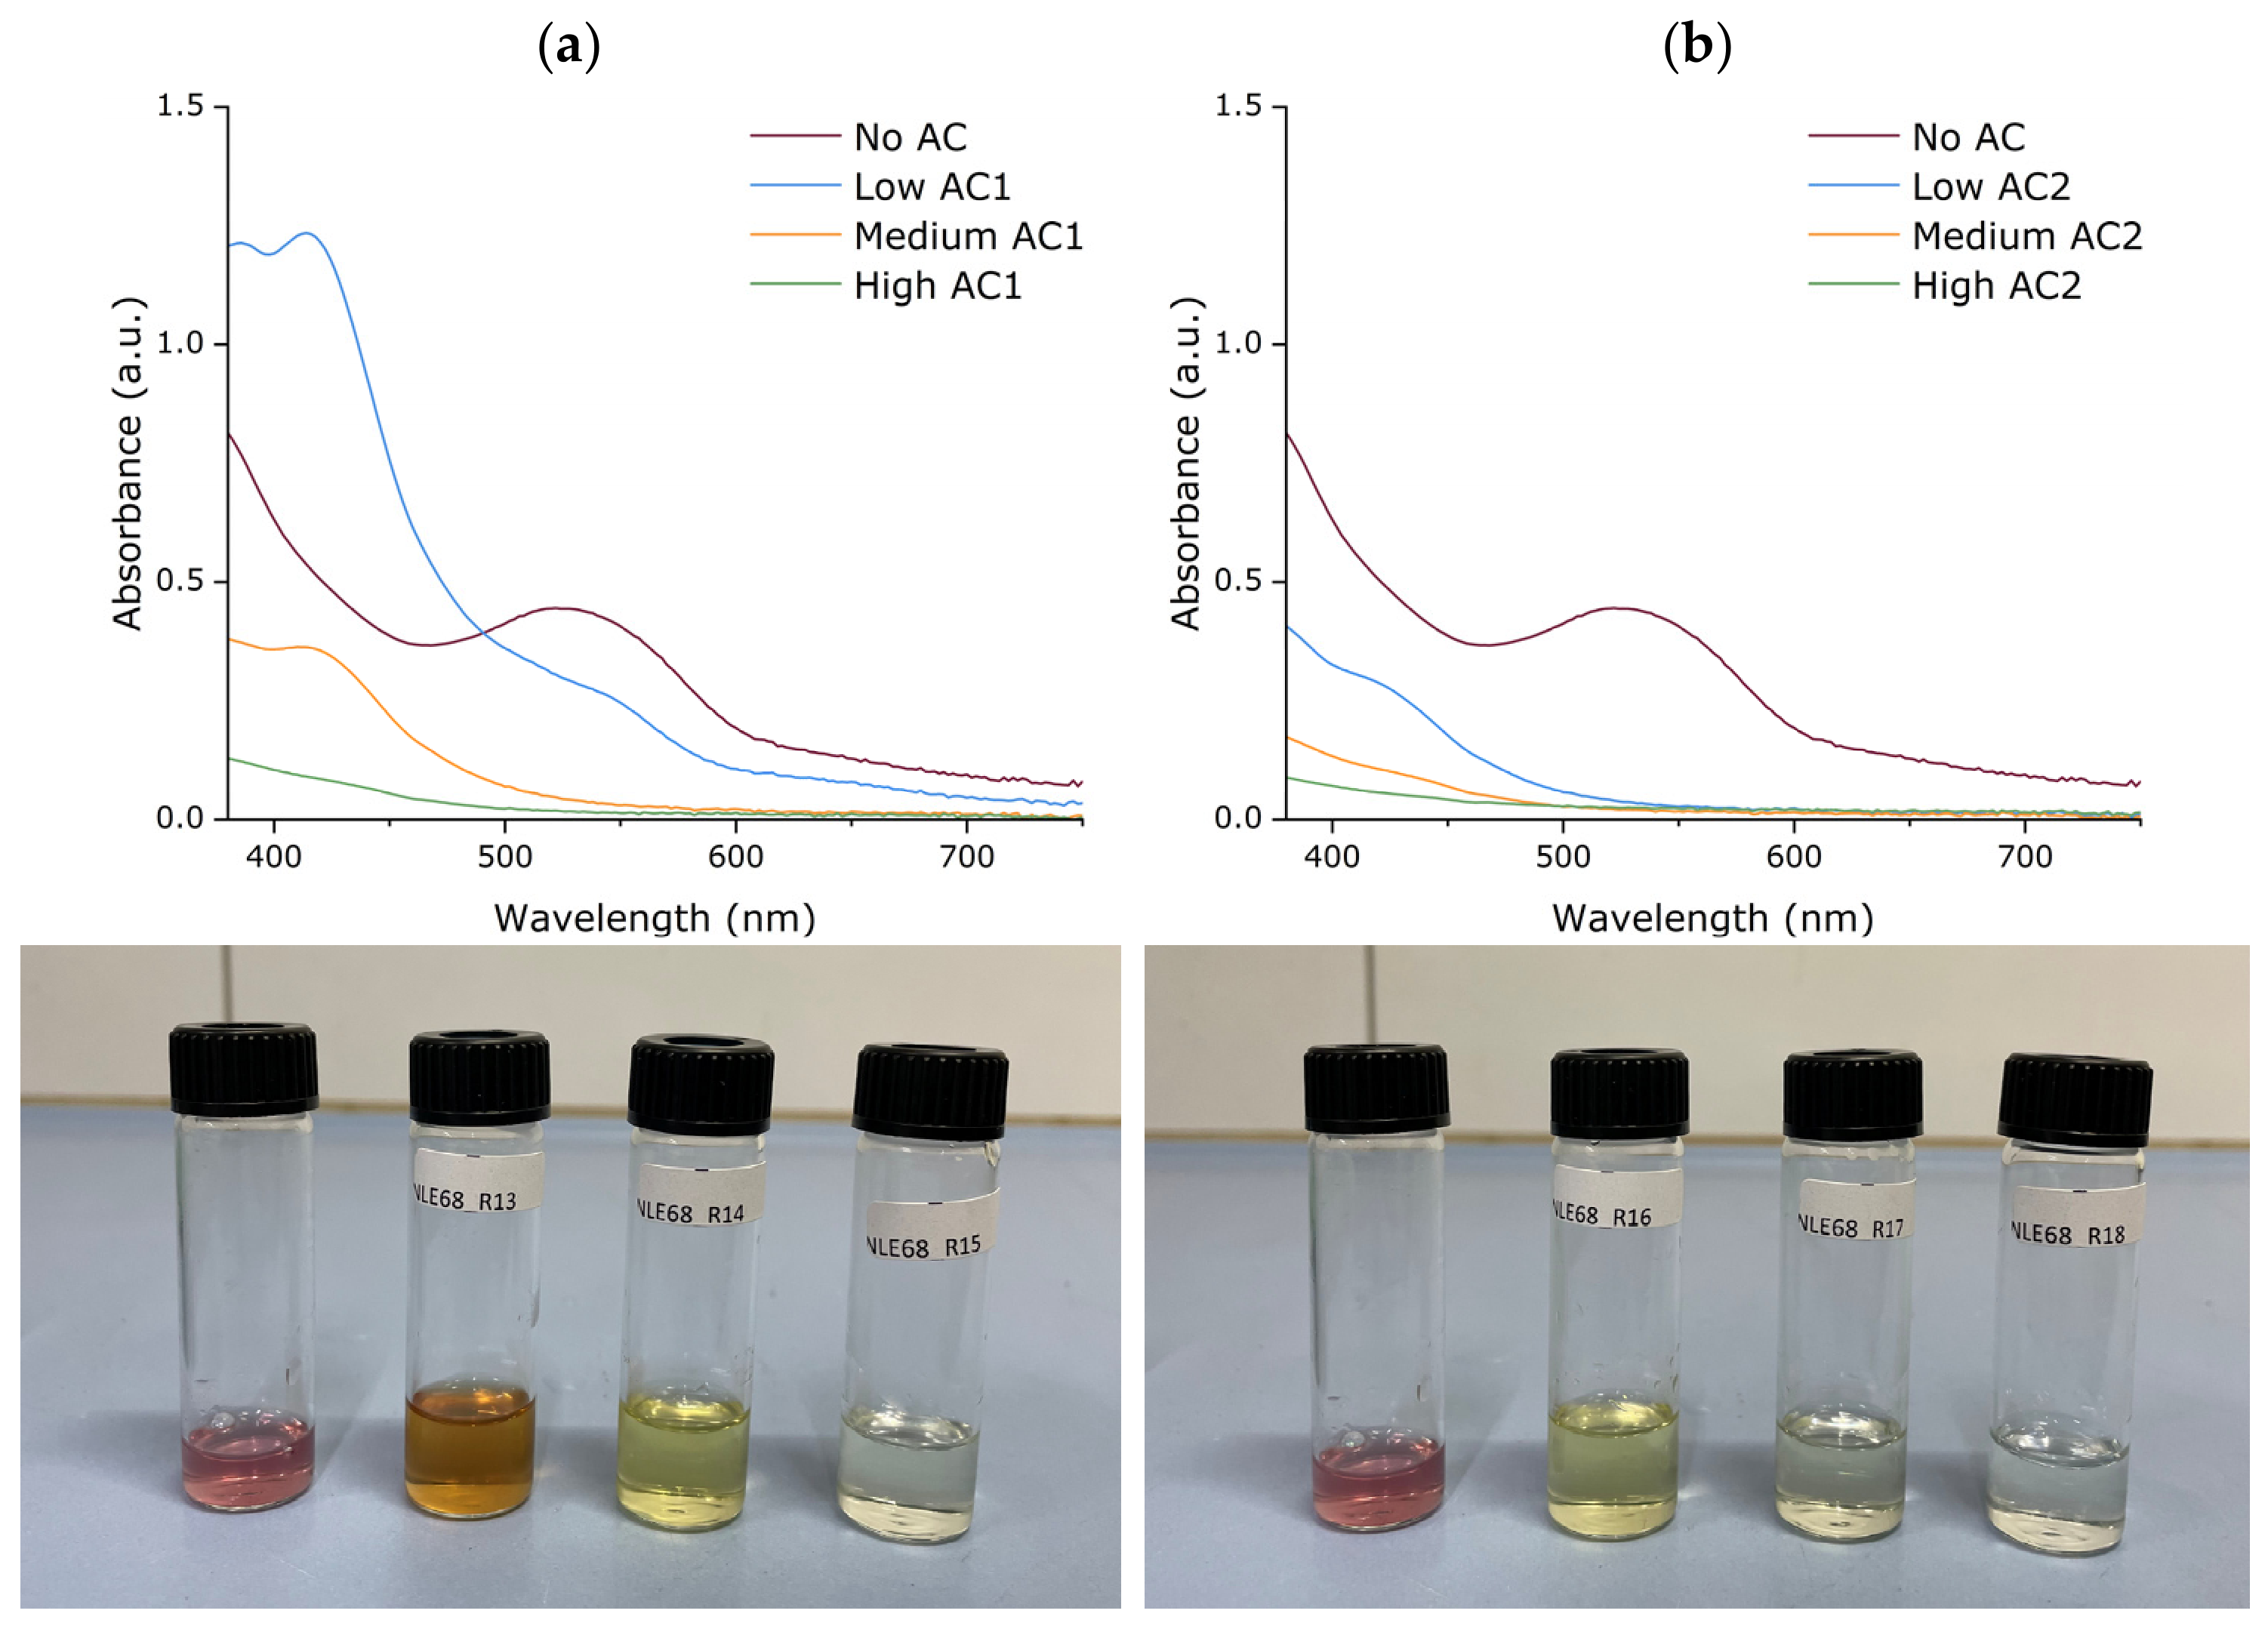
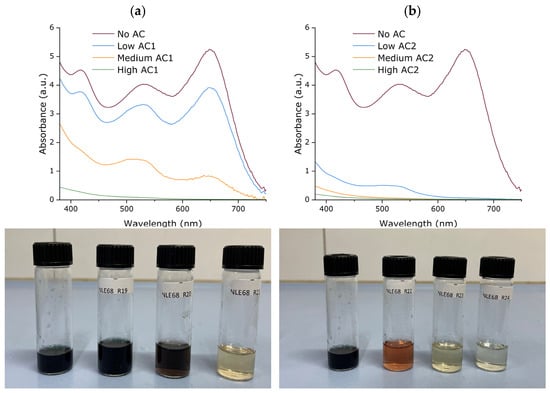
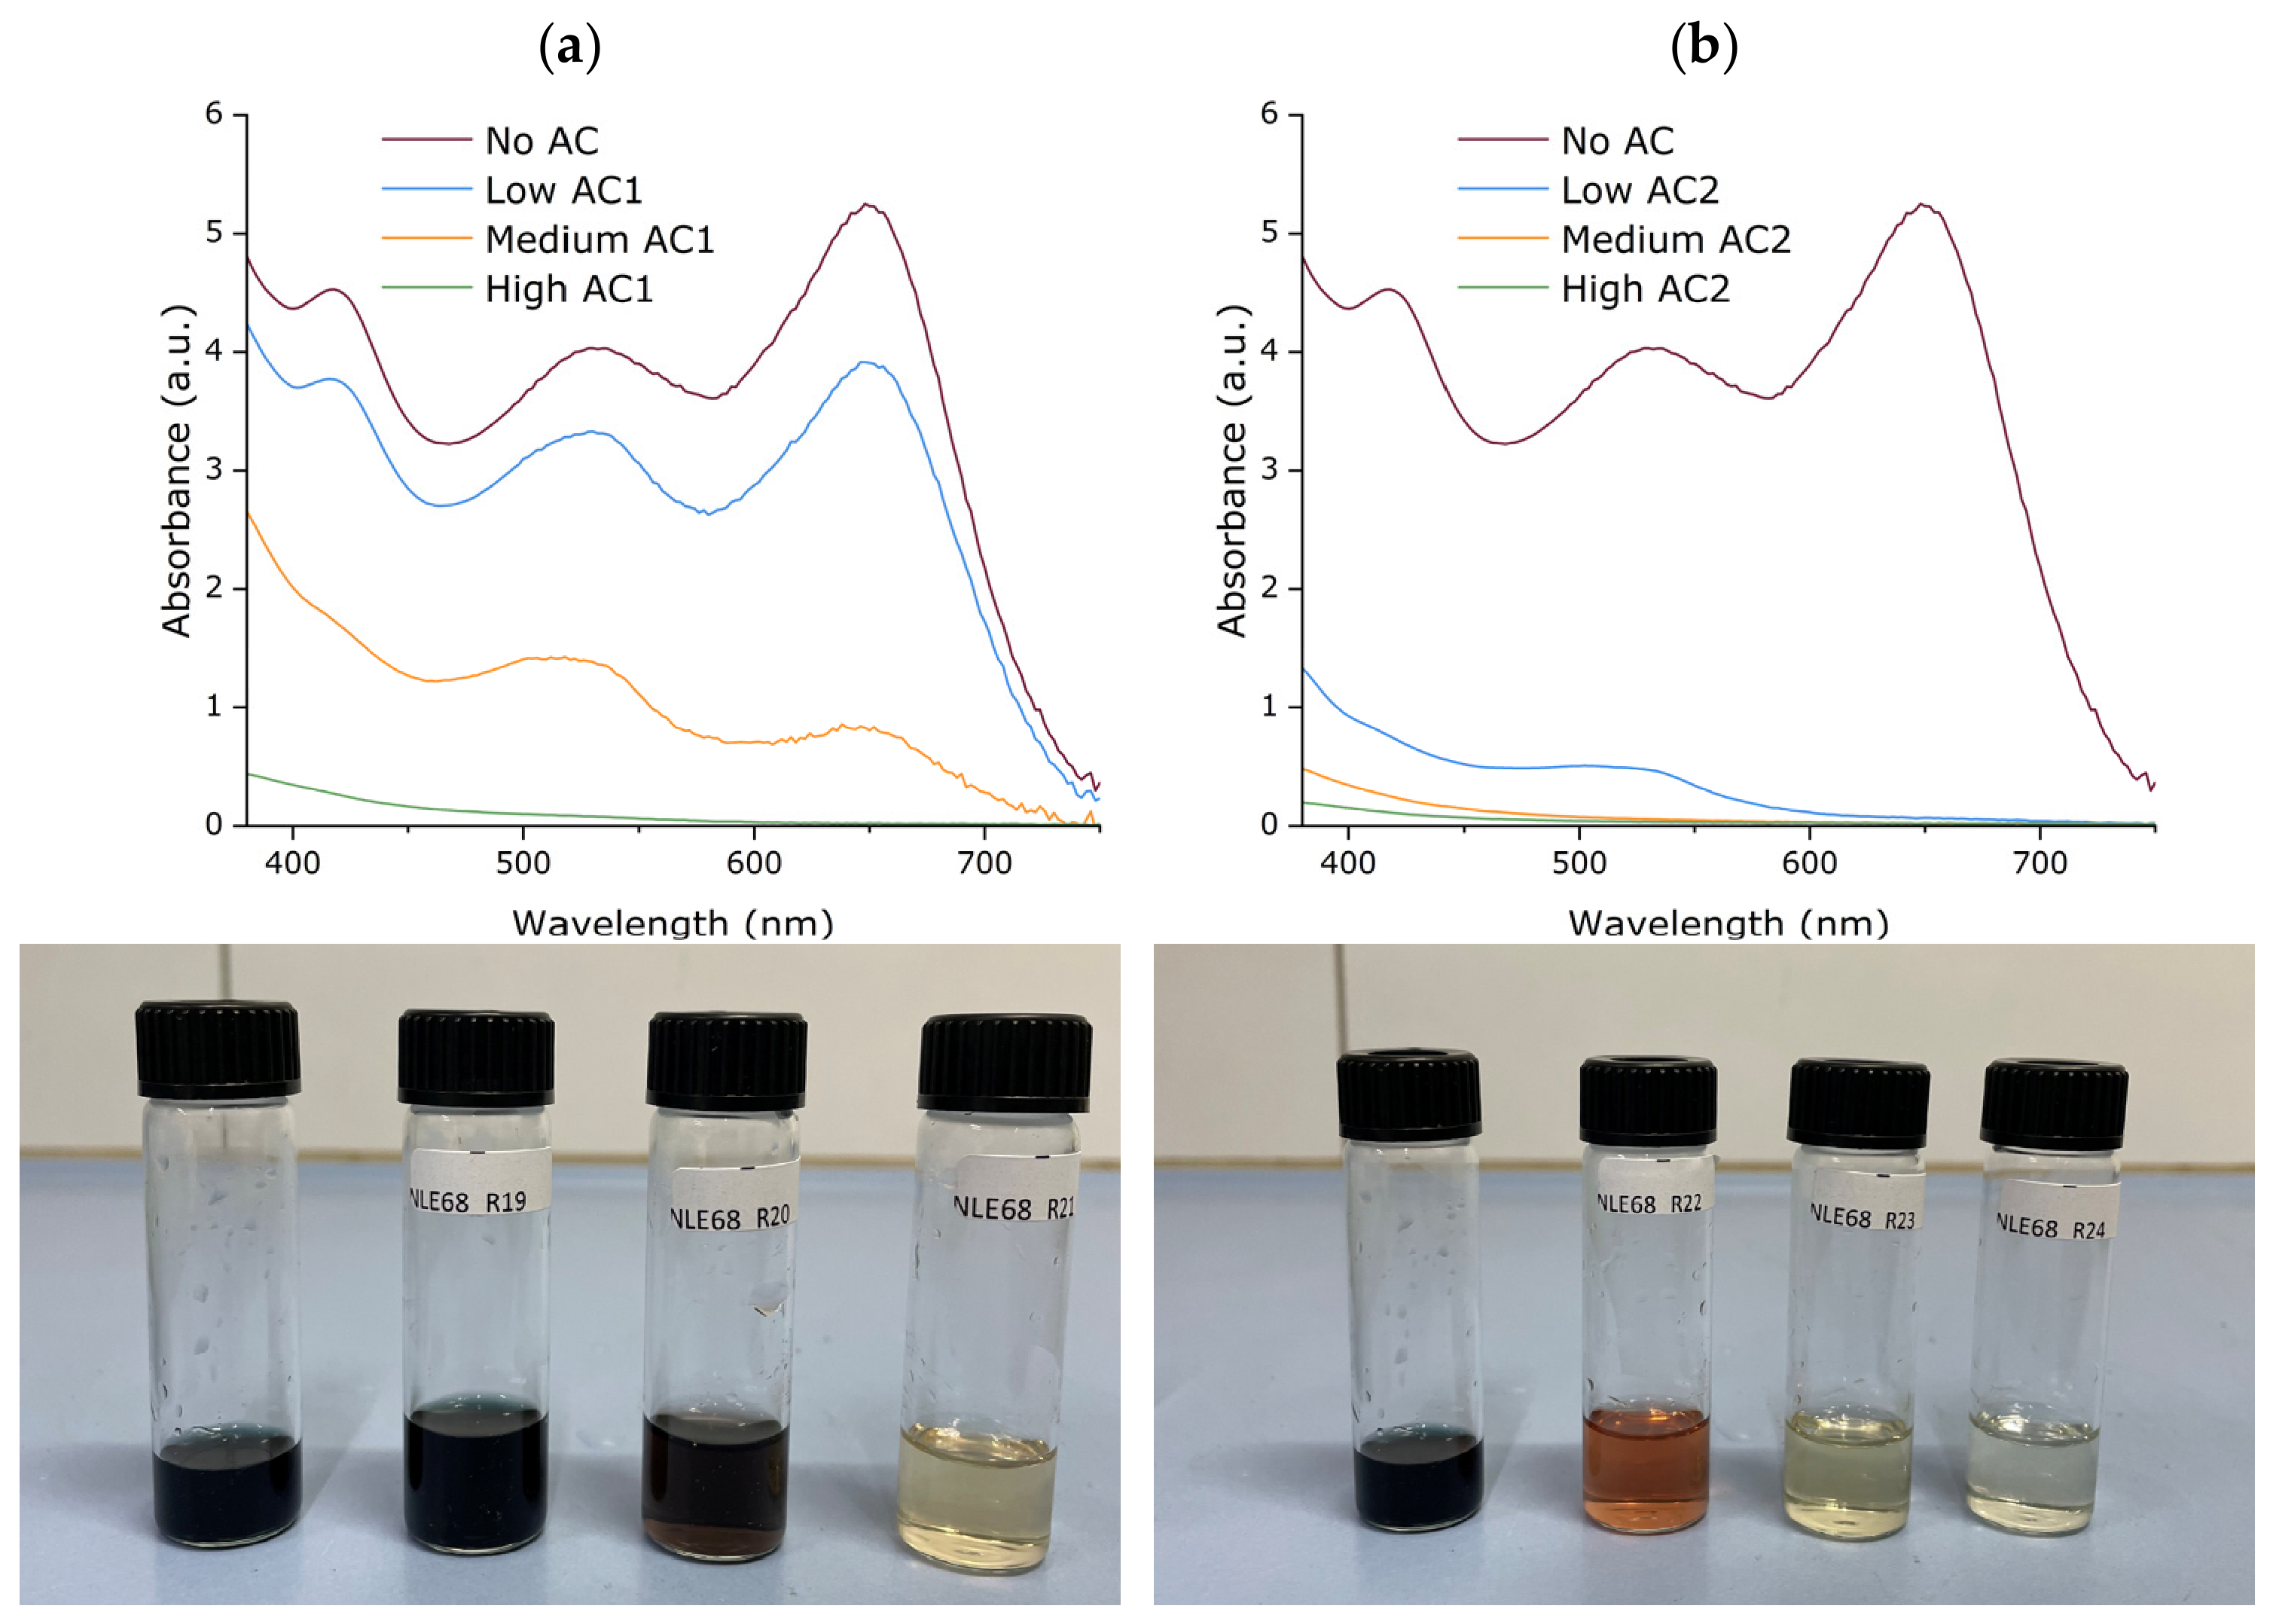
The removal of dye molecules with AC was tested using four different types of polycotton post-consumer waste textiles (Figure S7) so the versatility of the AC could also be confirmed. The polyester/cotton ratio was determined with the thermogravimetric analysis, as described in previous work [10]. Two different types of AC were used; their properties can be found in Table 1. Each polycotton textile was treated with both ACs at three different concentrations: low (2 mg/mL), medium (5 mg/mL) and high (10 mg/mL). The hydrolysate was treated with the desired amount of AC for 1 h at 600 rpm at room temperature. After this time, the AC was separated from the hydrolysate by gravity filtration, and the decolored hydrolysates were analyzed by UV–Vis spectroscopy (Figure 3, Figure 4, Figure 5 and Figure 6) and HPLC (Figure 7).
Figure 3.
Ultraviolet–visible (UV–Vis) data with photographs of decolored T1 hydrolysates with three different concentrations of (a) AC1 (low: 2.2 mg/mL, medium: 5.6 mg/mL, high: 11.3 mg/mL) and (b) AC2 (low: 1.9 mg/mL, medium: 5.3 mg/mL, high: 10.0 mg/mL).
Figure 4.
UV–Vis data with photographs of decolored T2 hydrolysates with three different concentrations of (a) AC1 (low: 2.1 mg/mL, medium: 5.2 mg/mL, high: 10.4 mg/mL) and (b) AC2 (low: 2.3 mg/mL, medium: 4.9 mg/mL, high: 10.5 mg/mL).
Figure 5.
UV–Vis data with photographs of decolored T3 hydrolysates with three different concentrations of (a) AC1 (low: 2.0 mg/mL, medium: 5.1 mg/mL, high: 10.4 mg/mL) and (b) AC2 (low: 2.4 mg/mL, medium: 4.9 mg/mL, high: 10.7 mg/mL).
Figure 6.
UV–Vis data with photographs of decolored T4 hydrolysates with three different concentrations of (a) AC1 (low: 2.1 mg/mL, medium: 5.1 mg/mL, high: 10.1 mg/mL) and (b) AC2 (low: 2.2 mg/mL, medium: 4.8 mg/mL, high: 10.8 mg/mL).
Figure 7.
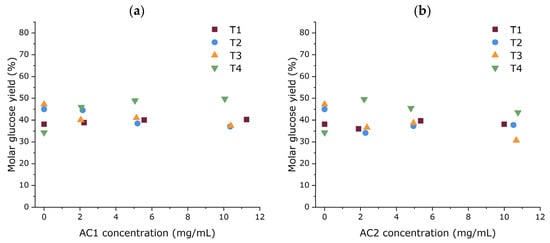
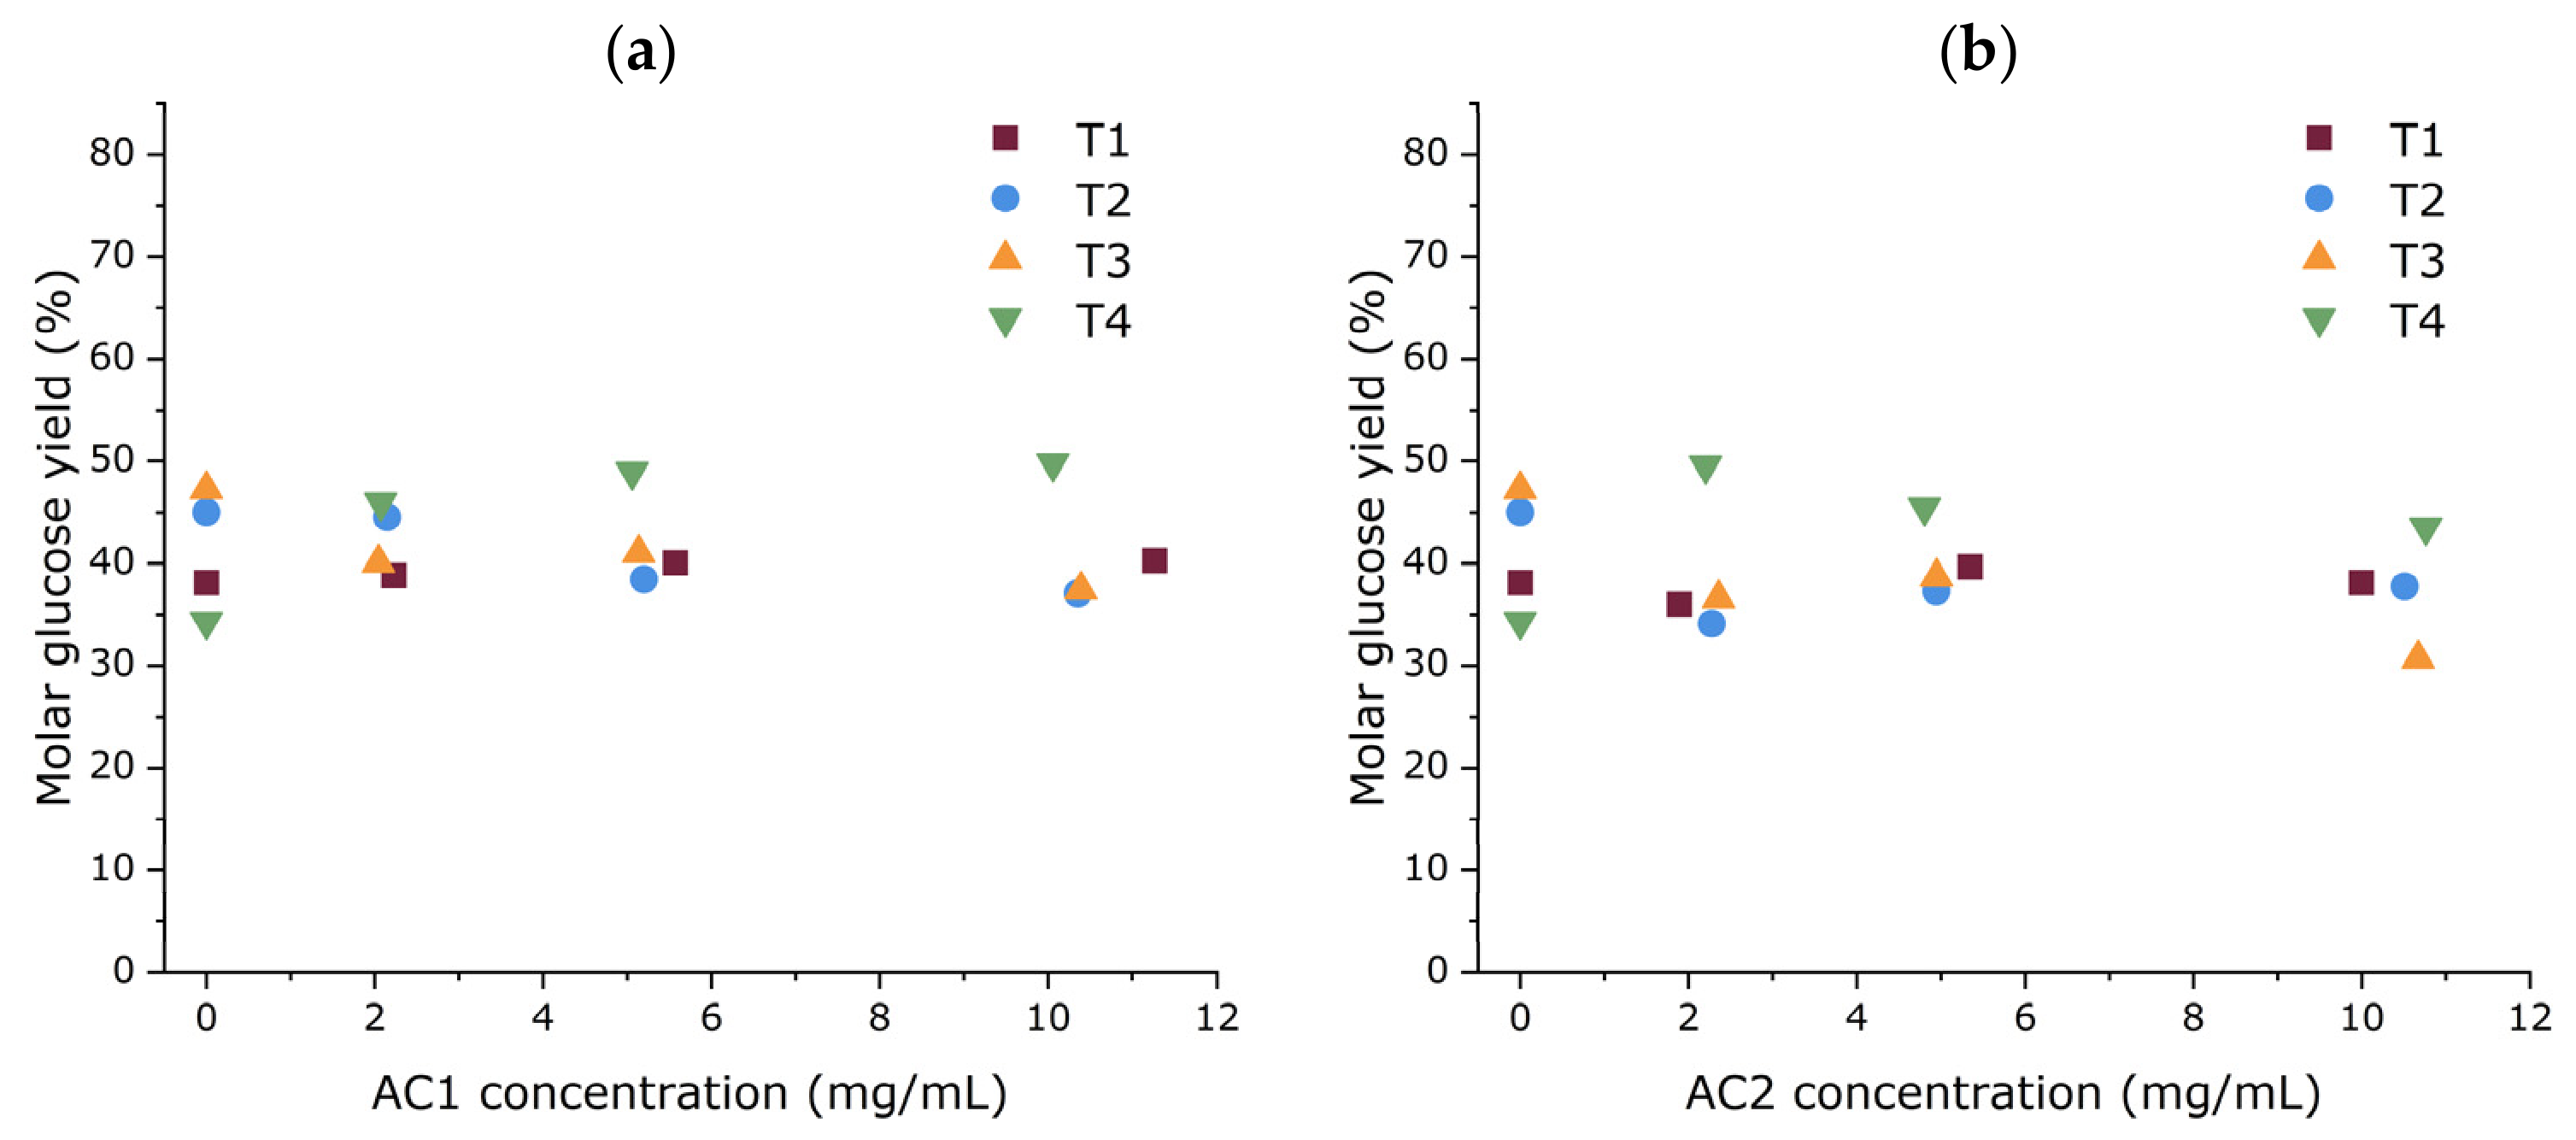
Glucose yield of the four decolorized hydrolysates after dye adsorption (1 h, 600 rpm, room temperature) with different concentrations of (a) AC1 and (b) AC2.
For all four textiles (T1–T4), treatment with AC resulted in a significant decrease in absorbance intensity (hypochromic effect) and visual decolorization (Figure 3, Figure 4, Figure 5 and Figure 6) of the solution. Adsorption on ACs is usually not selective as it occurs through van der Waals forces [17]. Adsorption can also occur through π–π interactions, as AC is an aromatic-rich compound, and strong ionic or electrostatic interactions [15,44,45]. Overall, AC2 showed better adsorption performance compared to AC1. This enhanced performance is probably the result of the significantly higher total surface area of AC2, which is approximately 1.7 times larger than that of AC1 (Table 1). The increased surface area provides a higher number of vacant adsorption sites, thus improving dye adsorption. Furthermore, increasing the AC concentration generally led to an increase in adsorption for all textile samples, except for T3 treated with AC1 (Figure 5). Here, the use of a low concentration of AC1 resulted in an unexpected increase in absorbance intensity (hyperchromic effect) in the UV region. Upon further increasing the AC1 dosage, the absorbance intensity decreased, similar to the other solutions.
Generally, increasing the adsorbent dosage increases the quantity of sorption sites which allows for more adsorption [35]. Notably, the relationship between the AC concentration and adsorption efficiency was non-linear. Increasing the adsorbent concentration from a medium to high concentration resulted only in a minimal improvement of dye removal, which could indicate that the removable dyes were already captured by the AC at a medium concentration. A similar observation was reported by Mihret et al., who found that increasing the amount of adsorbent from 5 to 10 mg/mL led to an increase in dye adsorption within the tested concentration range of 0.05–0.1 mg/mL [45]. However, once the optimal adsorbent concentration was reached (10 mg/mL), further increasing the adsorbent concentration (15 mg/mL) did not significantly improve adsorption of dye molecules and the removal remained somewhat constant. After treatment with high AC concentrations, all the samples (T1–T4) showed a minimal yellow haze (Figure 3, Figure 4, Figure 5 and Figure 6). This phenomenon could be explained by the increased interaction between AC and highly conjugated dye molecules. Overall, a highly conjugated dye molecule has an absorption at longer wavelength [16], thus by removing them a blue (i.e., hypsochromic) shift can occur. This results in an observed color of yellow (Table S2).
The measured glucose yields, depicted in Figure 7, were lower than usually found. Based on comparison with previously obtained data at similar substrate loadings, a textile loading of 90 mg/mL would be expected to result in a molar glucose yield of approximately 80%. However, unlike the other experiments in this study, the hydrolysates in this section (Section 3.2) were not produced in a closed reaction vessel (Ace Glass pressure tube), but in an Erlenmeyer flask fitted with a stopper. In this configuration, pressure cannot be contained, as the stopper can partially dislodge during the reaction. Consequently, the equilibrium of the HCl solution will slowly go to 37 wt%, the stable HCl concentration at room temperature. This loss of acid likely contributed to the reduced molar monomeric glucose yields observed under these conditions. Yet, the molar monomeric glucose yields seem not to be affected by using either ACs, even when higher AC concentrations (10 mg/mL) were used (Figure 7).
However, it was still possible that the oligomers adsorbed onto the AC. Therefore, the T4 hydrolysates treated with high AC concentrations (10 mg/mL) were subjected to post-hydrolysis to convert all oligomers into monomeric glucose. This resulted in monomeric glucose yields of 118 and 102% for AC1 and AC2, respectively, indicating that the oligomers were not adsorbed by the AC and could be fully converted into monomeric glucose. The monomeric glucose yields (slightly) exceeding 100% are likely attributable to analytical uncertainties. Therefore, initial results suggest that the glucose yield is not affected by the use of AC.
3.2.2. Effect of Adsorption Time on the Adsorption Performance
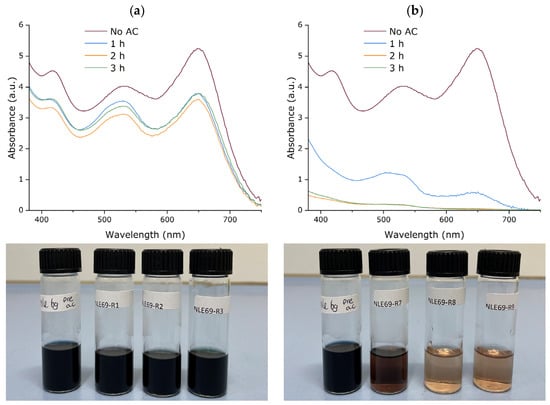
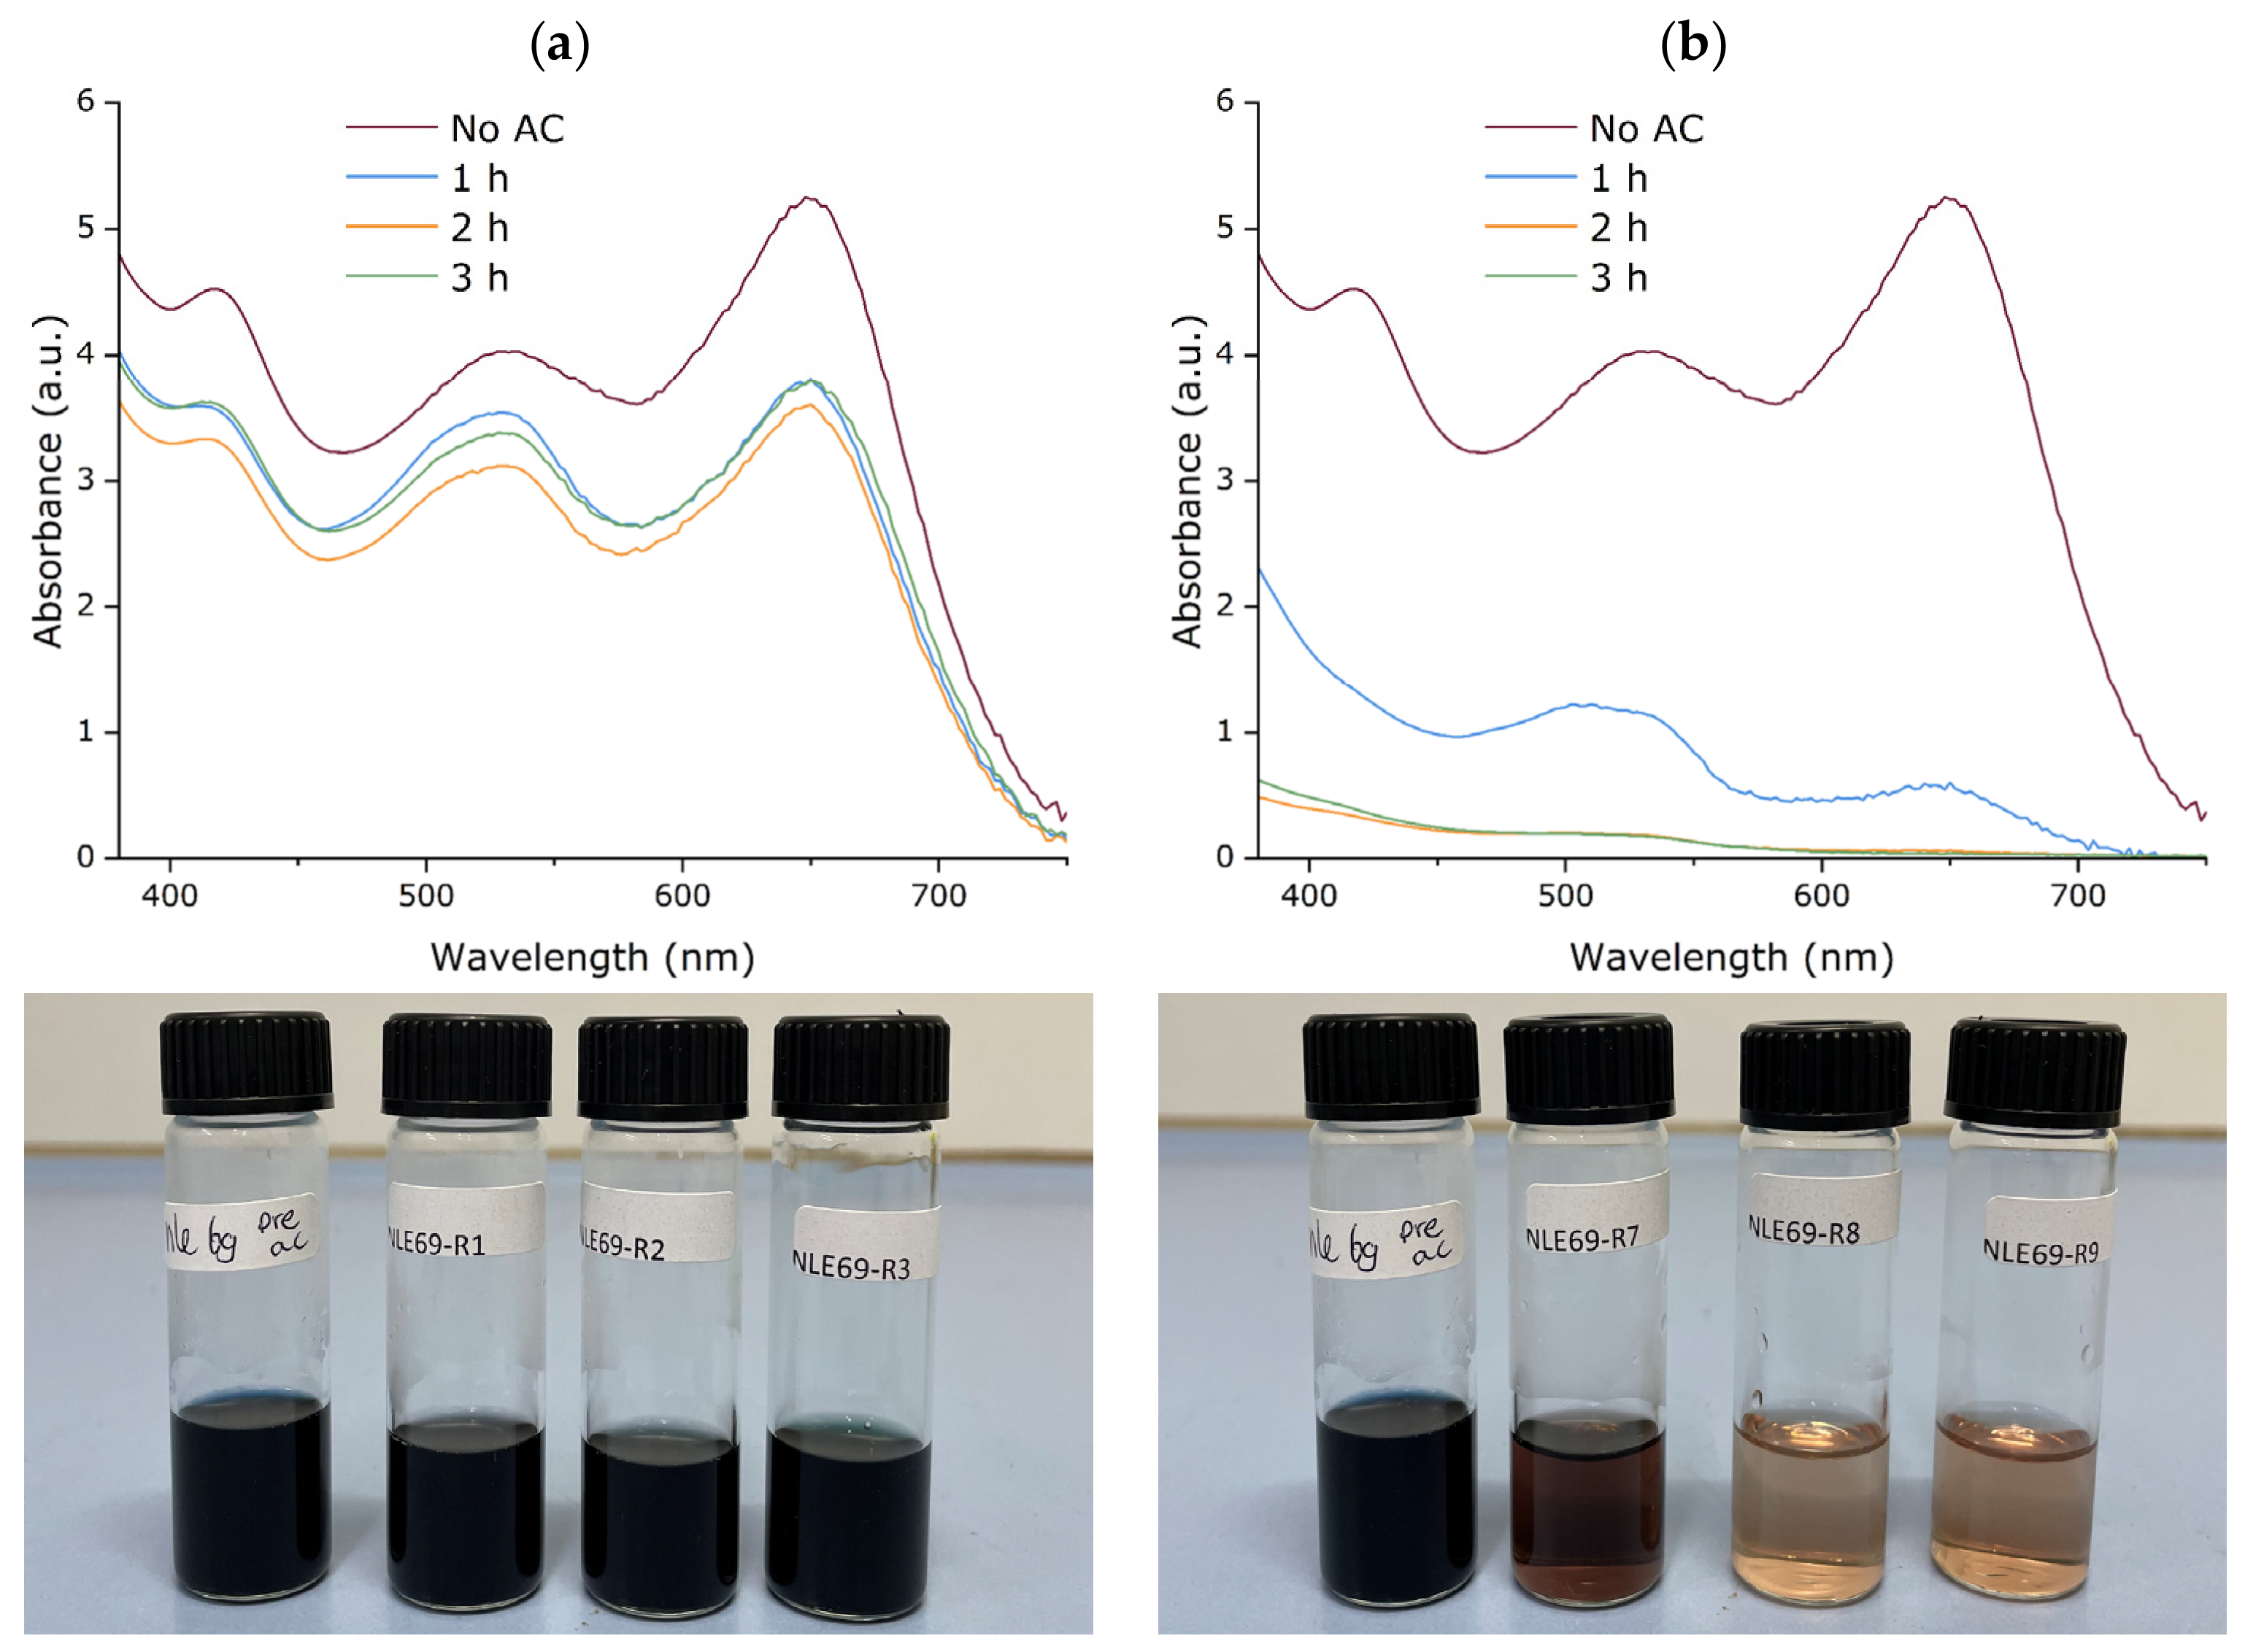
The effect of the adsorption time was investigated using T4 and the two different ACs. The effect of the adsorption time at low (2 mg/mL) and high (10 mg/mL) AC concentrations was investigated. At low concentrations, the adsorption time was tested from 1 to 3 h with a one-hour interval. At high concentrations, the adsorption time ranged from 20 to 60 min with a 20 min interval.
For the low AC1 concentration (Figure 8a), increasing the adsorption time did not affect the adsorption performance, as the absorbance intensity was similar at all three time intervals. For the low AC2 concentration (Figure 8b), increasing the adsorption time from 1 to 2 h improved the decoloration of the hydrolysate; however, further increases in adsorption time did not improve the adsorption performance. For both ACs, the removal efficiency became constant after a certain period, which could indicate that beyond this point the number of vacant adsorption sites became minimal and increasingly difficult to access due to the presence of adsorbate on the AC surface or in its voids [45]. As AC2 has a substantially higher total surface area than AC1 (1.7 times larger, Table 1), it provides more adsorption sites, prolonging the time needed to reach saturation of the available sites.
Figure 8.
Absorbance change of decolorized T4 hydrolysate at low AC loadings over time with (a) AC1 and (b) AC2.
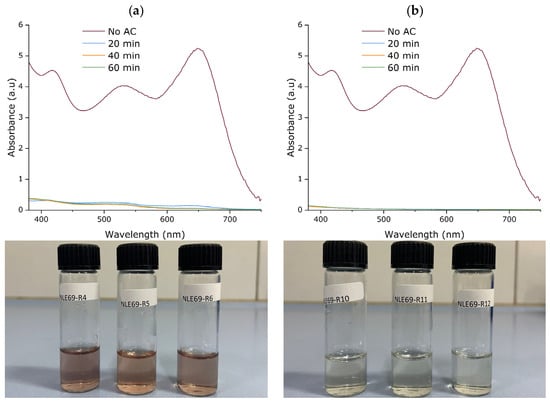
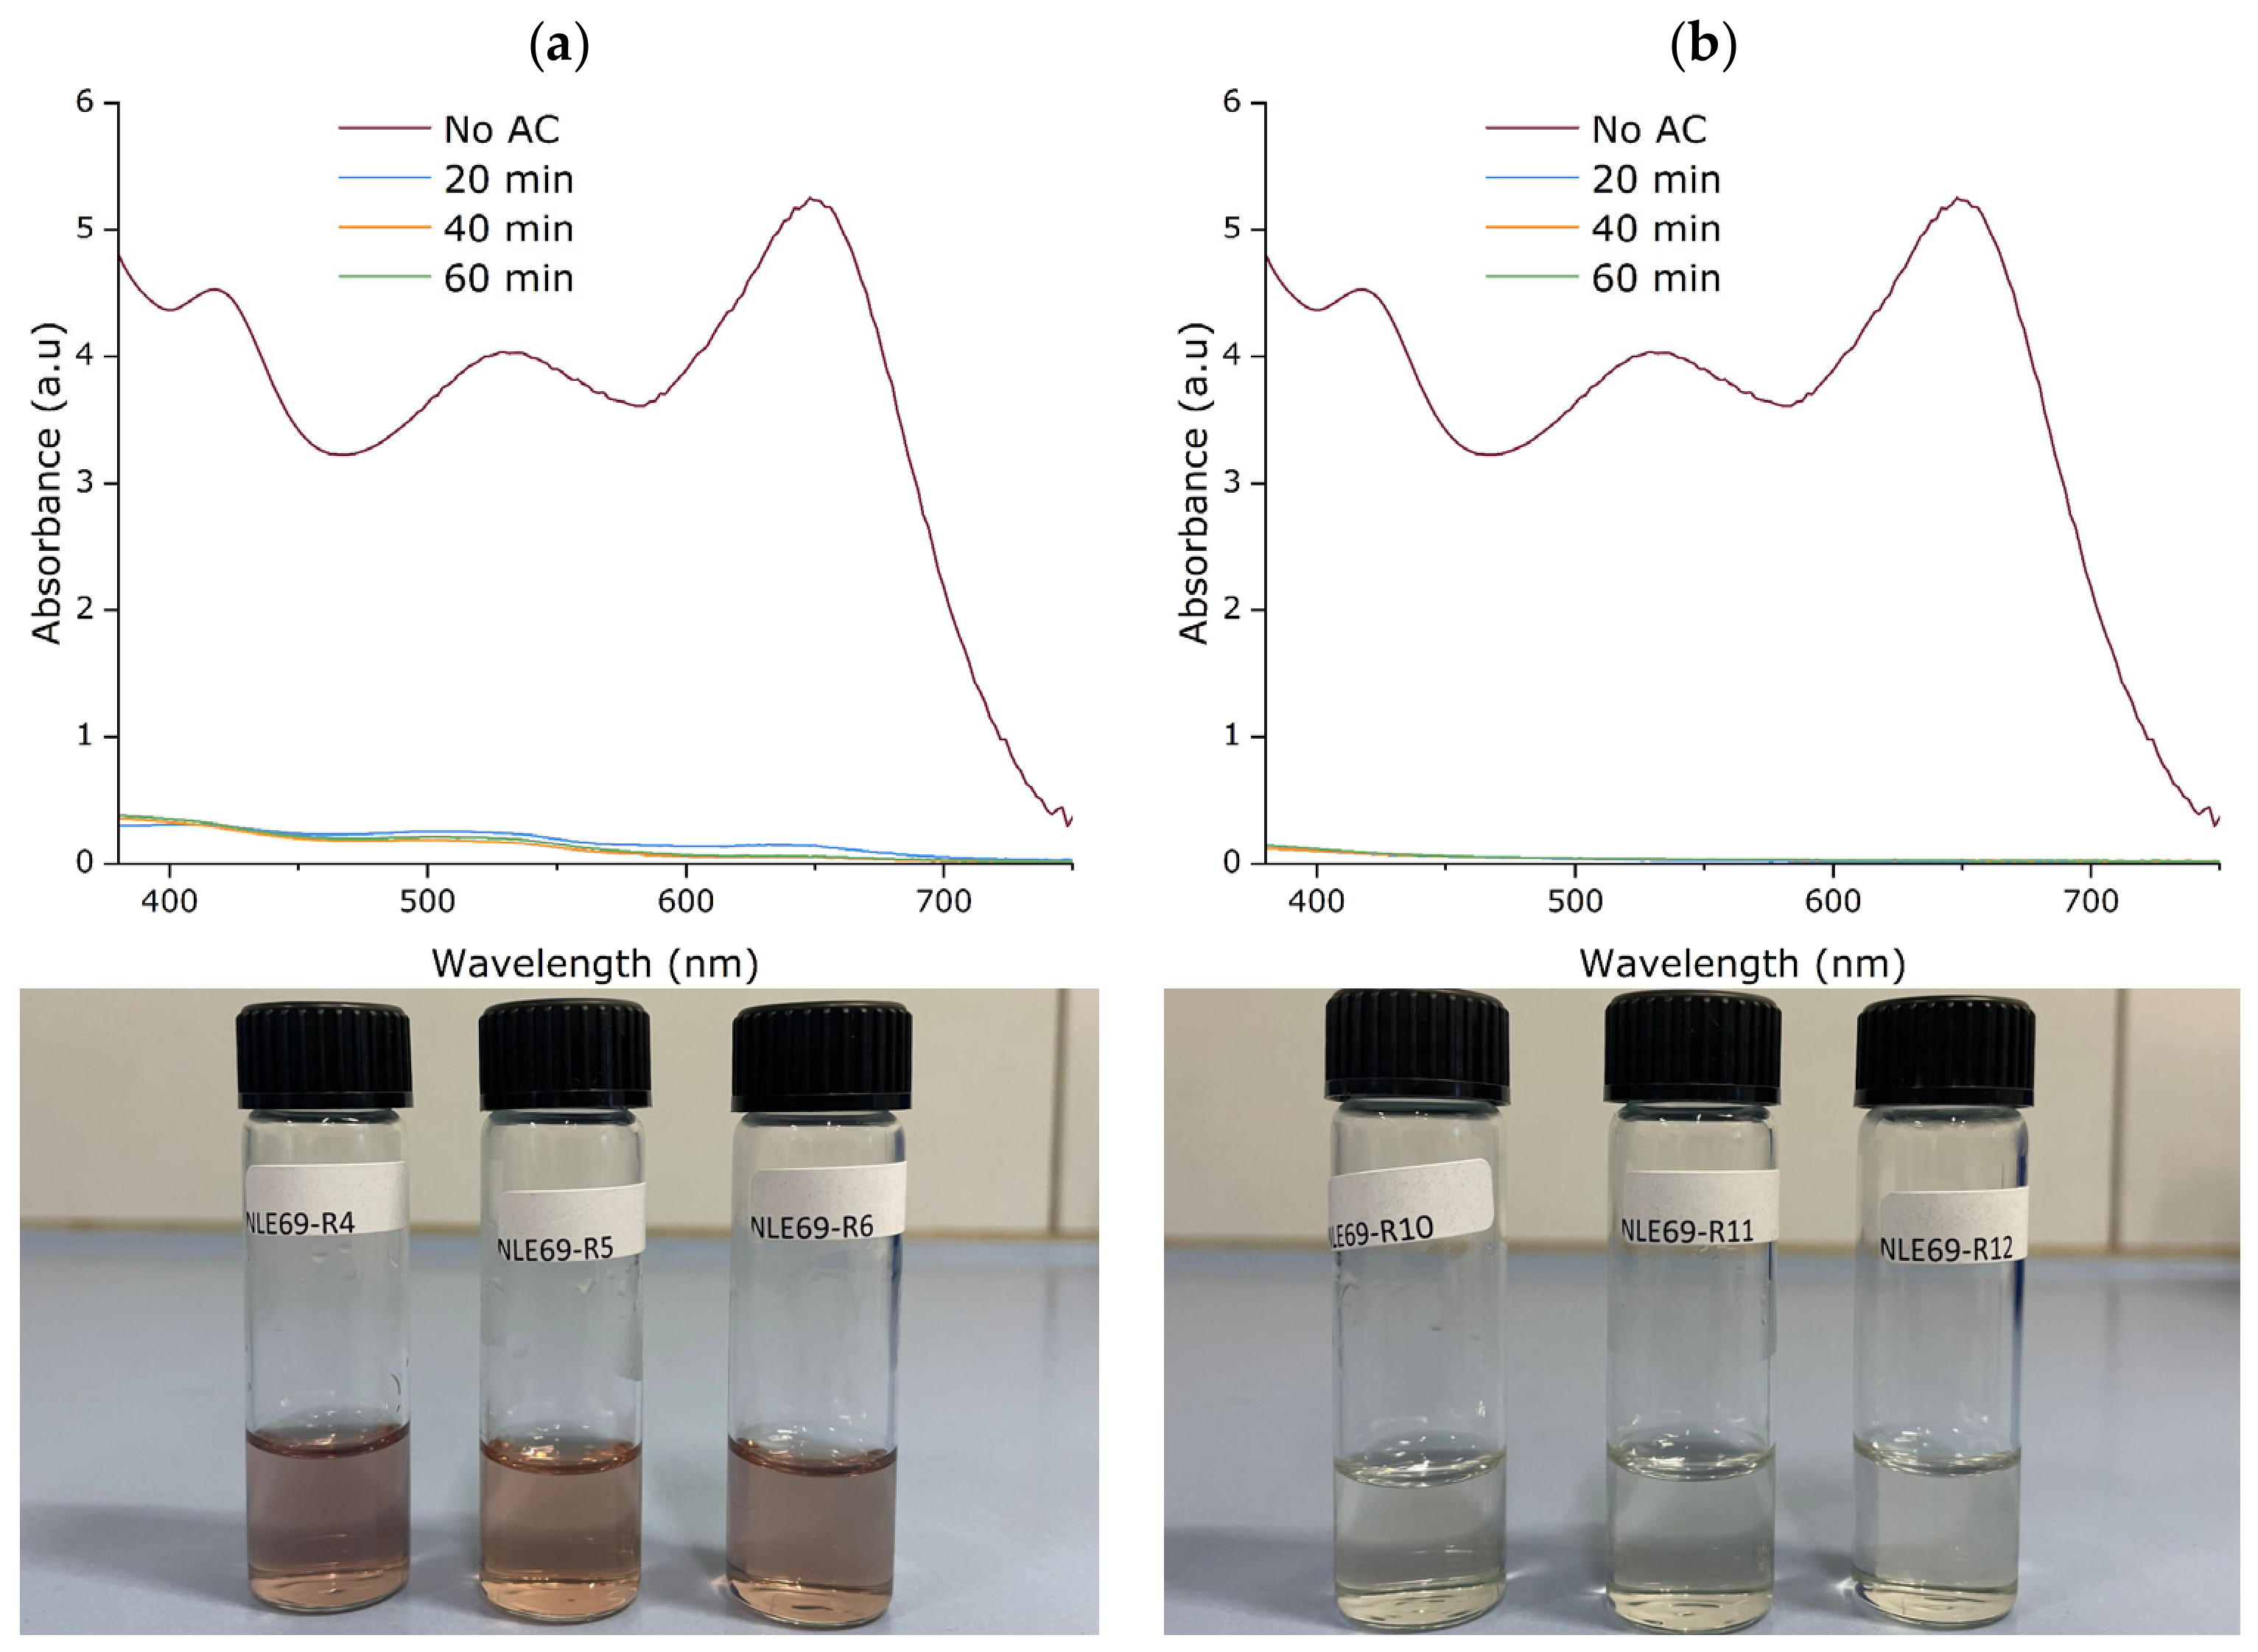
At high AC concentrations (Figure 9), the removal efficiency became constant after 20 min for both AC1 and AC2 and further increases in adsorption time had no effect on the adsorption performance. Because of the high availability of vacant adsorption sites, the adsorption of dye molecules occurred extremely fast. As seen before, AC2 showed improved adsorption performances compared to AC1. Yet, the exact adsorption mechanism of the dyes cannot be determined due to the missing information on the exact type of dye molecules used and their concentrations.
Figure 9.
Absorbance change of decolorized T4 hydrolysate at high AC loadings over time with (a) AC1 and (b) AC2.
Additionally, when comparing the absorbance intensity and color of the treated hydrolysates, it can be observed that treatment with a low AC2 concentration for 2 h (Figure 8b) resulted in a similar outcome to treatment with a high AC1 concentration for 20 min (Figure 9a). This information can be particularly of interest when considering process economics, as it allows for a well-informed decision regarding the choice of AC. Additionally, to obtain a sustainable and cost-effective process [33], the regeneration of AC should be included in these decisions.
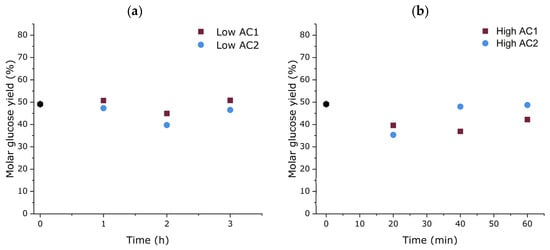
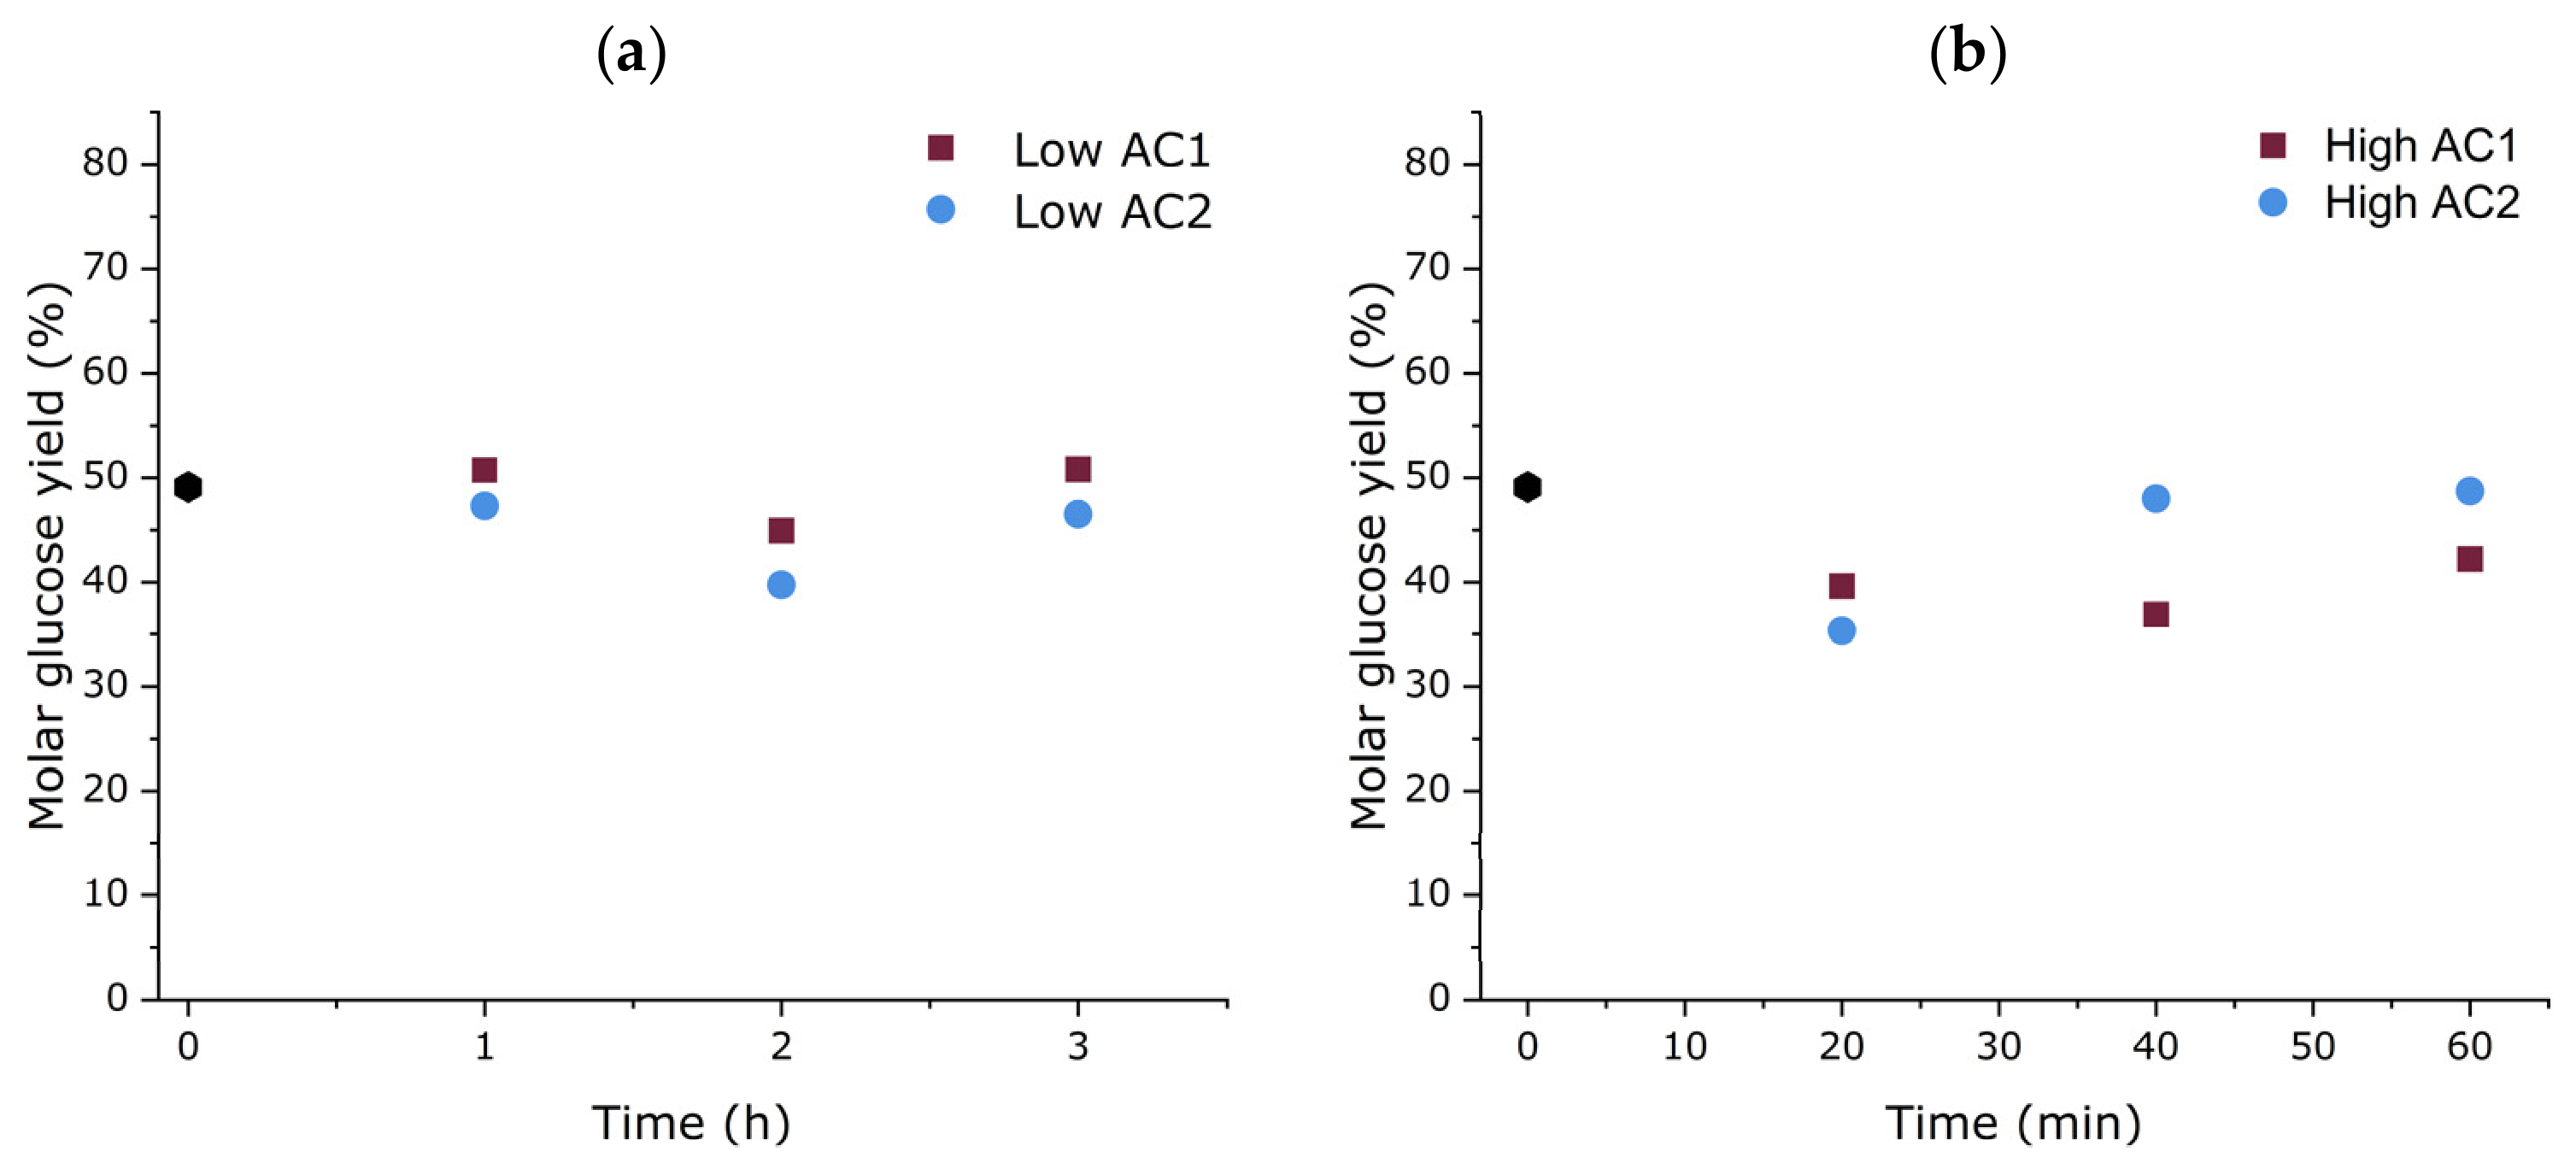
When considering the molar glucose yield as a function of adsorption time (Figure 10), the glucose yield seemed unaffected when increasing the adsorption time. This observation was also in line with the previously reported results (vide supra). The minor variation in glucose yield was likely caused by the (mandatory) wetting of the glass filter paper with water, leading to a small dilution of the decolored hydrolysate.
Figure 10.
Glucose yield of the decolorized T4 hydrolysate after dye adsorption at different adsorption times with (a) low and (b) high AC concentrations.
Overall, these results provide the first indication that dyes present in the four tested polycotton waste textiles can be removed from the hydrolysate. However, because the specific dye classes, chemical structures and concentrations are unknown, the findings cannot be generalized to textile dyes as a whole.
3.2.3. CMF Production from Decolorized Hydrolysate
Finally, decolorized hydrolysate was used for the production of CMF. Red and green mercerized cotton yarns were selected to allow direct comparison with the data presented earlier in this study (Figure 2). The material was first subjected to cellulolysis using 44 wt% HCl in an Ace Glass pressure reactor for 1.5 h. Subsequently, the reactors were cooled in a freezer (−20 °C) for 15 min to promote reabsorption of gaseous HCl into solution, as a 44 wt% HCl solution at room temperature gradually decreases to 37 wt% due to HCl desorption. Then, activated carbon (AC2) was added at a high concentration (10 mg/mL) and the mixture was stirred for 20 min at room temperature and with a magnetic stirring speed of 600 rpm. After adsorption, the reactor was again placed in the freezer for 15 min, after which a wet glass filter paper was used to filter the solution. The resulting filtrate (i.e., the decolorized hydrolysate) was placed in a reactor containing chlorobenzene and treated at 91 °C for 1 h, following the same procedure as for samples not treated with AC.
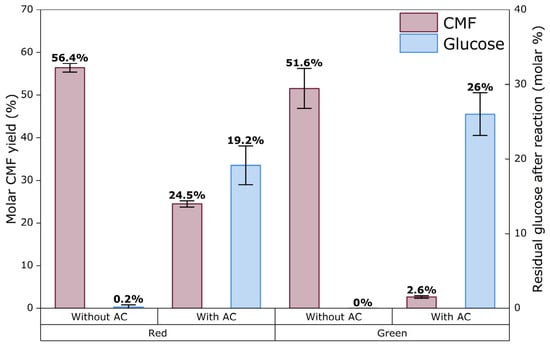
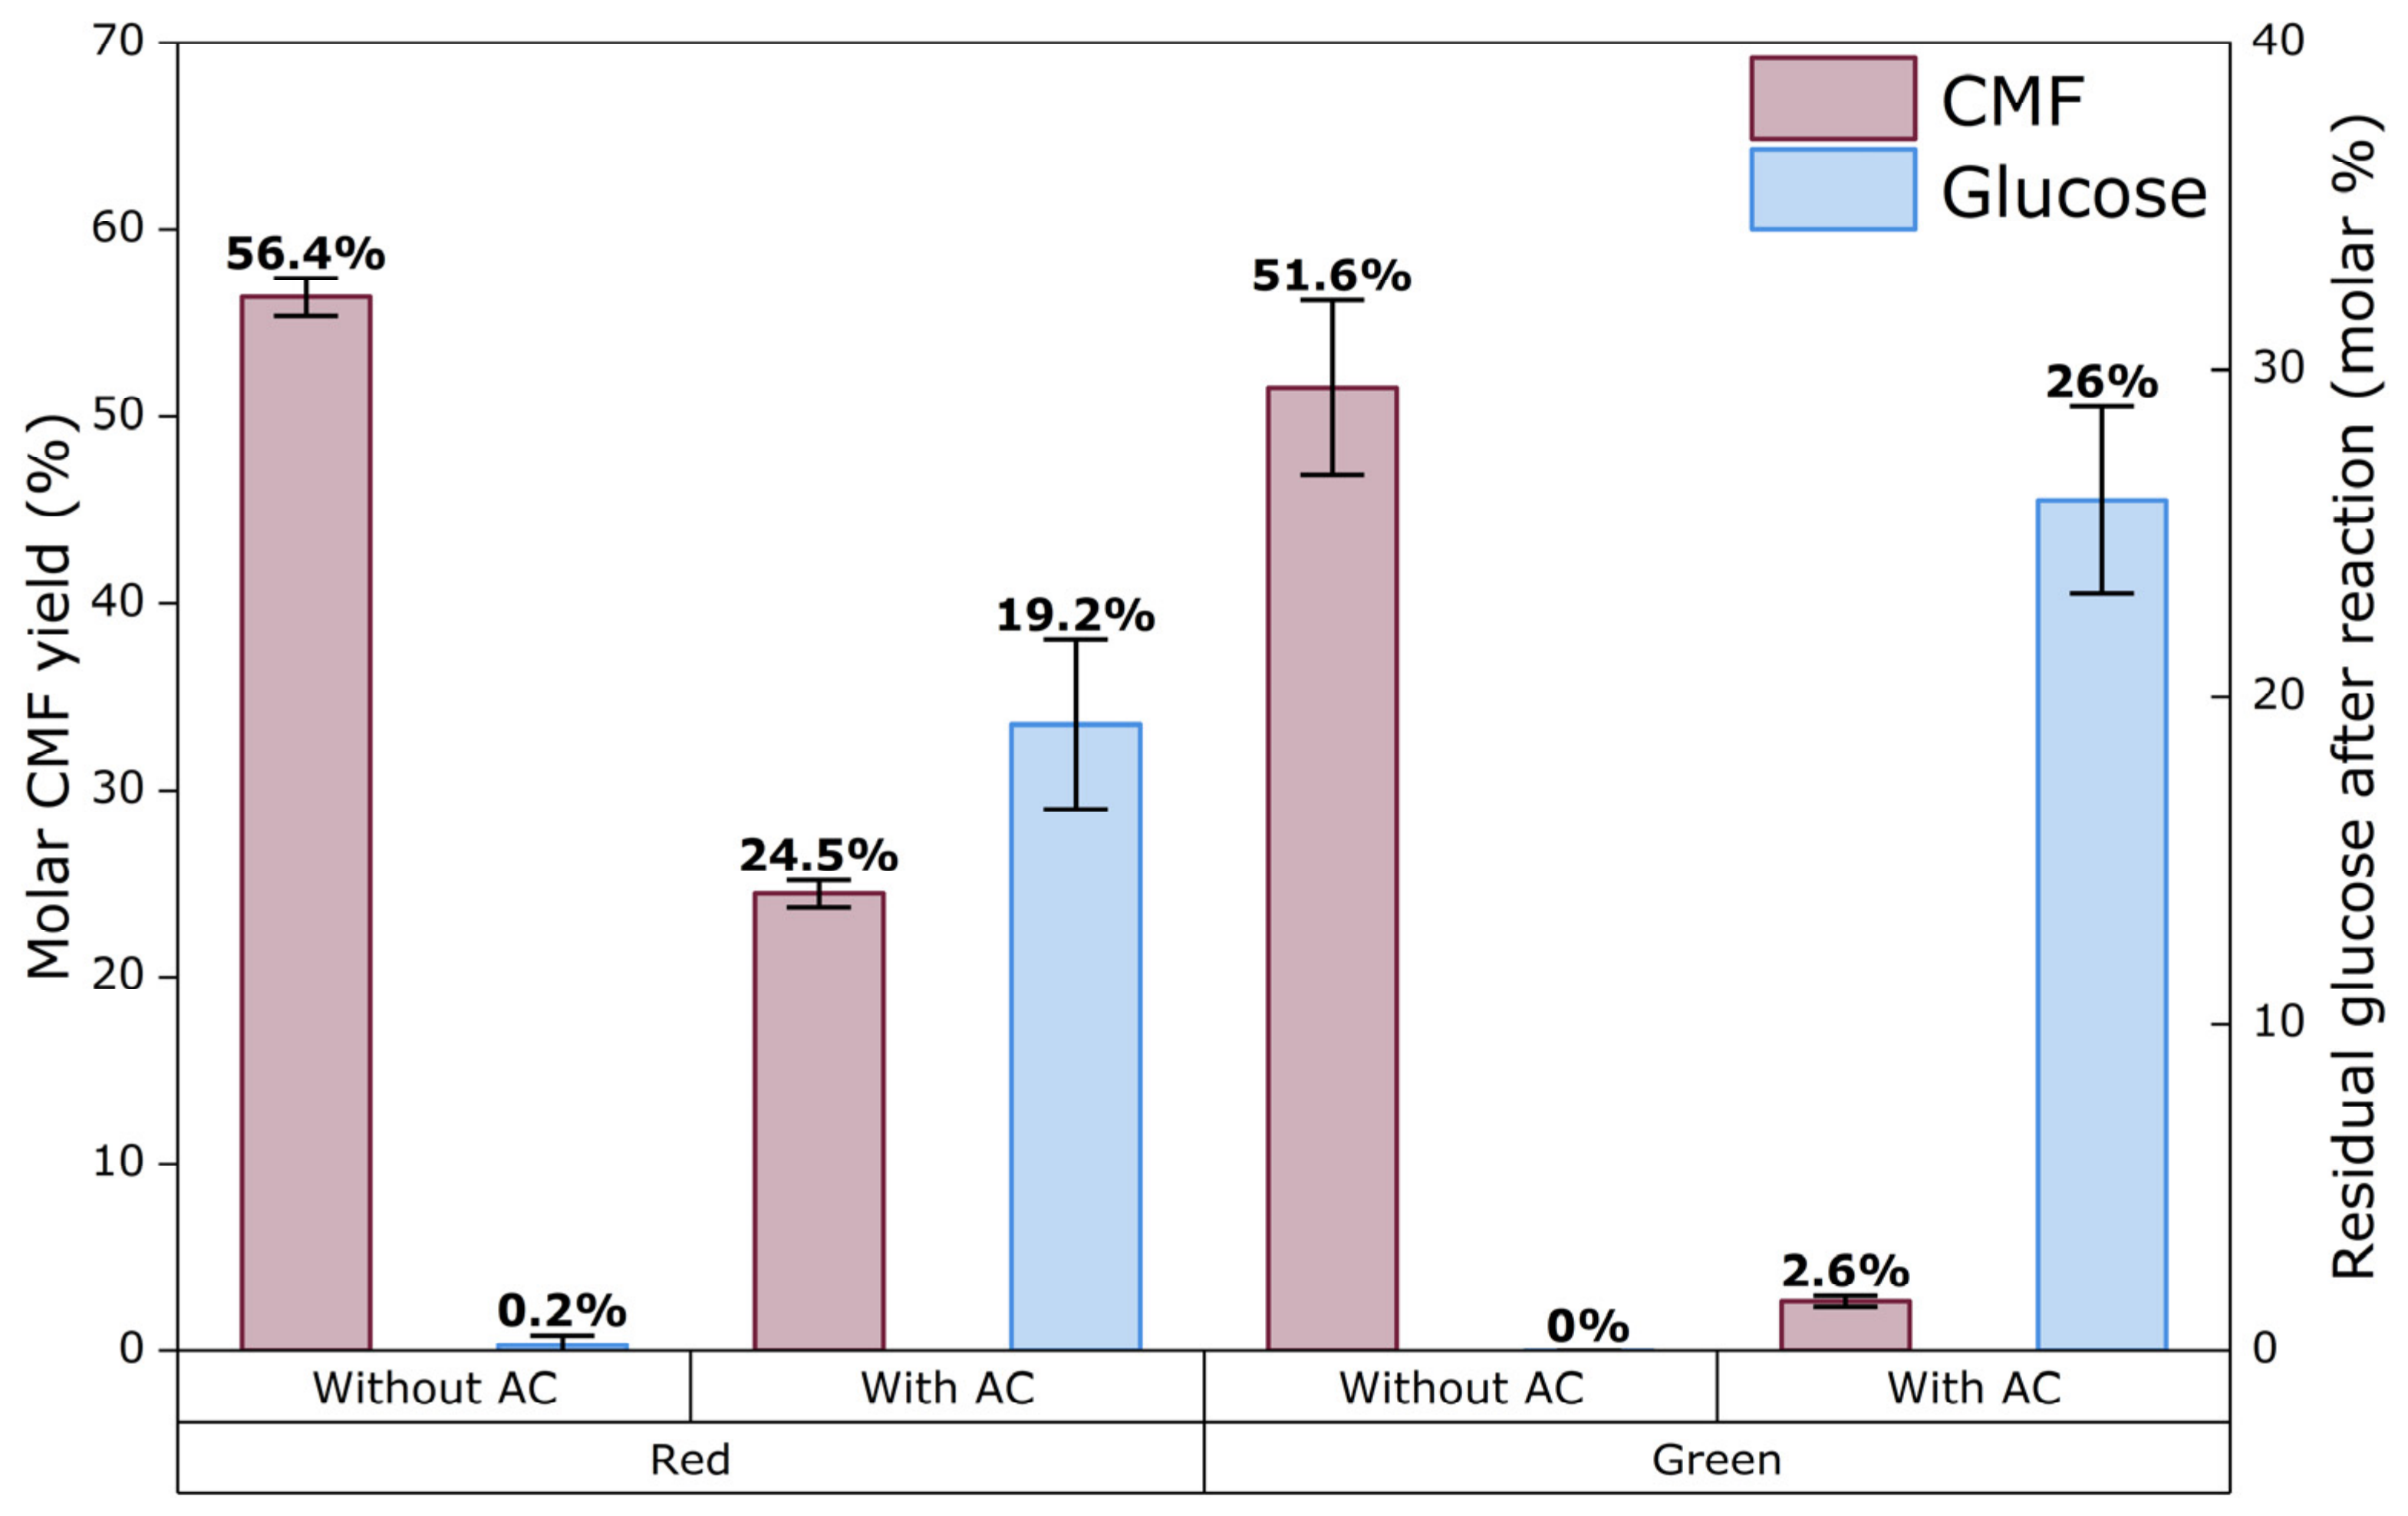
The samples treated with activated carbon exhibit a significantly lower CMF yield compared to the untreated samples (Figure 11). For both red and green yarn, the CMF yield decreased from 56.4 and 51.6% to 24.5 and 2.6%, respectively. This substantial reduction may be attributed to several factors. One possibility is the adsorption of sugars onto the activated carbon; however, earlier results in this work suggested that the use of AC did not significantly reduce the saccharide concentration. Alternatively, a dramatic decrease in acid concentration may have occurred due to adsorption of HCl onto the activated carbon, dilution by water introduced during filtration or desorption of gaseous HCl resulting from temperature increases in the open glassware required for filtration.
Figure 11.
Molar CMF yield and residual glucose percentage after reaction of CMF synthesis from colored and decolorized hydrolysate. Reaction conditions two-step batch synthesis with adsorption: 1. Cellulolysis of 1.5 h with 50 mg yarn and 1 mL HCl (44 wt%). Adsorption of the dye with 10 mg/mL AC2 for 20 min and 600 rpm at room temperature. Separation performed with glass filter paper. 2. Synthesis of CMF with 1 mL (decolorized) hydrolysate, 4 mL PhCl, 91 °C, 1 h, 900 rpm. All experiments were performed in triplicate.
The hypothesis of reduced acid concentration is further supported by the residual glucose content in the reactors treated with activated carbon. In the absence of activated carbon, (almost) complete glucose conversion was observed, whereas the red and green samples treated with activated carbon showed residual monomeric glucose contents of 19.2 and 26%, respectively (Figure 11). This suggests that the HCl concentration was lower, leading to a reduced reaction rate for both the conversion of glucose to CMF, but also the further cellulolysis reaction of oligosaccharides into monomeric glucose.
A decrease in HCl concentration also seemed visible by the altered structure of the heterogeneous reaction mixture observed in one of the reactors after CMF synthesis (Figure S8). Under normal conditions, the aqueous phase (primarily 44 wt% HCl) has a density of approximately 1220 kg/m3, while the organic phase (mainly chlorobenzene) has a density of approximately 1110 kg/m3, resulting in a well-defined biphasic system. However, when the HCl concentration decreases from 44 to 37 wt%, the density of the aqueous phase decreases from 1220 to 1184 kg/m3. This reduction significantly affects the density difference between the phases, leading to the observed change in the structure of the heterogeneous mixture.
Overall, the current experimental setup does not permit a definitive explanation for the observed decrease in CMF yield when activated carbon is used for hydrolysate decolorization. In contrast, it makes performing the reaction on laboratory scale more challenging and unreliable. Additionally, the removal of dye molecules did not lead to a higher CMF yield; on the contrary, the yield was even lower compared to the dye containing samples. Furthermore, as the presence of the dyes did not appear to affect the CMF yield, the use of AC is not recommended. The use of an adsorption step would also lead to an increase in processing costs, while the use of AC is not justified based on the current results. Therefore, it is not advised to use AC based on the current results and the dyes and their degradation products can be removed from the system during the current downstream processing as indicated in the conceptual process design of the HCl-based recycling process for polycotton waste [10,37].
4. Conclusions
The results of this preliminary study on the effects of dyes in the HCl-based polycotton recycling process showed that the dye molecules present in our selected cotton textiles did not influence CMF production. The heat applied during the second step of the process, the CMF production step, led to the degradation of the dye molecules which may lead to contamination of the process streams. The organic layers obtained after CMF production exhibited a variety of colors; however, no correlation could be found between the initial color of the yarn and the final color of the organic layer.
To prevent the migration of the dyes and their degradation products during the CMF production step, activated carbon was used to decolorize the hydrolysate obtained after the cellulolysis step. Both tested ACs proved effective in removing dye molecules from hydrolysates produced from four different types of post-consumer polycotton waste. Additionally, the ACs seemed not to affect the glucose yield after dye adsorption, as post-hydrolysis treatment of the decolorized hydrolysate showed full recovery of the saccharides.
However, the CMF production from decolorized hydrolysate showed significantly reduced CMF yields. Although the exact cause cannot be definitively identified, a decrease in HCl concentration is a plausible explanation. Furthermore, the additional processing steps for adsorption on laboratory scale introduced variability and reduced the reliability of the reaction. As the dye molecules also did not seem to negatively influence the CMF yield, the further use of activated carbon on laboratory scale is not recommended.
Supplementary Materials
The following supporting information can be downloaded at https://www.mdpi.com/article/10.3390/textiles6040133/s1, Figure S1: Five differently colored mercerized cotton yarns used in the dye testing experiment; Figure S2: Reactors with different colored yarns and 44 wt% hydrochloric acid (HCl) after cellulolysis for 10 min; Figure S3: Reactors with the hydrolysate from cellulolysis step with chlorobenzene before heating after vigorous shaking; Table S1: Measured 5-(chloromethyl)furfural (CMF) concentration after five times dilution of the individual organic layer vials of CMF production; Figure S4: Organic washing layer from the two-step batch reaction; Figure S5: Aqueous layers from the two-step batch reaction after addition of 7 mL water and before filtration; Figure S6: Aqueous layer from the two-step batch reaction after addition of 7 mL water and filtration; Figure S7: Four different polycotton post-consumer waste textiles used for dye adsorption tests; Table S2: Correlation between the wavelength of the absorbed light and the observed color; Figure S8: Reactors (triplicates) after CMF synthesis from decolorized green hydrolysate.
Author Contributions
N.L.: conceptualization, methodology, formal analysis, writing—original draft preparation and editing. G.P.M.v.K.: conceptualization, writing—reviewing, supervision. G.-J.M.G.: conceptualization, writing—reviewing, supervision. All authors have read and agreed to the published version of the manuscript.
Funding
This research is part of the project MIWATEX (project number [KICH1.ED01.20.006]) of the research program Circularity (KIC), which is (partly) financed by the Dutch Research Council (NWO).
Data Availability Statement
The authors declare that the data supporting the findings of this study are available within the paper. Should any raw data files be needed in another format, they are available from the corresponding author upon reasonable request.
Acknowledgments
The authors acknowledge Norit Activated Carbon for the generous supply of activated carbon.
Conflicts of Interest
G.P.M.v.K. works at Avantium. G.-J.G. is the CTO of Avantium and holds the chair of Industrial Sustainable Chemistry at the University of Amsterdam. The remaining author declares no competing interests. The company Norit Activated Carbon was not involved in the study design, collection, analysis, interpretation of data, the writing of this article or the decision to submit it for publication.
Abbreviations
The following abbreviations are used in this manuscript:
| AC | Activated carbon |
| ANOVA | Analysis of variance |
| CMF | 5-(Chloromethyl)furfural |
| GC | Gas chromatography |
| HCl | Hydrochloric acid |
| HPLC | High–performance liquid chromatography |
| PhCl | Chlorobenzene |
| UV-Vis | Ultraviolet–visible spectrophotometry |
References
- Loo, S.-L.; Yu, E.; Hu, X. Tackling Critical Challenges in Textile Circularity: A Review on Strategies for Recycling Cellulose and Polyester from Blended Fabrics. J. Environ. Chem. Eng. 2023, 11, 110482. [Google Scholar] [CrossRef] [Scilit]
- Abbate, S.; Centobelli, P.; Cerchione, R.; Nadeem, S.P.; Riccio, E. Sustainability Trends and Gaps in the Textile, Apparel and Fashion Industries. Environ. Dev. Sustain. 2023, 26, 2837–2864. [Google Scholar] [CrossRef] [Scilit]
- Slobodkina, L.; Muzyka, R.; Sajdak, M.; Sobek, S.; Werle, S. Recent Trends in Textile Waste Recycling: An Overview. Rev. Chem. Eng. 2026, 42, 283–306. [Google Scholar] [CrossRef] [Scilit]
- Biyada, S.; Urbonavičius, J. Circularity in Textile Waste: Challenges and Pathways to Sustainability. Clean. Eng. Technol. 2025, 24, 100905. [Google Scholar] [CrossRef] [Scilit]
- BCG. Spinning Textile Waste into Value. Available online: https://www.bcg.com/publications/2025/spinning-textile-waste-into-value (accessed on 20 January 2026).
- Ellen MacArthur Foundation. A New Textiles Economy: Redesigning Fashion’s Future. Available online: https://ellenmacarthurfoundation.org/a-new-textiles-economy (accessed on 4 August 2024).
- Ghosh, J.; Repon, M.R.; Rupanty, N.S.; Asif, T.R.; Tamjid, M.I.; Reukov, V. Chemical Valorization of Textile Waste: Advancing Sustainable Recycling for a Circular Economy. ACS Omega 2025, 10, 11697–11722. [Google Scholar] [CrossRef] [Scilit]
- Ndagano, U.N.; Cahill, L.; Smullen, C.; Gaughran, J.; Kelleher, S.M. The Current State-of-the-Art of the Processes Involved in the Chemical Recycling of Textile Waste. Molecules 2025, 30, 299. [Google Scholar] [CrossRef] [Scilit]
- Clark, J.H. Textile Waste—An Opportunity as Well as a Threat. Green Carbon 2023, 1, 146–149. [Google Scholar] [CrossRef] [Scilit]
- Leenders, N.; Moerbeek, R.M.; Puijk, M.J.; Bronkhorst, R.J.A.; Bueno Morón, J.; van Klink, G.P.M.; Gruter, G.-J.M. Polycotton Waste Textile Recycling by Sequential Hydrolysis and Glycolysis. Nat. Commun. 2025, 16, 738. [Google Scholar] [CrossRef] [Scilit]
- Periyasamy, A.P.; Harlin, A. The Need and Challenges of Decolorization of Textile Waste in Textile Recycling: Review. ChemistrySelect 2025, 10, e01130. [Google Scholar] [CrossRef] [Scilit]
- Wang, S.; Salmon, S. Progress toward Circularity of Polyester and Cotton Textiles. Sustain. Chem. 2022, 3, 376–403. [Google Scholar] [CrossRef] [Scilit]
- Hassan, M.M. A Comprehensive Review of the Advances in Process Engineering and Greener Solvents in Dyeing to Impart Sustainable Textile Manufacturing. Sustain. Mater. Technol. 2025, 45, e01490. [Google Scholar] [CrossRef] [Scilit]
- Upadhyay, R.; Przystaś, W.; Dave, B. Myco-Remediation of Synthetic Dyes: A Comprehensive Review on Contaminant Alleviation Mechanism, Kinetic Study and Toxicity Analysis. Int. J. Environ. Sci. Technol. 2025, 22, 521–538. [Google Scholar] [CrossRef] [Scilit]
- Al-Degs, Y.; El-Barghouthi, M.; El-Sheikh, A.; Walker, G. Effect of Solution PH, Ionic Strength, and Temperature on Adsorption Behavior of Reactive Dyes on Activated Carbon. Dye. Pigment. 2008, 77, 16–23. [Google Scholar] [CrossRef] [Scilit]
- Gürses, A.; Açıkyıldız, M.; Güneş, K.; Gürses, M.S. Dyes and Pigments: Their Structure and Properties. In Dyes and Pigments; Springer: Cham, Switzerland, 2016; pp. 13–29. [Google Scholar]
- Gupta, V.K.; Suhas. Application of Low-Cost Adsorbents for Dye Removal—A Review. J. Environ. Manag. 2009, 90, 2313–2342. [Google Scholar] [CrossRef] [Scilit]
- Sanchez, L.M.; Ollier, R.P.; Gonzalez, J.S.; Alvarez, V.A. Nanocomposite Materials for Dyes Removal. In Handbook of Nanomaterials for Industrial Applications; Elsevier: Amsterdam, The Netherlands, 2018; pp. 922–951. [Google Scholar]
- Ayadi, I.; Souissi, Y. Chemical Synonyms, Molecular Structure and Toxicological Risk Assessment of Synthetic Textile Dyes: A Critical Review. J. Dev. Drugs 2016, 5, 57. [Google Scholar] [CrossRef]
- Kiernan, J. Classification and Naming of Dyes, Stains and Fluorochromes. Biotech. Histochem. 2001, 76, 261–278. [Google Scholar] [CrossRef] [Scilit]
- Gorreta, G.; Maesani, C.; Alini, S.; Blangetti, M.; Prandi, C. Towards Fiber-to-Fiber Recycling of Synthetic Textile Wastes: The Problem of Decolorization. Waste Manag. 2025, 205, 114979. [Google Scholar] [CrossRef] [Scilit]
- Raman, C.D.; Kanmani, S. Textile Dye Degradation Using Nano Zero Valent Iron: A Review. J. Environ. Manag. 2016, 177, 341–355. [Google Scholar] [CrossRef] [Scilit]
- Benkhaya, S.; M’rabet, S.; El Harfi, A. A Review on Classifications, Recent Synthesis and Applications of Textile Dyes. Inorg. Chem. Commun. 2020, 115, 107891. [Google Scholar] [CrossRef] [Scilit]
- Burkinshaw, S.M.; Salihu, G. The Wash-off of Dyeings Using Interstitial Water. Part 4: Disperse and Reactive Dyes on Polyester/Cotton Fabric. Dye. Pigment. 2013, 99, 548–560. [Google Scholar] [CrossRef] [Scilit]
- Wang, J.; Cheng, W.; Gao, Y.; Zhu, L.; Pei, L. Mechanism of Accelerant on Disperse Dyeing for PET Fiber in the Silicone Solvent Dyeing System. Polymers 2019, 11, 520. [Google Scholar] [CrossRef] [Scilit]
- Leube, H. Textile Dyeing. In Industrial Dyes; Wiley: Hoboken, NJ, USA, 2002; pp. 339–425. [Google Scholar]
- Dhouib, S.; Lallam, A.; Sakli, F. Study of Dyeing Behavior of Polyester Fibers with Disperse Dyes. Text. Res. J. 2006, 76, 271–280. [Google Scholar] [CrossRef] [Scilit]
- Ketema, A.; Worku, A. Review on Intermolecular Forces between Dyes Used for Polyester Dyeing and Polyester Fiber. J. Chem. 2020, 2020, 6628404. [Google Scholar] [CrossRef] [Scilit]
- Muralidharan, B.; Laya, S. A New Approach to Dyeing of 80 : 20 Polyester/Cotton Blended Fabric Using Disperse and Reactive Dyes. ISRN Mater. Sci. 2011, 2011, 907493. [Google Scholar] [CrossRef] [Scilit]
- Singha, K. Characterization of Dyeing P/C Blends Fabric: A Thermodynamic View. Int. J. Text. Sci. 2013, 2, 1–6. [Google Scholar] [CrossRef]
- Yi, J.; Pei, L.; Lu, D.; Sun, S.; Hu, Q.; Luo, C.; Zhang, X.; Wang, J. A Short-Time, Low-Dosage Chemicals Dyeing of Polyester/Cotton Blended Fabric with Benzothiazole Dyes in Water-Less, Salt-Free Dyeing System. Int. J. Biol. Macromol. 2025, 284, 138159. [Google Scholar] [CrossRef] [Scilit]
- Robinson, T.; McMullan, G.; Marchant, R.; Nigam, P. Remediation of Dyes in Textile Effluent: A Critical Review on Current Treatment Technologies with a Proposed Alternative. Bioresour. Technol. 2001, 77, 247–255. [Google Scholar] [CrossRef] [Scilit]
- Mezohegyi, G.; van der Zee, F.P.; Font, J.; Fortuny, A.; Fabregat, A. Towards Advanced Aqueous Dye Removal Processes: A Short Review on the Versatile Role of Activated Carbon. J. Environ. Manag. 2012, 102, 148–164. [Google Scholar] [CrossRef] [Scilit]
- El Maguana, Y.; Elhadiri, N.; Benchanaa, M.; Chikri, R. Activated Carbon for Dyes Removal: Modeling and Understanding the Adsorption Process. J. Chem. 2020, 2020, 2096834. [Google Scholar] [CrossRef] [Scilit]
- Yagub, M.T.; Sen, T.K.; Afroze, S.; Ang, H.M. Dye and Its Removal from Aqueous Solution by Adsorption: A Review. Adv. Colloid Interface Sci. 2014, 209, 172–184. [Google Scholar] [CrossRef] [Scilit]
- Avantium Dawn Technology®. Turning Post-Consumer Textile Waste into Valuable Products. Available online: https://avantium.com/products-technologies/dawn-technology/ (accessed on 20 January 2026).
- Leenders, N.; Groot, T.S.; van Klink, G.P.M.; Gruter, G.-J.M. 5-(Chloromethyl)Furfural from Polycotton Waste Textile in a Biphasic System: Different Process Designs. ACS Omega 2026, 11, 50933–50944. [Google Scholar] [CrossRef] [Scilit]
- Leenders, N.; van Klink, G.P.M.; Gruter, G.-J.M. Beyond Polycotton: How Other Fibers Affect the HCl-Based Polycotton Recycling Process. Textiles 2026, 6, 79. [Google Scholar] [CrossRef] [Scilit]
- Mascal, M. 5-(Chloromethyl)Furfural (CMF): A Platform for Transforming Cellulose into Commercial Products. ACS Sustain. Chem. Eng. 2019, 7, 5588–5601. [Google Scholar] [CrossRef] [Scilit]
- Slokar, Y.M.; Majcen Le Marechal, A. Methods of Decoloration of Textile Wastewaters. Dye. Pigment. 1998, 37, 335–356. [Google Scholar] [CrossRef] [Scilit]
- Constant, S.; Lancefield, C.S.; Vogelzang, W.; Pazhavelikkakath Purushothaman, R.K.; Frissen, A.E.; Houben, K.; de Peinder, P.; Baldus, M.; Weckhuysen, B.M.; van Es, D.S.; et al. Molecular Structure and Composition Elucidation of an Industrial Humin and Its Fractions. Green Chem. 2024, 26, 7739–7751. [Google Scholar] [CrossRef] [Scilit]
- Karimi, S.; Gharouni Fattah, S.; Li, Z.; Zuo, M.; Nasrollahzadeh, M.; Zeng, X. A Comparative Study of 5-(Chloromethyl)Furfural and 5-(Hydroxymethyl)Furfural. Green Chem. 2025, 27, 379–402. [Google Scholar] [CrossRef] [Scilit]
- van Putten, R.-J.; van der Waal, J.C.; de Jong, E.; Rasrendra, C.B.; Heeres, H.J.; de Vries, J.G. Hydroxymethylfurfural, A Versatile Platform Chemical Made from Renewable Resources. Chem. Rev. 2013, 113, 1499–1597. [Google Scholar] [CrossRef] [Scilit]
- Sudarsan, S.; Murugesan, G.; Varadavenkatesan, T.; Vinayagam, R.; Selvaraj, R. Efficient Adsorptive Removal of Congo Red Dye Using Activated Carbon Derived from Spathodea Campanulata Flowers. Sci. Rep. 2025, 15, 1831. [Google Scholar] [CrossRef] [Scilit]
- Mihret, T.; Gabbiye, N.; Tegegne, B.; Tibebe, D.; Alemu, A. Removal of Reactive Red 45 Dye from Aqueous Solution Using Activated Carbon Developed from Catha Edulis Stem as a Potential Biosorbent. Sci. Rep. 2025, 15, 28195. [Google Scholar] [CrossRef] [Scilit]

Disclaimer/Publisher’s Note: The statements, opinions and data contained in all publications are solely those of the individual author(s) and contributor(s) and not of MDPI and/or the editor(s). MDPI and/or the editor(s) disclaim responsibility for any injury to people or property resulting from any ideas, methods, instructions or products referred to in the content. |
© 2026 by the authors. Licensee MDPI, Basel, Switzerland. This article is an open access article distributed under the terms and conditions of the Creative Commons Attribution (CC BY) license.