


Abstract
Cobalt ferrite (CoFe2O4) photocatalysts were synthesized through a citric acid–ethylene glycol-assisted sol–gel route by systematically varying the Co2+ precursor concentration from 0.1 to 0.5 M. Precursor concentration significantly influenced the structural, optical, surface, and photocatalytic properties of the resulting CoFe2O4. Among the synthesized samples, Sp3, prepared using 0.3 M Co2+ precursor, exhibited the smallest crystallite size (17 nm), the largest (311) d-spacing (0.268 nm), and an indirect optical band gap of approximately 1.3 eV. XPS analysis of the optimized catalyst revealed mixed Co2+/Co3+ and Fe2+/Fe3+ oxidation states together with lattice and defect-associated oxygen species, indicating a redox-active surface environment. Under UV–Vis irradiation using a 350 W xenon (Xe) lamp, Sp3 achieved complete phenol removal within approximately 40 min and exhibited the highest apparent pseudo-first-order rate constant (0.162 min−1) among the synthesized samples. H2O2 addition further accelerated phenol degradation. Reactive-species scavenging experiments identified •OH as the predominant reactive species, with additional contributions from •O2− and h+. TOC removal reached approximately 88% after 15 min under the optimized conditions, demonstrating substantial mineralization. Furthermore, recycling experiments, post-reaction XRD, and ICP-OES analysis demonstrated good structural and chemical stability of the optimized catalyst. These results demonstrate that controlled precursor concentration provides an effective approach for optimizing CoFe2O4 for photocatalytic degradation of phenolic pollutants under UV–Vis irradiation.
1. Introduction
Phenol is a representative aromatic micropollutant and a probe molecule to test advanced wastewater treatment technologies. Phenol contamination of surface water, groundwater, and industrial wastewater is generally of industrial origin, from plastics, fibers, adhesives, oil and synthetic fuels, petrochemicals, coke production, iron and steel foundries, pharmaceuticals, leather tanneries, and the pesticide sector. The toxicity of phenol to aquatic organisms and its inhibitory effects on biological treatment of wastewater have received considerable attention. Acute exposure to phenol can cause severe irritation to skin, eyes, and mucous membranes. After absorption into the body through the skin, lungs, gastrointestinal tract, nervous system, blood, liver, and kidneys, systemic effects can occur [1,2]. As there is no universal drinking-water limit for phenol, in the United States, 21 CFR §165.110 has established a maximum allowable level of 0.001 mg/L for total phenols in bottled water. Previously, the World Health Organization (WHO) had recommended a maximum of 0.001 mg/L for total phenol in water to be chlorinated to prevent taste and odor problems from chlorophenols [3,4,5].
Since phenol is colorless, its photocatalytic degradation is not expected to involve dye-sensitization effectsPhenol can be removed from water by various methods. Most of these methods transfer the phenol to a second solid or to the concentrated retentate in the case of membrane filtration and thus require further treatment. Biological removal of phenol is economical, but the metabolism by microorganisms is generally inhibited at high concentrations of phenol. Chemical and electrochemical methods of oxidation require a large amount of reagents and thus generate a large amount of sludge; in addition, a lot of energy is required, and the methods can be operated only at a limited pH. On the other hand, semiconductor-based photocatalysis uses photons that are absorbed by the semiconductor to form conduction-band electrons and valence-band holes. The product distribution from partial oxidation of phenol contains catechol, hydroquinone, benzoquinone and low-molecular-weight organic acids. Hence, apparent removal of phenol is not sufficient and must be accompanied by aromatic ring opening and mineralization to CO2 and H2O. As such, phenol is a challenging contaminant for testing solar-driven photocatalysis and correlation between the semiconductor’s electronic structure and its activity [6,7]. The conduction-band electrons can reduce O2 to form •OH, while the valence-band holes can oxidize H2O/OH− on the surface of the semiconductor to form •OH. Thus, many reactive oxygen species are formed, which can carry out the hydroxylation, ring opening, and complete mineralization of the aromatic rings of the pollutant. High-energy photons from solar light are absorbed by the semiconductor, and thus the treatment can be carried out without external sources of UV light and without the continuous addition of an oxidant. The efficiency of a photocatalytic system depends on several parameters, such as light harvesting, the charge-separation process, interfacial charge transfer, adsorption of the pollutant on the semiconductor’s surface, and preservation of the redox potential of the semiconductor for a sufficient time [8,9].
The use of photocatalysis for the treatment of wastewater containing aromatic micropollutants has been investigated using a wide variety of semiconductors in suspension, films, or as part of hybrid materials or nano-photocatalytic heterostructures. Most studies have been performed using TiO2, ZnO, ZrO2, CdS, Fe2O3, bismuth-based compounds, and g-C3N4 as the main photocatalyst. TiO2 is the most widely used material because it is non-toxic, stable, and has a suitable valence band for the oxidation of organic compounds. However, it only absorbs a small portion of solar radiation in the solar spectrum (about 4% corresponding to wavelengths below 387 nm, i.e., ultraviolet light). For this reason, a great deal of research has been focused on the use of visible light, and the results obtained with some compounds, such as CdS, have been poor due to the compound’s strong tendency to be photocorroded [9,10]. Other semiconductors, such as g-C3N4, have moderate band gap energies (2.7 eV) but low surface areas and a high rate of recombination of the charge carriers [7]. The use of single photocatalysts has some limitations, and, for this reason, a great deal of research has been focused on the use of spinel ferrites of the MFe2O4 type, where M is a transition metal cation, or a combination of cations, such as Co, Ni, Cu, and Zn [11]. These compounds have visible light photocatalytic activity, redox-active sites, and are chemically stable. In addition, many of these compounds are magnetic, and thus can be easily recovered by magnetic separation. The activity of the ferrites has been reported in several studies, but the degradation percentages reported cannot be used to compare the performance of the different compounds, because the experiments were carried out under different conditions, such as varied amounts of catalyst, model compounds, light sources, and experimental conditions, such as pH and amount of oxidizing agent [12,13,14,15]. For these reasons, a p–n type heterojunction between CoFe2O4 and g-C3N4, in the form of a suspension in water, was found to be the most active system for the degradation of both a colored pollutant, such as methyl orange, and a non-colored pollutant, such as 4-chlorophenol, in the presence of H2O2 [7]. In other studies, trace amounts of CoFe2O4 anchored on surfaces of TiO2 have been found to enhance the O2 reduction reaction and the oxidation of the parent phenol by utilizing the electrons and holes photogenerated on the surfaces of the TiO2 [16]. Other compounds, such as Ni–Zn ferrites, are highly active for the complete oxidation of 4-chlorophenol by means of heterogeneous peroxide oxidation at neutral pH, and are more active than ZnFe2O4 [17]. LaFeO3 loaded on g-C3N4 has reported activity for the visible-light-induced degradation of 4-chlorophenol [18]. In general, the activity of a ferrite depends on optical absorption, positions of the band edges, redox ability of the cations, possibility of forming junctions with other semiconductor materials, surface area and the interfacial charge transfer kinetics at the contact points between the grains of the ferrite.
In recent years, the spinel ferrites MFe2O4 (M = Co, Ni, Cu, Zn and others) have attracted attention as visible-light-responsive, chemically stable and recoverable photocatalysts [19]. Their intrinsic photocatalytic activity, however, is greatly influenced by the charge carrier’s lifetime, surface-active sites and the catalyst’s crystallinity, and thus it is generally low. CoFe2O4, as a typical p-type narrow band gap semiconductor, has been found to have a 50% inverse-spinel structure with good magnetic separability [20]. It has been calculated that the band gap of CoFe2O4 is approximately 0.8 eV. However, the positive conduction band edge position facilitates the reduction reaction that is thermodynamically favorable. Therefore, the CoFe2O4 samples generally suffer from fast recombination of the photo-charge carriers, agglomeration of the small particles and low efficiency of the active sites. In addition, it was also reported that the plasmonic modification enhanced the degradation rate of an anionic dye by using solar light to irradiate the Al/TiO2 composites, whereas the phenol degradation was decreased in some configurations due to the unfavorable surface interactions with neutral phenol molecules [21]. In summary, although enhanced photon absorption is crucial for phenol oxidation, the electronic regulation of photocatalysts must be combined with pollutant adsorption, charge migration and surface redox reactions.
Therefore, the present study investigates the influence of Co2+ precursor concentration on the structural, optical, surface, and photocatalytic properties of CoFe2O4. The Co precursor concentration was systematically varied from 0.1 to 0.5 M, and the resulting materials were characterized to establish relationships between precursor concentration, physicochemical properties, and photocatalytic performance. Phenol was employed as a model pollutant to evaluate photocatalytic activity under UV–Vis irradiation using a 350 W xenon (Xe) lamp. The degradation kinetics, influence of H2O2 and initial phenol concentration, reactive species, mineralization, recyclability, post-reaction structural stability, and metal leaching were systematically evaluated. The study therefore provides insight into precursor-concentration-dependent optimization of CoFe2O4 for photocatalytic treatment of phenolic pollutants.
2. Materials and Methods
Iron(III) nitrate nonahydrate (Fe (NO3)3·9H2O, ≥99%), cobalt(II) nitrate hexahydrate (Co(NO3)2·6H2O, ≥98%), sodium hydroxide (NaOH, ≥98%), ethanol (≥99.9%), and hydrochloric acid (37 wt%) were purchased from Sigma-Aldrich (Merck KGaA, Darmstadt, Germany). All reagents were of analytical grade and were used without further purification. Deionized water (18.2 MΩ cm) was employed in all synthesis and washing procedures.
2.1. Synthesis of CoFe2O4 Nanoparticles
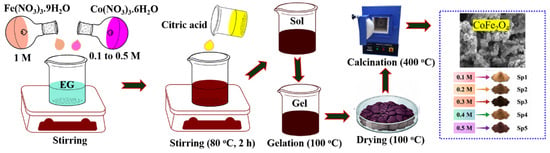
CoFe2O4 nanoparticles were synthesized using a citric acid–ethylene glycol-assisted sol–gel method. The overall citric acid–ethylene glycol-assisted sol–gel synthesis procedure and the precursor-concentration variation used to prepare Sp1–Sp5 are schematically illustrated in Figure 1. Iron(III) nitrate nonahydrate [Fe(NO3)3·9H2O] and cobalt(II) nitrate hexahydrate [Co(NO3)2·6H2O] were used as the Fe and Co precursors, respectively. The concentration of the Fe precursor was maintained at 1.0 M, while the concentration of the Co precursor was systematically varied from 0.1 to 0.5 M. Accordingly, the samples prepared using 0.1, 0.2, 0.3, 0.4, and 0.5 M Co(NO3)2·6H2O were designated Sp1, Sp2, Sp3, Sp4, and Sp5, respectively. The Fe and Co precursor solutions were mixed, followed by the addition of an aqueous citric acid solution as a complexing agent and ethylene glycol (EG) as a polycondensation agent. The total metal-ion-to-citric-acid molar ratio was maintained at 1:1.4. The resulting homogeneous precursor solution was continuously stirred at 80 °C for 2 h and subsequently subjected to slow evaporation to form a highly viscous sol. Further gelation produced a dark porous gel, which was pyrolyzed at 400 °C for 4 h at a heating rate of 5 °C min−1 to remove residual nitrates and organic constituents. Next, the calcined sample was washed with water and ethanol several times and dried in vacuum oven at 100 °C overnight to obtain crystalline CoFe2O4 powders. The synthesized samples were stored for subsequent physicochemical characterization and photocatalytic experiments.
Figure 1.
Schematic illustration of the citric acid–ethylene glycol-assisted sol–gel synthesis of CoFe2O4 nanoparticles with varying Co2+ precursor concentrations (Sp1–Sp5).
2.2. Characterizations
The obtained CoFe2O4 powder samples were studied for their structural, morphological, optical, surface and electronic properties. XRD (X-ray powder diffraction) was used to determine the crystalline phase and the spinel-type structure. Diffraction patterns were recorded by a PANalytical X-ray diffractometer equipped with Cu Kα radiation (λ = 1.540598 Å) and operated at 40 kV and 40 mA. For the investigation of the optical properties of the samples, UV–Visible diffuse-reflectance spectra were recorded by a VARIAN Cary 4000 spectrophotometer. The optical band gap energy was calculated from the obtained spectra after transformation by the well-known Kubelka–Munk function. The morphology of the particles, their size, elemental composition, as well as the lattice structure of the samples were studied by a JEM-2100F transmission electron microscope (TEM) equipped with energy-dispersive X-ray spectroscopy (EDS). High-resolution TEM images were taken in order to study the local structure of the samples. The surface elemental composition as well as the corresponding oxidation states of the elements were studied by X-ray photoelectron spectroscopy (XPS) on an ESCALAB 250 Xi spectrometer using Al Kα radiation.
2.3. Photocatalytic Degradation Experiment
The photocatalytic activity of the synthesized catalysts was evaluated under UV–Vis light irradiation using a 350 W xenon lamp with a 10 ppm phenol solution as the model pollutant. Briefly, 10 mg of the catalyst was dispersed in 100 mL of the prepared phenol solution, and the suspension was continuously irradiated using the 350 W xenon (Xe) lamp. Aliquots of the reaction mixture were collected at 10 min intervals, centrifuged for 2 min to remove the catalyst particles, and analyzed using a UV–Vis spectrophotometer to determine the absorbance of the residual phenol solution. The effects of catalyst dosage, solution pH, H2O2 concentration, and initial phenol concentration on the photocatalytic degradation were systematically optimized. The photocatalytic degradation efficiency was calculated using the following equation.
where C0 represents the initial concentration of the phenol (mg·L−1), and Cf indicates the concentration of the final phenol solution at various photocatalytic reaction times.
3. Results and Discussion
3.1. Physicochemical Properties
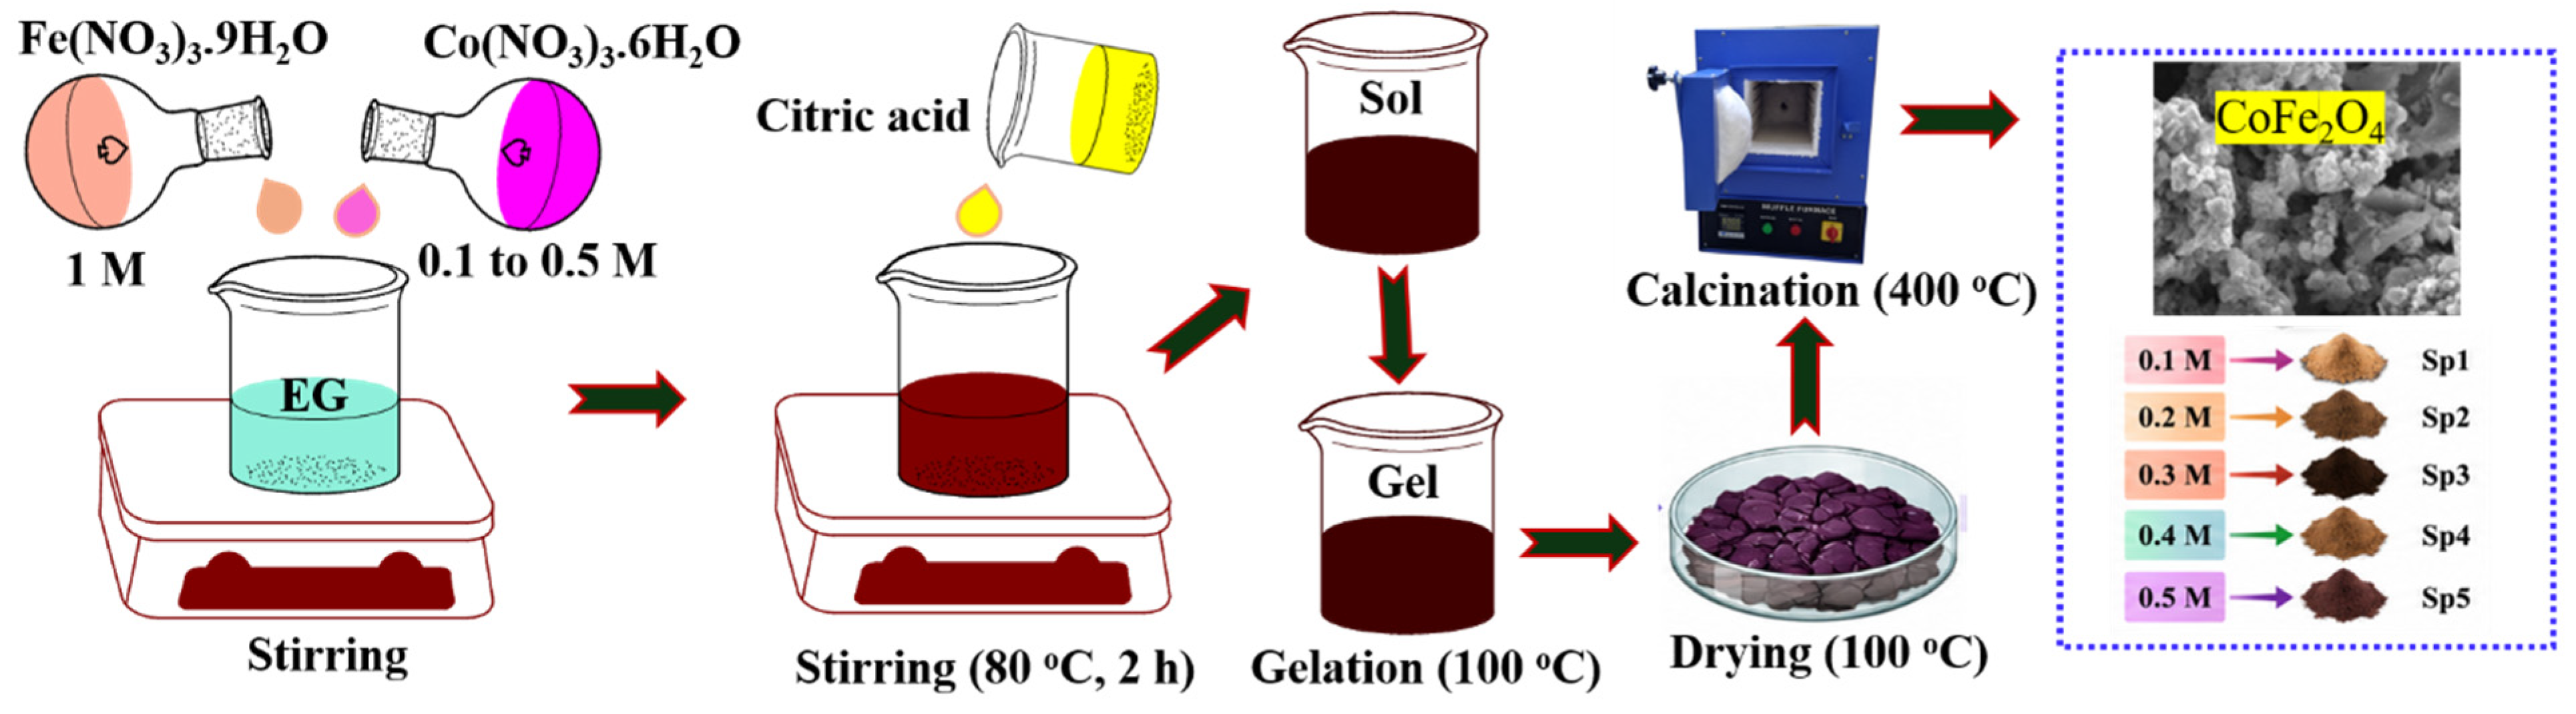
The as-developed samples of cobalt ferrite, Sp1 to Sp5, were prepared from five solutions of different concentrations of the cobalt precursor, 0.1 M Co (Sp1), 0.2 M Co (Sp2), 0.3 M Co (Sp3), 0.4 M Co (Sp4) and 0.5 M Co (Sp5). In the XRD, FTIR, diffuse-reflectance spectra and the Tauc plots for these samples, there is an increase in the crystallinity of the CoFe2O4 spinel structure with an increase in the concentration of the cobalt precursor, but the increase is not proportional.
The XRD patterns for all the cobalt ferrite samples, Sp1 to Sp5, were found to consist of the typical XRD reflections for a cubic spinel, as shown in Figure 2a. The most intense peak, corresponding to the (311) plane, was found to occur at approximately 35.5° 2θ for all the samples. The remaining reflections, for the (111), (220), (222), (400), (422), (511), and (440) planes, were also found to occur at the expected 2θ values of approximately 18.3°, 30.2°, 37.1°, 43.2°, 53.5°, 57.1° and 62.7°, respectively. The cubic inverse-spinel structure for CoFe2O4 corresponds to the Fd3m space group and has a PDF/JCPDS card No. of 22-1086 [7,22]. All the samples have all the major reflections corresponding to CoFe2O4, and there are obvious differences in the peak widths and intensities between the samples. Quantitative analysis further demonstrates that the cobalt precursor concentration significantly influences the crystallite size of CoFe2O4 without altering its principal spinel structure. The calculated crystallite sizes of Sp1, Sp2, Sp3, Sp4, and Sp5 were approximately 21, 20, 17, 18, and 21 nm, respectively. Thus, the crystallite size progressively decreased from 21 nm for Sp1 to a minimum of 17 nm for Sp3, followed by an increase to 18 and 21 nm for Sp4 and Sp5, respectively. This non-monotonic variation suggests that precursor concentration controls the balance between nucleation and crystal growth. At the intermediate Co precursor concentration corresponding to Sp3, enhanced nucleation likely restricts subsequent crystal growth, resulting in the smallest coherent crystalline domains. At higher precursor concentrations, increased particle growth and/or agglomeration during calcination may account for the increase in crystallite size. A similar concentration-dependent variation was observed in the interplanar spacing of the dominant (311) plane. The calculated d-spacing values were 0.254, 0.258, 0.268, 0.259, and 0.258 nm for Sp1, Sp2, Sp3, Sp4, and Sp5, respectively. Notably, Sp3 exhibited the largest (311) d-spacing of 0.268 nm, together with the smallest crystallite size of 17 nm. The expanded lattice spacing may indicate greater local lattice distortion/strain in Sp3 compared with the other samples. Such structural perturbation can influence defect formation and the local electronic environment of Co and Fe sites. However, because lattice strain was not independently quantified, the increased d-spacing is interpreted as evidence of structural distortion rather than being assigned directly to a specific defect. Overall, these results demonstrate that the 0.3 M Co precursor concentration (Sp3) produces a distinct microstructural state characterized by the smallest crystallite size and largest (311) interplanar spacing. These structural characteristics may increase the availability of surface-active and defect-associated sites and, together with the electronic and surface properties discussed below, contribute to the enhanced photocatalytic activity of Sp3. Furthermore, no additional intense peaks for the α-Fe2O3, Fe3O4 and CoO phases were observed in the XRD patterns for the samples, and, therefore, the major phase present in the samples is CoFe2O4.
Figure 2.
Structural and optical characterization of the as-synthesized CoFe2O4 samples: (a) X-ray diffraction (XRD) patterns, (b) FTIR spectra, (c) UV–(DRS) diffuse-reflectance spectra, and (d) Kubelka–Munk for indirect band gap energy determination.
The FTIR spectra of the synthesized Sp1–Sp5 CoFe2O4 samples are presented in Figure 2b. The FTIR spectra of as-synthesized ferrite samples exhibited two absorption bands at about 537.92 cm−1 and 471.45 cm−1, corresponding to the stretching of the M-O bond of the tetrahedral A sites of the spinel structure and M-O stretching in the octahedral B sites, respectively. The absorption band of the tetrahedral bond (A sites) has a higher wavenumber number than that of the octahedral sites (B sites) due to the longer bond length and the lower force constant of the octahedral sites in the cubic spinel structure [23,24,25]. The presence of two metal–oxygen vibrational regions (corresponding to tetrahedral and octahedral sites) in the spectra of cubic-spinel-type ferrites is typical, as shown in Figure 2b. Cobalt ferrite is often depicted as a partially inverse spinel with the following cation distribution: (Fe3+)A[Co2+Fe3+]BO4 (AB2-type structure). In this structure, the Fe3+ ions occupy all the tetrahedral sites, and the Co2+ and the remaining Fe3+ ions occupy all the octahedral sites. The degree of inversion in nanoscale cobalt ferrite materials can vary depending on several factors, i.e., the concentration of the precursor, synthesis procedures, annealing temperature and crystallite size. Thus, the two absorption bands at 537.92 cm−1 and 471.45 cm−1 can be assigned to the tetrahedral and octahedral metal–oxygen bond vibrations instead of to Fe–O or Co–O bonds. Importantly, the two characteristic absorption bands corresponding to the tetrahedral and the octahedral sites for all the samples, from Sp1 to Sp5, were observed at the same positions of wavenumbers, while the relative intensity of the absorption bands varied. This result indicates that an increase in the cobalt concentration from 0.1 M to 0.5 M does not apparently deteriorate the spinel structure, i.e., the typical 3:2 AB2 spinel structure of the ferrite. It should also be noted that the vertical displacement of the spectra indicates a shift by variation in the intensity scale (Figure 2b). In addition, no prominent absorption bands were observed in the region of 1000–4000 cm−1, indicating that essentially all of the nitrate, citrate and other organic materials used as precursors have been removed during the calcination step. Some very weak absorption due to water and/or surface hydroxyl groups is barely perceptible in this region but is deemed insignificant.
Furthermore, the diffuse-reflectance spectra of the ferrite samples show a broad absorption in the ultraviolet and visible part of the electromagnetic radiation. The optical absorption characteristics of the synthesized CoFe2O4 samples were investigated using UV–Vis diffuse-reflectance spectroscopy, as shown in Figure 2c. After a low reflectance value (high absorption) in the range of approximately 200 to 500 nm, a rise in reflectance to values of about 520 to 550 nm is observed. The samples show a dark color and are semiconductor materials with a narrow band gap. As already reported in a diffuse-reflectance study of CoFe2O4, the absorption of the whole 200 to 800 nm range of the electromagnetic radiation is possible for these materials. Thus, the material is able to absorb solar light in the whole visible region and even in the near-ultraviolet region. A clear increase in the absorption of the long-wavelength radiation with an increase in the Co concentration is observed for the samples Sp4 and Sp5 (the samples with the highest Co concentrations) and can be explained by an increased contribution of the Co-derived 3d electronic states to the optical transitions. Additionally, an increased amount of Co2+, an increased amount of intervalence charge transfer, as well as an increased amount of defect-associated energy levels in the band gap could be responsible for increased absorption of the long-wavelength radiation. The values of the reflectance of the samples Sp4 and Sp5 could also be influenced by the size and the agglomeration of the particles. The Kubelka–Munk equation, describing the light scatter by optically thick powdered samples, is frequently used to convert the reflectance (R) of powdered semiconductors into an absorption-related function, as shown by Equation (1). This equation assumes that the scattering coefficients of a sample do not vary with wavelength within the spectral region studied. Thus, differences in powder packing, particle morphology, and agglomeration could also affect the spectral shape of the reflectance.
The optical band gap of the samples was assumed to be an indirect allowed transition and was estimated from the plots of [F(R)hv]1/2 versus photon energy by using the Tauc relationship, which can be expressed as:
where hv is the incident photon energy, Eg is the optical band gap, A is a proportionality constant and (n = 1/2) for an indirect allowed transition. The Tauc plots for the absorption edges of the ferrite samples Sp1–Sp5 are presented in Figure 2d. As can be seen, all the plots are very close to each other. Thus, it can be concluded that the increase in the concentration of Co does not affect the optical gap. However, the high values of ([F(R)hv]1/2) for the different samples (for example, sample Sp4 has the highest values), correspond to the high absorption intensities of the samples. The absorption intensities cannot be used to determine the optical gap for individual samples. Instead, a linear fit to the absorption edge of each sample should be performed, and the most appropriate part of the absorption edge for each sample should be used to determine the band gap energy for individual samples. The indirect optical band gap of 1.3 eV for CoFe2O4 means that it will absorb most of the available solar radiation. The band gaps for CoFe2O4 have been reported to vary significantly depending on the method of synthesis, particle size, cation inversion, defect concentration and the Tauc model used to calculate the fundamental optical transition.
[F(R)hv]n = A(hv − Eg)
Overall, the cubic spinel structure of the precursors is generally retained as the concentration of Co3+ is increased from 0.1 M up to 0.5 M, corresponding to samples Sp1 to Sp5, exhibiting an increasing extent of absorption of visible light, a decrease in their degree of crystallinity and an increase in the extent of their structural disorder. Diffraction patterns for the most highly crystalline samples, namely Sp1 and Sp2, reveal several well-defined features attributed to the spinel structure, whereas for the more amorphous samples, namely Sp3, Sp4 and Sp5, the corresponding diffraction patterns are more featureless, with lower reflectance at longer wavelengths indicating that the samples can absorb the corresponding portion of the visible light. It is noteworthy that the Co3+ concentration influences the process of nucleation of the precursor particles along with the formation of the resulting electronic states, i.e., the extent to which deep traps are created for the electron–hole pairs generated upon absorption of light, with the traps preventing recombination and thus enabling redox activation of a reactant such as oxygen via the Co2+/Co3+ and the Fe2+/Fe2+ ions. On the other hand, the desired amount of structural disorder can increase the extent of charge-carrier separation and could provide the sites for redox activation of oxygen. It has been recently reported that CoFe2O4 could be an effective photocatalyst, the activity being, however, strongly affected by the degree of charge-carrier (electron- and hole-) separation and the samples’ band edge positions rather than by their optical gap.
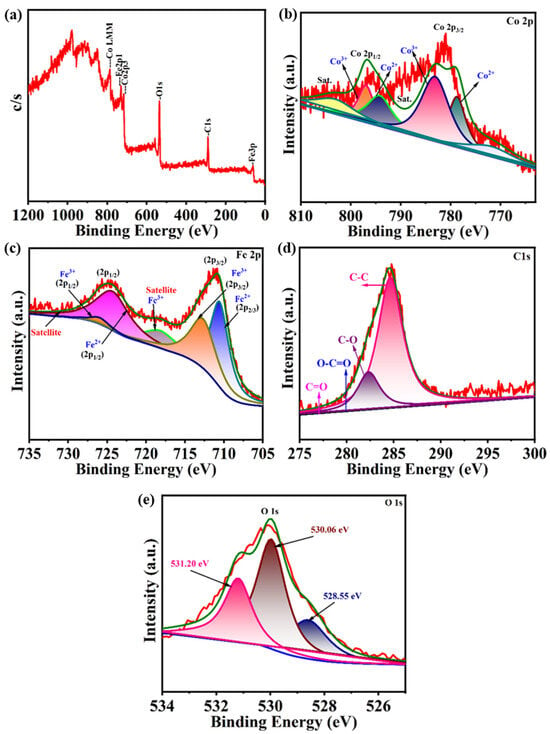
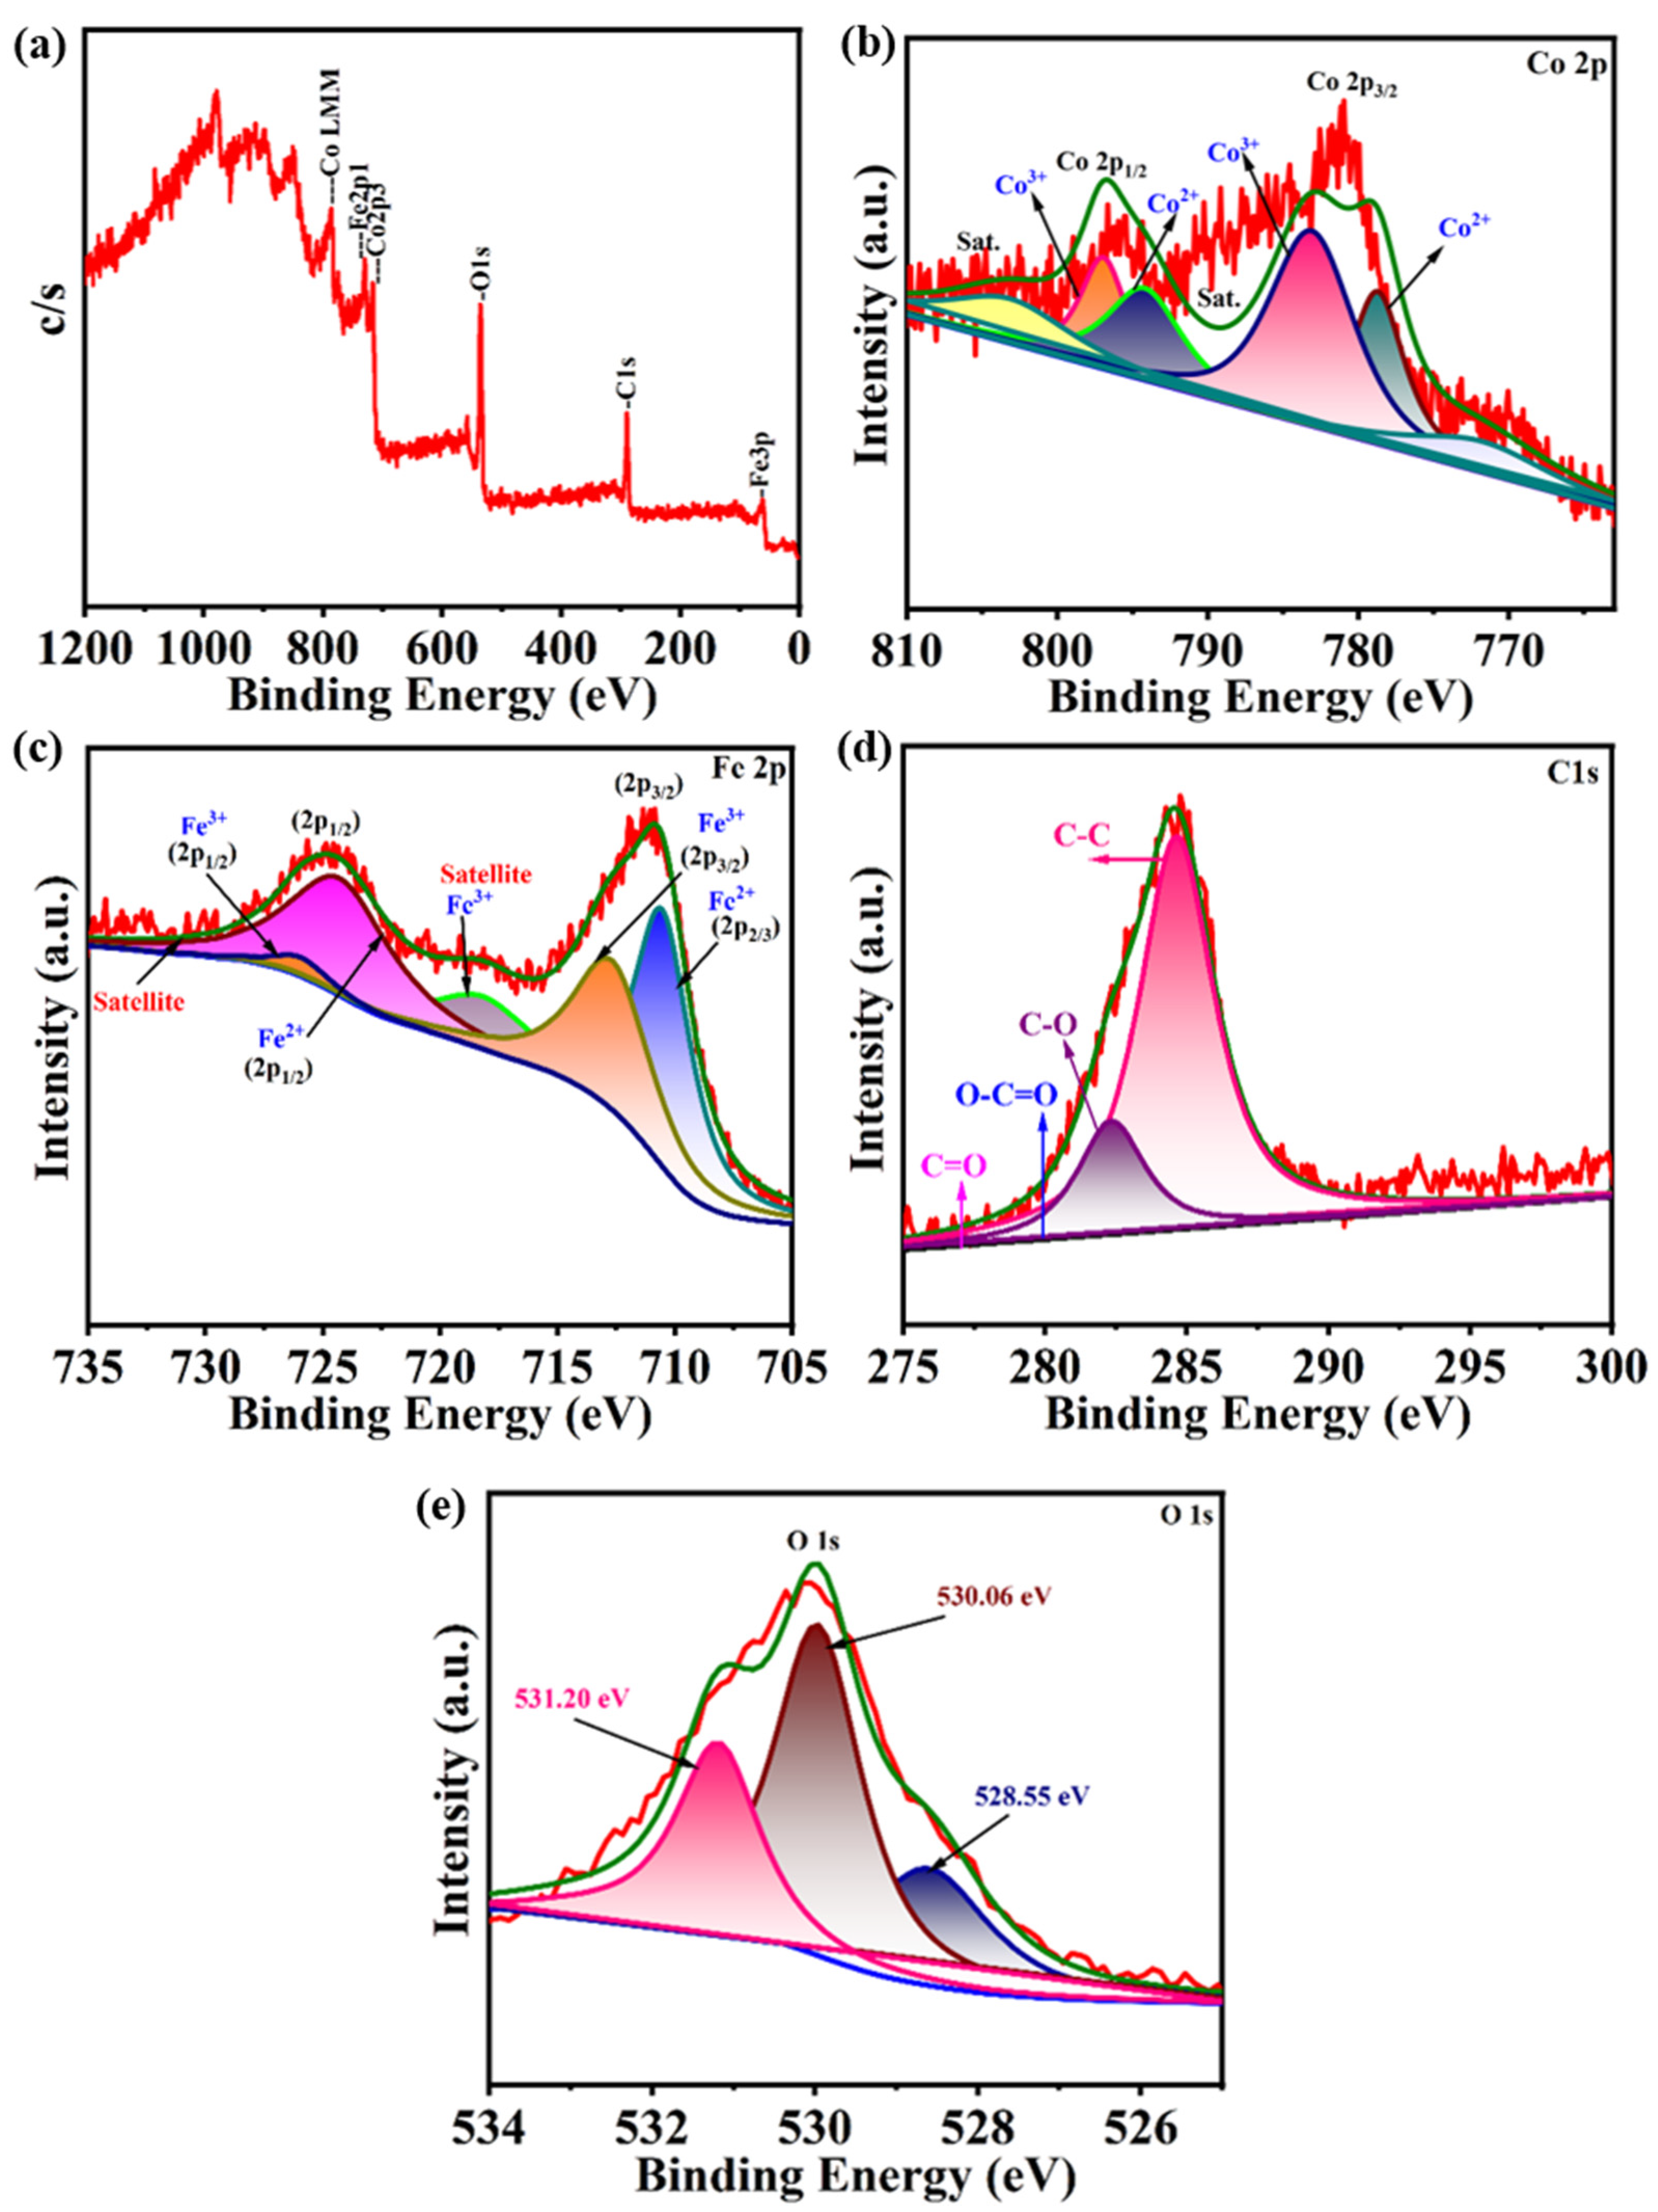
The surface elemental composition and oxidation states of the synthesized CoFe2O4 were investigated by X-ray photoelectron spectroscopy (XPS), as shown in Figure 3a–e. The XPS spectrum of CoFe2O4 is particularly valuable for analyzing the catalytic behavior, electronic structure and interfaces, affected by the oxidation state of Co and Fe, the local environment of O, and the distribution of Co3+ and Fe3+ between tetrahedral and octahedral sites in the spinel-type lattice of the crystal lattice of CoFe2O4 [26,27]. The full survey spectrum contains the characteristic Co 2p, Fe 2p, O 1s and Fe 3p photoelectron signals, together with Co LMM and O KLL Auger features (Figure 3a). A photoelectron signal at 285 eV corresponding to the C 1s photoelectrons is also observed. The carbon is not part of the CoFe2O4 and thus is assumed to be from adventitious hydrocarbons on the surface of the sample as well as any residue from the carbon source (e.g., citrate) used in the synthesis of the ferrite. No other photoelectron lines were observed that could be attributed to other elements within the near-surface region of the sample. The near-surface region of CoFe2O4 consists mainly of Co, Fe and O, and thus the material is stoichiometric.
Figure 3.
X-ray photoelectron spectroscopy (XPS) analysis of CoFe2O4: (a) survey spectrum, high-resolution spectra of (b) Co 2p, (c) Fe 2p, (d) C 1s, and (e) O 1s, confirming the elemental composition and surface chemical states of the catalyst. The red lines represent the experimental spectra, the green lines indicate the overall fitted envelopes, and the colored shaded peaks represent the deconvoluted components corresponding to different chemical states and satellite features. The background curves are shown separately.
The high-resolution Co 2p spectrum (Figure 3b) reveals the characteristic Co 2p3/2 and Co 2p1/2 components together with their associated satellite features. The Co 2p lines are of spin–orbit split form with a main peak at the binding energies corresponding to the Co 2p3/2 and Co 2p3/2 transitions (779–783 eV and 794–798 eV, respectively) and with a broad intermediate region with various satellite signals (Figure 3b). The lines could be fitted using a multiple-split form of Co2+ in a spinel environment (shake-up satellites and a large signal of the corresponding spin–orbit partners) and a contribution of Co3+ species (with lower intensity of corresponding shake-up satellites, i.e., of lower energy). Comparable data on CoFe2O4 samples reported Co 2p3/2 and Co 2p1/2 transitions at 780–781 eV and 796–797 eV, respectively, with corresponding satellites at 786–788 eV and 802–805 eV [28]. The large satellite intensities of high-spin Co2+ are caused by the multiplet splitting within the 3d-shell of the Co2+ cations, the incomplete screening of the final state in photoionization processes and the strong charge transfer to the metal center from the neighboring ligands. It was investigated that CoFe2O4 nanoparticles are composed of high-spin Co2+ cations in an inverse-spinel structure (Fe3+)Td[Co2+Fe3+]OhO4. Here, (Fe3+)Td denotes tetrahedral sites and [Co2+Fe3+]Oh denotes octahedral sites. The Co3+ component of the Co 2p spectrum of the surface of the nanocrystals indicates that a part of the Co2+ has been oxidized and/or that the ideal stoichiometry of the material is locally deviated from by cation vacancies and/or oxygen non-stoichiometry. The mixed Co2+/Co3+ states at the surface of the nanocrystals are of great advantage for redox activity. Thus, interfacial electron transfer as well as the activation of oxidants and adsorbed oxygen species are strongly enhanced. Furthermore, the high-resolution Fe 2p spectrum (Figure 3c) confirms the predominance of Fe3+ together with a smaller Fe2+ contribution. The Fe 2p peak was deconvoluted into two large spin–orbit split peaks (Fe2+ and Fe3+). The main 2p peaks for Fe3+ were found at binding energies of 711.1 eV and 724.2 eV for 2p3/2 and 2p1/2, respectively. The corresponding peaks for Fe2+ were found at lower binding energies around 709.5–710.5 eV (2p3/2) and 722–723 eV (2p1/2). Characteristic shake-up satellites for iron were observed at 718–720 eV (2p3/2) on the low-binding-energy side of the 2p3/2 peak and on the high-binding-energy side of the 2p1/2 peak. A predominant signal of Fe3+ corresponds to the Fe2+ counterpart of about 10% within the surface regions of the samples and is in line with the nominal composition of CoFe2O4 [27]. However, also within surface regions, there are areas of reduced Fe3+, probably caused by existing oxygen defects. The redox reactions between Co2+ and Fe3+ are well-known, and the following equilibrium reaction is representative: Co2+ + Fe3+ ⇌ Co3+ + Fe2+. This reaction can locally be in equilibrium without any deviation from the nominal composition of CoFe2O4. The internal redox equilibrium between Co2+ and Fe3+ of the CoFe2O4 surface allows for local charge compensation by formation of a surface vacancy or by transfer of an electron to a neighboring Co3+ or Fe3+, respectively. The presence of both Co2+ and Co3+ as well as of Fe2+ and Fe3+ on the surface of CoFe2O4, therefore, is in line with a chemically highly dynamic surface with redox-active sites.
The C 1s spectrum (Figure 3d) is dominated by the adventitious carbon contribution near 285 eV. The photoelectron peaks in the C 1s spectra of CoFe2O4 samples correspond to C–C/C=C bonds of adventitious carbon and may be in C–O, C=O and O–C=O type functionalities that are unreacted citrate and/or other organic precursors used in the synthesis, as shown in Figure 3d. Binding energies for these types of carbon environments are C–C/C=C 284.8 eV, C–O 286.0–286.5 eV, C=O 287.5–288.0 eV and O–C=O 288.5–289.2 eV [29]. All the additional components on the lower-binding-energy side of the main C–C/C==C peak at 284.8 eV for adventitious carbon (and possibly remnant carbon from the citrate used for the synthesis of the samples) are assigned to C–O, C=O and O–C–O. However, with increasing amounts of oxygen in C-containing species, the binding energy is expected to increase; i.e., all these species have a binding energy greater than that for C–C/C==C. Moreover, the O1s photoelectron peak of CoFe2O4 was deconvoluted into three peaks at binding energies of 528.55 eV, 530.06 eV and 531.20 eV, as shown in Figure 3e. The most intense peak is at 530.06 eV, attributed to the lattice O2− ions of Co and Fe in the spinel framework of CoFe2O4. For cobalt ferrite, the binding energy for lattice oxygen in CoFe2O4 typically falls in the range of 529.5 eV to 530.1 eV [28,30], in good agreement with our results. The second peak is at a higher binding energy of 531.20 eV. It can be assigned to the low coordination number of O atoms, O-related defects, surface hydroxyl groups and/or chemisorbed oxygen species, which are present on the surface of the sample. In a previous report, for another CoFe2O4 sample, the lattice oxygen peak position was at 529.6 eV, while the surface/defect-related oxygen peaks were at 531.3 eV [29,31]. For strongly hydroxylated surfaces, or for molecularly adsorbed water, their O 1s photoelectron peaks are at binding energies greater than 532 eV [30]. The peaks at higher binding energies (above 532 eV) would be assigned to hydroxyl groups or even to molecularly adsorbed water. The large signal for non-lattice oxygen on the surface of the CoFe2O4 particles is a significant finding. The surface hydroxide groups on the particles could facilitate phenol adsorption by forming hydrogen bonds with hydroxyl groups of phenol. In addition, the surface hydroxide groups, oxygen vacancies, and the coordinatively unsaturated metal ions on the surface of the particles are expected to activate O2 to form reactive oxygen species upon trapping electrons. The number of defects on the surface of the particles is expected to be beneficial for photocatalysis at moderate levels, to trap the charge and activate surface species. However, at high levels of defects, they can act as deep recombination centers and decrease the photocatalytic activity. Overall, the surface of CoFe2O4 samples consists of mixed Co2+/Co3+ and Fe2+/Fe3+ redox sites, lattice oxygen, surface-bound hydroxyl groups, and defect-related oxygen species. The mixed-metal sites on the surface are highly active for interfacial electron transfer, thus allowing activation and subsequent reuse of these sites for the photocatalytic degradation of phenol in solution.
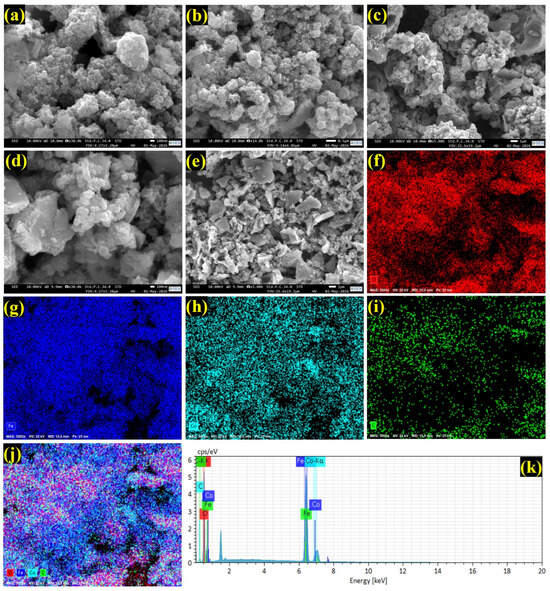
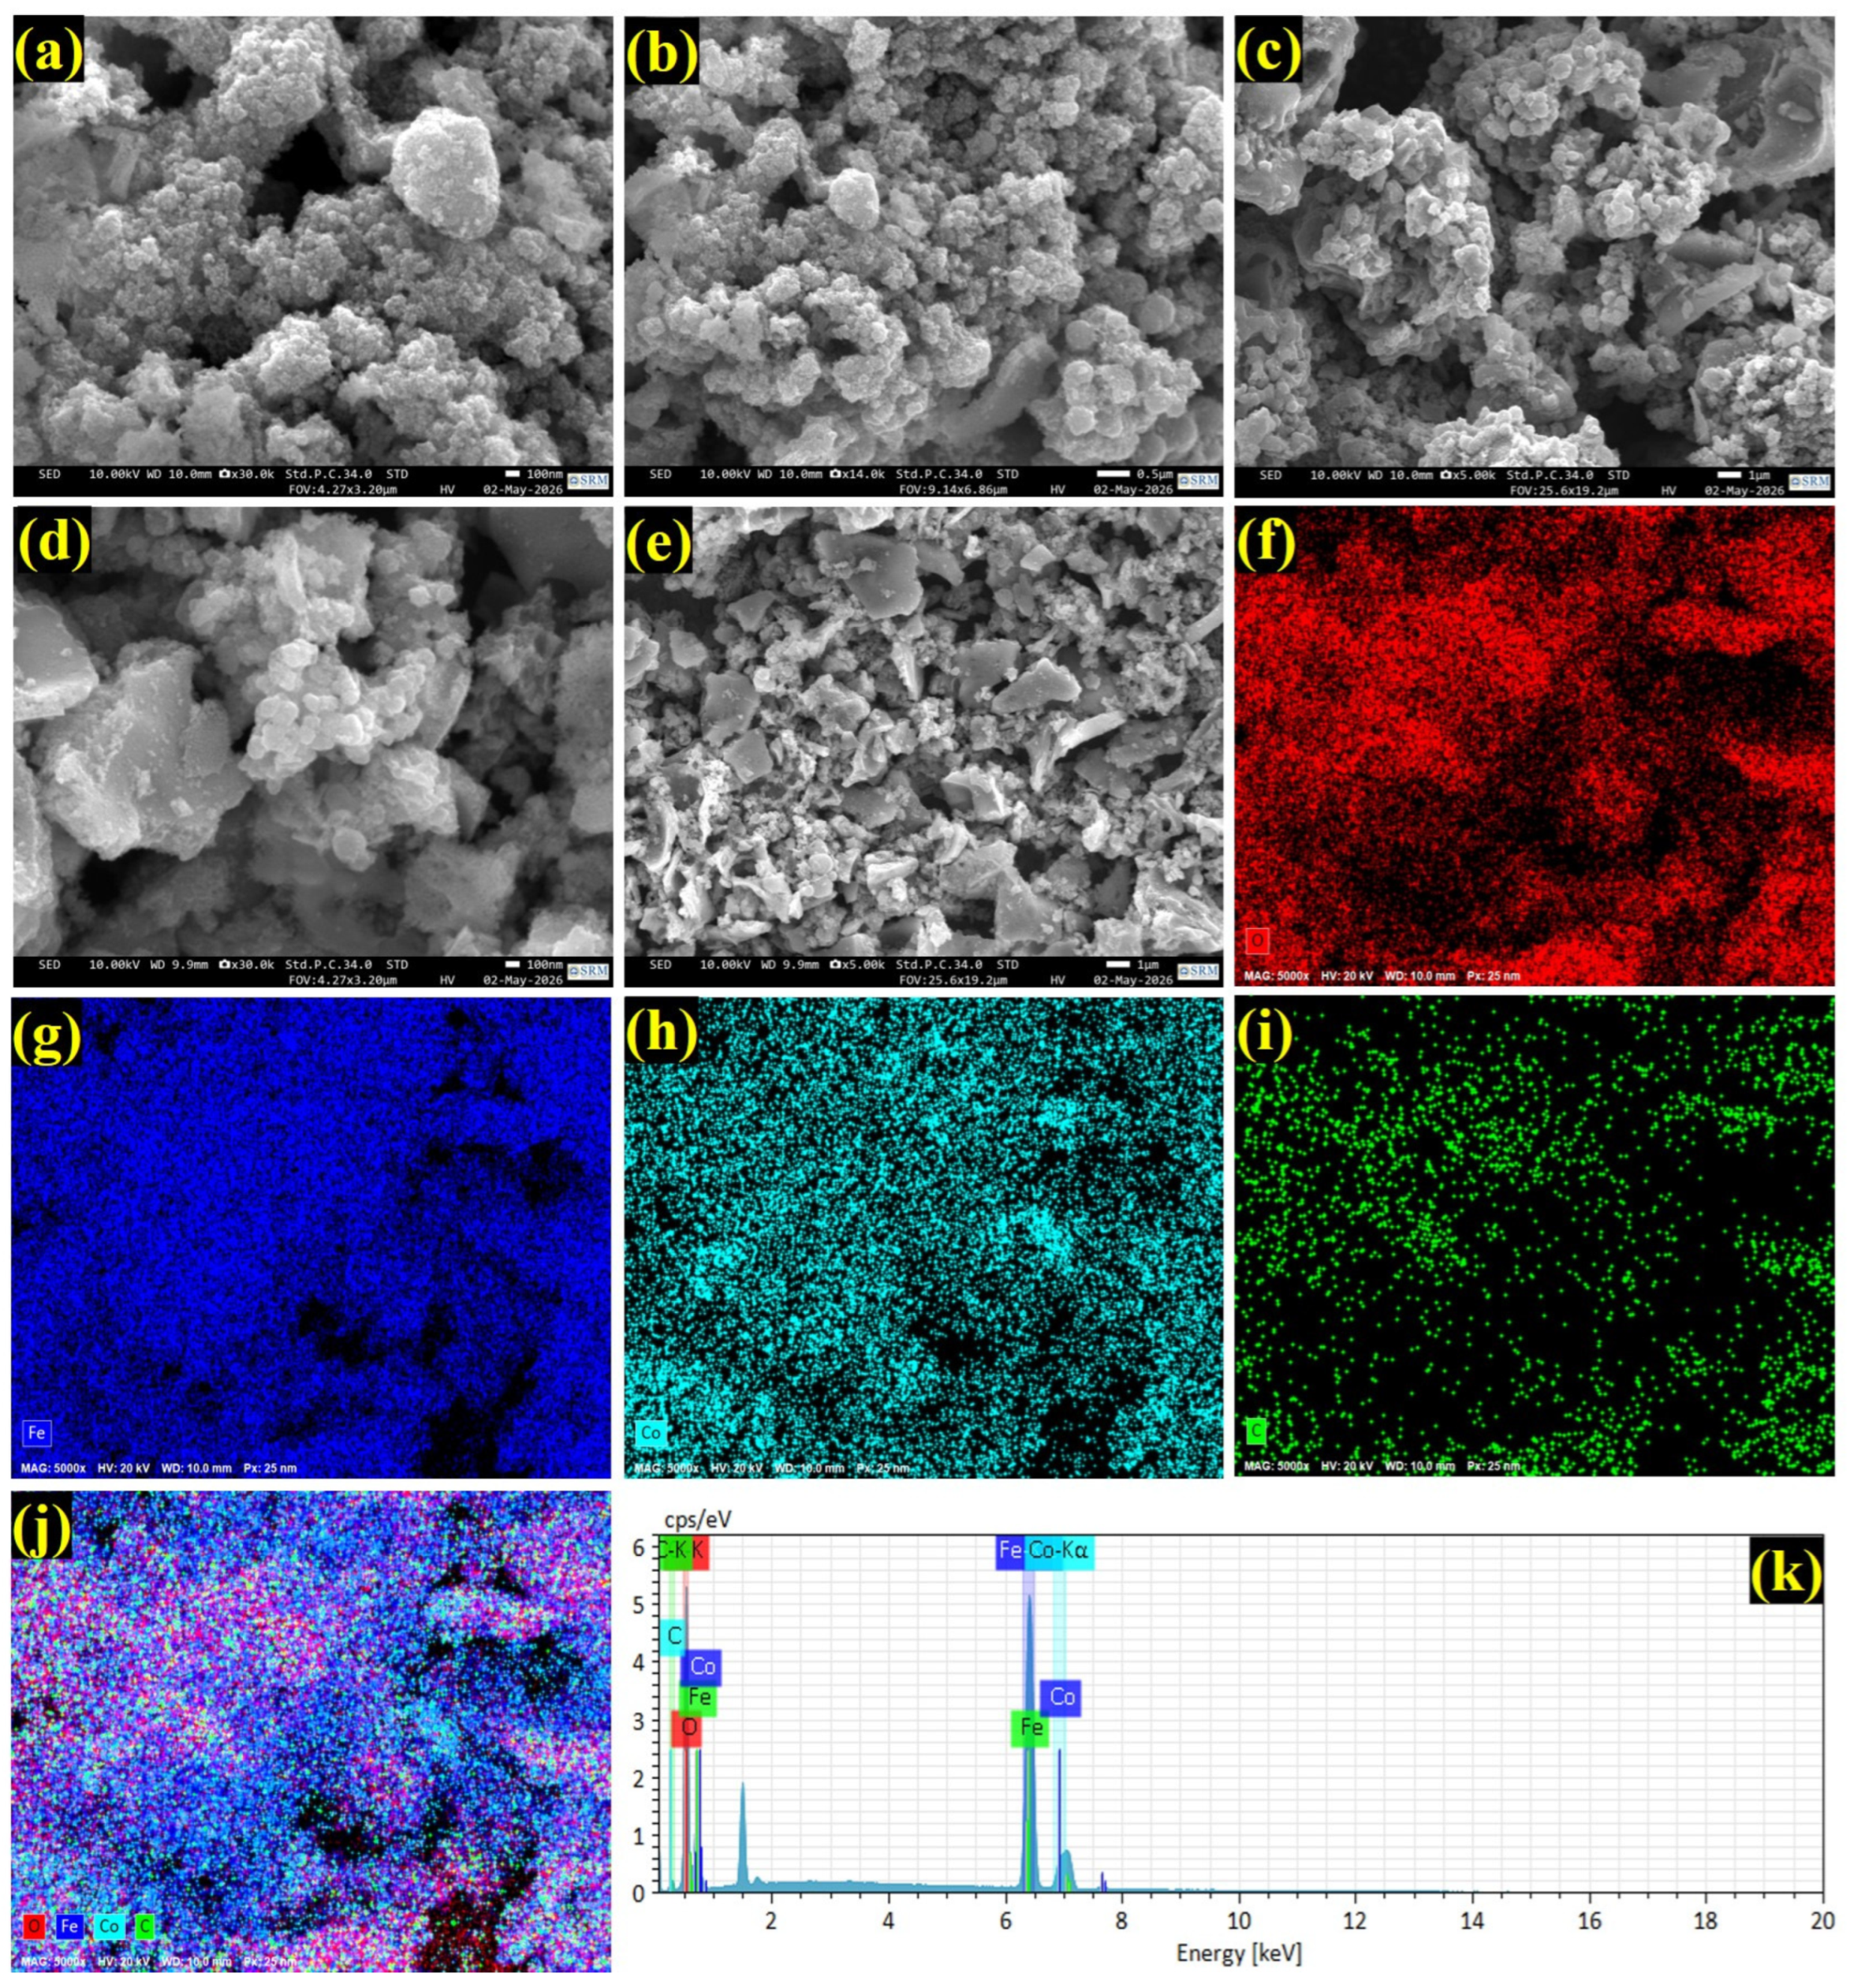
Figure 4a–e present field-emission scanning electron microscopy (FESEM) at different magnifications for the as-synthesized CoFe2O4. The as-produced ferrites resulted in heterogeneous granules, consisting of irregular or quasi-spherical particles with different sizes, agglomerated to form large-sized clusters. Aggregates have a rough surface, and interstitial spaces between individual particles and the aggregates form voids of irregular sizes, contributing to the porous structure of the material. During drying and calcination, the primary particles interact via magnetic dipole–dipole and van der Waals forces, resulting in the coalescence of particles into compact secondary aggregates, or in the formation of necks between individual particles, thereby increasing the surface area of the material. The corresponding energy-dispersive X-ray (EDX) mapping and complete spectrum demonstrated the presence of Co, Fe, and O in the as-prepared ferrites (Figure 4f–k). Similarly, spherical/irregular shapes were reported for CoFe2O4 nanoparticles with a mean diameter of the individual primary particles of 10–25 nm, which then merged into larger-sized aggregates [31,32]. As-prepared samples possess a highly porous morphology, which can be both advantageous and disadvantageous. On the one hand, the morphology can facilitate the adsorption of pollutants and penetration of water into the material surface, thus enabling exposure of active centers, i.e., surface cobalt and iron cations, as well as the traps at grain boundaries of the individual particles for the charge carriers generated upon irradiation, which can prevent their fast recombination. On the other hand, the pores and interstitial voids between individual aggregates and secondary aggregates can act as a barrier for the diffusion of charge carriers to the surface of the material, thus hampering the photocatalytic reaction.
Figure 4.
Morphological and compositional characterization of CoFe2O4: (a–e) FESEM images at different magnifications, (f–i) elemental mapping of O, Fe, Co and C, (j) overlay elemental mapping, and (k) EDX spectrum, confirming the homogeneous elemental distribution and composition of the synthesized CoFe2O4.
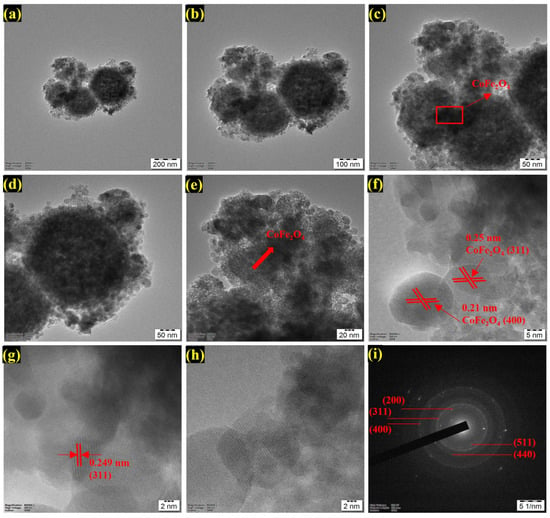
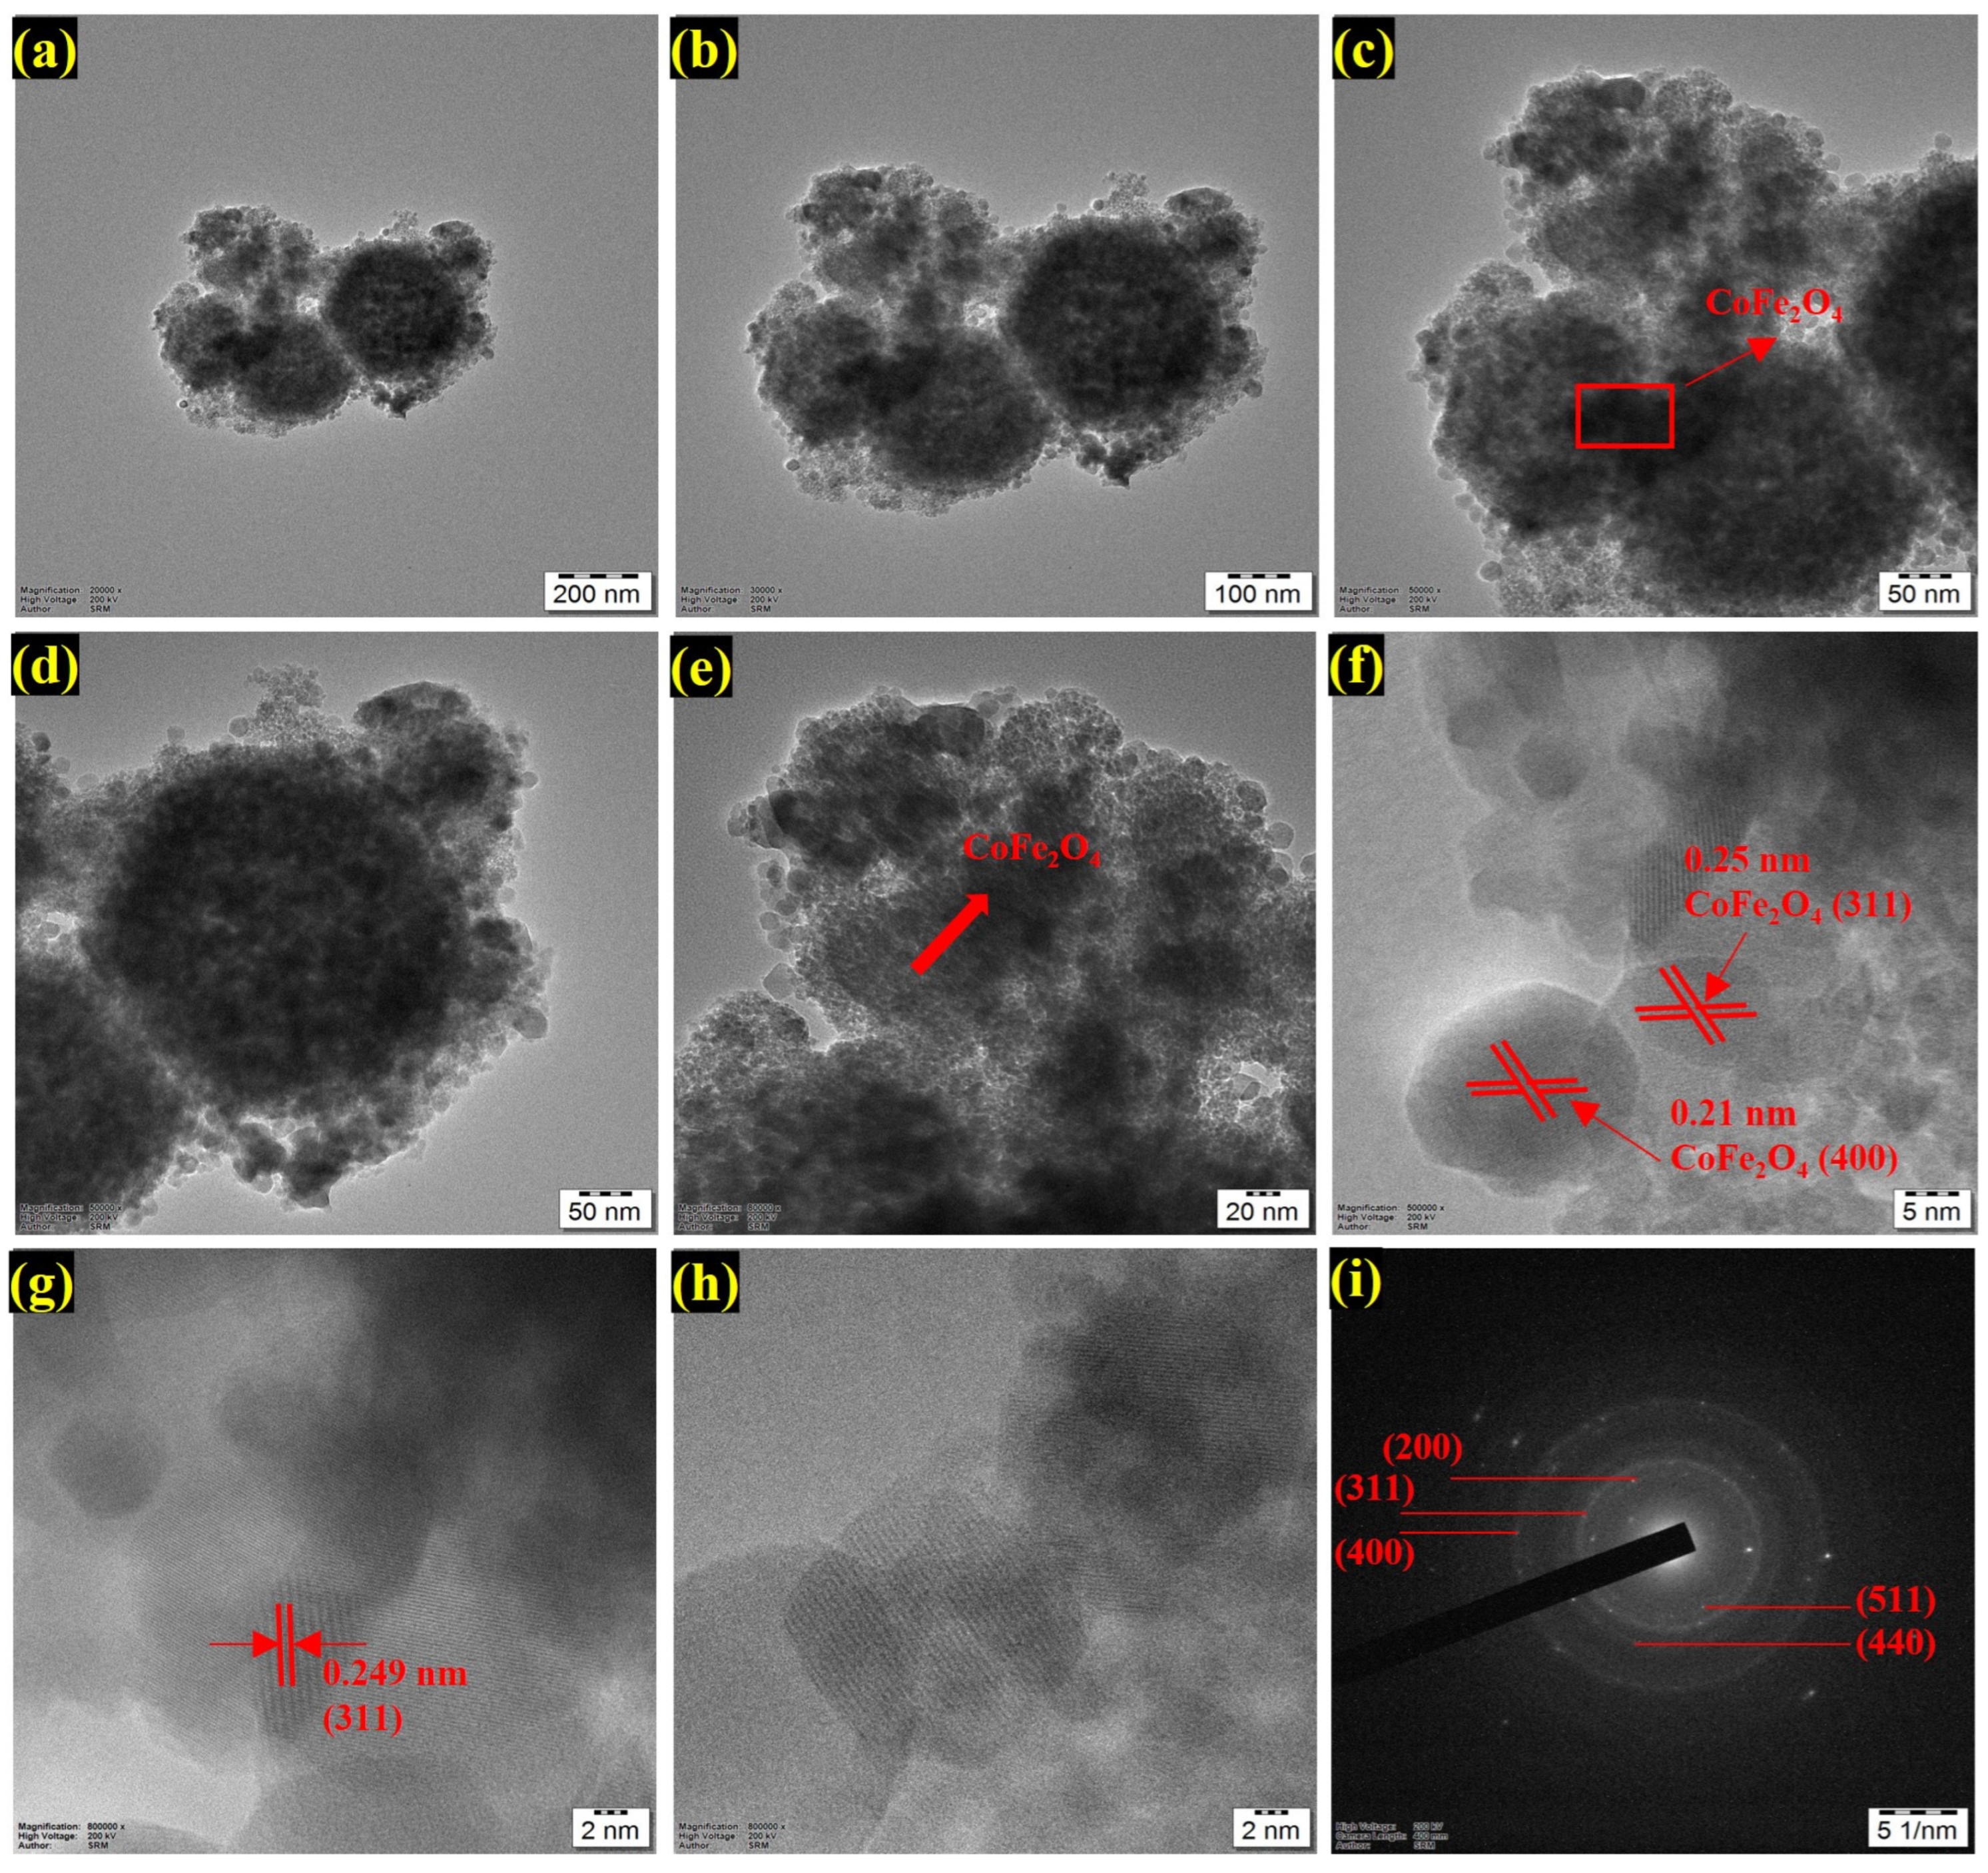
To confirm the morphology of CoFe2O4 nanoparticles, the morphology of the sample was investigated by transmission electron microscopy (TEM), as shown in Figure 5. The low-magnification images of the sample are shown in Figure 5a–c. It is obvious that the primary particles are aggregated to form rather large secondary aggregates of nanoparticles. The sizes of the secondary aggregates of nanoparticles are in the range of several hundred nanometers to a few micrometers, whereas the sizes of the individual nanoparticles are in the range of a few nanometers to tens of nanometers. Most individual nanoparticles have a nearly spherical shape but with some irregular facets and are in close contact with their neighboring nanoparticles. Such secondary aggregates of nanoparticles consisting of nanoscale primary particles are typically formed by the drying process of precursor gels and subsequent coalescence of nanoparticles due to their high surface energies, magnetic dipole interactions, Van der Waals interactions, etc. [33]. The secondary agglomerates of nanoparticles consisting of very densely packed CoFe2O4 nanocrystallites are highlighted by red circles in Figure 5a,b,d. Higher-magnification images of the secondary aggregates are shown in Figure 5c–e. The larger secondary aggregates of the nanoparticles consist of very densely packed individual nanoparticles, and the surfaces of the individual nanoparticles are rounded or partially faceted. The larger nanoparticles are also visible, comprising several primary nanoparticles as shown in Figure 5e. Such secondary aggregates of nanoparticles consisting of primary nanoscale particles are typically observed using field-emission scanning electron microscopy (FESEM), consist of finer granular domains on the surface of the clusters. The size of a single nanoparticle as observed using TEM could correspond to a single CoFe2O4 crystallite, but it could also correspond to several coherently diffracting domains of CoFe2O4. The reported sizes of CoFe2O4 primary nanoparticles are typically in the range of approximately 13 nm to 25 nm, strongly depending on the synthesis method, Co substitution, as well as on the conditions of thermal treatment during drying and calcination [34,35,36]. The lattice fringes of individual nanoparticles were clearly resolved in the high-resolution TEM images. The interplanar spacings of the lattice fringes were approximately 0.25 nm and 0.21 nm, corresponding to the (311) and (400) planes of the cubic spinel CoFe2O4, respectively (Figure 5f). The measured interplanar spacings were in good agreement with the reported values of 0.25–0.26 nm for the (311) plane and 0.21 nm for the (400) plane of cobalt ferrite [37]. The (311) plane is one of the most intense reflections for spinel CoFe2O4 in XRD patterns, and the corresponding lattice fringes are frequently observed in HRTEM images, corresponding to individual crystallites of CoFe2O4 with different crystallographic orientations. In contact with each other, the nanocrystals of CoFe2O4 favor charge transfer over the grain boundaries of individual particles. However, structural defects or trap states at the interfaces between two neighboring particles are expected to form. Figure 5g represents the region of a CoFe2O4 nanocrystal with a lattice spacing of 0.249 nm. This corresponds to (311) planes of cubic spinel CoFe2O4. This value is in good agreement with that (0.249–0.250 nm) measured for some fringes in Figure 5f and with the reported value of 0.253 nm for (311) planes of cubic CoFe2O4 nanoparticles [38,39]. High-resolution images of several individual particles show clear lattice fringes and high local order (Figure 5g,h). The lattice fringes at the interfaces between the individual particles are pointing in different directions, clearly indicating that the interfaces are between individual crystallites. These have probably grown and nucleated independently, for example during gel combustion, drying or calcination. All surfaces of the crystallites have been completely transformed into oxides, and all remaining organic material has been removed from the surface.
Figure 5.
Representative TEM and HRTEM characterization of CoFe2O4 nanoparticles. (a–e) TEM images at progressively higher magnifications showing agglomerated CoFe2O4 nanocrystallites; the red dashed circles and boxes indicate selected regions examined at higher magnification, while the arrows highlight CoFe2O4 domains. (f–h) HRTEM images displaying well-resolved lattice fringes with interplanar spacings of approximately 0.25 and 0.249 nm, corresponding to the (311) plane, and 0.21 nm, assigned to the (400) plane of spinel CoFe2O4. (i) Selected area electron diffraction pattern showing diffraction rings indexed to the (200), (311), (400), (511), and (440) crystallographic planes, confirming the polycrystalline spinel structure of CoFe2O4.
For measurement of the lattice fringes, the interplanar spacing d of crystal planes with Miller indices h, k, l can be used to calculate the lattice parameter a of a crystal. For the (311) planes of measurement (Figure 5f,g), a value of approximately 0.249 nm for d(311) gave a value for the lattice parameter of approximately 0.826 nm (this value has a small degree of scatter between individual measurements). For the (400) planes, a value of d(400) = 0.210 nm gave a value for a of 0.840 nm. This value for a is close to the reported value for bulk CoFe2O4 of approximately 0.838 nm for the cubic spinel structure of the Fd3m space group. The SAED pattern from a selected area of the CoFe2O4 sample (Figure 5i) is characterized by several concentric diffraction rings, made up of several bright spots. This type of diffraction pattern is typical for a polycrystalline sample of well-crystallized nanoparticles with different crystallographic orientations. The diffraction rings have been indexed in the figure to the planes of a spinel-type crystal structure, i.e., (311), (400), (511) and (440). The diffraction rings correspond to the principal planes of the spinel lattice, namely, 311, 400, 511, and 440. The selected area electron diffraction pattern for the electron microdiffraction is similar to that reported for CoFe2O4, and consists of many concentric rings that correspond to the cubic spinel structure of the Fd3̅m space group, with the principal diffraction lines having the following sequence: (220), (311), (400), (422), (511), and (440) planes. The most intense line corresponds to the 311 planes [40].
Overall, the as-synthesized CoFe2O4 is a polycrystalline material made up of nano-sized crystals of high local order. The primary building blocks of secondary aggregates of CoFe2O4 are 2D to 3D nanoscaled porous structures, which potentially aid in charge transport in a material; however, it is also known that the interface between different nanoparticles can form sites of trap states or surface sites which are involved in the charge separation as well as in the activation and adsorption of oxygen. Excessive secondary aggregation of such nanoscaled primary crystals could decrease the surface area of the catalyst, which in turn could reduce the sites available for the reaction, and may also result in the recombination of the charge that is formed upon the absorption of light by the catalyst before its transfer to the interface between the catalyst and solution.
3.2. Photodegradation of Phenol
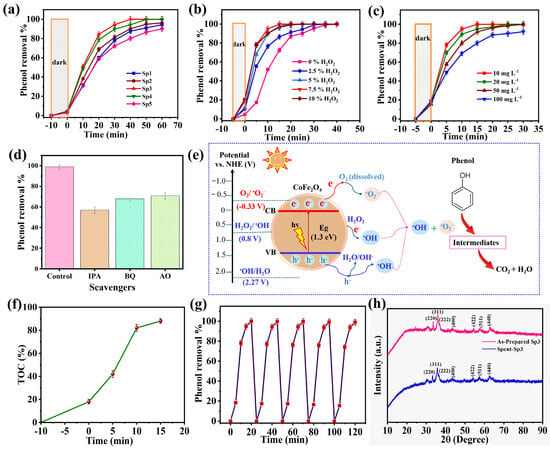
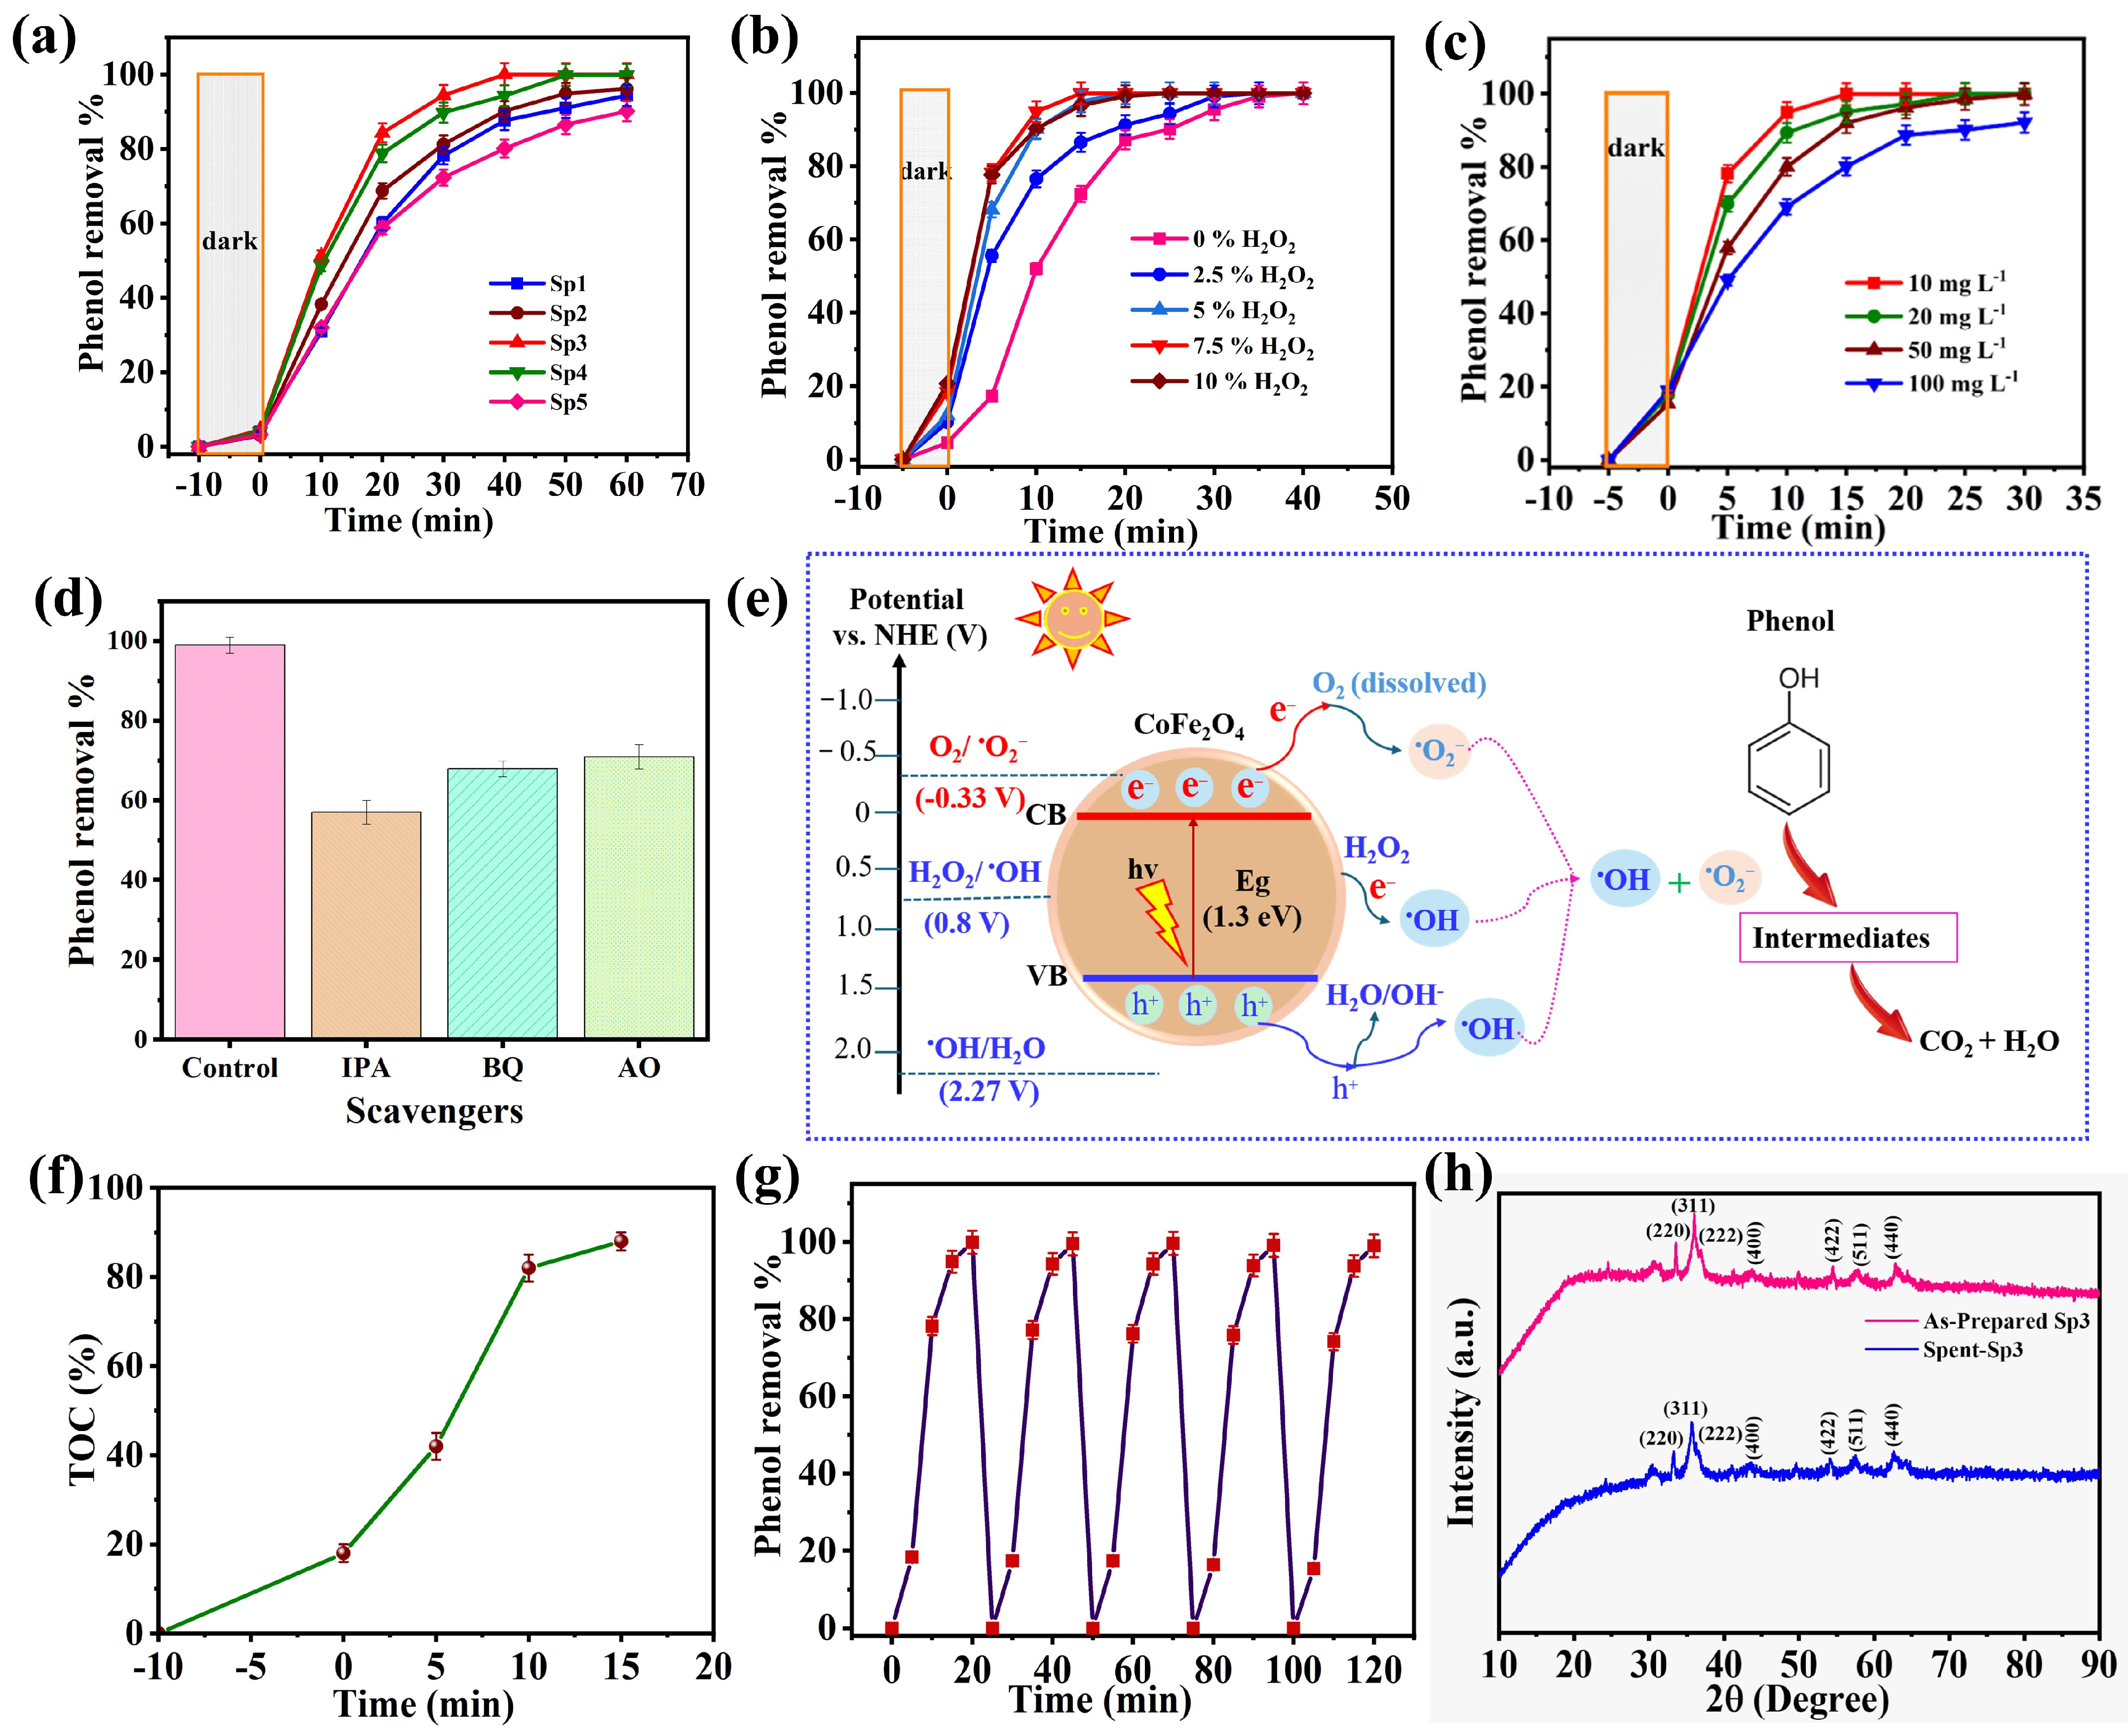
Prior to irradiation, 10 mg of each photocatalyst was dispersed in 100 mL of a 10 mg L−1 phenol solution and magnetically stirred in the dark for 10 min to establish adsorption–desorption equilibrium. Subsequently, the light source was switched on to initiate the photocatalytic reaction [41,42]. As shown in Figure 6a, all samples demonstrated a slight adsorption of phenol (<5%) during the dark adsorption period, representing that adsorption contributed minimally to the overall phenol oxidation and removal process. Upon UV–VIS irradiation, the degradation efficiency increased sharply from 0 to 20 min for all catalysts, then saturated at 60 min, confirming that the degradation was primarily governed by photocatalytic reactions. Among the photocatalysts, Sp3, prepared using a 0.3 M Co2+ precursor concentration, demonstrated the highest photocatalytic activity, achieving 100% phenol degradation within 40 min. In comparison, Sp4 reached 100% phenol degradation after approximately 50 min, whereas Sp1, Sp2, and Sp5 exhibited degradation efficiencies of approximately 94%, 95%, and 91%, respectively, after 60 min of irradiation. The remarkable photocatalytic performance of Sp3 can be attributed to the optimized Co2+ precursor concentration, which effectively regulates the nucleation and crystal growth of the CoFe2O4 nanocatalyst, important for enhanced crystallinity, homogeneous particle size distribution, and a higher density of catalytically active surface sites. Furthermore, the optimized cobalt concentration promotes the formation of an efficient Co2+/Co3+ and Fe2+/Fe3+ mixed-valence redox system, which facilitates rapid electron transport between metal cations and suppresses the recombination of photogenerated electron–hole pairs [43]. The prolonged lifetime of charge carriers significantly enhances the production of reactive oxygen species (ROS), particularly superoxide radicals (•O2−) and hydroxyl radicals (•OH), which actively oxidize phenol molecules. In addition, the optimized surface properties of Sp3 improve the adsorption of phenol molecules and dissolved oxygen, thereby accelerating interfacial photocatalytic reactions. On the other hand, catalysts synthesized with lower cobalt precursor concentrations (Sp1 and Sp2) likely contained fewer catalytically active Co sites and lower crystallinity, resulting in reduced charge separation efficiency, which leads to lower phenol degradation efficiency [44]. Meanwhile, excessive cobalt precursor concentration (Sp5) may have decreased the effective surface area, induced particle agglomeration, and introduced defect-induced recombination centers that accelerated electron–hole recombination, thereby reducing photocatalytic efficiency. These results clearly demonstrate that a 0.3 M Co2+ precursor concentration provides the optimum balance between structural properties and electronic characteristics, leading to superior photocatalytic performance.
Figure 6.
Photocatalytic performance, reaction mechanism, mineralization, and stability of the optimized CoFe2O4 photocatalyst under UV–Vis irradiation using a 350 W xenon (Xe) lamp: (a) phenol degradation over Sp1–Sp5; (b) effect of H2O2 concentration (0–10%); (c) effect of initial phenol concentration (10–100 mg L−1); (d) reactive-species trapping experiments using isopropyl alcohol (IPA), p-benzoquinone (BQ), and ammonium oxalate (AO) as scavengers for •OH, •O2−, and h+, respectively; (e) proposed photocatalytic phenol degradation mechanism over CoFe2O4; (f) total organic carbon (TOC) removal as a function of reaction time; (g) recyclability of the optimized Sp3 photocatalyst over consecutive degradation cycles; and (h) XRD patterns of as-prepared and spent Sp3 photocatalysts demonstrating retention of the CoFe2O4 spinel phase after photocatalytic cycling.
The influence of H2O2 concentration on photocatalytic degradation was further investigated using the optimized Sp3 photocatalyst, as shown in Figure 6b. In the absence of H2O2, phenol degradation proceeded relatively slowly, requiring approximately 40 min for complete removal. Upon UV–Vis irradiation, CoFe2O4 generates conduction-band electrons (e−) and valence-band holes (h+). The addition of H2O2 markedly accelerated phenol degradation because H2O2 can act as an efficient electron acceptor, thereby competing with electron–hole recombination and simultaneously promoting the formation of highly reactive hydroxyl radicals (•OH). The photogenerated electrons can reduce H2O2 according to Equation (4), providing an additional pathway for •OH generation.
H2O2 + e− → •OH + OH−
These highly oxidative •OH species subsequently attack the aromatic ring of phenol, promoting hydroxylation, ring opening, and further oxidation of the resulting intermediates. Increasing the H2O2 concentration from 2.5% to 7.5% progressively enhanced the degradation rate because of the increased availability of H2O2 for electron capture and ROS generation. Consequently, 7.5% H2O2 exhibited the optimum performance, achieving nearly complete phenol degradation within 15–20 min. However, increasing the H2O2 concentration further to 10% produced no appreciable enhancement. At excessive concentrations, H2O2 can compete with phenol for •OH and act as a hydroxyl-radical scavenger as shown in Equation (5).
Because HO2• is less reactive toward phenol than •OH, excessive H2O2 decreases the effective availability of strongly oxidizing •OH species for pollutant degradation. Therefore, the optimum performance at 7.5% H2O2 results from a favorable balance between enhanced electron capture/ROS generation and suppression of radical-scavenging effects at higher H2O2 concentrations. The effect of the initial phenol concentration on photocatalytic degradation was systematically investigated using phenol concentrations of 10, 20, 50, and 100 mg L−1, as shown in Figure 6c. A progressive decrease in the degradation rate was observed with increasing initial phenol concentration. Under the optimized conditions of 10 mg Sp3 catalyst and 7.5% H2O2 under UV–Vis irradiation, complete degradation of 10 mg L−1 phenol was achieved within 15 min, whereas higher initial concentrations required longer irradiation times to reach comparable degradation efficiencies. Nevertheless, even at 100 mg L−1 phenol, approximately 90% degradation was achieved after 30 min. The slower degradation at higher phenol concentrations can be attributed to several concurrent effects. First, increasing the number of phenol molecules and their oxidation intermediates enhances competition for the finite adsorption and reactive sites on the CoFe2O4 surface. Second, at higher pollutant concentrations, increased absorption and attenuation of the incident radiation within the solution can reduce photon penetration and consequently decrease the effective photoexcitation of the catalyst. Under irradiation, photogenerated electrons and holes participate in surface redox reactions, while H2O2 acts as an additional electron acceptor and promotes the formation of highly reactive hydroxyl radicals (•OH). At a fixed catalyst loading and H2O2 concentration, however, the generation rate of these reactive oxygen species does not increase proportionally with the phenol concentration. Consequently, the effective ROS-to-phenol ratio decreases as the pollutant concentration increases, reducing the probability of oxidative attack per phenol molecule and resulting in slower overall degradation kinetics [45].
The photocatalytic degradation kinetics were evaluated using a pseudo-first-order model as displayed in Figure S1. The k values for Sp1–Sp5 were 0.044, 0.051, 0.162, 0.097, and 0.035 min−1, respectively, confirming the highest kinetic activity of Sp3. With increasing H2O2 concentration from 0 to 2.5, 5, 7.5, and 10%, the corresponding k values were 0.138, 0.162, 0.188, 0.179, and 0.183 min−1, respectively, demonstrating a substantial kinetic enhancement upon H2O2 addition, while further increases produced no proportional improvement. In contrast, increasing the initial phenol concentration from 10 to 100 mg L−1 decreased k from 0.242 to 0.079 min−1, indicating slower degradation at higher pollutant loading. Overall, the kinetic analysis confirms the superior activity of Sp3 and demonstrates the significant influence of H2O2 and initial phenol concentration on the degradation rate.
3.3. Photocatalytic Degradation Mechanism
The photocatalytic degradation mechanism of phenol over the optimized Sp3 CoFe2O4 was further studied through reactive-species scavenging as shown in Figure 6d. In the absence of scavengers, approximately 99% phenol degradation was achieved within 15 min using 7.5% H2O2. Upon addition of isopropyl alcohol (IPA), p-benzoquinone (BQ), and ammonium oxalate (AO), the degradation efficiencies decreased to 57%, 68%, and 71%, respectively. IPA, employed as a •OH scavenger, produced the strongest inhibition, demonstrating that hydroxyl radicals (•OH) are the predominant reactive species responsible for phenol oxidation. The inhibition observed with BQ and AO further confirms the participation of superoxide radicals (•O2−) and photogenerated holes (h+), respectively. Based on the degree of inhibition, the relative importance of the reactive species follows the order •OH > •O2− > h+. The detailed phetodegradation mechanim is illustrated in Figure 6e. Upon UV–Visible light irradiation, the CoFe2O4 photocatalyst generates electron–hole pairs (e−/h+). The photogenerated electrons can reduce surface-adsorbed O2 to •O2− (O2 + e− → •O2−), while h+ participates in oxidative surface reactions. XPS analysis confirmed the mixed Co2+/Co3+ and Fe2+/Fe3+ redox states, together with defect-associated oxygen species and surface hydroxyl environments, which can enable interfacial charge transfer and activation of adsorbed oxygen-containing species. In the presence of H2O2, electron transfer to H2O2 provides an additional pathway for •OH generation (H2O2 + e− → •OH + OH−), consistent with the experimentally observed acceleration of phenol degradation after •OH addition.
Furthermore, the total organic carbon (TOC) analysis was performed to evaluate the removal and subsequent mineralization of phenol during the photocatalytic process as shown in Figure 6f. Prior to UV–Visible light irradiation, the Sp3–phenol suspension with 7.5% H2O2 was stirred in the dark for 10 min to establish adsorption–desorption equilibrium. The end of this dark equilibration period was designated as 0 min, at which approximately 18% TOC removal was observed, which can primarily be attributed to adsorption of phenol and/or organic species onto the photocatalyst surface and H2O2 is slightly involved in the degradation process. After switching on the 350 W xenon (Xe) lamp under UV–Vis irradiation, TOC removal increased rapidly to 42% at 5 min, 82% at 10 min, and 88% at 15 min. Thus, irradiation produced an additional 70 percentage-point decrease in TOC relative to the initial solution, demonstrating substantial oxidation and mineralization of the organic species. The rapid TOC decrease between 5 and 10 min is consistent with efficient ROS-mediated oxidation, while the residual TOC of approximately 12% after 15 min indicates that a small fraction of phenol-derived organic intermediates remained incompletely mineralized. Together with the scavenger experiments, these results support a photocatalytic pathway dominated by •OH-mediated oxidation, with additional contributions from •O2− and h+, leading to progressive degradation and mineralization of phenol over the Sp3 CoFe2O4 photocatalyst. The practical applicability of the optimized Sp3 photocatalyst was assessed through five consecutive photocatalytic degradation cycles, as illustrated in Figure 6g. After each cycle, the catalyst was separated, thoroughly washed with deionized water and ethanol, dried, and reused under identical experimental conditions. The photocatalyst consistently maintained nearly 100% phenol degradation efficiency for the first two cycles and 97% phenol removal efficiency was retained for the last three cycles, demonstrating good photocatalytic stability and reusability during repeated operation. The chemical stability of the Sp3 photocatalyst was further evaluated by ICP-OES analysis of the reaction solution after five consecutive recycling cycles. No detectable Co or Fe leaching was observed, indicating negligible dissolution of the metal species during repeated photocatalytic operation [46]. The outstanding recyclability and chemical stability confirm the robustness of the synthesized CoFe2O4 photocatalyst and highlights its strong potential for long-term application in the photocatalytic treatment of phenol-contaminated wastewater. The structural stability of the optimized Sp3 photocatalyst after repeated photocatalytic operation was further examined by XRD analysis as shown in Figure 6h. The post-reaction (spent) Sp3 catalyst retained the characteristic diffraction reflections corresponding to the (220), (311), (222), (400), (422), (511), and (440) planes of the cubic spinel CoFe2O4 phase. No obvious additional diffraction peaks or major phase transformation were observed after photocatalytic cycling. Although minor variations in peak intensity were observed, the overall diffraction pattern remained consistent with that of the as-prepared Sp3 catalyst. These results demonstrate that the crystalline spinel framework and phase integrity of CoFe2O4 were largely preserved after repeated phenol degradation cycles, supporting the good structural stability and recyclability of the Sp3 photocatalyst. These findings collectively establish a clear relationship between the optimized physicochemical properties of CoFe2O4 and its enhanced photocatalytic performance.
4. Conclusions
In this work, a precursor concentration-controlled sol–gel strategy was employed to synthesize spinel CoFe2O4 nanophotocatalysts for phenol degradation under UV–Vis irradiation. Variation in the Co2+ precursor concentration significantly influenced the structural, optical, surface, and photocatalytic properties of CoFe2O4. Among the synthesized samples, Sp3, prepared using 0.3 M Co2+ precursor, exhibited the optimum physicochemical characteristics and highest photocatalytic activity, with a nanocrystalline cubic spinel structure, an indirect band gap of approximately 1.3 eV, mixed Co2+/Co3+ and Fe2+/Fe3+ states, and defect-associated surface oxygen species. Sp3 achieved complete phenol removal within approximately 40 min without H2O2 and exhibited the highest apparent rate constant k = 0.162 min−1 among Sp1–Sp5. H2O2 addition further accelerated phenol degradation, while increasing the initial phenol concentration decreased the apparent degradation rate. Radical-scavenging experiments identified •OH as the predominant reactive species, with additional contributions from •O2− and h+, while TOC analysis demonstrated substantial phenol mineralization, reaching approximately 88% TOC removal after 15 min of irradiation under the optimized conditions. Furthermore, the catalyst maintained high activity during repeated recycling, and post-reaction XRD confirmed preservation of the characteristic CoFe2O4 spinel phase. ICP-OES analysis after five consecutive recycling cycles showed no detectable Co or Fe leaching, further supporting the chemical stability of the catalyst. Overall, the results demonstrate that controlled Co2+ precursor concentration is an effective approach for optimizing the physicochemical and photocatalytic properties of CoFe2O4, providing a stable and reusable photocatalyst for the degradation of phenolic pollutants.
Supplementary Materials
The following supporting information can be downloaded at https://www.mdpi.com/article/10.3390/physchem6040063/s1, Figure S1: Photocatalytic degradation profiles and corresponding pseudo-first-order kinetic analysis of phenol over CoFe2O4 photocatalysts under UV–Vis irradiation; Table S1: Structural parameters of CoFe2O4 samples obtained from XRD analysis; Text S1: Photocatalytic degradation kinetics of phenol.
Author Contributions
Methodology, G.B.; Software, A.M.; Formal analysis, S.P.C., A.M. and S.B.M.; Investigation, S.B.M.; Resources, S.P.C. and A.H.; Data curation, A.M.; Writing—original draft, S.P.C., A.H. and G.B.; Writing—review & editing, A.H., S.B.M. and R.K.; Visualization, R.K.; Supervision, G.B. and R.K.; Project administration, G.B.; Funding acquisition, G.B. All authors have read and agreed to the published version of the manuscript.
Funding
Anusandhan National Research Foundation (ANRF), Government of India.
Data Availability Statement
The original contributions presented in this study are included in the article/Supplementary Material. Further inquiries can be directed to the corresponding authors.
Acknowledgments
G. Bharath, one of the corresponding authors, gratefully acknowledges the Anusandhan National Research Foundation (ANRF), Government of India, for financial support through the Early Career Research Grant (ECRG; File No. ANRF/ECRG/2024/001990/ENS) and the Advanced Research Grant (ARG; File No. ANRF/ARG/2025/008031/ENS). The authors acknowledge the limited use of OpenAI’s ChatGPT (GPT-6) for minor graphical assistance in preparing Figure 1.
Conflicts of Interest
The authors declare no conflicts of interest.
References
- Marçon, C.R. Phenol in dermatology: Updated evidence on efficacy and safety. An. Bras. Dermatol. 2025, 100, 501200. [Google Scholar] [CrossRef] [Scilit] [PubMed]
- Bharath, G.; Rambabu, K.; Alqassem, B.; Morajkar, P.P.; Abu Haija, M.; Nadda, A.K.; Gupta, V.K.; Banat, F. Fabrication of gold nanodots decorated on 2D tungsten sulfide (Au-WS2) photoanode for simultaneous oxidation of phenol and arsenic (III) from industrial wastewater. Chem. Eng. J. 2023, 456, 141062. [Google Scholar] [CrossRef] [Scilit]
- Ortlund, K.; Dunlop, A.L.; Barr, D.B.; Liang, D.; Tan, Y.; Buckley, J.P.; Kannan, K.; Chandler, M.; Ren, M.; Eick, S.M. Characterizing Prenatal Exposure to Contemporary and Emerging Chemicals in a Prospective Cohort of Pregnant Women in Atlanta, Georgia. Environ. Health 2026, 4, 331–340. [Google Scholar] [CrossRef] [Scilit] [PubMed]
- Abouleish, M.Y.Z. Concentration of Selected Anions in Bottled Water in the United Arab Emirates. Water 2012, 4, 496–509. [Google Scholar] [CrossRef] [Scilit]
- Fawell, J.K. Drinking Water Quality and Health. In Pollution: Causes, Effects and Control; The Royal Society of Chemistry: London, UK, 2013; pp. 60–79. [Google Scholar] [CrossRef] [Scilit]
- Ahmed, S.; Rasul, M.G.; Martens, W.N.; Brown, R.; Hashib, M.A. Heterogeneous photocatalytic degradation of phenols in wastewater: A review on current status and developments. Desalination 2010, 261, 3–18. [Google Scholar] [CrossRef] [Scilit]
- Ismael, M.; Wark, M. Photocatalytic activity of CoFe2O4/g-C3N4 nanocomposite toward degradation of different organic pollutants and their inactivity toward hydrogen production: The role of the conduction band position. FlatChem 2022, 32, 100337. [Google Scholar] [CrossRef] [Scilit]
- Mohammadi, S.; Kargari, A.; Sanaeepur, H.; Abbassian, K.; Najafi, A.; Mofarrah, E. Phenol removal from industrial wastewaters: A short review. Desalin. Water Treat. 2015, 53, 2215–2234. [Google Scholar] [CrossRef] [Scilit]
- Wasim, S.; Loeb, S.K. Aluminum nanoparticle enhanced TiO2 photocatalysis of organic pollutants under solar and UV-B irradiation. npj Clean Water 2026, 9, 29. [Google Scholar] [CrossRef] [Scilit] [PubMed]
- Schneider, J.; Matsuoka, M.; Takeuchi, M.; Zhang, J.; Horiuchi, Y.; Anpo, M.; Bahnemann, D.W. Understanding TiO2 Photocatalysis: Mechanisms and Materials. Chem. Rev. 2014, 114, 9919–9986. [Google Scholar] [CrossRef] [Scilit] [PubMed]
- Casbeer, E.; Sharma, V.K.; Li, X.-Z. Synthesis and photocatalytic activity of ferrites under visible light: A review. Sep. Purif. Technol. 2012, 87, 1–14. [Google Scholar] [CrossRef] [Scilit]
- Mmethi, G.L.; Mahlaule-Glory, L.M.; Hintsho-Mbita, N.C. Progress in green metal ferrite nanoparticles as photocatalysts for the degradation of dyes. Next Mater. 2026, 11, 101777. [Google Scholar] [CrossRef] [Scilit]
- Asokan, J.; Kumar, P.; Arjunan, G.; Shalini, M.G. Photocatalytic Performance of Spinel Ferrites and their Carbon-Based Composites for Environmental Pollutant Degradation. J. Clust. Sci. 2025, 36, 42. [Google Scholar] [CrossRef] [Scilit]
- Alqassem, B.; Banat, F.; Palmisano, G.; Abu Haija, M. Emerging trends of ferrite-based nanomaterials as photocatalysts for environmental remediation: A review and synthetic perspective. Sustain. Mater. Technol. 2024, 40, e00961. [Google Scholar] [CrossRef] [Scilit]
- Sanchez-Lievanos, K.R.; Sun, T.; Gendrich, E.A.; Knowles, K.E. Surface Adsorption and Photoinduced Degradation: A Study of Spinel Ferrite Nanomaterials for Removal of a Model Organic Pollutant from Water. Chem. Mater. 2024, 36, 3981–3998. [Google Scholar] [CrossRef] [Scilit] [PubMed]
- Chen, M.; Xu, Y. Trace Amount CoFe2O4 Anchored on a TiO2 Photocatalyst Efficiently Catalyzing O2 Reduction and Phenol Oxidation. Langmuir 2019, 35, 9334–9342. [Google Scholar] [CrossRef] [Scilit] [PubMed]
- Kurian, M.; Nair, D.S. Heterogeneous Fenton behavior of nano nickel zinc ferrite catalysts in the degradation of 4-chlorophenol from water under neutral conditions. J. Water Process Eng. 2015, 8, e37–e49. [Google Scholar] [CrossRef] [Scilit]
- Ismael, M.; Wu, Y. A facile synthesis method for fabrication of LaFeO3/g-C3N4 nanocomposite as efficient visible-light-driven photocatalyst for photodegradation of RhB and 4-CP. New J. Chem. 2019, 43, 13783–13793. [Google Scholar] [CrossRef] [Scilit]
- Liandi, A.R.; Cahyana, A.H.; Kusumah, A.J.F.; Lupitasari, A.; Alfariza, D.N.; Nuraini, R.; Sari, R.W.; Kusumasari, F.C. Recent trends of spinel ferrites (MFe2O4: Mn, Co, Ni, Cu, Zn) applications as an environmentally friendly catalyst in multicomponent reactions: A review. Case Stud. Chem. Environ. Eng. 2023, 7, 100303. [Google Scholar] [CrossRef] [Scilit]
- Sonu; Dutta, V.; Sharma, S.; Raizada, P.; Hosseini-Bandegharaei, A.; Gupta, V.K.; Singh, P. Review on augmentation in photocatalytic activity of CoFe2O4 via heterojunction formation for photocatalysis of organic pollutants in water. J. Saudi Chem. Soc. 2019, 23, 1119–1136. [Google Scholar] [CrossRef] [Scilit]
- Bharath, G.; Palanisamy, S.; Sivaranjani, T.; Karthigeyan, A.; Rajakarthihan, S.; Banat, F. Advancing nanoarchitectures of 2D WO3/MXene photoanode for enhanced photoelectrocatalytic oxidation of phenol and arsenic in synthetic wastewater. Environ. Res. 2024, 260, 119676. [Google Scholar] [CrossRef] [Scilit] [PubMed]
- Roy, P.; Hoque, S.M.; Liba, S.I.; Choudhury, S. Investigation of various magnetic features of spinel type cobalt ferrite (CoFe2O4) nanoparticles tuned by annealing temperature. AIP Adv. 2018, 8, 105124. [Google Scholar] [CrossRef] [Scilit]
- Labchir, N.; Hannour, A.; Hssi, A.A.; Vincent, D.; Abouabassi, K.; Ihlal, A.; Sajieddine, M. Synthesis and characterization of CoFe2O4 thin films for solar absorber application. Mater. Sci. Semicond. Process. 2020, 111, 104992. [Google Scholar] [CrossRef] [Scilit]
- El-Masry, M.M.; Arman, M.M. Cobalt, nickel and zinc spinel ferrites with high transmittance and UV-blocking for advanced optical applications. Sci. Rep. 2025, 15, 16636. [Google Scholar] [CrossRef] [Scilit] [PubMed]
- Ravindra, A.V.; Chandrika, M.; Rajesh, C.; Kollu, P.; Ju, S.; Ramarao, S.D. Simple synthesis, structural and optical properties of cobalt ferrite nanoparticles. Scope Eur. Phys. J. Plus 2019, 134, 296. [Google Scholar] [CrossRef] [Scilit]
- Zhou, Z.; Zhang, Y.; Wang, Z.; Wei, W.; Tang, W.; Shi, J.; Xiong, R. Electronic structure studies of the spinel CoFe2O4 by X-ray photoelectron spectroscopy. Appl. Surf. Sci. 2008, 254, 6972–6975. [Google Scholar] [CrossRef] [Scilit]
- Fantauzzi, M.; Secci, F.; Sanna Angotzi, M.; Passiu, C.; Cannas, C.; Rossi, A. Nanostructured spinel cobalt ferrites: Fe and Co chemical state, cation distribution and size effects by X-ray photoelectron spectroscopy. RSC Adv. 2019, 9, 19171–19179. [Google Scholar] [CrossRef] [Scilit] [PubMed]
- Li, R.; Sun, C.; Liu, J.; Zhen, Q. Sulfur-doped CoFe2O4 nanopowders for enhanced visible-light photocatalytic activity and magnetic properties. RSC Adv. 2017, 7, 50546–50554. [Google Scholar] [CrossRef] [Scilit]
- Moretti, G.; Salvi, A.M.; Guascito, M.R.; Langerame, F. An XPS study of microporous and mesoporous titanosilicates. Surf. Interface Anal. 2004, 36, 1402–1412. [Google Scholar] [CrossRef] [Scilit]
- Rana, G.; Verma, R.; Alabdullkarem, E.A.; Rao, S.K.; Lin, K.-Y.A.; Ghotekar, S.; Chauhan, A. Z-Scheme CoFe2O4/g-C3N4/MWCNT catalyst for the degradation of organic pollutants: Electrochemical evaluation and HPLC analysis of the intermediates. RSC Adv. 2026, 16, 29434–29449. [Google Scholar] [CrossRef] [Scilit] [PubMed]
- Refat, N.M.; Nassar, M.Y.; Sadeek, S.A. A controllable one-pot hydrothermal synthesis of spherical cobalt ferrite nanoparticles: Synthesis, characterization, and optical properties. RSC Adv. 2022, 12, 25081–25095. [Google Scholar] [CrossRef] [Scilit] [PubMed]
- Arman, M.M.; El-Dek, S.I. Structural, Surface, Magnetic Study and Application of Nanoparticles CoFe2O4, ZnO and its Nanocomposite. J. Supercond. Nov. Magn. 2023, 36, 1913–1925. [Google Scholar] [CrossRef] [Scilit]
- Roy, P.; Hoque, S.M.; Akter, S.; Liba, S.I.; Choudhury, S. Study on the chemical co-precipitation synthesized CoFe2O4 nanoparticle for magnetocaloric performance in the vicinity of superparamagnetic blocking temperature. Heliyon 2024, 10, e34413. [Google Scholar] [CrossRef] [Scilit] [PubMed]
- Mohapatra, J.; Xing, M.; Elkins, J.; Beatty, J.; Liu, J.P. Size-dependent magnetic hardening in CoFe 2 O 4 nanoparticles: Effects of surface spin canting. J. Phys. D Appl. Phys. 2020, 53, 504004. [Google Scholar] [CrossRef] [Scilit]
- Bortnic, R.; Szilárd, T.; Szatmári, Á.; Hirian, R.; Știufiuc, R.I.; Moldovan, A.-I.; Dudric, R.; Tetean, R. Synthesis and Characterization of Size- and Shape-Controlled CoFe2O4 Nanoparticles via Polyvinylpyrrolidone (PVP)-Assisted Hydrothermal Synthesis. Appl. Sci. 2026, 16, 3547. [Google Scholar] [CrossRef] [Scilit]
- Mosleh, Z.; Beygmohammadvand, M.; Ghotbi Varzaneh, A.; Kameli, P. Influence of cobalt substitution in CoFe2O4 nanoparticles on structural, morphological, cation distribution, optical and magnetic properties. Heliyon 2025, 11, e41276. [Google Scholar] [CrossRef] [Scilit] [PubMed]
- Kumar, S.; Ahmed, F.; Shaalan, N.M.; Kumar, R.; Alshoaibi, A.; Arshi, N.; Dalela, S.; Sayeed, F.; Dwivedi, S.; Kumari, K. Structural, Magnetic, and Electrical Properties of CoFe2O4 Nanostructures Synthesized Using Microwave-Assisted Hydrothermal Method. Materials 2022, 15, 7955. [Google Scholar] [CrossRef] [Scilit] [PubMed]
- Kumar, Y.; Sharma, A.; Shirage, P.M. Impact of different morphologies of CoFe2O4 nanoparticles for tuning of structural, optical and magnetic properties. J. Alloys Compd. 2019, 778, 398–409. [Google Scholar] [CrossRef] [Scilit]
- El Hamid, R.K.A.; Barakat, F.I.; Seoudi, R.; Said, D.A. Synthesis, multifunctional properties, and photocatalysis of cobalt ferrite (CoFe2O4) nanoparticles. Sci. Rep. 2026, 16, 23452. [Google Scholar] [CrossRef] [Scilit] [PubMed]
- Ayyappan, S.; Mahadevan, S.; Chandramohan, P.; Srinivasan, M.P.; Philip, J.; Raj, B. Influence of Co2+ Ion Concentration on the Size, Magnetic Properties, and Purity of CoFe2O4 Spinel Ferrite Nanoparticles. J. Phys. Chem. C 2010, 114, 6334–6341. [Google Scholar] [CrossRef] [Scilit]
- Alsharaeh, E.H.; Bora, T.; Soliman, A.; Ahmed, F.; Bharath, G.; Ghoniem, M.G.; Abu-Salah, K.M.; Dutta, J. Sol-Gel-Assisted Microwave-Derived Synthesis of Anatase Ag/TiO2/GO Nanohybrids toward Efficient Visible Light Phenol Degradation. Catalysts 2017, 7, 133. [Google Scholar] [CrossRef] [Scilit]
- Ayyappan, S.; Nithya, R.; Sivaranjani, T.; Karthigeyan, A.; Rajakarthihan, S.; Bharath, G. Enhanced photoelectrocatalytic and antibacterial performance of g-C3N4/ZnWO4 heteronanostructures for sustainable water purification. Ceram. Int. 2025, 51, 14565–14574. [Google Scholar] [CrossRef] [Scilit]
- Bharath, G.; Hai, A.; Kiruthiga, T.; Rambabu, K.; Sabri, M.A.; Park, J.; Choi, M.Y.; Banat, F.; Haija, M.A. Fabrication of Ru–CoFe2O4/RGO hierarchical nanostructures for high-performance photoelectrodes to reduce hazards Cr(VI) into Cr(III) coupled with anodic oxidation of phenols. Chemosphere 2022, 299, 134439. [Google Scholar] [CrossRef] [Scilit] [PubMed]
- Sivaranjani, T.; Rajakarthihan, S.; Karthigeyan, A.; Bharath, G. Sustainable photoelectrocatalytic oxidation of antibiotics using Ag–CoFe2O4@TiO2 heteronanostructures for eco-friendly wastewater remediation. Chemosphere 2024, 362, 142736. [Google Scholar] [CrossRef] [Scilit] [PubMed]
- Venkatesh, D.; Kanchana, V.; Vasanthan, S.; Kistan, A.; Rajeswaran, P.; Arunkumar, K.; Siva Karthik, P. Design and fabrication of magnetically recoverable SnO2/CoFe2O4 nanocomposite for enhanced visible light-driven wastewater treatment. Inorg. Chem. Commun. 2024, 166, 112657. [Google Scholar] [CrossRef] [Scilit]
- Guo, S.; Yang, M.; Gao, X.; Huang, Y.; Huang, Y.; You, L.; Han, C.; Cai, C.; Chen, F.; Chen, R. 3D-Printed Porous High-Entropy Alloy Boosts Peroxymonosulfate Activation for Long-Term Organic Pollutant Degradation. Rare Met. 2026, 45, e70134. [Google Scholar] [CrossRef] [Scilit]
Disclaimer/Publisher’s Note: The statements, opinions and data contained in all publications are solely those of the individual author(s) and contributor(s) and not of MDPI and/or the editor(s). MDPI and/or the editor(s) disclaim responsibility for any injury to people or property resulting from any ideas, methods, instructions or products referred to in the content. |
© 2026 by the authors. Licensee MDPI, Basel, Switzerland. This article is an open access article distributed under the terms and conditions of the Creative Commons Attribution (CC BY) license.