


Abstract
Natural slopes commonly exhibit stratified soil profiles due to depositional and pedogenic processes, and differences in hydraulic properties between soil layers can affect rainfall infiltration and slope stability. However, conventional rainfall intensity–duration (I–D) threshold curves are generally developed under the assumption of homogeneous slopes and therefore cannot adequately represent the hydraulic responses and failure mechanisms of multilayered slopes. This study evaluates the stability of multilayered unsaturated slopes using critical suction stress–depth profiles and establishes physically based rainfall I–D threshold curves to investigate the effects of permeability contrasts and interlayer failure mechanisms. The results indicate that interlayer failure mechanisms are a key factor controlling the stability of multilayered slopes. During rainfall infiltration, pore-water pressure development is strongly dependent on soil-layer configuration and hydraulic conditions, causing the distribution and relative position of rainfall threshold curves to vary with failure depth and rainfall pattern. These variations may alter the threshold criteria and lead to prediction errors in practical early warning applications. Accordingly, an adjustment framework for early warning strategies is proposed for multilayered slopes to improve the applicability and reliability of rainfall threshold curves under stratified geological conditions.
1. Introduction
Rainfall-induced shallow landslides are common and high-risk geological hazards worldwide [1,2,3,4,5]. During rainfall infiltration, water often forms localized saturated zones above bedrock or low-permeability soil layers. The development of these saturated zones is controlled by factors such as topographic conditions, antecedent moisture conditions, geological material properties, and rainfall patterns [6,7,8,9], thereby affecting slope stability and posing threats to mountainous environments and infrastructure. Therefore, developing a slope early warning system that combines predictive accuracy with practical applicability is essential for disaster mitigation, emergency response, and risk management. Among the available approaches, intensity–duration (I–D) curves, which describe the relationship between rainfall intensity and duration, have become one of the principal methods for predicting slope failure because of their intuitive concept and reliance solely on rainfall data [10,11]. Compared with empirical-statistical models, physically based rainfall threshold methods provide a more comprehensive theoretical framework and can directly represent the mechanisms of rainfall infiltration, pore-water pressure evolution, and slope stability [12,13,14]. Among commonly used physically based approaches, SHALSTAB combines topographic controls, steady-state hydrological conditions, and infinite-slope stability analysis to identify terrain units susceptible to shallow landsliding, whereas SINMAP evaluates relative slope stability using ranges of hydrological and geotechnical parameters through a stability index. Both approaches are primarily based on simplified or steady-state hydrological representations and therefore place less emphasis on transient responses during individual rainfall events [15,16]. TRIGRS further incorporates transient rainfall infiltration and pore-water-pressure changes into infinite-slope stability analysis, allowing temporal and spatial variations in slope stability to be evaluated. However, its hydrological formulation is primarily based on one-dimensional vertical flow within individual grid cells, resulting in simplifications when representing complex stratification and multidimensional water redistribution [16,17]. Despite these advances, existing rainfall threshold methods generally assume homogeneous materials in slope stability analyses and do not account for the stratified soil structures commonly found in natural slopes. Masoudian et al. [18] indicated that neglecting soil stratification may overestimate the factor of safety and underestimate the potential sliding volume.
Only a limited number of studies have investigated the spatial variability of unsaturated soils, and the influence of suction stress distributions across different soil layers on the stability of stratified unsaturated slopes remains insufficiently understood [19]. Liu et al. [20] indicated that soil stratification and infiltration rate jointly control the distributions of matric suction and degree of saturation within a slope. In particular, when permeability contrasts exist between soil layers, water accumulation and abrupt changes in suction stress at the layer interfaces become key factors governing slope stability. Therefore, the practical application of physically based rainfall threshold curves is constrained by the heterogeneity and stratification of in situ soils. Overcoming the limitations associated with the homogeneous-material assumption would improve the applicability of rainfall threshold curves in engineering practice.
When rainfall infiltrates multilayered slopes, water may be retained or redistributed between soil layers or may migrate downward more rapidly, resulting in more complex hydrological responses within the slope [21,22,23,24]. Compared with homogeneous slopes, the failure mechanisms of multilayered slopes are also more complex. Previous studies have identified rainfall intensity as an important factor controlling the failure process of multilayered slopes [25,26]. Low-intensity rainfall generally induces basal sliding, whereas high-intensity rainfall tends to trigger failure along soil-layer interfaces [27,28]. However, most existing studies have focused on a single factor, such as slope angle or rainfall intensity [29,30], and therefore cannot fully represent the complexity of hydrological behavior within multilayered slopes. In addition, rainfall temporal patterns are important factors affecting the spatial heterogeneity of soil water content. In studies of homogeneous slopes, rainfall patterns have frequently been incorporated into hydrological simulations to investigate their effects on infiltration behavior and water redistribution [31,32]. This study showed that wetting-front development is closely associated with the occurrence of shallow slope failure [33]. However, the effects of infiltration differences induced by various rainfall patterns on the stability of multilayered slopes remain insufficiently understood.
Therefore, the objective of this study is to extend the rainfall intensity–duration threshold methodology to multilayered slopes and to develop a physically based, mechanism-oriented analytical framework. HYDRUS-2D (PC-Progress, Prague, Czech Republic) is employed to simulate transient unsaturated flow and to obtain the spatial and temporal variations in the internal hydrological state of the slope under different rainfall conditions. The simulated hydrological responses are then combined with suction-stress-based slope stability analysis to determine the corresponding critical failure conditions. This framework is used to analyze the variation in internal hydraulic behavior within slopes under different rainfall intensities and rainfall patterns and to investigate the effects of permeability contrasts between soil layers and interlayer failure mechanisms on the distribution of rainfall threshold curves. By linking transient hydrological responses within layered slopes to interlayer failure mechanisms, the framework provides a physical interpretation of how soil stratification and rainfall characteristics alter physically based I–D threshold behavior. The proposed framework is primarily applicable to shallow slopes with approximately planar geometry and identifiable stratified soil profiles, where the hydraulic and mechanical properties of individual soil layers can be reasonably characterized. Although the present numerical analyses adopt a two-layer configuration, the stability formulation itself is not restricted to two layers and can be extended to other stratified slopes with similar hydrogeological characteristics. Finally, considering the influences of antecedent rainfall and rainfall patterns, this study evaluates the limitations that slope early warning systems may encounter in practical applications and proposes corresponding adjustment strategies to improve the applicability and reliability of rainfall threshold curves under stratified geological conditions.
2. Materials and Methods
This study first establishes critical suction stress–depth profiles for multilayered slopes to identify the failure mechanisms and potential failure depths under different rainfall conditions. The effects of permeability contrasts between soil layers on water distribution are also considered to develop physically meaningful rainfall intensity–duration (I–D) threshold curves. Next, different rainfall conditions and temporal patterns are applied to analyze the hydraulic responses at soil-layer interfaces during rainfall infiltration and to determine whether slope failure is primarily governed by suction stress dissipation or pore-water pressure accumulation. Finally, the transient rainfall simulation results are used to systematically investigate the effects of interlayer failure mechanisms on the distribution and relative positions of the rainfall threshold curves. Based on differences in soil stratification and failure mechanisms, corresponding modification strategies for the early warning system are proposed.
2.1. Two-Layer Slope Model
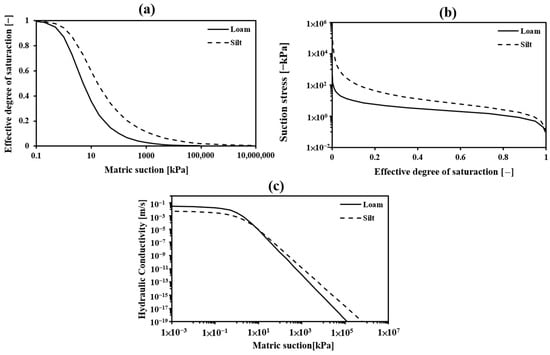
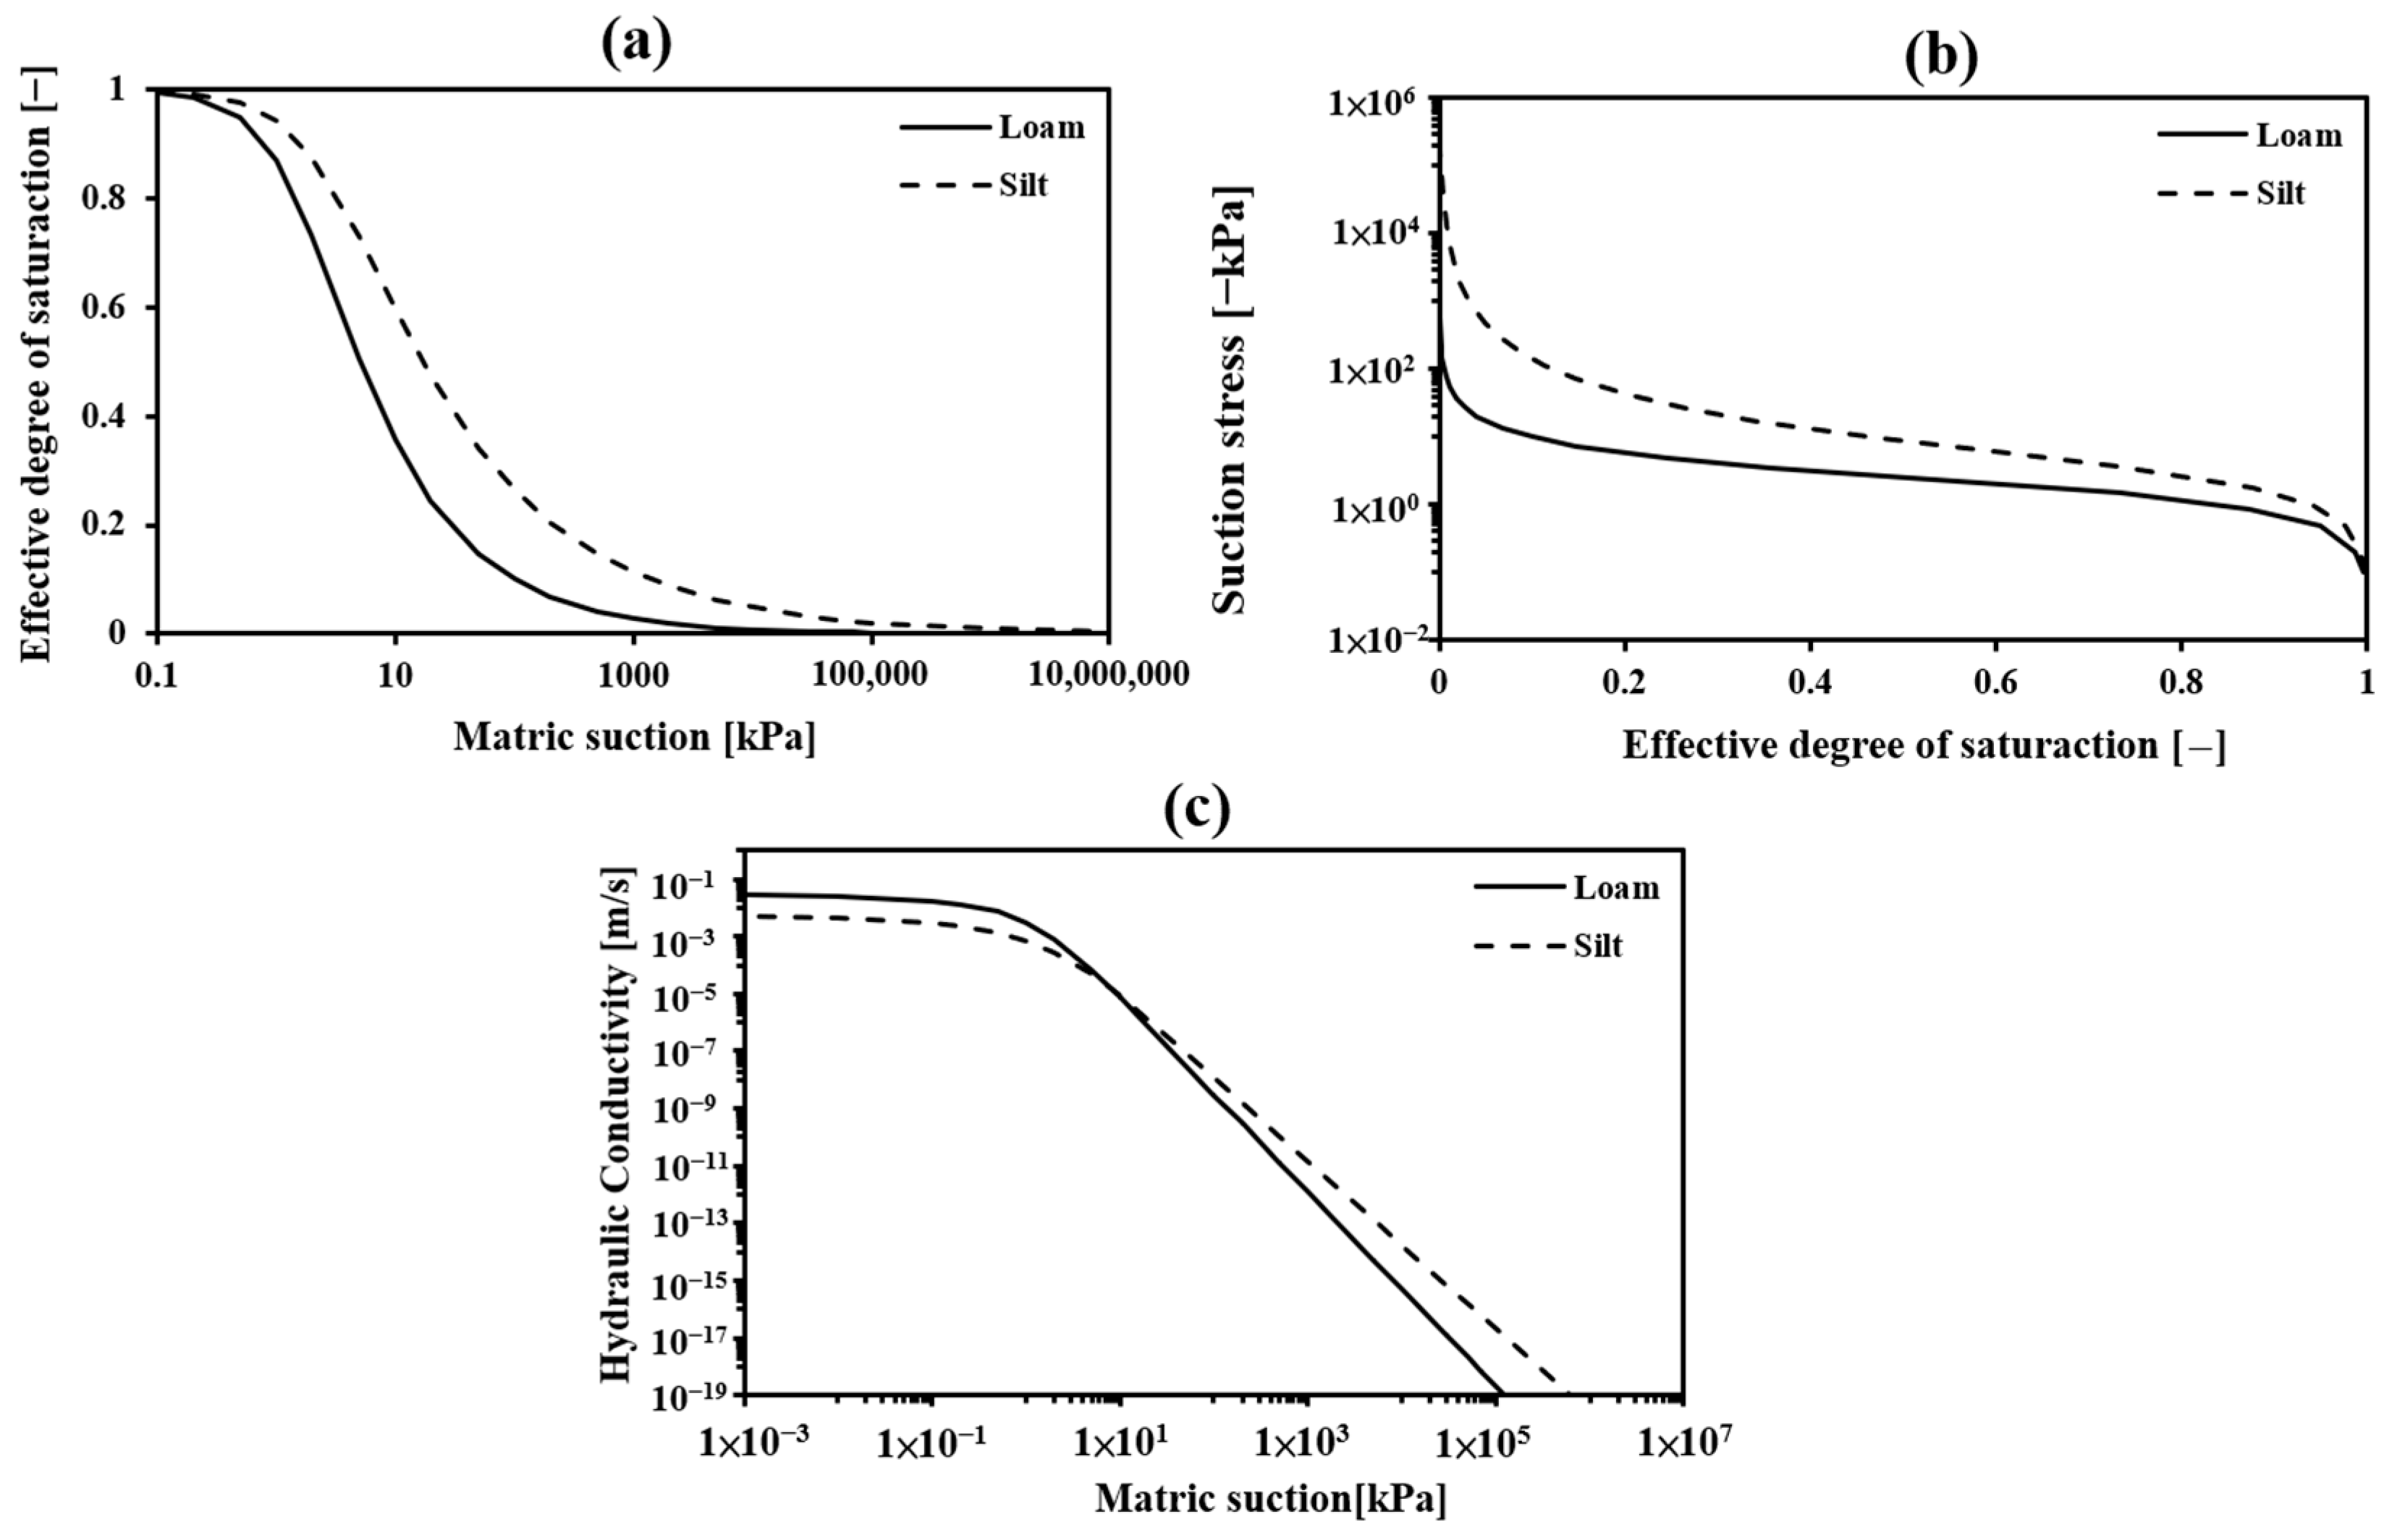
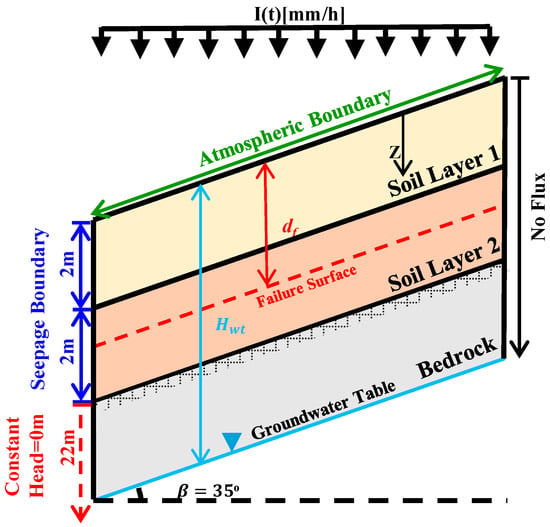
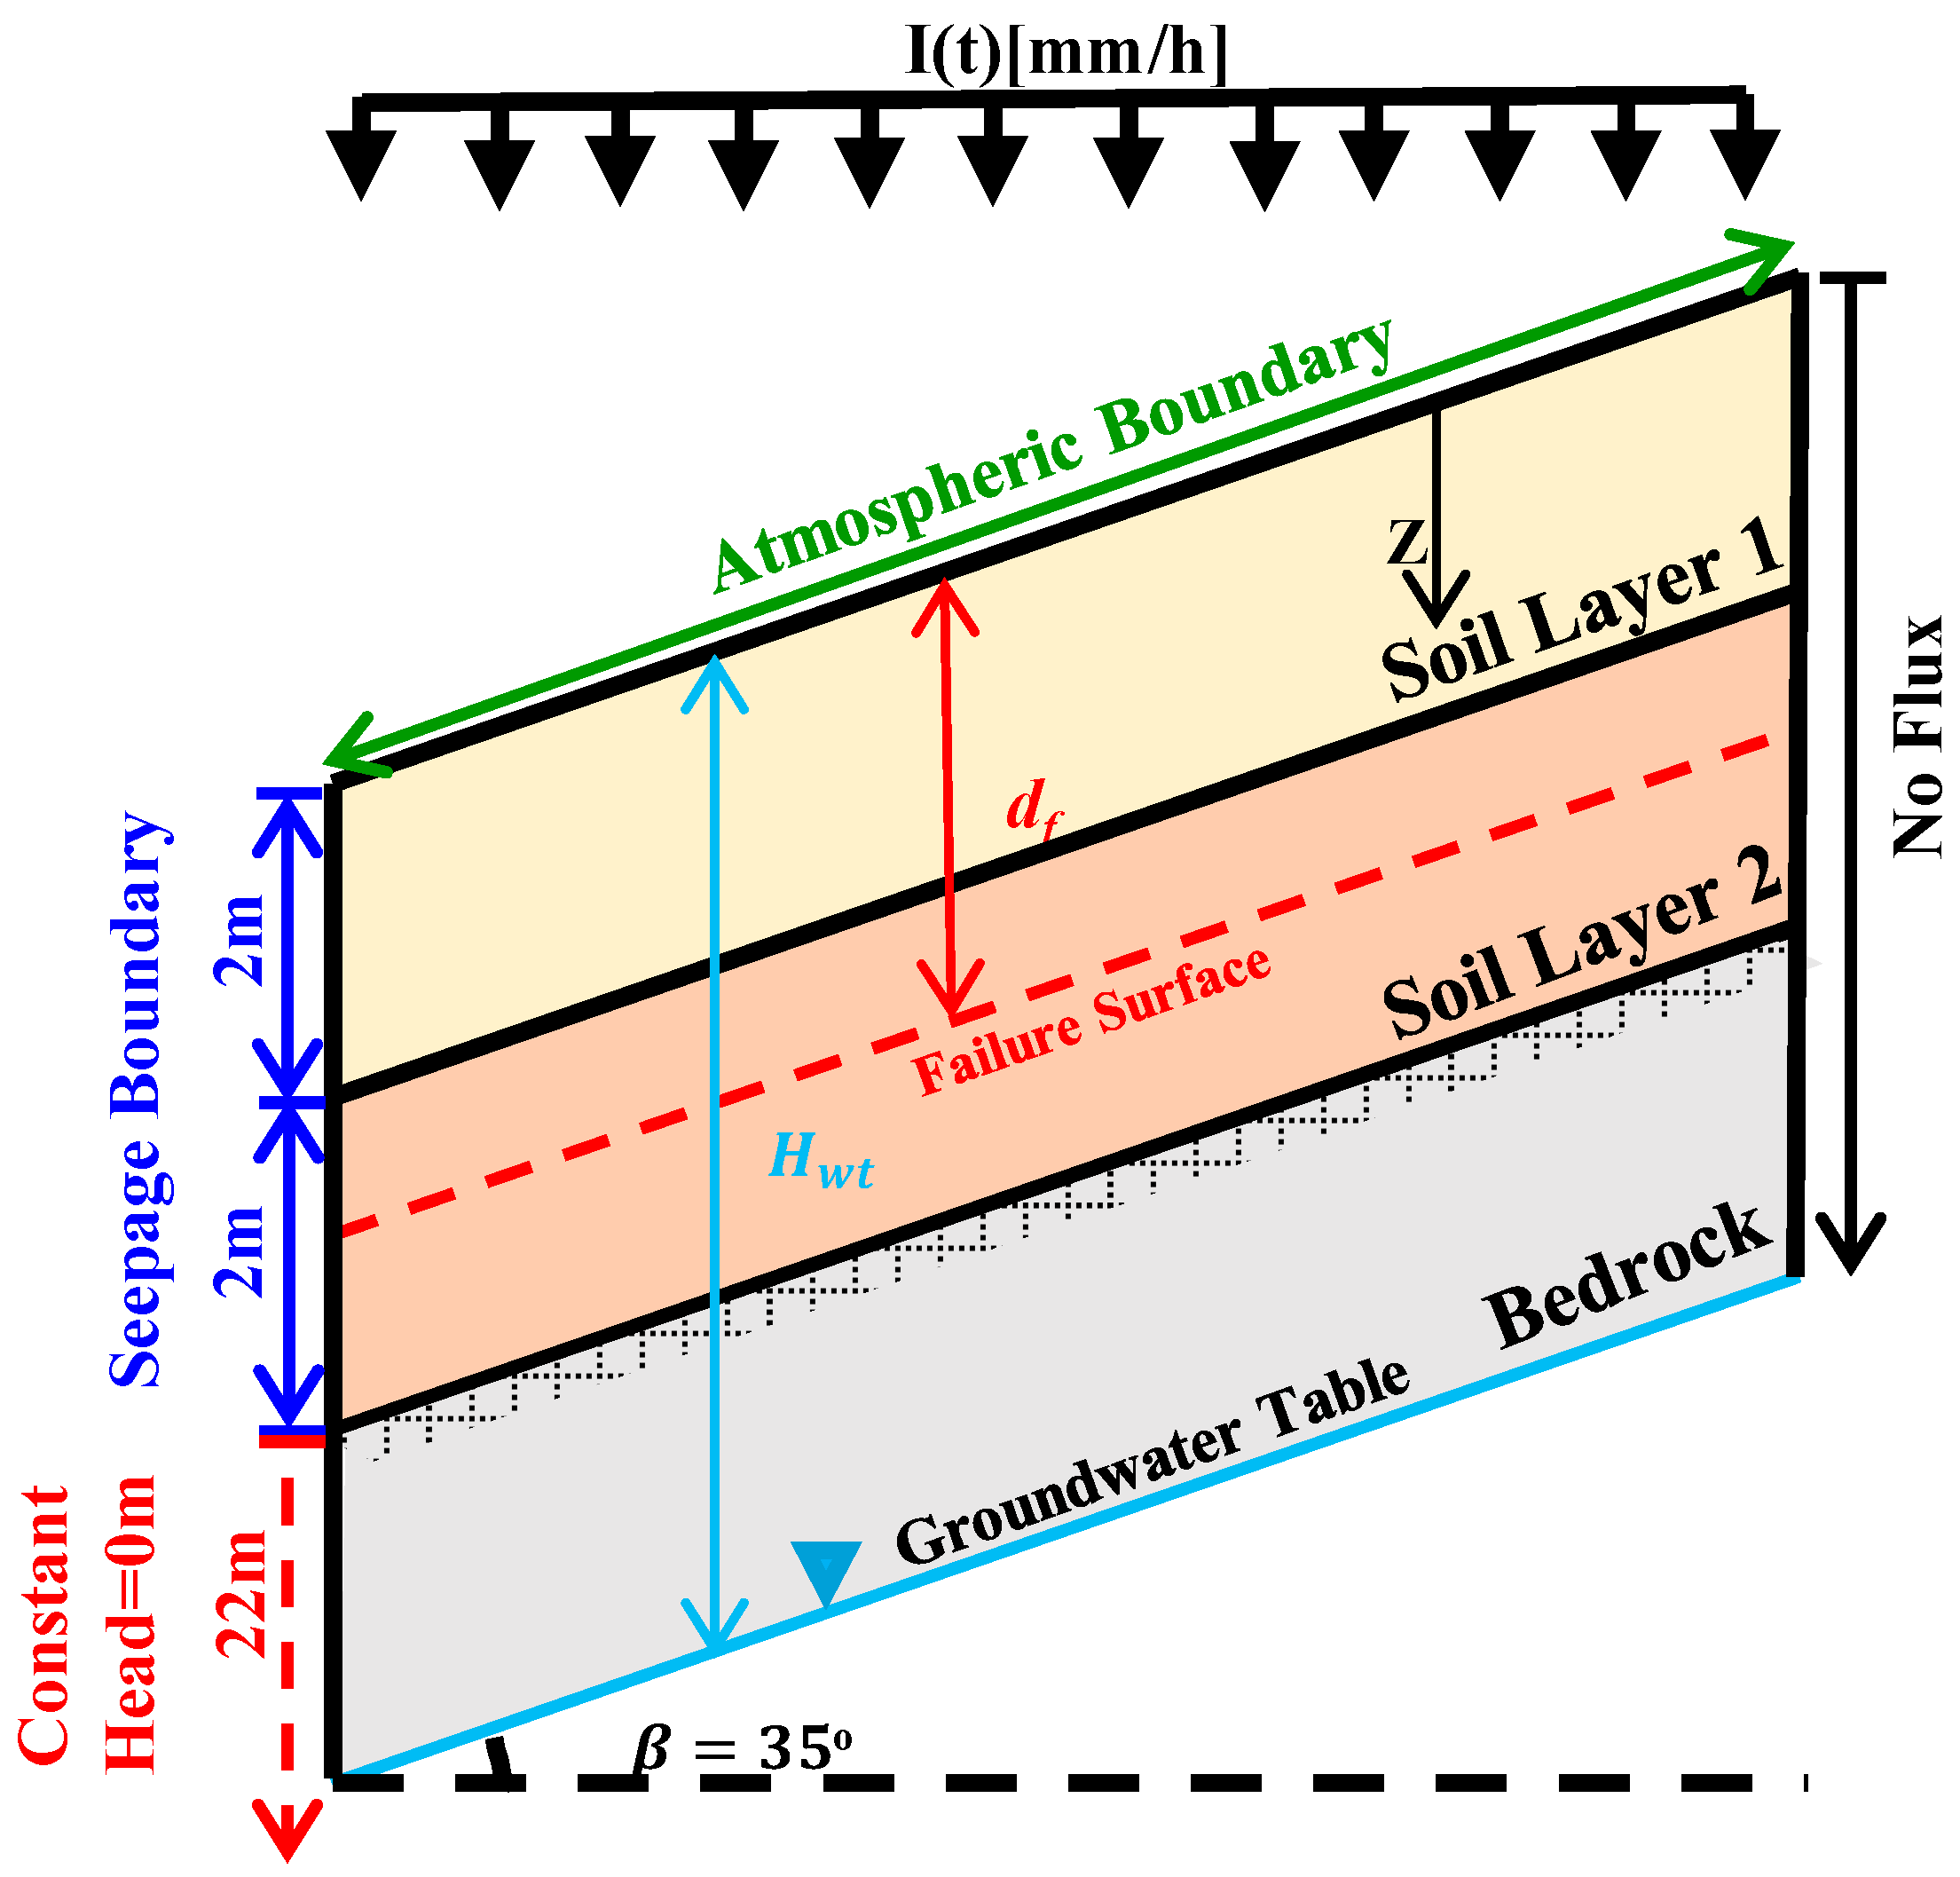
Rainfall-induced slope failure generally occurs at shallow depths, with the failure surface approximately parallel to the slope surface [14]. Therefore, this study develops two-layer slope models composed of loam and silt, which have different hydraulic conductivities. By simulating rainfall infiltration and suction stress variations under different soil-layer configurations, the effects of permeability contrasts between the upper and lower soil layers on slope stability are investigated. The soil parameters used in the simulations are presented in Table 1 and Table 2. The soil hydraulic and mechanical parameters were adopted from the statistical database reported by Carsel and Parrish [34], while the parameters of the bedrock layer were obtained from Yang et al. [35]. The parameters listed in Table 1 and Table 2 are primarily used to construct idealized two-layer slope cases for comparing the relative effects of different soil-layer configurations, mechanical conditions, and hydraulic properties on the I–D threshold curves, rather than for high-precision calibration of a specific site. Therefore, no uniform numerical criterion was prescribed for the accuracy or precision of these parameters. Instead, representative parameter sets were selected to reflect the contrasting characteristics of different soil layers. For application to an actual engineering site, the parameters should be calibrated based on field investigations, laboratory tests, and in situ tests, together with appropriate sensitivity or uncertainty analyses where necessary, to ensure that the parameter accuracy is sufficient to support slope-stability assessment. The Soil Water Retention Curve (SWRC), Suction Stress Characteristic Curve (SSCC), and Hydraulic Conductivity Function (HCF) are shown in Figure 1. The two-layer slope model is illustrated in Figure 2.
Table 1.
Multilayer soil mechanical parameters.
Table 2.
Multilayer soil hydraulic parameters.
Figure 1.
Hydraulic properties of materials (a) SWRC (b) SSCC (c) HCF.
Figure 2.
Conceptual model of a two-layer infinite slope.
The numerical domain consists of a 4 m-thick soil profile underlain by a 22 m-thick bedrock layer, giving a total model depth of 26 m. The groundwater table is assumed to be parallel to the slope surface and located at the bottom of the numerical domain. The initial pore-water pressure and water content distributions are specified according to hydrostatic conditions. The failure surface is allowed to develop at any depth within the 4 m soil profile, with its location determined by the prevailing hydrological and mechanical conditions. Although the hydrological simulation includes both the soil and bedrock layers, only the suction-stress data within the soil profile are used for slope-stability analysis. The numerical domain is discretized using a mesh size of 0.6 m, and the simulation results are recorded at 1 h intervals. For the hydrological boundary conditions, the upper boundary is specified as an atmospheric boundary condition with surface runoff. When the rainfall intensity exceeds the instantaneous infiltration capacity of the soil, the excess rainfall is calculated as surface runoff. This setting represents runoff generation following near-surface saturation during intense rainfall events. The right-side boundary and the bottom boundary beneath the bedrock layer are specified as no-flux boundaries, indicating that no water exchange occurs across these boundaries. In contrast, the left-side boundary is assigned different conditions according to the material and groundwater level: the soil portion is specified as a seepage boundary, whereas the bedrock portion below the groundwater table is prescribed as a constant-head boundary with a pressure head of 0 m to maintain the specified groundwater level.
The boundary and initial conditions used in the rainfall infiltration analysis are described as follows. The upper boundary was specified as an atmospheric boundary condition with a prescribed rainfall flux. Under unsaturated conditions, the rainfall intensity Is was applied to the slope surface as the infiltration flux. When the rainfall intensity exceeded the infiltration capacity of the soil and the surface became saturated (), the actual infiltration flux was automatically governed by the soil hydraulic conductivity, the pressure head gradient, and the gravitational gradient.
where Is denotes the rainfall intensity [LT−1], K(h) represents the hydraulic conductivity as a function of pressure head [LT−1], and ∂h/∂z is the pressure head gradient [−]. Here, the vertical coordinate z is defined as positive downward from the slope surface, and positive flux represents downward infiltration. The vertical flux is governed by both the pressure-head gradient and gravity. The negative pressure head (h < 0) corresponds to matric suction via , where is the unit weight of water. Therefore, when the groundwater table is located at a depth of Hwt [L] (i.e., z = Hwt), the matric suction is zero:
Assuming hydrostatic equilibrium as the initial condition, the distribution of pressure head and matric suction with depth can be expressed as follows:
This expression indicates that, under hydrostatic equilibrium, matric suction varies linearly with depth, and its distribution is mainly governed by the position of the groundwater table. This distribution was adopted as the initial condition for the subsequent rainfall infiltration analysis. Subsequently, in the transient infiltration analysis, rainfall intensity was incorporated into the calculation as the upper atmospheric flux boundary condition in the HYDRUS-2D model.
2.2. Coupled Hydro-Mechanical Analysis of Unsaturated Slopes
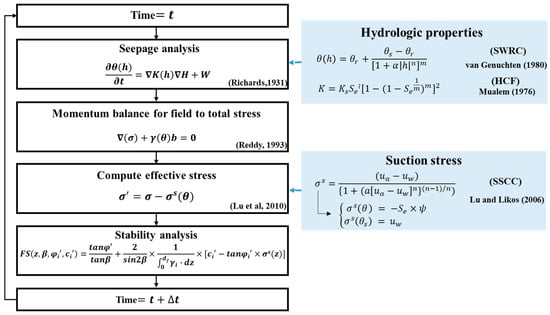
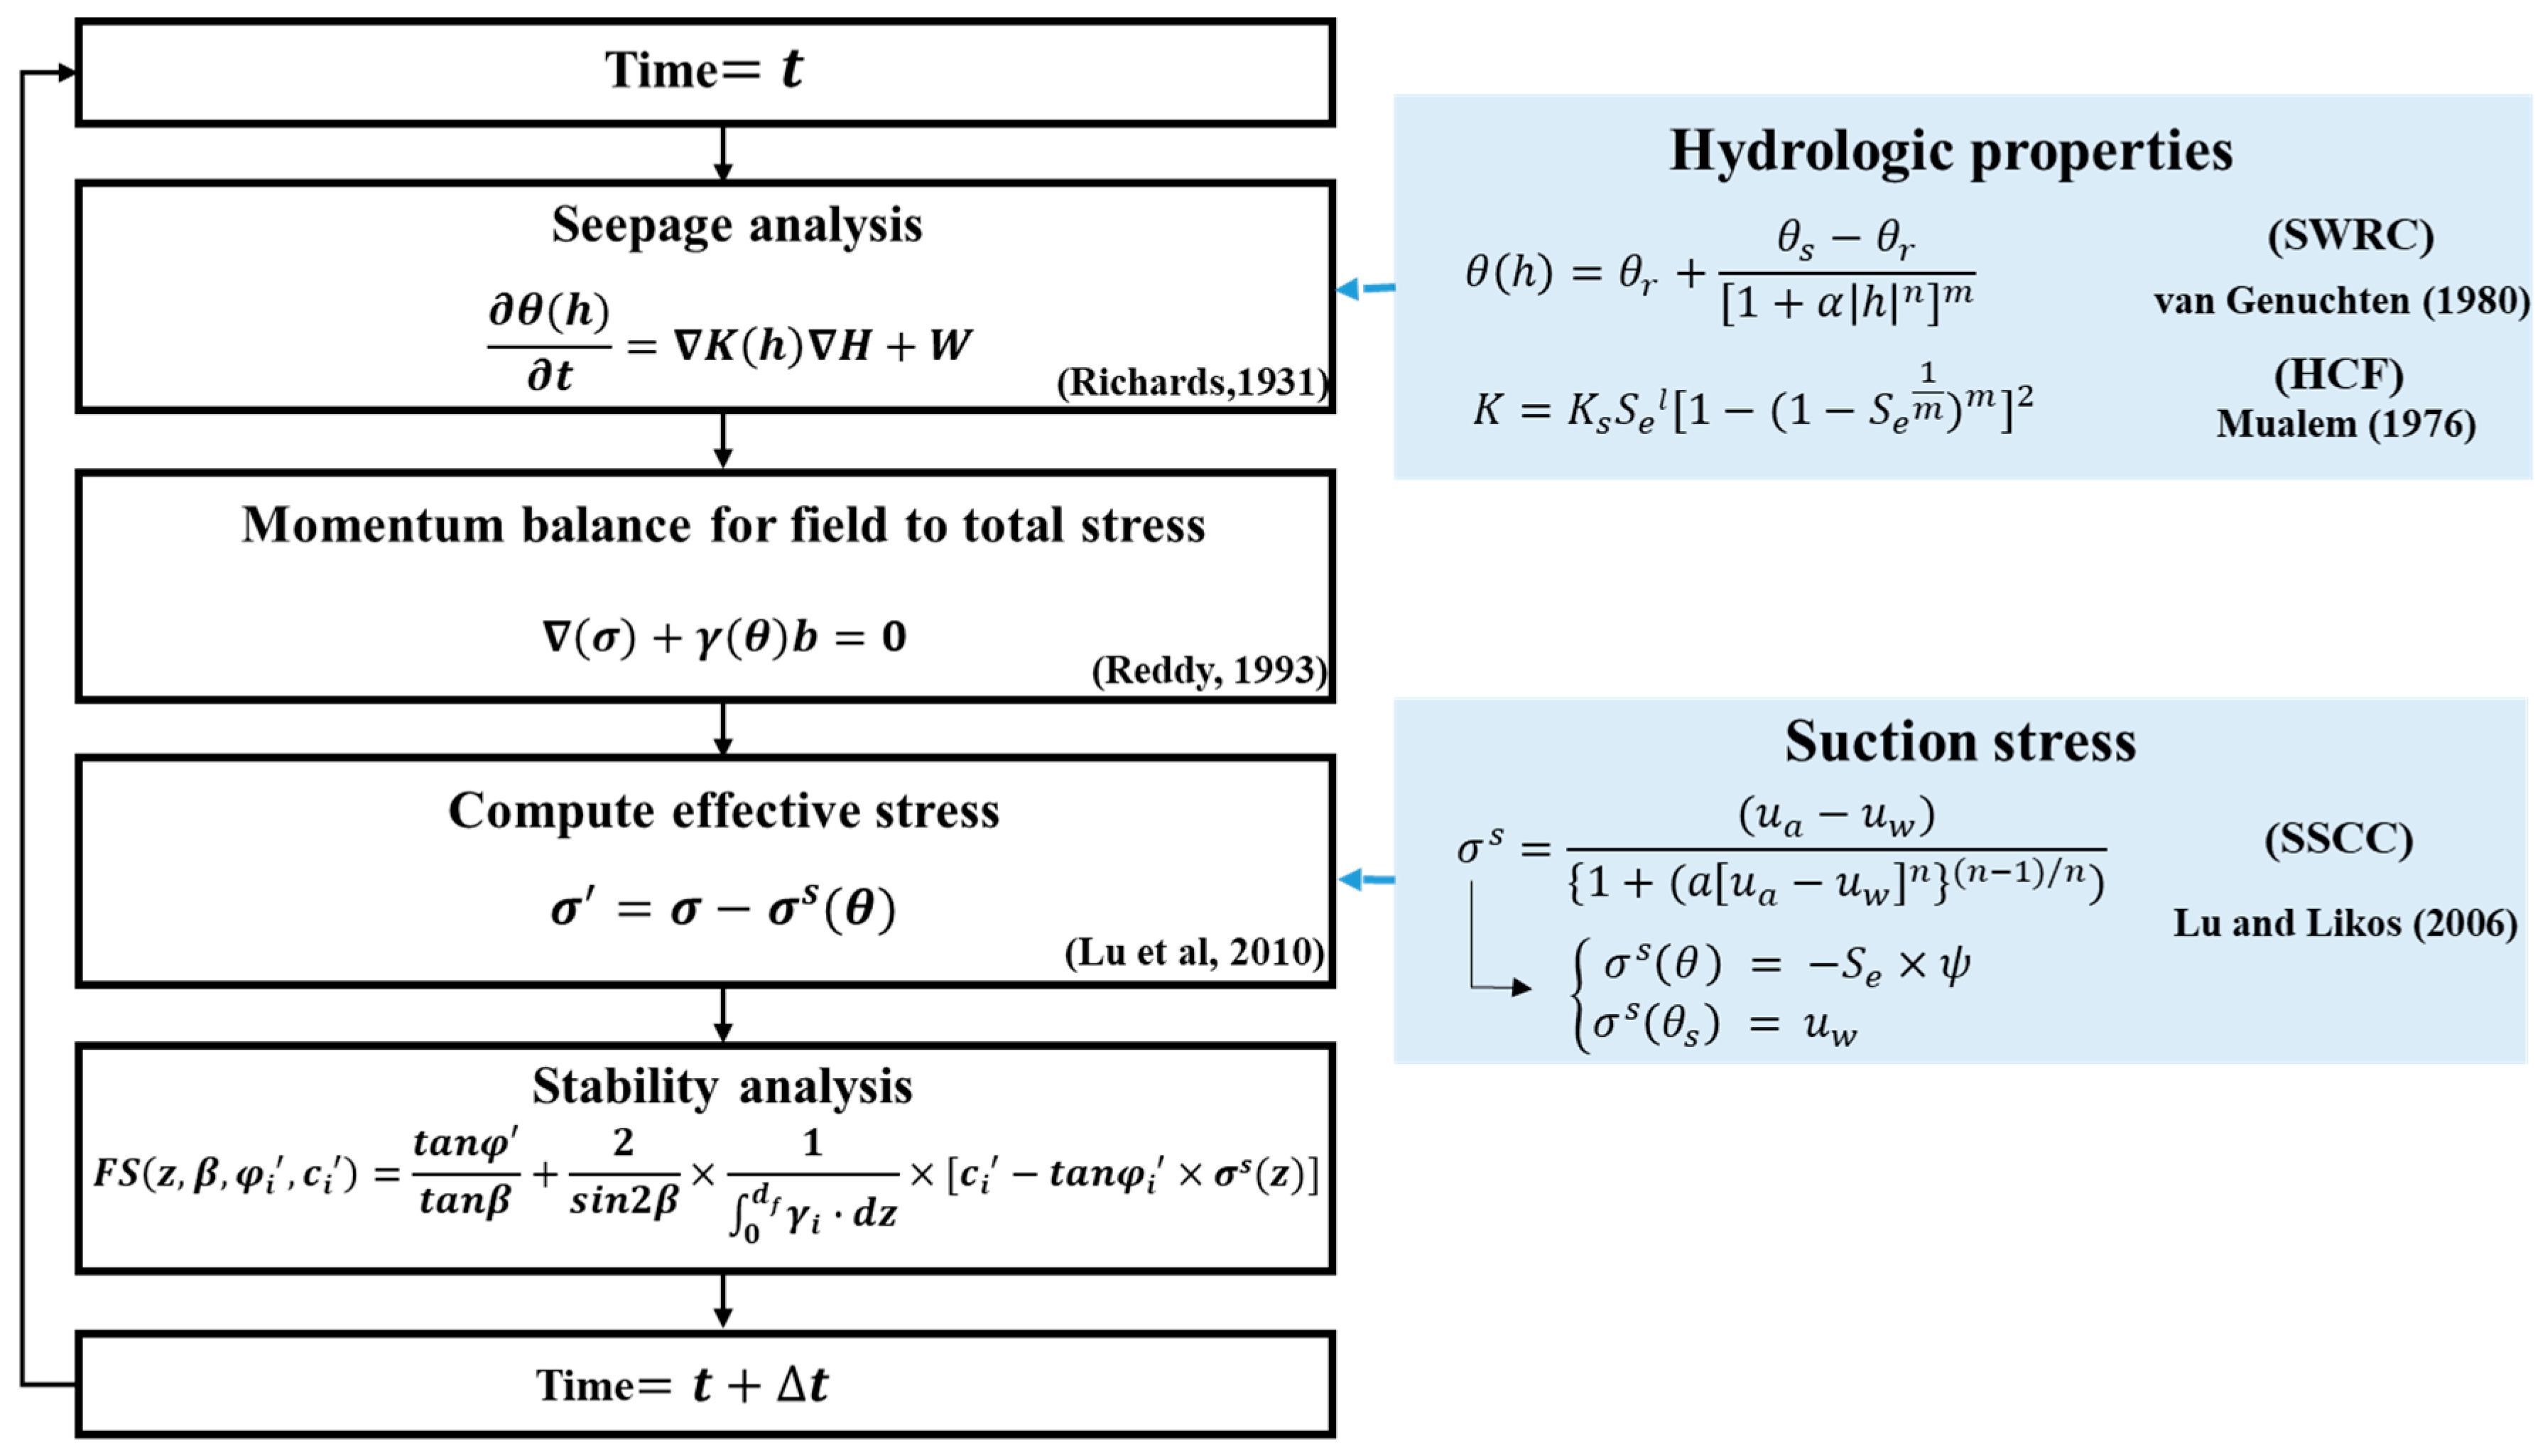
The rainfall intensity–duration (I–D) curve of a slope reflects its site-specific hydrological and mechanical characteristics and is primarily controlled by the hydrological properties of the slope and its critical suction stress. The curve can be established through numerical simulations and represents combinations of rainfall intensity and duration that cause the slope to reach a critical state under different rainfall conditions. In this study, numerical simulations are performed using HYDRUS-2D [36]. The rainfall infiltration analysis calculates the temporal and spatial variations in matric suction, water content, hydraulic conductivity, and suction stress. The governing equation for transient unsaturated flow is based on the Richards equation [37], expressed as follows:
where is the volumetric water content [−]; t is time [T]; h is the pressure head [L]; H is the total hydraulic head [L]; and W is the source sink term [T−1]. The functions and K(h), which vary with pore-water pressure, correspond to the SWRC and HCF, respectively. In this study, the SWRC model proposed by van Genuchten [38] is adopted and expressed as follows:
where is the saturated volumetric water content [−]; is the residual volumetric water content [−]; and [L−1] and n [−] are fitting parameters of the SWRC, with m = 1 − 1/n. In addition, Mualem [39] derived a HCF for unsaturated soils based on the above SWRC model, expressed as follows:
where Se is the effective degree of saturation [−], and is the pore-connectivity parameter, which is commonly assumed to be 0.5.
According to the unified effective stress theory proposed by Lu and Likos [40], the effective stress in variably saturated soils can be expressed as follows:
where is the total stress [ML−1T−2], and is the suction stress [ML−1T−2] (taken as negative under unsaturated conditions to represent tensile stress), which varies as a function of matric suction or soil water content. This relationship is referred to as the SSCC [40]. The SSCC is derived from the SWRC and is jointly controlled by matric suction and the effective degree of saturation.
where is the effective degree of saturation [−], (ua − uw) is the matric suction [ML−1 T−2], and represents the corresponding suction stress. Under saturated conditions, pore-water pressure in soil may be compressive, meaning positive relative to atmospheric pressure, or tensile, meaning negative relative to atmospheric pressure, depending on the boundary conditions. Under a hydrostatic pressure distribution, the maximum negative pore-water pressure that the soil can sustain while remaining saturated is an intrinsic property known as the air-entry pressure. When the pore-water pressure falls below this value, the soil becomes unsaturated, and suction stress contributes to the internal effective stress.
As the soil approaches saturation, the contribution of suction stress diminishes and is replaced by the effect of pore-water pressure. This is consistent with the pore-water pressure concept in Terzaghi’s [41] effective stress theory and reflects the continuity of effective stress across the saturated–unsaturated transition.
where is the effective degree of saturation [−], is the matric suction [ML−1T−2] (), and is the pore-water pressure [ML−1T−2]. Here, suction stress is negative () under unsaturated conditions, enhancing effective normal stress, and becomes positive () under positive pore-water pressure conditions. Therefore, regardless of whether the soil is in a saturated or unsaturated state, its shear strength can be described using the Mohr–Coulomb failure criterion:
This study employs a limit equilibrium–based factor of safety framework modified to account for the suction stress distribution, enabling its application to stability analyses of stratified unsaturated slopes with an arbitrary number of soil layers. This method effectively captures the variations in soil saturation, suction stress, and unit weight within different soil layers during the infiltration process. The factor of safety is calculated as follows:
where β is the slope angle; is the effective internal friction angle of the (i)-th soil layer; is the effective cohesion of the (i)-th soil layer; γi is the unit weight of the (i)-th soil layer; df is the slip surface depth; and σs(z) is the suction stress varying with depth. The calculation procedure is illustrated in Figure 3.
Figure 3.
Unsaturated hydro-mechanical coupled analysis procedure [37,38,39,40,42,43].
2.3. Method for Establishing Rainfall Threshold Curves Based on Critical Suction Stress
The critical suction stress of a slope refers to the minimum effective stress condition required to induce failure under a given slope angle (β) and set of soil mechanical parameters (γ, , ), and is therefore regarded as an intrinsic property of the slope. For a specific slope, the distribution of critical suction stress can be expressed as a deterministic function of depth (z). Although soil suction and water content affect the transient pore-water pressure and seepage behavior, thereby altering the time at which failure is triggered, the critical suction stress itself does not vary with time or soil moisture conditions [14]. To extend the rainfall threshold curve method to multilayered soil slopes, the integral term of soil unit weight in Equation (11) is discretized by setting the factor of safety equal to 1. The resulting expression for the distribution of critical suction stress across different soil layers is given as follows:
The first term on the right-hand side represents the shear resistance contribution provided by effective cohesion under the control of the effective friction angle when the failure depth is located within the i-th soil layer. The second and third terms correspond to the gravitational components resulting from the combined effects of geometric and mechanical conditions, including the slope angle β [−], the internal friction angle [−], and the geometry of the slip surface, and are used to describe the driving effect along the potential sliding surface. The fourth term represents the weighted summation of the unit weights of each soil layer from the ground surface to depth z. To avoid underestimating the potential instability at soil layer interfaces, this study adopts a conservative estimation for the critical condition at the interface. The overburden weight of the upper soil layer is substituted into the shear strength parameters of both the upper and lower layers to calculate the critical suction stress, and the lower of the two values is taken as the controlling critical condition at the interface.
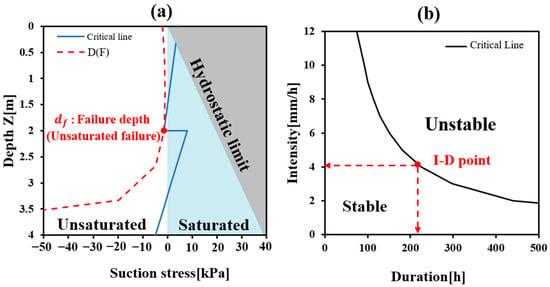
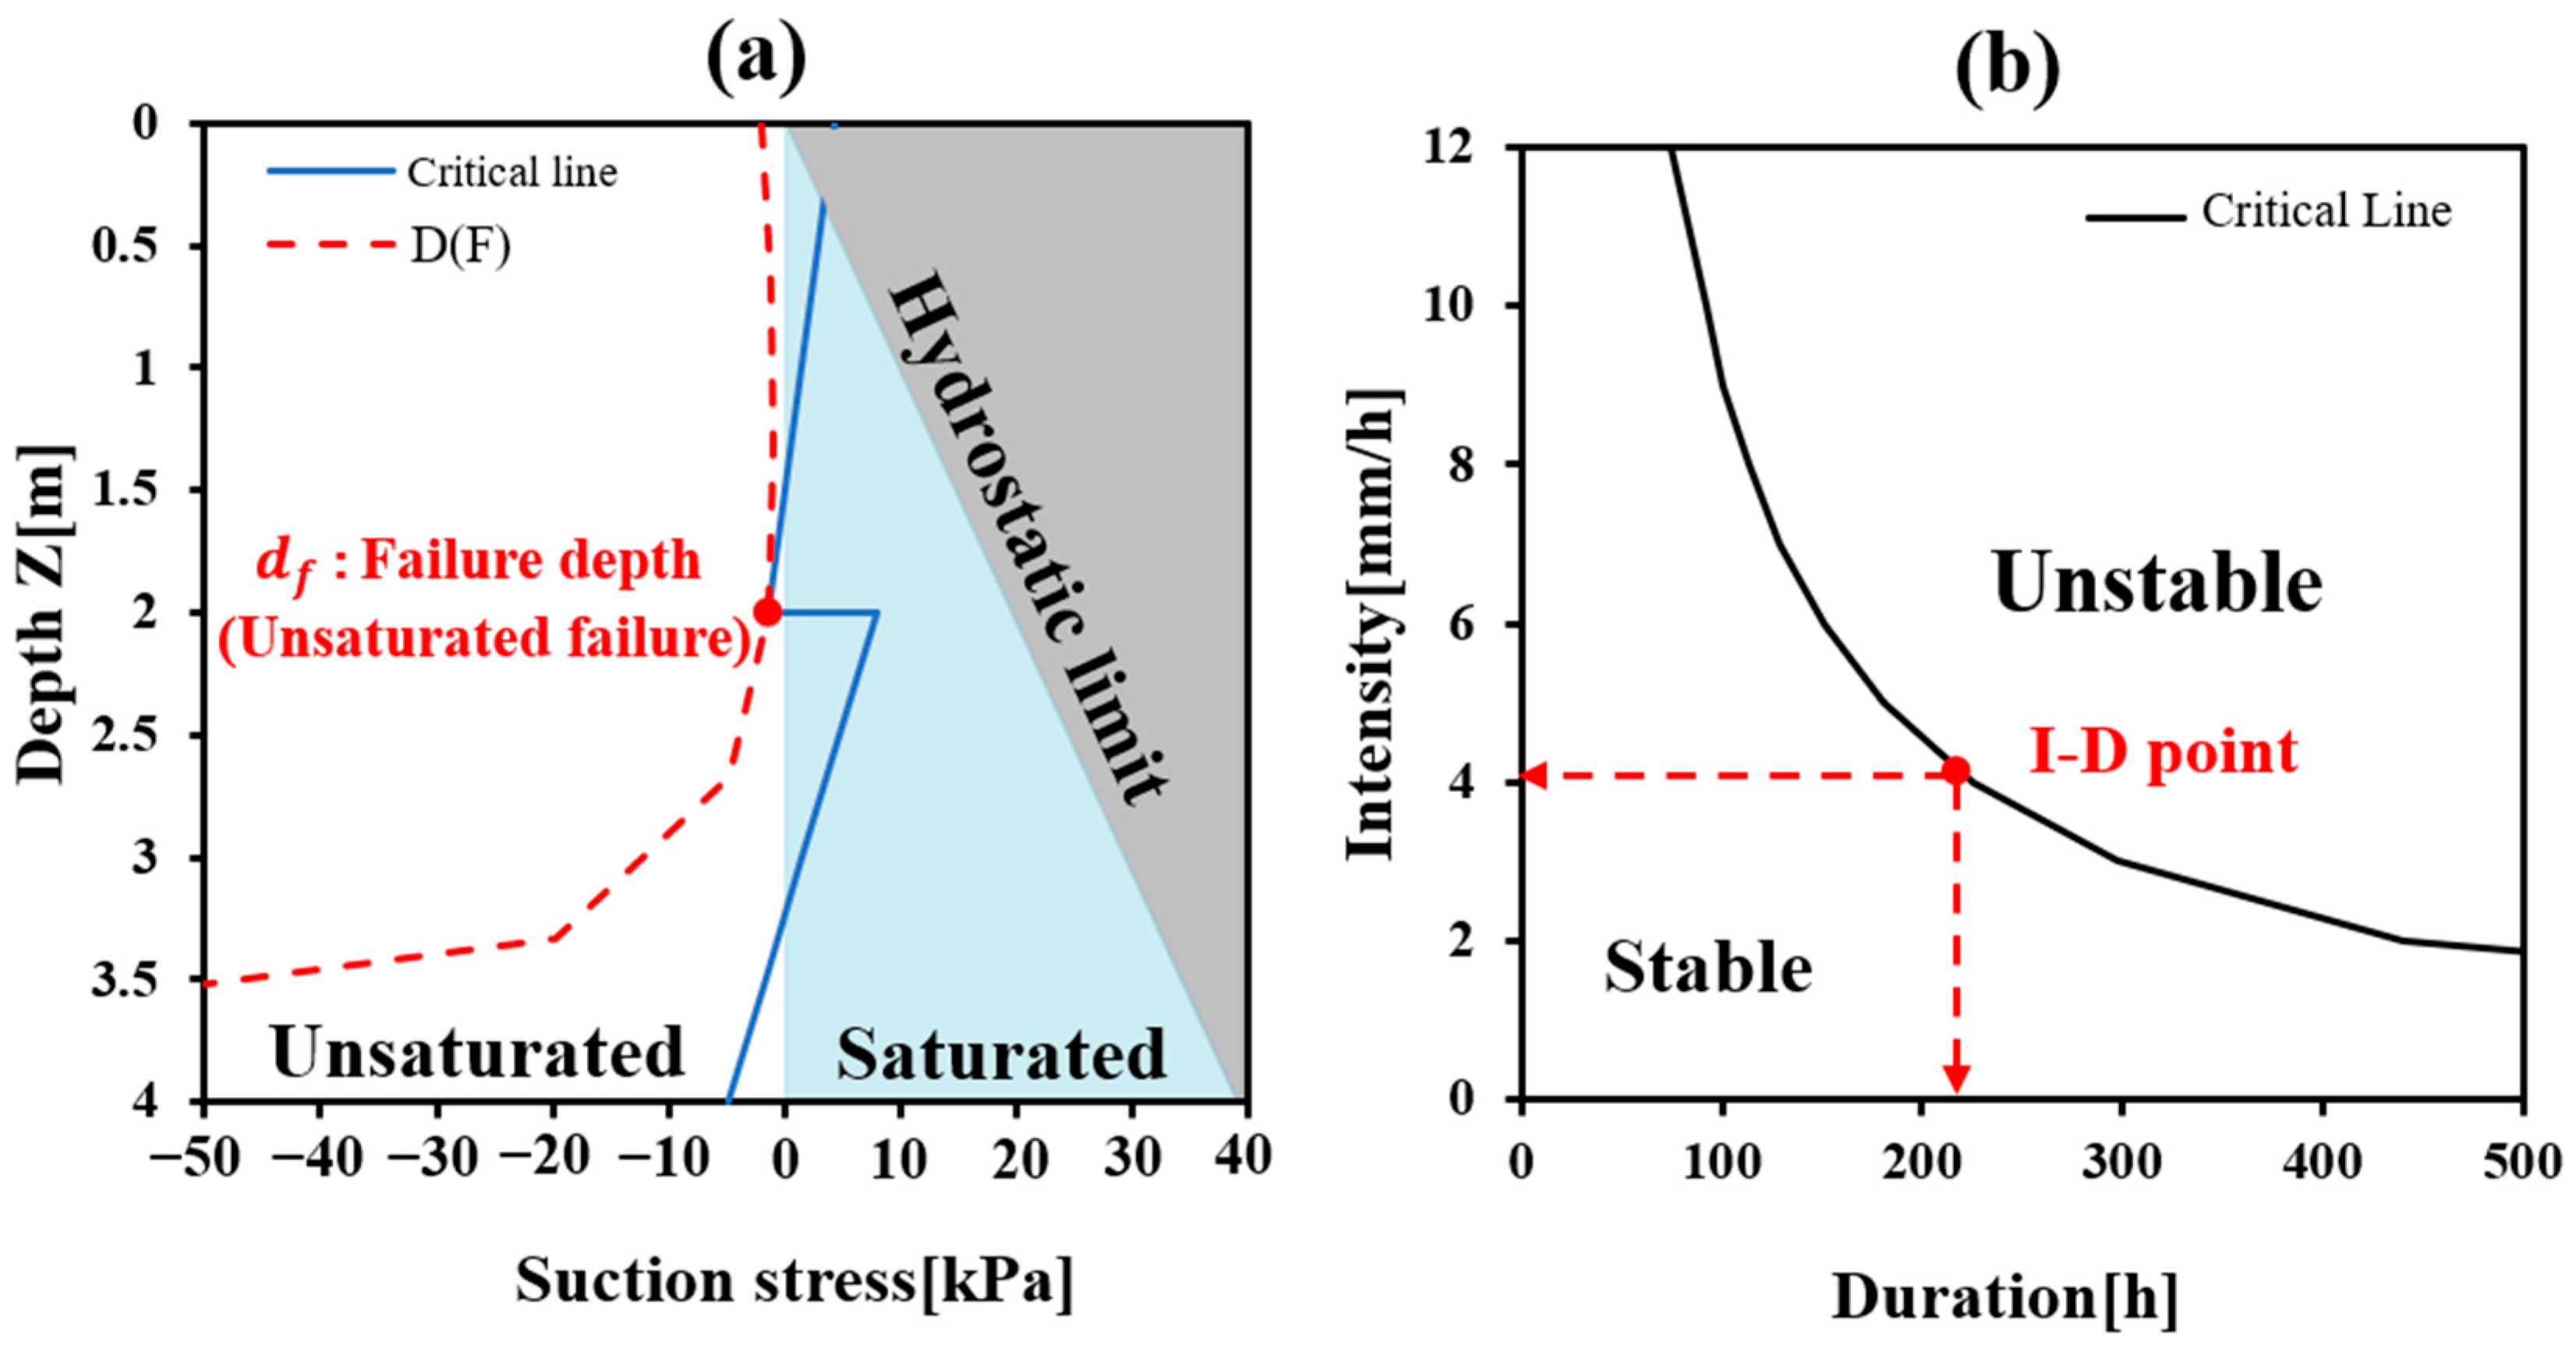
Finally, by cumulatively evaluating suction stress layer by layer under critical conditions, the critical suction stress–depth profile applicable to multilayered slopes can be established, as shown by the blue line in Figure 4a. This profile corresponds to the limit equilibrium state of the slope defined by Equation (12). The red dashed line represents the rainfall-induced suction stress profile simulated using HYDRUS-2D. In the transient infiltration analysis, rainfall intensity was incorporated as the upper atmospheric flux boundary condition of the HYDRUS-2D model, as shown in Equation (1). The Richards equation in Equation (4) was then numerically solved to calculate the temporal and depth-dependent variations in pressure head and volumetric water content within the slope under different rainfall intensities. Accordingly, the influence of rainfall intensity on the soil water conditions was represented through the transient infiltration process. Finally, the simulated volumetric water content, or the effective degree of saturation derived from the SWRC, was substituted into Equation (8) to calculate the suction stress.
Figure 4.
(a) Critical suction stress–depth profile; (b) suction stress–based rainfall intensity–duration threshold curve.
For a given rainfall intensity, the infiltration process was simulated until the rainfall-induced suction stress profile first intersected the critical suction stress profile. The depth corresponding to the first intersection was defined as the critical failure depth (df), and the corresponding simulation time was defined as the failure time. To establish the rainfall intensity–duration (I–D) threshold curve, rainfall intensities ranging from 1 to 12 mm/h, with an increment of 1 mm/h, were systematically simulated. By repeating this procedure under different rainfall intensities, multiple combinations of critical rainfall intensity and failure duration were obtained and used to establish the rainfall intensity–duration (I–D) threshold curve, as shown in Figure 4b. Rainfall conditions above the threshold curve indicate unstable conditions, whereas those below the curve represent stable conditions. The red point in Figure 4b represents one critical I–D combination determined from the first intersection shown in Figure 4a.
2.4. Configuration of Layer Permeability and Interlayer Failure Conditions
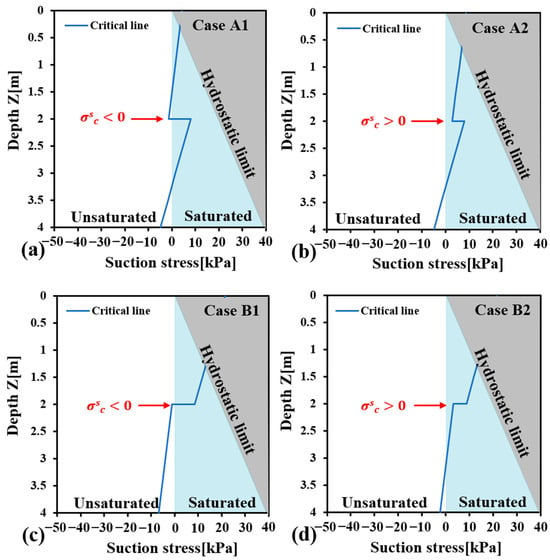
This study investigates the effects of permeability contrasts between soil layers on the internal hydraulic behavior of slopes by varying the layer configuration in a two-layer soil slope. The cases considered are listed in Table 3. Case A represents a loam–silt slope, simulating rainfall infiltration from a high-permeability upper layer to a low-permeability lower layer. In contrast, case B represents a silt–loam slope, corresponding to rainfall infiltration from a low-permeability upper layer to a high-permeability lower layer. In addition, this study establishes a two-layer slope model using two types of loam with different cohesion values (loam 1 and loam 2) to investigate the effects of mechanical parameter variations on slope stability. The critical suction stress–depth profiles for different cases are shown in Figure 5.
Table 3.
Soil layer configuration and interlayer failure conditions of two-layer slopes.
Figure 5.
Critical suction stress profiles of two-layer slopes under different layer configurations and interlayer failure conditions. Loam–silt slope: (a) unsaturated failure, (b) saturated failure; silt–loam slope: (c) unsaturated failure, (d) saturated failure.
Under different cohesion conditions, the critical suction stress at the soil layer interface (Z = 2 m) is negative ( = −1 kPa) and positive ( = 3 kPa), respectively. When the interlayer critical suction stress is negative ( ≤ 0), slope stability decreases due to suction stress dissipation induced by rainfall infiltration, leading to unsaturated failure. In contrast, when the interlayer critical suction stress is positive ( > 0), slope stability is controlled by water accumulation at the interface and the development of positive pore water pressure, resulting in saturated failure. Therefore, this study can analyze the effects of different rainfall infiltration behaviors on interlayer failure conditions by combining different soil layer configurations with critical suction stress conditions, thereby causing changes in the distribution of rainfall threshold curves.
3. Results and Discussion
3.1. Failure Depth and Rainfall Threshold of Two-Layer Slopes
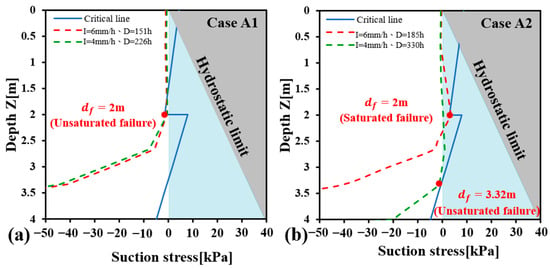
In this study, the low-permeability silt layer is used as the reference (Ks = 5.8 mm/h). Rainfall intensities of 6 mm/h and 4 mm/h are applied to analyze the hydraulic behavior of the slope under different infiltration conditions and to compare the locations of moisture accumulation within the slope. The suction stress–depth profiles of the loam–silt slope under different rainfall intensities are shown in Figure 6. When the rainfall intensity exceeds the hydraulic conductivity of the silt layer, the suction stress profile at failure is represented by the red dashed line. The wetting front is impeded by the underlying silt layer and cannot readily propagate downward. As a result, infiltrating water accumulates above the soil interface, leading to increases in soil water content and pore water pressure. Consequently, slope failure occurs at the soil-layer interface at a depth of approximately 2 m.
Figure 6.
Suction stress distribution in a loam–silt slope under different rainfall intensities: (a) case A1 and (b) case A2.
In contrast, when interlayer failure is governed by pore water pressure and the rainfall intensity is lower than the permeability of the lower soil layer, the suction stress profile is shown by the green dashed line. Under this condition, the wetting front can continue to propagate downward without being constrained by the permeability contrast between soil layers. Although the water content in the lower soil layer increases, it is insufficient to generate pore water pressure at the layer interface. When infiltration reaches deeper zones and satisfies the failure condition, the failure depth shifts from the soil layer interface to approximately 3.32 m.
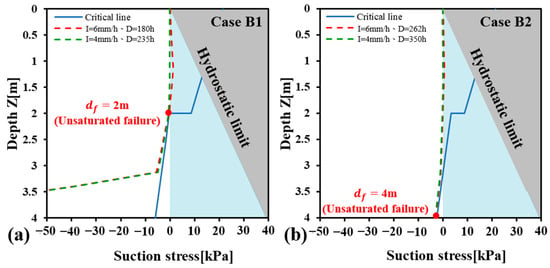
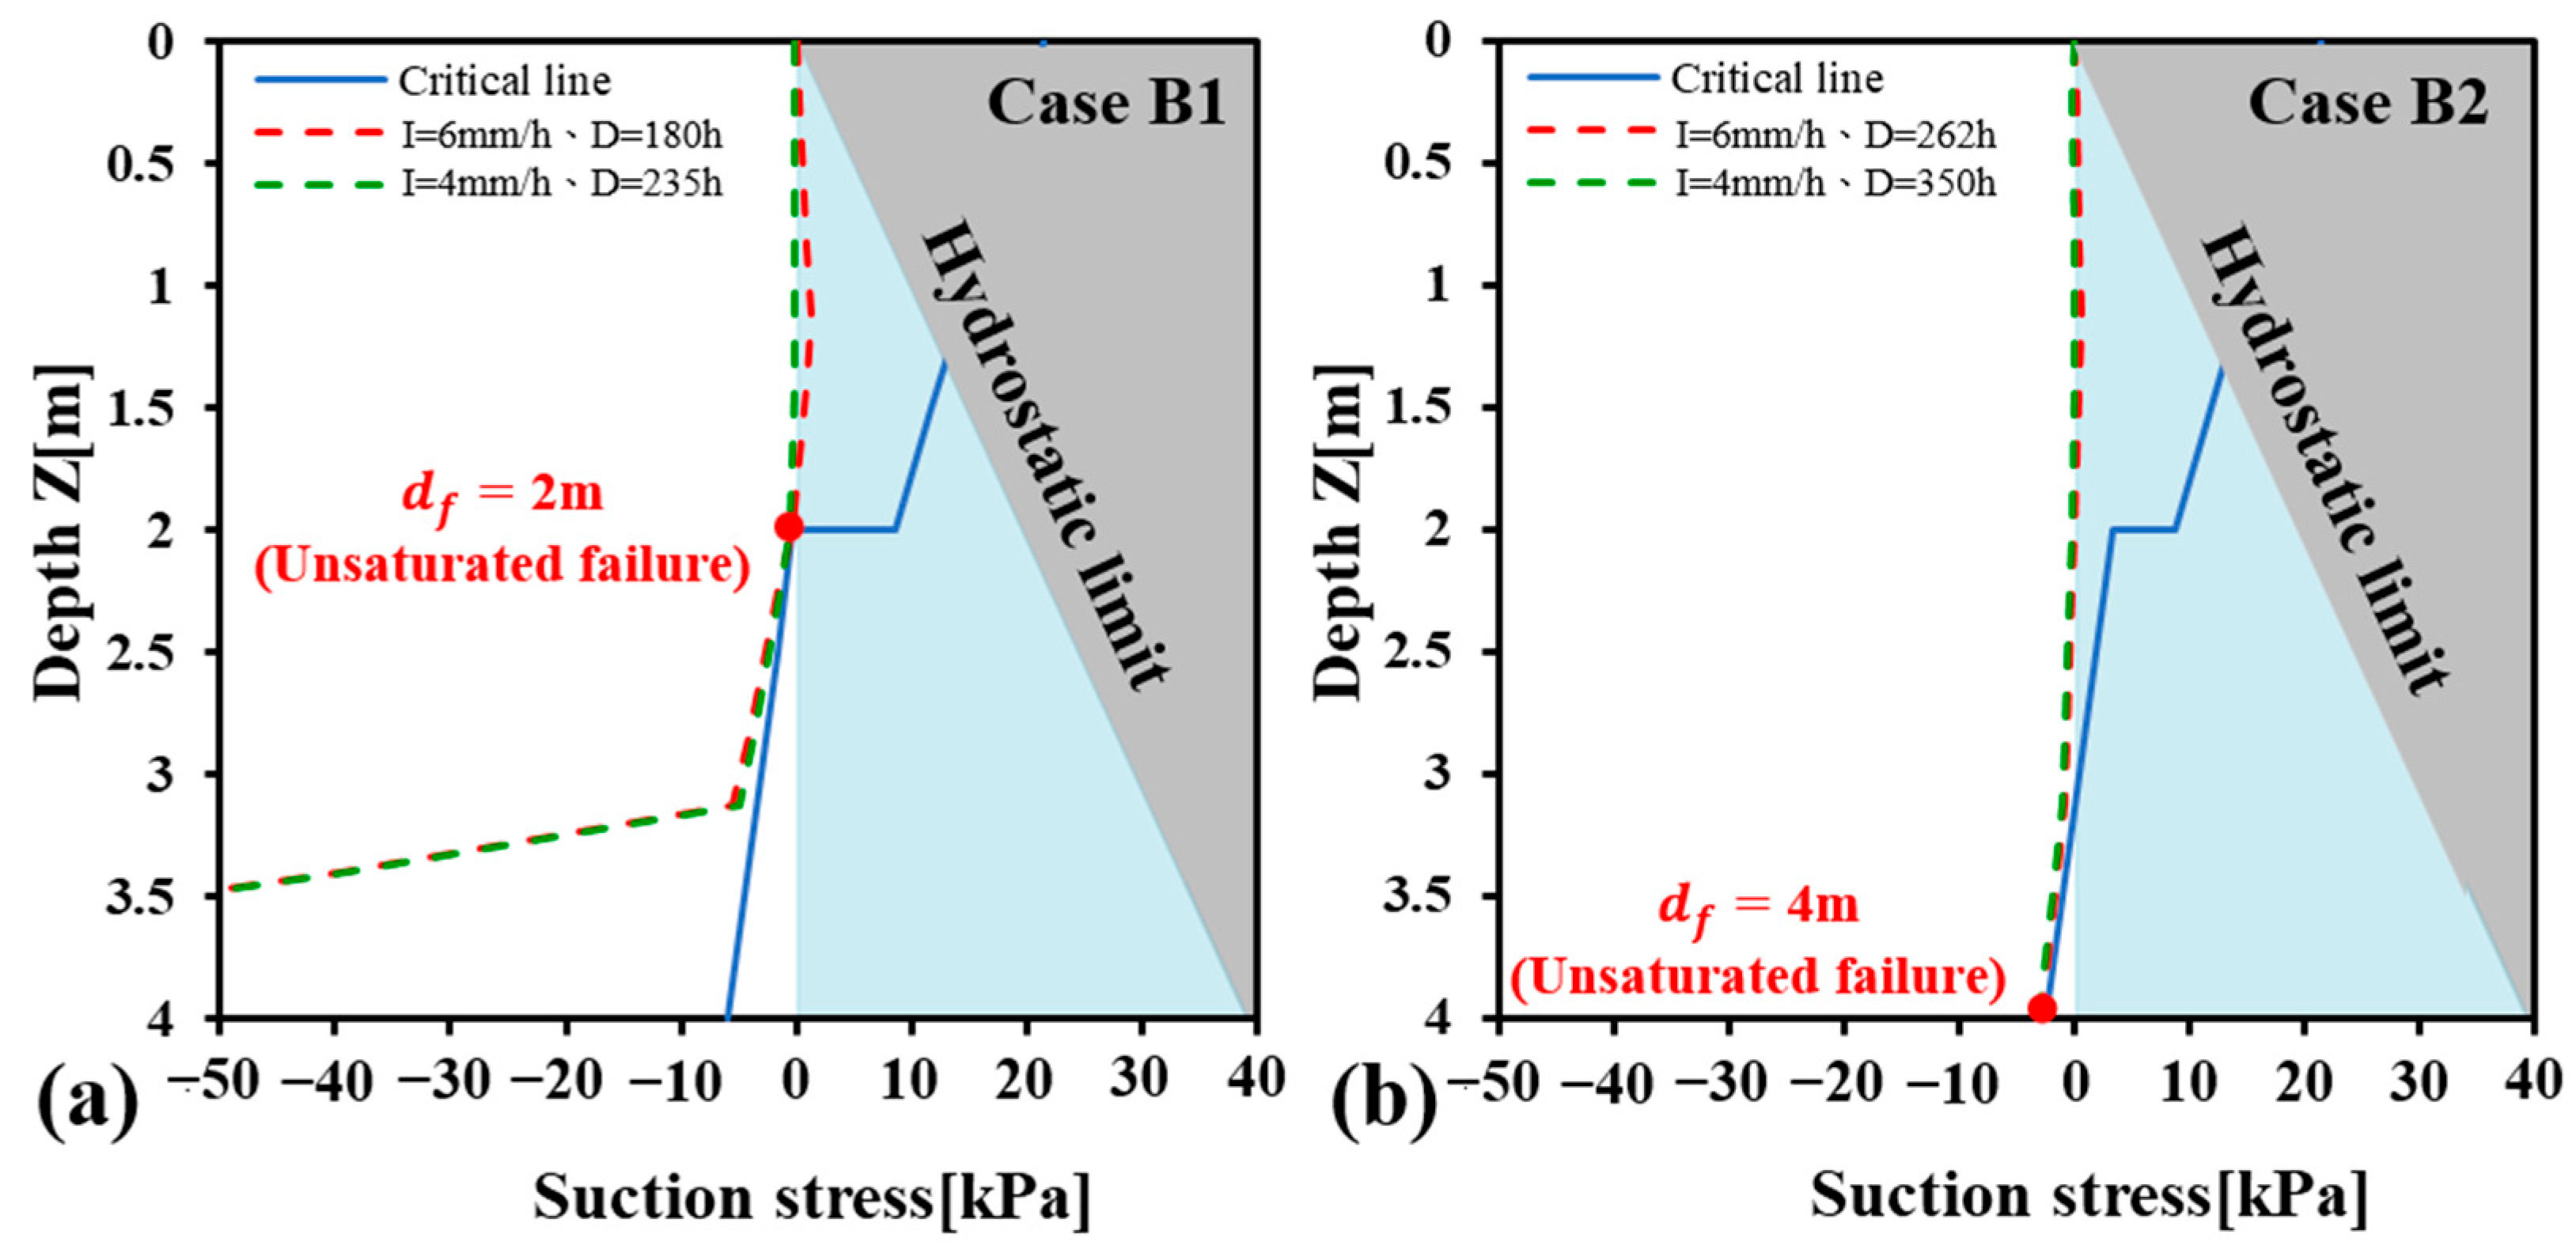
The suction stress–depth profiles of the silt–loam slope under different rainfall intensities are shown in Figure 7. Due to the lower permeability of the upper silt layer, when the rainfall intensity exceeds the permeability of the silt layer, surface runoff is easily generated at the slope surface, removing excess rainfall. At the same time, the higher permeability of the underlying loam layer makes it difficult for moisture to accumulate at the layer interface, which is unfavorable for the development of pore water pressure. As a result, when interlayer failure is governed by suction stress, the slip surface tends to develop along the soil layer interface. When interlayer failure is governed by pore water pressure, failure develops from the bottom of the loam layer. This indicates that under a permeability configuration increasing with depth, the failure depth does not change with increasing rainfall intensity, and the failure mechanism is primarily controlled by the hydraulic properties of the soil layers.
Figure 7.
Suction stress distribution in a silt–loam slope under different rainfall intensities: (a) case B1 (b) case B2.
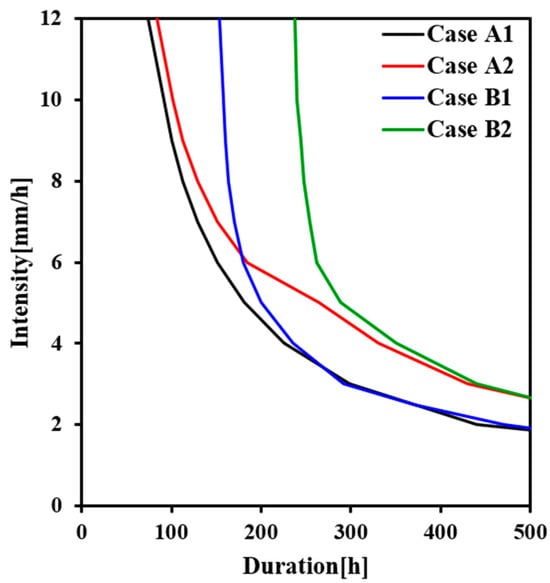
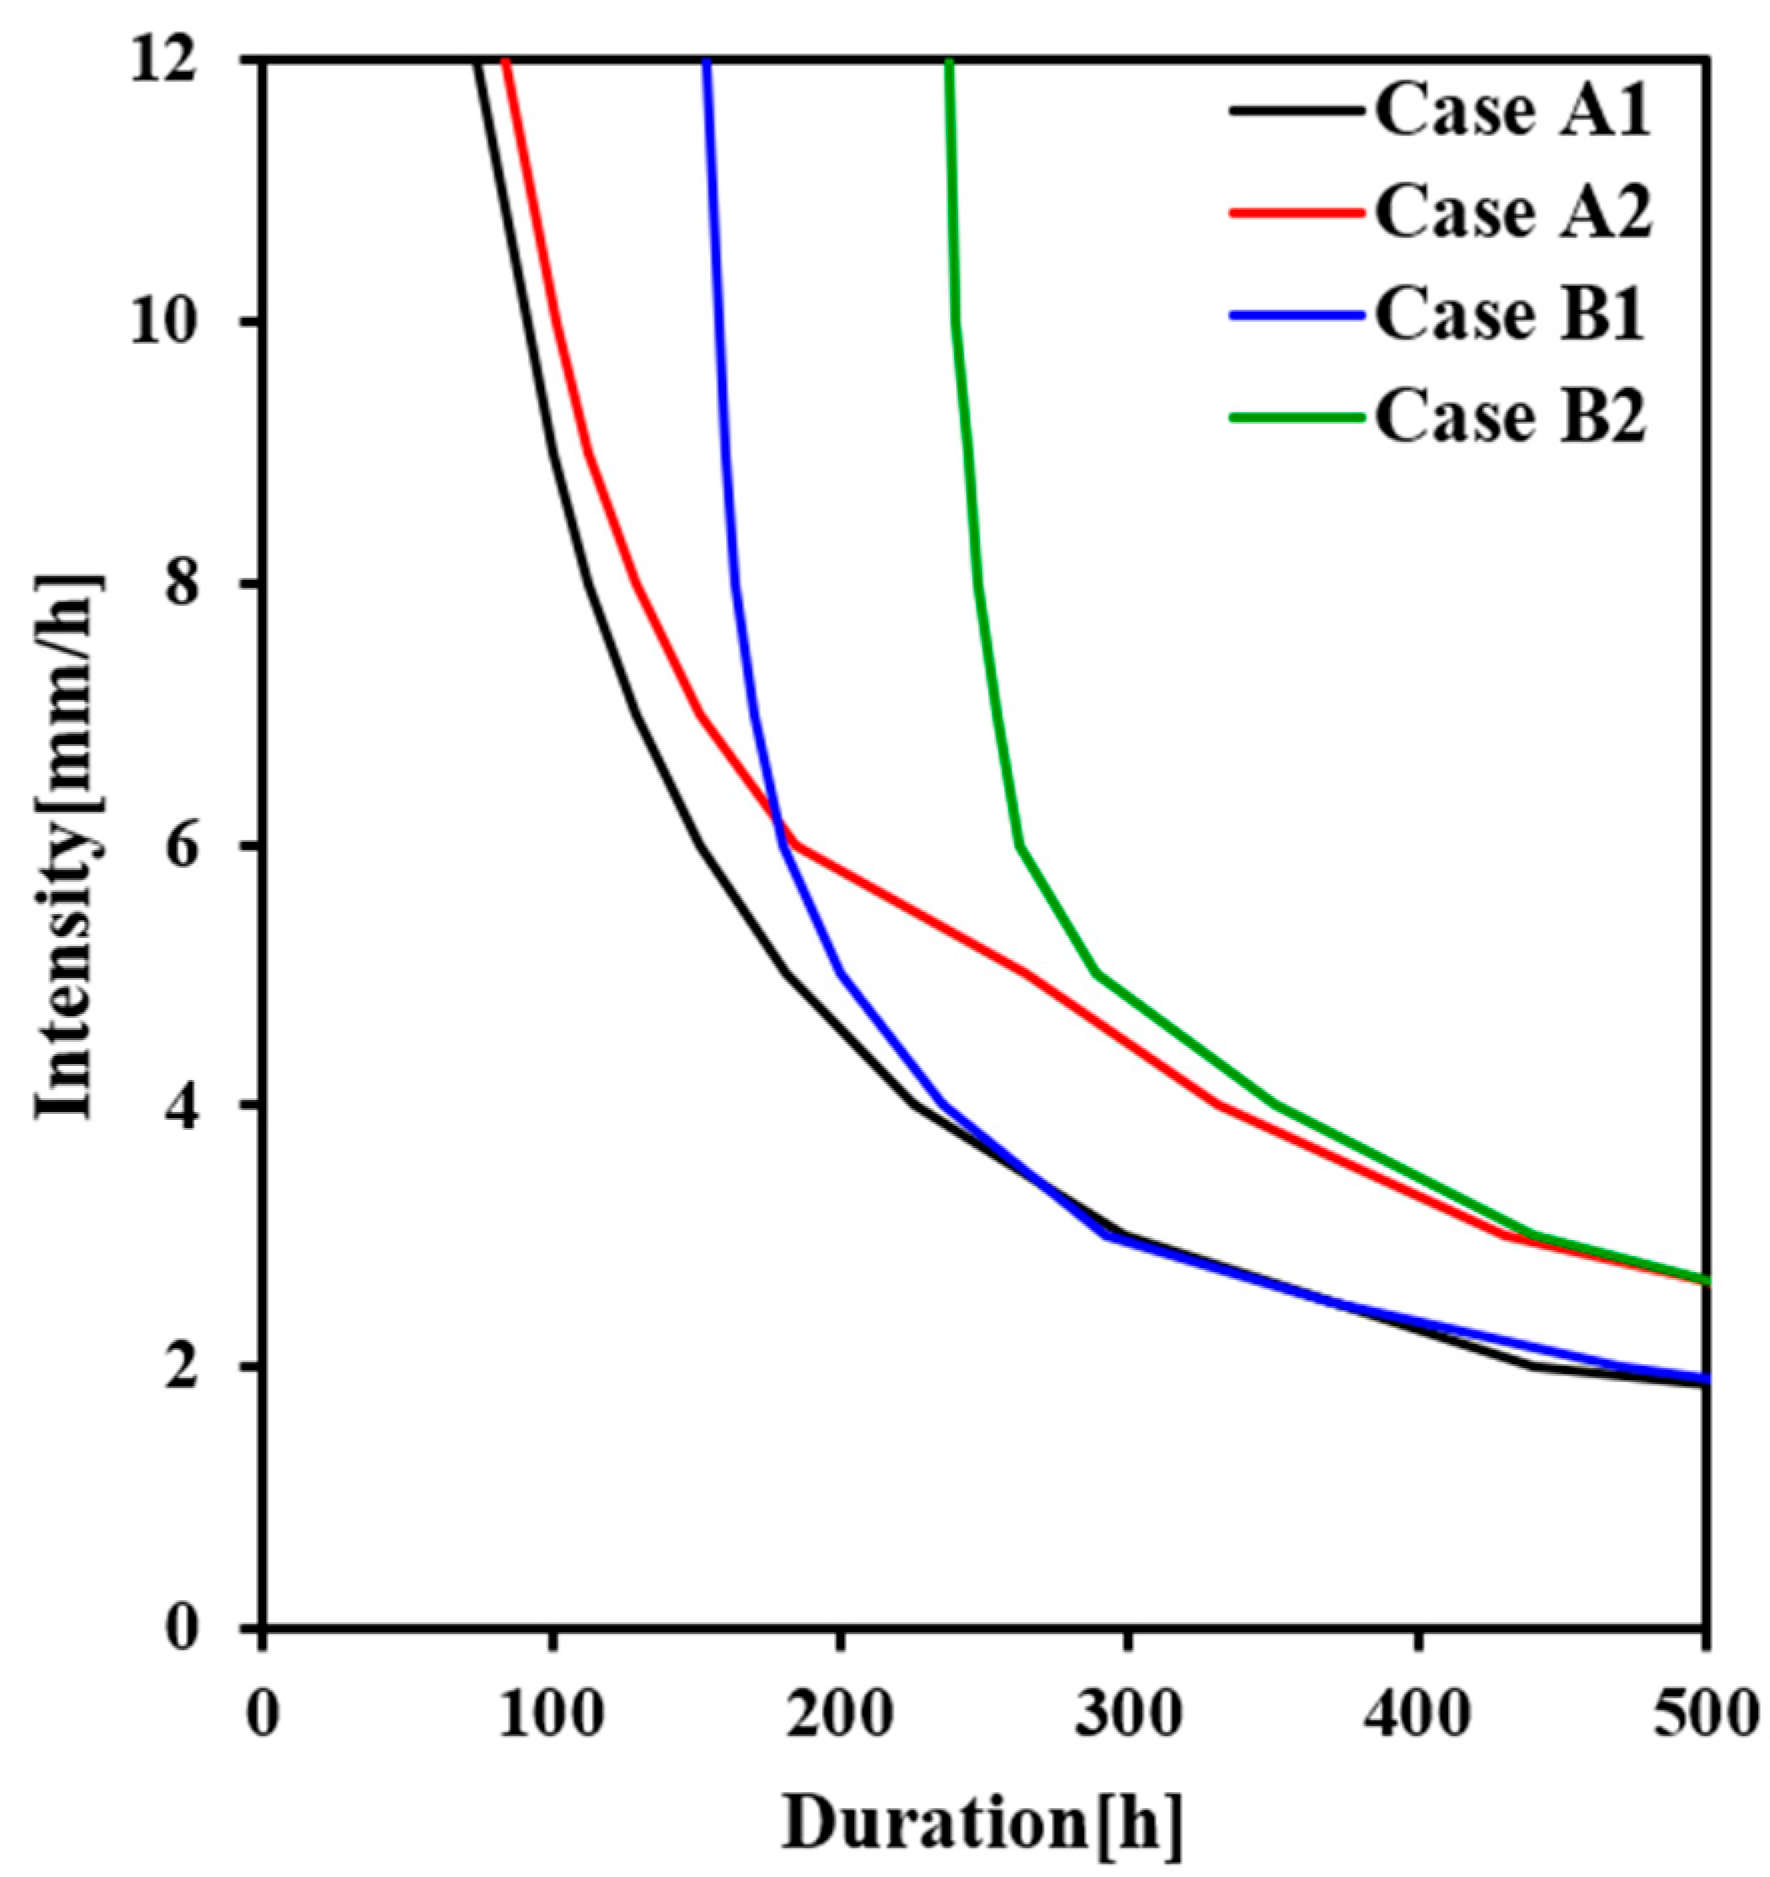
The results indicate that only the failure depth of the case A2 curve varies with rainfall intensity, demonstrating that changes in failure depth depend on whether the infiltration behavior of the wetting front can satisfy the failure condition at the soil layer interface. The rainfall intensity–duration (I–D) threshold curves for slopes under different soil layer configurations are shown in Figure 8. The distributions of the curves under different scenarios exhibit clear differences, reflecting that rainfall thresholds in two-layer slopes are significantly influenced by failure depth and failure mechanisms. Under high rainfall intensity conditions, the case A2 curve gradually converges with the case A1 curve of the same soil configuration, indicating that failure primarily occurs at the soil layer interface, where the rainfall intensity is sufficient to satisfy the interlayer failure condition.
Figure 8.
Rainfall threshold curve distributions under different soil layer configurations and interlayer failure conditions.
In contrast, when rainfall intensity decreases to approximately 6 mm/h or lower, the case A2 curve converges with the case B2 curve, indicating that the rainfall intensity is no longer sufficient to satisfy the interlayer failure condition, and the failure depth shifts downward to a deeper location. When the failure depth of the case A2 curve exceeds that of case B1, it exhibits higher stability, indicating that under two-layer slope conditions, slope stability cannot be adequately characterized solely based on internal soil layer distribution. The distribution of rainfall threshold curves is significantly influenced by failure depth. Therefore, in two-layer slope assessments, early warning systems must account for the physical mechanisms at soil layer interfaces rather than relying only on soil material distribution. Failure to adequately consider the differences in failure conditions associated with various soil layer configurations will result in biased predictions.
This study adopts a rainfall-intensity range of I = 1–12 mm/h for the analysis of the I–D threshold curves; however, this range does not represent the applicability limit of the model. Under high-intensity rainfall conditions with intensities exceeding 12 mm/h and durations shorter than 100 h, the failure durations of Cases A1 and A2 continue to decrease gradually in the high-intensity range, indicating that both cases can still reach the critical failure condition. This behavior is mainly associated with the highly permeable loam surface layer Ks = 28.6 mm/h, which allows greater effective infiltration, promotes rapid downward propagation of the wetting front, and facilitates suction-stress dissipation or pore-water-pressure development.
In contrast, Cases B1 and B2 have a low-permeability silt surface layer Ks = 5.8 mm/h. As rainfall intensity increases, a larger proportion of rainfall is converted into surface runoff, thereby limiting effective infiltration. Consequently, under short-duration, high-intensity rainfall, these cases are less likely to reach the critical failure condition during the rainfall event. If post-rainfall downward percolation and moisture redistribution are further considered, the interlayer suction stress in Case B1 continues to decrease and may lead to failure once the critical suction-stress condition is reached. In contrast, the soil-layer configuration of Case B2 is less favorable for pore-water-pressure accumulation, and the slope therefore remains stable. These results indicate that, under short-duration and high-intensity rainfall conditions, slope stability is still primarily controlled by soil-layer permeability configuration and actual infiltration behavior.
Traditional I–D thresholds are generally established from historical rainfall and landslide-event data, and bilogarithmic coordinates are commonly used to fit empirical relationships. In contrast, the I–D thresholds in this study are not derived from regression of historical event data. Instead, numerical simulations are used to directly determine the rainfall duration required for the slope to reach the critical failure condition under different rainfall intensities. Linear coordinates are adopted in this study mainly to directly illustrate the critical failure duration, curve transitions, and relative positional differences among the different cases. These transitions are associated with changes in failure depth and interlayer failure mechanisms and therefore have physical significance. By comparison, transforming the results to bilogarithmic coordinates and further fitting them with straight lines may weaken these differences. It should be emphasized that the use of linear or bilogarithmic coordinates affects only the graphical presentation and does not alter the critical I–D conditions obtained from the numerical simulations.
3.2. Effects of Rainfall Temporal Patterns on Slope Stability
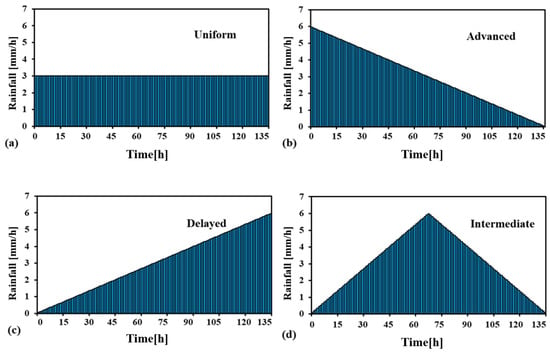
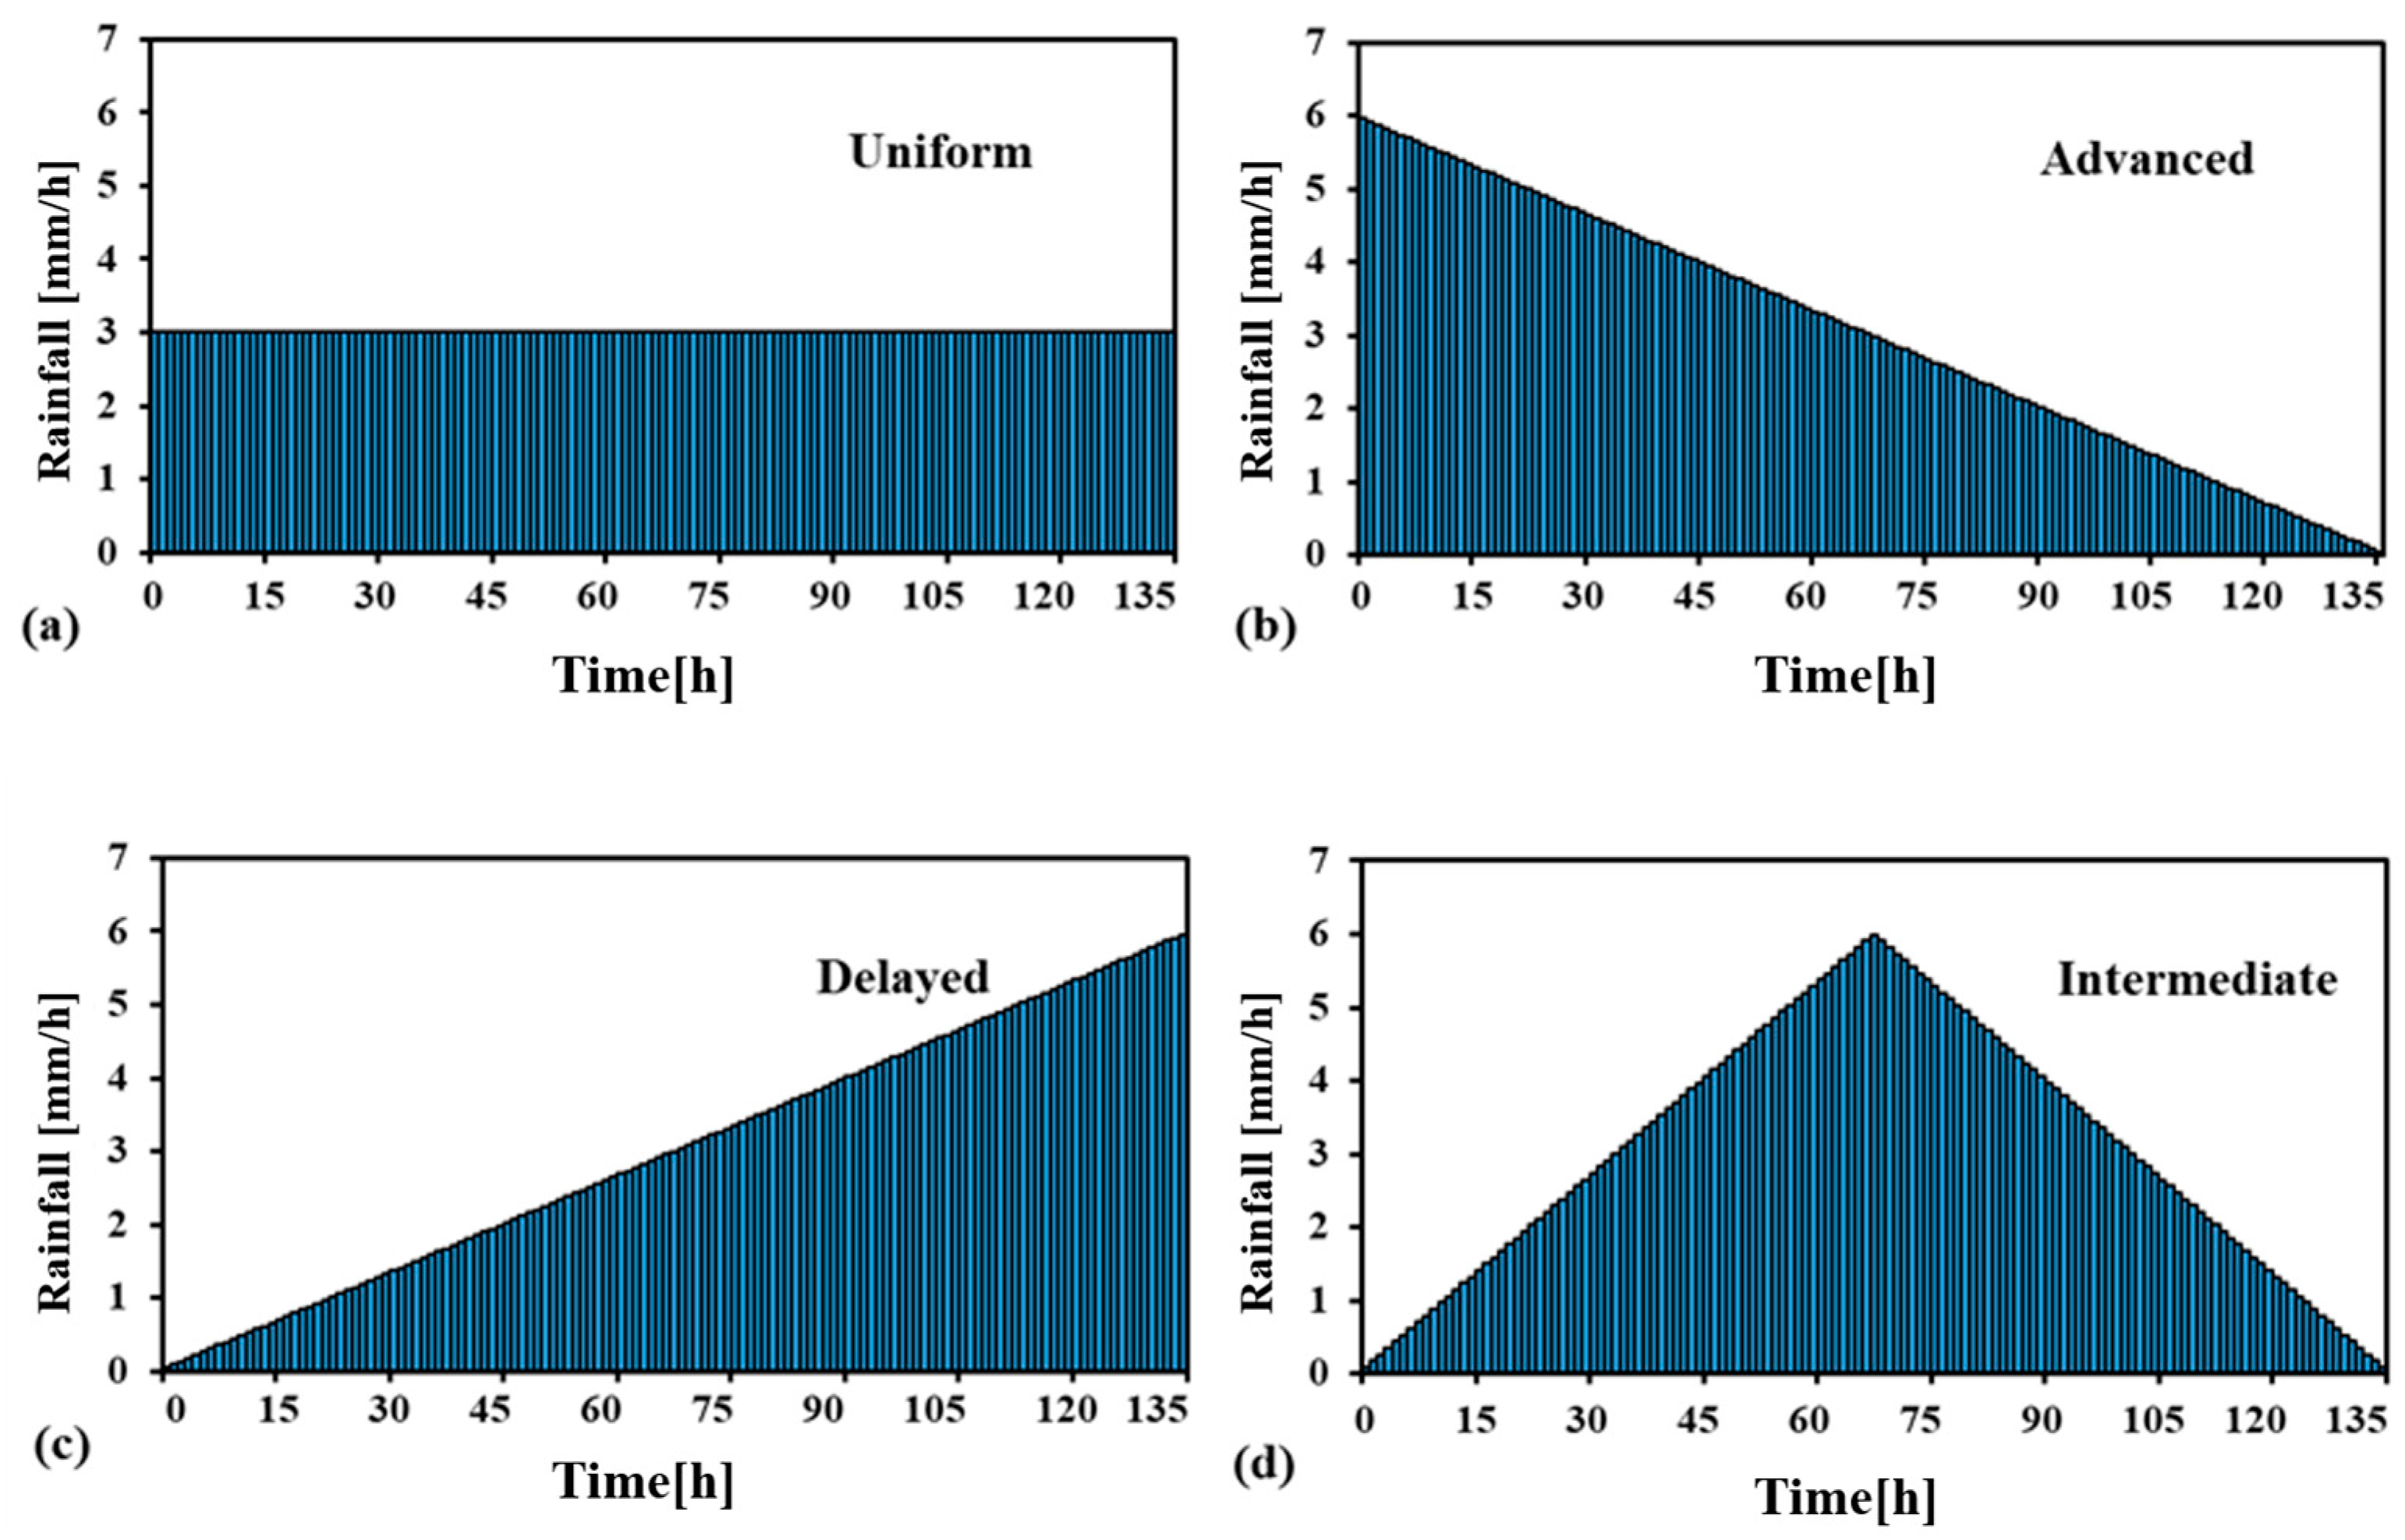
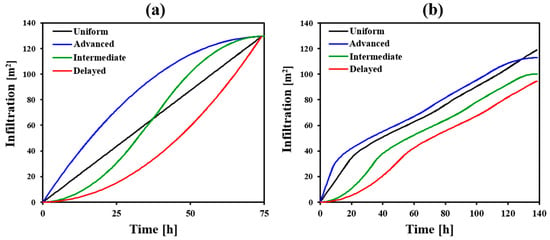
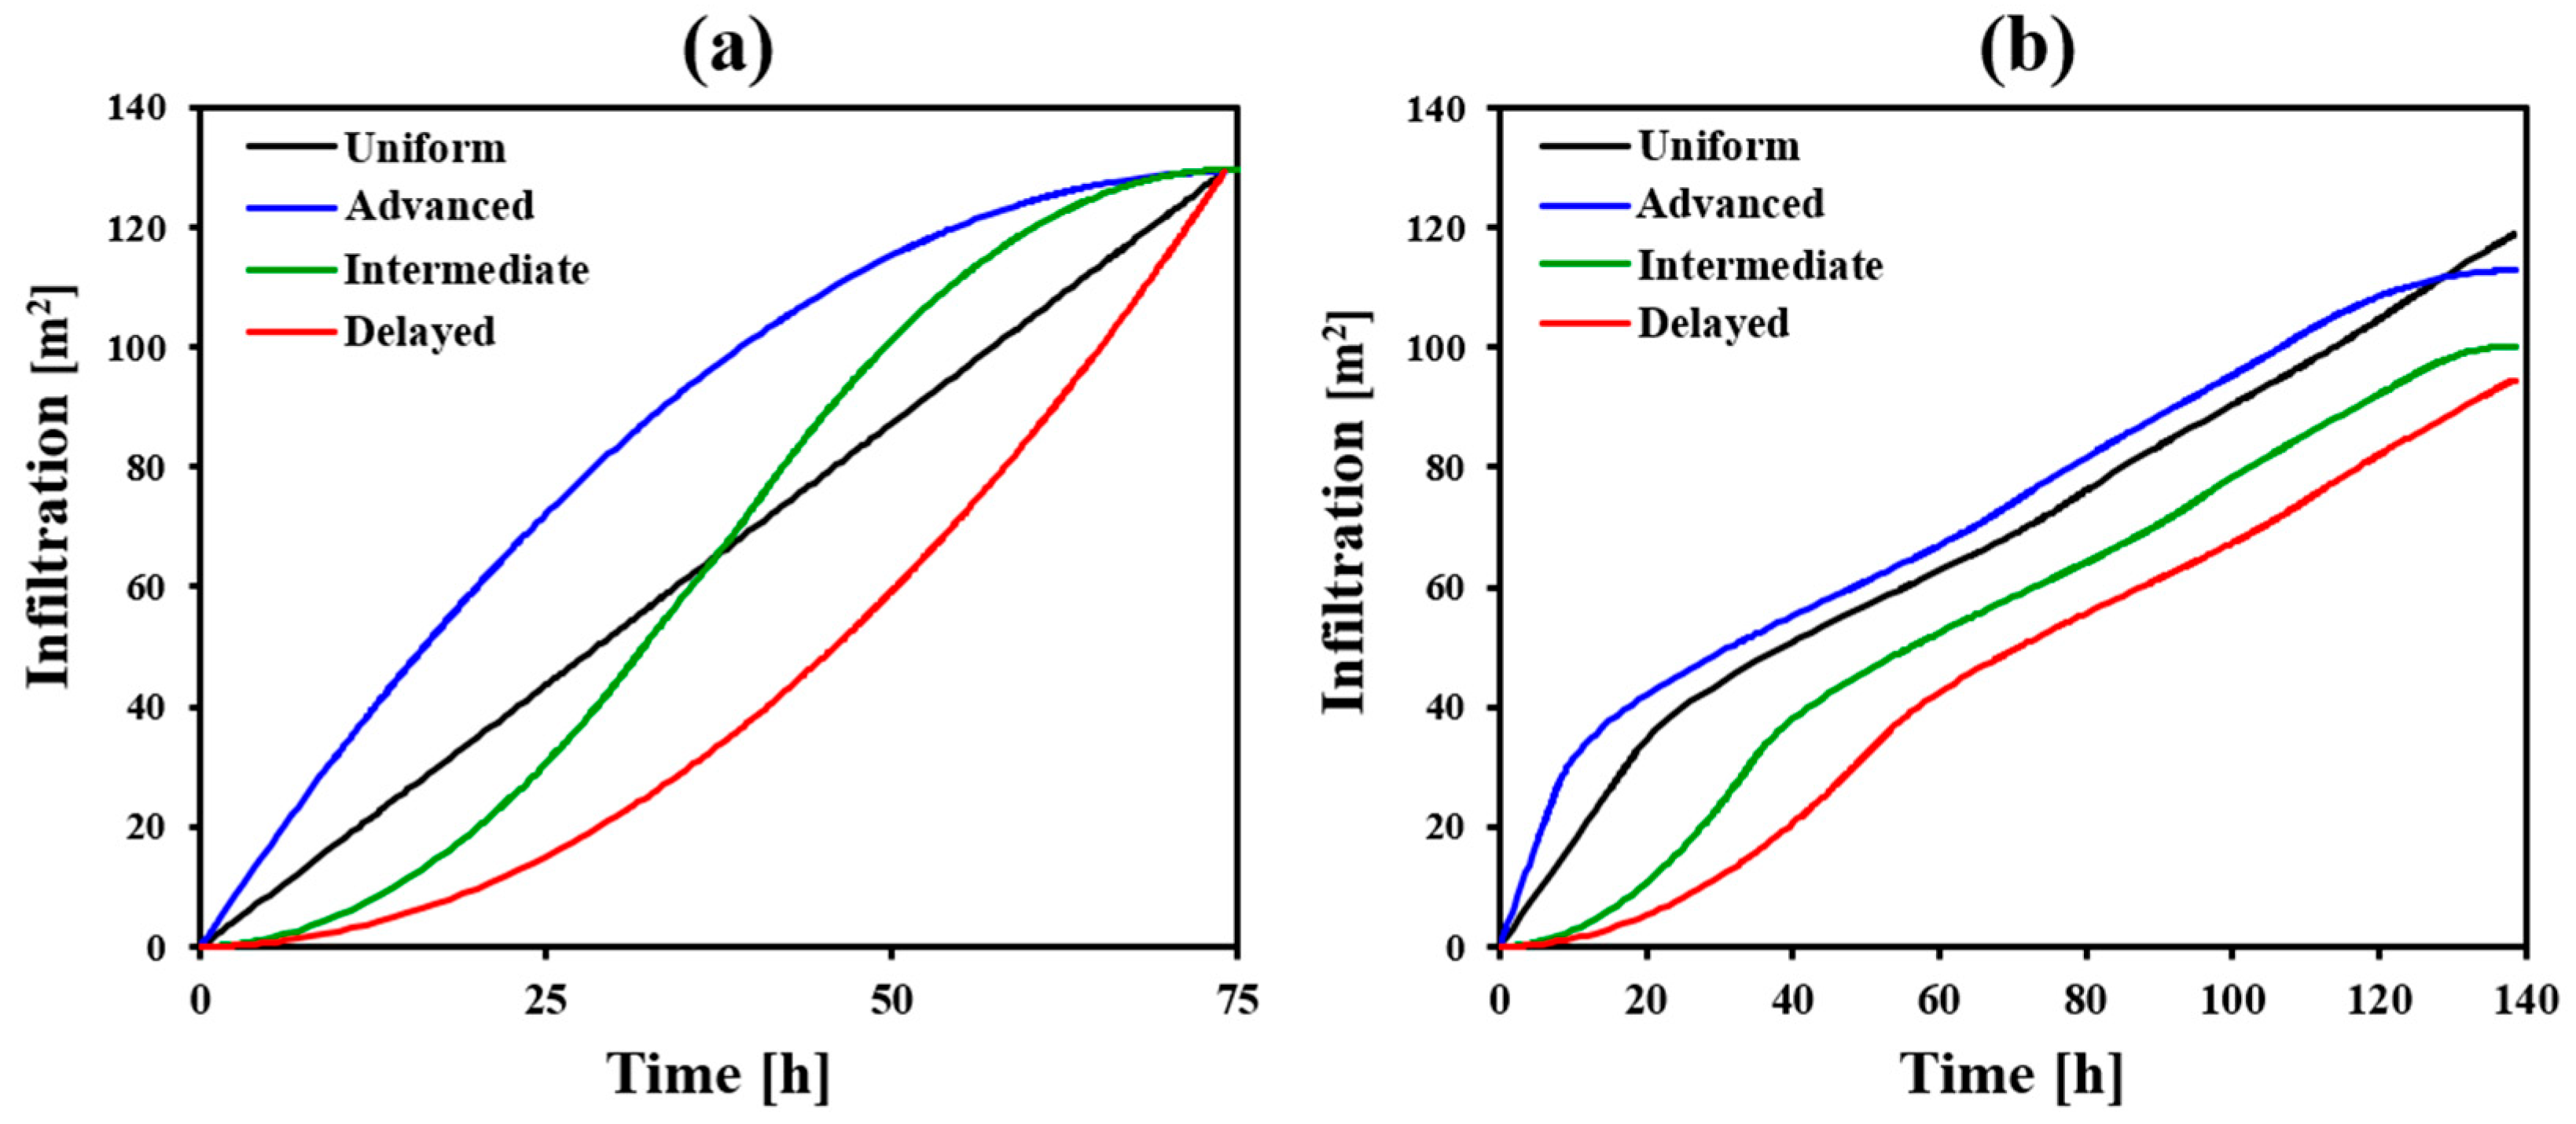
In this study, rainfall thresholds established under uniform rainfall conditions serve as the baseline. Non-uniform rainfall patterns (advanced, intermediate, and delayed) are incorporated into two-layer slope analyses to investigate their effects on infiltration behavior and rainfall threshold relationships. The same total rainfall amount and rainfall duration were maintained for all rainfall patterns, while the temporal distribution of rainfall intensity was varied. For the non-uniform rainfall patterns, the peak rainfall intensity was set to twice the event-average rainfall intensity. The advanced pattern reaches its peak intensity at the beginning of the rainfall event and then decreases linearly with time; the delayed pattern increases linearly and reaches its peak at the end of the event; and the intermediate pattern reaches its peak at the midpoint of the rainfall duration, as shown in Figure 9. The model itself is not restricted to these four rainfall patterns. As long as the rainfall history is prescribed as a time-varying upper-boundary flux, other temporal rainfall distributions, including actual rainfall histories, can also be simulated. In addition, the study design considers two typical hydrological response scenarios—full infiltration and partial infiltration—by configuring different soil layer arrangements to represent natural rainfall infiltration processes. Taking a rainfall intensity of I = 12 mm/h as an example, the loam–silt slope represents a full infiltration scenario (upper layer Ks = 28.6 mm/h), in which the cumulative infiltration under the four rainfall patterns converges at the end of rainfall. In contrast, the silt–loam slope represents a partial infiltration scenario (upper layer Ks = 5.8 mm/h), where most rainfall is converted into surface runoff, reducing infiltration. The ranking of cumulative infiltration is uniform > advanced > intermediate > delayed, as shown in Figure 10.
Figure 9.
Temporal distributions of the four rainfall patterns: (a) uniform, (b) advanced, (c) delayed, and (d) intermediate.
Figure 10.
Cumulative infiltration over rainfall duration: (a) loam–silt slope and (b) silt–loam slope.
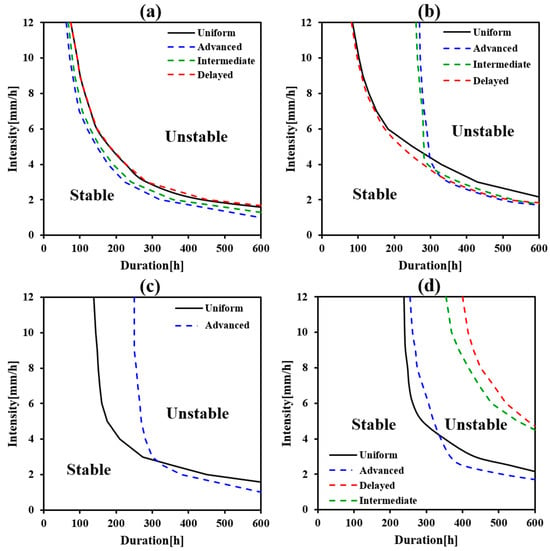
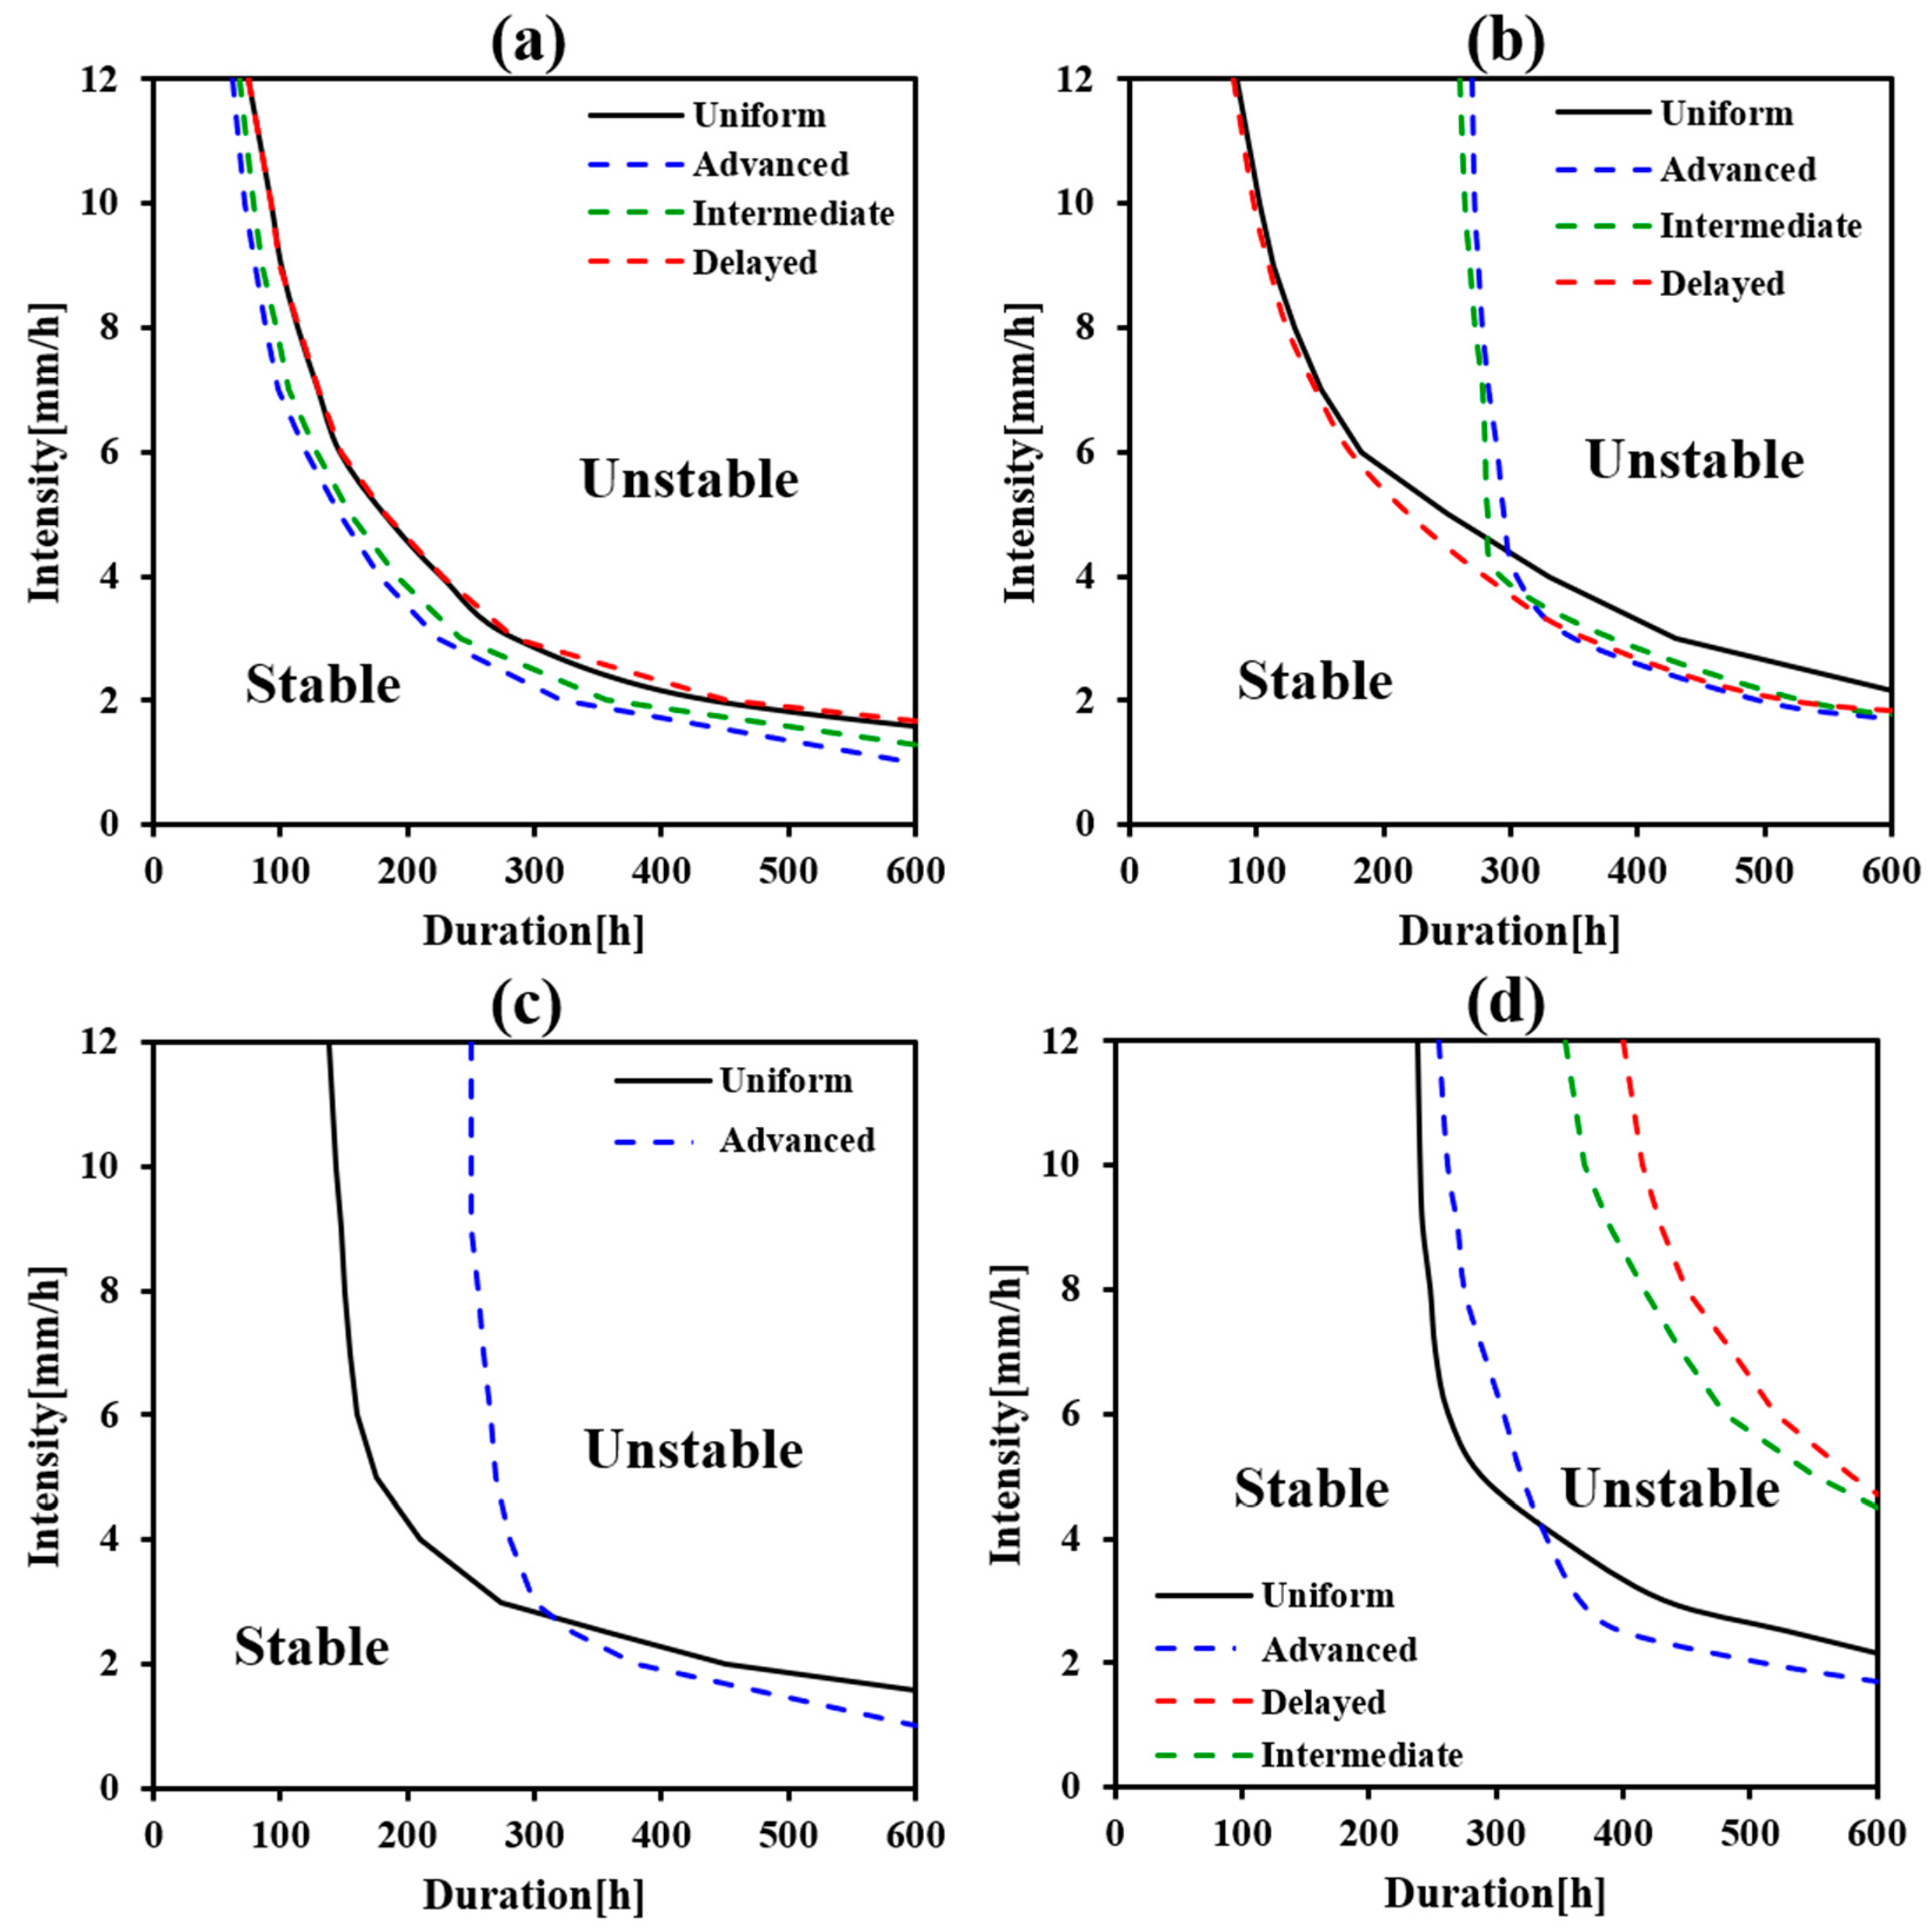
The distribution of rainfall threshold curves for two-layer slopes under different rainfall patterns is shown in Figure 11. Cases A and cases B correspond to the full infiltration and partial infiltration scenarios, respectively. In the loam–silt slope, the lower soil layer has lower permeability, which facilitates moisture accumulation at the layer interface and promotes the development of pore water pressure. As a result, the infiltration behavior under different rainfall patterns exhibits significant differences at the interface. When interlayer failure is governed by suction stress, as shown in case A1, the advanced rainfall pattern, due to its higher rainfall intensity in the early stage, accelerates the propagation of the wetting front and promotes a rapid decrease in suction stress, resulting in earlier failure. The delayed rainfall pattern requires a longer time for infiltration, leading to delayed failure, while the intermediate rainfall pattern lies between the two. When interlayer failure is governed by pore water pressure, as shown in case A2, the advanced rainfall pattern causes the wetting front to rapidly pass through the soil layer interface, which is unfavorable for pore water pressure accumulation and instead results in delayed failure.
Figure 11.
Distribution of I–D curves for two-layer slopes under different rainfall patterns: (a) case A1, (b) case A2, (c) case B1, and (d) case B2.
The intermediate rainfall pattern shows a similar trend and also leads to delayed failure. In contrast, the delayed rainfall pattern, with rainfall intensity concentrated in the later stage, is favorable for moisture accumulation at the interface and the development of pore water pressure and reaches the failure condition earlier than the uniform rainfall pattern. On the other hand, under partial infiltration conditions in the silt–loam slope, the lower permeability of the upper soil layer causes most rainfall to be converted into surface runoff, thereby limiting infiltration and consequently altering the influence of rainfall patterns on slope stability.
When interlayer failure is governed by suction stress, as shown in case B1, the intermediate and delayed rainfall patterns cannot reduce suction stress to the critical failure value due to insufficient infiltrated rainfall, and therefore no corresponding rainfall threshold curves can be established. The advanced rainfall pattern, in most cases (I > Ks), results in increased runoff due to excessive rainfall intensity and thus leads to delayed failure. A similar phenomenon is observed under pore water pressure–controlled conditions, as shown in case B2. The advanced rainfall pattern still results in delayed failure, while the intermediate and delayed rainfall patterns require higher cumulative rainfall to promote moisture accumulation and to establish corresponding rainfall threshold curves.
3.3. Adjustment Analysis of the Two-Layer Slope Early Warning System Under Antecedent Rainfall Conditions
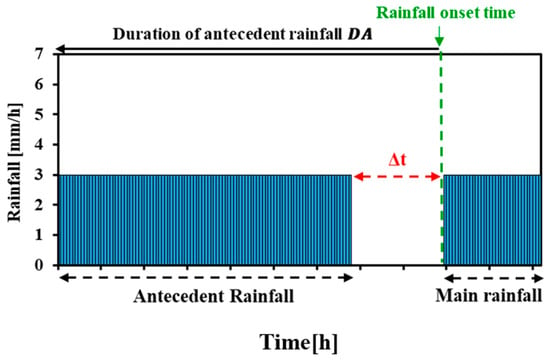
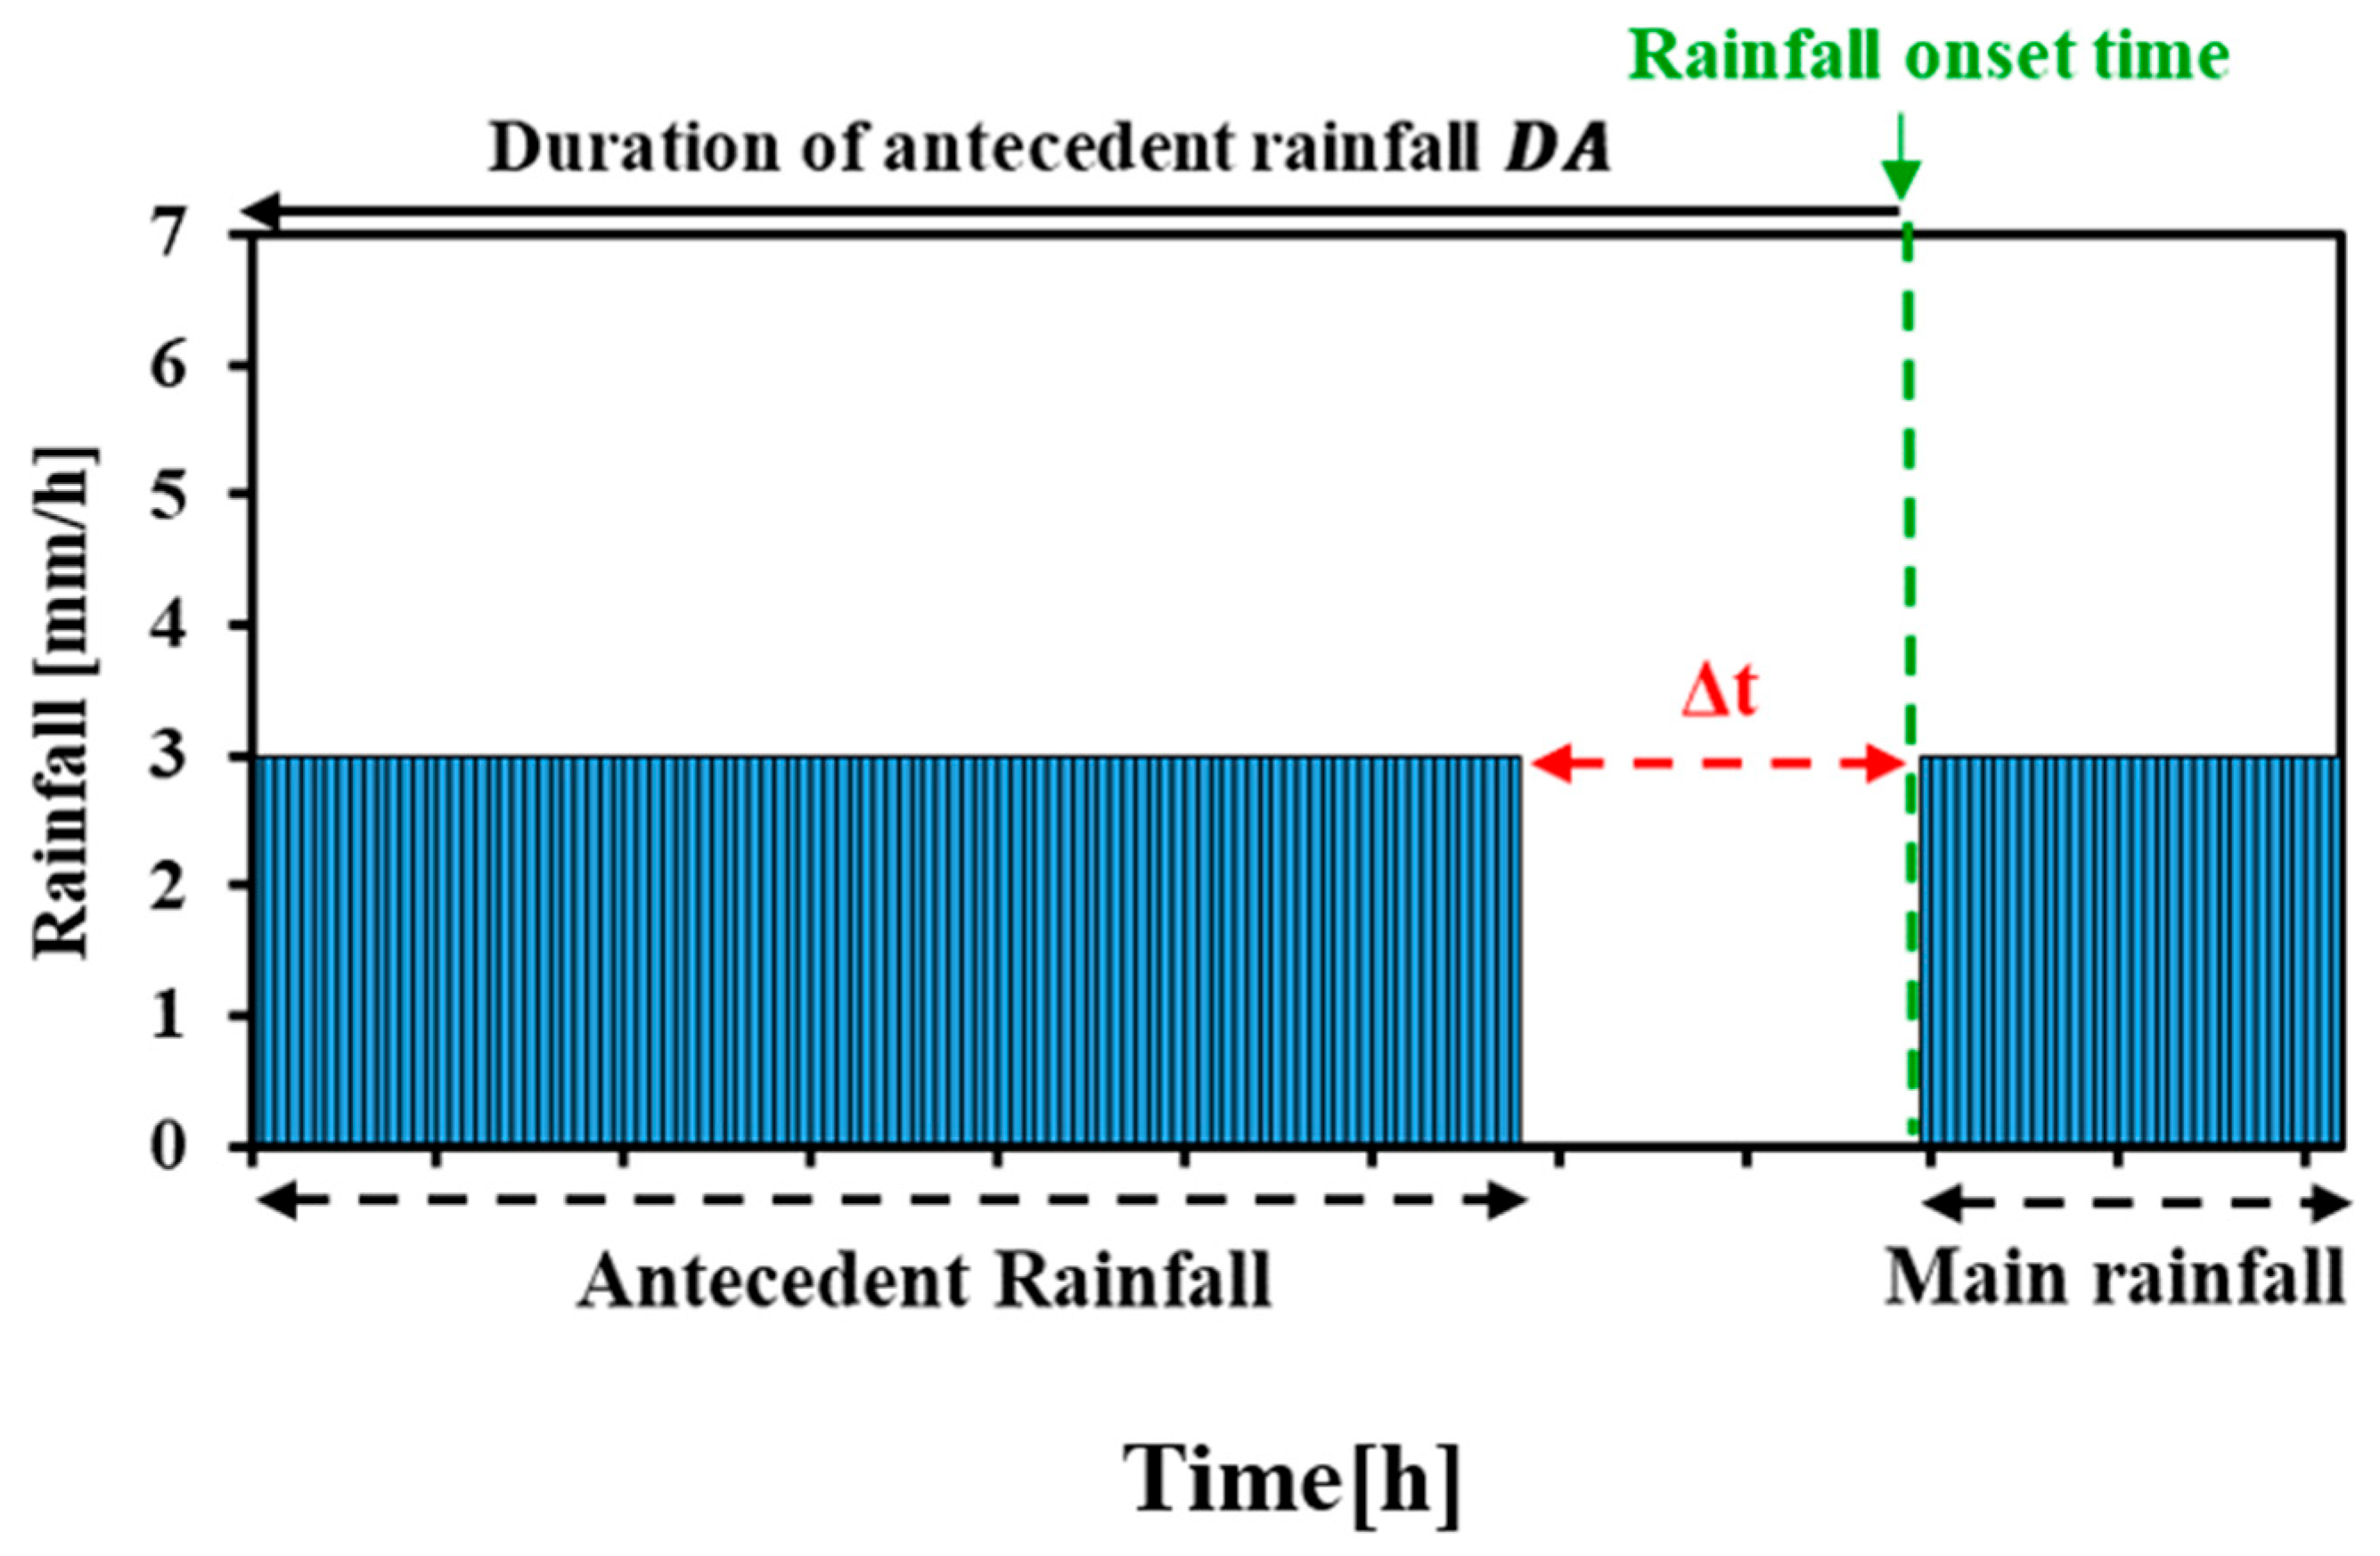
In continuous rainfall events, antecedent rainfall alters the initial moisture conditions within the slope, thereby causing prediction errors in the early warning system. In this study, intermittent rainfall events are designed across different cases to simulate the performance of the early warning system under continuous observational data and to analyze the effect of moisture redistribution caused by antecedent rainfall during no-rain periods on interlayer failure conditions. Furthermore, necessary adjustments and modifications for the practical application of the current early warning system are proposed. The intermittent rainfall event is illustrated in Figure 12.
Figure 12.
Schematic illustration of an intermittent rainfall event. (Rainfall intensity was set to I = 6 mm/h with an antecedent-to-main rainfall duration ratio of 3:1. The no-rain interval Δt was set to 72, 120, 240, and 360 h).
In this study, a uniform rainfall with an intensity of I = 6 mm/h is divided into antecedent rainfall and subsequent rainfall in a 3:1 ratio. The antecedent rainfall is used to wet the slope and modify its initial moisture condition, while the subsequent rainfall serves as the triggering factor for slope failure. Because the critical failure duration at I = 6 mm/h differs among Cases A1, A2, B1, and B2, the corresponding durations of antecedent and subsequent rainfall also vary among the cases. Therefore, Figure 12 is intended to illustrate the relative temporal arrangement of the rainfall phases rather than a common fixed time scale. A no-rain interval Δt with different time scales is introduced between the two rainfall phases, with durations of 72, 120, 240, and 360 h, respectively. These time scales are selected with reference to the ranges commonly used in previous studies to evaluate antecedent rainfall effects. This setup is used to simulate the dissipation of antecedent rainfall effects during no-rain periods and to examine how different moisture redistribution scenarios influence interlayer failure conditions and the determination of rainfall threshold curves. In addition, the appropriate Δt for separating two consecutive rainfall events is not a fixed value but is controlled by factors such as soil hydraulic properties, soil-layer configuration, initial moisture conditions, and drainage conditions. Therefore, a single fixed time threshold is unlikely to be applicable to all sites. Accordingly, this study does not attempt to establish a universal Δt criterion for multilayered slopes. Instead, in future practical early warning applications, Δt should be regarded as a parameter that requires further calibration according to site-specific hydrological and geological conditions.
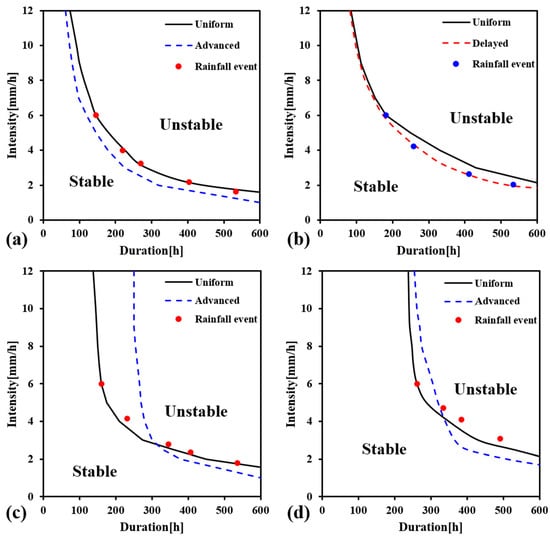
In this study, the early warning system adopts the uniform rainfall threshold curve as the basis for evaluating slope stability. To assess its applicability to two-layer slopes, intermittent rainfall simulations are conducted to account for the effects of antecedent rainfall and moisture redistribution based on the antecedent rainfall events defined in Figure 12 and to examine the predictive performance of the rainfall threshold curves. The simulation results of intermittent rainfall for two-layer slopes are shown in Figure 13. When interlayer failure is governed by suction stress, the intermittent rainfall event points are distributed along the uniform rainfall threshold curve without any noticeable shift, as shown in cases A1 and B1. This result indicates that although antecedent rainfall alters the initial moisture condition of the slope, the failure mechanism at the soil layer interface remains controlled by suction stress dissipation. Consequently, moisture redistribution during no-rain periods does not alter the interlayer failure conditions. Therefore, the failure criterion can still be determined using the uniform rainfall threshold curve, with the advanced rainfall threshold curve adopted for early warning purposes.
Figure 13.
Prediction results of two-layer slopes under different rainfall intervals: (a) case A1, (b) case A2, (c) case B1, and (d) case B2 (The data points represent the antecedent rainfall events defined in Figure 12, corresponding to Δt = 0, 72, 120, 240, 360 h, respectively).
In contrast, when interlayer failure is governed by pore water pressure, the distribution of intermittent rainfall event points exhibits a pronounced shift. In the loam–silt slope, the event points tend to align with the delayed rainfall threshold curve and deviate from the original uniform threshold curve, as shown in case A2. This result indicates that moisture redistribution during no-rain periods induced by antecedent rainfall alters the development of pore water pressure near the soil layer interface, causing failure to occur earlier than originally predicted. Therefore, under this condition, using the uniform rainfall threshold curve as the evaluation criterion would underestimate the actual failure risk.
Instead, the delayed rainfall threshold curve should be adopted as a more appropriate basis for early warning. In the silt–loam slope, intermittent rainfall event points are primarily distributed near the uniform rainfall threshold curve; however, as the duration of the no-rain period increases, the distance between the event points and the uniform curve gradually expands, as shown in case B2. This indicates that the influence of antecedent rainfall on the slope moisture condition accumulates over time, thereby reducing the predictive capability of the early warning system for two-layer slopes. Therefore, the early warning system should enhance its sensitivity to potential failure by appropriately reducing the factor of safety.
3.4. Adjustment Procedure for Practical Application of the Early Warning System
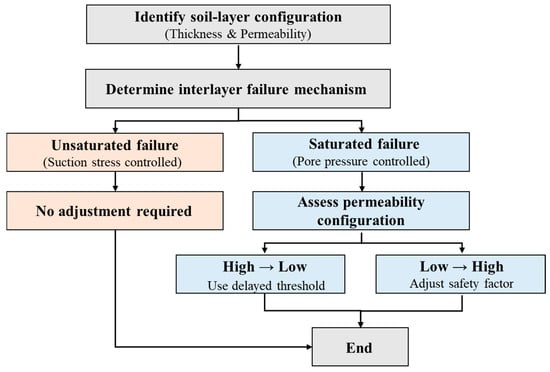
Based on the aforementioned analysis results of two-layer slopes under different soil configurations, failure mechanisms, and rainfall patterns, traditional rainfall threshold approaches—based on a single rainfall pattern and single-event assumption—lead to prediction biases in two-layer slope conditions. To improve the accuracy and applicability of early warning assessments, this study proposes an adjustment procedure for early warning in two-layer slopes for practical applications, as illustrated in Figure 14.
Figure 14.
Adjustment workflow for the two-layer slope early warning system.
- (1).
- The first step is to investigate the internal soil stratification and permeability configuration of the slope. Since the distribution of rainfall thresholds in two-layer slopes is significantly influenced by interlayer failure mechanisms, failure-controlling conditions cannot be correctly identified without accurate information on layer thickness, material properties, and permeability sequence. Therefore, the initial step in refining the early warning system should involve establishing a subsurface soil structure model through methods such as field drilling, test pits, or geophysical surveys and identifying the corresponding permeability configuration.
- (2).
- The dominant interlayer failure mechanism can be determined using the critical suction stress profile. If the critical suction stress at the soil-layer interface is positive, interlayer water accumulation and the development of positive pore-water pressure are the primary controlling mechanisms; if it is negative, suction stress dissipation is the dominant failure mechanism. When interlayer failure is primarily controlled by suction stress, the ordering of rainfall threshold curves is similar to that of a homogeneous slope. In this case, the uniform rainfall threshold curve can be adopted as the primary criterion, while the advanced rainfall pattern can be used as a more conservative basis for early warning. Under these conditions, the influence of antecedent rainfall on interlayer failure is relatively limited, and intermittent rainfall does not cause significant shifts in the threshold curves; therefore, no additional correction is required.
- (3).
- If interlayer failure is governed by pore water pressure, the rainfall threshold should be adjusted according to the permeability configuration of the soil layers. When permeability decreases with depth (case A2), pore water pressure tends to accumulate at the layer interface, and the ordering of rainfall threshold curves with respect to rainfall patterns is reversed compared to other cases. In this situation, the delayed rainfall pattern should be adopted as the primary criterion. When permeability increases with depth (case B2), the layer interface is unfavorable for pore water pressure accumulation, and the rainfall pattern ordering is similar to that of a homogeneous slope. However, antecedent rainfall reduces the prediction accuracy of the rainfall threshold curves; therefore, the factor of safety associated with the rainfall threshold should be adjusted to enhance the sensitivity of the early warning system.
This study shows that rainfall thresholds in two-layer slopes are primarily controlled by interlayer failure conditions, rather than being a simple extension of homogeneous assumptions. Therefore, early warning systems should shift from material-based classification to mechanism-based identification to reduce misclassification risk and improve prediction reliability.
4. Limitations and Suggestions
This study adopts an idealized two-layer slope model with several simplifying assumptions. These simplifications facilitate a clear comparison of the effects of different soil-layer configurations and interlayer failure mechanisms, but they also imply that some of the complexities present in natural slopes are not fully represented and may therefore be considered in future studies.
First, the soil-layer interface in the model is treated as a distinct boundary with negligible thickness. However, natural slopes may contain finite-thickness transition zones and different grain-size configurations. Such transition zones may affect rainfall infiltration, pore-water pressure development, and slope failure [44]. In addition, when a fine-grained soil layer overlies a coarse-grained layer, a capillary barrier effect may develop, thereby altering wetting-front propagation and water accumulation [45]. Future studies may therefore incorporate transition-zone properties, grain-size differences, and capillary barrier effects to improve the representation of interlayer hydraulic behavior.
In addition, the standard van Genuchten hydraulic model adopted in this study is based on the main drying path and a unimodal pore-size distribution. Hydraulic hysteresis and bimodal pore-size distributions may affect rainfall infiltration and the hydro-mechanical behavior of unsaturated slopes [46,47]. Future studies may incorporate these hydraulic characteristics to evaluate their effects on physically based rainfall threshold predictions. This study adopts representative deterministic soil parameters and primarily focuses on the relative changes in I–D threshold curves associated with different soil-layer configurations, interlayer failure mechanisms, and rainfall patterns. Previous studies have indicated that rainfall conditions, as well as the hydraulic and mechanical properties of natural slopes, may exhibit varying degrees of stochasticity and spatial variability, which can in turn affect rainfall infiltration, pore-water-pressure development, failure timing, and slope-failure probability [48,49]. A comprehensive uncertainty or sensitivity analysis covering all hydraulic and mechanical parameters was not conducted in the present study because such an analysis would substantially increase the dimensionality of the problem and generate a large number of additional results, potentially obscuring the interlayer failure mechanisms and threshold-curve variations that constitute the primary focus of this study. Nevertheless, different interfacial critical suction-stress conditions were established through the mechanical parameter settings of Loam 1 and Loam 2 to compare suction-stress-controlled and pore-water-pressure-controlled interlayer failure mechanisms. This comparison also demonstrates how differences in effective cohesion affect the critical conditions and the resulting I–D threshold curves. Future studies may further incorporate random-field, probabilistic, and systematic sensitivity-analysis approaches to evaluate the effects of parameter variability on failure time, failure depth, I–D threshold dispersion, and prediction ranges, thereby improving the robustness and interpretability of the proposed thresholds for practical site applications.
Finally, the present stage of this study focuses on the development of the theoretical methodology and hydro-mechanical coupling mechanisms, while the early-warning adjustment framework remains primarily qualitative. Therefore, dedicated field-monitoring data are not yet available for direct calibration and validation. The development of quantitative early-warning criteria and statistical performance evaluation requires large and complete datasets of rainfall, displacement, and failure events; these aspects are therefore identified as directions for future research.
5. Conclusions
This study develops a rainfall intensity–duration (I–D) threshold analysis method for multilayered slopes by integrating critical suction stress–depth profiles with a modified limit equilibrium method and systematically investigates the effects of soil-layer configuration, interlayer failure mechanisms, and rainfall conditions on slope stability. The results indicate that soil-layer configuration alone is insufficient to fully assess the stability of two-layer slopes; differences in hydraulic properties between soil layers and the resulting failure mechanisms must also be considered. Because the failure depth varies with infiltration behavior and hydraulic conditions, the position and distribution of the rainfall threshold curves also exhibit marked differences. Therefore, applying the homogeneous-slope assumption to early warning assessments of two-layer slopes may lead to biased predictions.
When interlayer failure is governed by pore-water pressure, corresponding to a saturated failure mechanism, rainfall patterns affect the distribution of rainfall intensity–duration (I–D) threshold curves by constraining the development of pore-water pressure. In particular, the delayed infiltration associated with a rear-loaded rainfall pattern promotes water transmission and accumulation at the soil-layer interface, thereby facilitating the development of positive pore-water pressure and causing two-layer slopes to reach the failure condition earlier. These results demonstrate that failure in two-layer slopes is not controlled solely by the properties of an individual soil layer or by total rainfall, but by the combined effects of soil-layer permeability configuration, rainfall temporal distribution, and interlayer failure mechanisms.
In addition, the model developed in this study is not limited to a specific rainfall pattern. As long as the rainfall history can be prescribed as a time-varying upper-boundary flux, different temporal rainfall distributions and actual rainfall histories can be simulated. Four rainfall patterns, including uniform, advanced, intermediate, and delayed patterns, were considered in this study to compare their effects on infiltration, suction stress, and pore-water-pressure responses. The results also show that the critical failure durations of some I–D thresholds mainly occur at approximately 100 h or longer. This behavior is determined by the soil-layer configuration, initial hydrological conditions, and mechanical parameters adopted in this study, rather than by a predefined minimum applicability duration of the model. Therefore, the model is not limited to long-duration rainfall events. In practical applications, the effects of antecedent rainfall and rain-free intervals on the initial moisture condition and moisture redistribution within the slope should also be considered.
Finally, based on the analysis of the early warning system under intermittent rainfall conditions, this study proposes an adjustment framework for early warning strategies applicable to multilayered slopes. When failure is governed by suction stress dissipation, the original rainfall threshold criterion can be retained. When failure is governed by pore-water pressure accumulation, the selection of threshold curves and the corresponding assessment criteria should be adjusted according to the soil-layer permeability configuration and rainfall pattern. This framework addresses the limitations of the conventional homogeneous-slope assumption and provides a basis for applying rainfall threshold methods to early warning assessments under complex stratified geological conditions.
Author Contributions
Conceptualization, Y.-S.Y. and J.-K.Y.; methodology, Y.-S.Y.; software, J.-K.Y.; validation, Y.-S.Y. and J.-K.Y.; formal analysis, J.-K.Y.; resources, H.-F.Y.; data curation, Y.-S.Y.; writing—original draft preparation, Y.-S.Y.; writing—review and editing, H.-F.Y.; visualization, J.-K.Y.; supervision, H.-F.Y. All authors have read and agreed to the published version of the manuscript.
Funding
This research received no external funding.
Institutional Review Board Statement
Not applicable.
Informed Consent Statement
Not applicable.
Data Availability Statement
The data presented in this study are available from the corresponding author upon reasonable request.
Conflicts of Interest
The authors declare no conflicts of interest.
Abbreviations
The following abbreviations are used in this manuscript:
| I–D | Intensity–Duration |
| SWRC | Soil-Water Retention Curve |
| SSCC | Suction Stress Characteristic Curve |
| HCF | Hydraulic Conductivity Function |
References
- Cho, S.E. Prediction of shallow landslide by surficial stability analysis considering rainfall infiltration. Eng. Geol. 2017, 231, 126–138. [Google Scholar] [CrossRef] [Scilit]
- Reichenbach, P.; Rossi, M.; Malamud, B.D.; Mihir, M.; Guzzetti, F. A review of statistically-based landslide susceptibility models. Earth-Sci. Rev. 2018, 180, 60–91. [Google Scholar] [CrossRef] [Scilit]
- Segoni, S.; Piciullo, L.; Gariano, S.L. A review of the recent literature on rainfall thresholds for landslide occurrence. Landslides 2018, 15, 1483–1501. [Google Scholar] [CrossRef] [Scilit]
- Sim, K.B.; Lee, M.L.; Wong, S.Y. A review of landslide acceptable risk and tolerable risk. Geoenviron. Disasters 2022, 9, 3. [Google Scholar] [CrossRef] [Scilit]
- Yang, Y.-S.; Yeh, H.-F.; Huang, C.-C.; Chen, H.-Y. Reviews and Syntheses: Promoting the Advancement of Hillslope Hydrology and Stability in Taiwan from the Perspective of Critical Zone Science. Water 2023, 15, 1234. [Google Scholar] [CrossRef] [Scilit]
- Kim, M.S.; Onda, Y.; Kim, J.K.; Kim, S.W. Effect of topography and soil parameterisation representing soil thicknesses on shallow landslide modelling. Quat. Int. 2015, 384, 91–106. [Google Scholar] [CrossRef] [Scilit]
- Peres, D.J.; Cancelliere, A. Estimating return period of landslide triggering by Monte Carlo simulation. J. Hydrol. 2016, 541, 256–271. [Google Scholar] [CrossRef] [Scilit]
- Ye, S.; Liu, L.; Li, J.; Pan, H.; Li, W.; Ran, Q. From rainfall to runoff: The role of soil moisture in a mountainous catchment. J. Hydrol. 2023, 625, 130060. [Google Scholar] [CrossRef] [Scilit]
- Montgomery, D.R.; Dietrich, W.E. A physically based model for the topographic control on shallow landsliding. Water Resour. Res. 1994, 30, 1153–1171. [Google Scholar] [CrossRef] [Scilit]
- Guzzetti, F.; Melillo, M.; Mondini, A.C. Landslide predictions through combined rainfall threshold models. Landslides 2025, 22, 137–147. [Google Scholar] [CrossRef] [Scilit]
- Segoni, S.; Nocentini, N.; Barbadori, F.; Medici, C.; Gatto, A.; Rosi, A.; Casagli, N. A novel prototype national-scale landslide nowcasting system for Italy combining rainfall thresholds and risk indicators. Landslides 2025, 22, 1341–1366. [Google Scholar] [CrossRef] [Scilit]
- Zhao, B.; Marin, R.J.; Luo, W.; Yu, Z.; Yuan, L. Rainfall thresholds for shallow landslides considering rainfall temporal patterns. Bull. Eng. Geol. Environ. 2025, 84, 132. [Google Scholar] [CrossRef] [Scilit]
- Conte, E.; Pugliese, L.; Troncone, A. A simple method for predicting rainfall-induced shallow landslides. J. Geotech. Geoenviron. Eng. 2022, 148, 04022079. [Google Scholar] [CrossRef] [Scilit]
- Lu, N.; Calderon, A.R.A.; Wayllace, A.; Lovekin, J.; Crandall, A. Suction stress-based rainfall intensity-duration method for slope instability prediction. J. Geotech. Geoenviron. Eng. 2024, 150, 04024069. [Google Scholar] [CrossRef] [Scilit]
- do Pinho, T.M.; Augusto Filho, O. Landslide susceptibility mapping using the infinite slope, SHALSTAB, SINMAP, and TRIGRS models in Serra do Mar, Brazil. J. Mt. Sci. 2022, 19, 1018–1036. [Google Scholar] [CrossRef] [Scilit]
- Sachinthaka, R.; Kalatehjari, R.; Brook, M.S. Evolution and critical evaluation of deterministic physically based rainfall-induced landslide susceptibility mapping: A mixed review. Nat. Hazards 2025, 121, 20795–20818. [Google Scholar] [CrossRef] [Scilit]
- Durmaz, M.; Hürlimann, M.; Huvaj, N.; Medina, V. Comparison of different hydrological and stability assumptions for physically-based modeling of shallow landslides. Eng. Geol. 2023, 323, 107237. [Google Scholar] [CrossRef] [Scilit]
- Masoudian, M.S.; Afrapoli, M.A.H.; Tasalloti, A.; Marshall, A.M. A general framework for coupled hydro-mechanical modelling of rainfall-induced instability in unsaturated slopes with multivariate random fields. Comput. Geotech. 2019, 115, 103162. [Google Scholar] [CrossRef] [Scilit]
- Dai, G.; Zhang, F.; Wang, Y. Stability analysis of layered slopes in unsaturated soils. Front. Struct. Civ. Eng. 2022, 16, 378–387. [Google Scholar] [CrossRef] [Scilit]
- Liu, S.; Yuan, Z.; Xiao, Y.; Fang, Q.; Liu, H. Profiles of suction stress of layered soils under infiltration conditions and its applications. Eur. J. Environ. Civ. Eng. 2025, 29, 64–88. [Google Scholar] [CrossRef] [Scilit]
- Damiano, E. Effects of layering on triggering mechanisms of rainfall-induced landslides in unsaturated pyroclastic granular soils. Can. Geotech. J. 2019, 56, 1278–1290. [Google Scholar] [CrossRef] [Scilit]
- Tang, J.; Taro, U.; Huang, D.; Xie, J.; Tao, S. Physical model experiments on water infiltration and failure modes in multi-layered slopes under heavy rainfall. Appl. Sci. 2020, 10, 3458. [Google Scholar] [CrossRef] [Scilit]
- Wu, L.; Huang, R.; Li, H.; Li, X.; Sun, P. The model tests of rainfall infiltration in two-layer unsaturated soil slopes. Eur. J. Environ. Civ. Eng. 2021, 25, 1555–1569. [Google Scholar] [CrossRef] [Scilit]
- Xiong, S.; Yao, W.; Li, C. Stability evaluation of multilayer slopes considering runoff in the saturated zone under rainfall. Eur. J. Environ. Civ. Eng. 2021, 25, 1718–1732. [Google Scholar] [CrossRef] [Scilit]
- Damiano, E.; Greco, R.; Guida, A.; Olivares, L.; Picarelli, L. Investigation on rainwater infiltration into layered shallow covers in pyroclastic soils and its effect on slope stability. Eng. Geol. 2017, 220, 208–218. [Google Scholar] [CrossRef] [Scilit]
- Xu, Y.; Li, J.; Fan, H.; Chen, L.; Zhao, Y.; Li, L. Stability analysis of clastic rock slope with mudstone interlayer under rainfall infiltration. Geotech. Geol. Eng. 2017, 35, 1871–1883. [Google Scholar] [CrossRef] [Scilit]
- Sharma, R.H.; Nakagawa, H. Numerical model and flume experiments of single-and two-layered hillslope flow related to slope failure. Landslides 2010, 7, 425–432. [Google Scholar] [CrossRef] [Scilit]
- Shiqiang, B.; Chen, G.; Meng, X.; Yang, Y.; Wu, J.; Huang, F.; Wu, B.; Jin, J.; Qiao, F.; Chong, Y. Physical model experiment of rainfall-induced instability of a two-layer slope: Implications for early warning. Landslides 2024, 21, 3149–3167. [Google Scholar] [CrossRef] [Scilit]
- Yuan, C.; Qin, C.; Yang, Y.; Sun, Z.; Li, L.; Lei, X.; Chen Chian, S. An analytical insight into stability analysis of unsaturated multi-layered slopes subjected to rainfall infiltration. Int. J. Numer. Anal. Methods Geomech. 2024, 48, 4291–4303. [Google Scholar] [CrossRef] [Scilit]
- Tang, J.; Ma, Z.; Li, M.; Xu, J.; Uchimura, T.; Xiao, W.; Jiang, X.; Huang, D.; Fang, K. Failure patterns and hydrological response of layered slope. Geomorphology 2025, 468, 110071. [Google Scholar] [CrossRef] [Scilit]
- Rahimi, A.; Rahardjo, H.; Leong, E.-C. Effect of antecedent rainfall patterns on rainfall-induced slope failure. J. Geotech. Geoenviron. Eng. 2011, 137, 483–491. [Google Scholar] [CrossRef] [Scilit]
- Gui, M.-W.; Chu, H.-A.; Chung, M.-C.; Chih, L.-S. Integrating Rainfall Distribution Patterns and Slope Stability Analysis in Determining Rainfall Thresholds for Landslide Occurrences: A Case Study. Water 2025, 17, 1240. [Google Scholar] [CrossRef] [Scilit]
- Yang, Y.-S.; Yeh, H.-F.; Ke, C.-C.; Wei, L.-W. Assessing shallow slope stability using electrical conductivity data and soil hydraulic characteristics. Eng. Geol. 2024, 331, 107447. [Google Scholar] [CrossRef] [Scilit]
- Carsel, R.F.; Parrish, R.S. Developing joint probability distributions of soil water retention characteristics. Water Resour. Res. 1988, 24, 755–769. [Google Scholar] [CrossRef] [Scilit]
- Yang, Y.-S.; Yeh, H.-F.; Ke, C.-C.; Wei, L.-W.; Chen, N.-C. The Evaluation of Rainfall Warning Thresholds for Shallow Slope Stability Based on the Local Safety Factor Theory. Geosciences 2024, 14, 274. [Google Scholar] [CrossRef] [Scilit]
- Šimůnek, J.; van Genuchten, M.T.; Šejna, M. Development and applications of the HYDRUS and STANMOD software packages and related codes. Vadose Zone J. 2008, 7, 587–600. [Google Scholar] [CrossRef] [Scilit]
- Richards, L.A. Capillary conduction of liquids through porous mediums. Physics 1931, 1, 318–333. [Google Scholar] [CrossRef] [Scilit]
- van Genuchten, M.T. A closed-form equation for predicting the hydraulic conductivity of unsaturated soils. Soil Sci. Soc. Am. J. 1980, 44, 892–898. [Google Scholar] [CrossRef] [Scilit]
- Mualem, Y. A new model for predicting the hydraulic conductivity of unsaturated porous media. Water Resour. Res. 1976, 12, 513–522. [Google Scholar] [CrossRef] [Scilit]
- Lu, N.; Likos, W.J. Suction stress characteristic curve for unsaturated soil. J. Geotech. Geoenviron. Eng. 2006, 132, 131–142. [Google Scholar] [CrossRef] [Scilit]
- Terzaghi, K. Theoretical Soil Mechanics; John Wiley & Sons: New York, NY, USA, 1943. [Google Scholar]
- Reddy, J.N. An Introduction to the Finite Element Method, 2nd ed.; McGraw-Hill: New York, NY, USA, 1993. [Google Scholar]
- Lu, N.; Godt, J.W.; Wu, D.T. A closed-form equation for effective stress in unsaturated soil. Water Resour. Res. 2010, 46, W05515. [Google Scholar] [CrossRef] [Scilit]
- Dou, Z.; Liu, Y.; Zhang, X.; Wang, Y.; Chen, Z.; Wang, J.; Zhou, Z. Influence of layer transition zone on rainfall-induced instability of multilayered slope. Lithosphere 2021, 2021, 2277284. [Google Scholar] [CrossRef] [Scilit]
- Tang, J.; Ma, Z.; Zhou, D.; Zhang, S.; Zhang, F.; Zhou, X.; Mi, J. Numerical modeling of hydrological mechanisms and instability for multi-layered slopes. Water 2024, 16, 2422. [Google Scholar] [CrossRef] [Scilit]
- Yang, Y.-S.; Yeh, H.-F. Effects of hysteretic soil water characteristic curves on the hydromechanical behaviour. J. Earth Syst. Sci. 2023, 132, 136. [Google Scholar] [CrossRef] [Scilit]
- Huang, T.-H.; Yang, Y.-S.; Yeh, H.-F. A Novel Bimodal Hydro-Mechanical Coupling Model for Evaluating Rainfall-Induced Unsaturated Slope Stability. Geosciences 2025, 15, 265. [Google Scholar] [CrossRef] [Scilit]
- Gu, X.; Wang, L.; Ou, Q.; Zhang, W. Efficient stochastic analysis of unsaturated slopes subjected to various rainfall intensities and patterns. Geosci. Front. 2023, 14, 101490. [Google Scholar] [CrossRef] [Scilit]
- Liu, X.; Wang, Y. Probabilistic hazard analysis of rainfall-induced landslides at a specific slope considering rainfall uncertainty and soil spatial variability. Comput. Geotech. 2023, 162, 105706. [Google Scholar] [CrossRef] [Scilit]

Disclaimer/Publisher’s Note: The statements, opinions and data contained in all publications are solely those of the individual author(s) and contributor(s) and not of MDPI and/or the editor(s). MDPI and/or the editor(s) disclaim responsibility for any injury to people or property resulting from any ideas, methods, instructions or products referred to in the content. |
© 2026 by the authors. Licensee MDPI, Basel, Switzerland. This article is an open access article distributed under the terms and conditions of the Creative Commons Attribution (CC BY) license.