


Abstract
This paper investigates the reduction in radial stress from the cone-shoulder region to the friction sleeve during cone penetration testing (CPT), with particular reference to the interpretation of sleeve friction using cylindrical cavity expansion theory. The limiting cavity-expansion stress does not, in general, represent the radial stress acting subsequently on the friction sleeve because the surrounding soil undergoes unloading and stress redistribution following passage of the cone shoulder. A coupled finite-difference–discrete-element (FDM–DEM) model is therefore employed to quantify this stress reduction and to examine its underlying mechanisms. A stress-reduction coefficient is introduced to relate the radial stress acting on the friction sleeve to the limiting cavity-expansion stress. The numerical results show that the reduction in radial stress is associated with pronounced loading–unloading behavior, changes in stress path, radial-stress evolution and the rotation of the principal stress axes. For the silty clay and CPT configuration considered, the radial stress at the middle of the friction sleeve is approximately 70% of its peak value near the cone shoulder. Incorporation of this stress reduction provides a more physically consistent basis for relating cavity-expansion stress to sleeve friction, although the resulting coefficient is case-specific and requires further validation for other soil and stress conditions.
1. Introduction
The cone penetration test (CPT) is widely used for in situ characterization of geomaterials because it provides continuous measurements of cone resistance and sleeve friction. Considerable effort has been devoted to relating these measurements to soil classification and engineering properties through theoretical, numerical and empirical approaches [1,2,3,4,5]. Nevertheless, the mechanical processes governing CPT resistance, particularly the stress evolution around the friction sleeve, are not yet fully understood.
Cavity expansion theory provides an important theoretical framework for interpreting CPT penetration. In this approach, cone penetration is idealized as the expansion of a cylindrical or spherical cavity, and the limiting cavity-expansion stress is determined from the constitutive response of the surrounding soil. Various cavity-expansion solutions have been developed for different constitutive models and subsequently applied to CPT interpretation [6,7,8,9,10]. Most previous studies, however, have focused primarily on cone resistance, whereas the relationship between the limiting cavity-expansion stress and sleeve friction has received considerably less attention.
A key issue is that the limiting cavity-expansion stress does not necessarily represent the radial stress acting on the friction sleeve. After the cone shoulder passes a soil element, the surrounding soil undergoes unloading and stress redistribution before interacting with the sleeve. Previous studies have shown that the radial stress around a penetrating shaft evolves with penetration and shearing history and that sleeve friction is also affected by the soil–sleeve interface and soil conditions [11,12,13,14]. The limiting cavity-expansion stress should therefore be distinguished from the radial stress subsequently acting on the friction sleeve.
Numerical methods provide a useful means of examining this stress evolution. Continuum methods are computationally efficient but may encounter difficulties associated with large deformation near the cone, whereas DEM can explicitly capture particle-scale behavior at a substantially higher computational cost. Coupled continuum–discontinuum methods therefore provide an effective compromise by representing the highly deformed region around the penetrometer with discrete particles and the far field with a continuum model [15,16,17]. This approach has also been applied to CPT simulations. Kidane et al. [18] employed DEM–FDM coupling for CPT in coarse-grained soils, using DEM near the penetrometer and FDM in the far field. Song et al. [19] applied a similar approach to sand and investigated the effects of chamber size, density, and confining stress on penetration resistance. These studies demonstrated the applicability of DEM–FDM coupling to CPT simulations but primarily focused on penetration resistance and boundary or soil effects. In contrast, the stress evolution between the cone shoulder and friction sleeve, particularly the reduction in radial stress, has received limited attention. This issue is important for conventional cavity expansion theory (CET), which relates the stress state around the expanding cavity to the radial stress acting on the penetrometer–soil interface. Clarifying this stress evolution is therefore essential for assessing the assumptions underlying CET-based interpretations of sleeve friction.
The present study builds on the FDM–DEM coupled framework developed by Wang et al. [20] to investigate the radial-stress reduction occurring between the cone shoulder and the friction sleeve. Particular attention is given to the evolution of the stress path, loading–unloading response and rotation of the principal stress axes during penetration. A stress-reduction coefficient is introduced to characterize the difference between the limiting cavity-expansion stress and the radial stress acting on the friction sleeve. The resulting stress reduction is then incorporated into the cavity-expansion-based interpretation of sleeve friction. The main objective is to clarify the mechanical origin of radial-stress reduction during cone penetration and its implications for the interpretation of CPT sleeve friction.
2. Theoretical Model
Cylindrical cavity expansion theory was employed to establish the relationship between the limiting cavity-expansion stress and CPT sleeve friction. The soil is described by an elastic–perfectly plastic model with the Mohr–Coulomb yield criterion. The cavity-expansion solution is first presented, followed by its application to the interpretation of sleeve friction.
2.1. Cylindrical Cavity Expansion
Consider the expansion of a cylindrical cavity in an infinite soil medium. As the cavity expands, a plastic zone develops around the cavity wall, while the soil outside the elastic–plastic boundary remains elastic. The corresponding stresses and displacements are determined from the equilibrium equation, the elastic–plastic constitutive relations, and the boundary conditions.
2.1.1. Basic Assumption
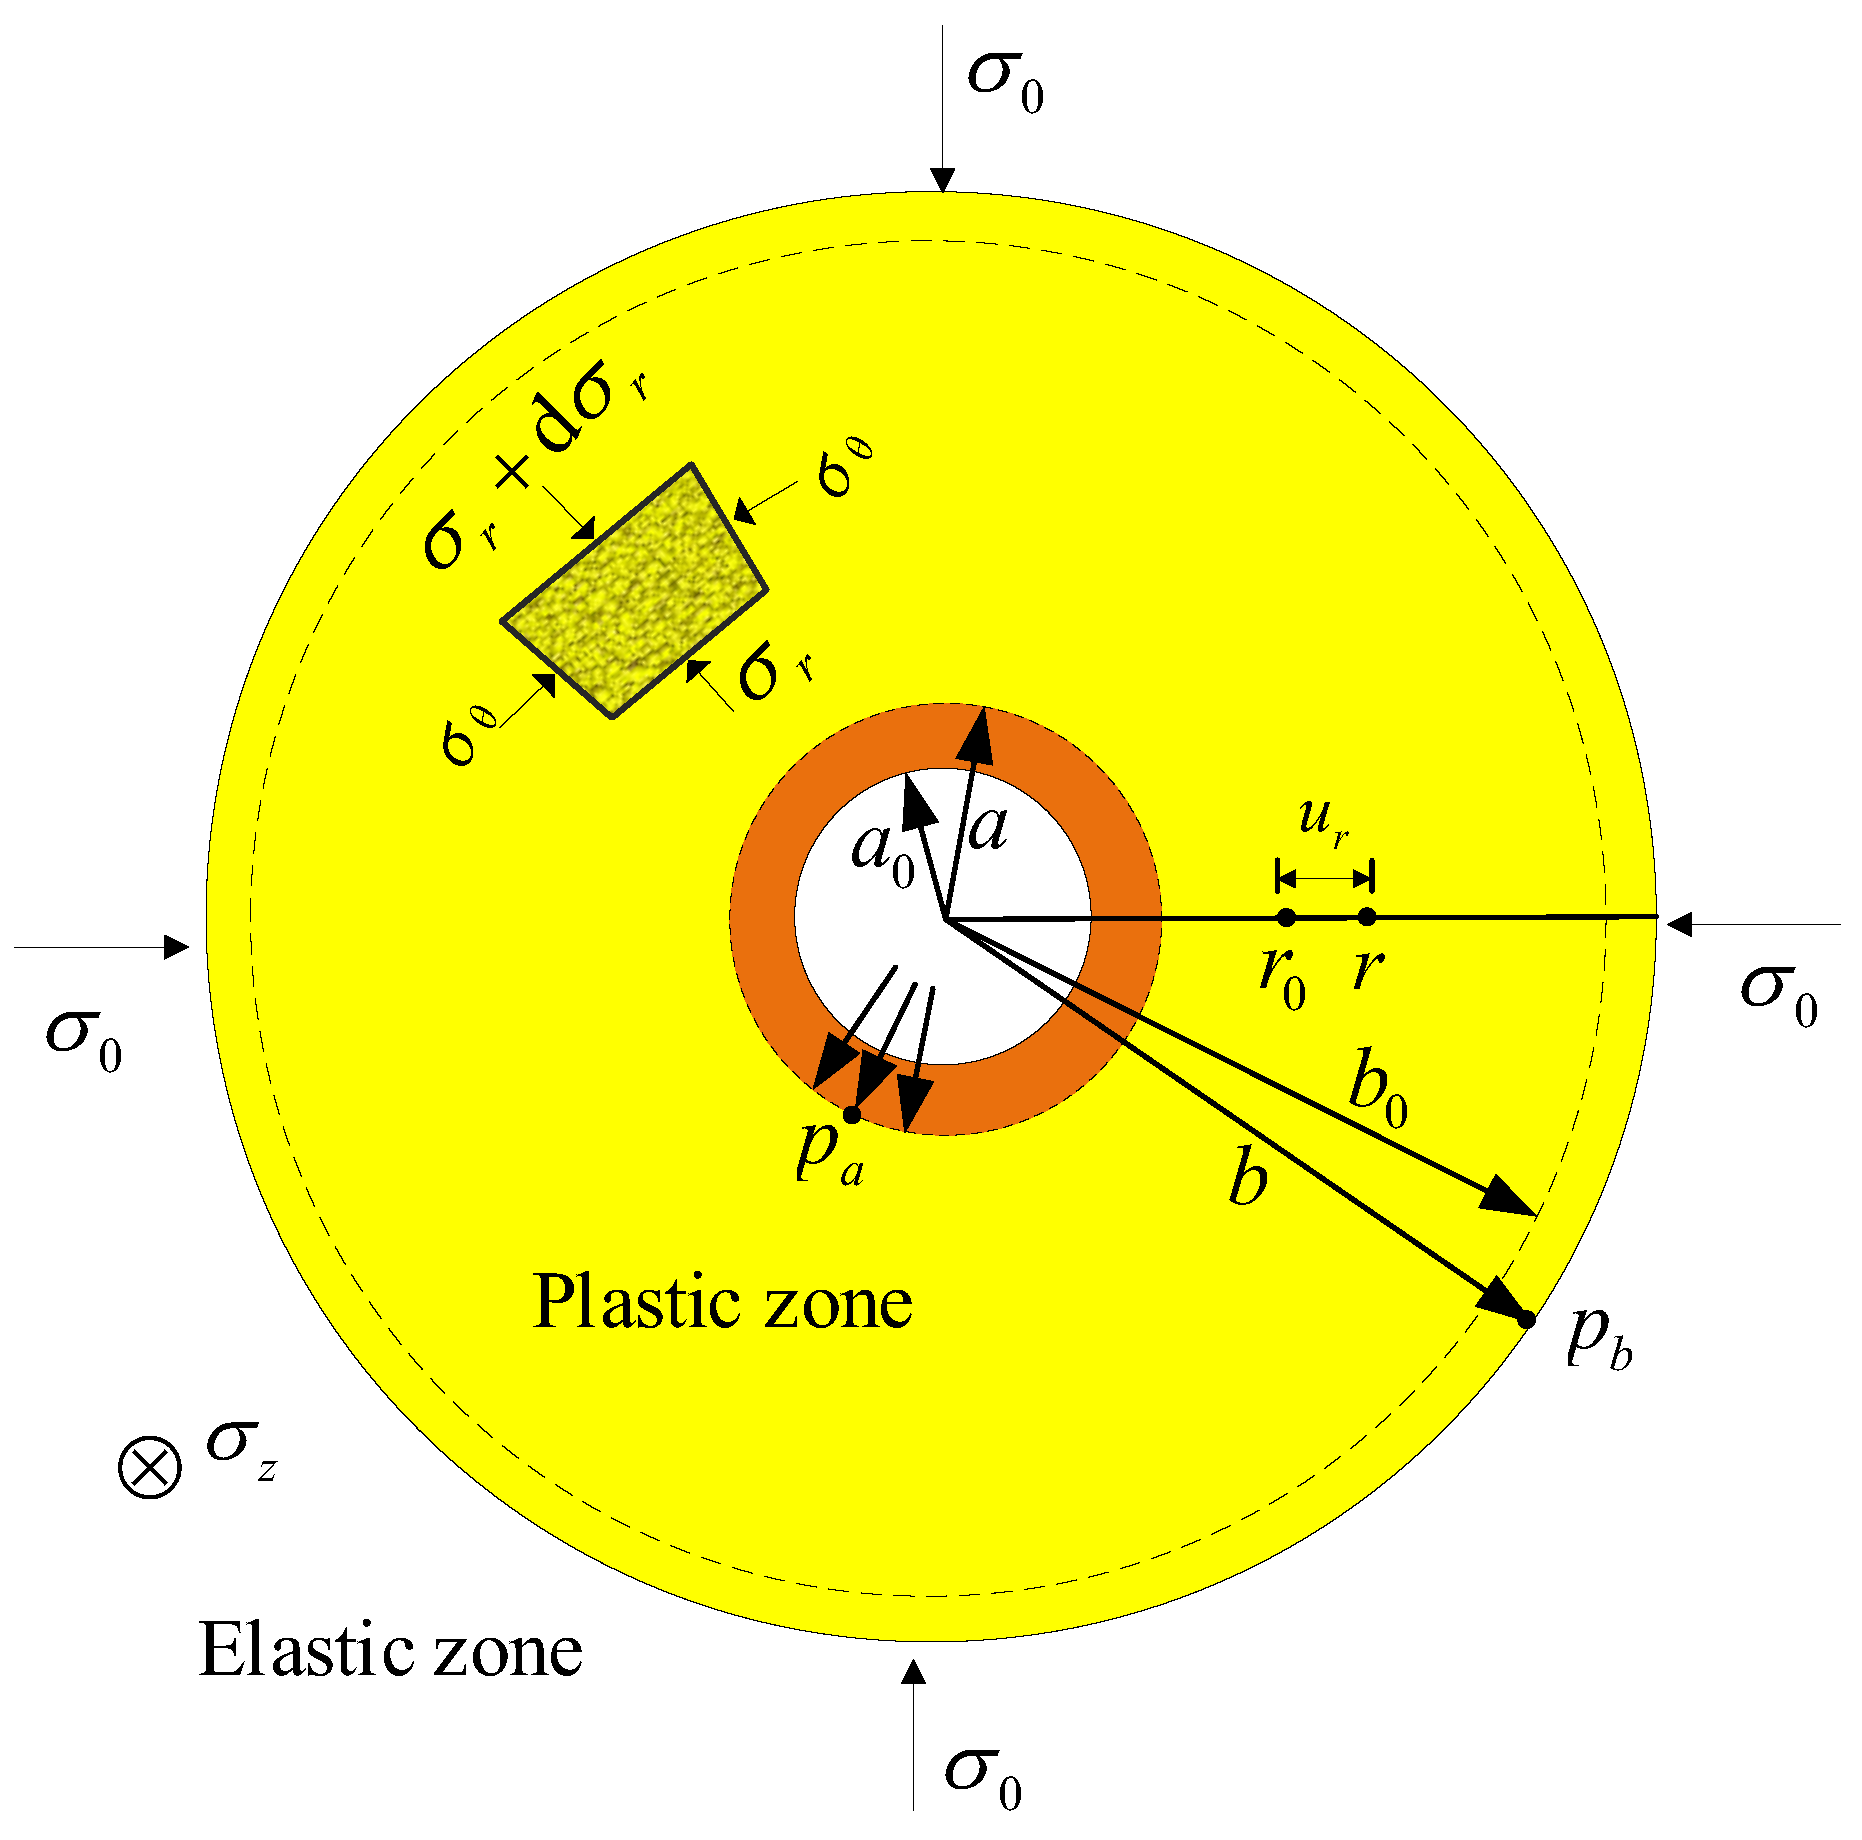
Figure 1 shows schematically the cylindrical cavity-expansion problem considered in this study. The cavity expands from an initial radius a0 to a current radius a under an increasing internal pressure. A soil element initially located at a radial distance r0 moves to its current position r, while the elastic–plastic boundary moves from b0 to b. The radial displacements at an arbitrary position and at the elastic–plastic boundary are denoted by ur and ub, respectively. The radial, circumferential, and vertical stresses are denoted by σr, σθ, and σz, respectively. The limiting cavity-expansion stress is denoted by pa, and pb denotes the radial stress at the elastic–plastic boundary.
An isotropic initial stress state, σ0, is assumed to retain the axisymmetric formulation of the conventional cylindrical cavity-expansion solution. This assumption is adopted as a theoretical simplification; the influence of initial stress anisotropy on cavity expansion has been discussed by Kong et al. [21] and Li et al. [8]. The present analysis focuses on the reduction in radial stress from the cavity-expansion state to the friction-sleeve position rather than on the development of an anisotropic cavity-expansion solution.
Figure 1.
The schematic representation of the cylindrical cavity-expansion model (adapted from [22]).
The mean stress p and deviatoric stress q are defined as
For the initial stress state, the radial and circumferential stresses are σr0 = σθ0 = σ0, and the initial mean stress is therefore .
2.1.2. Stress and Displacement
Following the elastic–plastic cavity-expansion solution of Yu [23], the radial stress σr in the plastic zone and the radial displacement ub at the elastic–plastic boundary are given by
where , , , , E and G are the Young’s modulus and shear modulus, respectively; ν is Poisson’s ratio; c is the cohesion; and φ is the angle of internal friction.
At the cavity wall, r = a, the radial stress reaches the limiting cavity-expansion stress pa. Substituting r = a into the radial-stress solution, Wang et al. [20] derived the expression for the limit expansion stress pa as
The ratio of the elastic–plastic boundary radius b to the current cavity radius a is determined from the displacement compatibility condition. Following Chen and Abousleiman [6], it can be expressed as
2.2. Relationship Between Cavity-Expansion Stress and Sleeve Friction
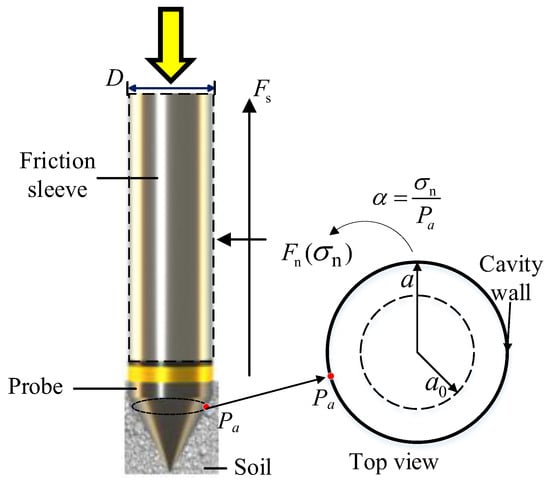
To relate the cavity-expansion solution to CPT sleeve friction, the penetration process is considered under a pseudo-static equilibrium condition. Figure 2 schematically illustrates the forces acting on the friction sleeve. The penetrometer has a diameter D. The normal stress acting on the sleeve is denoted by σn, and the corresponding normal force Fn and frictional force Fs are expressed as
where S is the surface area of the friction sleeve and μ is the soil–sleeve interface friction coefficient.
Figure 2.
The schematic representation of the relationship between cavity-expansion stress and sleeve friction (adapted from [20]).
The limiting cavity-expansion stress pa represents the radial stress associated with the expanded cavity near the cone-shoulder region. However, this stress is not maintained, as the soil subsequently moves along the friction sleeve. Following passage of the cone shoulder, the surrounding soil undergoes unloading and stress redistribution, resulting in a reduction in radial stress before it reaches the sleeve position [24,25]. A stress-reduction coefficient α is therefore introduced to relate the normal stress acting on the sleeve to the limiting cavity-expansion stress:
Accordingly, the sleeve friction fs is obtained as
Equation (8) shows that the cavity-expansion stress contributes to sleeve friction through two factors: the reduction in radial stress represented by α, and the conversion of normal stress to interface shear stress represented by μ. In the present analysis, the interface friction coefficient is taken as
following the simplified interface treatment adopted by Butlanska et al. [26] and Jin et al. [27]. This assumption is used to isolate the effect of radial-stress reduction and should not be interpreted as a universal soil–sleeve interface relationship.
μ = tan (φ/3)
The Mohr–Coulomb model adopted in the cavity-expansion analysis provides a simplified estimate of the limiting cavity-expansion stress from conventional soil parameters. Consequently, pa should be regarded as a constitutive-model-dependent reference stress. The stress-reduction coefficient α is evaluated from the radial-stress evolution obtained from the coupled FDM–DEM analysis rather than directly from the cavity-expansion solution. Its value may therefore depend on the constitutive representation, soil state, and penetration conditions considered and should not be regarded as universally applicable.
3. Coupled FDM–DEM Analysis
The coupled FDM–DEM analysis was performed for Layer ②1 silty clay at the selected CPT site in Shanghai, China. The numerical model was used to examine the evolution of radial stress during penetration and to evaluate the stress reduction from the cone-shoulder region to the friction sleeve. Particular attention was given to the stress path, loading–unloading response, and rotation of the principal stress axes. The numerical results were subsequently compared with the in situ CPT measurements and the cavity-expansion-based interpretation.
3.1. Site Conditions and Model Parameters
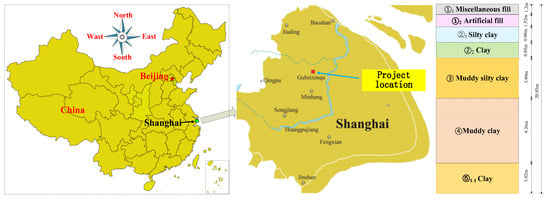
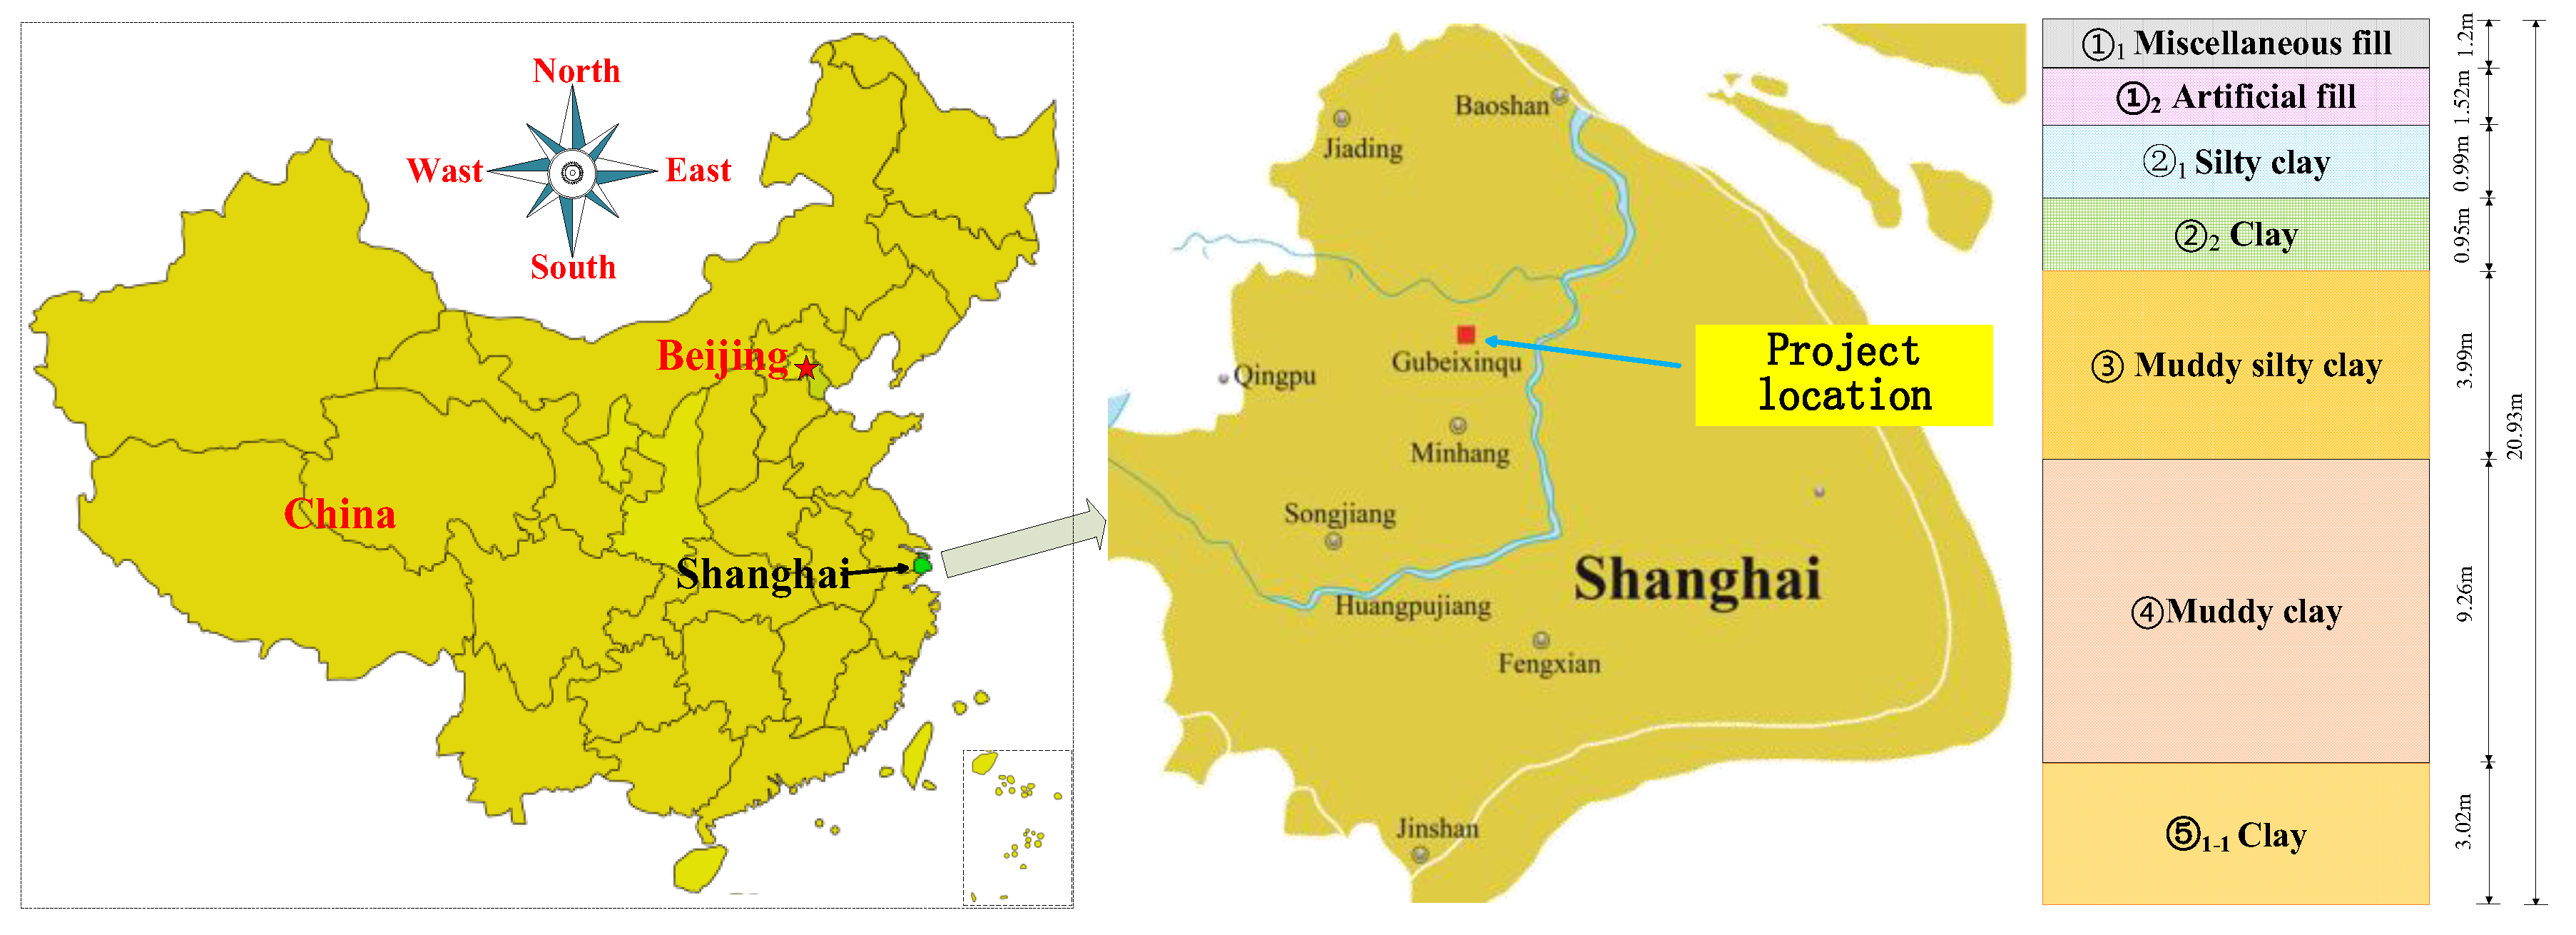
Figure 3 shows the location of the test site and the corresponding soil profile. Among the soils in Layer ②, the ②1 silty clay exhibits higher strength than the underlying ②2 clay and serves as the shallow bearing stratum. Consequently, Layer ② shows a characteristic stratification with a relatively stiff upper sublayer overlying a softer lower sublayer. The groundwater table is located at approximately 1.0 m below the ground surface. The numerical analysis focuses on Layer ②1, a silty clay layer with an average thickness of approximately 1.0 m.
Figure 3.
The location of the test site and soil profile.
The basic mechanical properties of the silty clay and the CPT penetrometer are summarized in Table 1. According to the geotechnical investigation report, the in situ horizontal total stress in Layer ②1 is approximately 102 kPa. An initial stress ratio of (K0 = 1.0) was adopted in the numerical model. Accordingly, the initial mean stress (p0) was taken as 102 kPa. The silty clay is represented in the continuum domain by the Mohr–Coulomb model, while the penetrometer is assumed to behave elastically.
Table 1.
Mechanical parameters of the silty clay and CPT penetrometer.
The statistical characteristics of the in situ CPT measurements within Layer ②1 are summarized in Table 2. The mean cone resistance is 0.67 MPa, with measured values ranging from 0.39 to 1.27 MPa, while the mean sleeve friction is 25.9 kPa, with a range of 17.2–60.5 kPa. These measurements are subsequently used for comparison with the coupled numerical results.
Table 2.
Statistical characteristics for the layer ②1 of silty clay.
In the DEM domain, the soil particles are described using the linear parallel-bond (LPB) model, which is suitable for representing geomaterials with interparticle bonding. The applicability of this contact model to cavity-expansion problems has been demonstrated by Yang and Fatahi [28]. The microscopic parameters adopted in the present study were calibrated in the authors’ previous work [20,29] for the same Layer ②1 silty clay at the study site in Shanghai. In that study, the relationship between the macroscopic soil properties and microscopic contact parameters was established using a stochastic discrete–continuum coupling approach combined with Bayesian inference. The calibrated parameters are therefore directly adopted in the present FDM–DEM analysis, as summarized in Table 3.
Table 3.
Calibrated microscopic parameters of the LPB contact model [20].
3.2. FDM–DEM Coupled Model
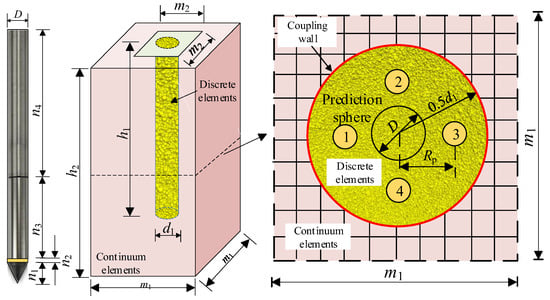
The FDM–DEM coupled model developed for Layer ②1 silty clay is shown in Figure 4. The model consists of a central DEM region surrounding the penetrometer and an outer FDM region representing the far-field soil. The two domains are connected through coupling walls. The numerical analysis is performed using FLAC3D.
Figure 4.
The geometry of the FDM–DEM coupled CPT model.
The model comprises 57,099 finite-difference elements and approximately 110,000 discrete particles, with particle diameters ranging from 2.2 to 3.6 mm. The use of enlarged particles is a common computational strategy in DEM simulations of penetration problems, for which representation of the actual soil particle size would be computationally prohibitive [26,30]. Particle scaling may affect the local contact network, force-chain development, and stress transmission [31,32,33,34,35].
Horizontal displacements are restrained along the four vertical boundaries, while the bottom boundary is fixed. Four measurement spheres, each with a diameter of 0.02 m, are positioned at a depth of 0.5h2 to record the local stress response of the soil particles during penetration. Gravity and pore-water pressure were then applied, and the model was allowed to reach numerical equilibrium under the combined effects of the initial stress, gravity, and pore-water pressure. Cone penetration was subsequently initiated from the equilibrated state.
The penetrometer is constructed according to the standard geometry of piezocone penetration test, providing a consistent geometric basis for comparison with conventional CPT conditions. The chamber dimensions are selected to minimize boundary effects. Gui et al. [36] showed that boundary effects are substantially reduced when the chamber width exceeds approximately 20 times the cone diameter. The dimensions adopted in the present model satisfy this requirement and are summarized in Table 4.
Table 4.
Geometric dimensions of the FDM–DEM coupled model.
The penetration rate of 0.25 mm/s was selected considering both the quasi-static penetration condition and the computational efficiency of the FDM-DEM coupled simulation [26,27,37,38]. Pore-water pressure and seepage are calculated in the FDM domain using the built-in fluid-flow formulation in FLAC3D. The hydraulic effect is transferred to the particles in the DEM domain through a user-defined FISH routine, which applies the corresponding fluid-induced forces to the particles. To assess the hydraulic significance of this loading rate, the normalized penetration velocity V, as proposed in previous studies [39], is defined as
where v is the penetration velocity, D is the cone diameter, and cv is the coefficient of consolidation. The coefficient of consolidation cv was estimated from the following relationship proposed in previous studies [40]:
where γw is unit weight of water and γw = 9.81 kN/m3.
For the investigated Layer ②1 silty clay, compression modulus Es = 5.15 MPa, and the hydraulic conductivity is k = 1.6 × 10⁻⁸ m/s, giving cv ≈ 8.4 × 10⁻⁶ m2/s. The adopted numerical velocity therefore corresponds to V ≈ 1.1, whereas a conventional field penetration rate of approximately 20 mm/s gives V ≈ 85.7.
The normalized penetration velocity provides a useful indicator of the drainage conditions during penetration. Previous studies have suggested that fully undrained penetration typically occurs at V > 30~100, whereas fully drained penetration is associated with V < 0.01~0.03 [41]. On this basis, the numerical penetration condition (V ≈ 1.1) falls within the intermediate range between the fully drained and fully undrained limits, indicating a partially drained condition in terms of the normalized velocity criterion. In contrast, the field CPT condition (V ≈ 85.7) is much closer to the undrained regime and may be regarded as predominantly undrained under commonly adopted criteria.
The difference between these two normalized velocities highlights an important distinction between the numerical loading rate and the hydraulic time scale of field CPT. The penetration velocity of 0.25 mm/s was selected to maintain quasi-static mechanical penetration while keeping the computational cost manageable; it was not selected to reproduce the hydraulic conditions of a conventional field test. Although pore-water pressure and seepage are represented in the FDM domain, the present analysis does not fully resolve the rate-dependent generation and dissipation of excess pore pressure associated with field CPT penetration. The influence of penetration-rate-dependent drainage on the measured CPT resistance remains a limitation of the present analysis.
3.3. Comparison with In Situ CPT Measurements
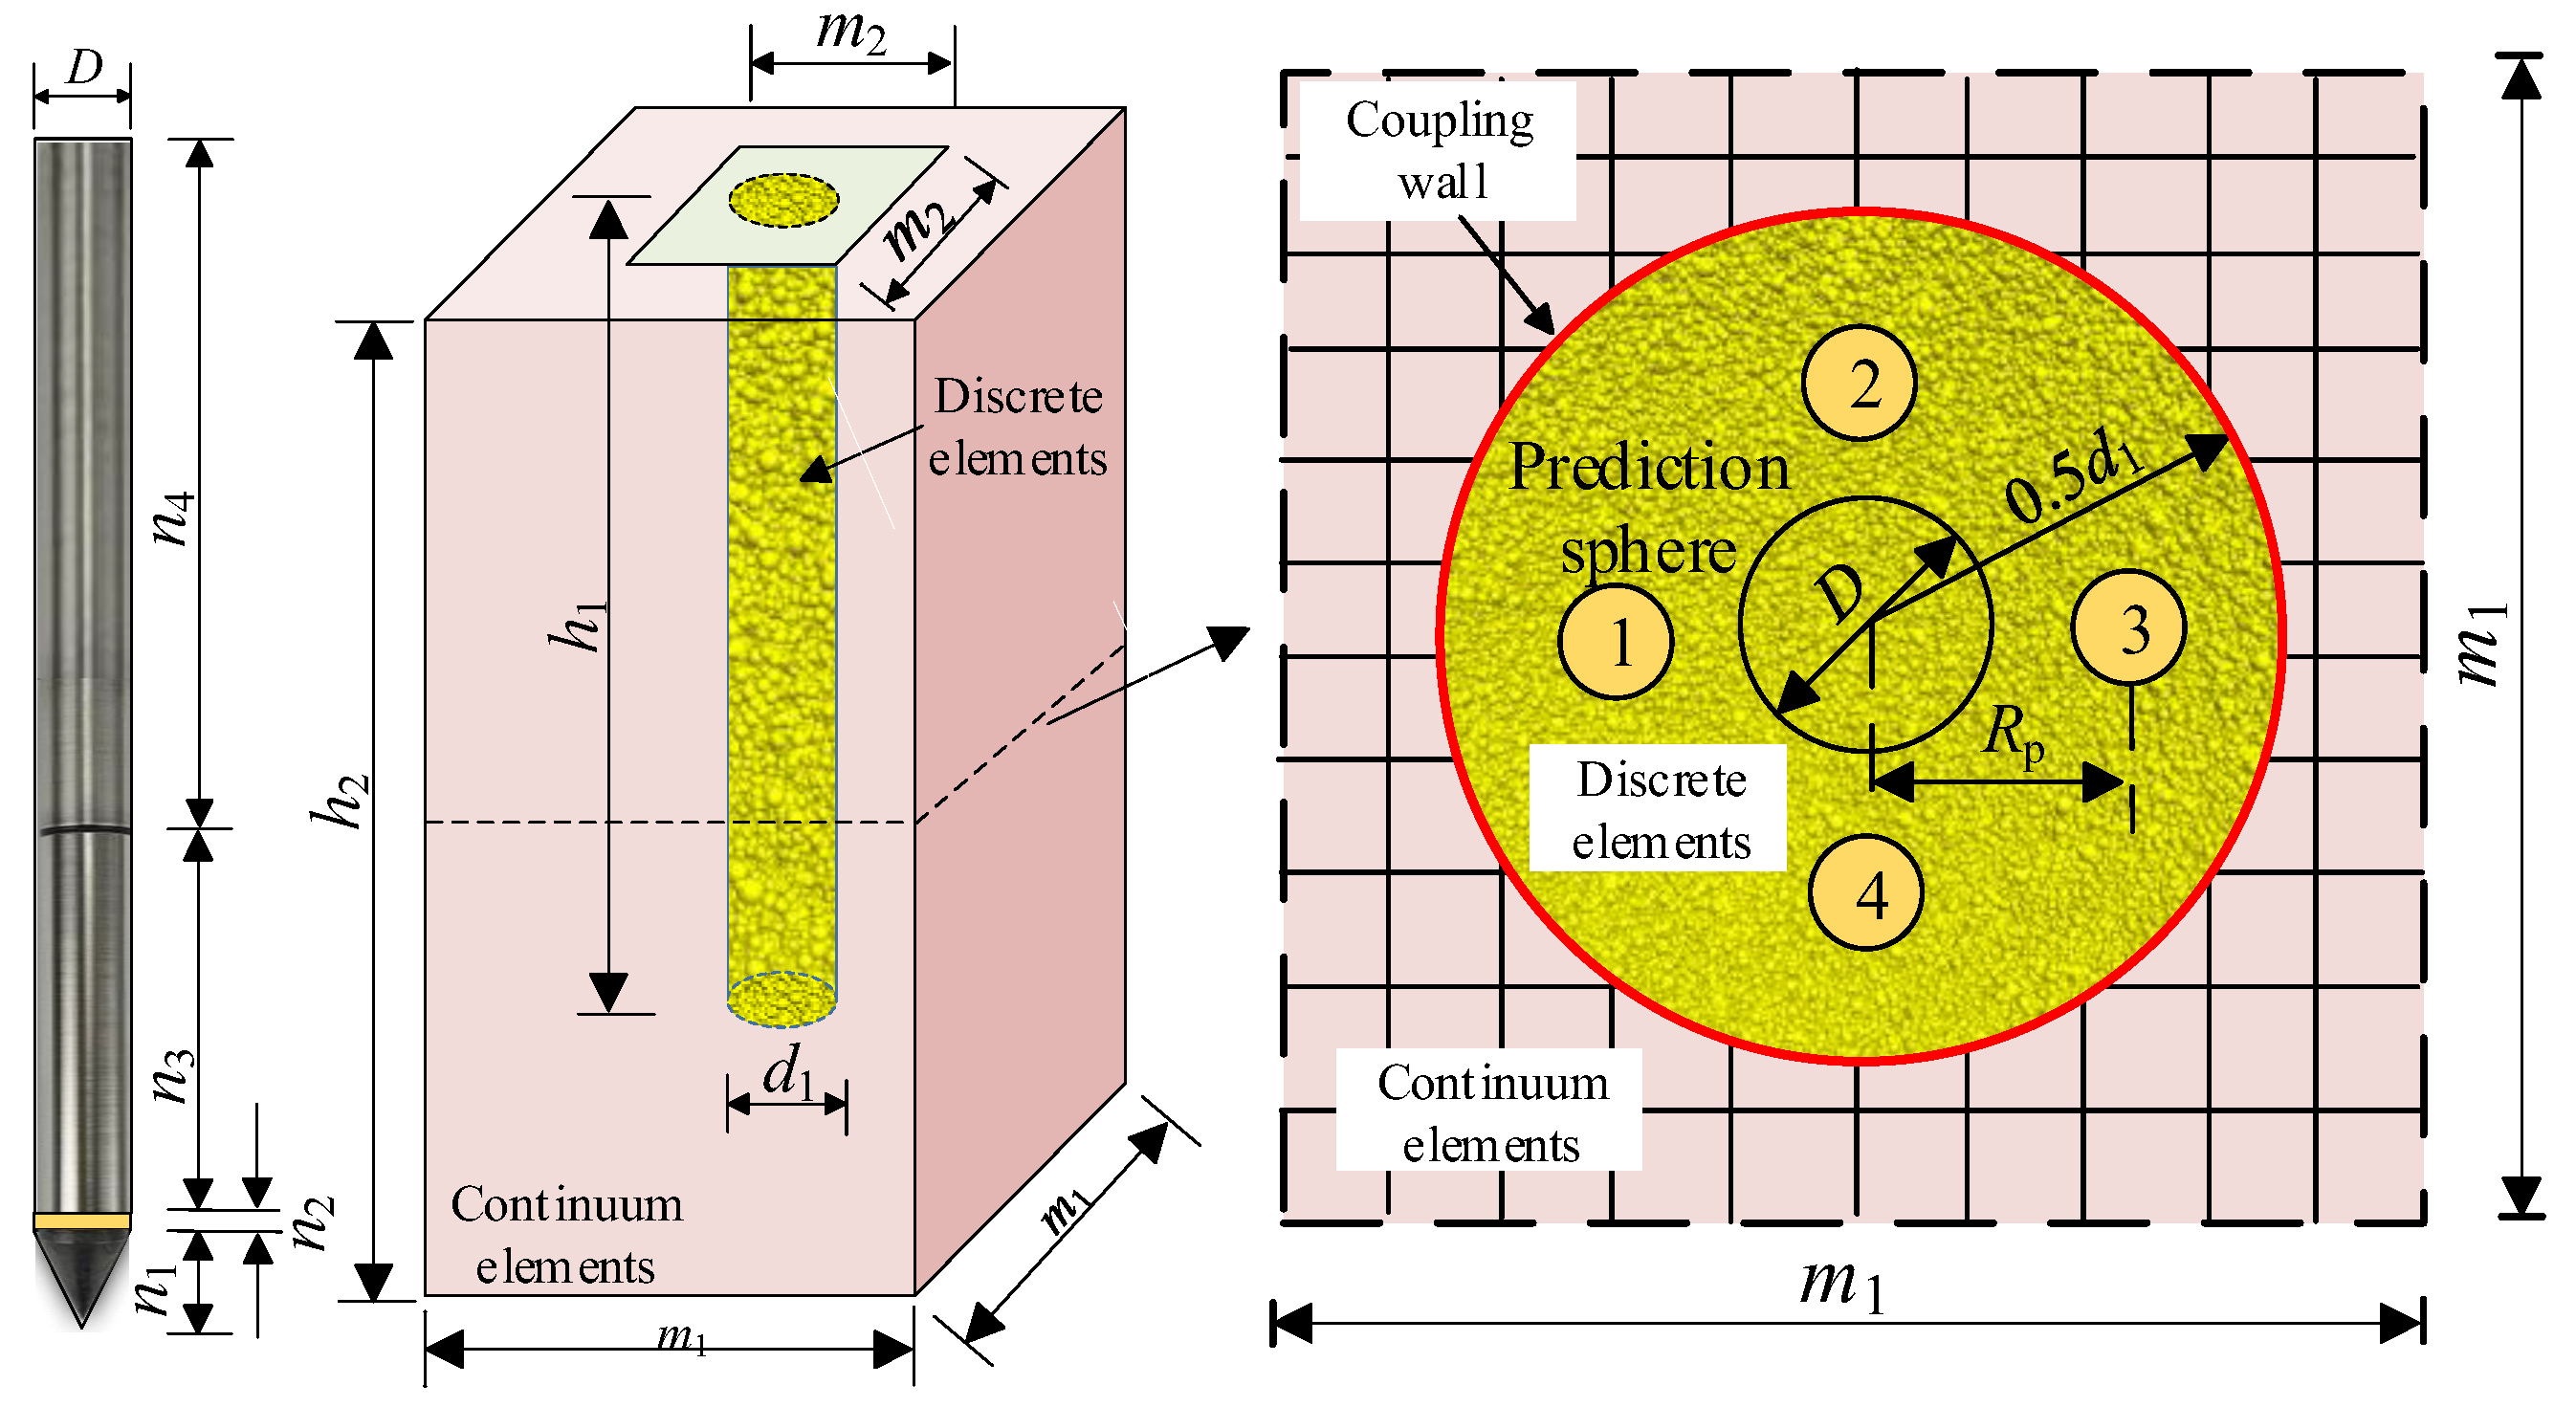
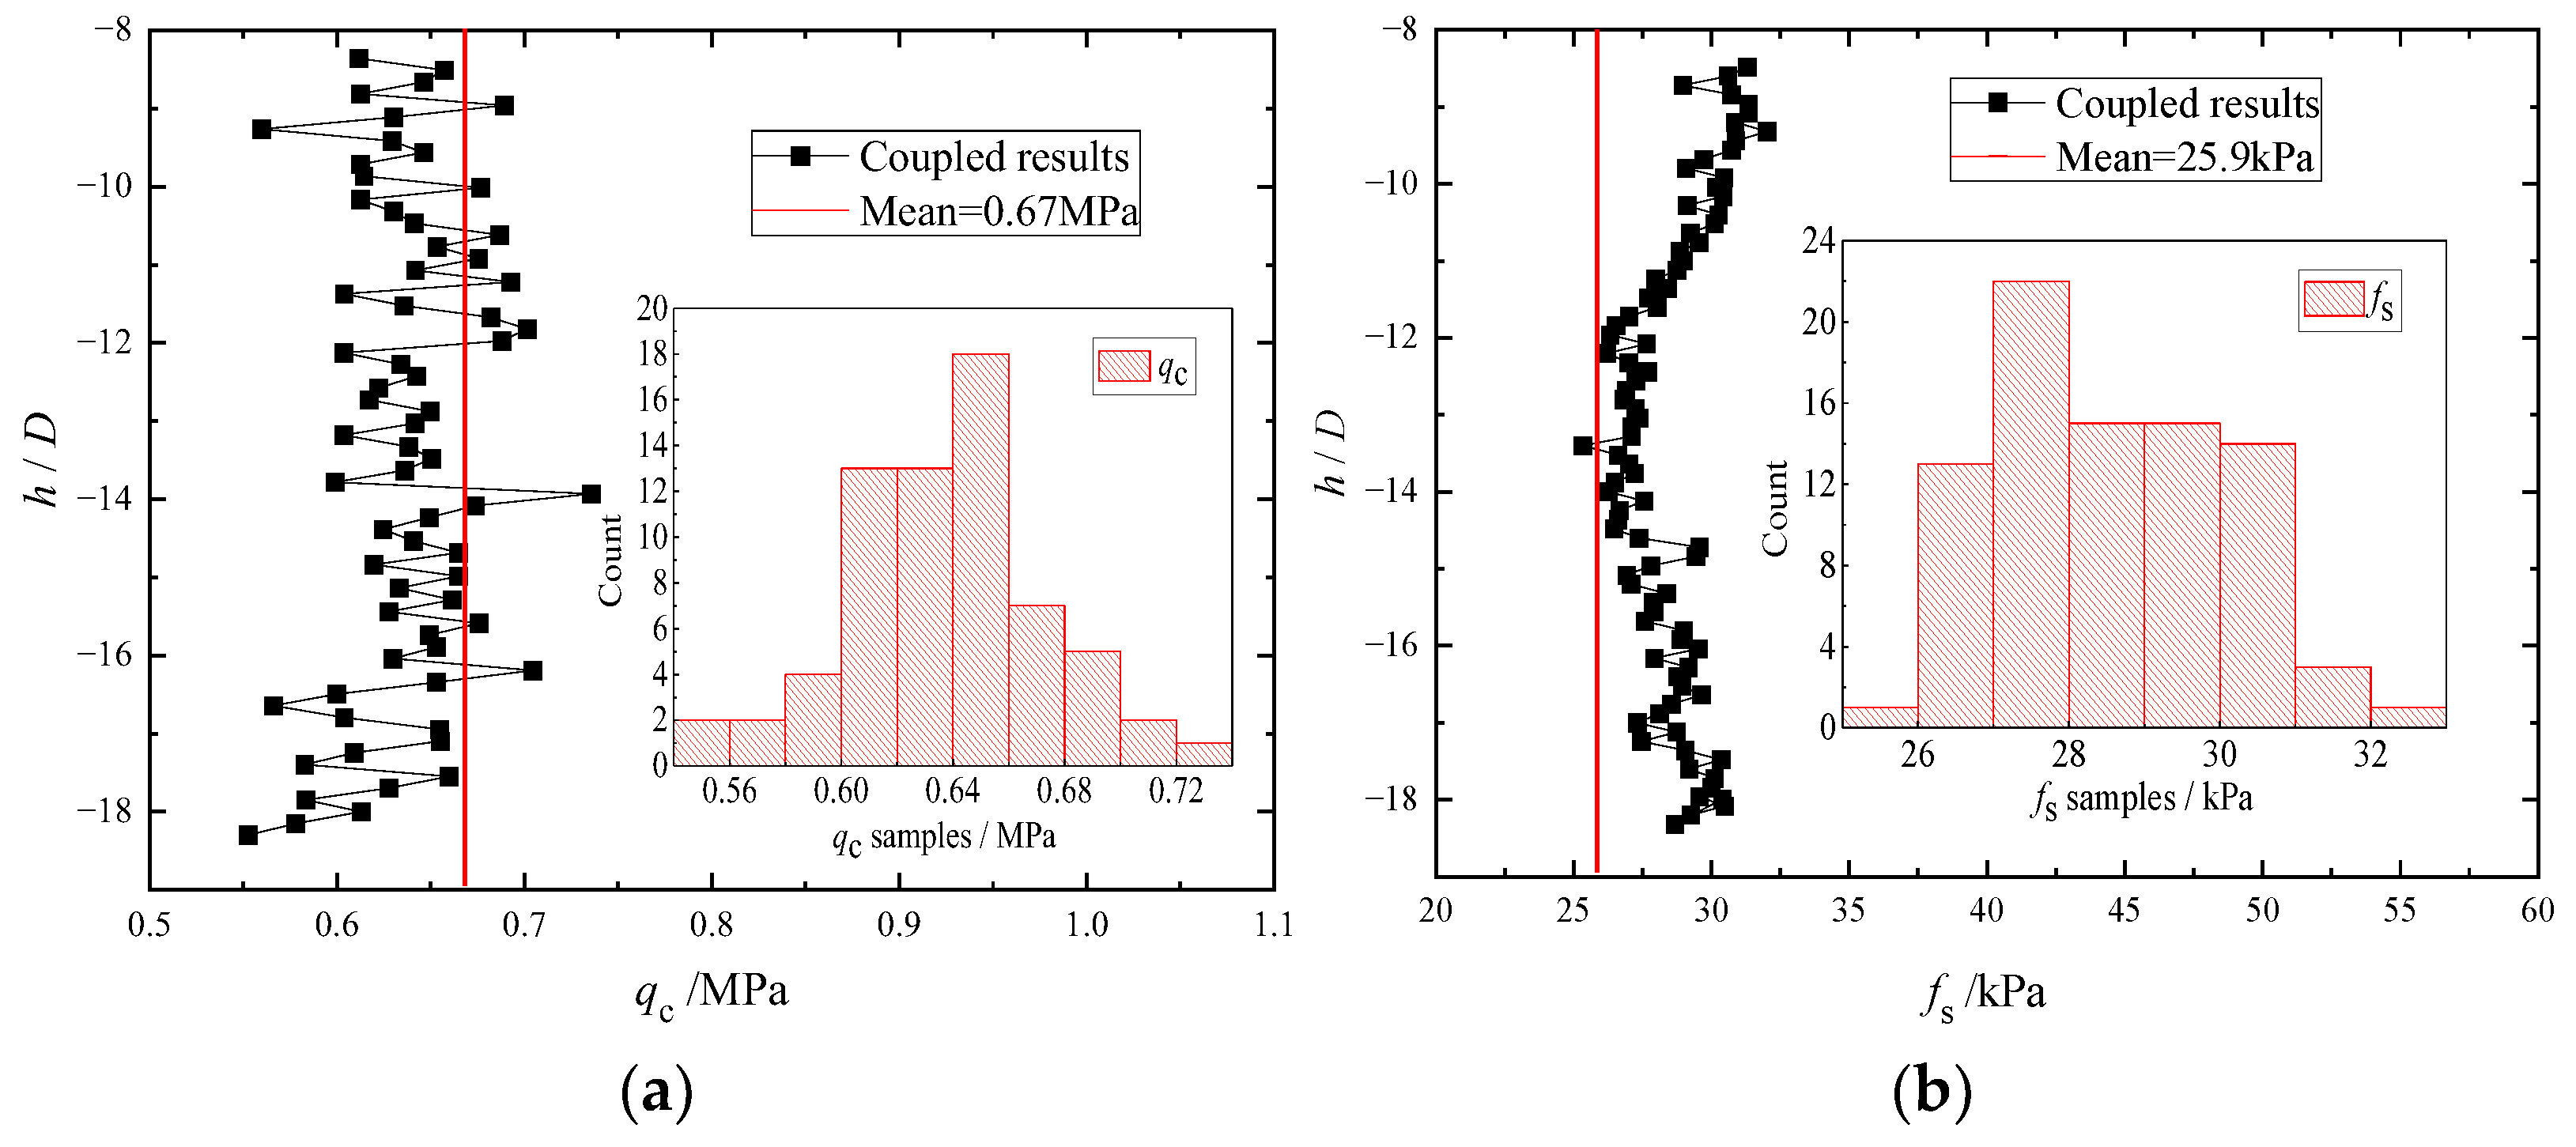
Figure 5 compares the cone resistance qc and sleeve friction fs obtained from the coupled FDM–DEM analysis with the corresponding in situ measurements. A relatively stable penetration response was obtained over the normalized depth range of approximately h/D = −8 to −18, corresponding to a penetration interval of about 0.30–0.65 m. The numerical results within this interval are therefore used for the following comparison.
Figure 5.
CPT responses obtained from the coupled FDM–DEM analysis: (a) cone tip resistance qc; (b) sleeve friction fs.
As shown in Figure 5a, the numerical cone resistance fluctuates around the measured mean value of 0.67 MPa. A similar trend is observed for the sleeve friction in Figure 5b, although the numerical values are slightly higher than the measured mean. The spatial variability and statistical characteristics of the CPT measurements at this site have been investigated in the authors’ previous study [29]. The present study therefore used the measured mean values as representative field responses since the primary objective was to investigate the stress-reduction mechanism rather than the spatial variability of CPT resistance.
The mean sleeve friction obtained from the coupled analysis is 28.32 kPa, compared with the measured mean value of 25.9 kPa, corresponding to a relative difference of 9.34% (Table 5). The numerical model therefore provides a reasonable representation of the measured sleeve-friction level for the soil layer considered. The remaining difference may be associated with the idealization of the soil as a homogeneous material, the constitutive assumptions, and the omission of transient pore-pressure effects. On this basis, the coupled model is subsequently used to examine the evolution and reduction of radial stress during cone penetration.
Table 5.
Comparison of numerical and measured sleeve friction.
3.4. Stress Evolution and Reduction Mechanism
To investigate the mechanical origin of the radial-stress reduction, the coupled FDM–DEM results were examined in terms of the stress path, deviatoric-stress response, radial-stress evolution, and rotation of the principal stress axes. These quantities were used to characterize the loading–unloading process experienced by the soil as the cone approached, passed, and moved beyond a given location.
3.4.1. Stress Path During the Cone Penetration
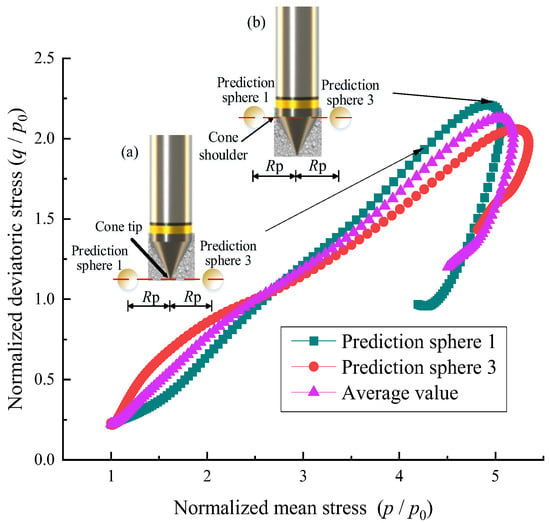
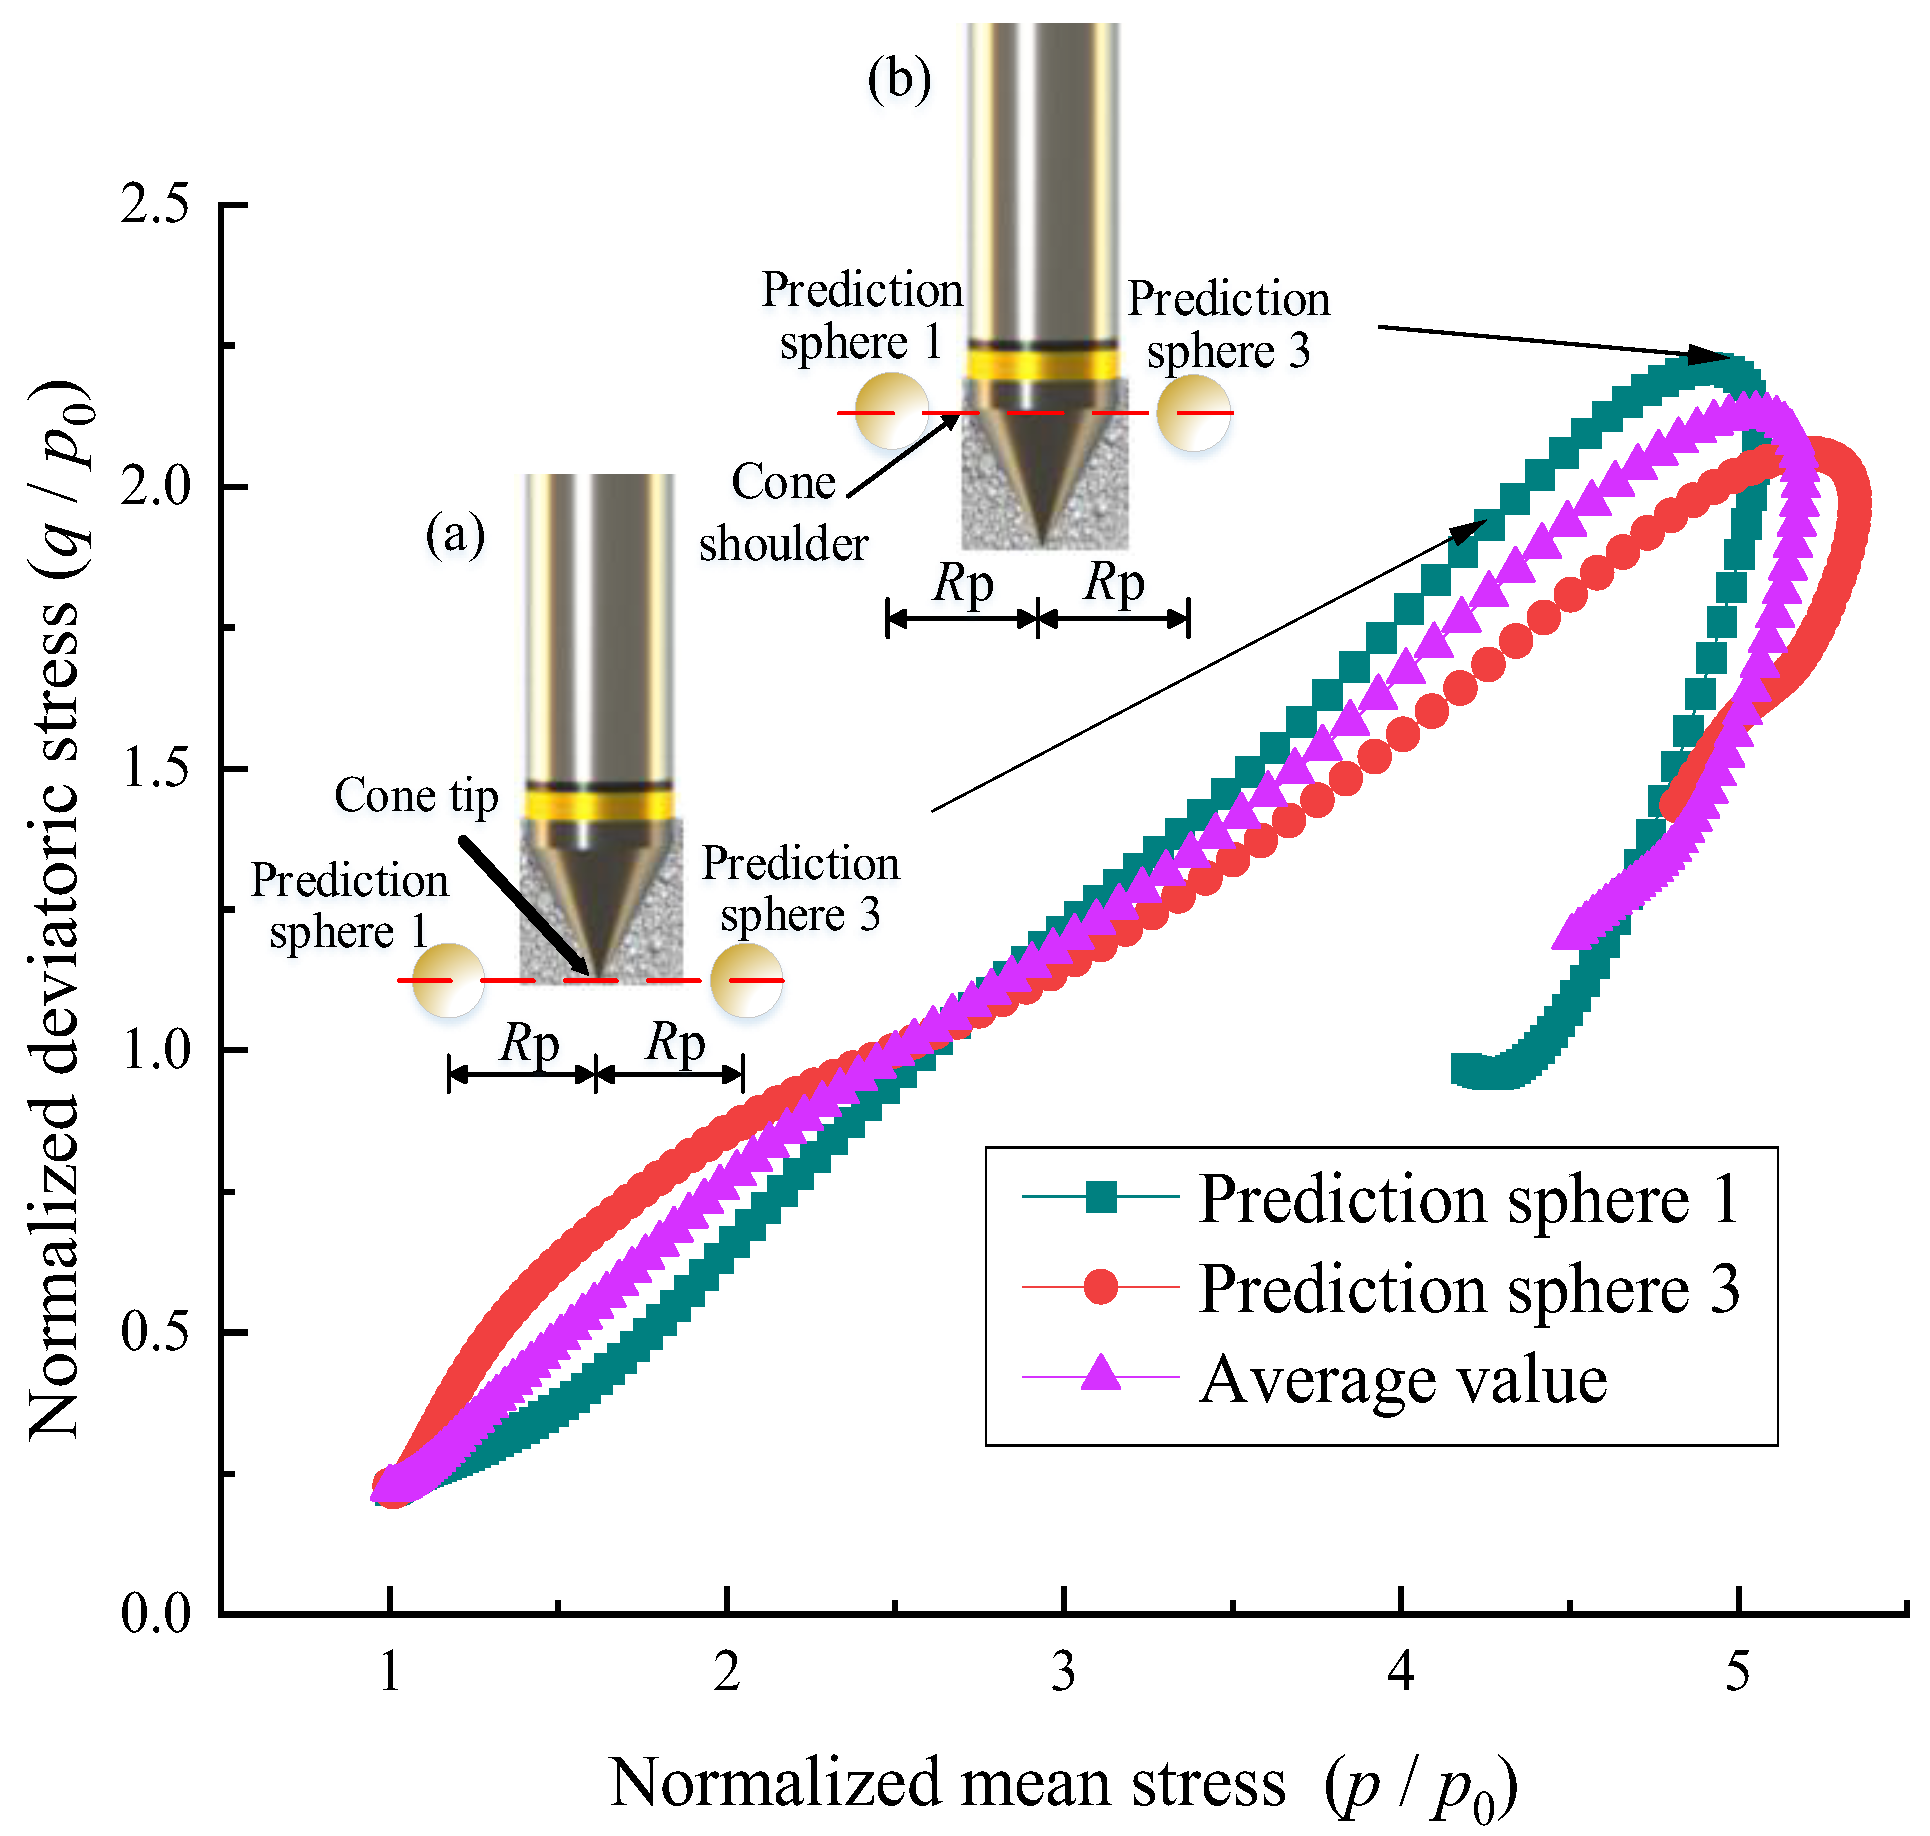
The mean stress p and deviatoric stress q recorded by the measurement spheres were used to construct the normalized stress paths in the p–q plane, as shown in Figure 6. Four measurement spheres were arranged around the penetrometer to capture the local stress evolution during penetration. Measurement spheres 1 and 3 were selected as representative locations because they exhibited the characteristic loading and loading–unloading responses observed in the model, whereas the remaining spheres showed similar trends.
Figure 6.
Stress paths obtained from the measurement spheres during cone penetration: (a) the cone tip reaching the elevation of the measurement spheres; (b) the cone shoulder passing the measurement spheres.
The inset configurations in Figure 6 identified two characteristic penetration stages: (a) the cone tip reaching the elevation of the measurement spheres and (b) the cone shoulder passing the same elevation. The interval between these two configurations represents the principal cavity-expansion stage, whereas the subsequent response reflects unloading behind the cone shoulder.
As the cone approaches the measurement location, both the mean stress and deviatoric stress increase along the stress paths. The stresses continue to rise as the cone advances and the surrounding soil undergoes cavity expansion, reaching their maximum levels approximately when the cone shoulder passes the measurement location. After the cone shoulder passes, both stresses decrease, indicating a transition from loading to unloading accompanied by stress redistribution. Consequently, the soil adjacent to the friction sleeve experiences a lower stress state than the peak stress state developed near the cone shoulder.
3.4.2. Deviatoric Stress–Strain Response
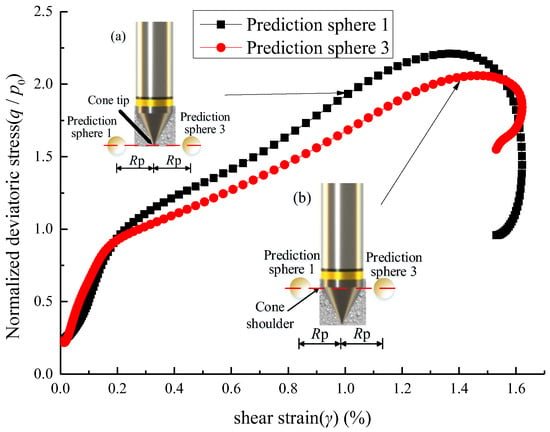
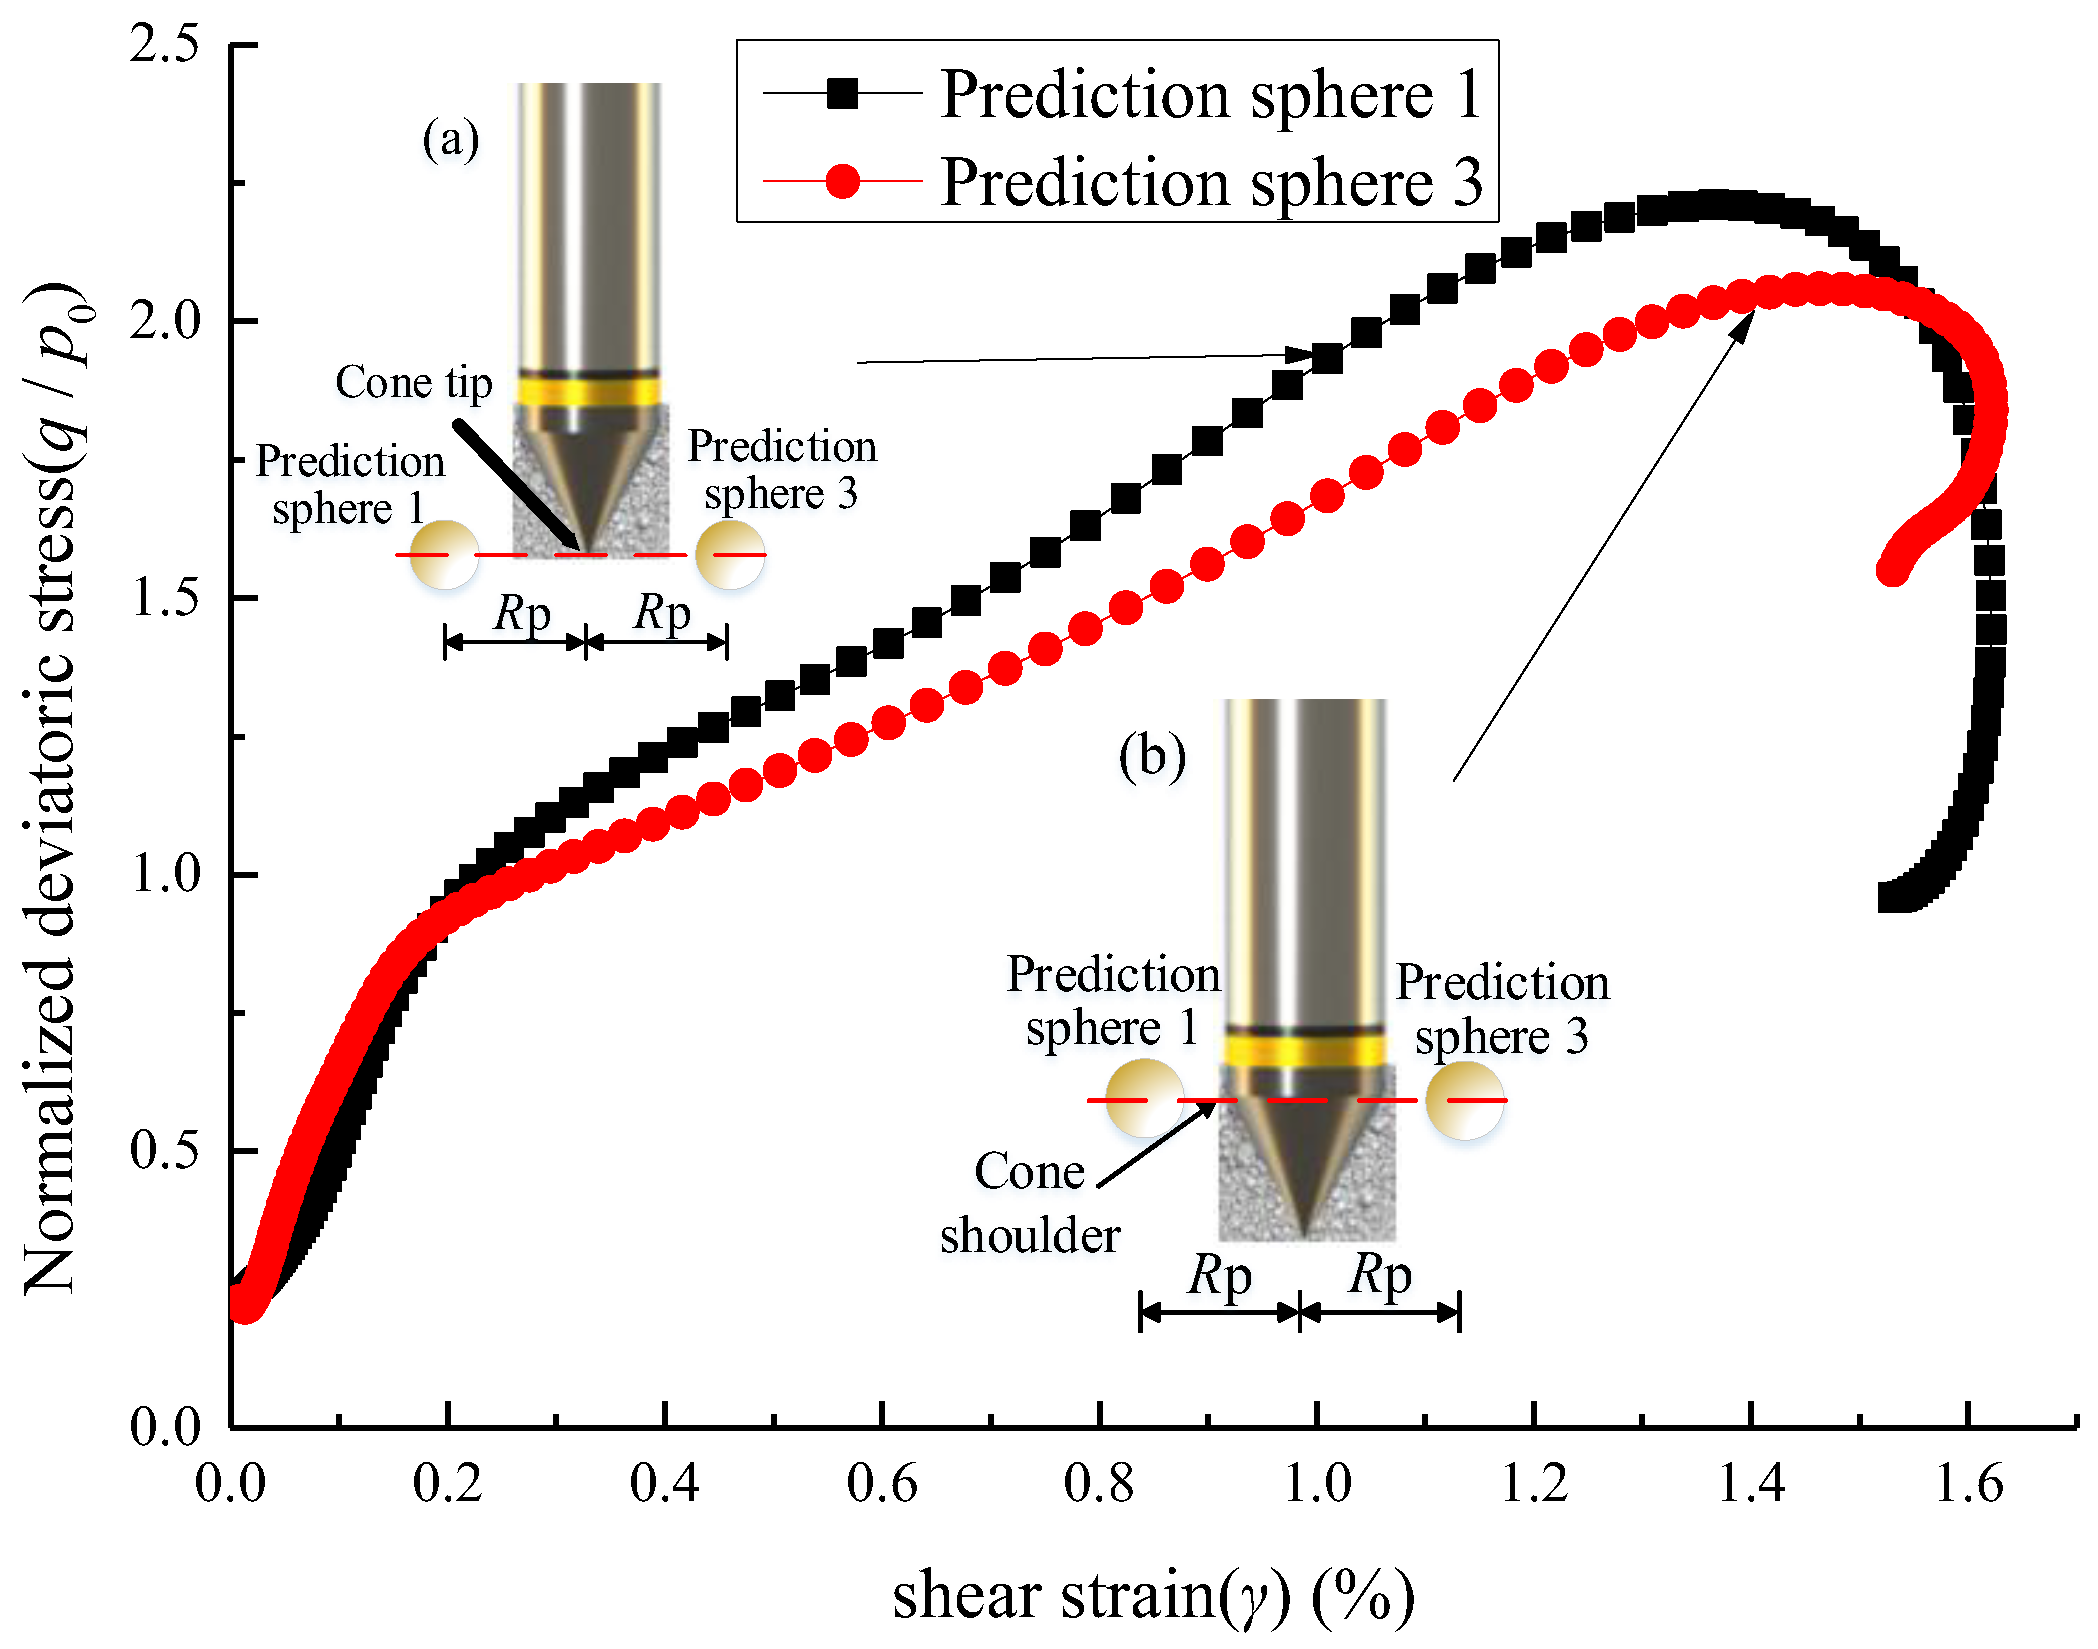
Figure 7 shows the relationship between the normalized deviatoric stress q/p0 and shear strain γ during cone penetration. Based on the evolution of the stress–strain response, the penetration process can be divided into three stages.
Figure 7.
Relationship between normalized deviatoric stress and shear strain during cone penetration: (a) the cone tip reaching the elevation of the measurement spheres; (b) the cone shoulder passing the measurement spheres.
In the first stage, corresponding approximately to γ = 0–0.2%, the normalized deviatoric stress increases rapidly while the shear strain remains small. At this stage, the cone is still relatively far from the measurement location, and the soil response is dominated by the initial increase in stress.
In the second stage, corresponding approximately to γ = 0.2–1.4%, the shear strain increases markedly, while the rate of increase in q/p0 gradually decreases. This stage corresponds to the cone approaching and passing the measurement location, during which substantial shearing and cavity expansion develop around the probe.
In the final stage, at γ ≈ 1.4–1.6%, the normalized deviatoric stress decreases after reaching its maximum value. This transition occurs approximately as the cone shoulder passes the measurement location and indicates a change from loading-dominated deformation to unloading and stress redistribution. The response is therefore consistent with the stress evolution, in which the soil reaches a highly stressed state near the cone shoulder and subsequently unloads as it moves into the region behind the shoulder.
3.4.3. Radial-Stress Evolution and Stress-Reduction Coefficient
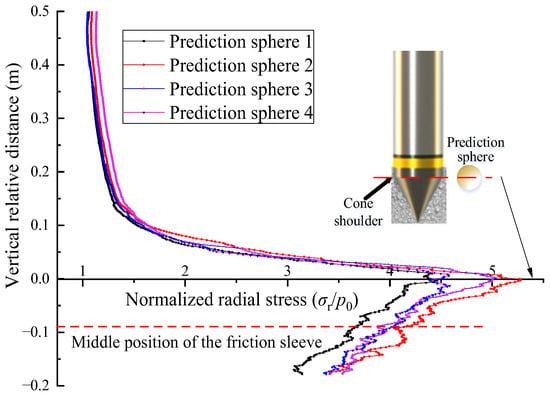
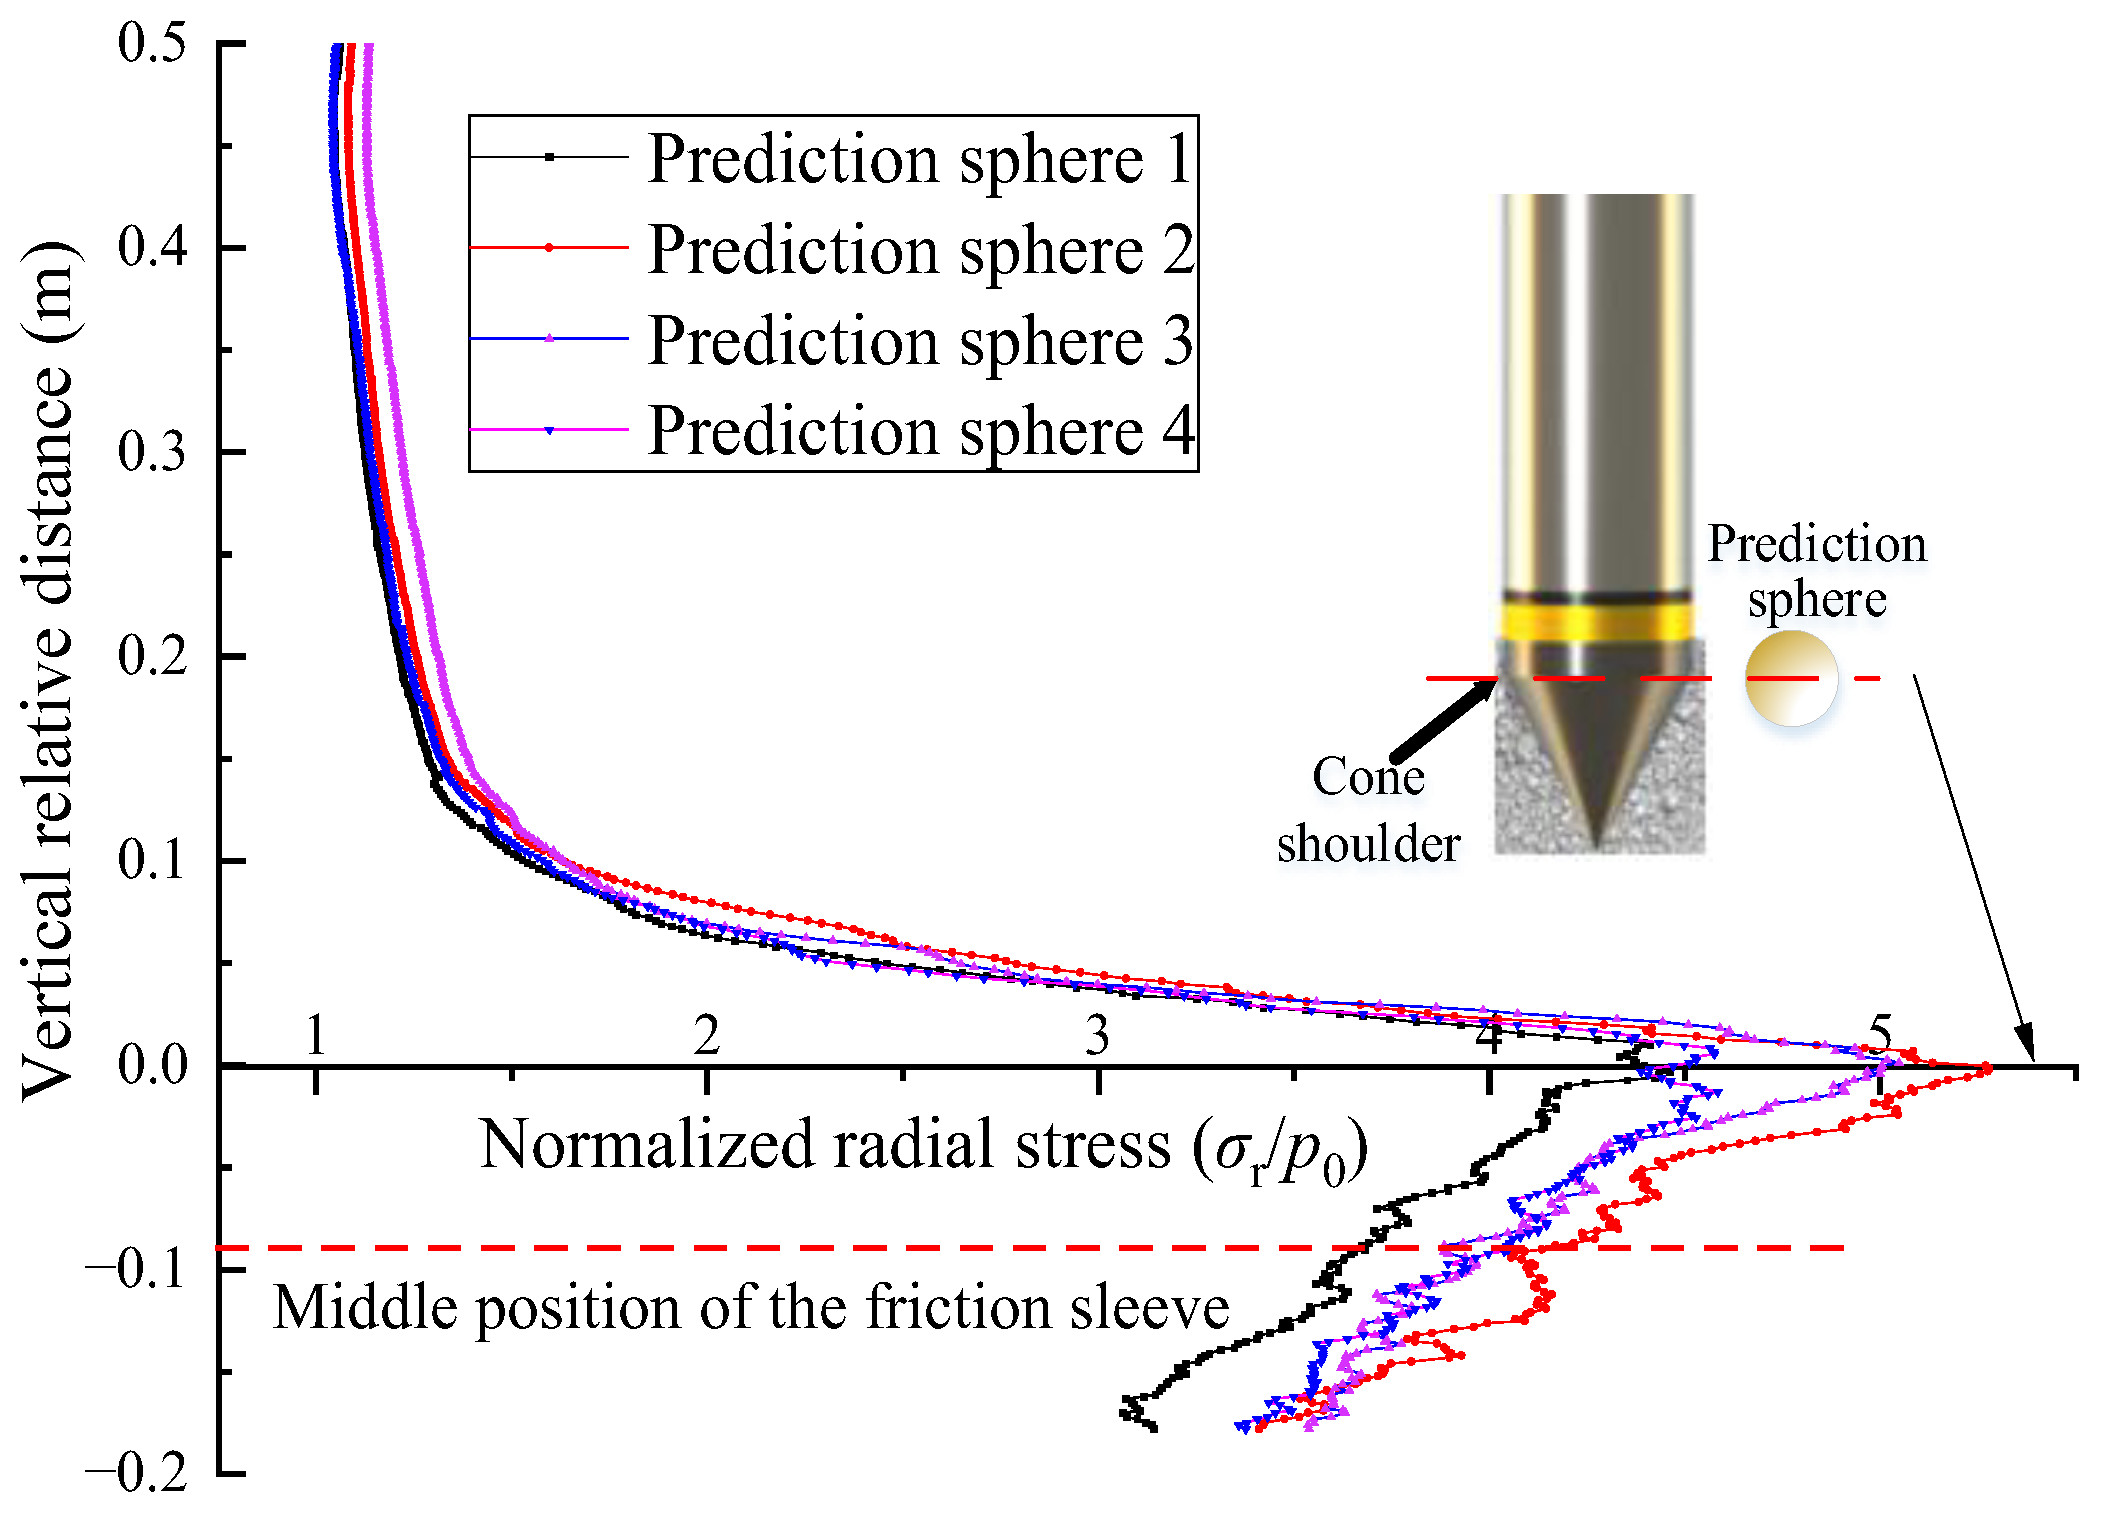
Figure 8 shows the evolution of the normalized radial stress σr/p0 recorded by the measurement spheres during cone penetration. The vertical coordinate represents the relative vertical distance between the cone shoulder and the center of each measurement sphere. A positive value indicates that the cone shoulder has not yet reached the measurement location, whereas a negative value indicates that the shoulder has passed it.
Figure 8.
Evolution of normalized radial stress during cone penetration.
As the cone approaches the measurement location, the radial stress increases rapidly and reaches a maximum near the passage of the cone shoulder. After the shoulder passes, the radial stress decreases progressively as the measurement location moves into the region adjacent to the friction sleeve. At a relative distance of approximately −0.08 m, corresponding to the middle of the friction sleeve, the radial stress decreases to about 70% of its peak value.
To quantify this reduction, let σr,shoulder denote the peak radial stress when the cone shoulder passes the measurement location, and let σr,sleeve denote the radial stress when the measurement location corresponds to the middle of the friction sleeve. The numerical stress-reduction coefficient is defined as
For the present numerical case, σr,sleeve is approximately 70% of σr,shoulder, giving αnum ≈ 0.7. In the cavity-expansion-based formulation, the peak radial stress near the cone shoulder is represented by the limiting cavity-expansion stress pa, whereas the radial stress acting on the friction sleeve corresponds to the normal stress σn. The numerical ratio αnum was therefore used to approximate the stress-reduction coefficient α = σn/pa for the present case.
The value α ≈ 0.7 should be regarded as a case-specific equivalent coefficient, as it is derived from a single soil layer and one calibrated numerical case. Although the standard geometry of piezocone penetration test adopted in the model improves the practical relevance of the observed stress-reduction behavior, its value may vary with soil type and state, stress history and stress level, penetrometer geometry, and numerical factors such as DEM particle size, DEM/FDM interface position, and FDM mesh discretization. The present analysis therefore used α ≈ 0.7 only for the conditions considered herein rather than treating it as a universal constant.
3.4.4. Rotation of Principal Stress Axes
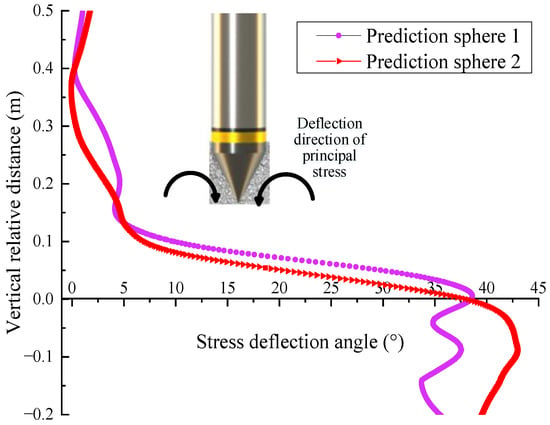
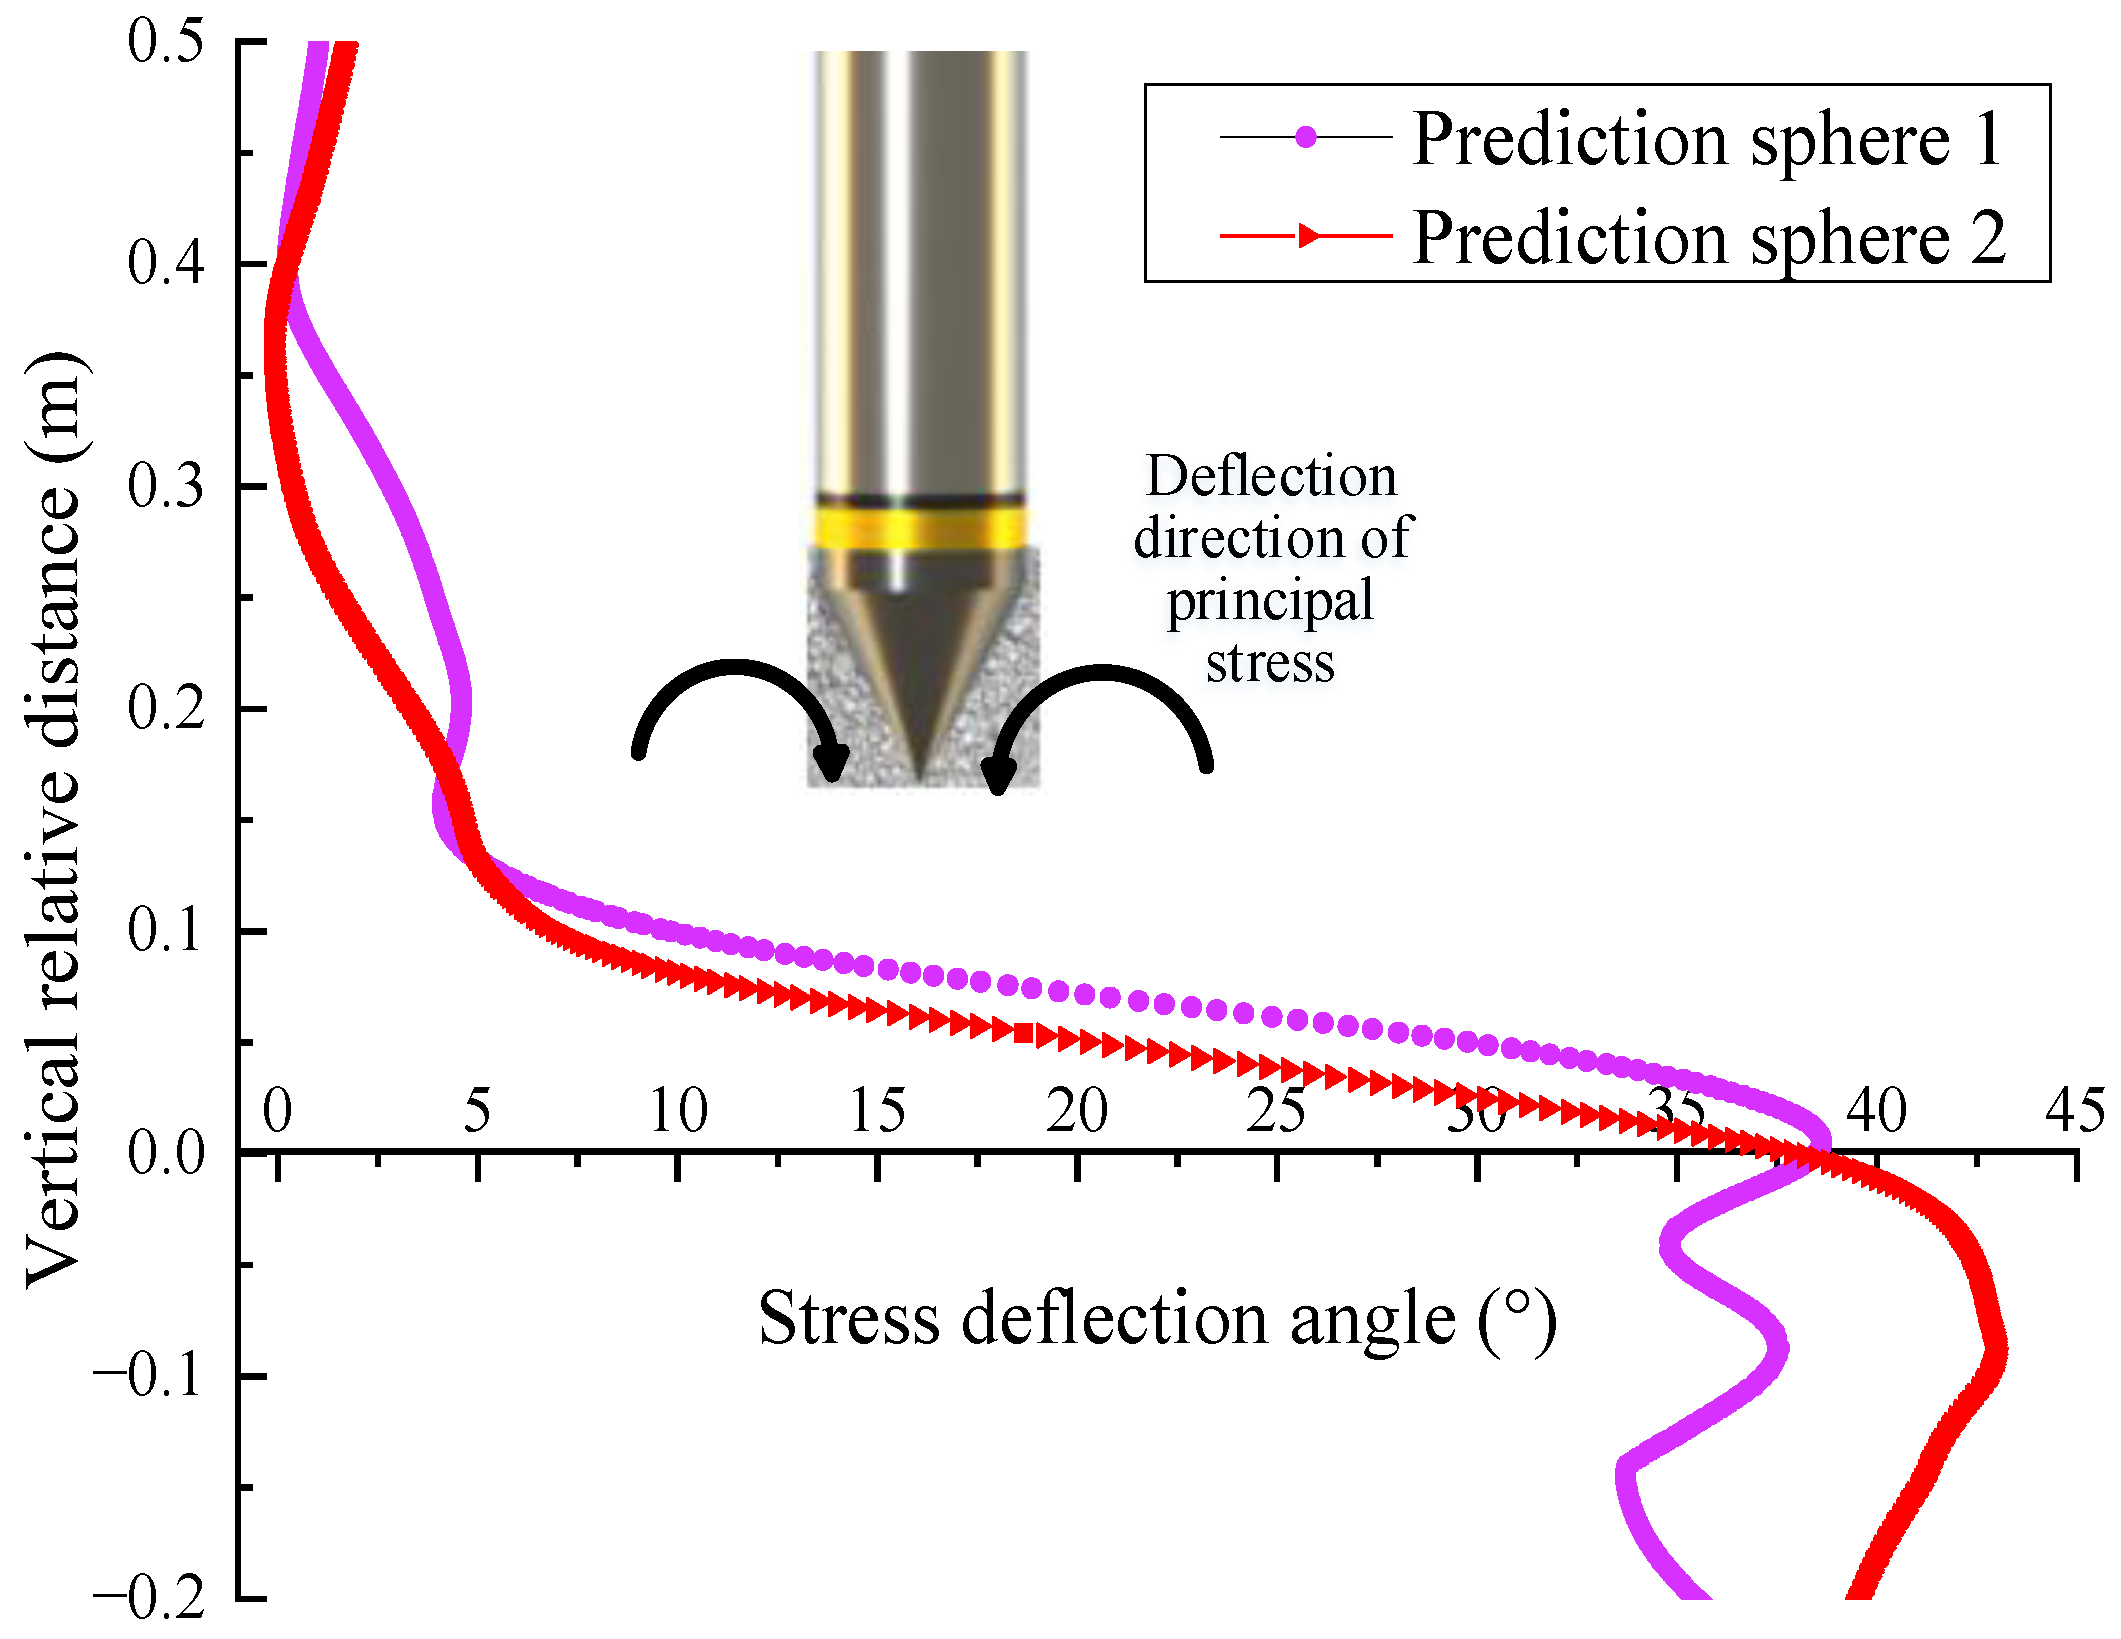
Figure 9 shows the evolution of the principal stress direction during cone penetration. The local stress tensor within each measurement sphere was determined from the particle contact forces, and the principal stress directions were obtained by eigenvalue decomposition of the stress tensor.
Figure 9.
Evolution of principal stress rotation during cone penetration.
When the cone tip is far from the measurement location, the rotation of the principal stress axes is small, generally less than 5°. As the cone approaches the measurement location, the rotation angle increases markedly and reaches a maximum of approximately 44° when the cone tip passes the measurement sphere. The rotation angle then decreases as the cone shoulder passes and gradually approaches a stable value.
The principal stress direction rotates generally toward the cone tip during penetration, consistent with the observations reported by Liu et al. [42]. This response indicates that the local stress state around the penetrometer undergoes substantial directional redistribution and therefore differs from the idealized stress condition assumed in cylindrical cavity expansion.
The principal-stress rotation occurs together with the loading–unloading response and radial-stress reduction described above, indicating substantial stress redistribution around the advancing cone. These combined changes in stress magnitude and direction cause the stress state at the friction sleeve to differ from the peak stress state developed near the cone shoulder. In the present framework, this difference is represented by the stress-reduction coefficient α, which quantifies the reduction in radial stress from the cone-shoulder region to the friction sleeve.
3.5. Verification of the Theoretical Results
Using the soil parameters listed in Table 1, the limiting cavity-expansion stress is calculated as pa = 0.612 MPa. With the soil–sleeve interface friction coefficient defined as μ = tan(φ/3), Equation (8) gives a theoretical sleeve friction of 62.5 kPa when the stress-reduction coefficient is taken as α = 1. This estimate assumes that the limiting cavity-expansion stress is fully maintained along the friction sleeve. However, the coupled FDM–DEM results indicate that the radial stress decreases after the cone shoulder passes a given soil element, reaching approximately 70% of its peak value at the middle of the friction sleeve. Incorporating the numerically derived coefficient (α ≈ 0.7) therefore reduces the predicted sleeve friction to 43.8 kPa.
The theoretical predictions were compared with the in situ CPT measurements to evaluate the effect of radial-stress reduction. The measured sleeve friction ranges from 17.2 to 60.5 kPa, with a mean value of 25.9 kPa. Without accounting for stress reduction, the predicted value of 62.5 kPa exceeds the maximum measured value. After introducing the stress-reduction coefficient, the prediction decreases to 43.8 kPa and falls within the measured range. The relative error with respect to the measured mean consequently decreases from 141.3% to 69.1%. These results indicate that accounting for radial-stress reduction improves the consistency between the cavity-expansion-based prediction and the field measurements, although a substantial difference from the measured mean remains.
The remaining discrepancy suggests that radial-stress reduction is only one of the factors governing sleeve friction. First, the limiting cavity-expansion stress is derived using an idealized elastic–perfectly plastic Mohr–Coulomb model under an axisymmetric initial stress condition. This formulation provides a simplified reference stress and cannot fully reproduce the stress redistribution and constitutive response of the soil during actual cone penetration. Second, the assumed interface friction coefficient, μ = tan(φ/3), represents a simplified description of soil–sleeve interaction and may not accurately reflect the mobilized interface friction under the local stress and deformation conditions. In addition, transient pore-pressure generation and dissipation are not explicitly considered in the present theoretical formulation. The individual contributions of these factors to the prediction discrepancy cannot be quantified from the available results.
Overall, introducing the stress-reduction coefficient provides a more physically consistent representation of the radial stress acting on the friction sleeve than directly using the limiting cavity-expansion stress. Nevertheless, the coefficient (α ≈ 0.7) should be regarded as a case-specific correction for the investigated silty clay and CPT configuration rather than a universal calibration factor that guarantees agreement between theoretical predictions and field measurements. Further numerical and experimental investigations incorporating more realistic soil–sleeve interface behavior and a wider range of soil and stress conditions are needed to assess the broader applicability of the proposed approach.
4. Conclusions
This study investigated the evolution of radial stress from the cone-shoulder region to the friction sleeve during CPT penetration using a coupled FDM–DEM model. Cylindrical cavity-expansion theory was combined with the numerical analysis to examine the relationship between the limiting cavity-expansion stress and sleeve friction. The main conclusions are as follows:
(1) The soil surrounding the penetrometer undergoes a pronounced loading–unloading process during penetration. The radial stress increases as the cone approaches, reaches a maximum near the passage of the cone shoulder, and subsequently decreases toward the friction sleeve. The limiting cavity-expansion stress therefore cannot be directly regarded as the radial stress acting on the sleeve.
(2) The reduction in radial stress is accompanied by changes in both stress magnitude and stress direction. After passage of the cone shoulder, the mean and deviatoric stresses decrease, while the principal stress axes undergo substantial rotation. These responses indicate significant stress redistribution between the cone-shoulder region and the friction sleeve and distinguish the actual CPT stress path from the idealized cylindrical cavity-expansion condition.
(3) A stress-reduction coefficient α was introduced to characterize the decrease in radial stress from the cone-shoulder region to the friction sleeve. For the investigated silty clay and the adopted CPT configuration, the coupled analysis gives an equivalent value of approximately α = 0.7, indicating that the radial stress at the middle of the friction sleeve is about 70% of the peak value near the cone shoulder.
(4) Incorporating the stress-reduction coefficient decreases the cavity-expansion-based sleeve-friction estimate from approximately 62.5 kPa for α = 1 to 43.8 kPa for α ≈ 0.7. The latter value remains higher than the measured mean sleeve friction of 25.9 kPa. Radial-stress reduction is therefore an important component of the sleeve-friction mechanism, but the remaining discrepancy indicates that the prediction is also affected by the constitutive representation of the soil and the assumed soil–sleeve interface behavior.
The value α ≈ 0.7 obtained in this study is specific to the investigated silty clay, initial stress state, penetration conditions, and penetrometer geometry and should not be regarded as a universal constant. Further numerical and experimental studies covering different soil types, stress histories, and probe geometries are required to establish the variability and broader applicability of the stress-reduction coefficient.
Author Contributions
Conceptualization, D.T.; methodology, D.T.; software, D.T.; validation, Y.M.; formal analysis, Y.M.; investigation, D.T.; resources, D.T.; data curation, Y.M.; writing—original draft preparation, D.T.; writing—review and editing, D.T.; visualization, Y.M.; supervision, Y.M.; project administration, D.T.; funding acquisition, D.T. All authors have read and agreed to the published version of the manuscript.
Funding
This study was funded by the Key Scientific Research Project of the Department of Education of Anhui Province, grant number 2025AHGXZK30606.
Institutional Review Board Statement
Not applicable.
Informed Consent Statement
Not applicable.
Data Availability Statement
The raw data supporting the conclusions of this article will be made available by the authors on request.
Conflicts of Interest
The authors declare no conflicts of interest.
References
- Robertson, P.K. Cone penetration test (CPT)-based soil behaviour type (SBT) classification system—An update. Can. Geotech. J. 2016, 53, 1910–1927. [Google Scholar] [CrossRef] [Scilit]
- Wang, C.; Osorio-Murillo, C.A.; Zhu, H.; Rubin, Y. Bayesian approach for calibrating transformation model from spatially varied CPT data to regular geotechnical parameter. Comput. Geotech. 2017, 85, 262–273. [Google Scholar] [CrossRef] [Scilit]
- Gharsallaoui, H.; Jafari, M.; Holeyman, A. Pile end bearing capacity in rock mass using cavity expansion theory. J. Rock Mech. Geotech. 2020, 12, 1103–1111. [Google Scholar] [CrossRef] [Scilit]
- Singh, S.; Patra, N.R. Axial behavior of tapered piles using cavity expansion theory. Acta Geotech. 2020, 15, 1619–1636. [Google Scholar] [CrossRef] [Scilit]
- Liu, X.; Cai, G.; Liu, L.; Liu, S.; Duan, W.; Puppala, A.J. Improved p-y curve models for large diameter and super-long cast-in-place piles using piezocone penetration test data. Comput. Geotech. 2021, 130, 103911. [Google Scholar] [CrossRef] [Scilit]
- Chen, S.L.; Abousleiman, Y.N. Exact undrained elasto-plastic solution for cylindrical cavity expansion in modified Cam Clay soil. Géotechnique 2012, 62, 447–456. [Google Scholar] [CrossRef] [Scilit]
- Chen, S.L.; Abousleiman, Y.N. Exact drained solution for cylindrical cavity expansion in modified Cam Clay soil. Géotechnique 2013, 63, 510–517. [Google Scholar] [CrossRef] [Scilit]
- Li, L.; Li, J.; Sun, D.A. Anisotropically elasto-plastic solution to undrained cylindrical cavity expansion in K0-consolidated clay. Comput. Geotech. 2016, 73, 83–90. [Google Scholar] [CrossRef] [Scilit]
- Chen, H.; Li, L.; Li, J.; Sun, D.A. Elastoplastic solution to drained expansion of a cylindrical cavity in anisotropic critical-state soils. J. Eng. Mech. 2020, 146, 04020036. [Google Scholar] [CrossRef] [Scilit]
- Zhou, H.; Liu, H.; Wang, Z.; Tong, L. Analytical solution for cavity expansion in rate-dependent and strain-softening clay and its application for CPT tests. J. Eng. Mech. 2021, 147, 04021004. [Google Scholar] [CrossRef] [Scilit]
- DeJong, J.T.; Frost, J.D.; Cargill, P.E. Effect of surface texturing on CPT friction sleeve measurements. J. Geotech. Geoenviron. Eng. 2001, 127, 158–168. [Google Scholar] [CrossRef] [Scilit]
- Lehane, B.M.; White, D.J. Lateral stress changes and shaft friction for model displacement piles in sand. Can. Geotech. J. 2005, 42, 1039–1052. [Google Scholar] [CrossRef] [Scilit]
- Ahmadi, M.M.; Robertson, P.K. Cone penetration test in sand: A numerical-analytical approach. Comput. Geotech. 2017, 90, 176–189. [Google Scholar] [CrossRef] [Scilit]
- Doan, L.V.; Lehane, B.M. CPT data in normally consolidated soils. Acta Geotech. 2021, 16, 2877–2885. [Google Scholar] [CrossRef] [Scilit]
- Breugnot, A.; Lambert, S.; Villard, P.; Gotteland, P. A discrete/continuous coupled approach for modeling impacts on cellular geostructures. Rock Mech. Rock Eng. 2016, 49, 1831–1848. [Google Scholar] [CrossRef] [Scilit]
- Ma, Y.; Sheng, Q.; Zhang, G.; Cui, Z. A 3D discrete-continuum coupling approach for investigating the deformation and failure mechanism of tunnels across an active fault: A case study of Xianglushan tunnel. Appl. Sci. 2019, 9, 2318. [Google Scholar] [CrossRef] [Scilit]
- Chen, P.Y.; Chantharayukhonthorn, M.; Yue, Y.; Grinspun, E.; Kamrin, K. Hybrid discrete-continuum modeling of shear localization in granular media. J. Mech. Phys. Solids 2021, 153, 104404. [Google Scholar] [CrossRef] [Scilit]
- Kidane, M.; Peña Olarte, A.A.; Cudmani, R. Coupled DEM-FDM simulation of cone penetration tests in coarse grained soils. EPJ Web Conf. 2021, 249, 11012. [Google Scholar] [CrossRef] [Scilit]
- Song, Y.; Gu, X.; Hu, J.; Zheng, X. DEM-FDM coupled simulation of cone penetration tests in a virtual calibration chamber with sand. Chin. J. Geotech. Eng. 2025, 47, 1249–1258. [Google Scholar]
- Wang, C.; Tang, D.; Wang, K.; Wu, Z. Macro and micro coupling analysis method and application of cone penetration test. Rock Soil Mech. 2021, 42, 1815–1827. [Google Scholar]
- Kong, G.Q.; Liu, H.L.; Zhou, H. Analytical solution of undrained cylindrical cavity expansion in saturated soil under anisotropic initial stress. Comput. Geotech. 2014, 55, 232–239. [Google Scholar] [CrossRef] [Scilit]
- Wang, C.; Tang, D.; Wang, K.; Hu, B. Analytical analysis of cylindrical cavity expansion considering particle breakage effect of sand and its application for cone penetration tests. Geol. J. 2024, 59, 2426–2441. [Google Scholar] [CrossRef] [Scilit]
- Yu, H.S. Cavity Expansion Methods in Geomechanics; Springer Science & Business Media: Dordrecht, The Netherlands, 2000. [Google Scholar]
- Jardine, R.J.; Zhu, B.; Foray, P.; Dalton, C.P. Experimental arrangements for investigation of soil stresses developed around a displacement pile. Soils Found. 2009, 49, 661–673. [Google Scholar] [CrossRef] [Scilit]
- Gao, L.; Guo, N.; Yang, Z.X.; Jardine, R.J. MPM modeling of pile installation in sand: Contact improvement and quantitative analysis. Comput. Geotech. 2022, 151, 104943. [Google Scholar] [CrossRef] [Scilit]
- Butlanska, J.; Arroyo, M.; Gens, A.; O’Sullivan, C. Multi-scale analysis of cone penetration test (CPT) in a virtual calibration chamber. Can. Geotech. J. 2014, 51, 51–66. [Google Scholar] [CrossRef] [Scilit]
- Jin, Y.F.; Yin, Z.Y.; Wu, Z.X.; Daouadji, A. Numerical modeling of pile penetration in silica sands considering the effect of grain breakage. Finite Elem. Anal. Des. 2018, 144, 15–29. [Google Scholar] [CrossRef] [Scilit]
- Yang, D.; Fatahi, B. Discrete element simulation of cavity expansion in lightly cemented sands considering cementation degradation. Comput. Geotech. 2020, 124, 103628. [Google Scholar] [CrossRef] [Scilit]
- Tang, D.; Wang, C.; Hu, B.; Wang, K.; Ma, C. Calibration of geotechnical parameters based on the stochastic discrete-continuum coupling method and Bayesian theory. KSCE J. Civ. Eng. 2023, 27, 1054–1065. [Google Scholar] [CrossRef] [Scilit]
- Arroyo, M.; Butlanska, J.; Gens, A.; Calvetti, F.; Jamiolkowski, M. Cone penetration tests in a virtual calibration chamber. Géotechnique 2011, 61, 525–531. [Google Scholar] [CrossRef] [Scilit]
- O’Sullivan, C. Particulate Discrete Element Modelling: A Geomechanics Perspective; Spon Press: London, UK, 2011. [Google Scholar]
- McDowell, G.R.; Falagush, O.; Yu, H.S. A particle refinement method for simulating DEM of cone penetration testing in granular materials. Géotechnique Lett. 2012, 2, 141–147. [Google Scholar] [CrossRef] [Scilit]
- Coetzee, C.J. Review: Calibration of the discrete element method. Powder Technol. 2017, 310, 104–142. [Google Scholar] [CrossRef] [Scilit]
- Wen, R.; Tan, C.; Wu, Y.; Wang, C. Grain Size Effect on the Mechanical Behavior of Cohesionless Coarse-Grained Soils with the Discrete Element Method. Adv. Civ. Eng. 2018, 2018, 4608930. [Google Scholar] [CrossRef] [Scilit]
- Lü, X.; Ma, Y.; Qian, J.; Huang, M. Discrete-element simulation of scaling effect of strain localization in dense granular materials. Int. J. Geomech. 2019, 19, 06019006. [Google Scholar] [CrossRef] [Scilit]
- Gui, M.W.; Bolton, M.D.; Garnier, J.; Corte, J.F.; Bagge, G.; Laue, J.; Renzi, R. Guidelines for cone penetration tests in sand. In Centrifuge; Balkema: Rotterdam, The Netherlands, 1998; pp. 155–160. [Google Scholar]
- Khosravi, A.; Martinez, A.; DeJong, J.T. Discrete element model (DEM) simulations of cone penetration test (CPT) measurements and soil classification. Can. Geotech. J. 2020, 57, 1369–1387. [Google Scholar] [CrossRef] [Scilit]
- Chen, Z.; Huang, M.; Shi, Z. Application of a state-dependent sand model in simulating the cone penetration tests. Comput. Geotech. 2020, 127, 103780. [Google Scholar] [CrossRef] [Scilit]
- Lee, J.; Randolph, M.F. Penetrometer based assessment of spudcan penetration resistance. J. Geotech. Geoenviron. Eng. 2011, 137, 587–596. [Google Scholar] [CrossRef] [Scilit]
- Mo, P.Q.; Gao, X.W.; Yang, W.; Yu, H.S. A cavity expansion–based solution for interpretation of CPTu data in soils under partially drained conditions. Int. J. Numer. Anal. Methods Geomech. 2020, 44, 1053–1076. [Google Scholar] [CrossRef] [Scilit]
- Randolph, M.F. Characterisation of soft sediments for offshore applications. In Proceedings of the 2nd International Conference on Site Characterization, ISC-2; Millpress: Rotterdam, The Netherlands, 2004; pp. 209–232. [Google Scholar]
- Liu, S.; Jiang, M.J.; Fu, C.; Zhu, J.G. Distinct element analysis of cone penetration tests in structured sand ground. Rock Soil Mech. 2018, 39, 933–942. [Google Scholar]

Disclaimer/Publisher’s Note: The statements, opinions and data contained in all publications are solely those of the individual author(s) and contributor(s) and not of MDPI and/or the editor(s). MDPI and/or the editor(s) disclaim responsibility for any injury to people or property resulting from any ideas, methods, instructions or products referred to in the content. |
© 2026 by the authors. Licensee MDPI, Basel, Switzerland. This article is an open access article distributed under the terms and conditions of the Creative Commons Attribution (CC BY) license.