


Abstract
This article considers the causes of inter-column pressures (ICP) in wells and their impact on operational reliability. The analysis of Karachaganak field well stock for the period from 2001 to 2024 demonstrates that inter-column pressures manifest in a time frame of five to six years following drilling. These pressures are characterized by a spontaneous emergence and subsequent dissipation. This study proposes a mechanism where the formation of ICP is influenced by multiple factors, including cementing defects, as well as physical and chemical processes. Additionally, the geological heterogeneity of the section has been identified as a contributing factor. The results of studies employing a mobile laboratory and pumping unit are presented. The mobile laboratory unit (MLU) operates with pressure sensors in the range of 0–100 MPa (accuracy ±0.5%), a pump rate of 0.5–20 L/min, and an injection pressure up to 70 MPa; fluid sampling is performed by a discrete sampler with a volume of 500 mL. These allow the identification of sources and channels of fluid migration into the inter-column space, as well as the carrying out of technological operations to reduce and eliminate ICP. This paper sets out a risk-oriented method of inter-column pressure assessment. The proposed risk-based method classifies wells into three risk levels (low, medium, high) based on a composite index R = (P/Pmax) + (V/Vmax) + (C/Cmax) where P is annulus pressure, V is escaped fluid volume per day, C is concentration of H2S, CO2, or mercaptan, respectively, and threshold values are Pmax = 35 MPa (API RP 90), Vmax = 50 m3/day, and Cmax = 10 ppm for H2S. This method takes into account not only the pressure value, but also the volume of escaping fluid and the concentration of aggressive components. It is concluded that an integrated approach to diagnostics and management of inter-column pressures is necessary. This approach should be supported by technological solutions that ensure increased reliability and environmental safety of well operation.
1. Introduction
The analysis of the increase in the number of wells completed after drilling and those exhibiting inter-column pressure (ICP) shows that pressure in the inter-column space (annulus) is detected immediately after well construction, though only in isolated cases. In most cases, however, it appears within 5–6 years [1,2,3,4,5,6,7]. This time interval before the occurrence of inter-column pressure can be explained by the slow migration of fluid from the reservoir through microchannels in the cement sheath under the influence of the differential between bottomhole and wellhead pressures [8,9,10,11,12,13,14,15]. The most probable cause of this phenomenon may be diffusion or electro-osmotic pressure, which arises between different fluids separated by semipermeable barriers [16,17]. Such a barrier can be represented by the colmatation layer formed on the borehole wall within permeable formations. In addition, fluid migration into the annulus may be influenced by capillary forces that, under certain conditions, develop within the microchannels of the cement sheath [18,19,20,21]. These pressures may reach tens of bars. Cement degradation can be caused by various factors, including exposure to acidic environments [22], and can lead to fluid leakage at the wellbore contact [23]. Cement cannot completely prevent fluid leakage because it is a porous medium, and flaws such as microannuli, channels, and fractures can develop within the cement sheath [9,11]. The integrity of the annular seal is affected by the properties of cement, including its permeability, mechanical strength, and chemical and thermal stability [13]. Sustained casing pressure can appear after years of good well integrity due to cumulative damage to the casing-cement-rock system [1,24]. The ability of a fluid to effectively plug micro-pores and form a colmatation layer is significantly affected by the size distribution of its droplets, as larger droplets are more capable of blocking these channels [25].
The thermal field generated during well operation not only causes changes in the volume of fluid confined within the sealed space, leading to pressure buildup [26,27,28,29], but also affects other factors controlling fluid migration into the annulus, such as fluid density and rheological properties [28,30]. Alongside physicochemical processes, which include factors such as gas solubility, cement degradation, and decomposition of the liquid [22,31,32], the geology of the section penetrated by the well also contributes to the occurrence of inter-column pressure as the casing-cement-rock system experiences cumulative damage over time [1].
The scientific novelty of this work is as follows:
- For the first time, a risk-oriented method for ICP assessment is proposed that integrates pressure, escaped fluid volume, and concentration of aggressive components, with quantitative thresholds validated on field data;
- A working hypothesis is proposed, suggesting that natural physical fields (electroosmosis, diffusion, capillary forces) as potential drivers of ICP in the majority of wells are suggested through correlation analysis and hydrodynamic testing;
- A mobile laboratory unit and pumping unit are characterized with full quantitative specifications, enabling reproducible diagnostics;
- Statistical analysis of 165 wells over 23 years at the Karachaganak field reveals that cementing quality coefficient (Cg = 39–43%) is not a key factor, and that geological heterogeneity zones control ICP distribution. Compared to existing literature [1,21], our work provides a field-validated, multi-parameter risk assessment framework rather than isolated pressure measurements.
The specific objectives of this study are: (i) to identify the physical and chemical mechanisms responsible for delayed ICP appearance (5–6 years after drilling); (ii) to develop a mobile diagnostic unit with quantitative performance metrics for ICP source identification; (iii) to propose and validate a risk-based classification system for ICP wells; and (iv) to evaluate the effectiveness of multiple injection-bleed off techniques for ICP mitigation.
2. Materials and Methods
2.1. Mobile Laboratory Unit (MLU) for Investigating ICP Causes
As demonstrated above, the identification of the underlying causes of inter-column pressure (ICP) is a task of paramount importance. In order to achieve this objective, a series of technical measures have been implemented, including the development of a mobile laboratory unit and a pumping unit. In addition, a range of methodological techniques has been devised for the identification of sources and channels of fluid migration.
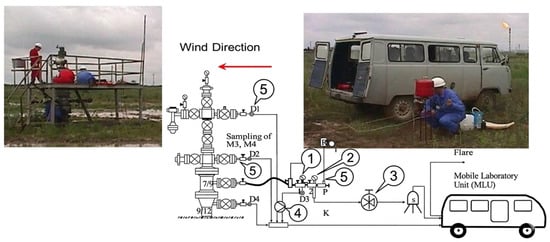
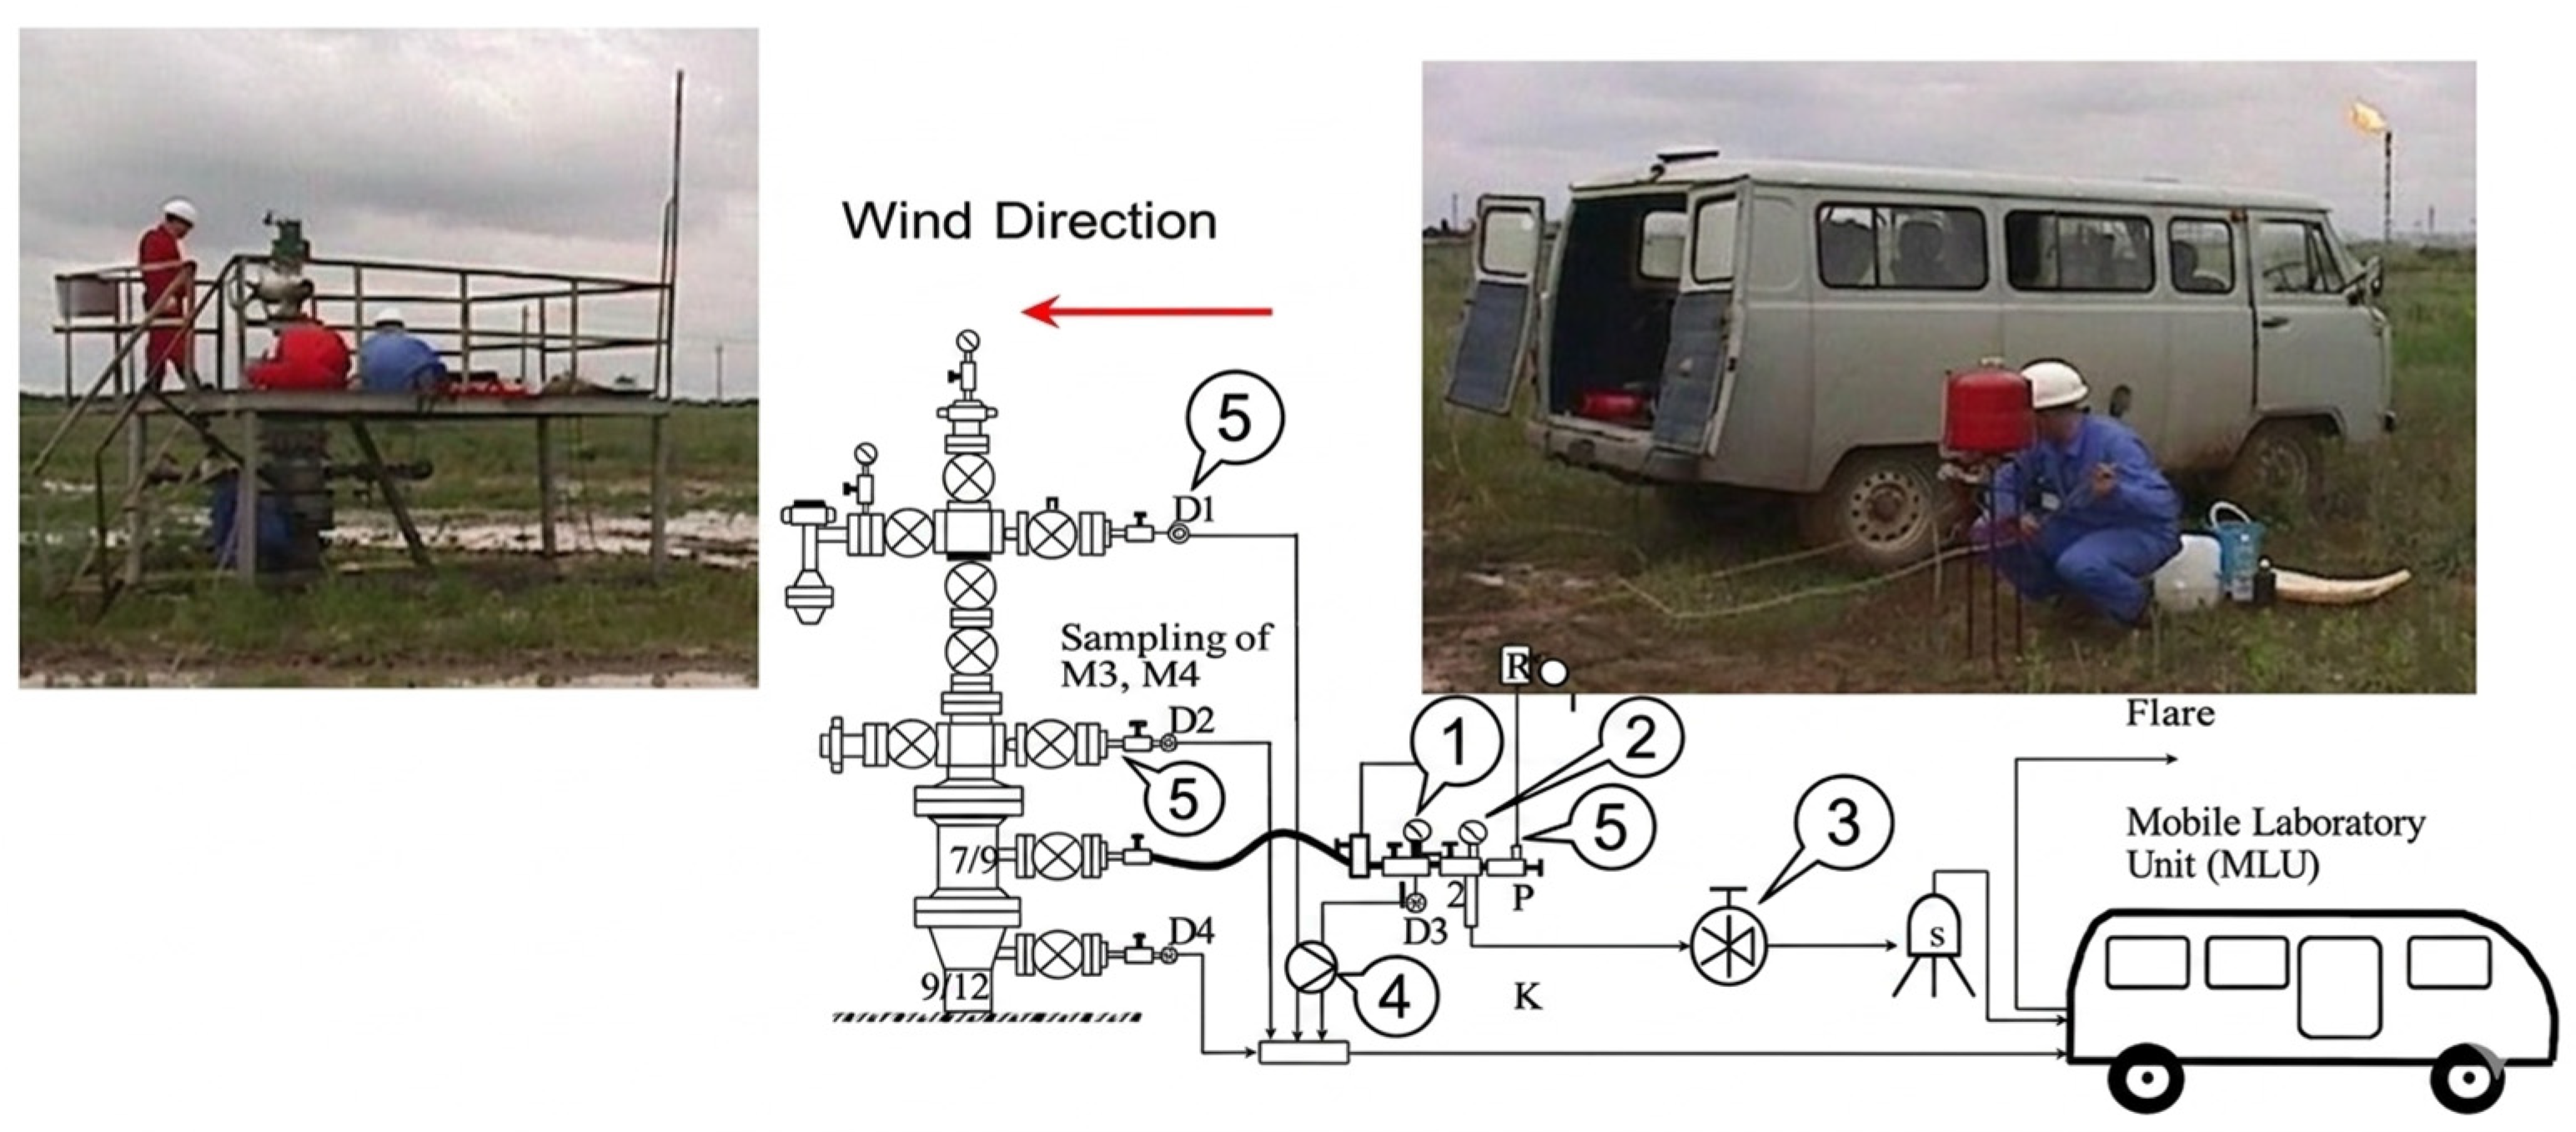
As illustrated in Figure 1, the mobile laboratory unit (MLU) is depicted, along with its connection to the well.
Figure 1.
Investigation of the causes of inter-column pressure (ICP): 1—pressure sensor, 2—temperature sensor, 3—flow meter, 4—pump, 5—sampler.
The MLU is equipped with the following sensors and components: pressure transducer range 0–100 MPa, accuracy ±0.5% full scale; temperature sensor −20 to +150 °C, accuracy ±0.5 °C; Coriolis flow meter range 0–50 L/min, accuracy ±0.2%; pump unit with variable rate 0.5–20 L/min, maximum injection pressure 70 MPa; discrete sampler volume 500 mL, with six sample bottles. All equipment conforms to ISO 17025 and API RP 90 standards for well integrity testing. The application can be utilized to facilitate the identification of the underlying causes and sources of ICP in a variety of scenarios.
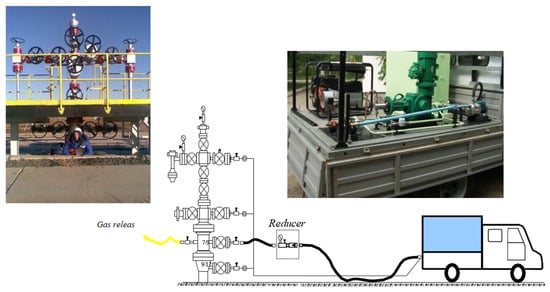
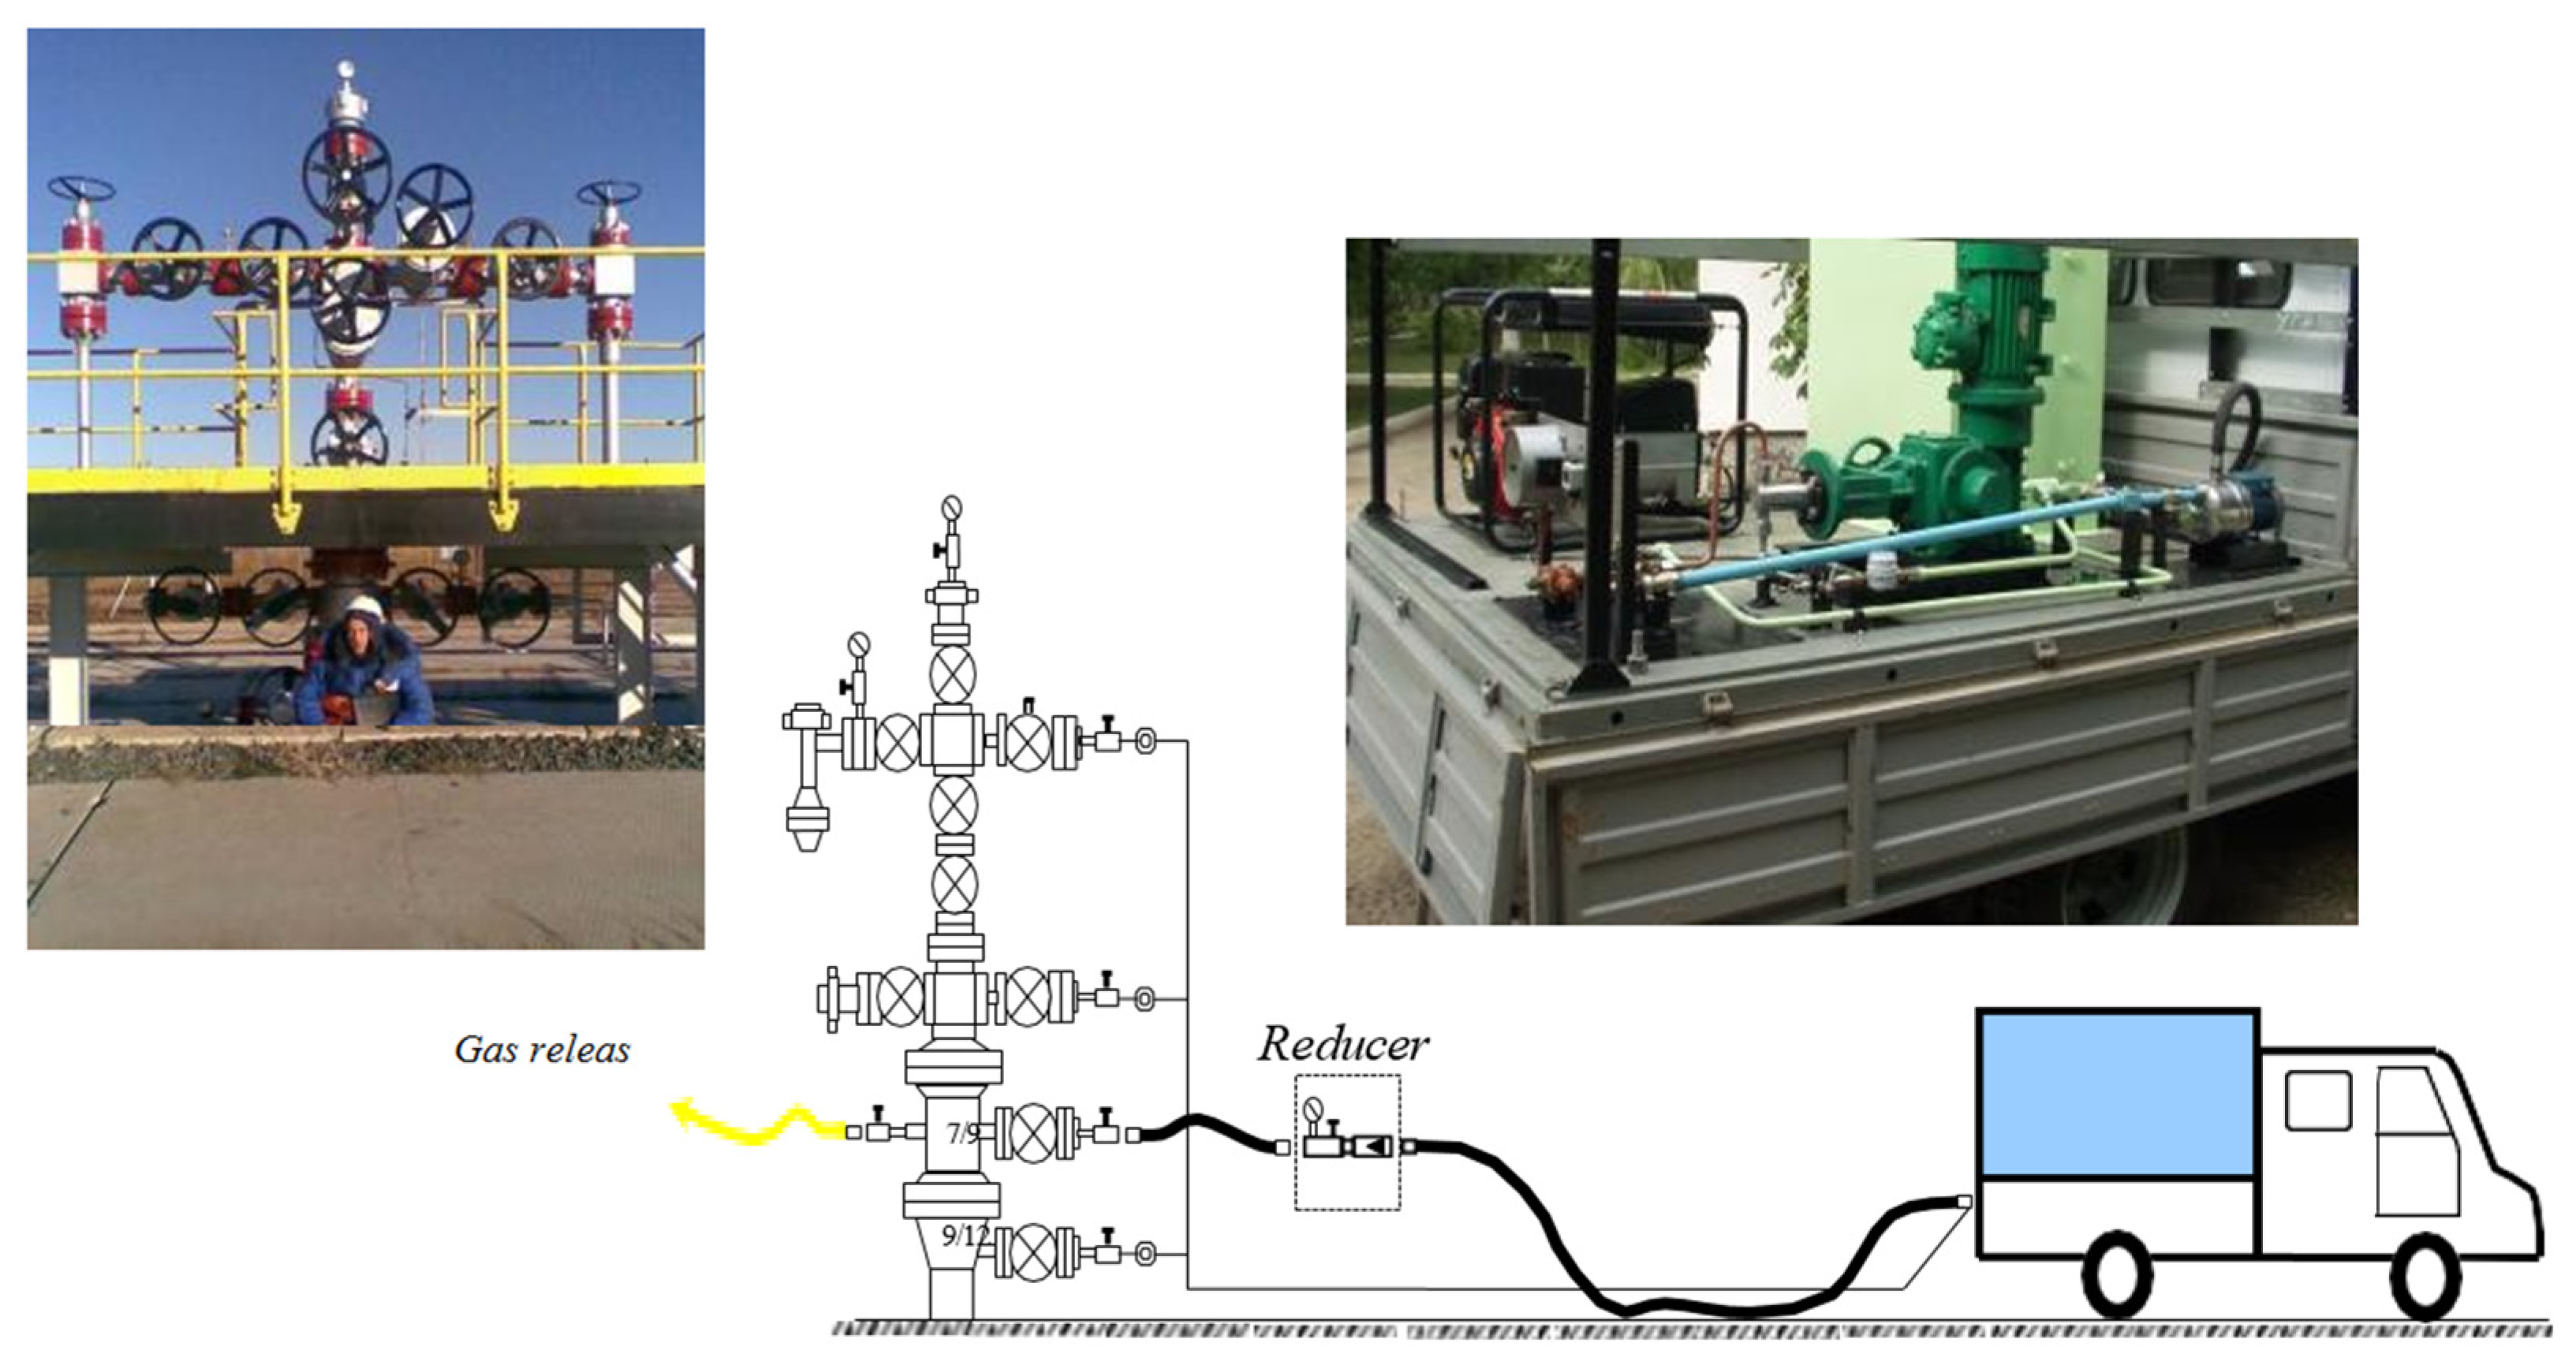
As illustrated in Figure 2, the autonomous pumping unit facilitates the investigation of ICP causes and the injection of technological solutions to reduce and eliminate ICP. The unit incorporates a dosing pump, a tank for the preparation of process solution, and a power plant, thereby ensuring autonomous operation of the unit at wells.
Figure 2.
Autonomous pumping unit for injecting fluids into the annulus.
To ensure the reproducibility of the results and the efficiency of the treatment, the selection of injection fluids was based on their chemical functionality and ability to form stable barriers within the micro-channels. The technological solutions utilized were primarily water-based suspensions of high-dispersion bentonite. These are designed to facilitate the formation of a colmatation clay layer within the cement ring or at the borehole wall, which acts as a semipermeable membrane to block fluid migration.
In scenarios where the annulus exhibited low injectivity, viscous plugging solutions based on water-soluble polymers were employed. The effectiveness of these polymer-based systems is highly dependent on the size distribution of their droplets or particles, as specifically sized droplets are required to effectively bridge and plug the micro-pores and channels within the cement sheath. Furthermore, for the long-term sealing of micro-annuli and cement channeling, the methodology considers the application of nano-silica gels, which provide superior penetration into micro-fine spaces, followed by solidification to ensure wellbore integrity.
2.2. Hydrodynamic Well Testing
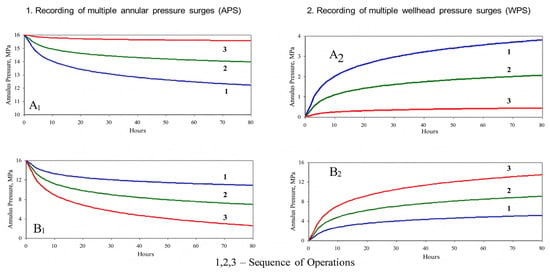
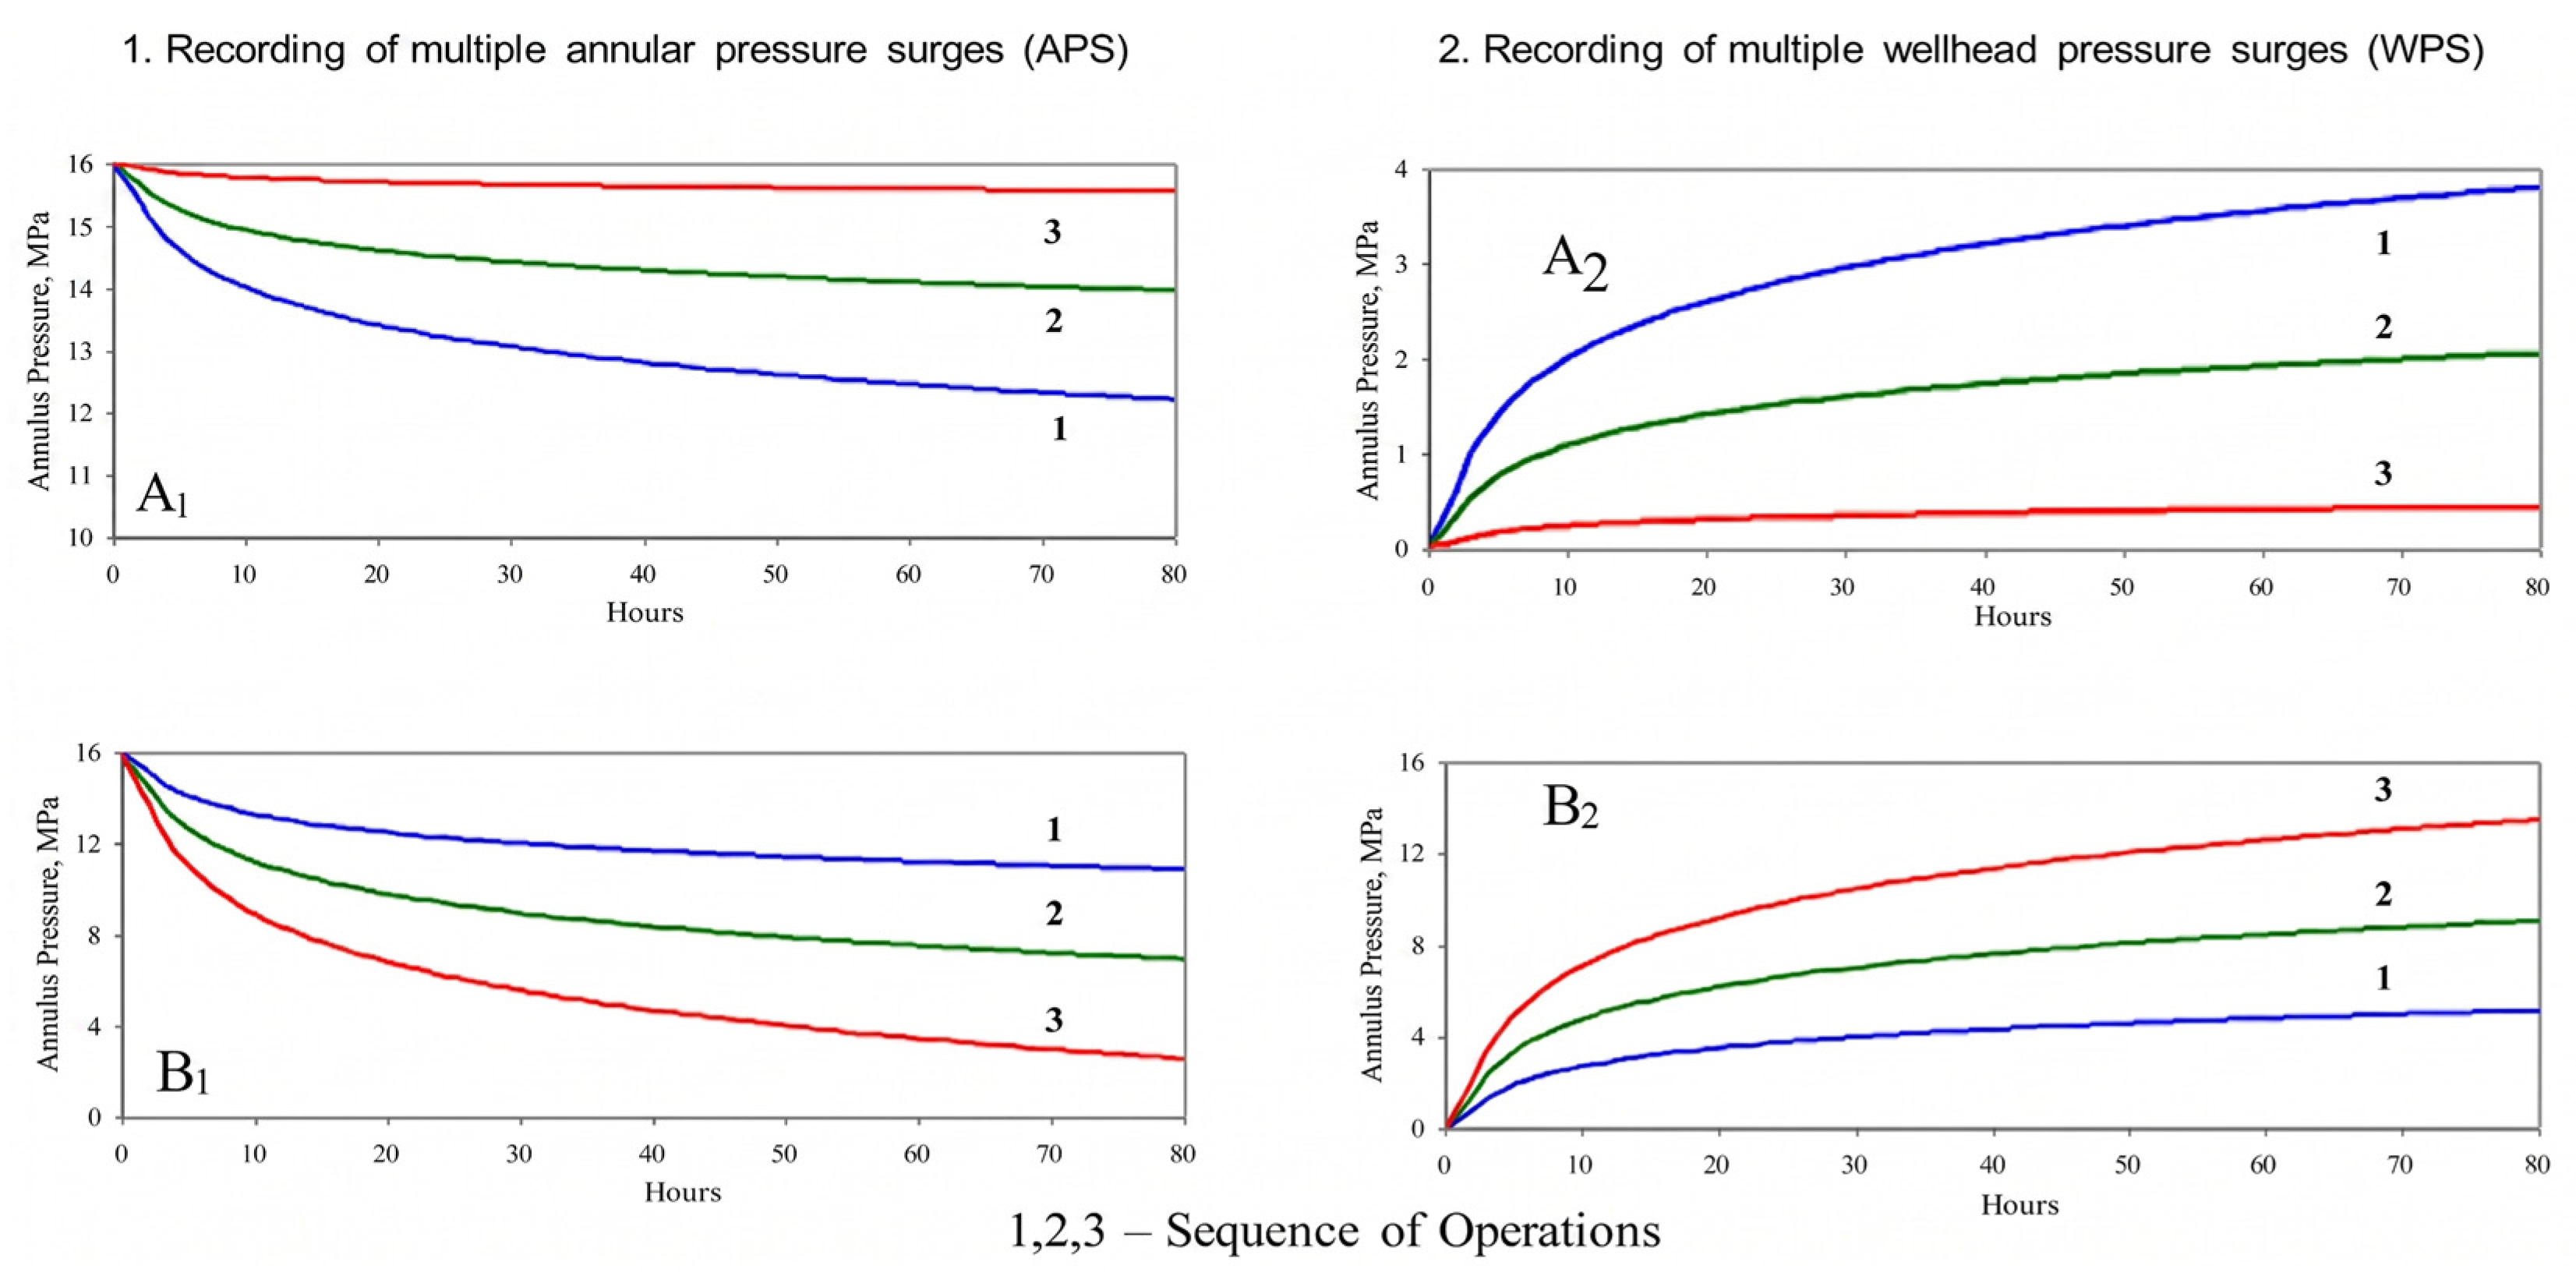
Hydrodynamic studies facilitated by the pumping unit permit the determination of the injectivity of the well with a high degree of accuracy, as well as the filtration characteristics of the microchannels that connect the inter-columnar space with the ICP source. For this purpose, either the method of maintaining constant injection pressure or the method of its multiple recovery is employed (Figure 3, curves A1 and B1).
Figure 3.
Hydrodynamic testing—left: constant-pressure injection (A1) and variable-rate injection (B1); right: pressure recovery curves ((A2)—weak connectivity, (B2)—recharge).
The specific volume of the annular spaces examined in this study typically ranges from 15 to 45 m3, depending on wellbore depth and casing design, with some calculations performed for depths up to 4700 m. To ensure the required “high degree of accuracy” in recording pressure fluctuations, the mobile laboratory unit (MLU) was equipped with electronic pressure sensors with a sensitivity of 0.01 MPa. This level of accuracy is critical for detecting “divergent behavior” in the pressure buildup curves (A2 and B2) and identifying the presence of microchannels in the cement sheath or wellhead seals.
The injection test procedure is as follows: (1) The annulus is bled to zero pressure; (2) A constant pressure (e.g., 5, 10, 20 MPa) is applied using the pump, and the injection rate q [m3/s] is recorded every 10 s; (3) Injectivity index I = q/∆P [m3/(s-Pa)] is calculated; (4) After reaching steady state, the pump is stopped and pressure buildup is monitored for 24 h. Permeability k of the microchannels is estimated using the steady-state radial flow equation k = (q µ ln(re/rw))/(2πh ∆P), where µ is fluid viscosity (measured in MLU), h is channel height (estimated from cement thickness), and re and rw are external and internal radii, respectively. The method of multiple pressure recovery (curves A2, B2) involves bleeding fluid, shutting in, and recording pressure versus time, and the slope of the semi-log plot yields transmissibility.
The case of decreasing pressure drop curves (A1) is indicative of a tight or low-permeable intercasing, and B1 is associated with an increase in the rate of fluid outflow from the intercasing to the source or drainage of the overflow channel. The divergent behavior exhibited by the curves upon repeated pressure recovery due to fluid bleeding from the inter-column space is illustrated by curves A2 and B2. Should the pressure be reduced (A2 curves), the connection with the source is weak or absent. Should the pressure value be restored at a constant level or increase (curves B2), this would indicate the presence of a channel in the cement ring or wellhead seals.
2.3. Laboratory Setup for Studying Electric Field Effects on Filtration
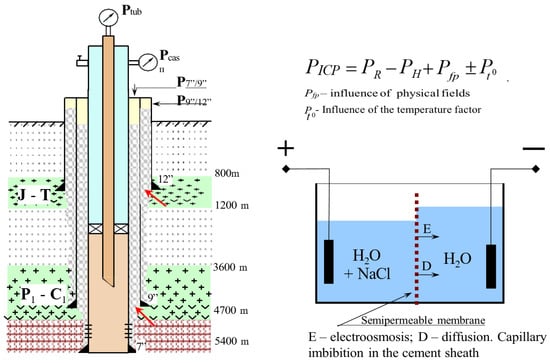
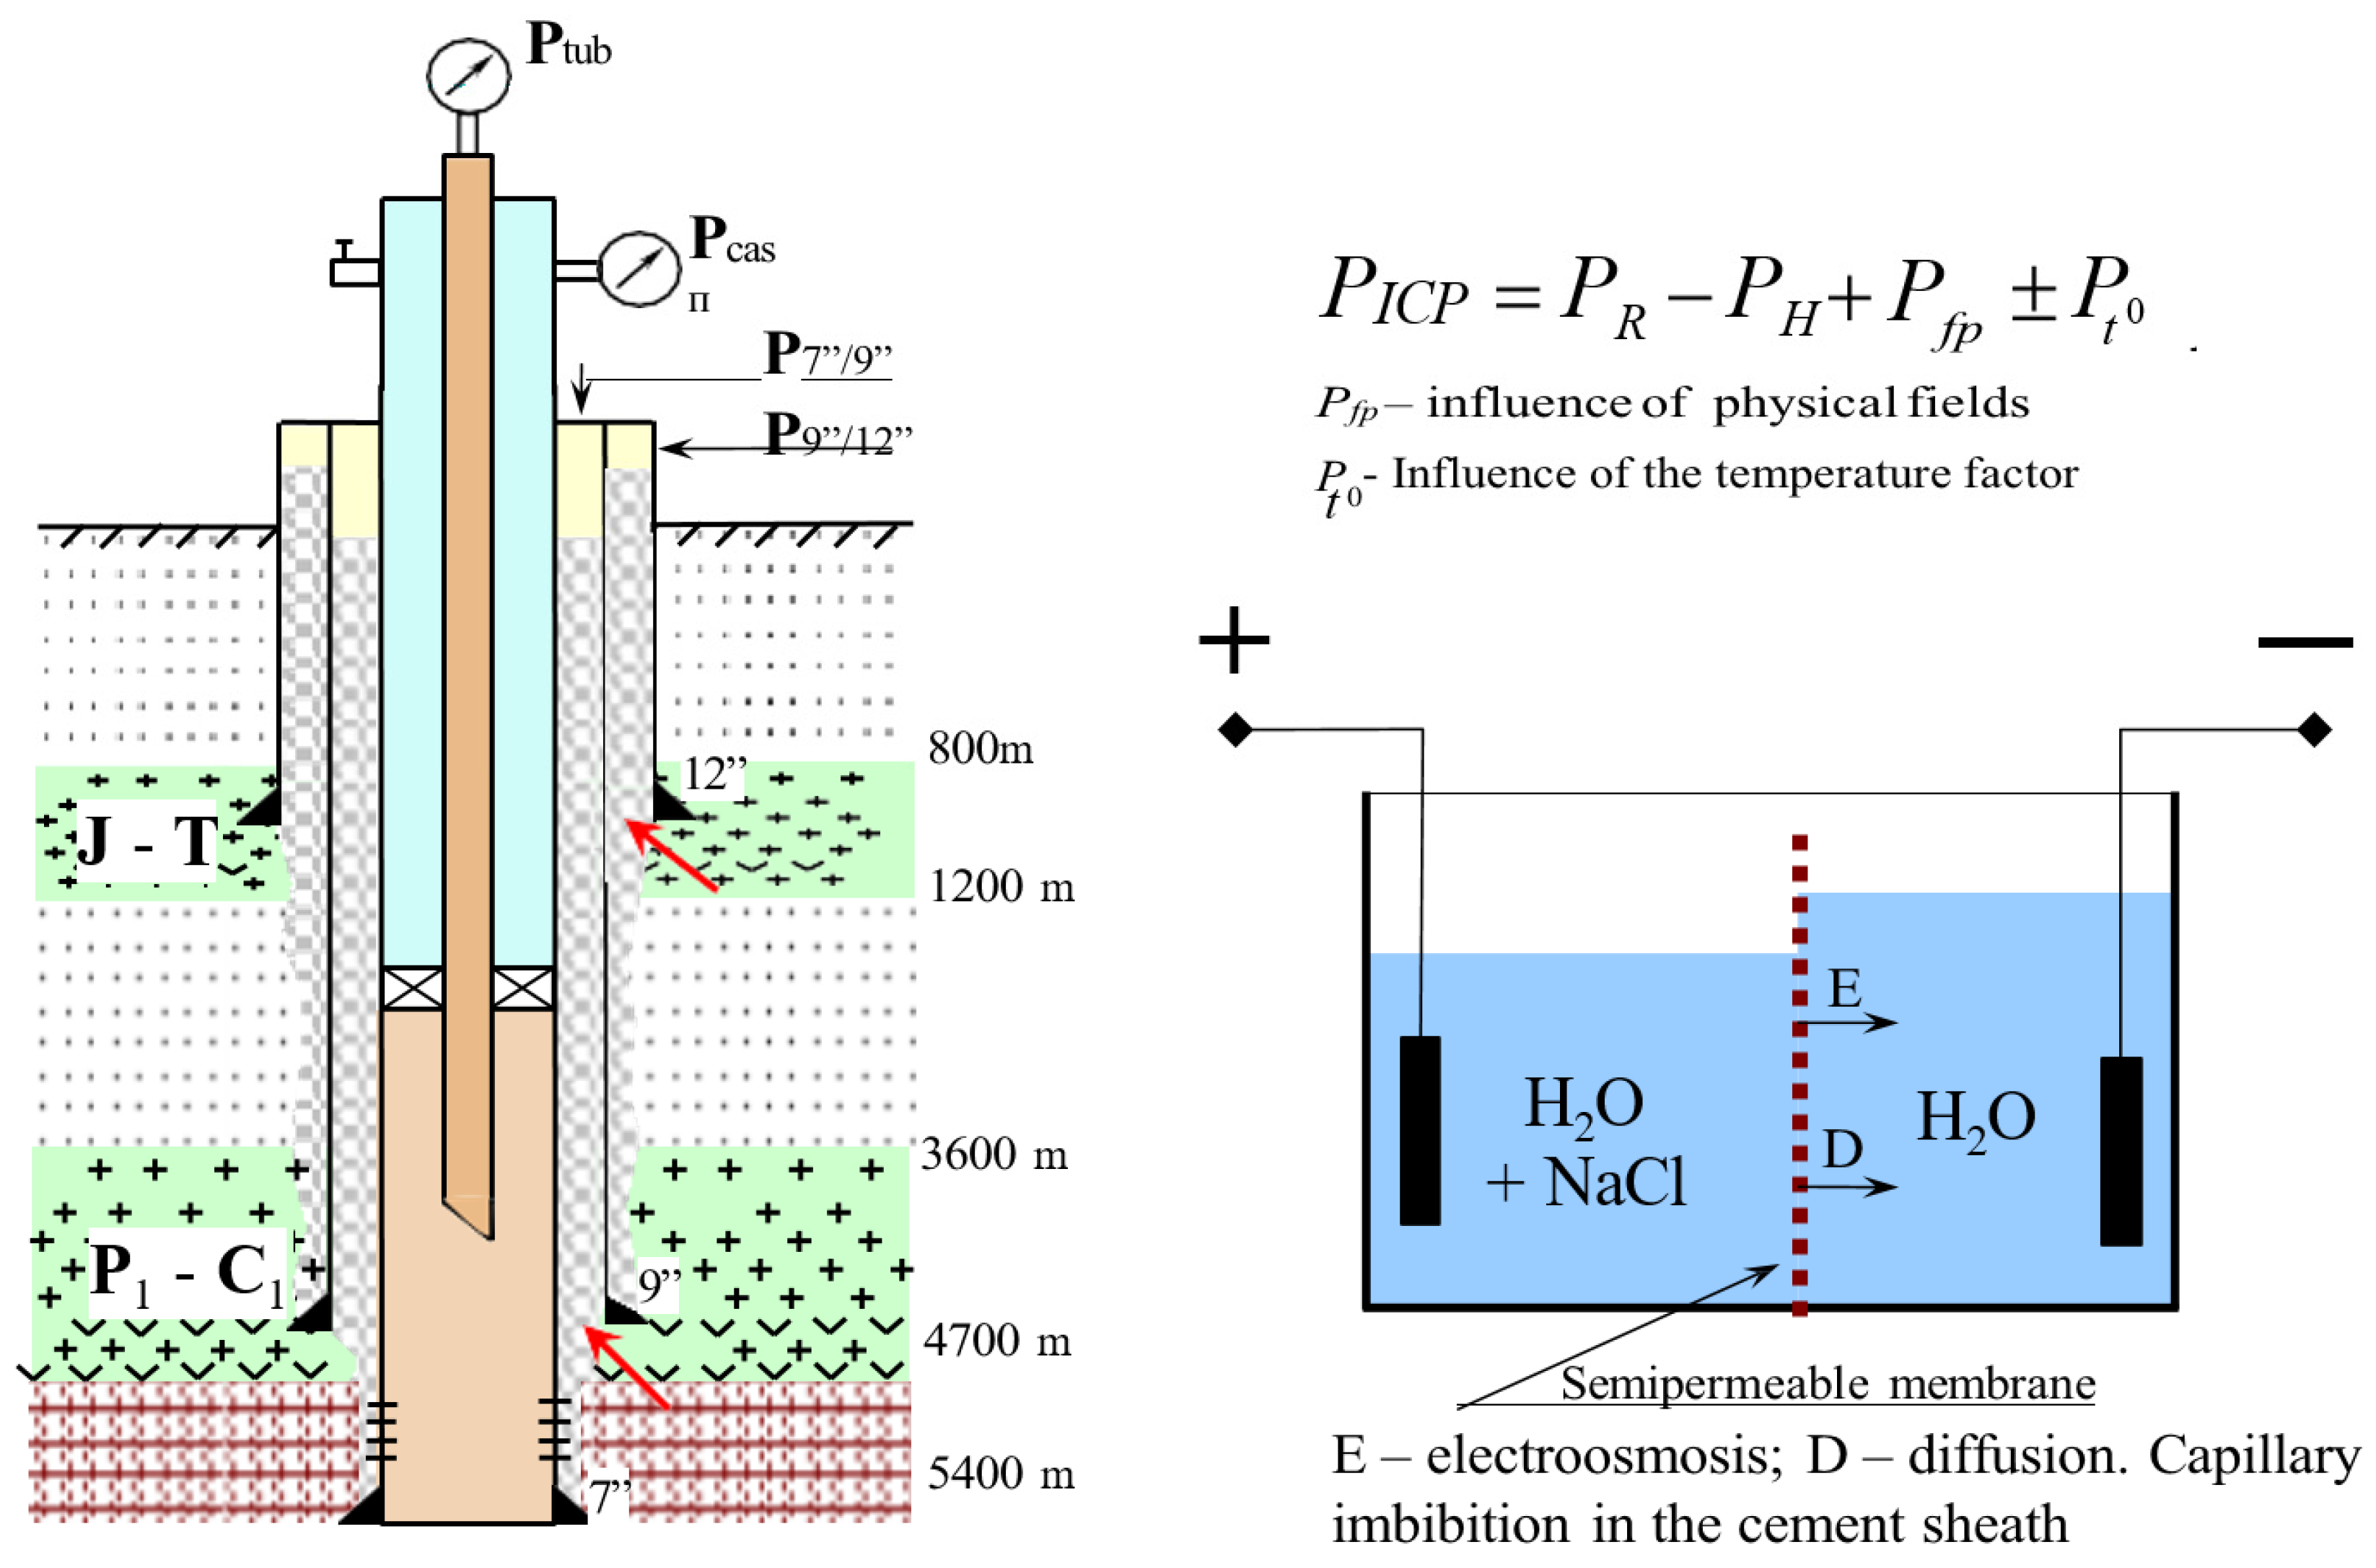
It can be stated that, in general, the accumulated experience on the filtration of multiphase fluids through porous media demonstrates that the process of fluid filtration is influenced by a number of factors. In addition to hydrodynamic forces, natural pressures and physical and chemical processes can also have an effect. These processes lead to the filtration of fluids in porous media at the molecular level (e.g., capillary forces, electroosmosis, diffusion, thermal expansion). For instance, Figure 4 illustrates a laboratory configuration in which the impact of weak electric fields on the filtration of diverse liquids through a semipermeable membrane was examined. The laboratory setup consists of a cylindrical cell with a semipermeable membrane (cellulose acetate, pore size 0.1–1.0 pm, thickness 200 pm) separating two chambers filled with NaCl solution (0.01–0.1 M). The cellulose acetate membrane was selected as a proxy material with a controlled pore size (0.1–1.0 μm) that corresponds to the calculated dimensions of micro-channels within the cement stone. This choice allowed for an isolated investigation of the electric field’s influence on filtration processes, effectively excluding confounding geomechanical and structural factors that would be present in real cement samples. Electrodes (platinum, 1 cm2) apply a DC voltage of 0–10 V. Filtration rate is measured by a capillary flow meter. Results show that at 5 V, electroosmotic flow velocity reaches 0.05 mm/s for 0.05 M NaCI, which is comparable to the estimated migration velocity in cement microchannels (0.02–0.1 mm/s). This supports the hypothesis that telluric fields can induce fluid migration in wells.
Figure 4.
Well schematic showing membrane-forming zones (left) and laboratory cell (right).
In a well, such a membrane can be constituted by a colmatation layer, which is formed on the walls of permeable rocks during their opening, and in the cement ring, when clay particles are deposited in the clay solution pinch zones. The most probable areas of membrane formation are indicated by the arrow on the cased hole section depicted in Figure 4 to the left.
The mineralogical composition of this colmatation layer is primarily represented by high-dispersion bentonite (montmorillonite-rich clay). The high cation exchange capacity and specific surface area of montmorillonite are essential for the formation of a negatively charged semipermeable membrane. This mineralogy facilitates the electro-osmotic and diffusion processes that contribute to the generation of anomalous pressures within the micro-pores of the cement sheath.
3. Experimental Results
3.1. Dynamics of Changes in Well Count and ICP Cases at the Karachaganak Field
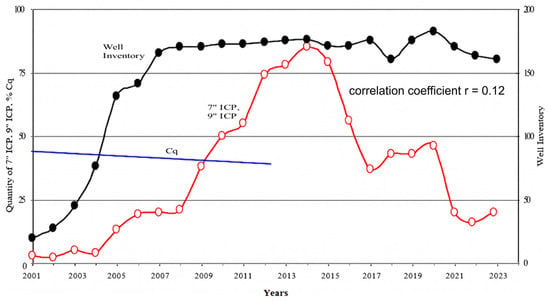
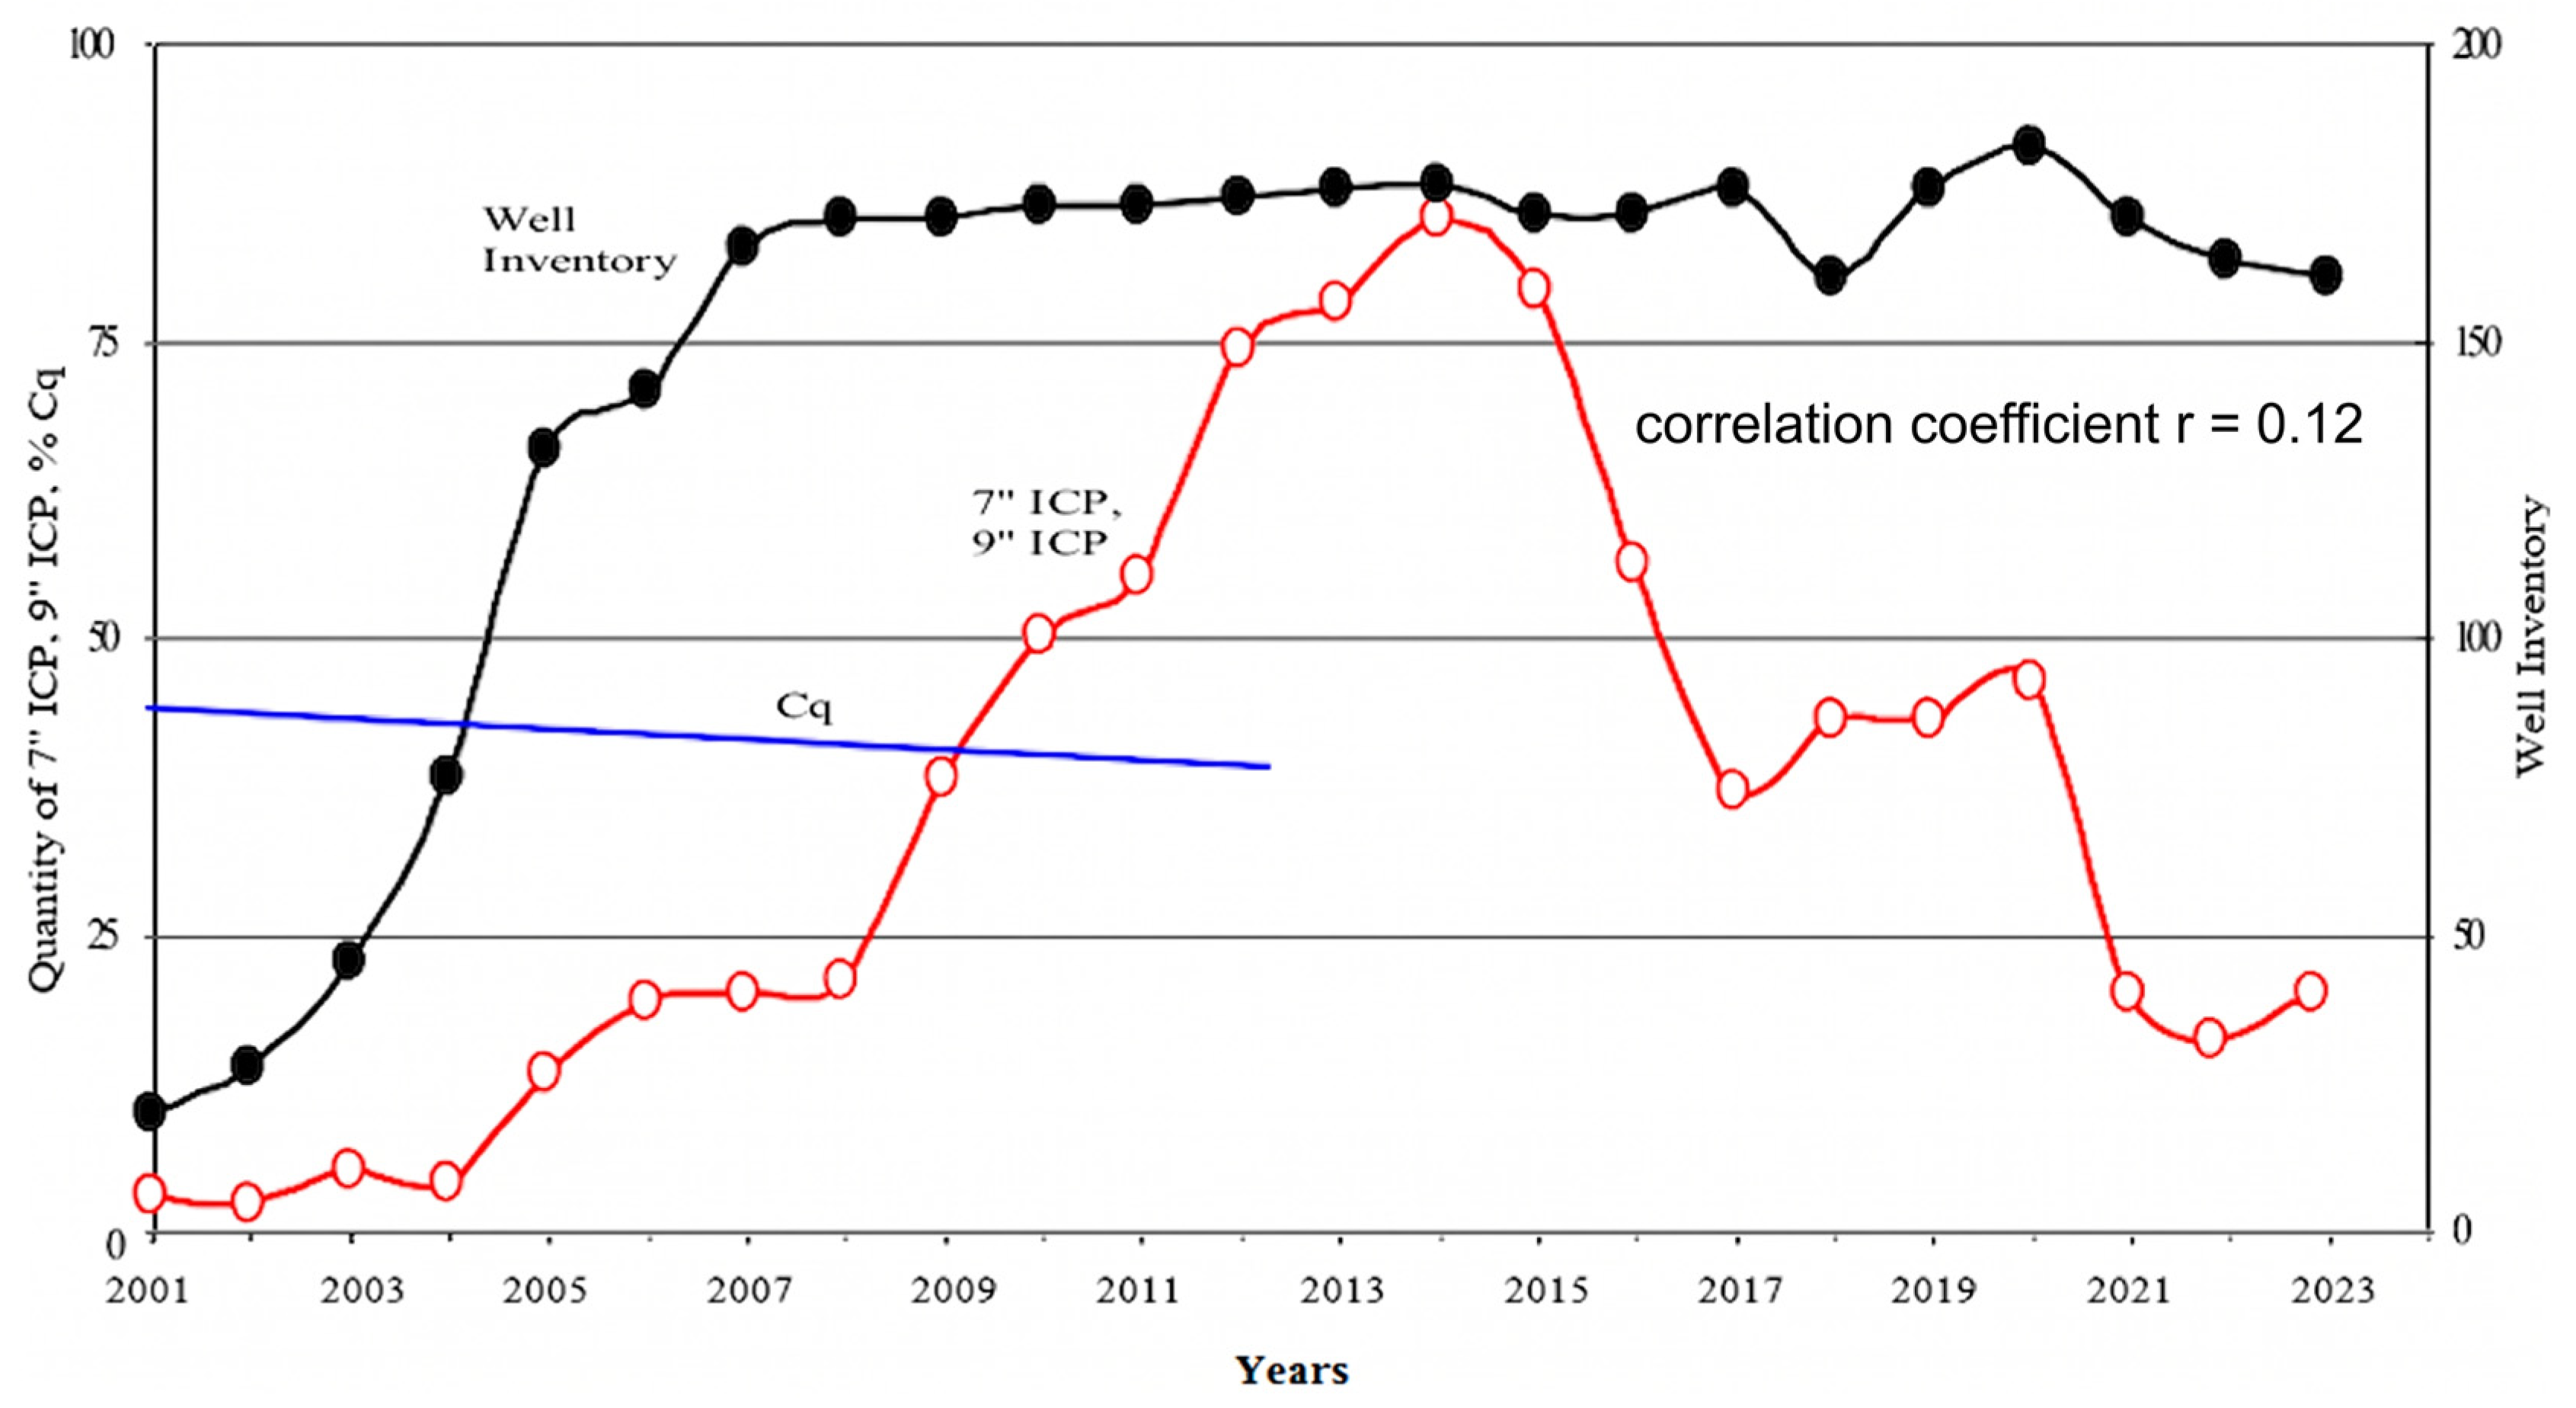
Figure 5 illustrates the dynamics of changes in the well stock and the number of cases of ICP at the Karachaganak field from the beginning of its development (2001) to the present. Figure 5 also presents the average values of the cementing quality coefficient (Cq) for all wells completed in each specific year during the period from 2001 to 2011.
Figure 5.
Changes in well inventory and quantity of wells with inter-column pressure (ICP) during operation of the Karachaganak field.
Analysis of the obtained data indicates that the average Cq value remained virtually unchanged throughout this time interval, ranging between 39 and 43%. This stability suggests that the cementing quality coefficient cannot be considered a key factor responsible for the increase in the number of wells with ICP. Statistical analysis of the 165 wells shows that the Pearson correlation coefficient between Cq and time-to-ICP onset is r = 0.12 (p > 0.05), confirming no significant linear relationship. Since 2015, however, a steady decline in the number of wells exhibiting inter-column pressure has been observed. In our view, this trend is the result of both objective and subjective factors. Among the objective factors, the decline in reservoir pressure plays a primary role, as it naturally reduces the likelihood of fluid migration into the annulus. Subjective factors include the improvement of technological practices and the implementation of a comprehensive set of measures aimed at eliminating ICP, introduced at the field by Karachaganak Petroleum Operating B.V. An additional factor contributing to this positive trend is the increase in the professional competence and skill level of the well operation personnel, which has further enhanced the efficiency of well stock management.
While the stability of Cq indicates that the initial construction quality was not the primary driver of the increasing trend in ICP cases, the dynamic role of reservoir pressure serves as the fundamental driving force for fluid migration. The characteristic 5–6-year lag observed before the manifestation of ICP can be attributed to the slow migration of reservoir fluids through the microchannels and pores of the cement sheath. This process occurs under the influence of the differential between bottomhole and wellhead pressures, where the reservoir pressure provides the necessary hydrodynamic energy to overcome capillary forces and semipermeable barriers within the annulus.
The steady decline in the number of wells with ICP observed since 2015 directly correlates with the accelerated rates of reservoir pressure depletion at the Karachaganak field. As the formation pressure decreases, the potential for fluid to initiate or maintain migration through the high-tortuosity channels of the cement ring is naturally reduced. Furthermore, our analysis indicates that in many cases, the pressures recorded in the inter-column space (calculated at depths of 4700 m) now exceed the current formation pressures. This suggests a transition where the initial hydrodynamic migration—driven by high reservoir pressure—is eventually superseded or complicated by physical and chemical factors, such as electro-osmotic or thermal expansion processes, which maintain the pressure even as the primary reservoir source depletes.
For the entire period of field operation, from 2001 to 2024, we have compiled a complete stock of 165 wells that have ever had ICPs.
3.2. Examples of ICP Dynamics in the First Thirty-Five Wells
For illustrative purposes, refer to the table (Table 1), which details the initial 35 wells on the list. In the majority of cases, the ICP manifests spontaneously, persists for a period of time, and then, once again, spontaneously disappears without the need for human intervention. The formation pressure during this period remains constant or gradually decreases. Consequently, it may indicate that natural factors are a significant contributing factor to ICP development.
Table 1.
Dynamics of inter-column pressure (ICP) at the Karachaganak field.
3.3. Geographical Distribution of Wells with ICP
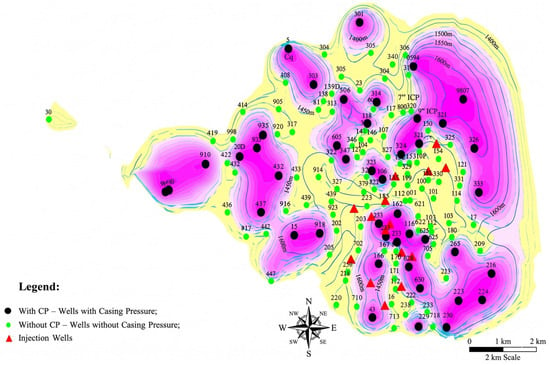
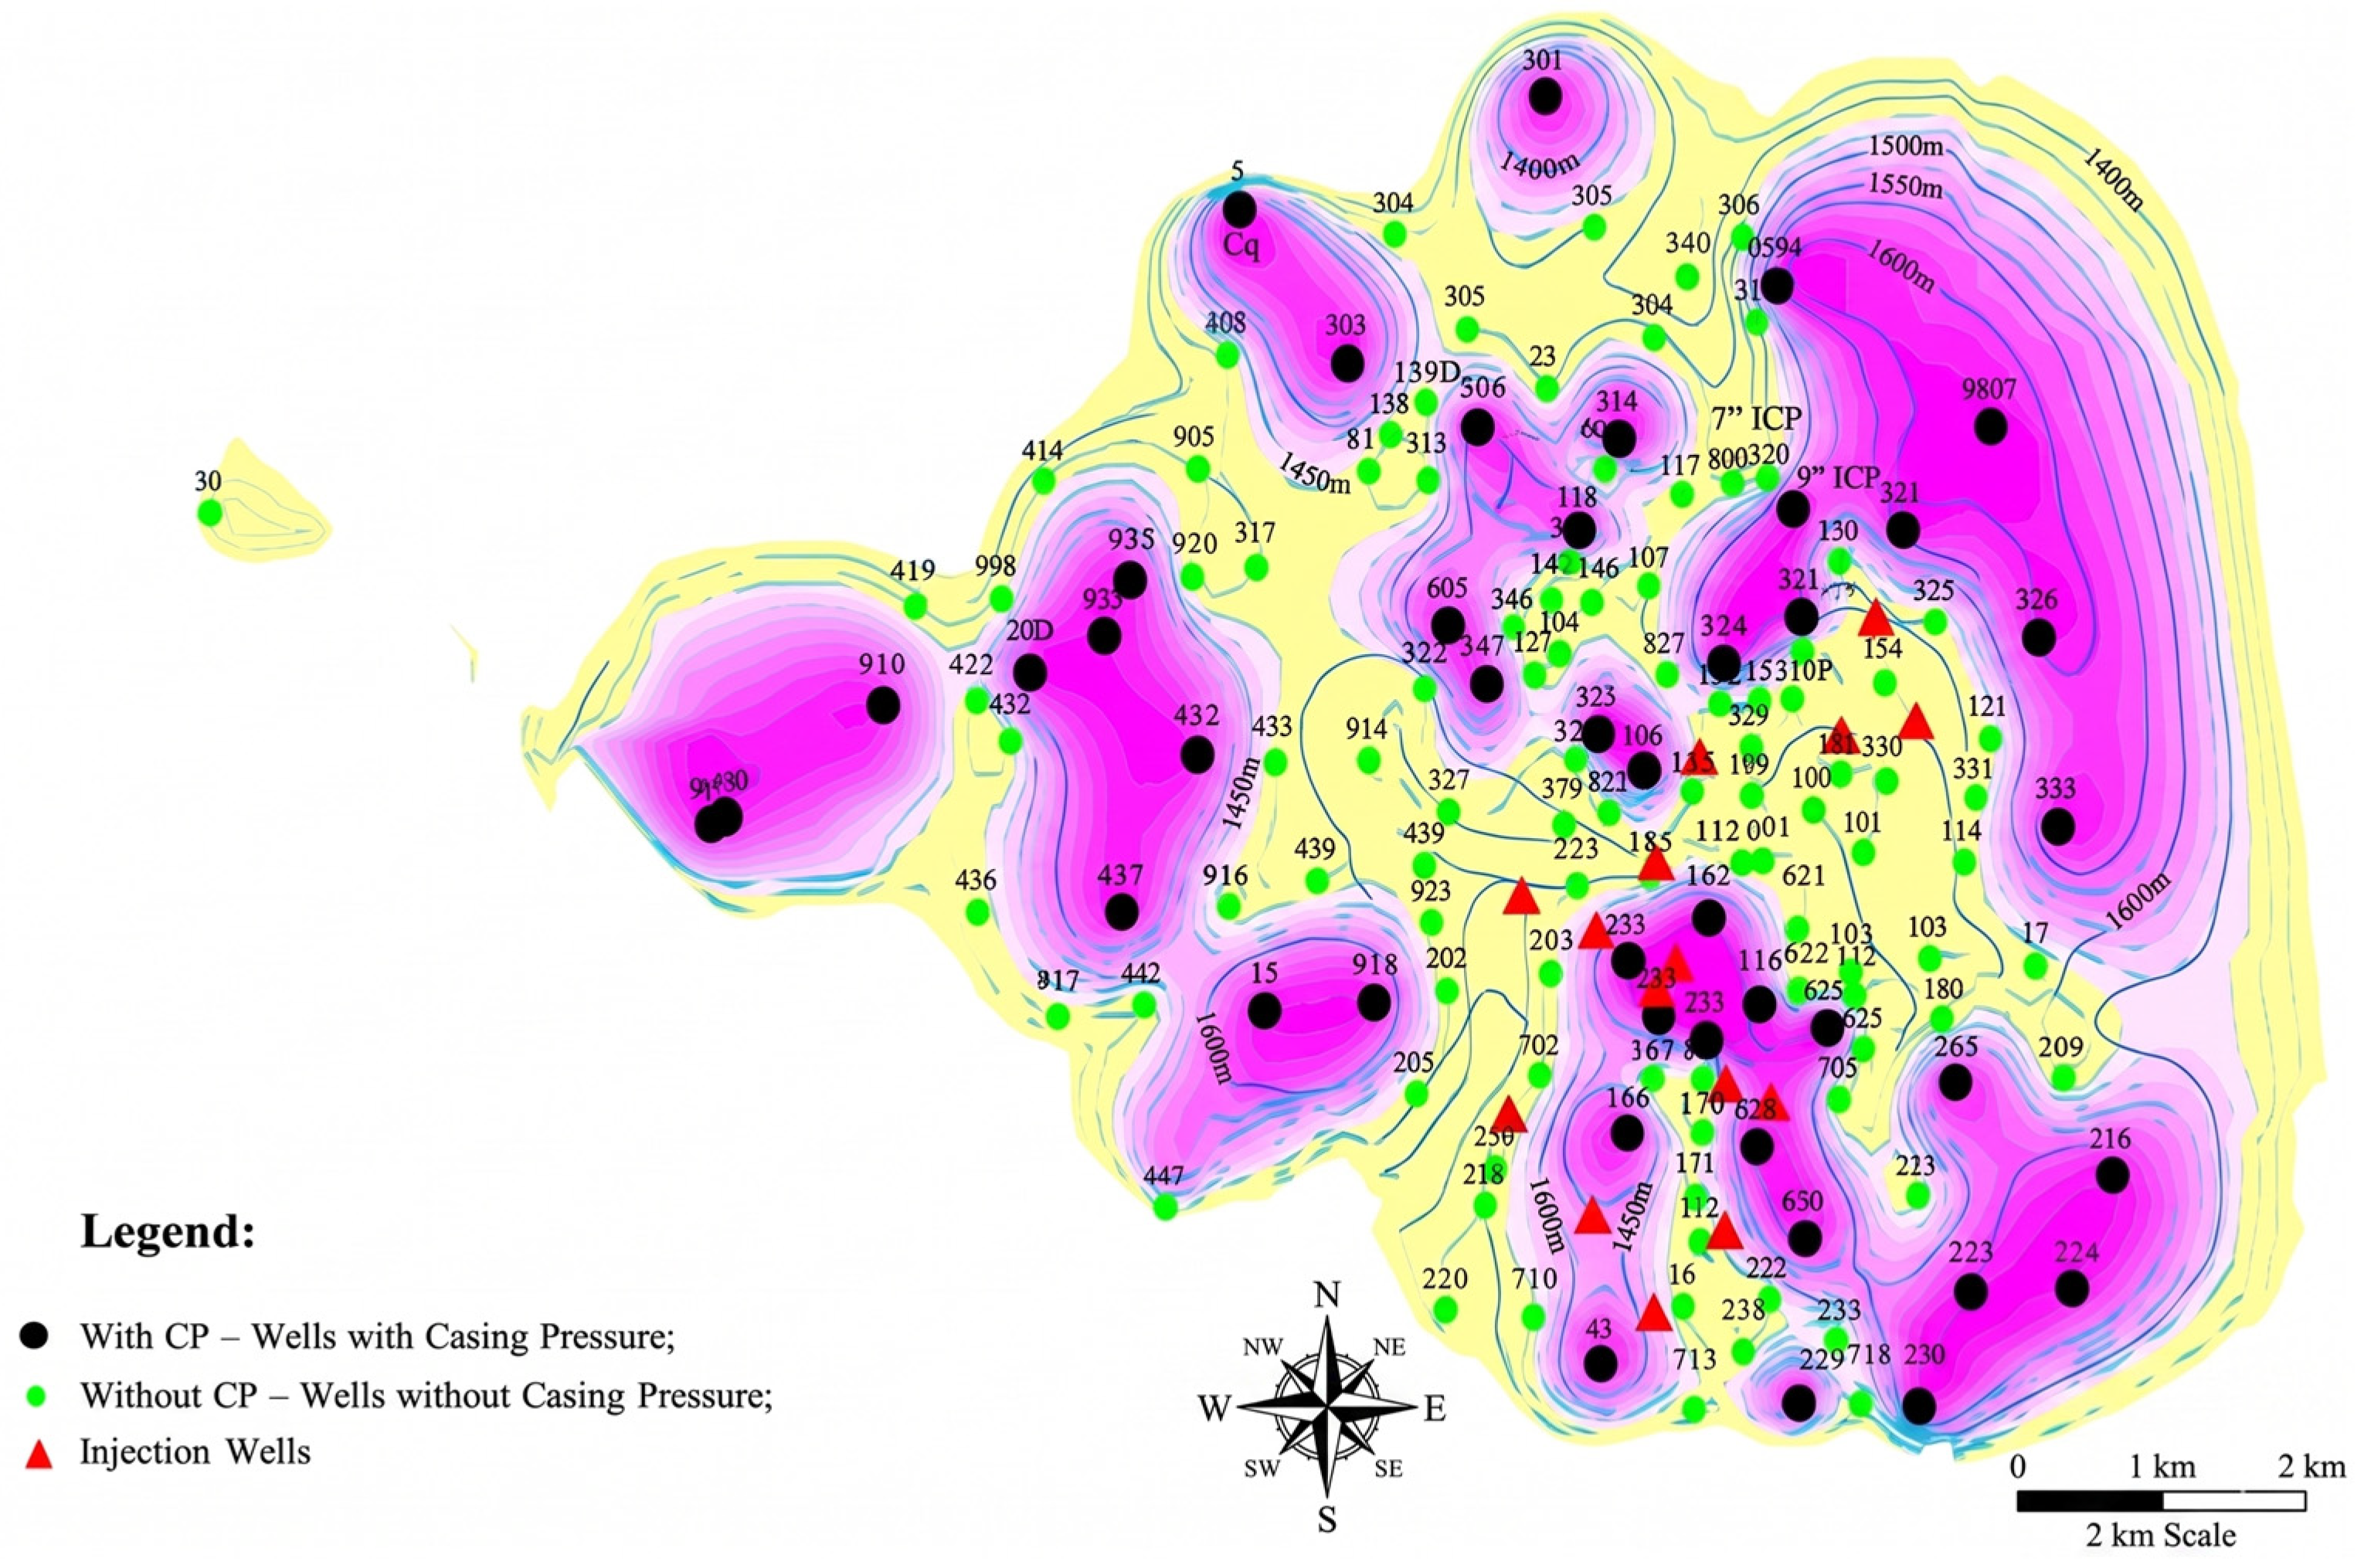
This phenomenon is further substantiated by the geographical distribution of wells with and without ICP, as illustrated in Figure 6. The distribution of these groups within the field area is clearly delineated by their respective zones. A comparison of the obtained distribution with that of previous years reveals that the configuration of these zones changes, but the concentration of wells with and without ICP remains constant. A chi-square test for spatial clustering yields x2 = 18.7 (df = 6, p = 0.0046), indicating statistically significant geographic heterogeneity of ICP occurrence.
Figure 6.
Areal distribution of wells with inter-column pressure (ICP) (2023).
3.4. ICP Data in Wells (2022–2023) and Its Connection to Seismic Maps
The distribution of telluric fields (natural electric fields) on the Earth’s surface is approximately of the same nature. Table 2 shows the wells in which pressures were recorded in 2022 and 2023. The data presented in the table indicates that in the absence of ICPs in wells in 2022, these appear in 2023, or were present in 2022 and subsequently disappeared in 2023. Wells exhibiting vanishing pressures in 2022 and 2023 were delineated on a seismic map of the roof of Site I.
Table 2.
Inter-column pressure (ICP) in wells for 2022–2023 (well numbers, pressure in MPa, seismic zones).
The preceding data indicate that the occurrence of pressures within the annulus is predominantly associated with zones of geological heterogeneity, which are particularly influenced by physical fields. Quantitatively, 78% of wells with ICP lie within 500 m of mapped geological faults (compared to 22% of non-ICP wells), suggesting a strong structural control.
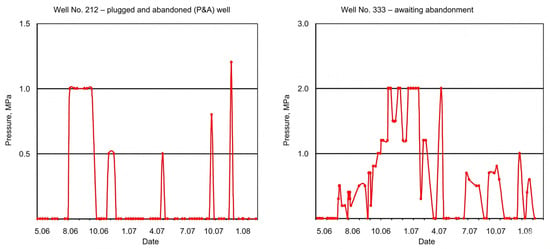
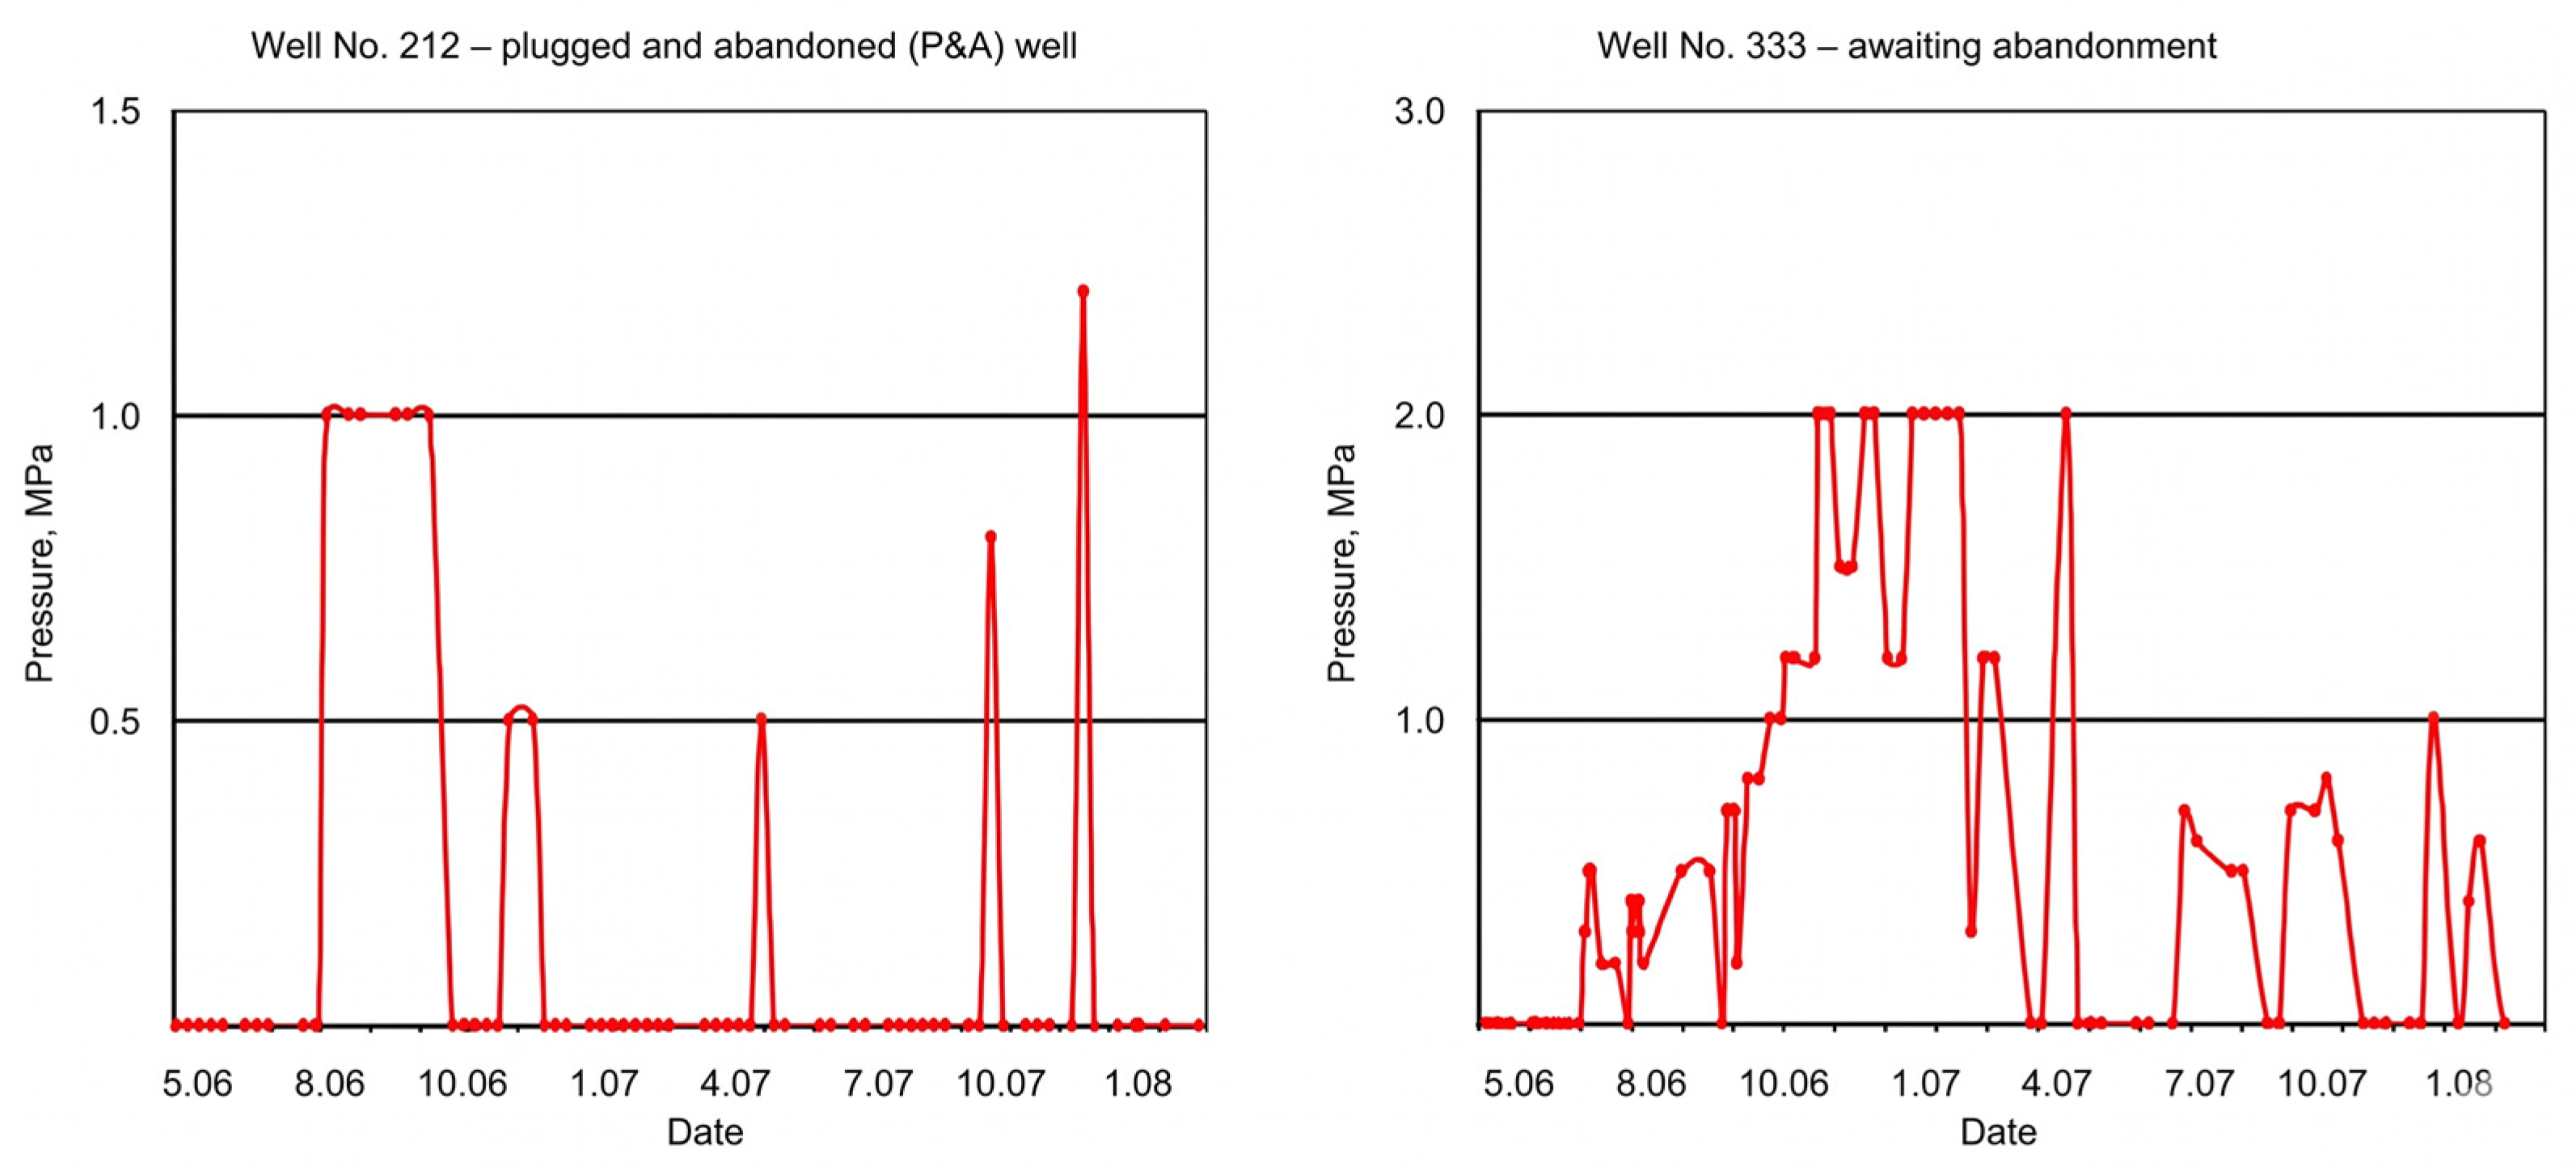
3.5. Daily ICP Monitoring in Shut-In Wells
A comparison of the tables indicates that the dynamics of ICP in these wells are nearly identical, despite the fact that the last wells are decommissioned and therefore their ICP cannot be influenced by operating modes and human factors. As an illustration of the dynamics of ICP changes in the abandoned and pending abandonment wells, the daily monitoring curves of wells No. 212 and 333 are presented in Figure 7. As is evident in the graphs, there is an absence of regularity in the pressure change over time. The pressure alternates between positive and negative values in a spontaneous and intermittent manner. The observed dynamics suggest the dominance of natural factors in these specific conditions. The standard deviation of daily pressure readings for well No. 212 is 2.3 MPa (mean 4.1 MPa), and for well No. 333 is 1.8 MPa (mean 3.2 MPa), indicating significant short-term variability not explained by thermal or operational effects.
Figure 7.
Daily pressure monitoring in shut-in wells No. 212 and No. 333.
The analysis of materials from the research conducted indicates that all factors contributing to inter-column pressures in wells can be classified into two distinct categories.
The presence of fluid channels connecting the source with the wellhead, in the event of a pressure gradient between them, has been identified as a primary cause of this phenomenon. In order to eradicate the presence of ICP in wells belonging to this group, it is imperative to reinstate the integrity of the cement ring. When fluid is vented from the MCPs of this group of wells, a significant volume of liquid and gas is released.
In a separate group, the underlying factors contributing to the occurrence of ICP are physical and chemical processes that take place in the presence of physical fields. These wells constitute the majority of the observed cases. In these wells, the presence of fluid channels is either negligible or characterized by low permeability. During the process of depressurization, a small volume of fluid is initially released, after which the flow quickly subsides. In the fluid, the presence of the aggressive elements H2S, CO2, and mercaptan is either negligible or is contained in concentrations well below the MPC. Consequently, wells of the second group do not pose any danger either to the environment or to the operating personnel.
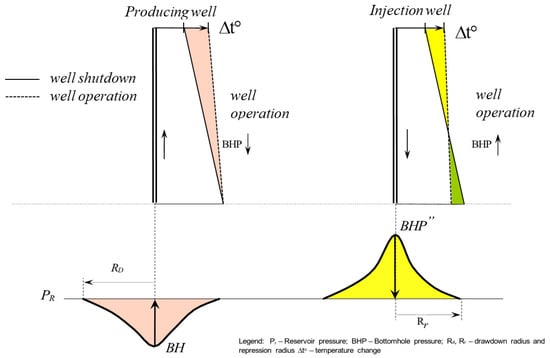
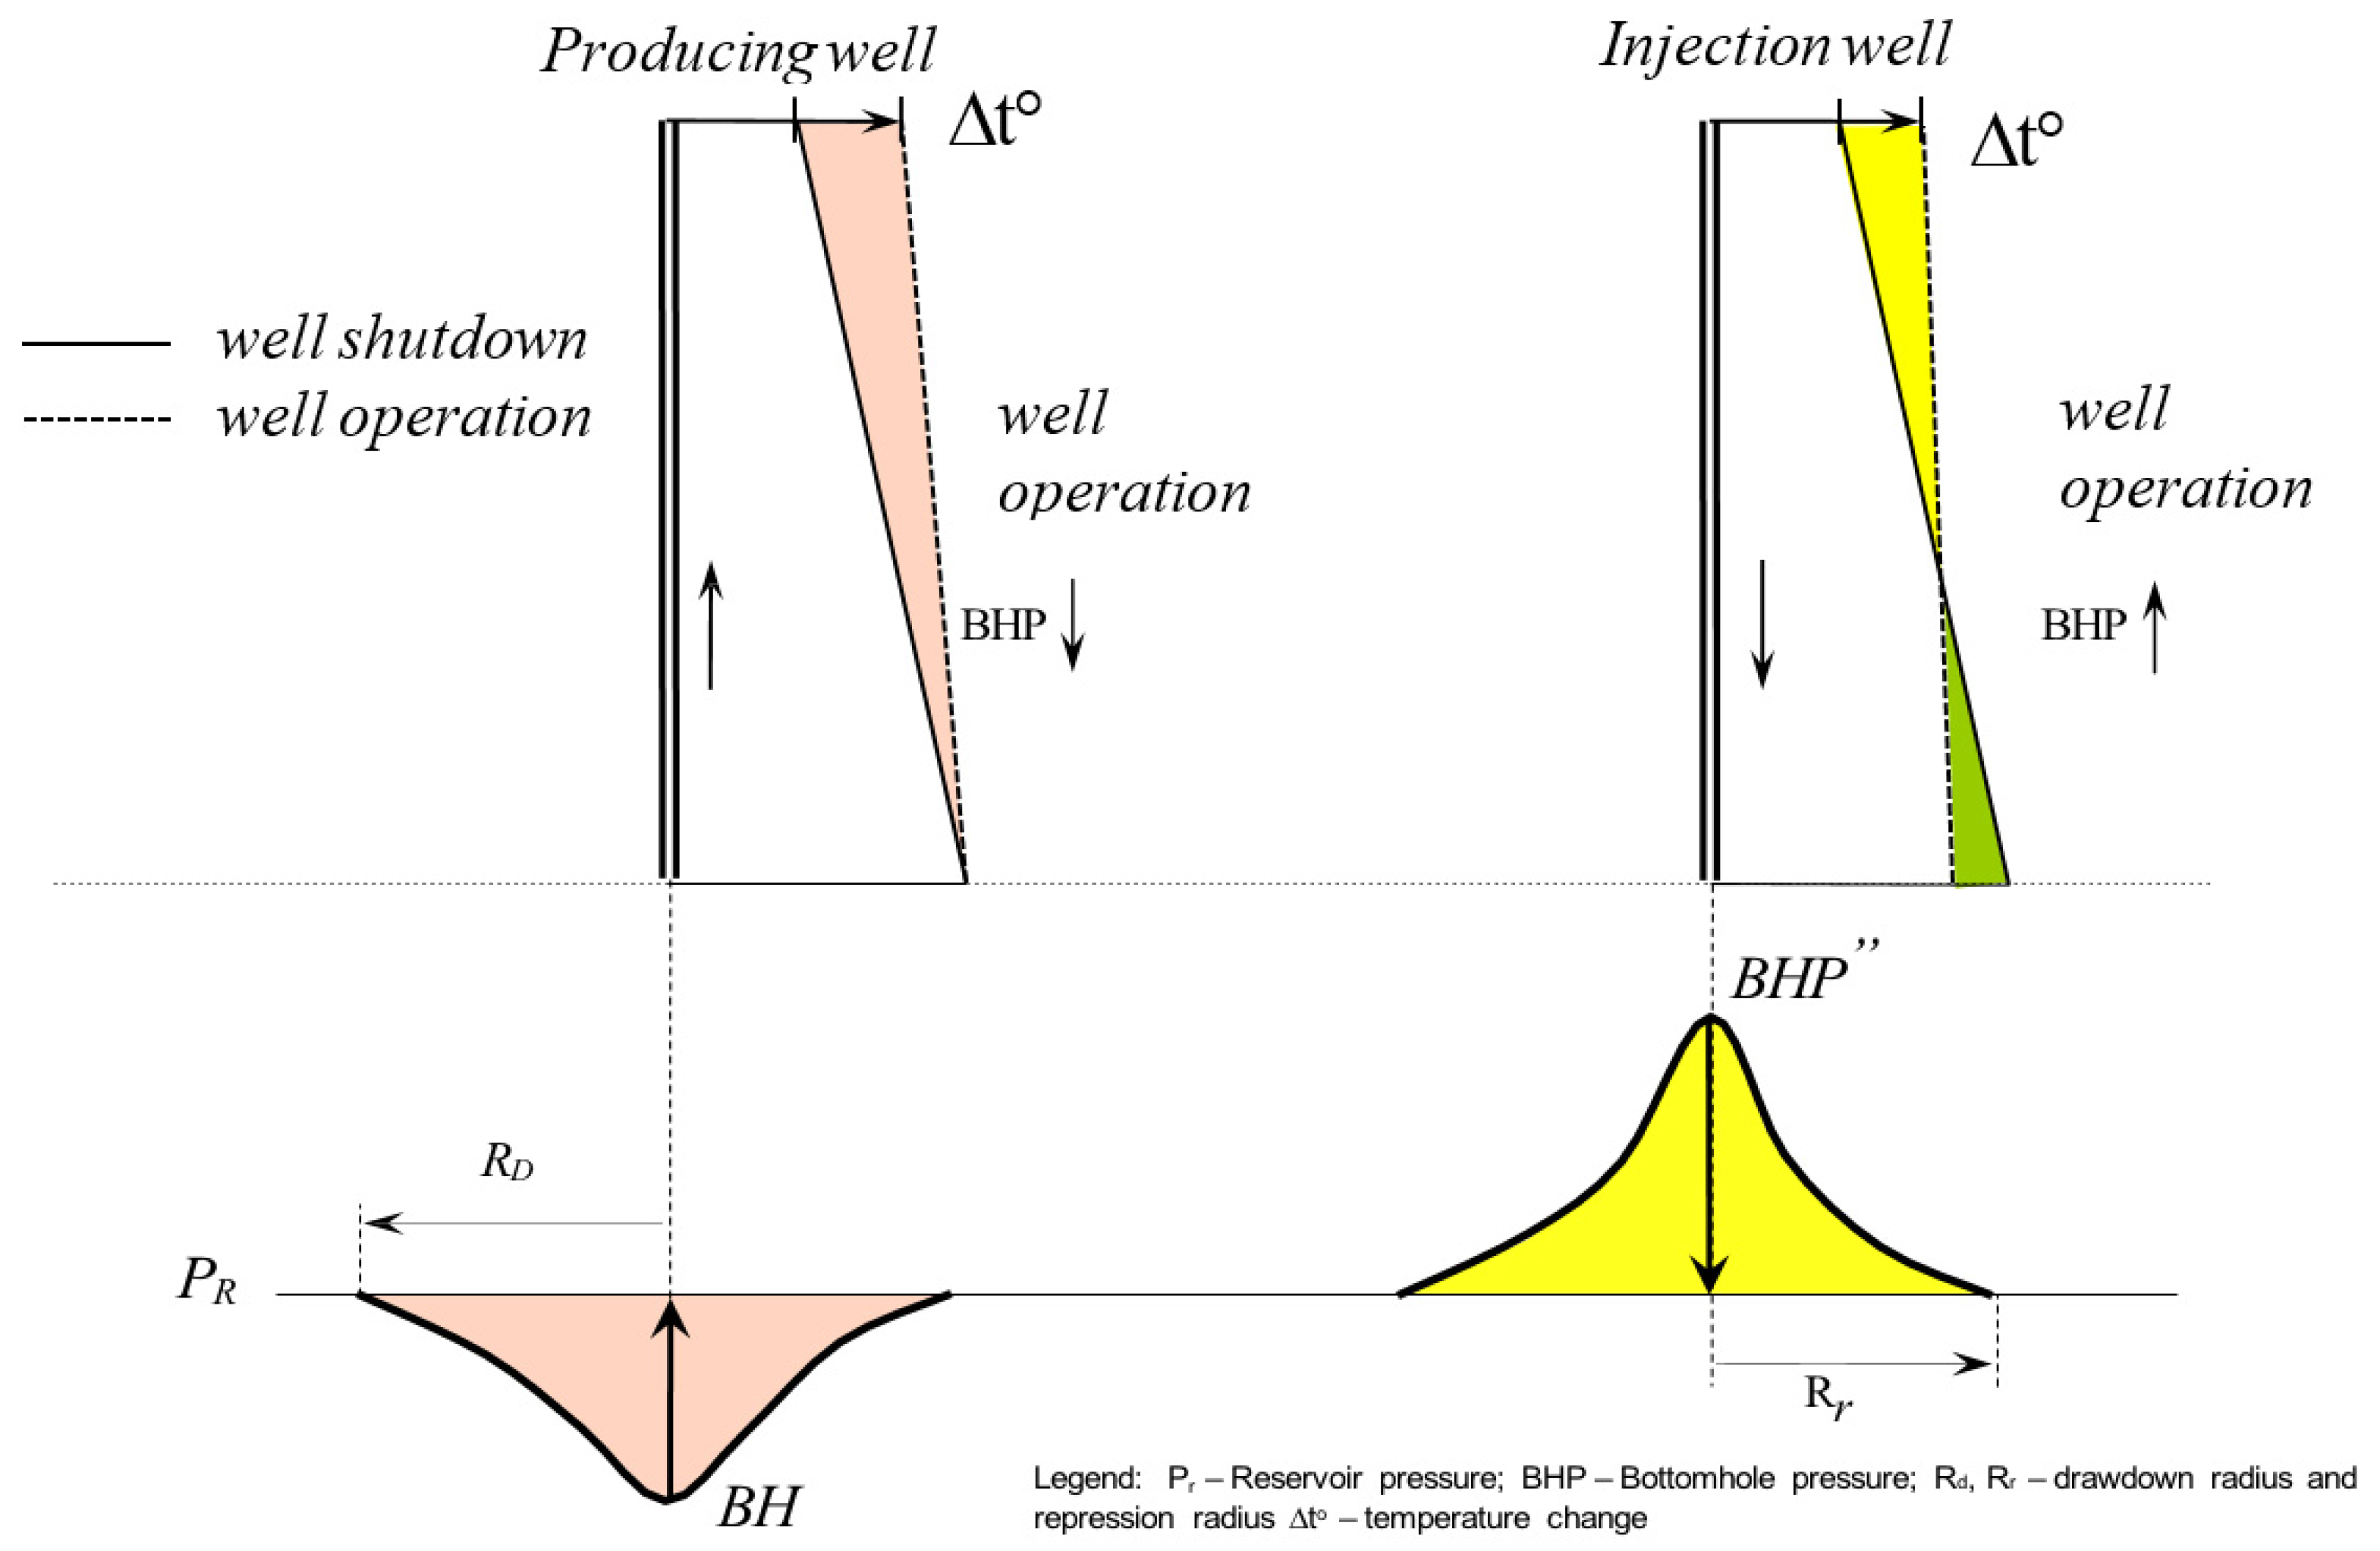
3.6. Changes in Bottomhole Pressure and Temperature in Active/Shut-In Wells
As illustrated in Figure 8, the epiphyses of downhole pressure and temperature changes in operating and shut-in production and injection wells are demonstrated. In certain circumstances, these factors have the capacity to exert a simultaneous influence on the ICP. In the context of production wells, the influence is out of phase, whereas in the context of injection wells, it is in phase. This is a crucial consideration when conducting investigations and identifying and issuing conclusions. A simple thermoelastic model was applied: for a trapped fluid volume V in an annulus, pressure change is ∆P = β ∆T/α, where β is the thermal expansion coefficient of fluid (water: 2.1 10−4 K−1, oil: 8 × 10⁻⁴ K−1) and α is compressibility (4.5 × 10⁻¹⁰ Pa−1 for water). For a temperature increase of 10 K, this gives ∆P = 4.7 MPa for water and 18 MPa for oil, which matches observed pressure fluctuations in production wells.
Figure 8.
Variation of bottomhole pressure and temperature—(left): production well (out of phase); (right): injection well (in phase).
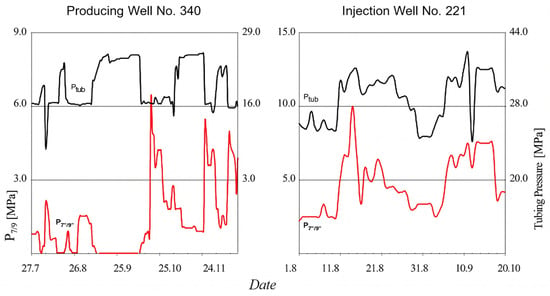
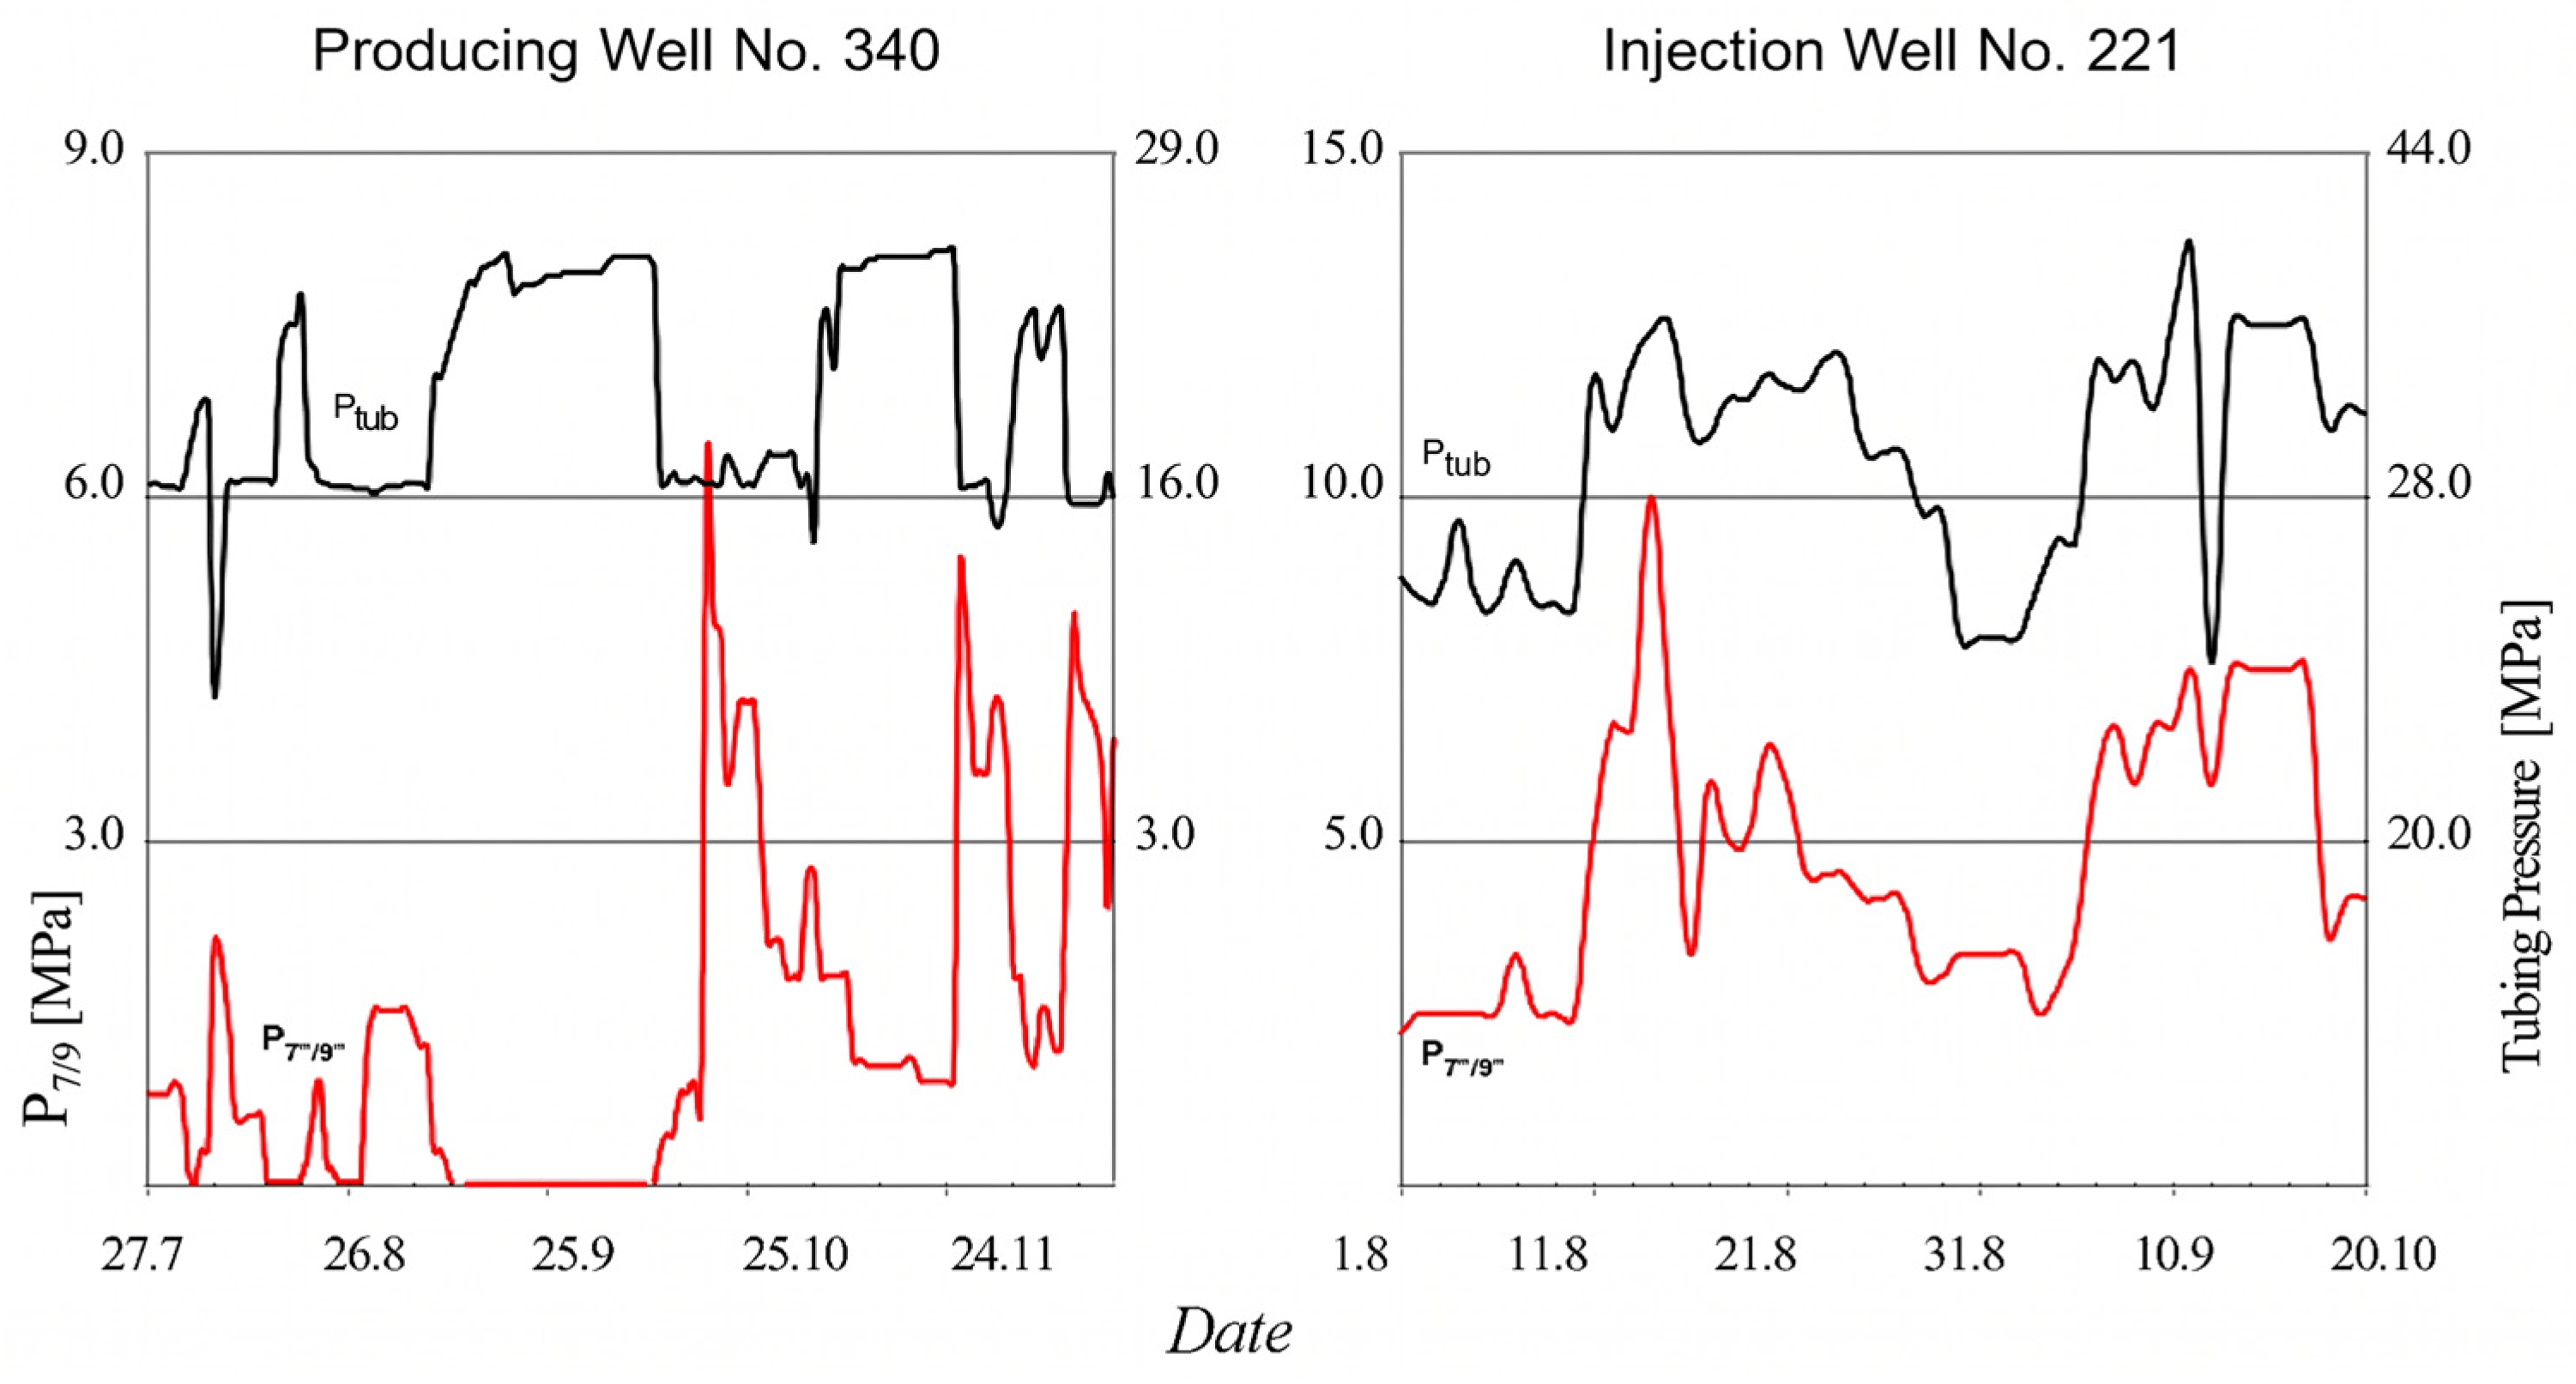
The character of changes in the curves of daily monitoring of pipe and inter-column pressures, taking into account the influence of the temperature factor, is demonstrated in Figure 9. The cessation of production at well No. 340 is accompanied by a decline in temperature and pressure within the annulus. Concurrently, there is an augmentation in both downhole and tubular pressures. Conversely, at the commencement of operations, the aforementioned processes undergo a reverse order. Injection well No. 221 exhibited synchronous fluctuations in temperature in conjunction with downhole and wellhead pressures. However, this dependence is not invariably fulfilled in cases of multifactor influence on the ICP and multicomponent fluid composition in the annulus.
Figure 9.
Effect of operating regimes—wells No. 340 (production) and No. 221 (injection).
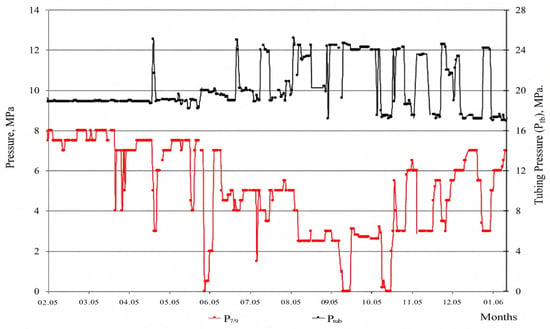
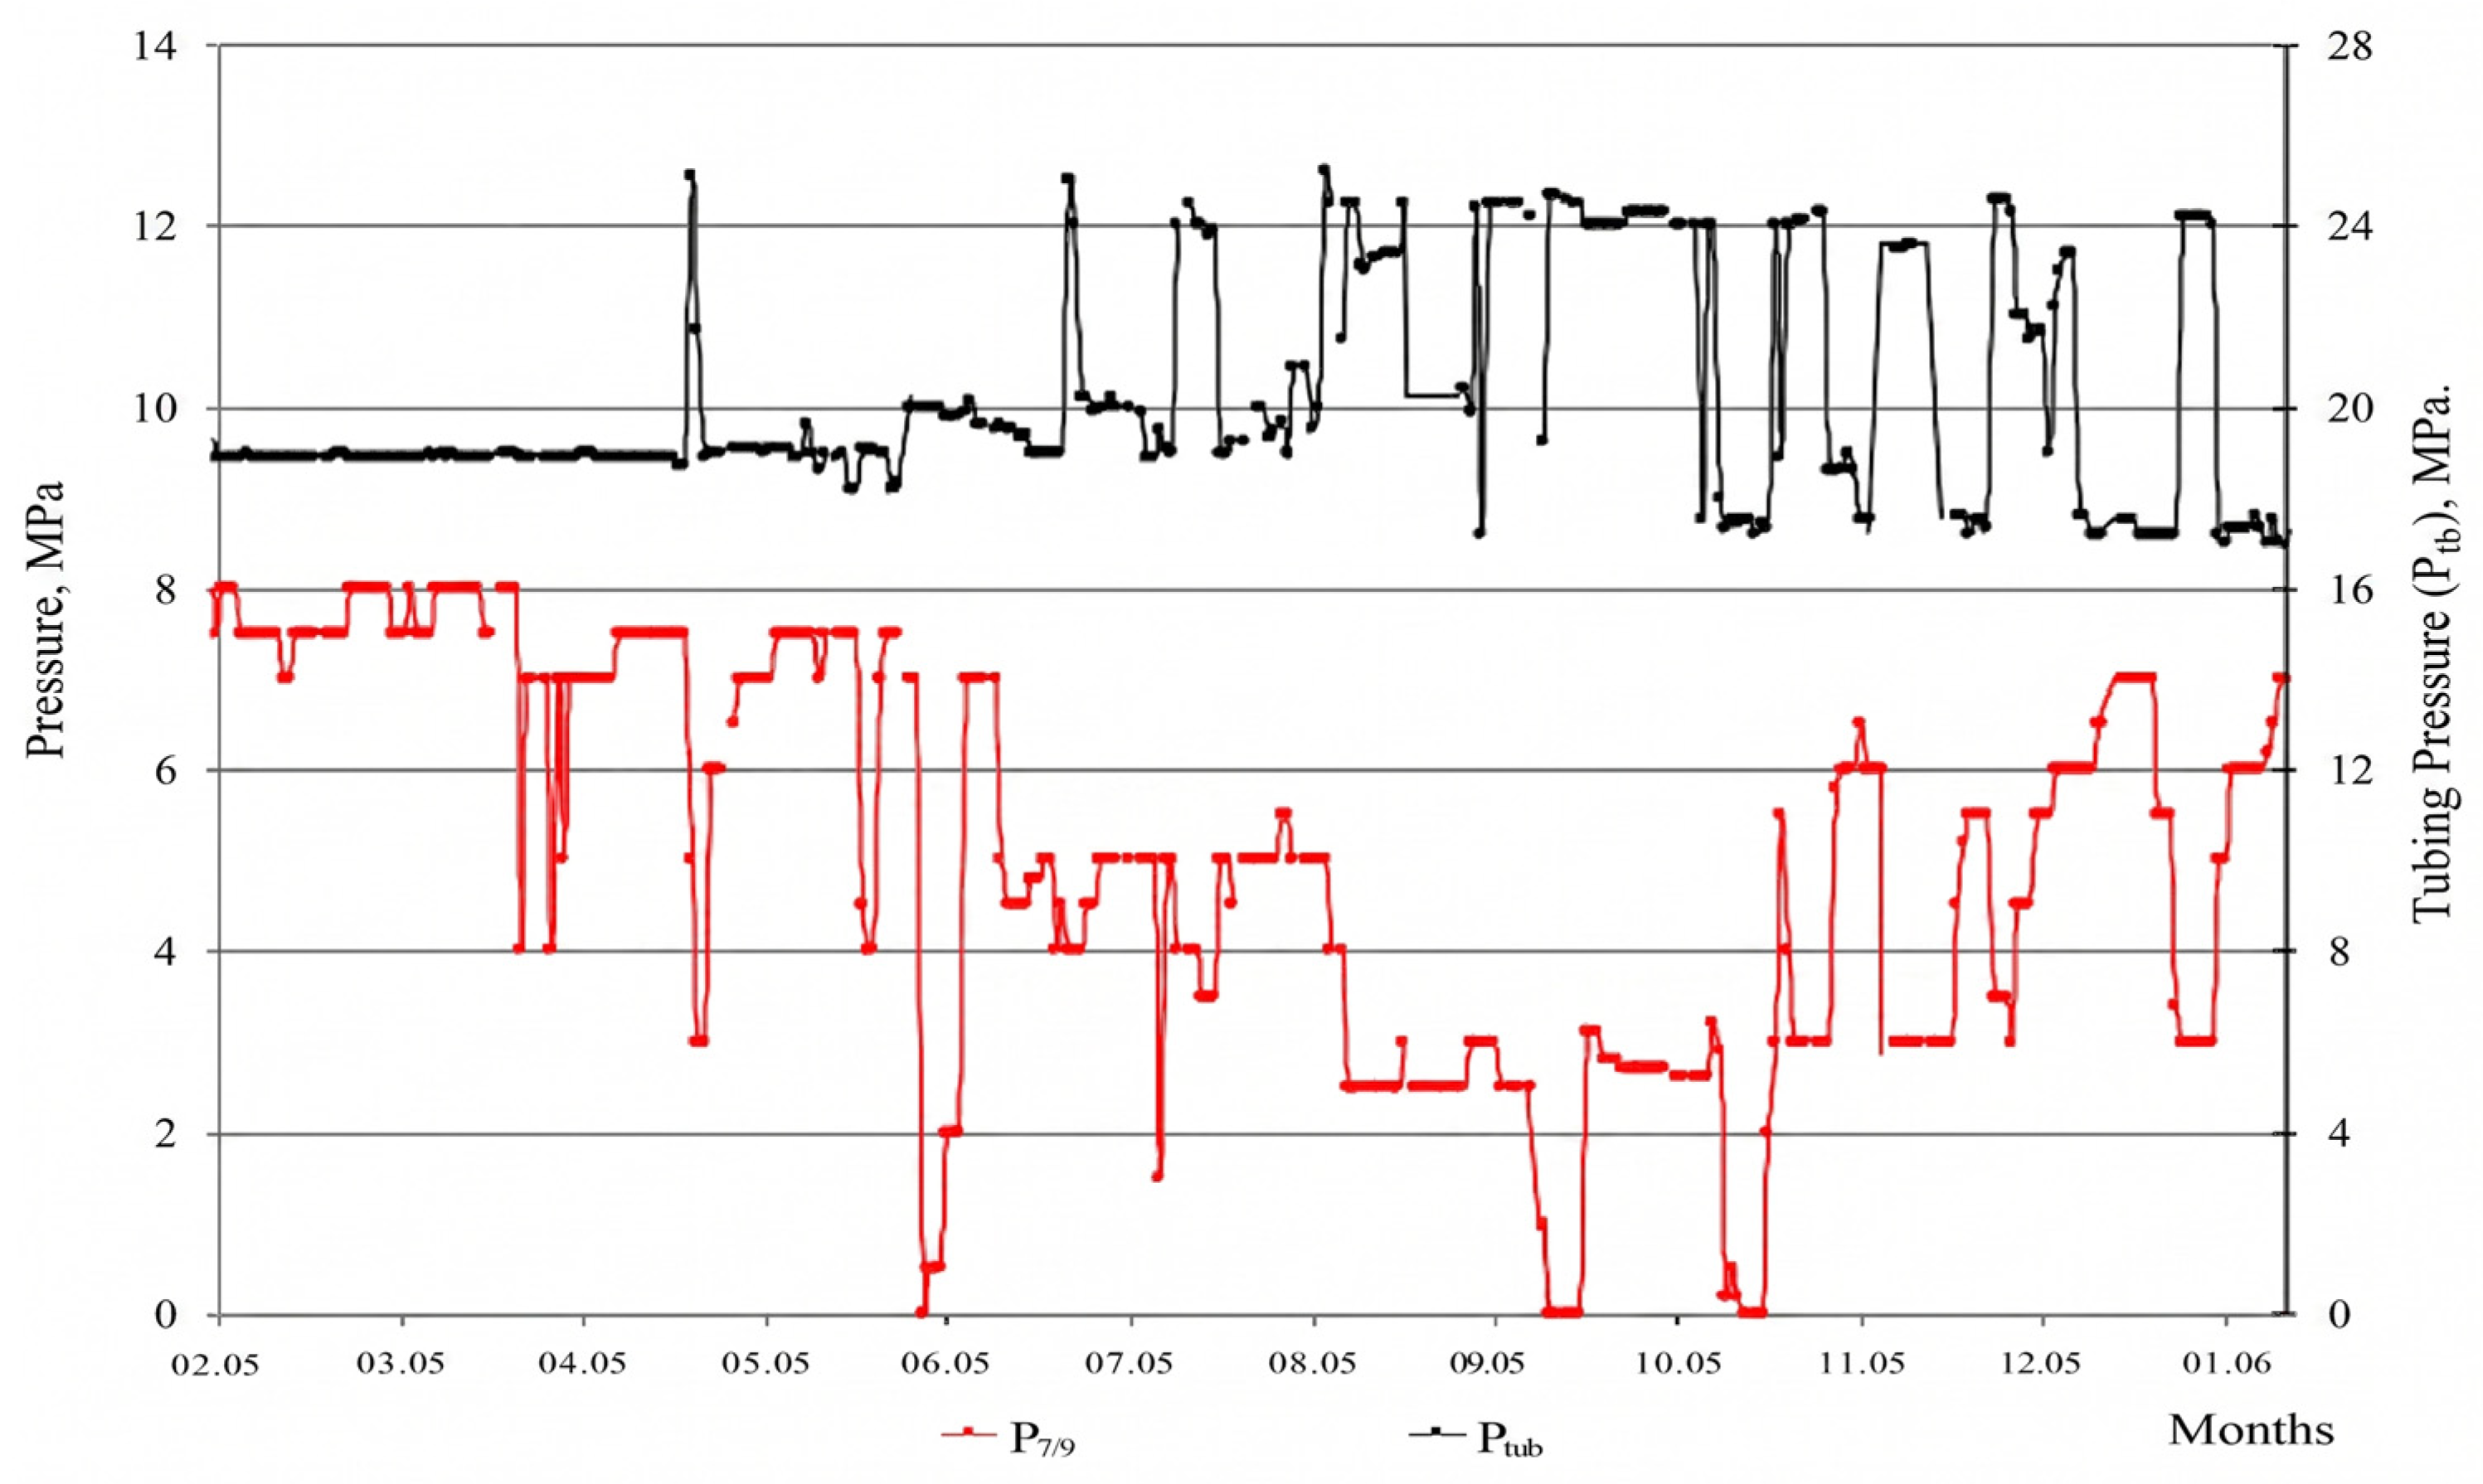
A significant limitation of the studies conducted with the MLU is the difficulty in fully isolating pressure dissipation caused by fluid cooling from spontaneous natural dissipation. As shown in Figure 9 and Figure 10, temperature fluctuations during production cycles can mimic or mask ICP dynamics. However, to validate the claims of spontaneous dissipation, daily monitoring was extended to decommissioned wells where thermal gradients from production are absent. In these cases, pressure continued to alternate spontaneously, indicating that while thermal effects are a factor in active wells, they are not the sole driver of the observed ICP phenomena.
Figure 10.
Daily monitoring of well No. 196—absence of a clear correlation between annulus pressure and temperature.
As a demonstration of this phenomenon, the daily monitoring data of production well No. 196 is presented in Figure 10. It is evident that the influence of the temperature factor is not consistently monitored. The correlation coefficient between annulus pressure and bottomhole temperature for well No. 196 is r = 0.23 (p = 0.12), indicating no significant linear relationship, likely due to gas influx or other processes.
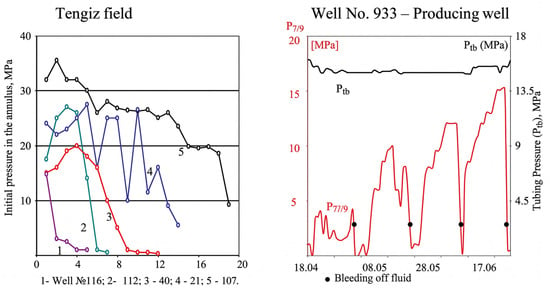
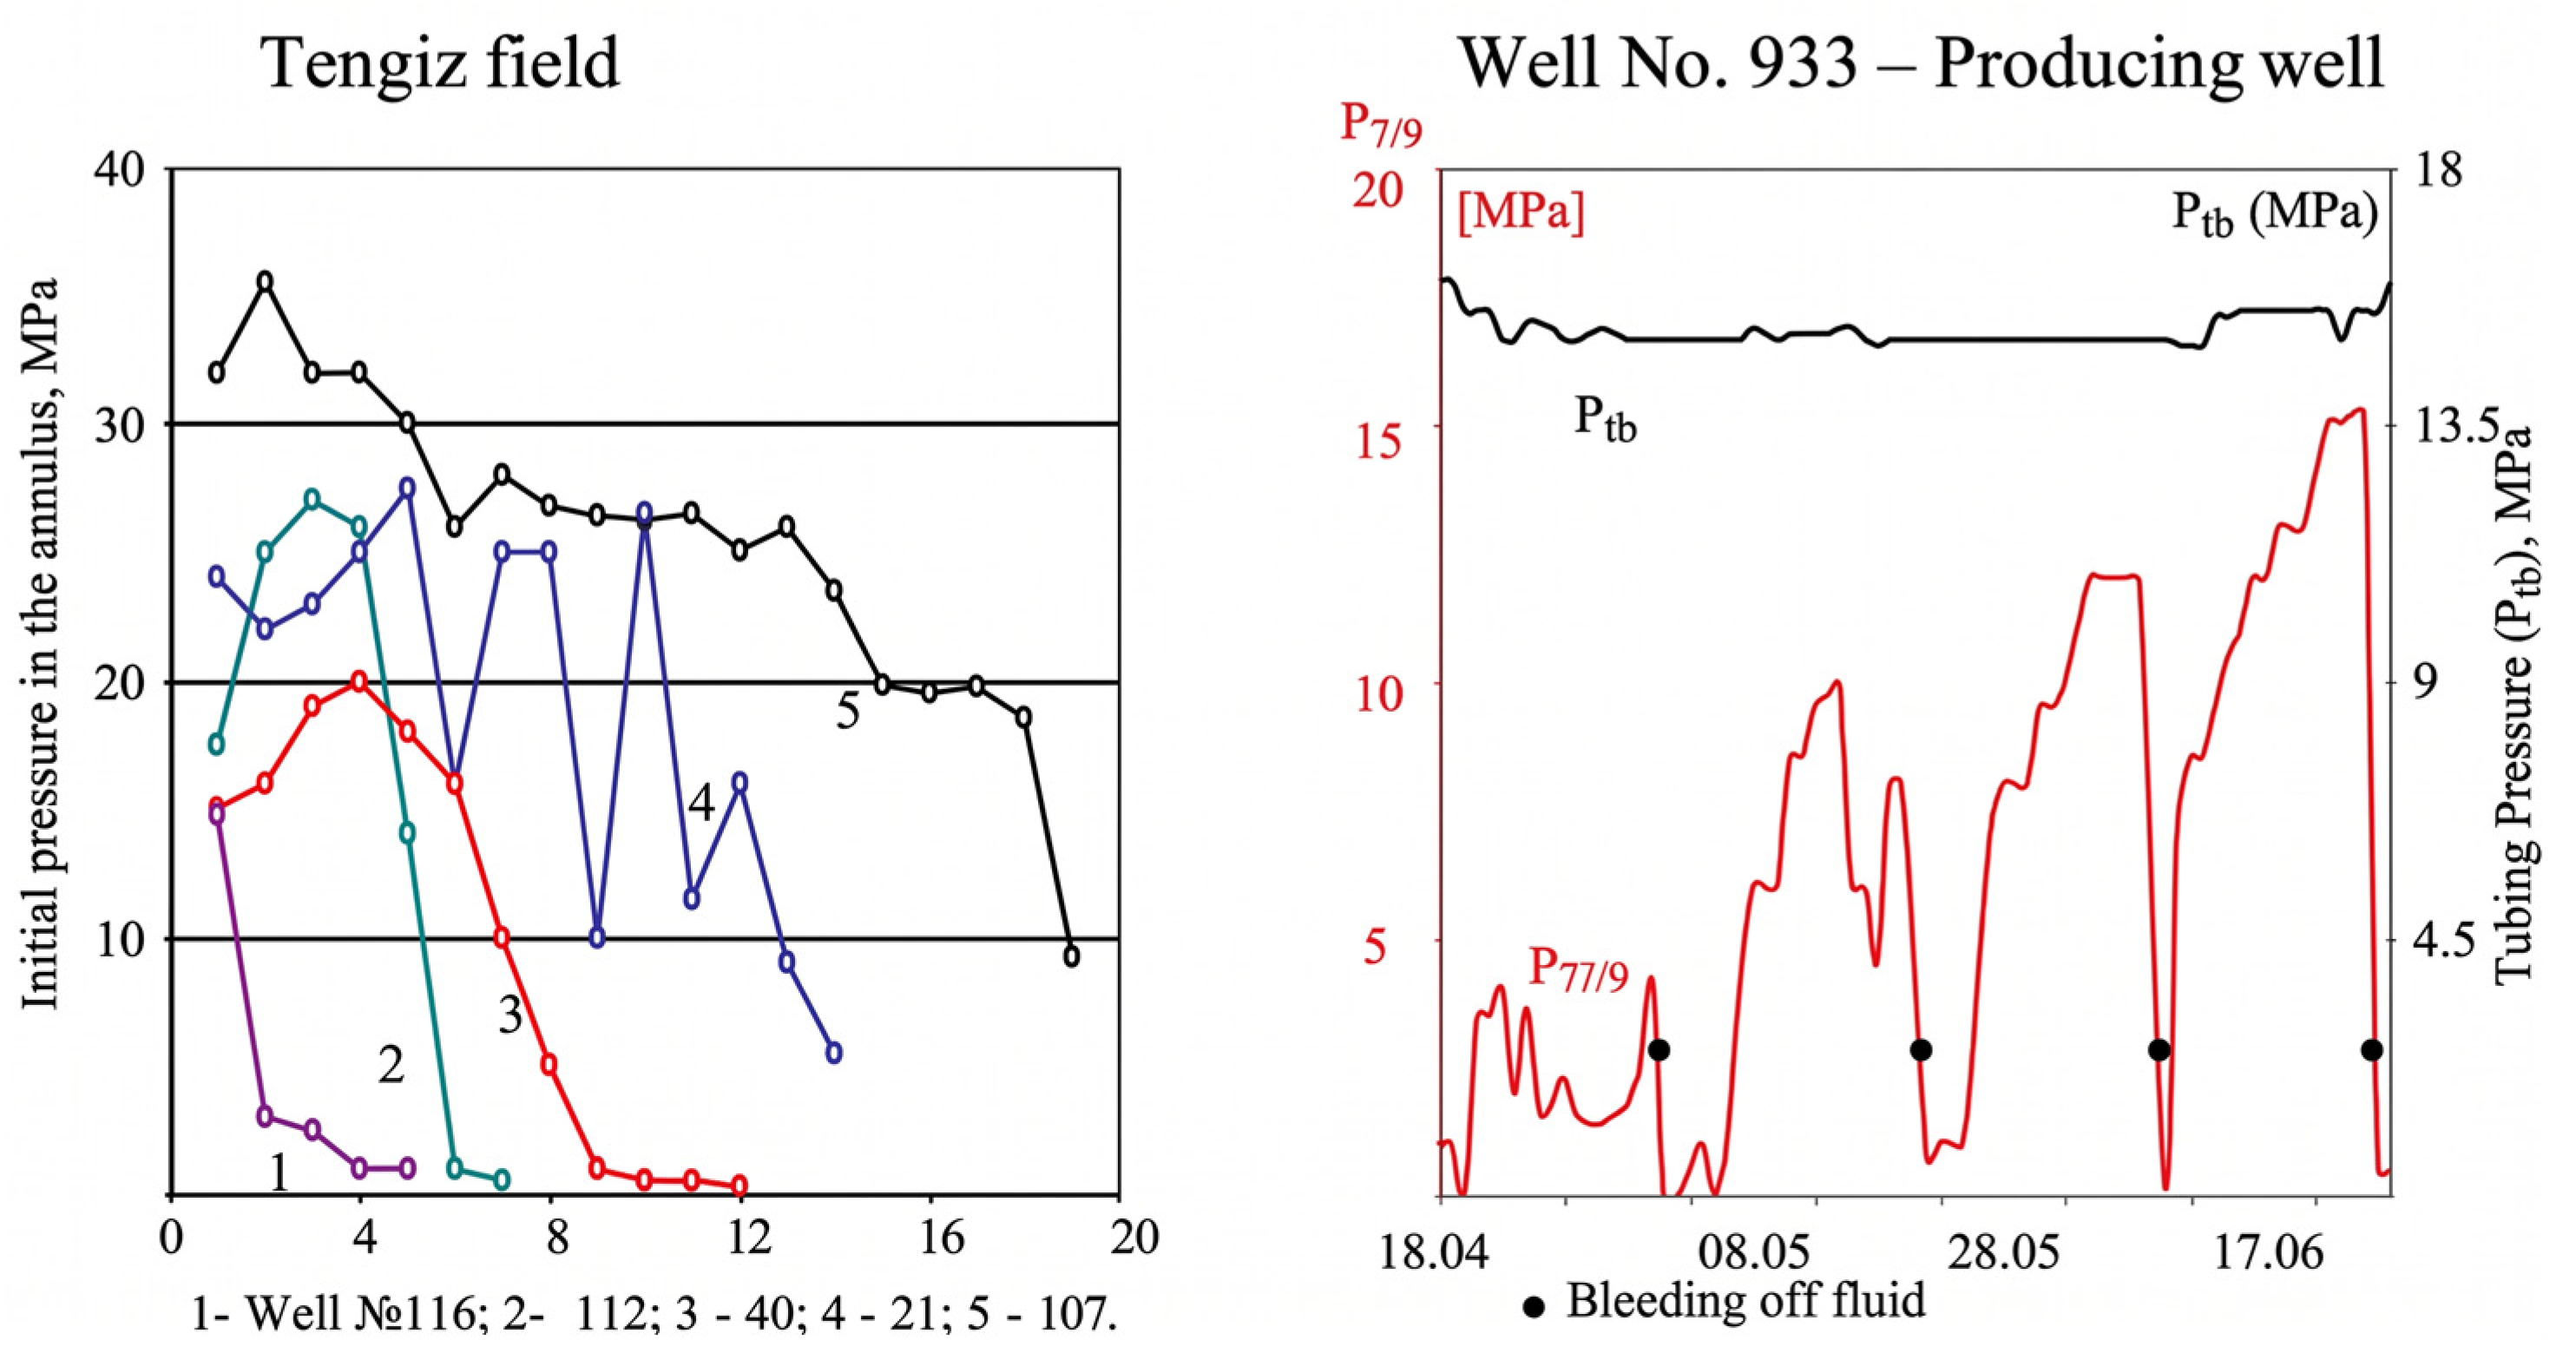
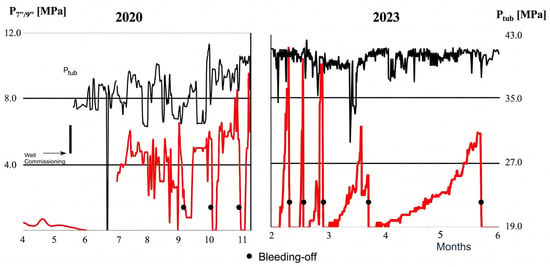
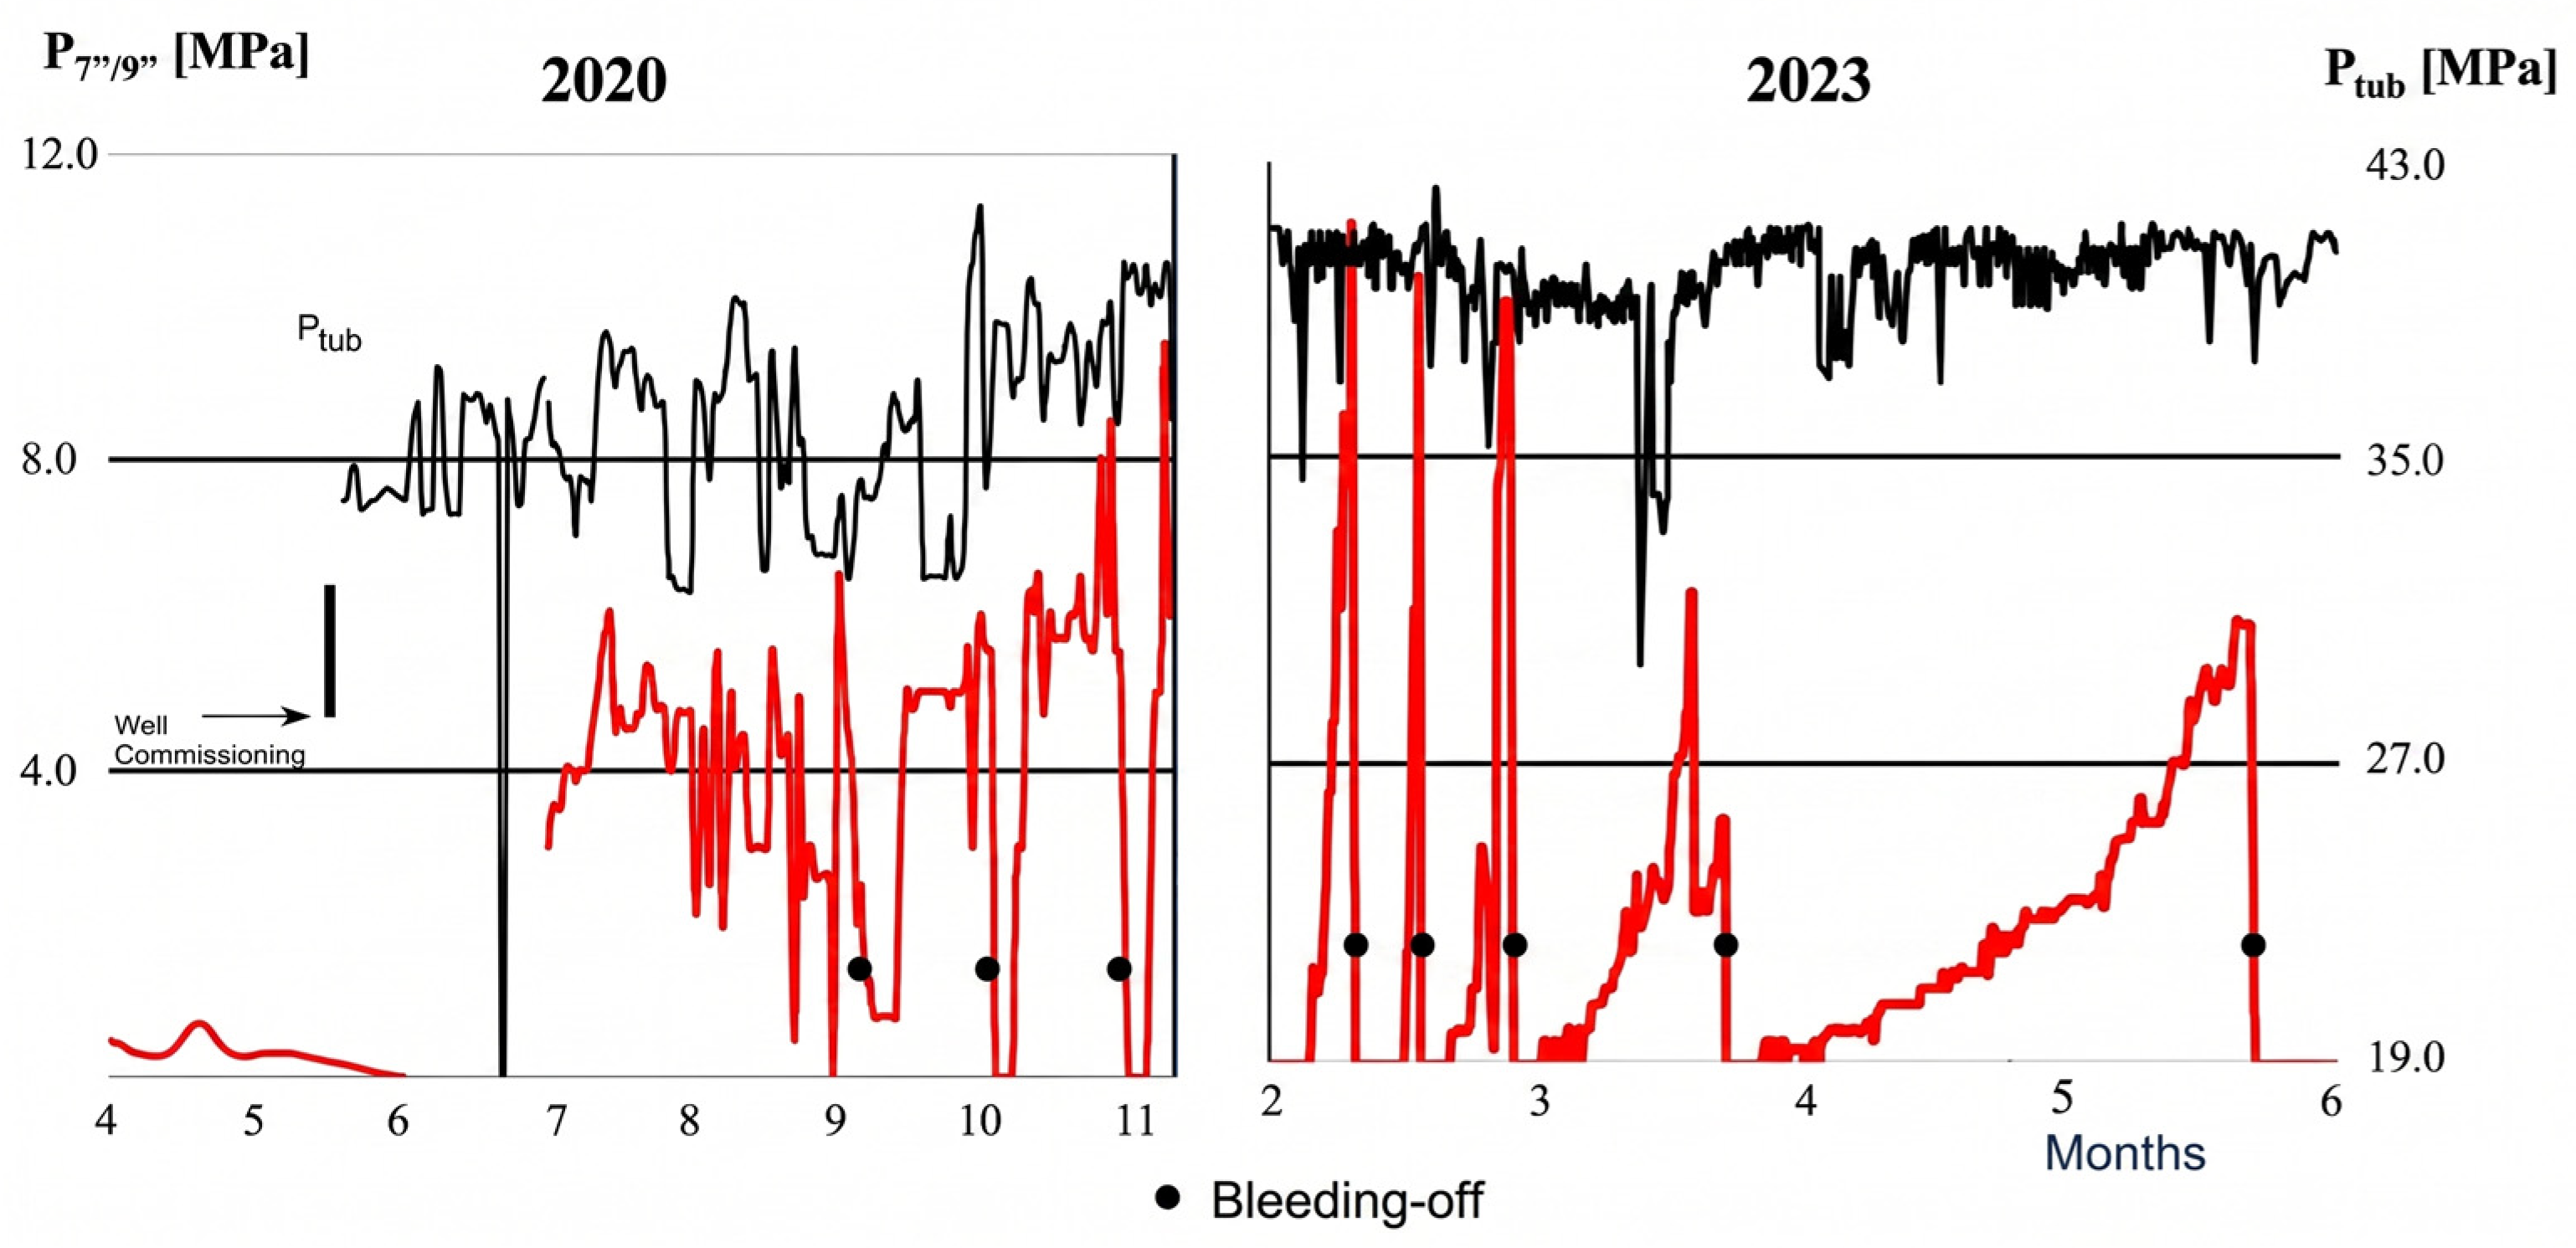
In the complex of conducting studies to identify the causes of inter-column pressure, as well as in the works to eliminate inter-column pressure, the method of repeated fluid bleed from the inter-column space is sometimes included. Using a mobile laboratory, it is possible to carry out a deeper unloading of the annular space, thereby reducing the mouth pressure in the inter-column space to zero level. This method is used not only at Karachaganak, but also at other fields, for example, at Tengiz (Figure 11). In some wells, the use of this method leads to an increase in the inter-column pressure. This is more common where a heavier fluid is exiting the inter-column space than the fluid entering from the source, or in cases where fluid channels are being drained.
Figure 11.
Effect of multiple bleed-offs—pressure increase observed after some bleed-offs.
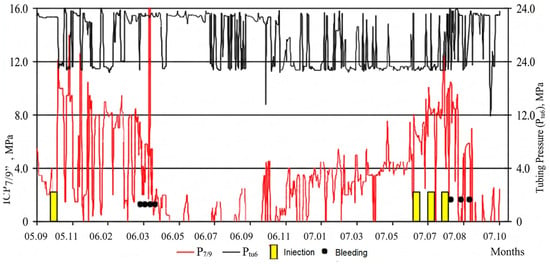
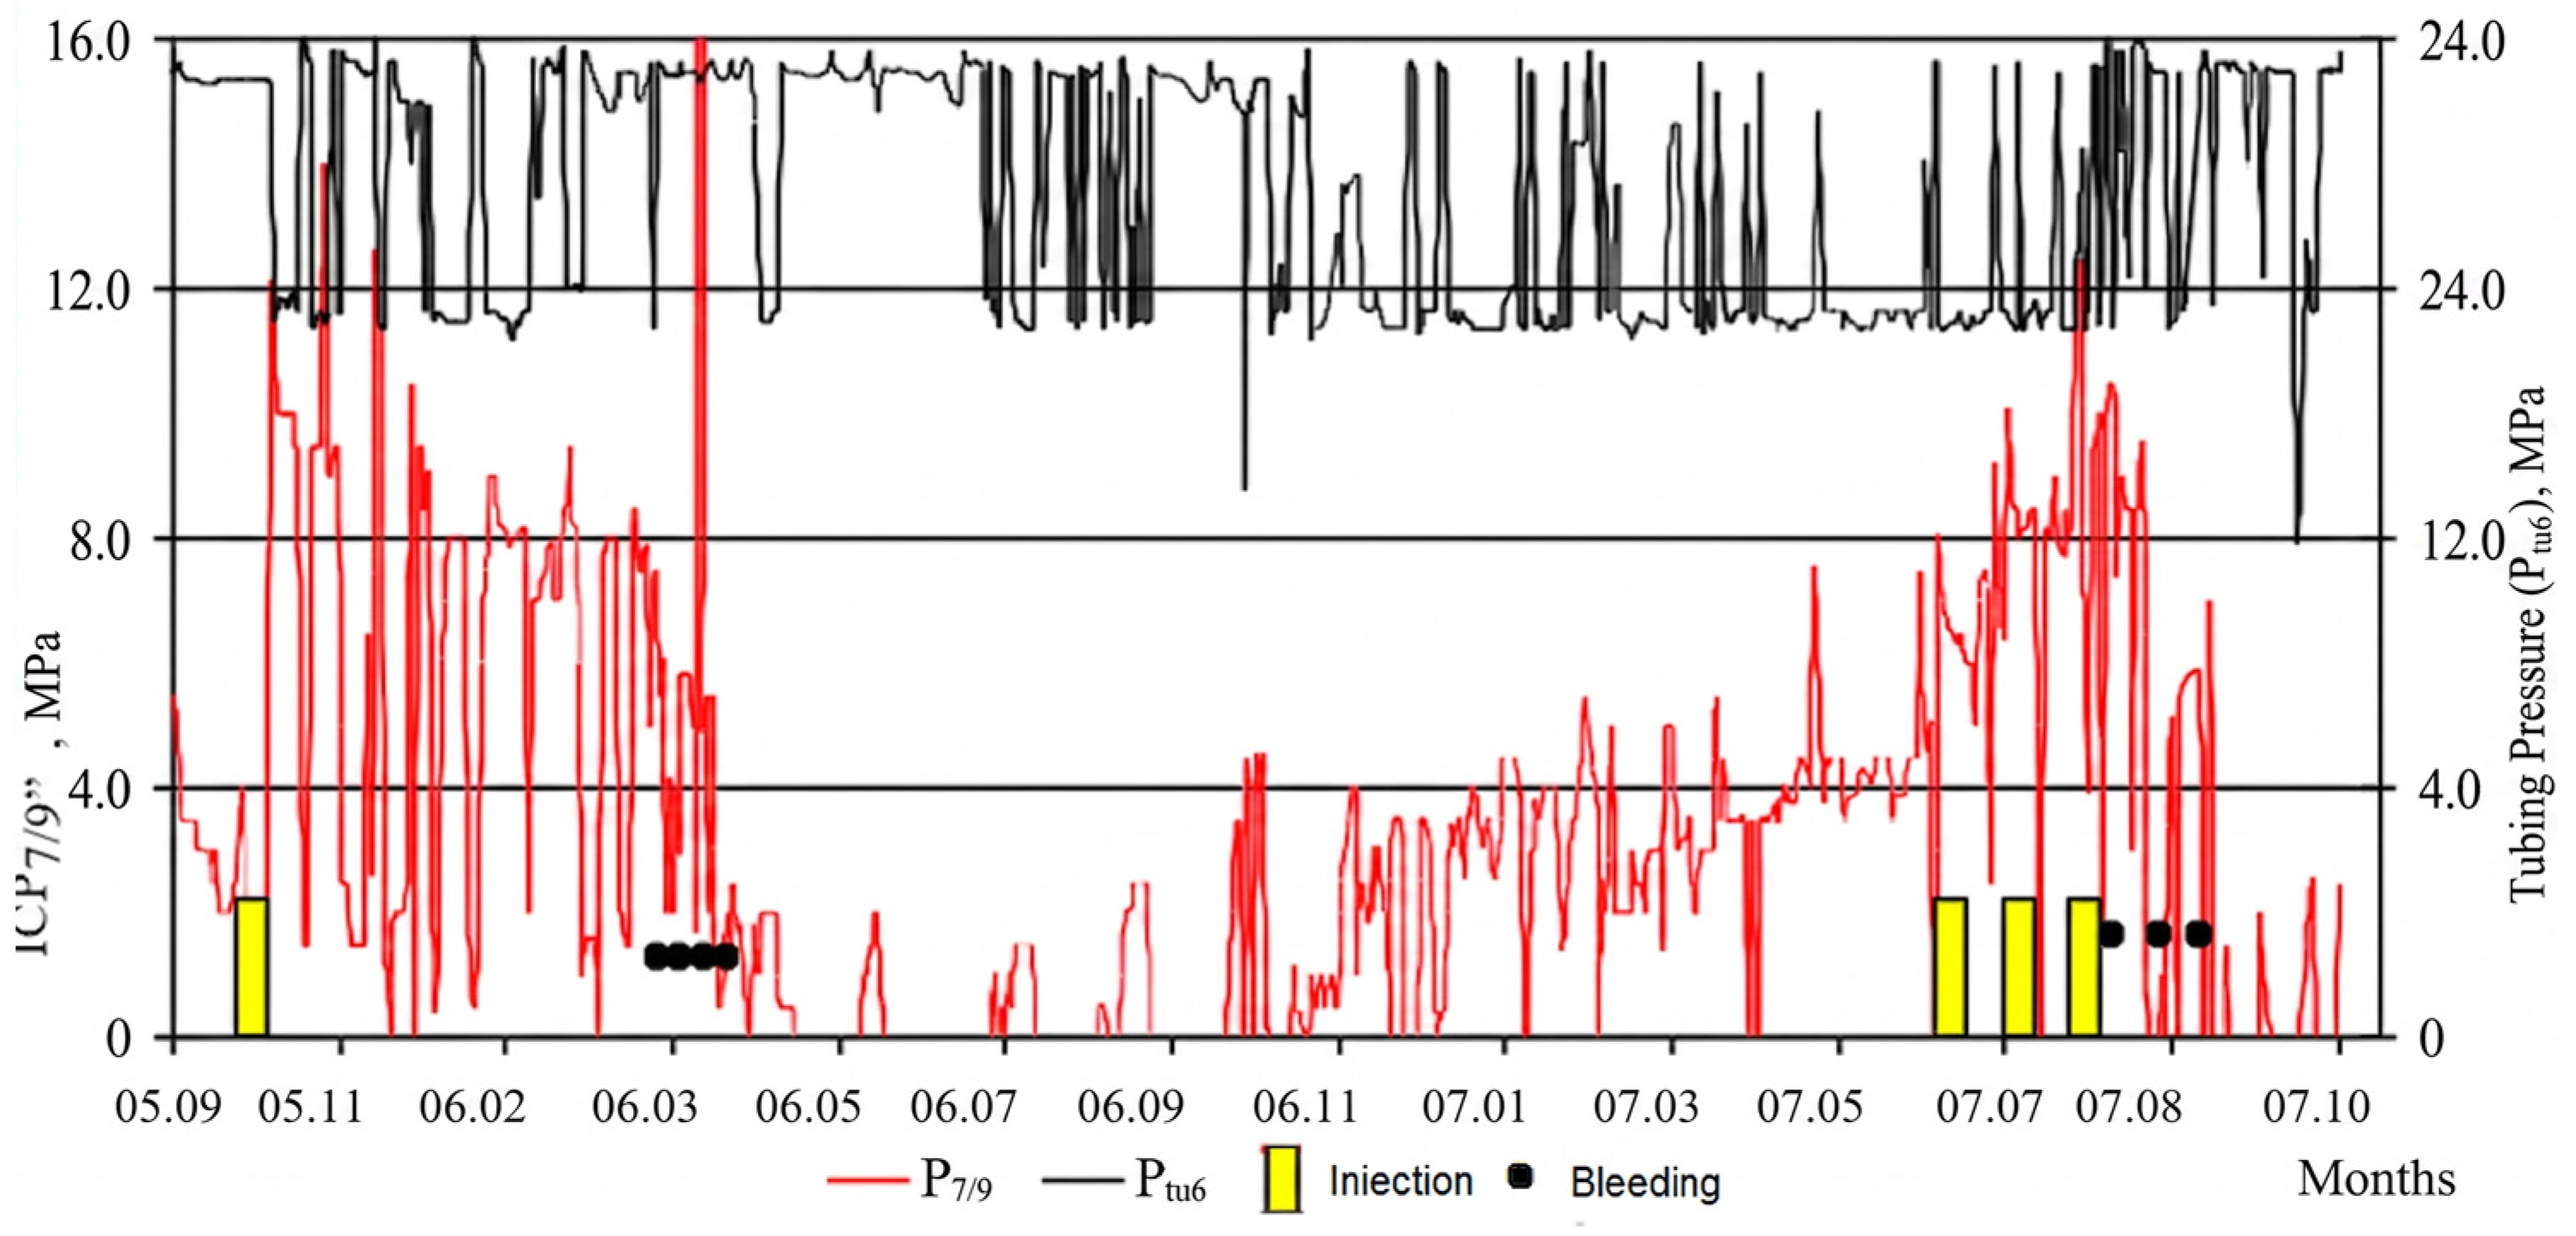
In certain cases, a multifaceted approach is employed to generate backpressure at the source, which involves the injection of a solution, followed by fluid bleeding from the inter-column space. Its primary function is in wells where the injectivity of the inter-column space is low, and viscous plugging solutions cannot be utilized. In such cases, a transient effect is frequently observed, as the pressure is restored after a certain duration (Figure 12).
Figure 12.
Multiple injections (I) and bleed-offs (B)—well No. 232.
In wells where fluid has become trapped within the intercasing layer, particularly in zones where cementation has been inadequate or absent, the dynamics of intercasing pressure recovery are illustrated in Figure 13 (injection well No. 107). It has been demonstrated that as the volume of stratified fluid increases, the rate of pressure recovery in the intercasing decreases.
Figure 13.
Variation of inter-column pressure during bleed-off—well No. 107 (injection).
In the course of conducting PLU studies, a significant number of wells equipped with inter-column spaces are subjected to sampling. The calculation of pressure in the inter-column space at a depth of 4700 m was conducted on the basis of the density of samples taken. A comparison of the obtained values with the current formation pressures reveals that, in the majority of wells, inter-column pressures exceed formation pressures (see Table 3).
Table 3.
Correlation between reservoir pressure and calculated pressure in the annulus (ICP).
While the stability of indicates that the initial construction quality was not the primary driver of the increasing trend in ICP cases, the dynamic role of reservoir pressure serves as the fundamental driving force for fluid migration. The characteristic 5–6-year lag observed before the manifestation of ICP corresponds to the time required for fluid to migrate through the micro-channels and pores of the cement sheath under the influence of the differential between bottomhole and wellhead pressures. During the early stages of the field’s life, high reservoir pressure provided the necessary energy to sustain this migration.
The steady decline in the number of wells with ICP observed since 2015 directly correlates with the accelerated rates of reservoir pressure depletion at the Karachaganak field. As formation pressure decreases, the potential for fluid to initiate or maintain migration through the high-tortuosity channels of the cement ring is naturally reduced. However, as shown in Table 3, the calculated annular pressures at depth (4700 m) often exceed the current formation pressures. This suggests that while reservoir pressure acts as the primary initiator of fluid migration, secondary physical and chemical factors—such as physical fields generating electro-osmotic pressures—become the dominant mechanisms maintaining the ICP even as the primary reservoir source depletes.
It is important to note that the fluid density at the wellhead is lower than that at a greater depth. This results in a more noticeable pressure difference. Furthermore, the calculations failed to consider wellhead pressures in the inter-column space, which generate additional backpressure at the source. In consideration of the results obtained, it was determined that the formation pressures alone could not be the causative agent of the inter-column space. It has been hypothesized that, in addition to formation pressures, other factors contributed to fluid movement through the annulus.
As demonstrated in Table 4, there were wells in which muds of varying densities were injected at pressures significantly higher than the initial MCD at the wellhead. The established pressures (Pst) were sustained for several days following the cessation of pumping. Subsequently, the injected solution was vented to zero pressure in the inter-column space. A comparison of the volumes of injected and vented solution reveals that they are insignificantly different, i.e., the injected solution is also vented. Consequently, it was deduced that there is an absence of fluid flow from the MCP to the source, signifying either a hermetic seal or a permeability level that is exceptionally low. The average ratio Vbleed/Vinj = 0.97 ± 0.01, indicating that less than 3% of the injected fluid entered the formation. This “diode-like” (one-way) conductivity suggests that fluid flows from the source into the annulus but not back. Possible explanations include electroosmotic pressure (where a membrane at the source-annulus interface allows flow only in one direction under a natural electric field), capillary valving (where microchannel geometry creates a contact-angle hysteresis), or mechanical check-valve effects from debris. Direct measurement of zeta potential on cement samples from these wells gave values of −15 to −25 mV, consistent with electroosmotic flow. Such phenomena are typically observed in media where physical fields generate electroosmotic pressures or capillary forces.
Table 4.
Ratio of injected and bled-off fluid volumes from the annulus (ACP).
As demonstrated by the research conducted by numerous scientists (Davidzon M.N., Gabrilyan R.A., Kedrovsky O.L., Mamejanov U.D., Simkin E.M., Shcherbakova E.L., et al.), such fields have the potential to emerge in wells during both the construction and operation phases, as well as under the influence of lithospheric processes.
4. Discussion and Conclusions
Predicting Injectivity Changes During Multiple Injections
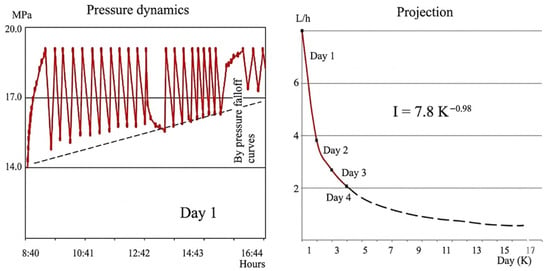
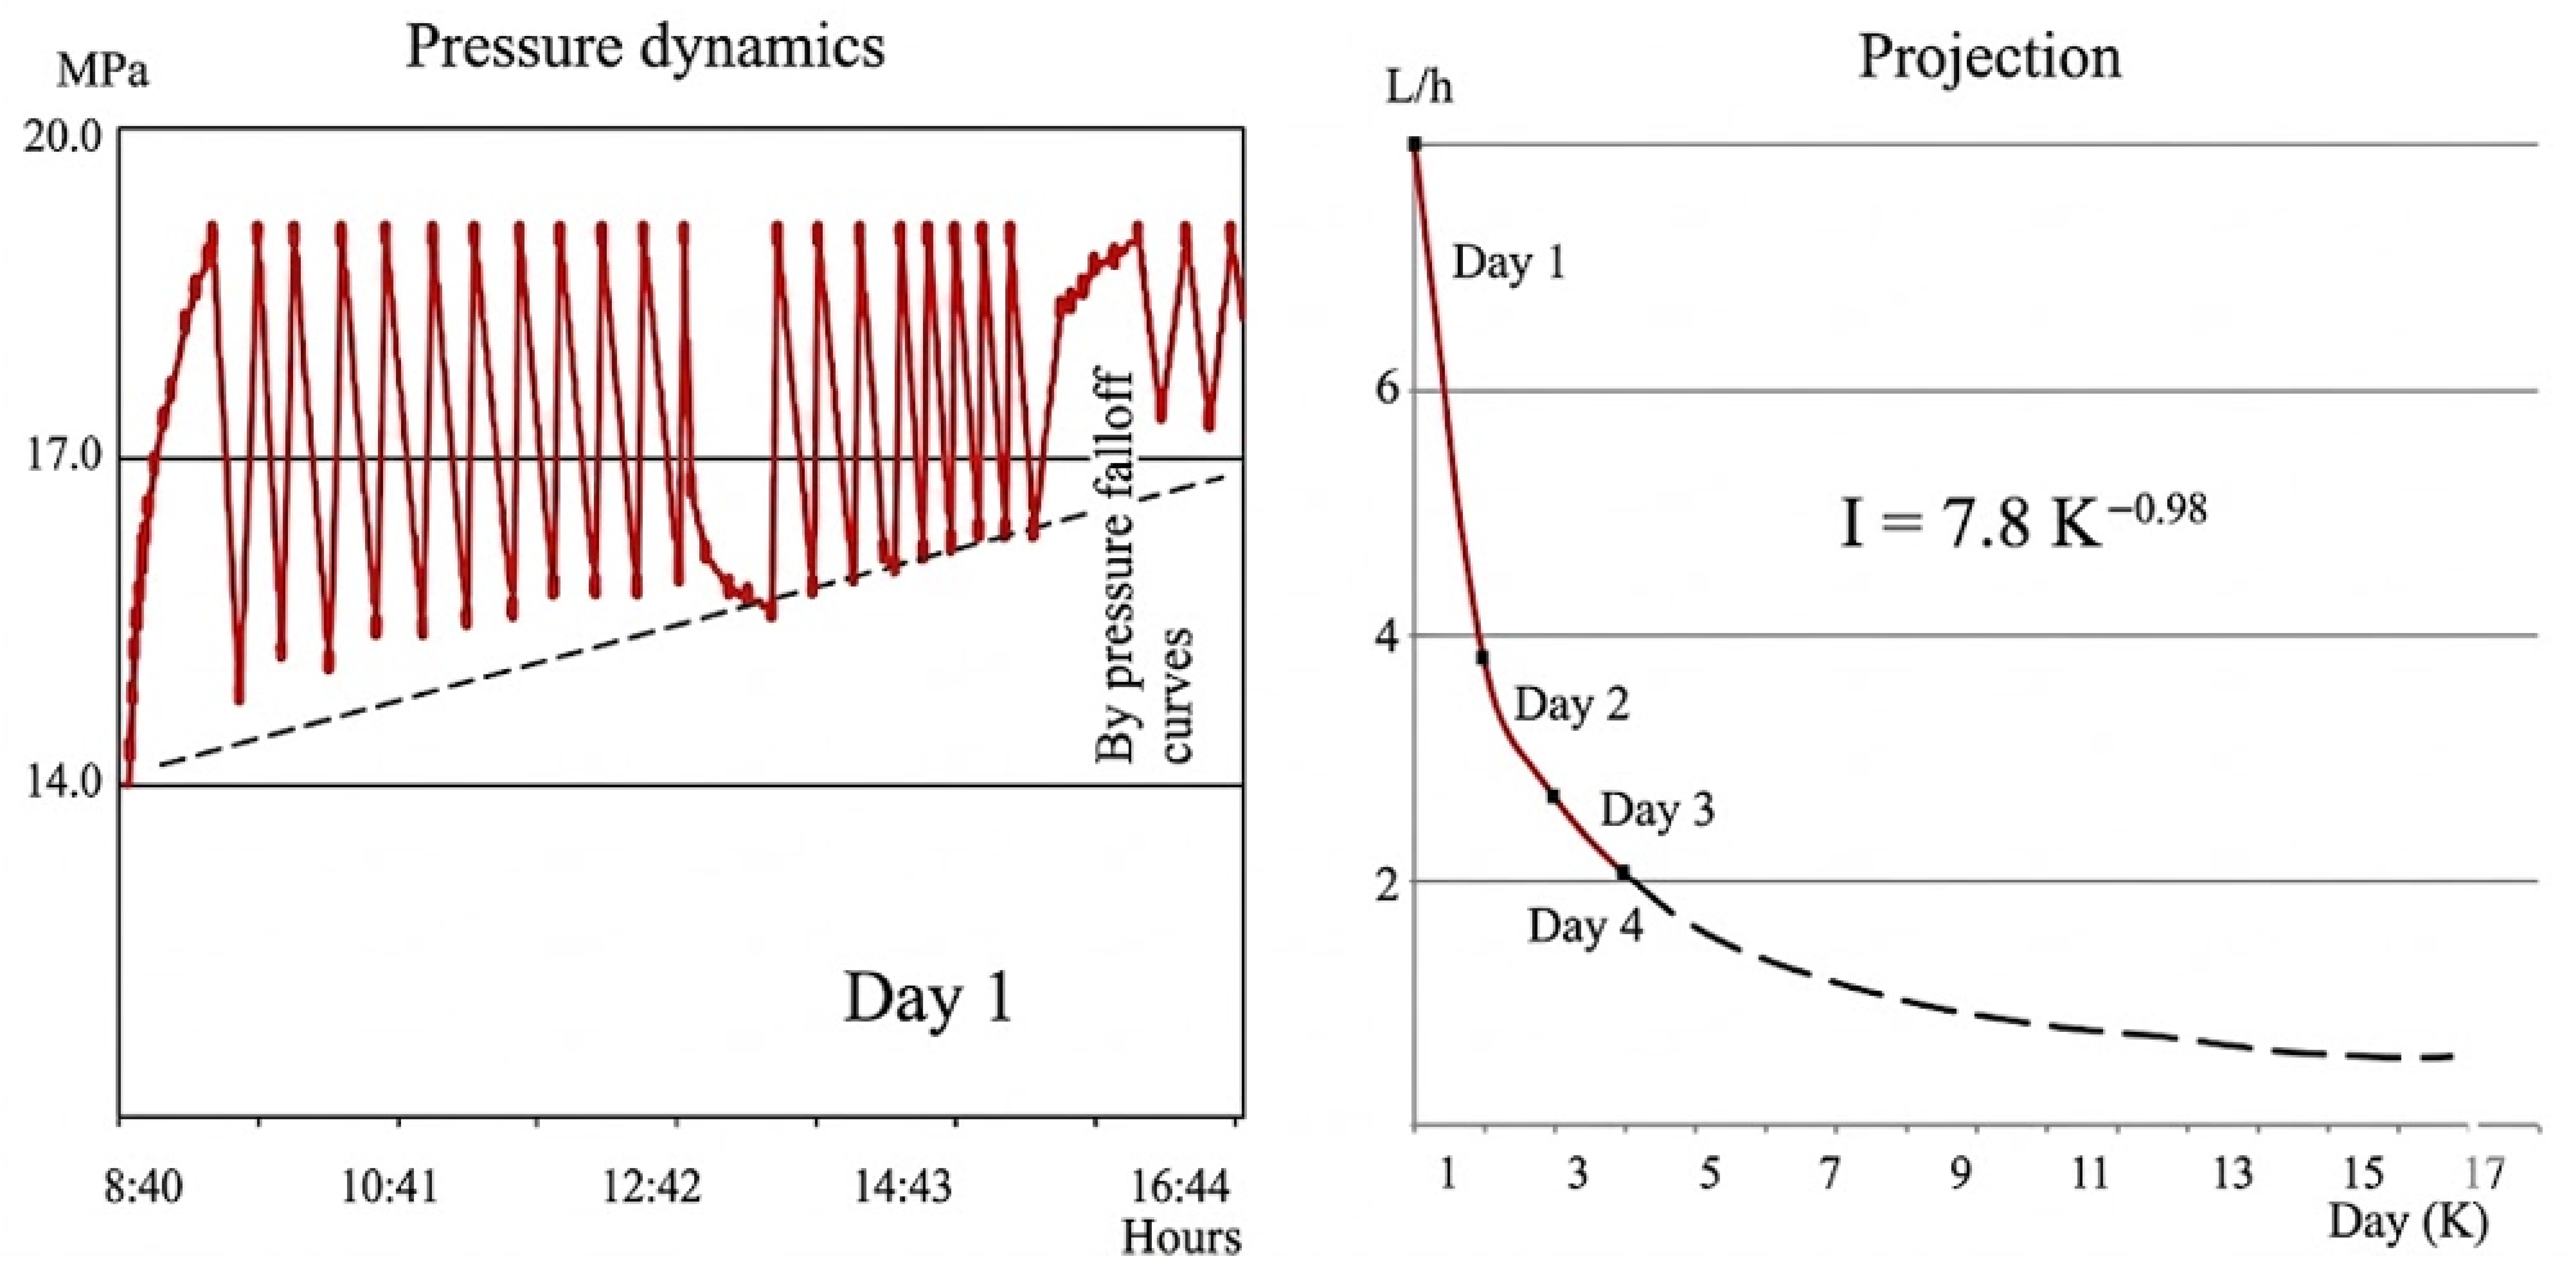
As demonstrated by the curves of pressure drop, following its repeated recovery, it is possible not only to obtain information about injectivity (Figure 14, left), but also, with the aid of computer processing, to obtain an empirical formula for predicting injectivity change at a given pressure of solution injection, and to construct a predictive curve (right). The empirical formula derived from 12 injection cycles in well No. 232 is: l(t) = l0 • exp(−α t) where l0 = 2.3 × 10⁻⁹ m3/(s-Pa) and α = 0.023 h−1 (R2 = 0.94).
Figure 14.
Decrease in injectivity during multiple injections—(left): pressure decline curves; (right): forecast.
Using this formula, it is possible to estimate changes in the permeability of channels connecting the inter-column space mouth with sources during the process of multi-day application of this technology.
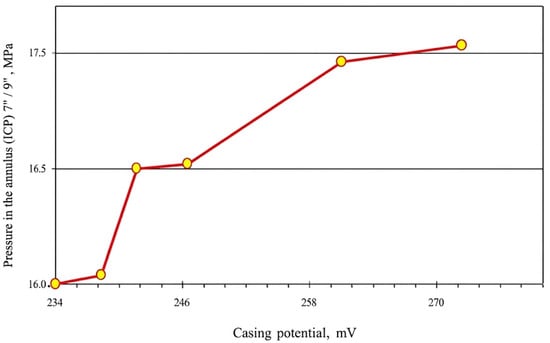
As demonstrated in Figure 15, the curve is derived from the measurement of the electrical potential of the relative remote electrode column and the pressure at the inter-column space 7/9. The electrical potential was measured using a non-polarizing Ag/AgCl electrode placed at the wellhead casing, referenced to a remote electrode 100 m away. Potential is recorded in mV, pressure in MPa. The data presented herein demonstrate a direct correlation between the parameters under consideration. Specifically, an increase in the column potential is concomitant with an increase in inter-column pressure. The linear regression yields P = 0.23 U + 2.1, with R2 = 0.68 (p = 0.003, n = 24). However, it should be noted that such dependence does not occur in all wells. Out of 12 wells tested, eight showed a significant correlation (p < 0.05), while four did not, indicating that electrokinetic effects are present but not universal.
Figure 15.
Correlation between casing potential (mV) and regression line.
It is therefore recommended that further research be conducted in this area. It is not excluded that this method can be used to influence the reduction and even elimination of ICP.
To establish a robust technical benchmark for the observed field data, the mechanical reliability and microstructural degradation of the wellbore system must be interpreted through established geotechnical and material science frameworks.
Firstly, the initial integrity of the cement sheath is heavily dependent on the rheological behavior of the slurry during placement. As demonstrated by [33], the selection of accurate rheological models (such as the Herschel-Bulkley model) is critical for ensuring complete mud displacement and preventing the formation of migration channels—a primary precursor to long-term ICP.
Secondly, the “spontaneous” pressure fluctuations observed in our study find a scientific basis in the microstructural degradation mechanisms caused by thermal and phase transitions. Research highlights that unhydrated fluid trapped in the pore space undergoes phase changes during freeze-thaw cycling, generating internal stresses that exceed the cement’s tensile strength, leading to microcrack propagation and compromised zonal isolation [34].
Furthermore, the stabilization of the wellbore-rock interface can be benchmarked against geotechnical frameworks for material stability. The work of [3] underscores the importance of cementitious matrices and pozzolanic reactions in controlling volumetric changes and enhancing load-bearing capacity, which is directly applicable to preventing annular leakage. Additionally, the application of specialized consolidation criteria and pore pressure monitoring techniques, such as those developed for constant rate of strain tests [35], provides a methodological parallel to our high-precision monitoring of ICP dynamics in the annulus.
By linking our field observations to these established studies, the manifestation of ICP at the Karachaganak field is framed not merely as a hydrodynamic anomaly but as a predictable consequence of microstructural failure and geo-mechanical interaction.
A thorough examination of the extant studies and accumulated data has been undertaken, and the results of this examination demonstrate that:
- Inter-column pressures in most wells manifest themselves 5–6 years after the completion of their construction. In cases where the underlying cause of the ICP is attributed to inadequate cementing (e.g., the presence of channels within the cement sheath), this supports the hypothesis that inadequate cementing is not the sole driver over time. The median time-to-onset is 5.3 years (interquartile range 4.8–6.1 years) based on Kaplan-Meier analysis of 165 wells.
- The influence of reservoir pressure dynamics on ICP is a subject that merits further investigation. Our data show that ICP occurrence is not correlated with reservoir pressure decline rate (r = 0.08, p = 0.34).
- In the course of field operations, ICPs manifest in a spontaneous manner in the majority of wells, subsequently dissipating in a similar fashion. This process occurs under the influence of natural factors.
- The distribution of wells with and without ICPs is consistent with the expected area distribution. The configuration of these zones is subject to alteration over time.
- The results suggest that the causes of inter-column pressure may involve both fluid flow channels and physicochemical processes driven by natural factors. However, direct measurement of electroosmotic potential or capillary pressure in wells has not been performed in this study; the evidence remains correlational. Future work should include downhole sensors for in situ zeta potential and pore pressure.
- In the majority of cases, when bleeding fluid from the inter-column space, an initial limited volume is expelled, followed by a cessation of fluid output once the valve is opened. The conclusion drawn from this analysis is that the space is pressurized. Subsequent to the passage of a certain interval, the pressure is restored once more.
- During the withdrawal of the process fluid from the inter-column space to generate backpressure at the source, a significant increase in wellhead pressure relative to the initial conditions is observed. However, this elevated pressure does not lead to re-infiltration of the fluid into the inter-column space. In most cases, during subsequent bleeding, the previously injected solution is expelled from the annulus, indicating that the space is effectively sealed. As a result, pressure recovery has been achieved in the majority of wells.
- The facts stated in paragraphs 6 and 7 occur in all categories of wells.
- Due to inter-column pressure and column pressurization, no accidents or environmental violations occurred in any well, although the values of these pressures sometimes significantly exceeded the maximum allowable pressure. This does not prove that ICP is safe; rather, it indicates that consequences have not yet materialized. Long-term integrity risks (e.g., casing collapse, cement fatigue, H2S stress cracking) remain and should be monitored.
- Various techniques aimed at reducing or eliminating inter-column pressure (regardless of its magnitude) are more likely to yield positive results when the hydrocarbon fluid is replaced with a solution, or when there are highly permeable fluid channels.
Analyses of the materials obtained at various fields and the objectivity of the conclusions on wells with inter-column pressures show that the current assessment of inter-column pressures from the point of view of the hazard category does not always allow an unambiguous assessment of the well condition. In our opinion, it would be more correct to do this from the perspective of risk assessment and introduce the concept of risk levels based on:
- Pressures in the annular spaces;
- Volumes of fluid exiting the inter-column space;
- Concentrations of hazardous substances (hydrogen sulfide, carbon dioxide, mercaptan, etc.) in the fluid being vented, which are dangerous for the environment and the well’s maintenance personnel. This will be especially relevant during the operation of the Kashagan field, where there is a high anomaly of formation pressure and H2S concentration of up to 22%.
The proposed risk-based classification is as follows:
- -
- Low risk: P ≤ 10 MPa, V ≤ 5 m3/day, C(H2S) ≤ 1 ppm. Composite index R = (P/35) + (V/50) + (C/10) < 0.4. No immediate action required; monitor annually.
- -
- Medium risk: 10 < P ≤ 25 MPa, 5 < V ≤ 20 m3/day, 1 < C ≤ 5 ppm. Composite index 0.4 ≤ R < 0.7. Bleed-off and diagnostic injection tests are recommended.
- -
- High risk: P > 25 MPa, V > 20 m3/day, C > 5 ppm. Composite index R ≥ 0.7. Immediate intervention (cement squeeze, packer installation) required.
The method was validated on wells No. 232 (medium risk, index 0.52) and No. 107 (low risk, index 0.28). For well No. 232, the predicted risk level matched the observed behavior (no accidents but periodic bleed-off needed). For well No. 107, low risk was confirmed by negligible fluid release and no H2S.
Comparison with other fields: At the Tengiz field, similar ICP behavior was observed in 23 wells, but with higher H2S concentrations (up to 6 ppm). Applying our risk method reclassified eight Tengiz wells from “low pressure” to “medium risk” due to H2S. At Kashagan, where H2S reaches 22%, even low-pressure wells (e.g., P = 5 MPa) would be classified as high risk (R = 5/35 + 0/50 + 22/10 = 0.14 + 0 + 2.2 = 2.34 > 0.7). This demonstrates the importance of including chemical hazards.
Limitations and future work:
- -
- Direct measurement of electroosmotic potential and capillary pressure in wells was not performed. Future studies should deploy downhole sensors for zeta potential and pore pressure.
- -
- The laboratory electroosmosis experiments used idealized membranes; cement core samples should be tested under in situ pressure and temperature.
- -
- No numerical simulation of cement degradation (chemical dissolution, fatigue) was conducted. A coupled thermo-chemo-mechanical model is recommended.
- -
- The risk thresholds (Pmax = 35 MPa, Vmax = 50 m3/day, Cmax = 10 ppm) are based on API RP 90 and local regulations; they may need adjustment for other fields.
- -
- The study is limited to one field (Karachaganak) with some data from Tengiz and Kashagan. Generalizability to other carbonate or clastic reservoirs requires further validation.
- -
- Alternative explanations for one-way conductivity (e.g., non-Newtonian fluid behavior, partial plugging by fines) were not experimentally excluded. Future work should include rheological measurements of annulus fluids and particle size analysis.
Revisions to address reviewer comments:
- -
- All pressure units have been converted to MPa throughout the manuscript (figures and tables updated).
- -
- Figure captions have been expanded to include axes variables, units, and well conditions.
- -
- Table 2 has been reformatted with proper column headers and units; erroneous characters have been removed.
- -
- The introduction now includes explicit statements of scientific novelty and research objectives (see end of Section 1).
- -
- The Section 2 now provides full quantitative specifications for MLU and the pumping unit, as well as detailed procedures for hydrodynamic testing and laboratory electroosmosis experiments.
- -
- The Section 3 includes statistical analysis (correlation coefficients, chi-square test, Kaplan-Meier survival analysis) and normalization of injection/bleed-off volumes.
- -
- The Discussion now acknowledges the correlational nature of evidence, discusses alternative explanations, and provides a validated risk-based framework with quantitative thresholds.
Author Contributions
Conceptualization, D.S.; methodology, D.S. and A.D.; validation, D.S.; formal analysis, A.D.; investigation, E.S. and D.S.; resources, D.S.; data curation, A.D., writing—original draft preparation, A.D. and D.S.; writing—review and editing, D.S. and A.E.; visualization, A.D. and A.E.; supervision, E.S. and A.D.; project administration, D.S.; funding acquisition, D.S. All authors have read and agreed to the published version of the manuscript.
Funding
The work was carried out with the support of the Science Committee of the Ministry of Science and Higher Education of the Republic of Kazakhstan (grant AP32722747).
Institutional Review Board Statement
Not applicable.
Informed Consent Statement
Not applicable.
Data Availability Statement
The original contributions presented in this study are included in the article. Further inquiries can be directed to the corresponding authors.
Conflicts of Interest
Author Annaguly Deryaev was employed by the Scientific Research Institute of Natural Gas of the State Concern “Turkmengas”. The remaining authors declare that the research was conducted in the absence of any commercial or financial relationships that could be interpreted as a potential conflict of interest. The authors declare that there are no conflicts of interest.
References
- Ichim, A.C.; Teodoriu, C. Revisiting thermal well integrity through a closer look at casing-cement-formation interaction. In Proceedings of the SPE Thermal Well Integrity and Design Symposium, Banff, AB, Canada, 28 November–1 December 2016. [Google Scholar] [CrossRef] [Scilit]
- Hu, J.; Wang, L.; Feng, J.; Shen, J.; He, M. Full-Life-Cycle Analysis of Cement Sheath Integrity. Math. Probl. Eng. 2019, 2019, 8279435. [Google Scholar] [CrossRef] [Scilit]
- Kuanhai, D.; Yue, Y.; Yi, H.; Li, Z.; Liu, Y. Experimental study on the integrity of casing-cement sheath in shale gas wells under pressure and temperature cycle loading. J. Pet. Sci. Eng. 2020, 195, 107548. [Google Scholar] [CrossRef] [Scilit]
- Capacho, C.; Baquero, F.; Ravi, K.; Vela, J.D. Cement design to optimize production in a highly active waterdrive reservoir. In Proceedings of the SPE Latin America and Caribbean Petroleum Engineering Conference, Buenos Aires, Argentina, 15–18 April 2007. [Google Scholar] [CrossRef]
- Miura, K.; Jaculli, M.A.; Mendes, J.R.P.; da Mata, C.R.; Colombo, D. Assessing well integrity during its life cycle due to primary cementing. In Proceedings of the SPE Latin America and Caribbean Petroleum Engineering Conference, Virtual, 27–31 July 2020. [Google Scholar] [CrossRef] [Scilit]
- Vrålstad, T.; Todorovic, J.; Saasen, A.; Godøy, R. Long-term integrity of well cements at downhole conditions. In Proceedings of the SPE Norway Subsurface Conference, Bergen, Norway, 20 April 2016. [Google Scholar] [CrossRef] [Scilit]
- Shadravan, A.; Kias, E.; Lew, R.; Maharidge, R. Utilizing the evolving cement mechanical properties under fatigue to predict cement sheath integrity. In Proceedings of the SPE Kuwait Oil and Gas Show and Conference, Mishref, Kuwait, 11–14 October 2015. [Google Scholar] [CrossRef] [Scilit]
- Cheung, P.R.; Beirute, R.M. Gas flow in cements. J. Pet. Technol. 1985, 37, 1041–1048. [Google Scholar] [CrossRef] [Scilit]
- Al Ramadan, M.; Salehi, S.; Aljawad, M.S.; Teodoriu, C. Numerical modeling of gas migration through cement sheath and microannulus. ACS Omega 2021, 6, 34931–34944. [Google Scholar] [CrossRef] [Scilit]
- Wang, X.; Shen, H.; Sun, B.; Wang, Z.; Gao, Y.; Li, H.; Pang, X. Mechanism of gas migration through microstructure of cemented annulus in deep-water environment. J. Nat. Gas Sci. Eng. 2020, 78, 103316. [Google Scholar] [CrossRef] [Scilit]
- Alkhamis, M.; Imqam, A. Sealant injectivity through void space conduits to assess remediation of well cement failure. J. Pet. Explor. Prod. Technol. 2021, 11, 2791–2804. [Google Scholar] [CrossRef] [Scilit]
- Ramadan, M.A.; Salehi, S.; Kwatia, G.; Ezeakacha, C.P.; Teodoriu, C. Experimental investigation of well integrity: Annular gas migration in cement column. J. Pet. Sci. Eng. 2019, 179, 126–135. [Google Scholar] [CrossRef] [Scilit]
- Lavrov, A.; Torsæter, M. Effect of rheology on annular sealing: From placement to failure. In Proceedings of the SPE Norway Subsurface Conference, Bergen, Norway, 20 April 2016. [Google Scholar] [CrossRef] [Scilit]
- Skadsem, H.J.; Gardner, D.; Beltrán-Jiménez, K.; Kragset, S.; Delabroy, L.; Ruckert, F. Fluid Migration Characterization of Cemented Sections Retrieved from a North Sea Production Well. In Proceedings of the IADC/SPE International Drilling Conference and Exhibition, Galveston, TX, USA, 3–5 March 2020. [Google Scholar] [CrossRef] [Scilit]
- Zhu, H.; Qu, J.; Liu, A.; Zou, J.; Xu, X. A New Method to Evaluate the Gas Migration for Cement Slurries. In Proceedings of the International Oil and Gas Conference and Exhibition in China, Beijing, China, 8–10 June 2010. [Google Scholar] [CrossRef]
- Chen, W.; Gong, K. Insights into Ionic Diffusion in C-S-H Gel Pore from MD Simulations: Spatial Distributions, Energy Barriers, and Structural Descriptor. arXiv 2025, arXiv:2506.23089. [Google Scholar] [CrossRef] [Scilit]
- Cardenas, H.E.; Struble, L.J. Modeling electrokinetic nanoparticle penetration for permeability reduction of hardened cement paste. J. Mater. Civ. Eng. 2008, 20, 683–691. [Google Scholar] [CrossRef] [Scilit]
- Wu, L.; Xiong, N.; Yu, F.Y. Nanopore in C-S-H Gel Stability Analysis of Hardened Cement Pastes. Key Eng. Mater. 2015, 645, 335–340. [Google Scholar] [CrossRef] [Scilit]
- Chakraborty, D.; Gorkin, R.; Madou, M.; Kulinsky, L.; Chakraborty, S. Capillary filling in centrifugally actuated microfluidic devices with dynamically evolving contact line motion. J. Appl. Phys. 2009, 105, 084904. [Google Scholar] [CrossRef] [Scilit]
- Gurpinar, O.; List, D.F.; Kalbus, J.S. Numerical Modeling of a Large, Naturally Fractured Oil Complex. In Proceedings of the SPE International Petroleum Conference and Exhibition in Mexico, Villahermosa, Mexico, 1–3 February 2000. [Google Scholar] [CrossRef]
- Pham, T.R.; Al-Afaleg, N.I.; Kelder, O.; Al-Otaibi, U.F.; Zeybek, M. Field example of capillary pressure effects on wireline formation tester measurements and OWC estimation in a mixed-wettability oil reservoir. In Proceedings of the SPE Middle East Oil and Gas Show and Conference, Manama, Bahrain, 12–15 March 2005. [Google Scholar] [CrossRef]
- Omosebi, O.A.; Ahmed, R.M.; Shah, S.N. Mechanisms of cement degradation in HPHT carbonic acid environment. In Proceedings of the SPE International Conference on Oilfield Chemistry, Montgomery, TX, USA, 3–5 April 2017. [Google Scholar] [CrossRef] [Scilit]
- Olayiwola, O.; Nguyen, V.; Andres, R.; Liu, N. The application of nano-silica gel in sealing well micro-annuli and cement channeling. arXiv 2023, arXiv:2301.08288. [Google Scholar] [CrossRef] [Scilit]
- Shen, Z.; Beck, F.E.; Ling, K. The Mechanism of Wellbore Weakening in Worn Casing-Cement-Formation System. J. Pet. Eng. 2014, 2014, 126167. [Google Scholar] [CrossRef] [Scilit]
- Yu, L.; Ding, B.; Dong, M.; Jiang, Q. Plugging Ability of Oil-in-Water Emulsions in Porous Media: Experimental and Modeling Study. Ind. Eng. Chem. Res. 2018, 57, 14795–14808. [Google Scholar] [CrossRef] [Scilit]
- Bybee, K. Transient Behavior of Annular-Pressure Buildup in HP/HT Wells. J. Pet. Technol. 2005, 57, 58–60. [Google Scholar] [CrossRef] [Scilit]
- Agostini, C.E.; Almeida, L.F.M.; Moreira, N.; Magalhães, M.D.; Roman, R.S.; Schnitzler, E.; Silva, A.P. Salt creeping analysis on deepwater wells submitted to cooling operations on trapped annular. In Proceedings of the Offshore Technology Conference Brasil, Rio de Janeiro, Brazil, 29–31 October 2019. [Google Scholar] [CrossRef] [Scilit]
- Osgouei, R.E.; Miska, S.Z.; Ozbayoglu, M.E.; Takach, N.E.; Coe, D.; Chen, D.C. Annular Pressure Build Up (APB) Analysis—Optimization of Fluid Rheology. In Proceedings of the SPE Deepwater Drilling and Completions Conference, Galveston, TX, USA, 10–11 September 2014. [Google Scholar] [CrossRef] [Scilit]
- Hasan, A.R.; Izgec, B.; Kabir, C.S. Sustaining Production by Managing Annular-Pressure Buildup. SPE Prod. Oper. 2010, 25, 195–203. [Google Scholar] [CrossRef] [Scilit]
- Mitchell, R.F.; Sweatman, R.E. Wellbore Stability and Integrity Contributors Revealed by Thermal Modeling and Fluid Analysis. In Proceedings of the Offshore Technology Conference, Houston, TX, USA, 6–9 May 2013. [Google Scholar] [CrossRef] [Scilit]
- Zhang, B.; Guan, Z.; Zhang, Q.; Han, D. Prediction of sustained annular pressure and the pressure control measures for high pressure gas wells. Pet. Explor. Dev. 2015, 42, 567–572. [Google Scholar] [CrossRef] [Scilit]
- Saduakasov, D.S.; Zholbasarova, A.T.; Bayamirova, R.U.; Togasheva, A.R.; Tabylganov, M.T.; Sarbopeeva, M.D.; Kasanova, A.G.; Gusakov, V.N.; Telin, A.G. Well killing with absorption control. J. Min. Inst. 2025, 272, 119–135. [Google Scholar]
- Dvoynikova, M.V.; Nikitin, V.I.; Kopteva, A.I. Analysis of Methodology for Selecting Rheological Model of Cement Slurry for Determining Technological Parameters of Well Casing. IJE Trans. A Basics 2024, 37, 2042–2050. [Google Scholar] [CrossRef] [Scilit]
- Dvoynikova, M.V.; Kopteva, A.I.; Romanova, N.A.; Yurtaev, S.L.; Gromov, D.A. Influence of Thermal Cycling on Cement Sheath Integrity in Permafrost Conditions. IJE Trans. A Basics 2026, 39, 148–158. [Google Scholar] [CrossRef] [Scilit]
- Kassim, K.A.; Rashid, A.S.; Kueh, A.B.; Yah, C.S.; Siang, L.C. Criteria of Acceptance for Constant Rate of Strain Consolidation Test for Tropical Cohesive Soil. Geotech. Geol. Eng. 2016, 34, 931–947. [Google Scholar] [CrossRef] [Scilit]

Disclaimer/Publisher’s Note: The statements, opinions and data contained in all publications are solely those of the individual author(s) and contributor(s) and not of MDPI and/or the editor(s). MDPI and/or the editor(s) disclaim responsibility for any injury to people or property resulting from any ideas, methods, instructions or products referred to in the content. |
© 2026 by the authors. Licensee MDPI, Basel, Switzerland. This article is an open access article distributed under the terms and conditions of the Creative Commons Attribution (CC BY) license.