


Abstract
To address the critical challenges of geological hazards, such as water and mud inrush, encountered during the construction of deep-buried tunnels in China, this study investigates the hydraulic properties of remolded mud-infill materials. A multi-scale approach, integrating indoor variable-head permeability tests with scanning electron microscopy (SEM), was employed to characterize the evolutionary patterns of the permeability coefficient (k). Specifically, the research evaluates the independent influences of moisture content, dry density, and confining pressure, alongside the synergistic coupling between dry density and hydration state. The results demonstrate the following: Under independent variable conditions, k exhibits a monotonic decline with increasing dry density and confining pressure while showing a positive correlation with moisture content, with the sensitivity varying significantly across different parameter regimes; under coupled effects, the permeability in both low- and high-moisture ranges manifests a distinct “increase–decrease–increase” fluctuation as dry density rises, reaching a local peak at 2.20 g/cm3. Notably, a relative minimum k (6.12 × 10⁻⁷ cm/s) is achieved at the optimum moisture content (5.8%); micro-mechanistic analysis reveals that low-moisture samples are characterized by randomized angular particles and well-developed interconnected macropore networks, facilitating higher k values. Conversely, high-moisture samples exhibit preferential plate-like stacking dominated by occluded micropores, resulting in a substantial reduction in hydraulic conductivity. This study elucidates the multi-factor coupling mechanism governing the seepage behavior of remolded mud, providing essential theoretical benchmarks for the prediction and mitigation of water–mud outburst disasters in deep underground engineering, thereby ensuring the structural stability and operational safety of tunnel projects.
1. Introduction
In recent years, China has been undergoing a strategic transition toward “expanding into deep underground space.” Deeply buried tunnels, serving as core conduits for cross-regional energy transmission and water resource allocation, have become a key focus in the 14th Five-Year Plan for infrastructure development. Projects such as the Yarlung Tsangpo Hydropower Station and the Kunlun Mountain Tunnel, which aim to divert water from Tibet to Xinjiang, face complex geological conditions characterized by great burial depth, intricate surrounding rock properties, widespread distribution of soft and soluble rocks, and numerous large-scale faults. During excavation, these tunnels encounter multiple engineering geological challenges, including water and mud surges, high water pressure, and deformation of soft rock. These issues constitute critical technical hurdles and primary challenges, emerging as bottlenecks for national mega-water diversion projects and severely constraining construction safety, progress, and quality. The 2025 Central Urban Work Conference proposed “advancing lifeline safety projects for infrastructure.” With annual national investment in underground engineering exceeding 4 trillion yuan, demand for deep-buried tunnel disaster prevention and control technologies has risen to the national strategic level.
Muddy substances are widely distributed in geotechnical engineering and play a significant role in triggering geological hazards. Tunnel construction frequently encounters major geological disasters such as water and mud outbursts and surrounding rock collapses. Water and mud outburst disasters result from the combined effects of underground engineering activities and poor geological formations, causing the potential energy stored within these formations to be released instantaneously [1]. This manifests as the sudden, gradual, or intermittent influx of large volumes of water or muddy water mixtures—originally confined within poor geological formations—breaking through the barriers of waterproofing rock masses. These flows enter tunnels or caverns through channels within the waterproofing rock mass or along engineering geological interfaces, constituting a dynamic, destructive phenomenon [2,3,4]. This process not only causes rock mass instability and support structure failure but may also alter regional groundwater recharge and discharge conditions, triggering secondary disasters such as surface subsidence and collapse, posing severe threats to construction safety and the ecological environment.
Numerous experimental and theoretical studies have been conducted on the permeability of fine-grained clays. Zeng [5] conducted permeability tests on remolded clay during compression and established a multiple linear regression analysis based on permeability coefficient results, finding that the permeability coefficient of remolded clay during compression is primarily influenced by the liquid limit and porosity ratio. Liang [6] conducted adjustable constant-head permeability tests on fine-grained artificial soil and natural soft soil, respectively, and analyzed the observed phenomena and results using the “micro-power plant theory” and “microscale theory.”
In recent years, the hydro-physical properties of building materials have attracted widespread attention in the scientific community. Lv [7] investigated the effects of three typical aggregate grading schemes—continuous, discontinuous, and single-grade—on the mechanical properties and water permeability of recycled permeable concrete. Using non-linear fitting techniques, the mathematical relationship between the “connected porosity” and “permeability coefficient” for materials with different gradations was characterized. The study indicated that while narrowing the particle size range of aggregates increases porosity and water permeability, it also leads to a decrease in density and strength. Ortiz-Marqués [8] conducted an in-depth analysis of how the microporous structure directly influences water transport within a material, capillary absorption phenomena, and degradation mechanisms such as salt crystallization. He [9] investigated the combined effects of the water-to-binder ratio, aggregate particle size, and specific additives on the porous structure and hydraulic properties of permeable planting concrete, which is commonly used in ecological slope protection. Specific chemical reactions can significantly improve the workability of cement paste, forming a highly interconnected pore network within it. Deng [10], focusing on the preparation of low-carbon grouting materials using waste glass powder (WGP), demonstrated that the water-to-binder ratio is the key parameter for regulating the hydraulic and physical properties of grouting materials. At high water-to-binder ratios, the effect of the WGP content on workability is mitigated, and the study ultimately proposed a WGP content scheme that balances workability and strength. Zhagifarov [11] also confirmed through their research on self-compacting concrete (SCC) that optimizing the proportion of mineral admixtures can effectively refine internal pores, thereby reducing capillary water absorption rates and water penetration depth. Liang [12] proposed a hydrophobic modification scheme. The emulsion disperses uniformly within the cement matrix and forms a hydrophobic layer on the pore walls, significantly reducing the material’s water absorption rate and permeability. Tkach [13] improved the uniformity of a material’s pore structure by treating aluminum powder with surfactants and adding organometallic modifiers, reducing the material’s water absorption rate by 1.5 to 2 times. Wang [14] demonstrated through research that silica fume and slag powder reduce the workability of fresh UHPC and significantly increase its plastic viscosity, whereas microspheres and fly ash, due to the lubricating effect of their spherical particles, can effectively enhance workability and reduce viscosity. Yu [15] investigated the physical response of high-water-content cement-stabilized soil under different confining pressures. They found that due to the material’s extremely poor permeability, the samples often remained in a state of incomplete saturation. Furthermore, high confining pressures highly compress the air within the pores and increase its solubility in water, thereby affecting the material’s overall physical density. Kamdem [16] systematically analyzed the physical properties of various cement–soil combinations. Their research confirmed that CEM III cement with a high slag content produces the densest micro-hydration products, thereby significantly reducing the material’s water porosity. Szafraniec [17] investigated the effects of surface hydrophobic agents based on nano-silicates and oligopropyl silicates on concrete, finding that surface modification significantly reduced water absorption rates, and they innovatively utilized image texture analysis and machine learning algorithms. Yue [18] employed a vacuum impregnation method to modify blue bricks using amide polymers; experiments confirmed that this method effectively reduces the capillary water absorption capacity of blue bricks and improves their performance stability under wet–dry cycling. Additionally, Sydor [19] evaluated the ability of different protective coatings to shield concrete from atmospheric moisture, emphasizing the pivotal role of high-quality coatings in blocking moisture penetration and preventing carbonation. Taouirte [20] found that hemp shives exhibit extremely high hydrophilicity, noting that their highly porous structure is the primary reason for their high water absorption and low thermal conductivity. Fischer and Korjenic [21] evaluated the resilience of bio-based exterior walls under air leakage and high-humidity loads. Poupard [22] found that moisture cycling causes micro-deformations in hempcrete and alters its pore characteristics, thereby affecting its long-term thermal and moisture performance. Ranefjrd [23] conducted a systematic evaluation of bio-based insulation materials sourced locally in Sweden, noting that these materials possess significantly higher moisture absorption and moisture buffering capacities compared to traditional mineral wool.
The concept of soil microstructure was first proposed by Terzaghi in the early 20th century [24], who linked the microscopic pore structure of cohesive soils to their engineering behavior and termed the consolidated soil structure as a “honeycomb structure.” With advancing research techniques, methods such as SEM and MIP (mercury intrusion porosimetry) have been increasingly applied to study soil microstructure. Feng [25] developed a method for calculating three-dimensional soil porosity based on SEM images, providing a microscopic analysis of the mechanism behind strength degradation in saline soils. G. Di Remigio [26] developed an image analysis program for a Microstructure Clay Analyzer (MiGA) based on SEM experiments, enabling the quantification of particle orientation and porosity in clay samples through SEM image analysis. Bowen [27] investigated the effects of cyclic loading on the micropore structure and fractal characteristics of soft soils via SEM experiments. The above studies indicate that the microstructural characteristics of soil significantly influence its macroscopic properties. They also demonstrate that the primary factor determining soil’s response to external loading is its distinct microstructure [28]. Therefore, investigating soil microstructure can further reveal the microscopic mechanisms underlying its macroscopic physical and mechanical behavior.
To predict the macroscopic hydraulic parameters of building materials, many researchers have replaced traditional empirical formulas with ensemble learning and neural network algorithms. Yu [29] employed the Stacking ensemble learning algorithm to predict the permeability coefficient and compressive strength of permeable concrete, demonstrating the superiority of machine learning in handling the non-linear relationship between complex pore structures and permeability. Wu [30] similarly utilized an MLP network model to successfully achieve innovative predictions of the hydraulic properties of permeable concrete. In the field of industrial waste reuse, Dzięcioł [31] evaluated the filtration performance of artificial aggregates such as blast furnace slag and found that the GBM model performed best in estimating the filtration coefficient. Hai-Bang [32] used an XGBoost model enhanced by the Seahorse optimization algorithm to predict the permeability of porous media with high accuracy and discovered that the size distribution of inclusions is the most critical microscopic factor affecting permeability. Deep learning techniques, particularly Convolutional Neural Networks (CNNs), have made it possible to directly predict material hydraulic properties from microstructural images. Wu [33] was among the first to apply a CNN model to predict the effective diffusivity of porous media from two-dimensional structural images; this model outperformed the traditional Bruggeman empirical equation, demonstrating higher robustness, especially when dealing with structures with low diffusivity. Heider [34] developed a multi-scale CNN architecture that utilizes microstructural geometric features obtained from micro-CT scans to achieve rapid prediction of intrinsic permeability. Kim [35] investigated the relationship between concrete electrical conductivity and degree of saturation (DS) as well as pore structure using a multivariate machine learning framework, confirming that electrical conductivity decreases exponentially with increasing saturation and determining that saturation is the key dominant factor influencing moisture migration monitoring. Current challenges lie in acquiring broader and higher-quality microstructural datasets, as well as further improving the model’s generalization ability across different material systems. In summary, current research on soil microstructure primarily focuses on analyzing its microscopic morphological characteristics. However, studies that delve deeper into soil permeability mechanisms by examining micro-morphology and internal pore structure characteristics require further investigation.
While research into the micro-hydro properties of soils has advanced, most studies rely on superficial microstructural characterizations that overlook multi-variable complexities. Elucidating the governing mechanisms of soil permeability necessitates a transition from macroscopic observation to pore network analysis. This is particularly critical for ‘mud-like materials’ encountered in deep-buried environments, where the multiphysics coupling of hydration state, compaction, and geostatic stress remains insufficiently explored. Bridging the gap between abrupt macroscopic permeability shifts and microscopic connectivity dynamics represents a vital frontier that has yet to be formally established.
Addressing the critical engineering challenges posed by recurrent water and mud inrush hazards in deep-buried tunnels through argillaceous (mud-like) formations, this study investigates the multiphysics coupling mechanisms governing the permeability of such media. By integrating variable-head permeability tests with advanced micro-characterization techniques, this research systematically quantifies the macroscopic sensitivity of hydraulic conductivity to varying moisture content, dry density, and geostatic stress. Furthermore, it unravels the mechanistic link between macroscopic flow behavior and the evolution of particle morphology and pore network architecture. The findings establish a robust theoretical framework for disaster mitigation and provide actionable insights for the design and construction of resilient underground infrastructure.
2. Experiments
2.1. Test Materials
This study focuses on typical mudstone and its silicified variants sampled from a fault-fracture zone in a deep-buried tunnel in Hubei, China. Primarily composed of clay minerals and silt, this argillaceous rock maintains moderate structural integrity when dry, often serving as a low-permeability seal or weak interlayer within deep geological strata.
Mudstone’s extreme hydrophilicity triggers rapid slaking and softening upon hydration. During excavation, the synergy of groundwater saturation and mechanical disturbance induces severe “mudification”: the dissolution of inter-granular cement causes the rock mass to disintegrate into a low-strength, fluid-like “re-plasticized” medium. This degraded material exhibits negligible bearing capacity and acts as a preferential conduit for high-pressure fluid flow, culminating in catastrophic water and mud inrush. Consequently, characterizing the permeability evolution of these remolded mud-like materials is essential for unraveling the mechanisms of mud outbursts and enhancing disaster mitigation in underground engineering.
The field-retrieved mudstone samples exhibit a silty-to-fine-silty matrix characterized by a pronounced platy (laminated) fabric. Localized fracture networks are observed throughout the rock mass, predominantly infilled with secondary minerals such as goethite. To precisely characterize the microstructural assembly, petrographic thin-section analysis via polarizing microscopy (Leica Microsystems, Wetzlar, Germany) was employed to identify the mineralogical constituents of both the intact mudstone and its silicified derivatives. Additionally, fundamental geotechnical index tests were conducted to evaluate the material’s physical properties. The results are summarized in Table 1 and Table 2.
Table 1.
Composition of mudstone.
Table 2.
Basic physical parameters of mud.
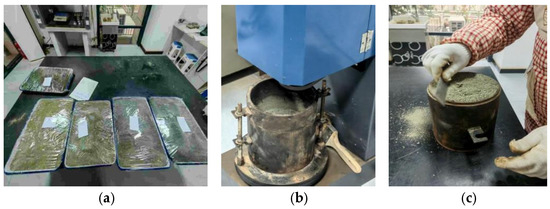
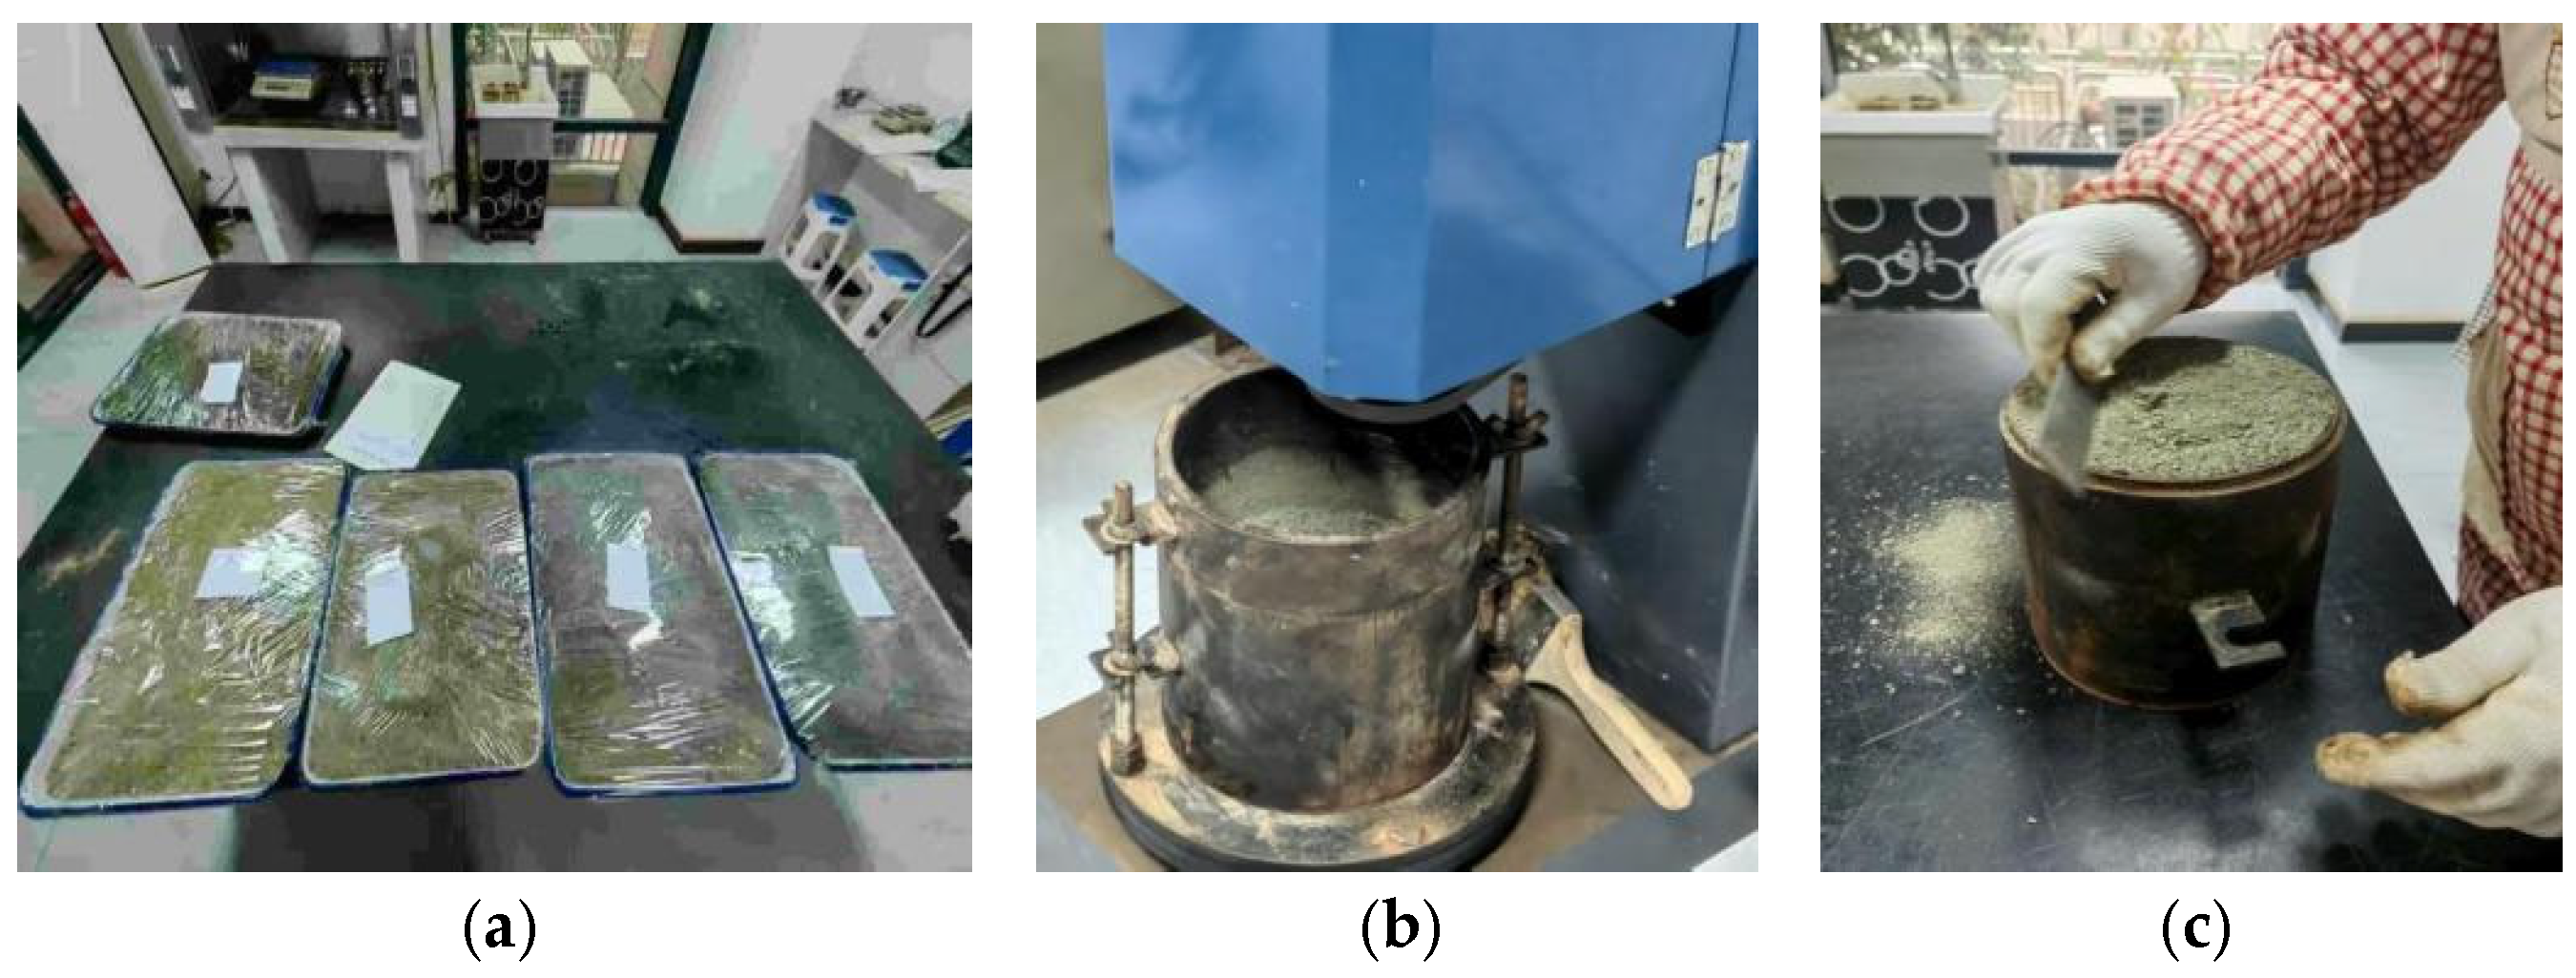
Compaction tests were performed in strict compliance with the protocols outlined in the Standard for Geotechnical Testing Methods (GB/T 50123-2019) to determine the dry density and moisture content of samples from various test points. The experimental workflow is illustrated in Figure 1, and the resulting compaction parameters are summarized in Table 3.
Figure 1.
Compaction test process for samples. (a) Batch preparation. (b) Compaction of soil. (c) Leveling of soil samples.
Table 3.
Maximum dry density and optimum moisture content of clayey materials.
2.2. Test Plan
Mud-reformed samples were selected for testing. Based on the experimental design, different combinations of density–moisture content and pressure–moisture content gradients were established, with moisture content values of 2%, 4%, 6%, 8%, and 10%. Densities of 1.5 g/cm3, 1.7 g/cm3, 1.9 g/cm3, 2.1 g/cm3, and 2.3 g/cm3 were employed, and pressures of 1 MPa, 3 MPa, 5 MPa, 7 MPa, and 10 MPa were applied.
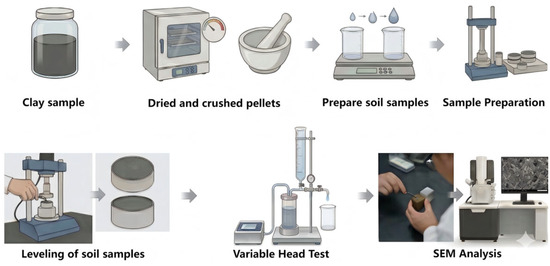
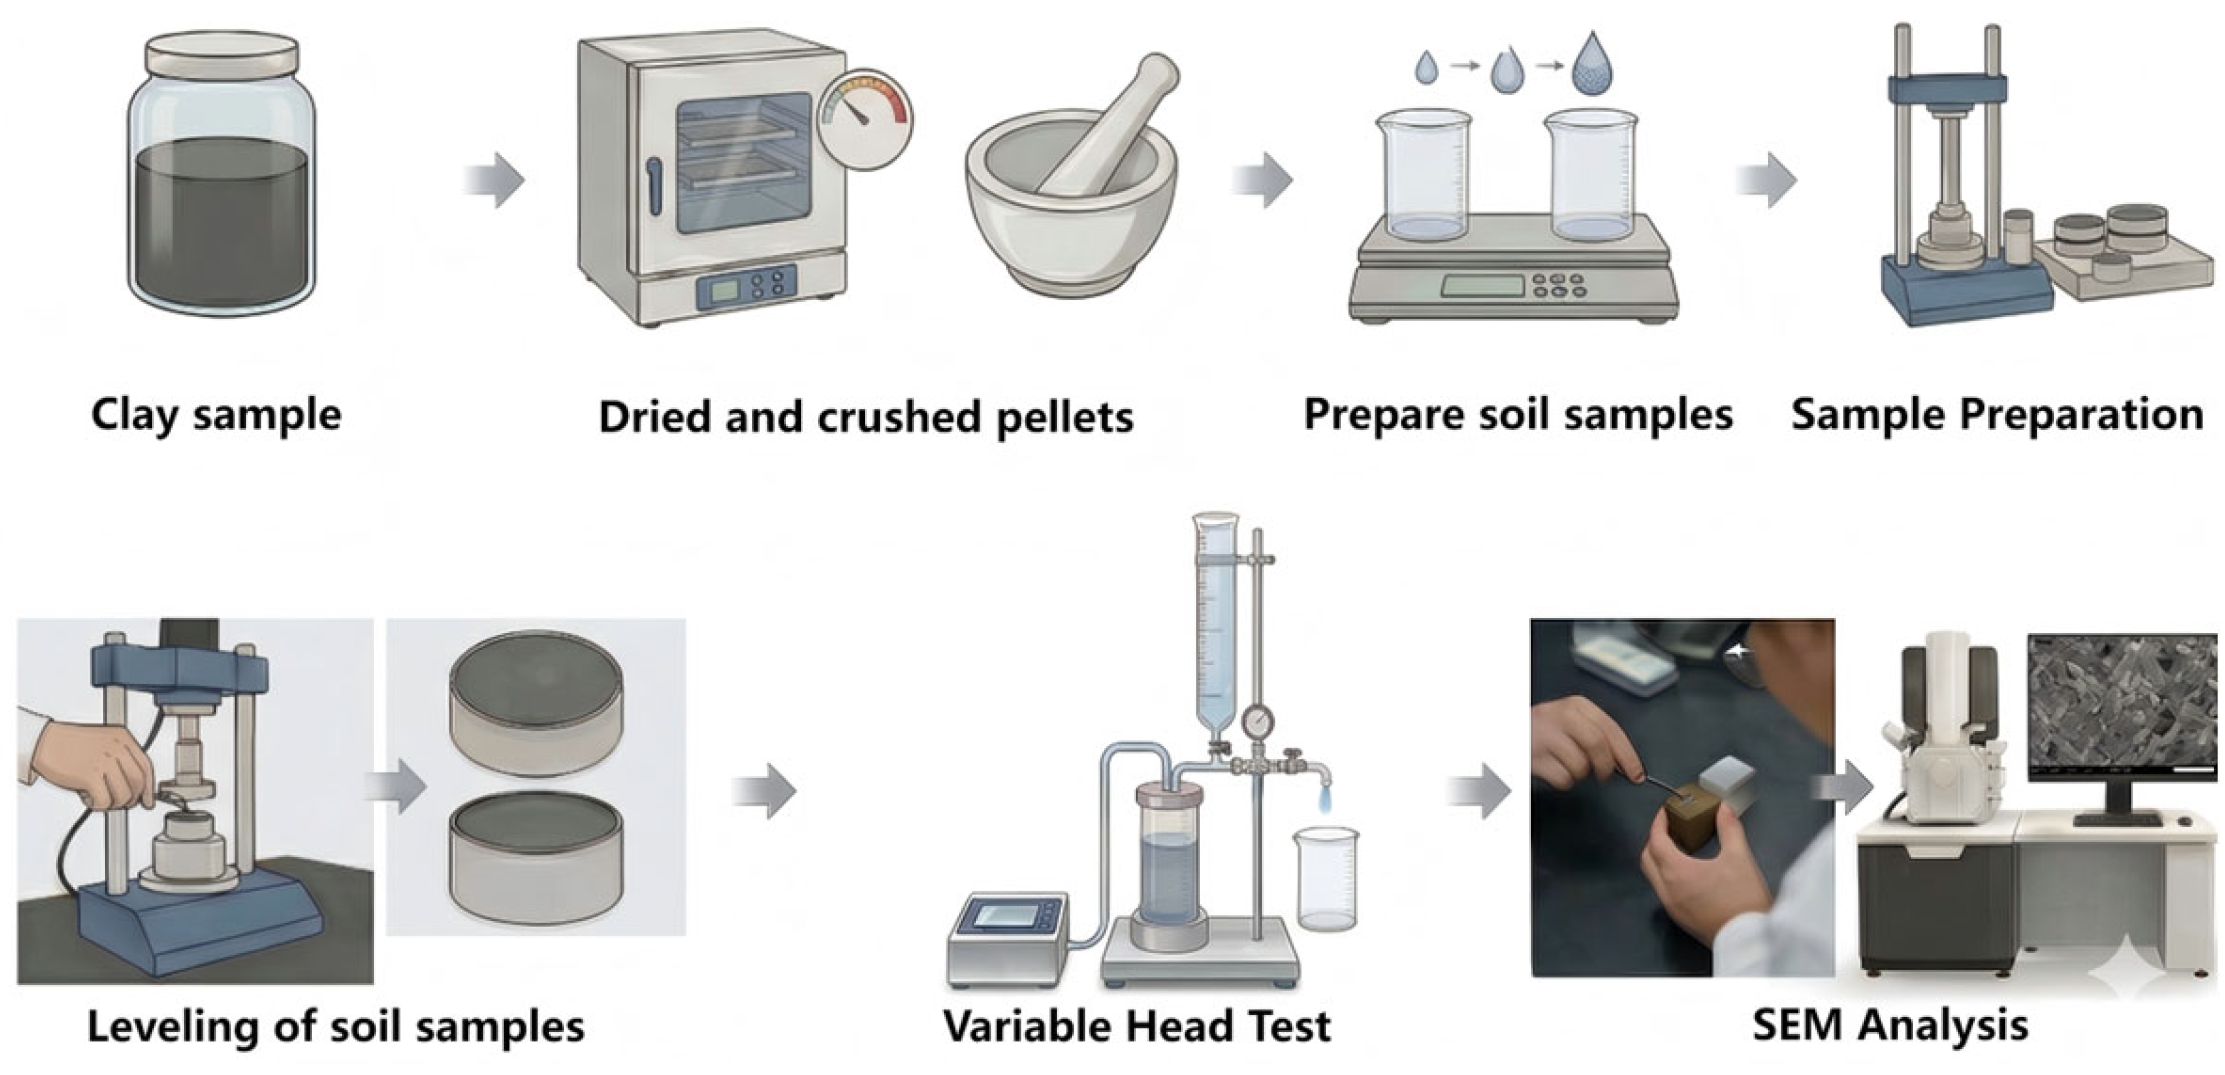
Additionally, based on the compaction test curve, 3–5 dry density levels were selected from the curve (e.g., , , ). For each dry density, samples with low moisture content (left points) and high moisture content (right points) were prepared for study. See Figure 2 below for the test procedure.
Figure 2.
Test procedure flowchart.
2.3. Sample Preparation and Test Procedure
2.3.1. Sample Preparation
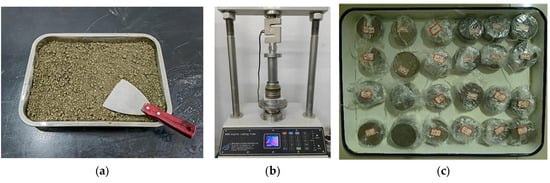
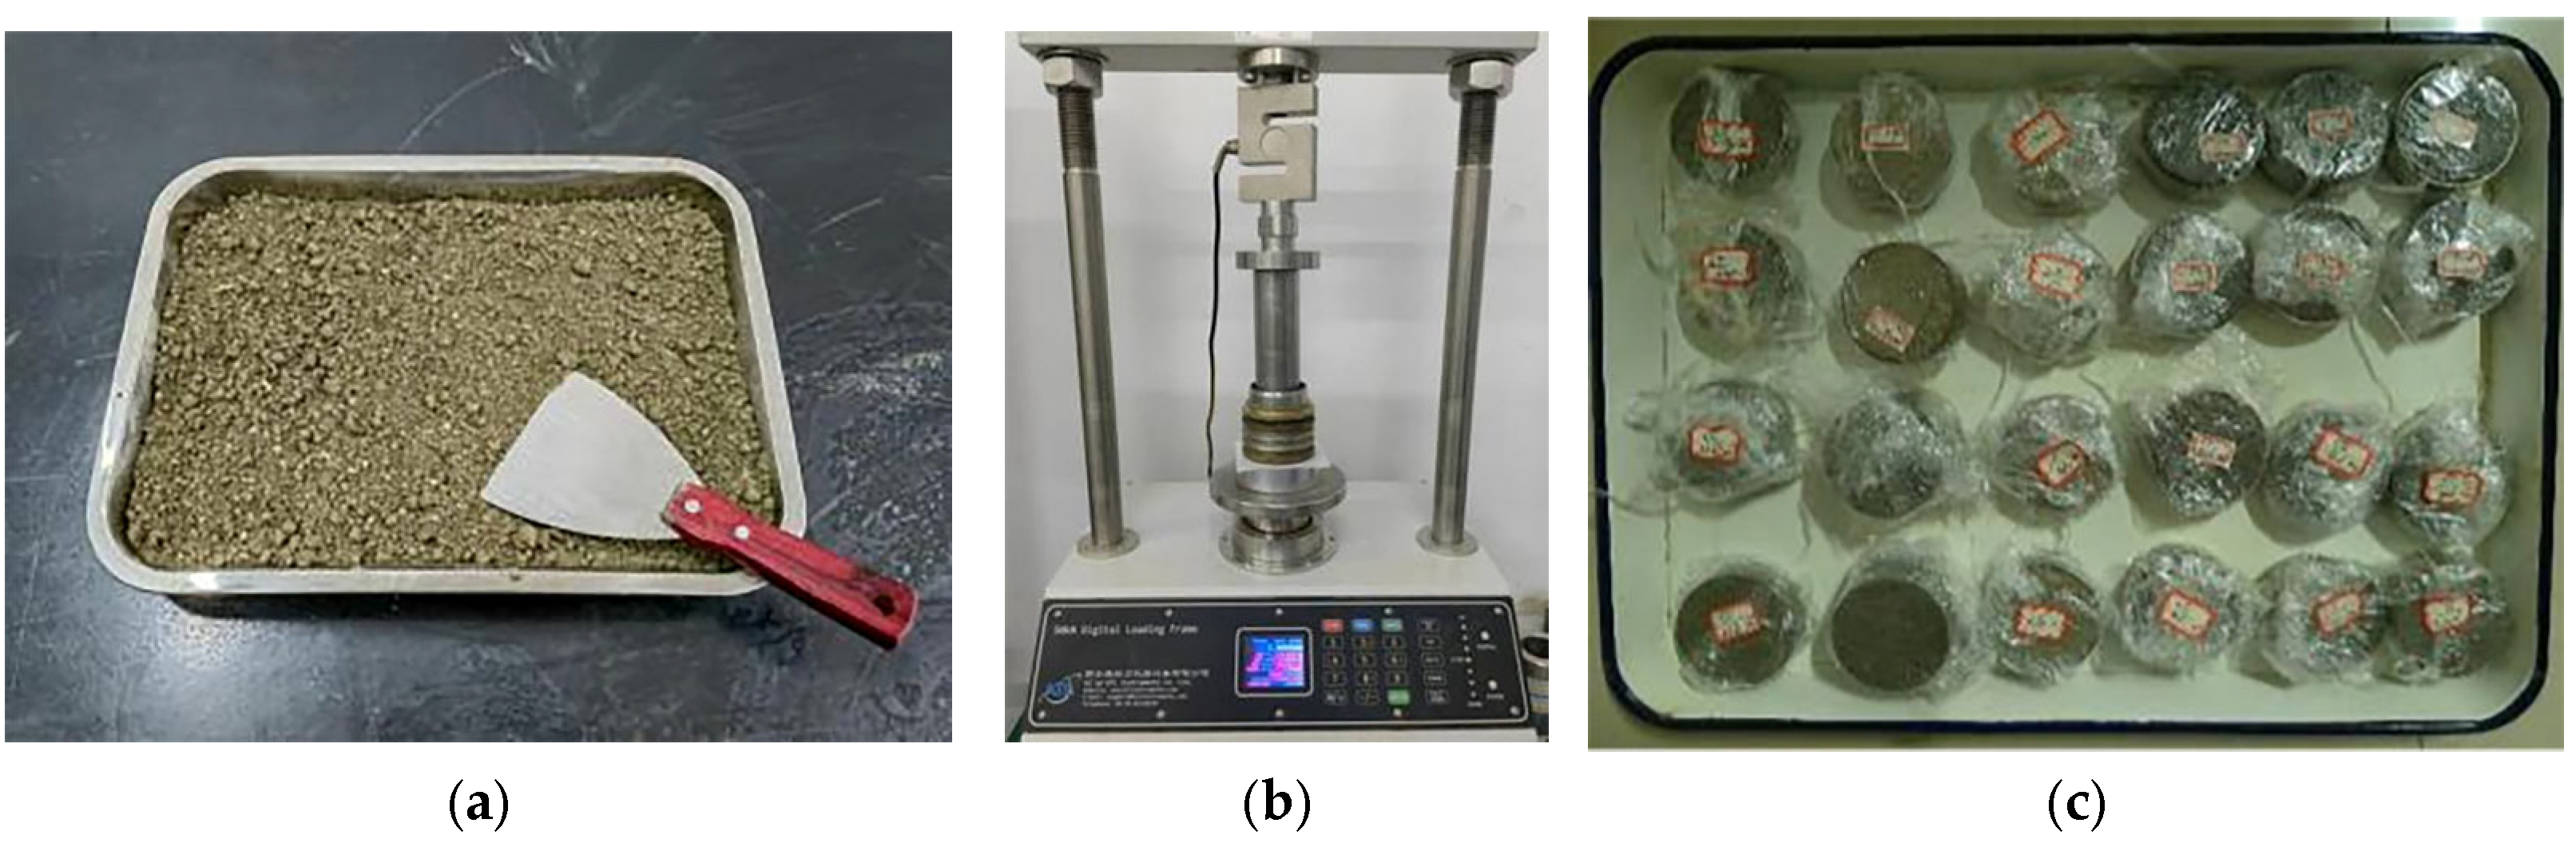
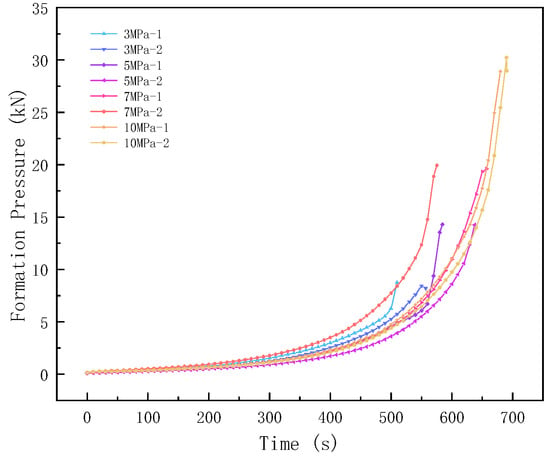
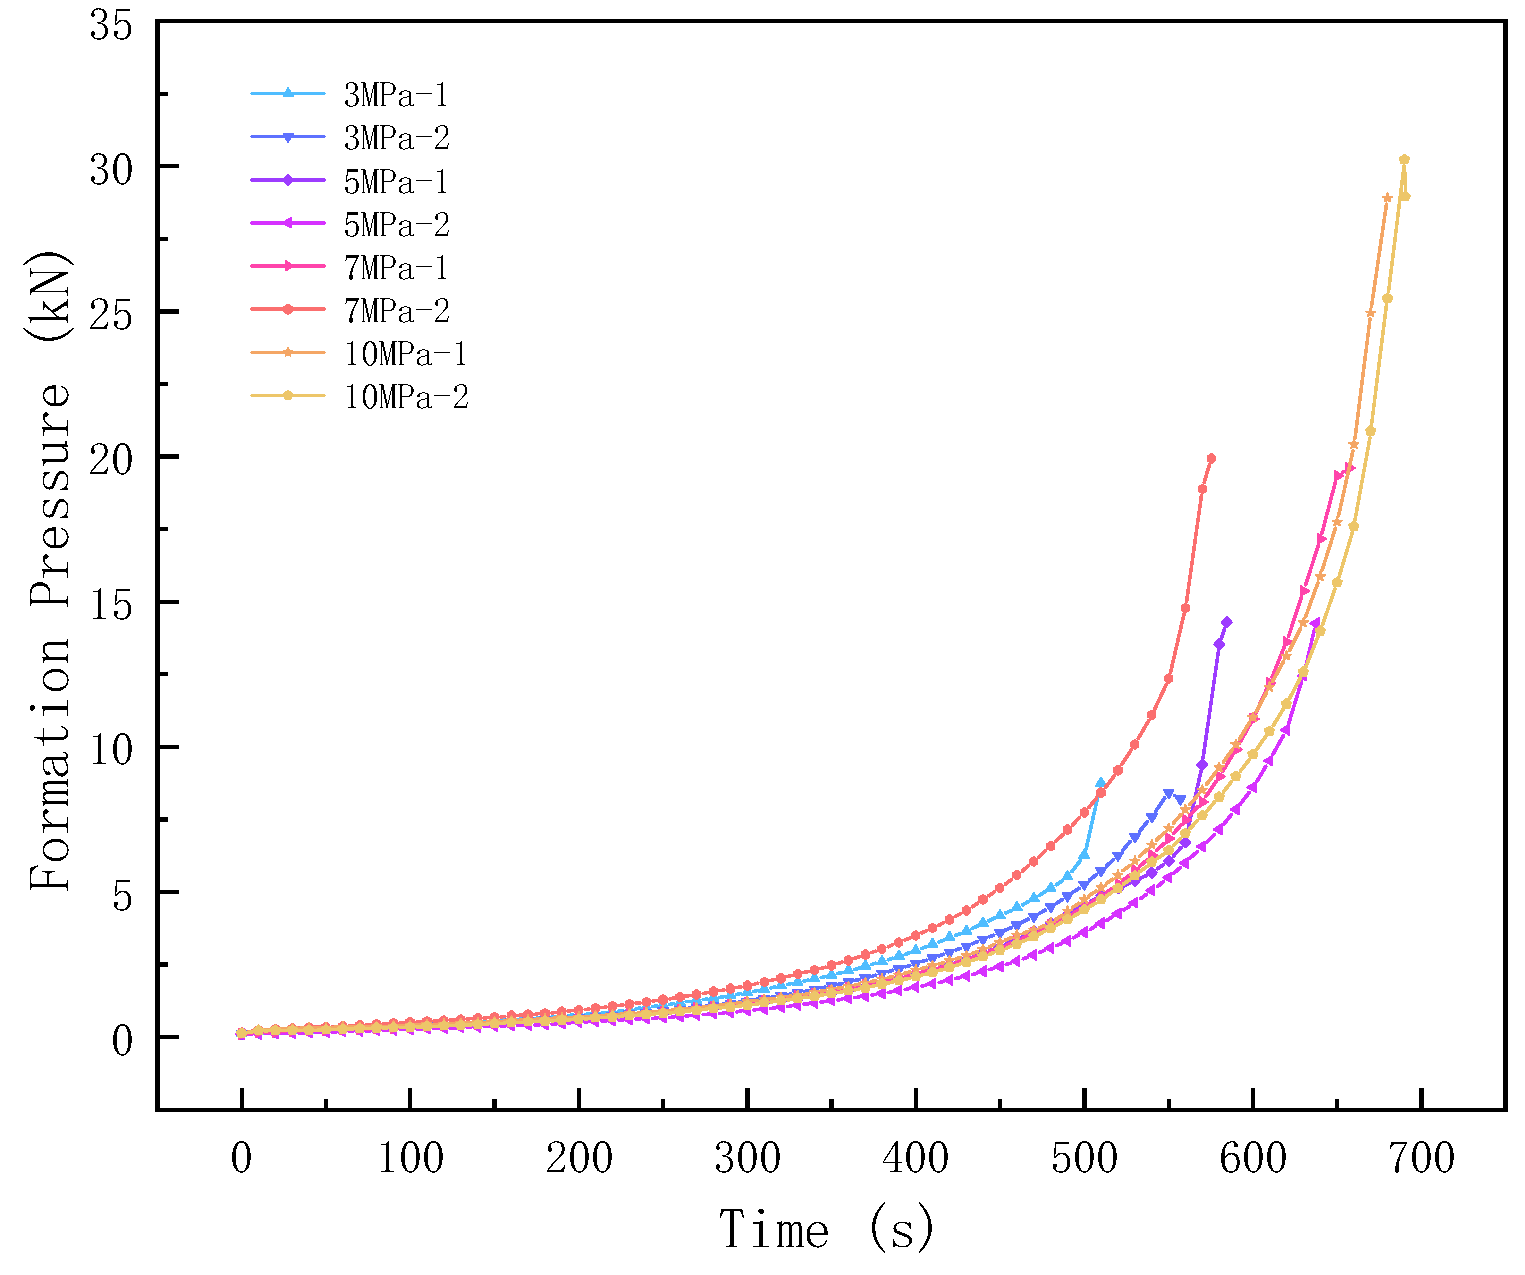
Field-collected clayey material samples were first air-dried, crushed, and sieved. Sample masses were then calculated based on the moisture content and compaction degree specified in the orthogonal test design, combined with the ring mold volume, and prepared accordingly. After thorough mixing, samples were sealed in bags and left to stand for over 24 h to ensure a uniform moisture content. Subsequently, static compression testing was conducted: a thin layer of petroleum jelly was applied to the inner wall of the ring mold to prevent adhesion. The required sample mass was calculated based on the desired compaction degree and loaded into the ring mold, and a tamper was used to achieve preliminary uniformity. The ring mold with the sample was placed onto the static press (Xi’an KTL Instruments Co., Ltd., Xi’an, China) bearing plate, and pressure was applied slowly until the specified ring mold dimensions were reached. A stable pressure and moderate loading rate were maintained throughout to avoid structural damage to the specimen. The pressure was slowly unloaded afterward, the ring mold was removed, and excess material was trimmed from the edges using a soil cutter to align the specimen flush with the ring mold’s perimeter (Figure 3 and Figure 4). To enhance the statistical reliability and reproducibility of the experimental results, triplicate samples were meticulously prepared for each parametric combination (dry density–moisture content or pressure–moisture content) as delineated in the experimental matrix.
Figure 3.
Specimen preparation process. (a) Soil preparation. (b) Sample compression. (c) Samples sealed and left standing.
Figure 4.
Load–displacement curve.
2.3.2. Variable Head Test
The saturated ring knife specimen was installed into the variable-head permeameter (Nanjing Soil Instrument Factory, Nanjing, China). Permeable stones and filter paper were placed at both ends of the specimen to ensure uniform water flow through it. The permeameter was inspected for leaks to ensure no water leakage occurred. The head control device was adjusted to achieve the specified initial head difference. The initial head height and time were recorded, and then timing was started. When the head dropped to a certain level, the head height and time at that point were recorded while the flow volume was measured with a graduated cylinder. The head control device was adjusted to change the head difference, the above steps were repeated, and the flow volume and time at different head differences were measured. At least 3–4 distinct head differences were measured for each specimen. Using the formula , the permeability coefficient was calculated based on the recorded time t (s), initial head h1 (cm), and final head h2 (cm) for each test. The mean values and standard deviations were computed for each triplicate set. To ensure data consistency, any dataset with a coefficient of variation (CV) exceeding 15% was rejected; in such cases, new samples were prepared, and the tests were re-executed to ensure statistical robustness.
2.3.3. SEM Testing
Following the permeability tests, a representative subsample with a volume of approximately 1 cm3 was extracted for microstructural characterization. Observations were conducted using a scanning electron microscope (SEM) (TESCAN, Brno, Czech Republic) equipped with Energy-Dispersive Spectroscopy (EDS), enabling high-resolution imaging and elemental analysis of the clay fabric and pore network. To ensure optimal image quality and electrical conductivity, the samples underwent a standardized preparation sequence, including vacuum drying, evacuation, and gold-sputtering of the sample surface.
3. Test Results and Analysis
3.1. Permeability Coefficient Variation
3.1.1. Permeability Tests of Remolded Mud–Dewatered Samples Under Varied Parameters
This study employed a structured test plan to investigate the impact of three primary factors—moisture content (2–10%), dry density (1.5–2.3 g/cm3), and formation pressure (1–10 MPa)—on the movement of water through remolded mudstones. To make the lab work easier, the pressure values were converted into corresponding axial loads ranging from 3 to 30 kN based on the size of each sample. Table 4 below shows the test setup and results for the measured permeability.
Table 4.
Summary table of remodeling mud permeability tests.
To decouple the confounding effects of multiple variables and quantify the independent influence of each factor on macroscopic hydraulic behavior, a control-variable approach was employed. Pearson’s correlation analysis was performed on the log-transformed permeability (log(k)) data derived from the factorial experimental matrix. The statistical results reveal that at a constant moisture state, dry density and log(k) exhibit a robust negative correlation (r ≈ −0.94, p < 0.01). Conversely, under constant dry density, moisture content is positively correlated with log(k) (r > 0.98, p < 0.01). These metrics rigorously substantiate that dry density is the predominant determinant driving macropore occlusion and the subsequent hydraulic collapse, whereas moisture content primarily modulates the system through lubrication and hydraulic facilitation within the established pore architecture.
3.1.2. Study on Permeability Mechanism Based on Water Content–Dry Density Coupling Effect
Based on the compaction test curve, three to five dry density levels were selected (e.g., , , ). For each dry density, samples with a low water content (left points) and high water content (right points) were prepared. The permeability coefficient (k) was measured for each group of samples. Data were recorded and plotted to establish the “dry density–permeability coefficient” relationship curve, distinguishing low- and high-water-content segments. The test results are shown in Table 5.
Table 5.
Permeability coefficient test table for water content–dry density coupling effect.
3.2. Single-Factor Influence of Density on Permeability Coefficient
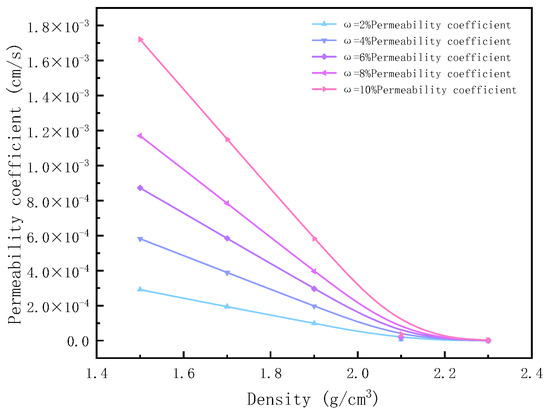
As density increases, the permeability coefficient of mud solids decreases significantly. At a water content of 2%, increasing density from 1.5 g/cm3 to 2.3 g/cm3 caused the permeability coefficient k to decrease from 2.91 × 10⁻⁴ cm/s to 2.69 × 10⁻⁷ cm/s, a reduction of three orders of magnitude (Figure 5). This decrease is attributed to the tighter packing of soil particles at higher densities, which reduces pore volume and connectivity, thereby hindering water flow.
Figure 5.
Effect of density on permeability coefficient of samples.
The rate of change in the permeability coefficient varies at different density levels. At low densities (1.5–1.7 g/cm3), permeability decreases sharply with increasing density. During the low-density stage, the specimen’s pore structure undergoes rapid compression. As a result, there is a significant reduction in the number of interconnected channels. For samples with a 6% moisture content, increasing density from 1.5 g/cm3 to 1.7 g/cm3 reduced the permeability coefficient from 8.72 × 10⁻⁴ cm/s to 5.84 × 10⁻⁴ cm/s (Figure 5). At higher densities (2.1–2.3 g/cm3), the rate of decrease in the permeability coefficient slowed. The reason is that, at this point, the soil has nearly reached its maximum compaction, leaving little room for particle rearrangement; therefore, further increasing the density has only a limited effect on improving the pore structure. When the density of the 6% moisture content sample increased from 2.1 g/cm3 to 2.3 g/cm3, the permeability coefficient decreased from 1.89 × 10⁻⁵ cm/s to 8.07 × 10⁻⁷ cm/s (Figure 5).
3.3. Single-Factor Influence of Moisture Content on Permeability Coefficient
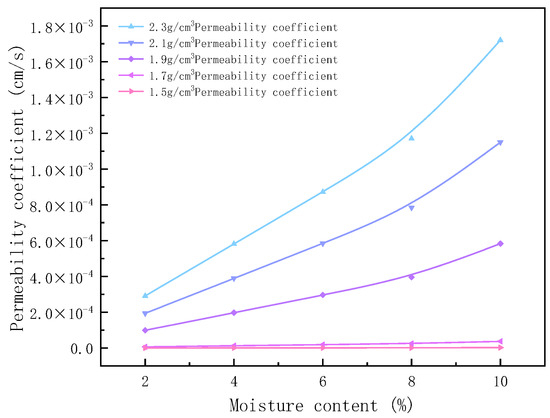
At a fixed density, the permeability coefficient increases as the moisture content increases. At a density of 2.3 g/cm3, increasing the moisture content from 2% to 10% raised the permeability coefficient k from 2.69 × 10⁻⁷ cm/s to 1.59 × 10⁻⁶ cm/s (Figure 6). This occurs because water fills pores and forms continuous flow channels, reducing air resistance and enabling rapid water flow, thereby enhancing the permeability coefficient.
Figure 6.
Effect of water content on sample permeability coefficient.
The variation in the permeability coefficient differs at different moisture contents. At a low moisture content (2–4%), the permeability coefficient shows minimal change with moisture content. At this stage, the specimen as a whole is in an undersaturated state; the newly introduced water can only fill some isolated pores or be adsorbed onto particle surfaces and has not yet formed interconnected channels for the free flow of water. Therefore, the effect on improving permeability is not significant. For samples with a density of 1.9 g/cm3, increasing moisture content from 2% to 4% raised the permeability coefficient from 9.86 × 10⁻⁵ cm/s to 1.97 × 10⁻⁴ cm/s (Figure 6). At a high moisture content (8–10%), the rate of change in the permeability coefficient slows. This is because the specimen has nearly reached saturation at this stage, and water has already formed continuous flow channels; at this point, the marginal contribution of further water addition to connectivity diminishes. For a sample with a density of 2.1 g/cm3, increasing moisture content from 8% to 10% caused the permeability coefficient to rise from 3.96 × 10⁻⁴ cm/s to 5.83 × 10⁻⁴ cm/s (Figure 6).
3.4. Single-Factor Influence of Formation Pressure on Permeability Coefficient
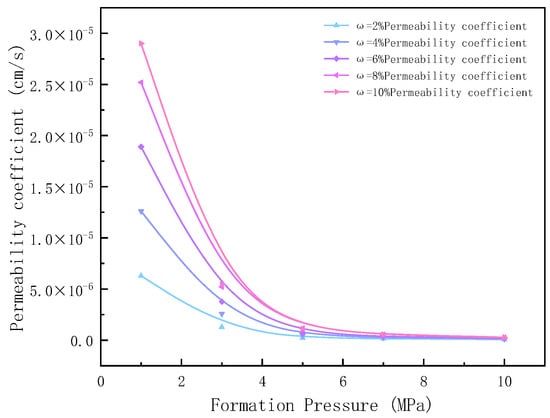
The permeability coefficient decreases as a power function with increasing pressure. As the confining pressure increases, the effective stress acting on the soil skeleton rises, leading to macroscopic soil compaction and a subsequent reduction in the effective flow area. For a sample with 10% moisture content, as the pressure increased from 1 MPa (3 kN) to 10 MPa (30 kN), the permeability coefficient k decreased from 2.90 × 10⁻⁵ cm/s to 2.83 × 10⁻⁷ cm/s.
During the low-pressure stage (1–3 MPa), the permeability coefficient decreased significantly. Due to the initially loose fabric of the soil, the applied pressure is primarily concentrated on large, macroporous structures. The rapid closure of these pores leads to a precipitous decline in permeability. When the pressure increased from 1 MPa to 3 MPa, the permeability coefficient of the 10% moisture content specimen decreased from 2.90 × 10⁻⁵ cm/s to 5.46 × 10⁻⁶ cm/s (Figure 7). In the high-pressure stage (5–10 MPa), the decrease in the permeability coefficient slowed. By this stage, the macropores within the specimen have largely collapsed, leaving a network dominated by isolated micropores. Consequently, further increments in pressure exert a diminishing impact on overall pore connectivity. When the pressure increased from 5 MPa to 10 MPa, the permeability coefficient decreased from 1.10 × 10⁻⁶ cm/s to 2.83 × 10⁻⁷ cm/s (Figure 7).
Figure 7.
Effect of formation pressure on sample permeability coefficient.
3.5. Mechanism of the Effect of Dry Density–Moisture Content Coupling on Permeability Coefficient
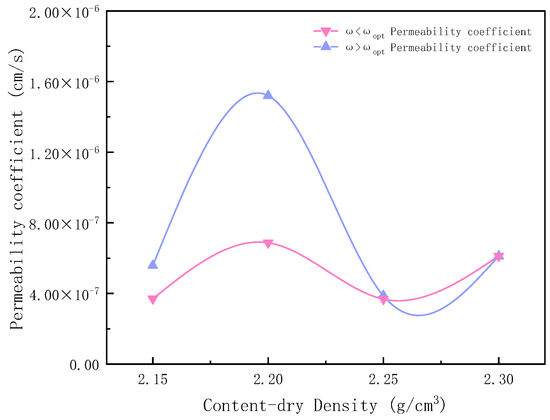
In the low-moisture-content range, the permeability coefficient exhibits an “increase–decrease–increase” fluctuation trend with dry density, peaking at a dry density of 2.20 g/cm3. This is closely related to changes in the pore structure of soil particle arrangement. In the high-moisture-content range, the trend of the permeability coefficient with dry density is similar to that in the low-moisture-content range, both exhibiting a fluctuation pattern of first increasing, then decreasing, and finally increasing again. The peak also occurs near a dry density of 2.20 g/cm3, but the overall values are significantly lower than those in the low-moisture-content range (Figure 8).
Figure 8.
Effect of water content–dry density coupling on permeability coefficient.
3.5.1. Analysis of Influence Mechanisms in the Low-Moisture-Content Range ()
When the moisture content is far below the optimum value, insufficient lubrication between soil particles prevents adequate compaction during impact, resulting in low dry density. The soil contains numerous large interconnected pores, allowing water to permeate easily through these pores, thus yielding a relatively high permeability coefficient. As dry density increases from 2.15 g/cm3 to 2.20 g/cm3, soil particles gradually consolidate, yet the moisture content remains low. Although the pore volume within the sample decreases, connectivity persists, resulting in a peak permeability coefficient. At a dry density of 2.30 g/cm3, the soil reaches its optimum moisture content, enabling more uniform particle alignment and continuous pore distribution. Although the overall pore volume of the soil is minimal at this point, some pores that were partially sealed during the particle orientation process are reconnected, increasing the proportion of interconnected pores.
3.5.2. Analysis of Mechanisms Affecting the High-Moisture-Content Range ()
When moisture content exceeds the optimum value, pores within the soil fill with free water, increasing particle dispersion and reducing pore connectivity. This disrupts the continuity of water permeation pathways, leading to a significant decrease in the permeability coefficient. For instance, at a dry density of 2.15 g/cm3, the permeability coefficient in the high-moisture-content range is lower than that in the low-moisture-content range. As dry density increases from 2.15 g/cm3 to 2.20 g/cm3, soil particles pack more tightly, reducing the pore volume. However, the pore connectivity defects caused by a high moisture content remain fundamentally unresolved. Although the permeability coefficient rises, it remains at a relatively low overall level.
3.5.3. Analysis of the Influence Mechanism of the Optimum Moisture Content ()
When the moisture content approaches the optimum value of 5.8%, the thickness of the surface-bound water film on soil particles is optimal, effectively reducing sliding friction resistance between particles. During compaction, soil particles slide freely and align directionally, forming a dense skeletal structure. At this stage, the internal pore volume of the soil is compressed to a minimum. Large, originally interconnected pores are fragmented by the dense granular skeleton into small, discontinuous pores. Water permeation pathways transform from “continuous channels” to “meandering channels,” causing permeation resistance to increase sharply. Simultaneously, the binding state between soil particles and water at the optimal moisture content is most stable. Water flow within pores is further impeded by the bound water film on particle surfaces, ultimately resulting in a low permeability coefficient (6.12 × 10⁻⁷ cm/s).
4. Microstructural Analysis
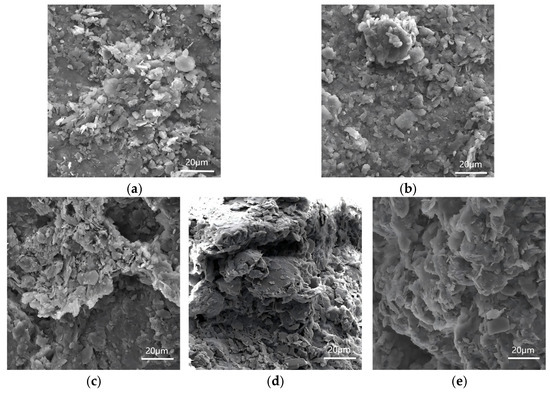
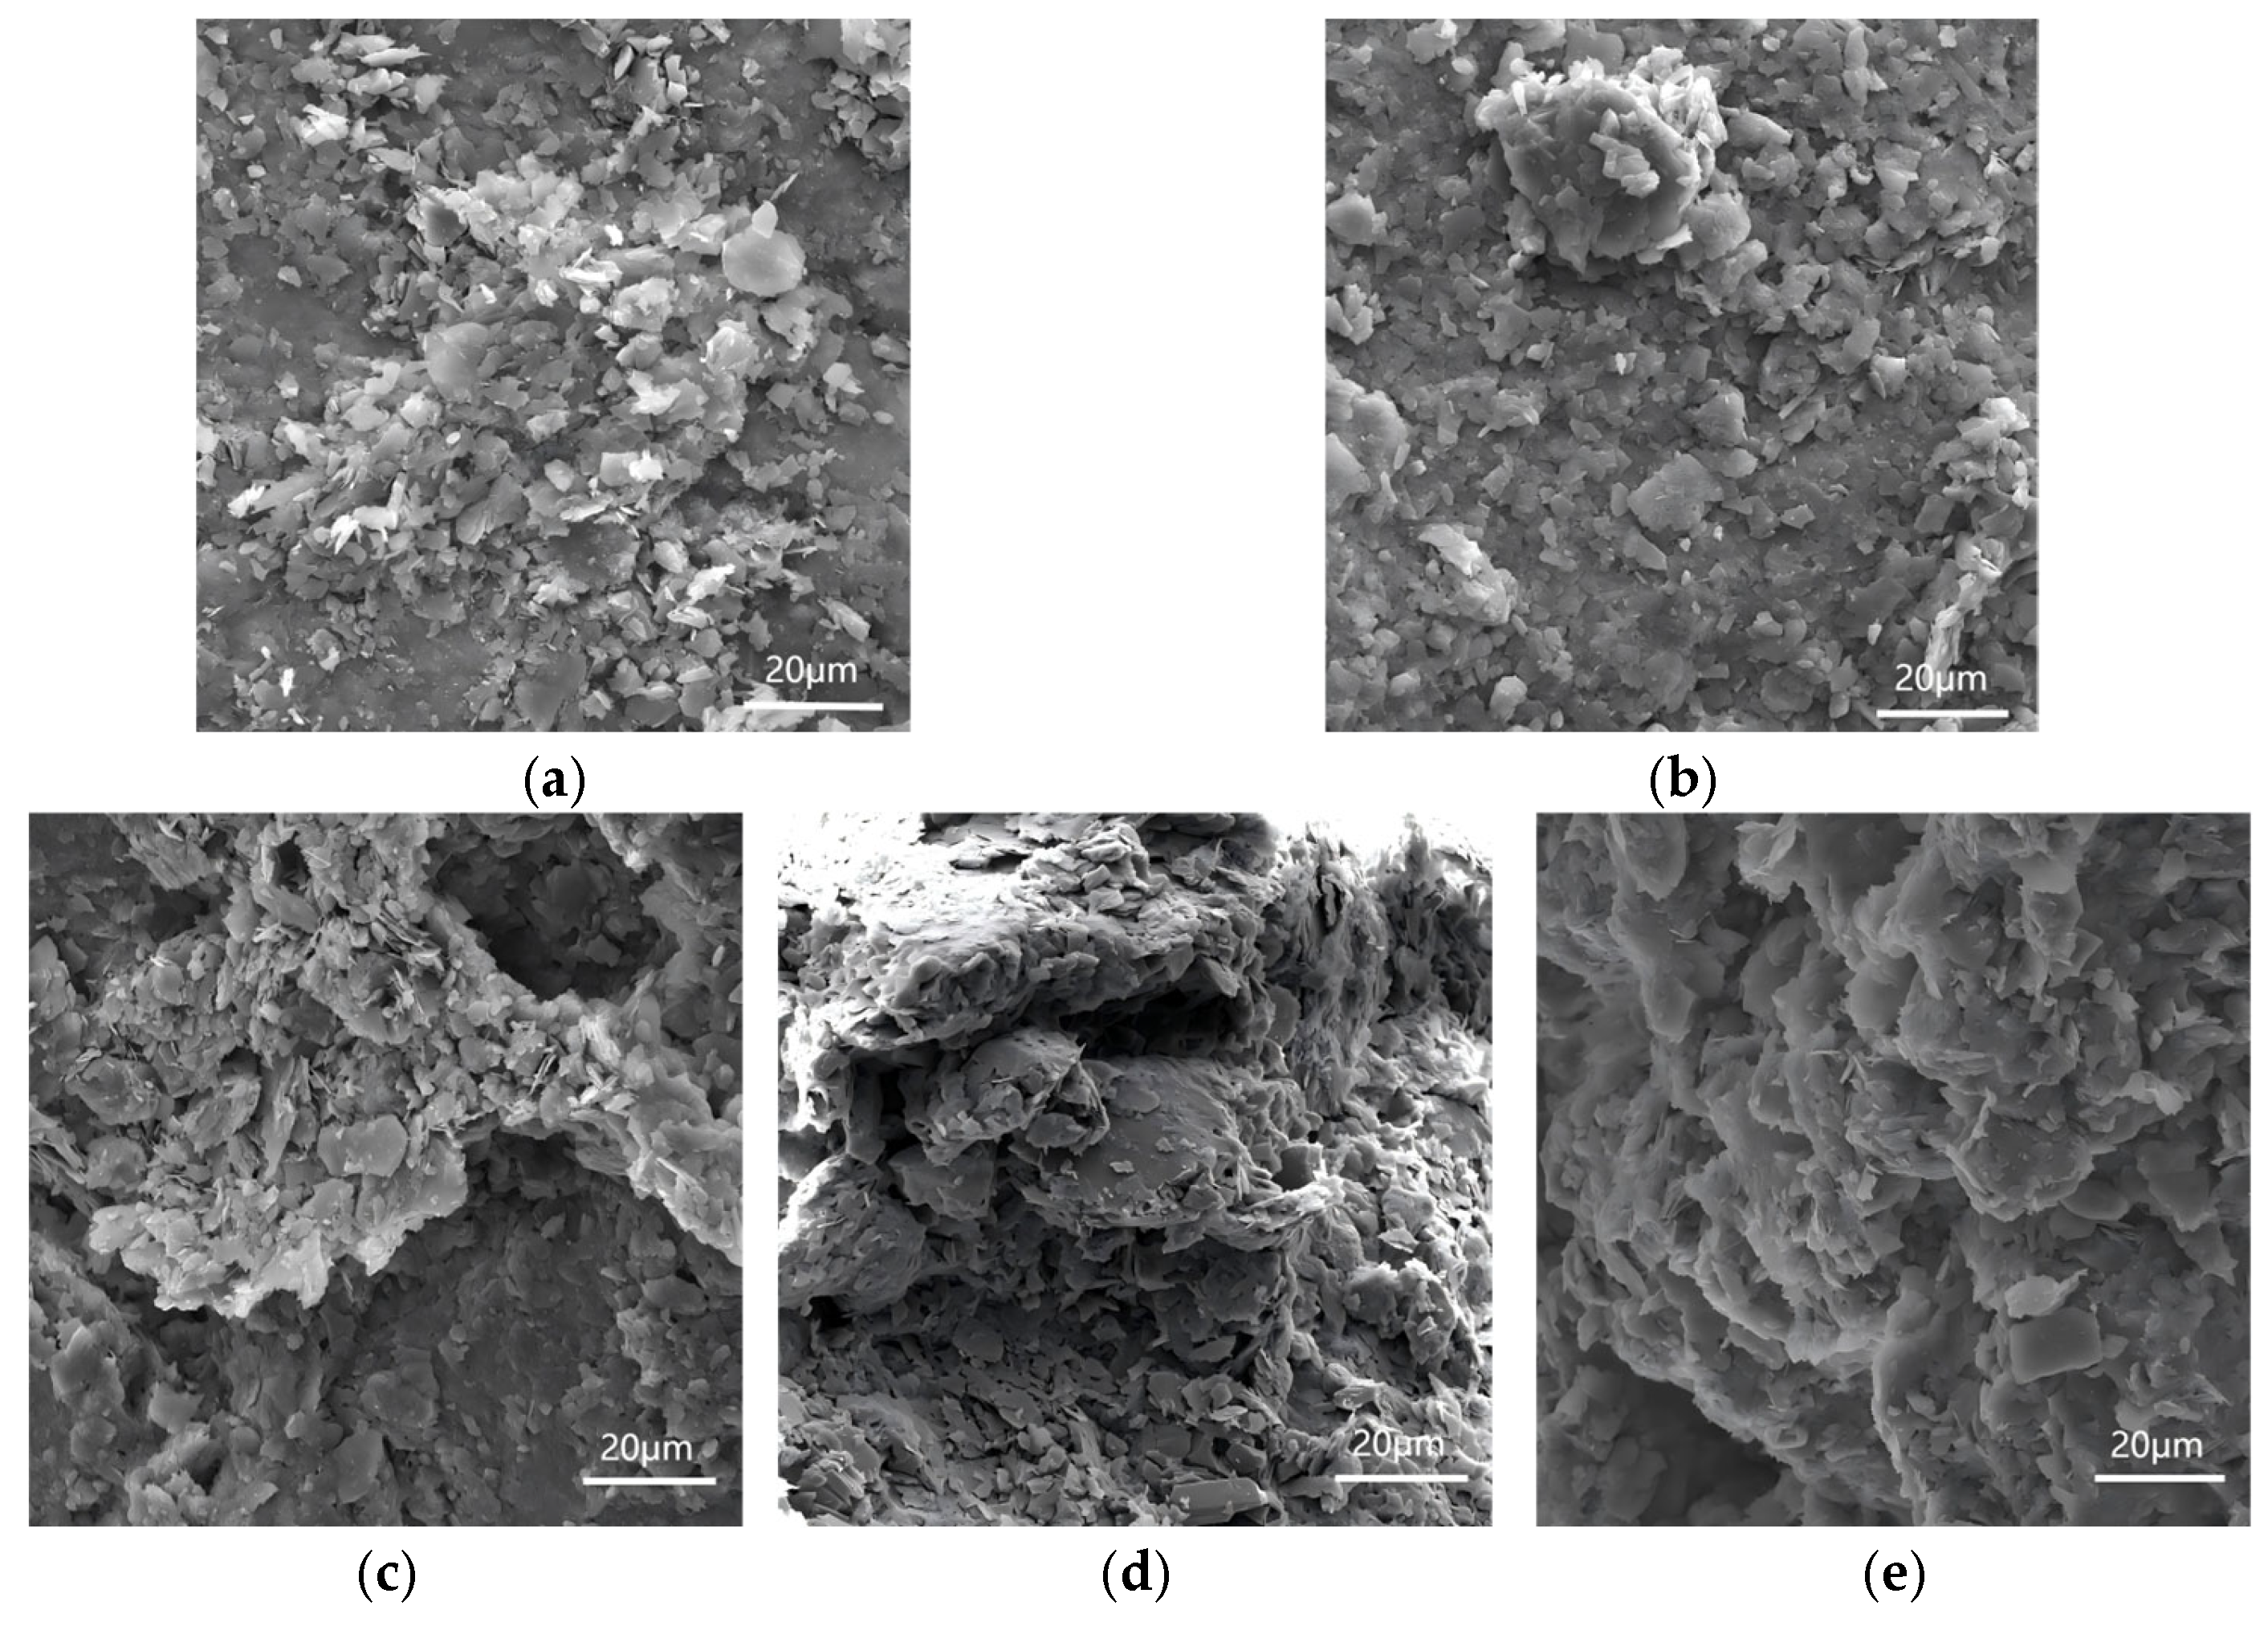
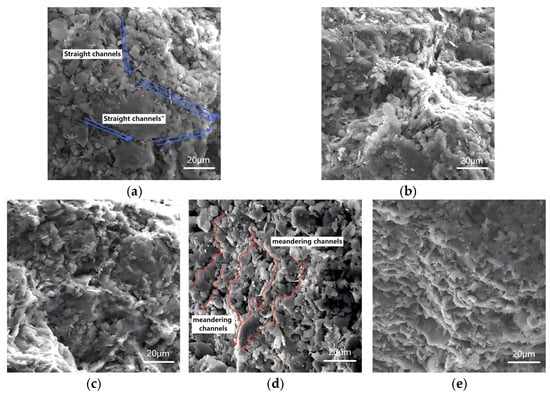
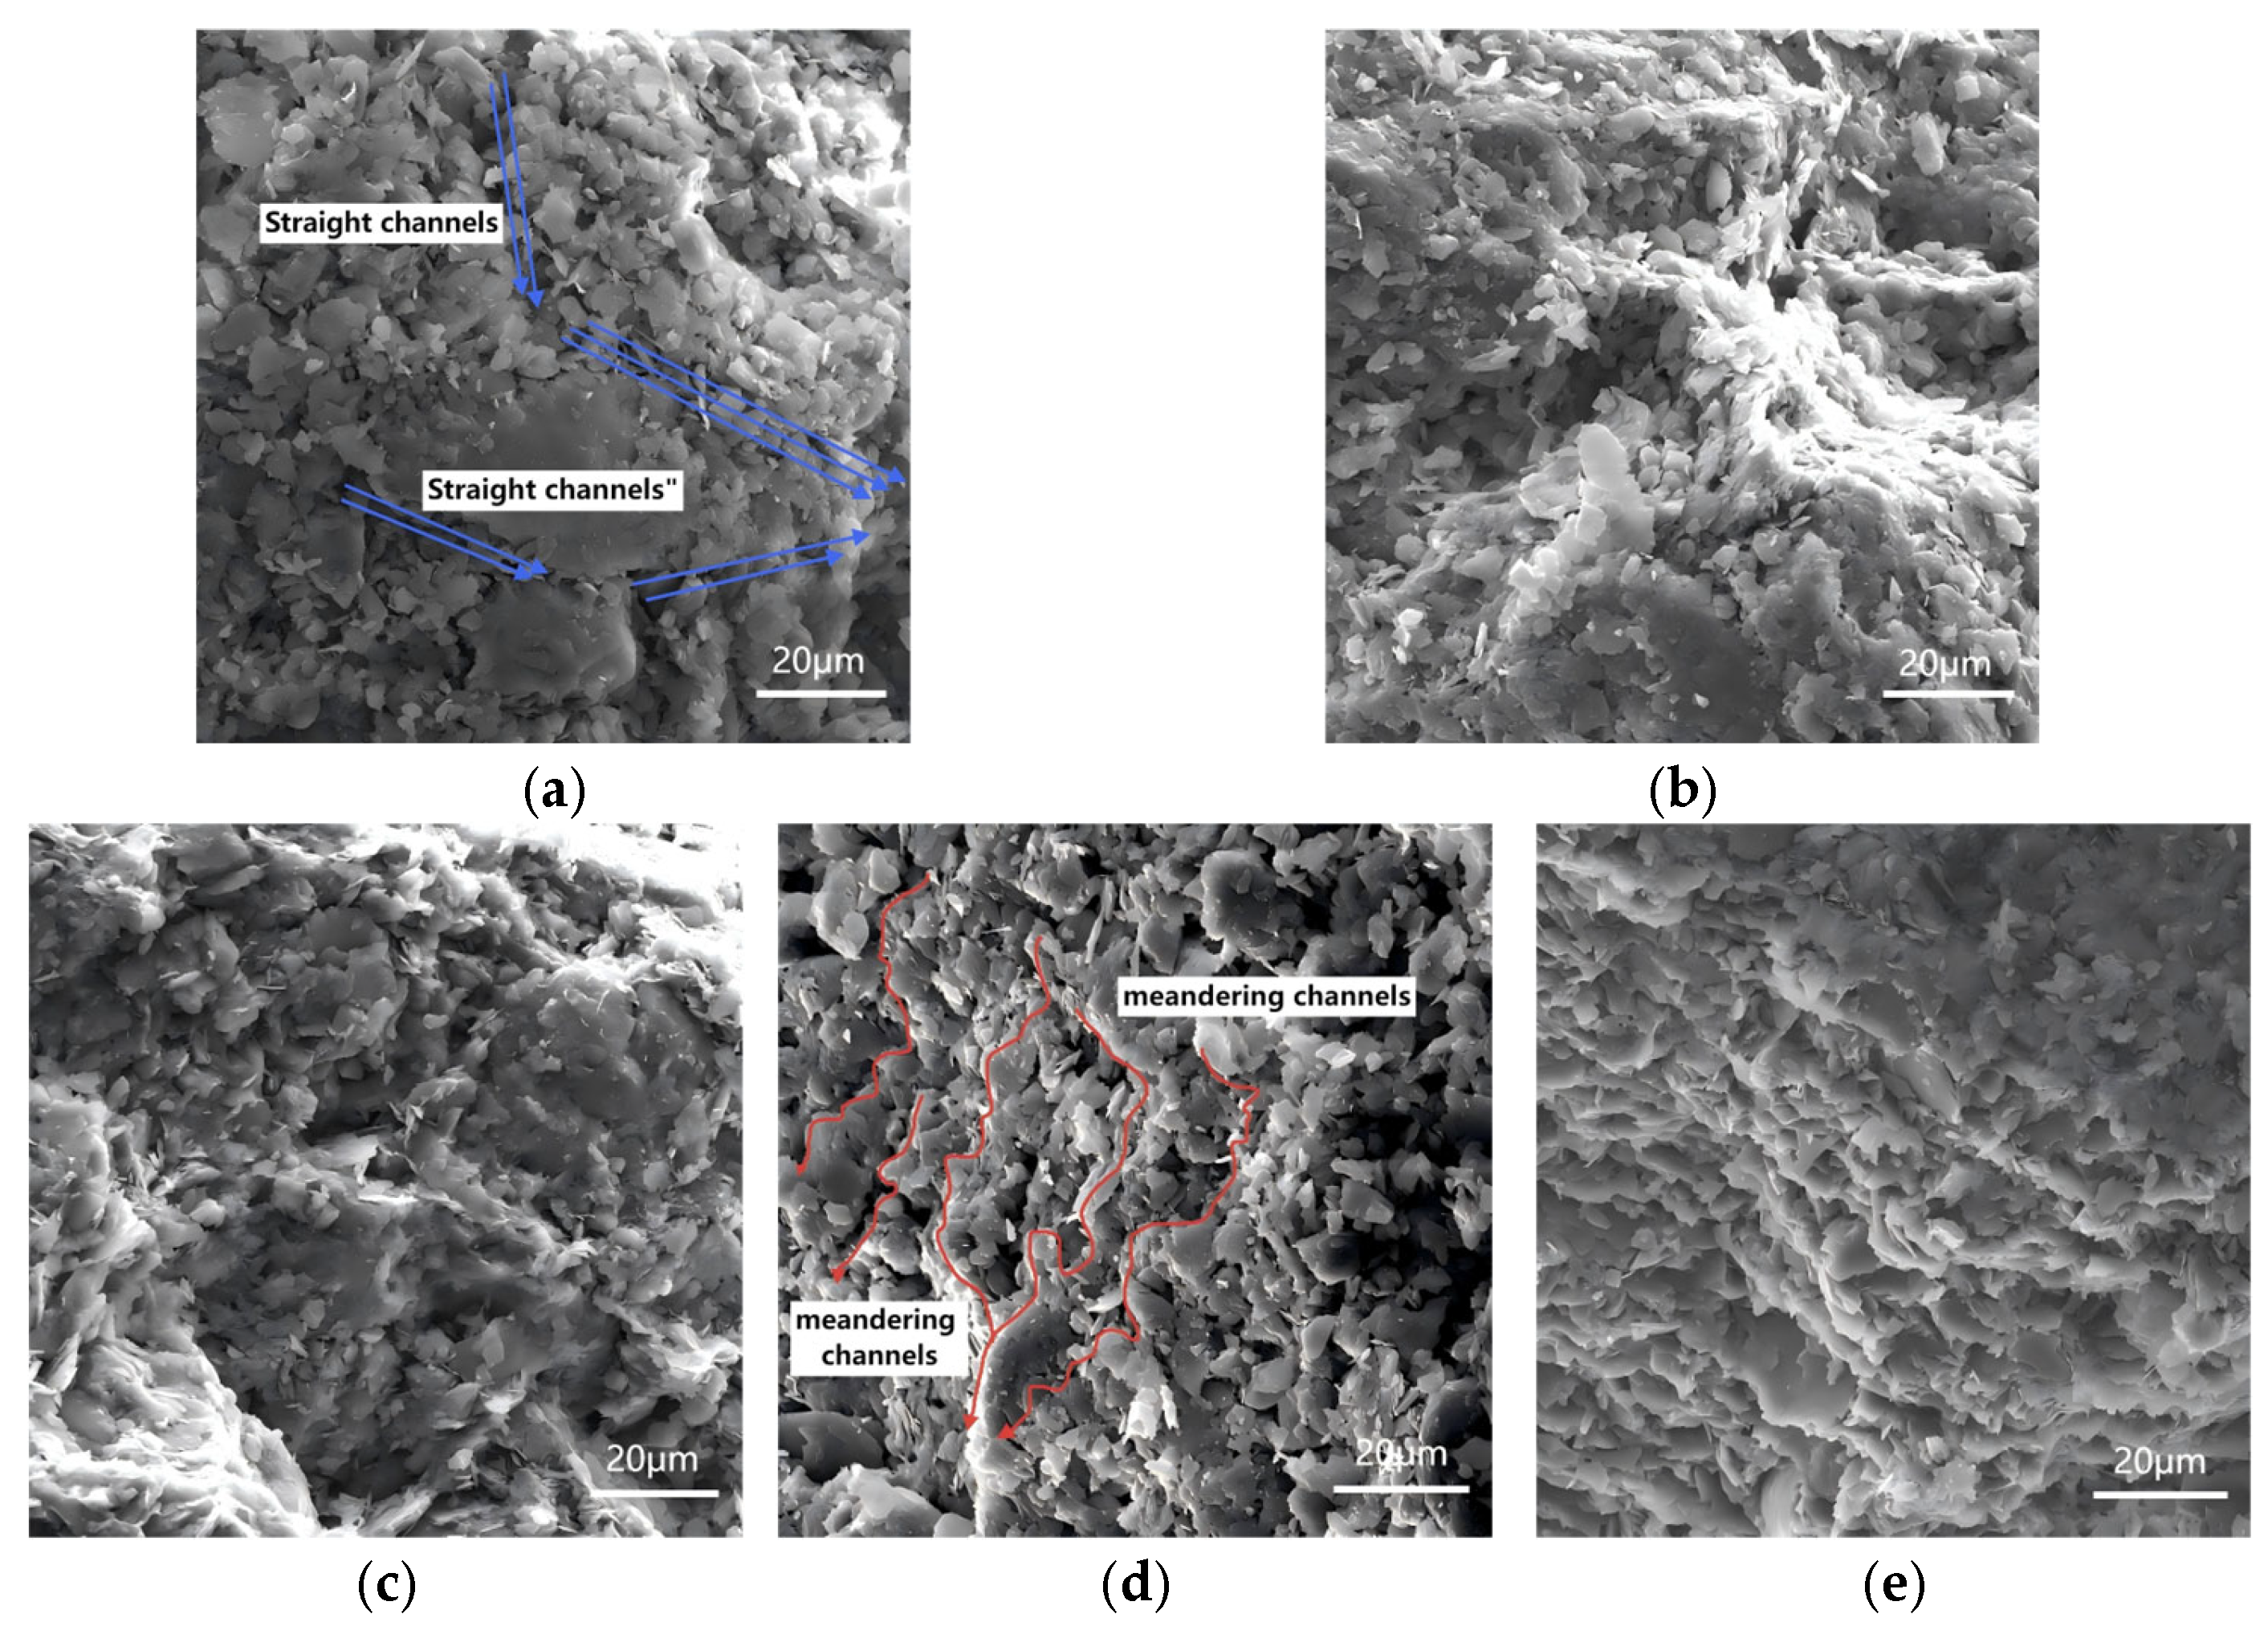
Micro-morphological characterization was conducted using a TESCAN MIRA3 field-emission scanning electron microscope (FE-SEM). Imaging was performed at an accelerating voltage of 20.0 kV and a working distance (WD) of approximately 15 mm. Micrographs were captured using both secondary electron (SE) and backscattered electron (BSE) detectors at a magnification of 2000×. Representative results are presented in Figure 9 and Figure 10.
Figure 9.
SEM images of sample particles. (a) Sample 11-1. (b) Sample 11-2. (c) Sample 13-1. (d) Sample 13-2. (e) Sample 14.
Figure 10.
SEM images of sample pores. (a) Sample 11-1 with “straight channels”. (b) Sample 11-2. (c) Sample 13-1. (d) Sample 13-2 with “meandering channels”. (e) Sample 14.
4.1. Microscopic Particle Morphology Analysis
Micro-morphological characterization via SEM reveals pronounced structural disparities among the remolded clay samples under varying hydration and compaction states. As illustrated in Figure 9, Sample 11-1 (Figure 9a) is characterized by pronounced angularity, where particles interact primarily through point-to-point or edge-to-edge contacts, facilitating robust mechanical interlocking. With an increased moisture content and densification, a morphological shift is observed in Sample 11-2 (Figure 9b); the particles adopt a platey or flaky geometry, undergoing face-to-face stacking to form a dense, laminated fabric. While Sample 13-1 (Figure 9c) exhibits localized flaky aggregation with a notably heterogeneous distribution, Sample 13-2 (Figure 9d) comprises larger, more compact aggregates, resulting in a more homogeneous mineral arrangement. At the peak dry density (Sample 14, Figure 9e), the particles manifest as irregular flakes or clastic lumps in a closely packed assembly, ultimately forming a stable, interlocking mineral skeleton.
4.2. Micropore Morphology and Connectivity Analysis
The evolution of pore topology and connectivity is intrinsically linked to particle morphology, directly governing the material’s macroscopic permeability. As illustrated in Figure 10, the internal void space in Sample 11-1 (Figure 10a) is dominated by irregular interfacial pores concentrated at coarse-grain contacts, establishing a highly interconnected pore network. In contrast, Sample 11-2 (Figure 10b) displays predominantly slit-like or flattened pores, primarily localized at the interfaces of lamellar particles and within aggregates, leading to the formation of discrete, isolated pore domains.
While Sample 13-1 (Figure 10c) exhibits a heterogeneous pore geometry that maintains a networked architecture, Sample 13-2 (Figure 10d) reflects a transition toward sub-spherical or ellipsoidal micropores that progressively become occluded or semi-occluded. At the maximum dry density (Sample 14, Figure 10e), the specimen exhibits a micro-to-mesoporous distribution with a scarcity of macropores, resulting in a complex matrix of sequestered voids and localized, interconnected channels.
4.3. Analysis of Micro-Mechanisms Affecting Permeability Coefficient
4.3.1. Mechanism of Soil Particle Characteristics Affecting Permeability Coefficient
At a low moisture content, soil particles predominantly exhibit an angular morphology, resulting in strong mechanical interlocking between particles and high structural stability of the soil. This minimizes pore deformation during water transport. Simultaneously, at a low moisture content, particles exhibit greater dispersion with fewer aggregates. The “spaced structure” formed by uneven particle distribution provides a smooth transmission pathway for water. Additionally, angular particles have relatively smaller specific surface areas and weaker water adsorption, further reducing permeation resistance. This ultimately results in a larger and more stable permeability coefficient.
At a high moisture content, soil particles stack in a lamellar form, increasing sliding resistance between particles. Simultaneously, high moisture triggers particle aggregation, with numerous aggregates filling pore spaces and disrupting the continuity of permeation pathways. Furthermore, increased plasticity at a high moisture content facilitates particle rearrangement and pore deformation during water transport, diminishing the permeability coefficient. The larger specific surface area of lamellar particles adsorbs more free water, further increasing transport resistance and ultimately resulting in a significant reduction in permeability coefficient.
4.3.2. Mechanism of Pore Structure Influence on Permeability Coefficient
At lower moisture regimes, SEM characterization reveals an abundance of macropores within the mineral matrix. Correlating these observations with the measured high hydraulic conductivity, it can be deduced that these large-scale void structures constitute highly connected three-dimensional networks. These networks function as preferential seepage conduits, or “dominant pathways,” which facilitate efficient fluid transport through the material. Simultaneously, the higher porosity at a low moisture content provides a larger effective cross-sectional area for water passage, reducing flow resistance during transport. These factors collectively promote an increase in the permeability coefficient.
Samples with a high water content exhibit a significant reduction in macropores, with pores predominantly appearing as micro-sized and closed forms. Connectivity decreases substantially, transforming water permeation pathways from “straight channels” (Figure 10a) to “meandering channels,” (Figure 10d) markedly increasing transport distance and resistance. Furthermore, soil porosity decreases at high water content, reducing the effective permeable cross-section and further impeding rapid water transport, ultimately leading to a significant decrease in permeability coefficient.
4.3.3. Elucidating the “Moisture–Fabric–Permeability” Coupling Mechanism
Integrating the micro-morphological and pore network analyses demonstrates that the moisture content fundamentally reconfigures the internal fabric and hydraulic conduits of clay minerals. This clarifies the intrinsic ‘moisture–fabric–permeability’ nexus and establishes a robust multi-scale evolutionary framework for clay minerals. The primary evolutionary pathways are systematically summarized in Table 6.
Table 6.
“Moisture–fabric–permeability” coupling mechanism.
4.3.4. Micro-Morphological Mechanisms of Stress-Driven Hydraulic Attenuation
Variable-head permeability tests demonstrate that the formation pressure is the predominant determinant driving a power-law attenuation of the permeability coefficient. Mechanistically, this behavior is rooted in the multi-stage mechanical compression of the pore structure. During the low-pressure regime (1–3 MPa), the clay-rich matrix undergoes significant elastoplastic deformation. The macropores, interconnected micro-fractures, and high-aspect-ratio voids undergo preferential closure, triggering a sharp contraction of the total pore volume. Consequently, the primary macroscopic flow channels are extensively obstructed, resulting in a precipitous order-of-magnitude reduction in hydraulic conductivity.
As the stress escalates into the high-pressure regime (5–10 MPa), the platy clay particles experience intense inter-granular sliding, rearrangement, and preferential orientation. The residual fine-pore network is physically segmented, transitioning into a series of occluded, isolated micropores. At this stage, the microstructural density approaches its asymptotic limit, and the effective pore connectivity nears zero. Fluid migration is restricted to extremely tortuous paths through sub-microscopic capillaries or along the adsorbed water films, governed by immense viscous drag. Macroscopically, this manifests as a stabilizing trend in the permeability coefficient, which ultimately plateaus at a residual threshold of 10−8~10−7 cm/s.
5. Conclusions
Integrating macro-scale laboratory testing with high-resolution micro-characterization, this research systematically evaluated the independent and synergistic effects of hydration state, dry density, and confining stress on the hydraulic conductivity (k) of remolded clay. By decoupling the influence of individual variables—such as preparation-induced pressure—and analyzing the coupled interplay between density and moisture, this study unraveled the fundamental mechanistic drivers governing fluid transport. These findings, interpreted through the dual lenses of mineral fabric evolution and pore network topology, lead to the following primary conclusions:
- (1)
- Influence patterns of individual factors on permeability coefficient.
- (a)
- Permeability decreases significantly with increasing density, with pronounced differences across distinct dry density ranges. At low densities (1.5–1.7 g/cm3), rapid pore structure compression causes permeability to drop by an order of magnitude. At high densities (2.1–2.3 g/cm3), approaching the maximum density, limited pore structure improvement results in a gradual and stabilizing decrease in permeability.
- (b)
- Under fixed-density conditions, the permeability coefficient increases with rising moisture content, with varying magnitudes across different moisture content ranges. At a low moisture content (2–4%), samples remain unsaturated, with water filling only isolated pores, resulting in minor permeability changes. At a high moisture content (8–10%), samples approach saturation, forming continuous flow pathways that significantly enhance permeability.
- (c)
- The permeability coefficient decreases exponentially with increasing formation pressure. At low pressures (1–3 MPa), large pores in the specimen are rapidly compressed, leading to a substantial decrease in permeability. At high pressures (5–10 MPa), pores predominantly become isolated small voids, and further compression has a diminished effect on pore connectivity, resulting in a slight decrease in permeability.
- (2)
- Mechanism of influence of dry density–moisture content coupling on permeability coefficient.
- (a)
- In both the low-moisture-content range (ω < ωopt) and the high-moisture-content range (ω > ωopt), the permeability coefficient exhibits an oscillating trend of “rise–fall–rise” with changes in dry density. The peak occurs near a dry density of 2.20 g/cm3, but the permeability coefficient in the high-moisture-content range is significantly lower overall than in the low-moisture-content range.
- (b)
- In the low-moisture-content range (ω < ωopt), insufficient lubrication between soil particles results in numerous large interconnected pores at lower dry densities, leading to higher permeability coefficients. As the dry density increases to 2.20 g/cm3, particles consolidate while maintaining pore connectivity, resulting in a peak permeability coefficient. At the maximum dry density of 2.30 g/cm3 (optimal moisture content of 5.8%), particles arrange directionally to form a dense framework, segmenting pores into isolated closed voids. The permeability coefficient first decreases and then increases, but it remains at a relatively low overall level.
- (c)
- In the high-moisture-content range (ω > ωopt), excessively thick surface-bound water films on soil particles enhance dispersion, fragmenting interconnected pores into isolated ones and significantly reducing permeability. As the dry density increases, particle packing becomes denser, yet the pore connectivity defects caused by the high moisture content remain fundamentally unresolved. Permeability rises but remains at a low level.
- (d)
- At the optimal moisture content (ω = ωopt), the thickness of the bound water film on soil particles is moderate. Particles are arranged in an oriented manner to form a dense skeleton, minimizing pore volume and reducing connectivity. The permeability coefficient reaches a relative minimum value (6.12 × 10⁻⁷ cm/s), reflecting the optimal coupling effect between dry density and moisture content.
- (3)
- Control mechanism of microstructure on permeability coefficient.
- (a)
- At a low moisture content, particles exhibit angular shapes with predominant point and line contacts, resulting in strong mechanical interlocking and good particle dispersion. This provides smooth pathways for water transport, leading to a higher permeability coefficient. At a high moisture content, particles stack in flake-like forms with pronounced agglomeration effects, filling pore spaces and disrupting the continuity of permeation pathways. Additionally, the large specific surface area of flake-like particles adsorbs more free water, increasing transport resistance and significantly reducing the permeability coefficient.
- (b)
- Samples with a low moisture content exhibit more extensive 2D pore areas, providing a significant morphological proxy for a higher probability of percolating 3D pore networks. These expanded 2D voids suggest a more open spatial architecture, which fundamentally facilitates the formation of interconnected 3D hydraulic conduits. High-water-content samples exhibit significantly fewer large pores, predominantly featuring small, closed pores with poor connectivity. Water permeation follows tortuous paths through small effective permeation cross-sections, leading to markedly reduced permeability coefficients.
This study reveals the multi-factor coupled influence mechanism governing the permeability of remolded muddy materials, providing a theoretical basis for preventing water and mud outburst disasters in deep-buried tunnels and other underground engineering projects. In engineering design and construction, predictive models can be developed using key parameters of muddy materials to provide early warnings of geological hazards, ensuring the safe and stable operation of projects.
- (4)
- Comparison with existing research.
The findings of this study are consistent with existing research by numerous scholars in this field. At the same time, under the coupled effects of multiple factors, they reveal the unique patterns of permeability evolution in remolded clay.
- (1)
- The experimental results from this study reveal that the hydraulic conductivity of remolded clay undergoes a precipitous decline as the dry density increases and pore spaces are rapidly compressed. These observations exhibit strong agreement with the findings of Zeng [5] regarding compacted clay, collectively corroborating that the void ratio (or density) serves as the primary governing parameter for macroscopic hydraulic performance. Furthermore, the non-linear attenuation of the permeability coefficient observed herein provides empirical support for the complex, non-linear relationship between pore-scale topology and macroscopic transport properties, as posited by Lv [7].
- (2)
- The experimental results demonstrate that under mechanical compaction, the interconnected pore networks within the clay-rich zones undergo segmentation, transitioning into a series of occluded, isolated voids. This structural transformation triggers a precipitous decline in the permeability coefficient, which subsequently stabilizes at a low residual threshold. These observations strongly corroborate the conclusions of Yu [15], who posited that in high-water-content porous media subjected to elevated confining pressures, the high compressibility and increased solubility of interstitial fluids significantly modulate the material’s bulk density, ultimately resulting in extremely low hydraulic conductivity.
- (3)
- Micro-morphological analysis via SEM elucidates that the connectivity of the macroporous network within clay minerals facilitates the formation of preferential flow paths, thereby dictating the material’s overall hydraulic conductivity. These findings align closely with the conclusions of He [9], who asserted that a highly interconnected pore network is the fundamental driver of fluid transport efficiency. Furthermore, this study provides empirical substantiation for the conceptual framework established by Ortiz-Marqués [8], reinforcing the principle that effective/connected porosity is a more direct determinant of internal transport characteristics than total porosity.
- (4)
- The present study elucidates that the precipitous shift in the macroscopic permeability of mud-like materials is driven by a fundamental microscopic fabric transition, shifting from a dispersed, angular state to an aggregated, lamellar stacking arrangement. This finding substantively extends and refines the theoretical framework established by Feng [25] and Bowen [27]—which attributes the diverse responses of soil under loading to microstructural disparities—by operationalizing these concepts to analyze the cross-scale hydraulic evolution of mud-bearing strata in deep-buried tunnel environments.
- (5)
- Research prospects and future directions.
This study establishes a theoretical framework for mitigating water and mud inrush in deep-buried tunnels. Future research should prioritize the following frontiers:
- (1)
- Develop machine learning architectures leveraging the SEM dataset to automate the mapping of micropore topologies to macroscopic hydraulic parameters, enhancing characterization precision.
- (2)
- Execute fluid–structure interaction simulations in COMSOL Multiphysics (version 6.1), benchmarked against this study’s empirical data, to replicate the spatiotemporal evolution of catastrophic inrush events.
- (3)
- Investigate microstructural degradation and seepage instability under hydro-mechanical–chemical coupling, specifically incorporating excavation-induced cyclic loads and groundwater-driven chemical erosion.
Author Contributions
Conceptualization, H.H.; Methodology, S.S. and W.Y.; Validation, S.S. and W.Y.; Formal analysis, S.S.; Writing—original draft, S.S.; Project administration, H.S. All authors have read and agreed to the published version of the manuscript.
Funding
This research received no external funding.
Institutional Review Board Statement
Not applicable.
Informed Consent Statement
Not applicable.
Data Availability Statement
The data presented in this study are available on request from the corresponding author due to privacy.
Conflicts of Interest
Author Huatang Shi was employed by the ChangJiang Survey, Planning, Design and Research Co., Ltd. The remaining authors declare that the research was conducted in the absence of any commercial or financial relationships that could be construed as a potential conflict of interest.
References
- Li, L. Mechanism and Application Research on Sudden Water Inflow Disaster Evolution in High-Risk Karst Tunnels. Ph.D. Thesis, Shandong University, Jinan, China, 2009. [Google Scholar]
- Li, S.; Wang, K.; Li, L.; Zhou, Z.; Shi, S.; Liu, S. Formation Mechanism and Development Trends of Sudden Water Inflow Disasters in Karst Tunnels. Acta Mech. Sin. 2017, 49, 22–30. [Google Scholar]
- Qian, Q. Challenges and Countermeasures for Underground Engineering Construction Safety. J. Rock Mech. Eng. 2012, 31, 1945–1956. [Google Scholar]
- Liu, S. Mechanism of Coal Mine Floor Water Inrush and Dynamic Detection Technology for Fracture Zone Evolution. Ph.D. Thesis, China University of Mining and Technology, Xuzhou, China, 2008. [Google Scholar]
- Zeng, L.; Hong, Z.; Liu, S.; Chen, F. Variation law and quantitative evaluation of secondary consolidation behavior for remolded clays. J. Geotech. Eng. 2012, 34, 1496–1500. [Google Scholar]
- Liang, J.; Fang, Y. Experimental Study of Seepage Characteristics of Tiny-Particle Clay. J. Rock Mech. Eng. 2010, 29, 1222–1230. [Google Scholar]
- Lv, H.; Xiong, Z.; Li, H.; Liu, J.; Xu, G.; Chen, H. Investigating the Mechanical Properties and Water Permeability of Recycled Pervious Concrete Using Three Typical Gradation Schemes. Buildings 2025, 15, 358. [Google Scholar] [CrossRef] [Scilit]
- Ortiz-Marqués, A.; Caldevilla, P.; Goldmann, E.; Safuta, M.; Fernández-Raga, M.; Górski, M. Porosity and Permeability in Construction Materials as Key Parameters for Their Durability and Performance: A Review. Buildings 2025, 15, 3422. [Google Scholar] [CrossRef] [Scilit]
- He, J.; Xu, S.; Sang, G.; Wu, Y.; Liu, S. Enhancing the Mechanical Properties and Water Permeability of Pervious Planting Concrete: A Study on Additives and Plant Growth. Materials 2024, 17, 2301. [Google Scholar] [CrossRef] [Scilit]
- Deng, C.; Li, L.; Wang, X.; Tan, Y.; Zhou, Y.; Xu, Z.; Zhang, D.; Yan, W. Fluidity and Strength Characteristics of Grouts Utilizing Waste Glass Powder as Cementitious Substitute: Effects of Content and Alkaline Activator. Waste Biomass Valorization 2026, in press. [Google Scholar] [CrossRef] [Scilit]
- Zhagifarov, A.M.; Akhmetov, D.A.; Suleyev, D.K.; Zhumadilova, Z.O.; Begentayev, M.M.; Pukharenko, Y.V. Investigation of Hydrophysical Properties and Corrosion Resistance of Modified Self-Compacting Concretes. Materials 2024, 17, 2605. [Google Scholar] [CrossRef] [Scilit]
- Liang, C.; Zhao, P.; Liu, L.; Wang, S.; Wang, S.; Sobolev, K.; Lu, L. Fabrication of bulk hydrophobic cement-based materials with ultra-high impermeability. J. Build. Eng. 2023, 63, 105492. [Google Scholar] [CrossRef] [Scilit]
- Tkach, E.; Serova, R.; Stasilovich, E.; Imanov, Y.; Bogoyavlenskaya, T. Modified Aerated Concrete Based on Man-Made Waste. Int. J. GEOMATE 2022, 23, 131–138. [Google Scholar] [CrossRef] [Scilit]
- Wang, L.; Tian, X.; Pan, Y.; Wu, D.; Xu, S.; Wang, H.; Tian, X.; Xu, Y.; Guo, H.; Zou, M. The Properties of Self-Compacting Ultra-High Performance Concrete with Different Types of Mineral Admixtures. Coatings 2025, 15, 591. [Google Scholar] [CrossRef] [Scilit]
- Yu, J.; Mao, Z.; Zhou, J.; Yu, Z.; Liu, X.; Gong, X. Experimental Study on Engineering Properties of Cemented Soil with High Water Content. Appl. Sci. 2023, 13, 937. [Google Scholar] [CrossRef] [Scilit]
- Kamdem, A.; Elat, E.; Eslami, J.; Amba, J.C.; Sali, M.; Mbessa, M.; Noumowé, A. Influence of the Nature of Cement on the Physical and Mechanical Properties of Soil Concretes from Sandy Clay and Laterite. CivilEng 2024, 5, 307–326. [Google Scholar] [CrossRef] [Scilit]
- Szafraniec, M.; Omiotek, Z.; Barnat-Hunek, D. Water absorption prediction of nanopolymer hydrophobized concrete surface using texture analysis and machine learning algorithms. Constr. Build. Mater. 2023, 375, 15. [Google Scholar] [CrossRef] [Scilit]
- Yue, T.; Zhang, X.; Yue, J.; Guo, Z.; Sun, Q. Experimental study on the hydrophysical properties of grey bricks modified with amide polymers. Case Stud. Constr. Mater. 2025, 22, e04422. [Google Scholar] [CrossRef] [Scilit]
- Sydor, N.; Margal, I.; Gayda, O. Research on the resistance of protective coatings for concrete to the effects of atmospheric moisture. Civ. Archit. Eng. 2024, 23, 99–106. [Google Scholar] [CrossRef] [Scilit]
- Taouirte, Y.; Kaoutari, T.; Louahlia, H.; Gounni, A.; El Alami, M. Experimental Study on the Hygrothermal Effect of Incorporating Phase-Change Materials in Cob Construction. Buildings 2025, 15, 1047. [Google Scholar] [CrossRef] [Scilit]
- Fischer, H.; Korjenic, A. Hygrothermal Performance of Bio-Based Exterior Wall Constructions and Their Resilience under Air Leakage and Moisture Load. Buildings 2023, 13, 2650. [Google Scholar] [CrossRef] [Scilit]
- Poupard, T.; Tchiotsop, J.; Issaadi, N.; Amiri, O. Experimental Study of the Dimensional and Hygrothermal Properties of Hemp Concrete under Accelerated Aging. Buildings 2023, 13, 2414. [Google Scholar] [CrossRef] [Scilit]
- Ranefjrd, O.; Strandberg-De Bruijn, P.B.; Wads, L. Hygrothermal Properties and Performance of Bio-Based Insulation Materials Locally Sourced in Sweden. Materials 2024, 17, 2021. [Google Scholar] [CrossRef] [Scilit]
- Terzaghi, K. Erdbaumechanik: Auf Bodenphysikalischer Grundlage; F. Deuticke: Vienna, Austria, 1925. [Google Scholar]
- Feng, H.; Ma, D.; Liu, Q.; Ye, C. Method for calculating three dimensional apparent porosity of soils based on SEM images e. Chin. J. Geotech. Eng. 2019, 41, 574–580. [Google Scholar] [CrossRef]
- Di Remigio, G.; Rocchi, I.; Zania, V. Scanning Electron Microscopy and clay geomaterials: From sample preparation to fabric orientation quantification. Appl. Clay Sci. 2021, 214, 106249. [Google Scholar] [CrossRef] [Scilit]
- Kong, B.; Dai, C.-X.; Hu, H.; Xia, J.; He, S.-H. The Fractal Characteristics of Soft Soil under Cyclic Loading Based on SEM. Fractal Fract. 2022, 6, 423. [Google Scholar] [CrossRef] [Scilit]
- Huang, X.; Yao, Z.; Cai, H.; Li, K.; Tang, C. Prediction of thermal conductivity of unsaturated frozen soil based on microstructure remodeling. Geotech. Mech. 2023, 44, 193–205. [Google Scholar]
- Yu, F.; Chu, W.; Zhang, R.; Yang, Y. Predicting the permeability and compressive strength of pervious concrete using a stacking ensemble machine learning approach. Sci. Rep. 2025, 15, 22506. [Google Scholar] [CrossRef] [Scilit]
- Wu, Y.; Pieralisi, R.; Sandoval, F.G.B.; López-Carreño, R.D.; Pujadas, P. Optimizing pervious concrete with machine learning: Predicting permeability and compressive strength using artificial neural networks. Constr. Build. Mater. 2024, 443, 137619. [Google Scholar] [CrossRef] [Scilit]
- Dzięcioł, J.; Tracz, R.; Kowalski, J. Could Machine Learning Algorithms affect the efficient management of anthropogenic materials? Arch. Civ. Eng. 2026, 72, 565–577. [Google Scholar] [CrossRef] [Scilit]
- Hai-Bang, L.; Hoang-Long, N.; Viet-Hung, P.; Monchiet, V. Hybrid approach for permeability prediction in porous media: Combining FFT simulations with machine learning. Vietnam J. Earth Sci. 2024, 46, 515–532. [Google Scholar] [CrossRef] [Scilit]
- Wu, H.; Fang, W.Z.; Kang, Q.; Tao, W.; Qiao, R. Predicting Effective Diffusivity of Porous Media from Images by Deep Learning. Sci. Rep. 2019, 9, 20387. [Google Scholar] [CrossRef] [Scilit]
- Heider, Y.; Aldakheel, F.; Ehlers, W. A Multiscale CNN-Based Intrinsic Permeability Prediction in Deformable Porous Media. Appl. Sci. 2025, 15, 2589. [Google Scholar] [CrossRef] [Scilit]
- Kim, Y.; Kee, S.-H.; Monjardin, C.E.F.; Robles, K.P.V. Multivariate Machine Learning Framework for Predicting Electrical Resistivity of Concrete Using Degree of Saturation and Pore-Structure Parameters. Materials 2026, 19, 349. [Google Scholar] [CrossRef] [Scilit]

Disclaimer/Publisher’s Note: The statements, opinions and data contained in all publications are solely those of the individual author(s) and contributor(s) and not of MDPI and/or the editor(s). MDPI and/or the editor(s) disclaim responsibility for any injury to people or property resulting from any ideas, methods, instructions or products referred to in the content. |
© 2026 by the authors. Licensee MDPI, Basel, Switzerland. This article is an open access article distributed under the terms and conditions of the Creative Commons Attribution (CC BY) license.