1. Introduction
Sulphide-rich soil, or sulphide soil, is a fine-grained alluvial soil type formed in the brackish, calm waters of river estuaries under anaerobic conditions. Sulphide soil is characterised by its high water content, significant organic content, and poor geotechnical properties [
1]. Infrastructure projects, such as roads and railways, built in areas where sulphide soil is prevalent are likely to encounter deposits of sulphide soil. These structures do not have high loads when compared to other geotechnical structures, but are subjected to a great number of load cycles in their design life. Due to the poor geotechnical performance of sulphide soil, a common practice, mainly in railway construction, is to excavate it and replace it with a more suitable material as a subgrade. Once the soil is excavated, the oxidation process begins. The leachate from oxidised sulphide soils has a low pH (<4) and high content of metals [
2], making it a potential risk for the environment when excavated. Excavated sulphide soil must be transported and disposed at specially certified landfill sites, which significantly increases the cost and environmental impact of such projects.
Advancements in soil stabilisation and reinforcement techniques, such as the work by [
3,
4,
5], have encouraged the idea of using more sulphide soil as a subgrade material to reduce costs and emissions. This underscores the need for reliable strength and mechanical behaviour definitions, mainly for cyclic loading. While studies have been published on the static mechanical properties of sulphide soil [
1,
6,
7,
8], a comprehensive understanding of the cyclic mechanical properties of this material remains incomplete. The properties of sulphide soil can make obtaining quality samples a challenging or even impossible task. Furthermore, it is not uncommon to find discrepancies between laboratory and field test results [
9]. In addition, laboratory studies on intact sulphide soil samples show higher scatter in the results in comparison to similar studies performed on other kind of soils.
This work is the first step of a research project with the goal of defining the mechanical behaviour of sulphide soil under cyclic loads. To draw meaningful conclusions, homogeneous and repeatable samples in great quantity are, in the authors’ opinion, crucial. Considering the challenges that sulphide soil testing presents, sample reconstitution was considered as a complementary method to intact sampling for producing the required quality and quantity of samples. The presented work implements the use of the slurry deposition method [
10] as a sample reconstitution method to obtain homogeneous and repeatable samples of sulphide soil. The focus herein is to explore if the sample reconstitution method can yield sulphide soil samples with predefined initial conditions and static mechanical behaviour similar to the intact samples. If so, a similar approach will be applied for cyclic triaxial testing as the research project progresses.
2. Sulphide Soil
It is estimated that 170,000–240,000 km
2 of the world’s surface area is covered by sulphide soil [
11], concentrated in coastal areas of Southeast Asia, Africa, Australia, North, Central and South America, and Northern Europe. Sulphide soil contains significant amounts of pyrite (
) due to its sedimentation under anaerobic conditions. When exposed to oxygen, the pyrite oxidises, forming colloidal iron III (
), sulphates (
) and hydrons (
) (Equation (
1)).
Subsequently, the sulphates and hydrons form sulphuric acid and the colloidal iron III precipitates as rust [
12], making the drainage water a potential risk for the environment, as documented by [
2].
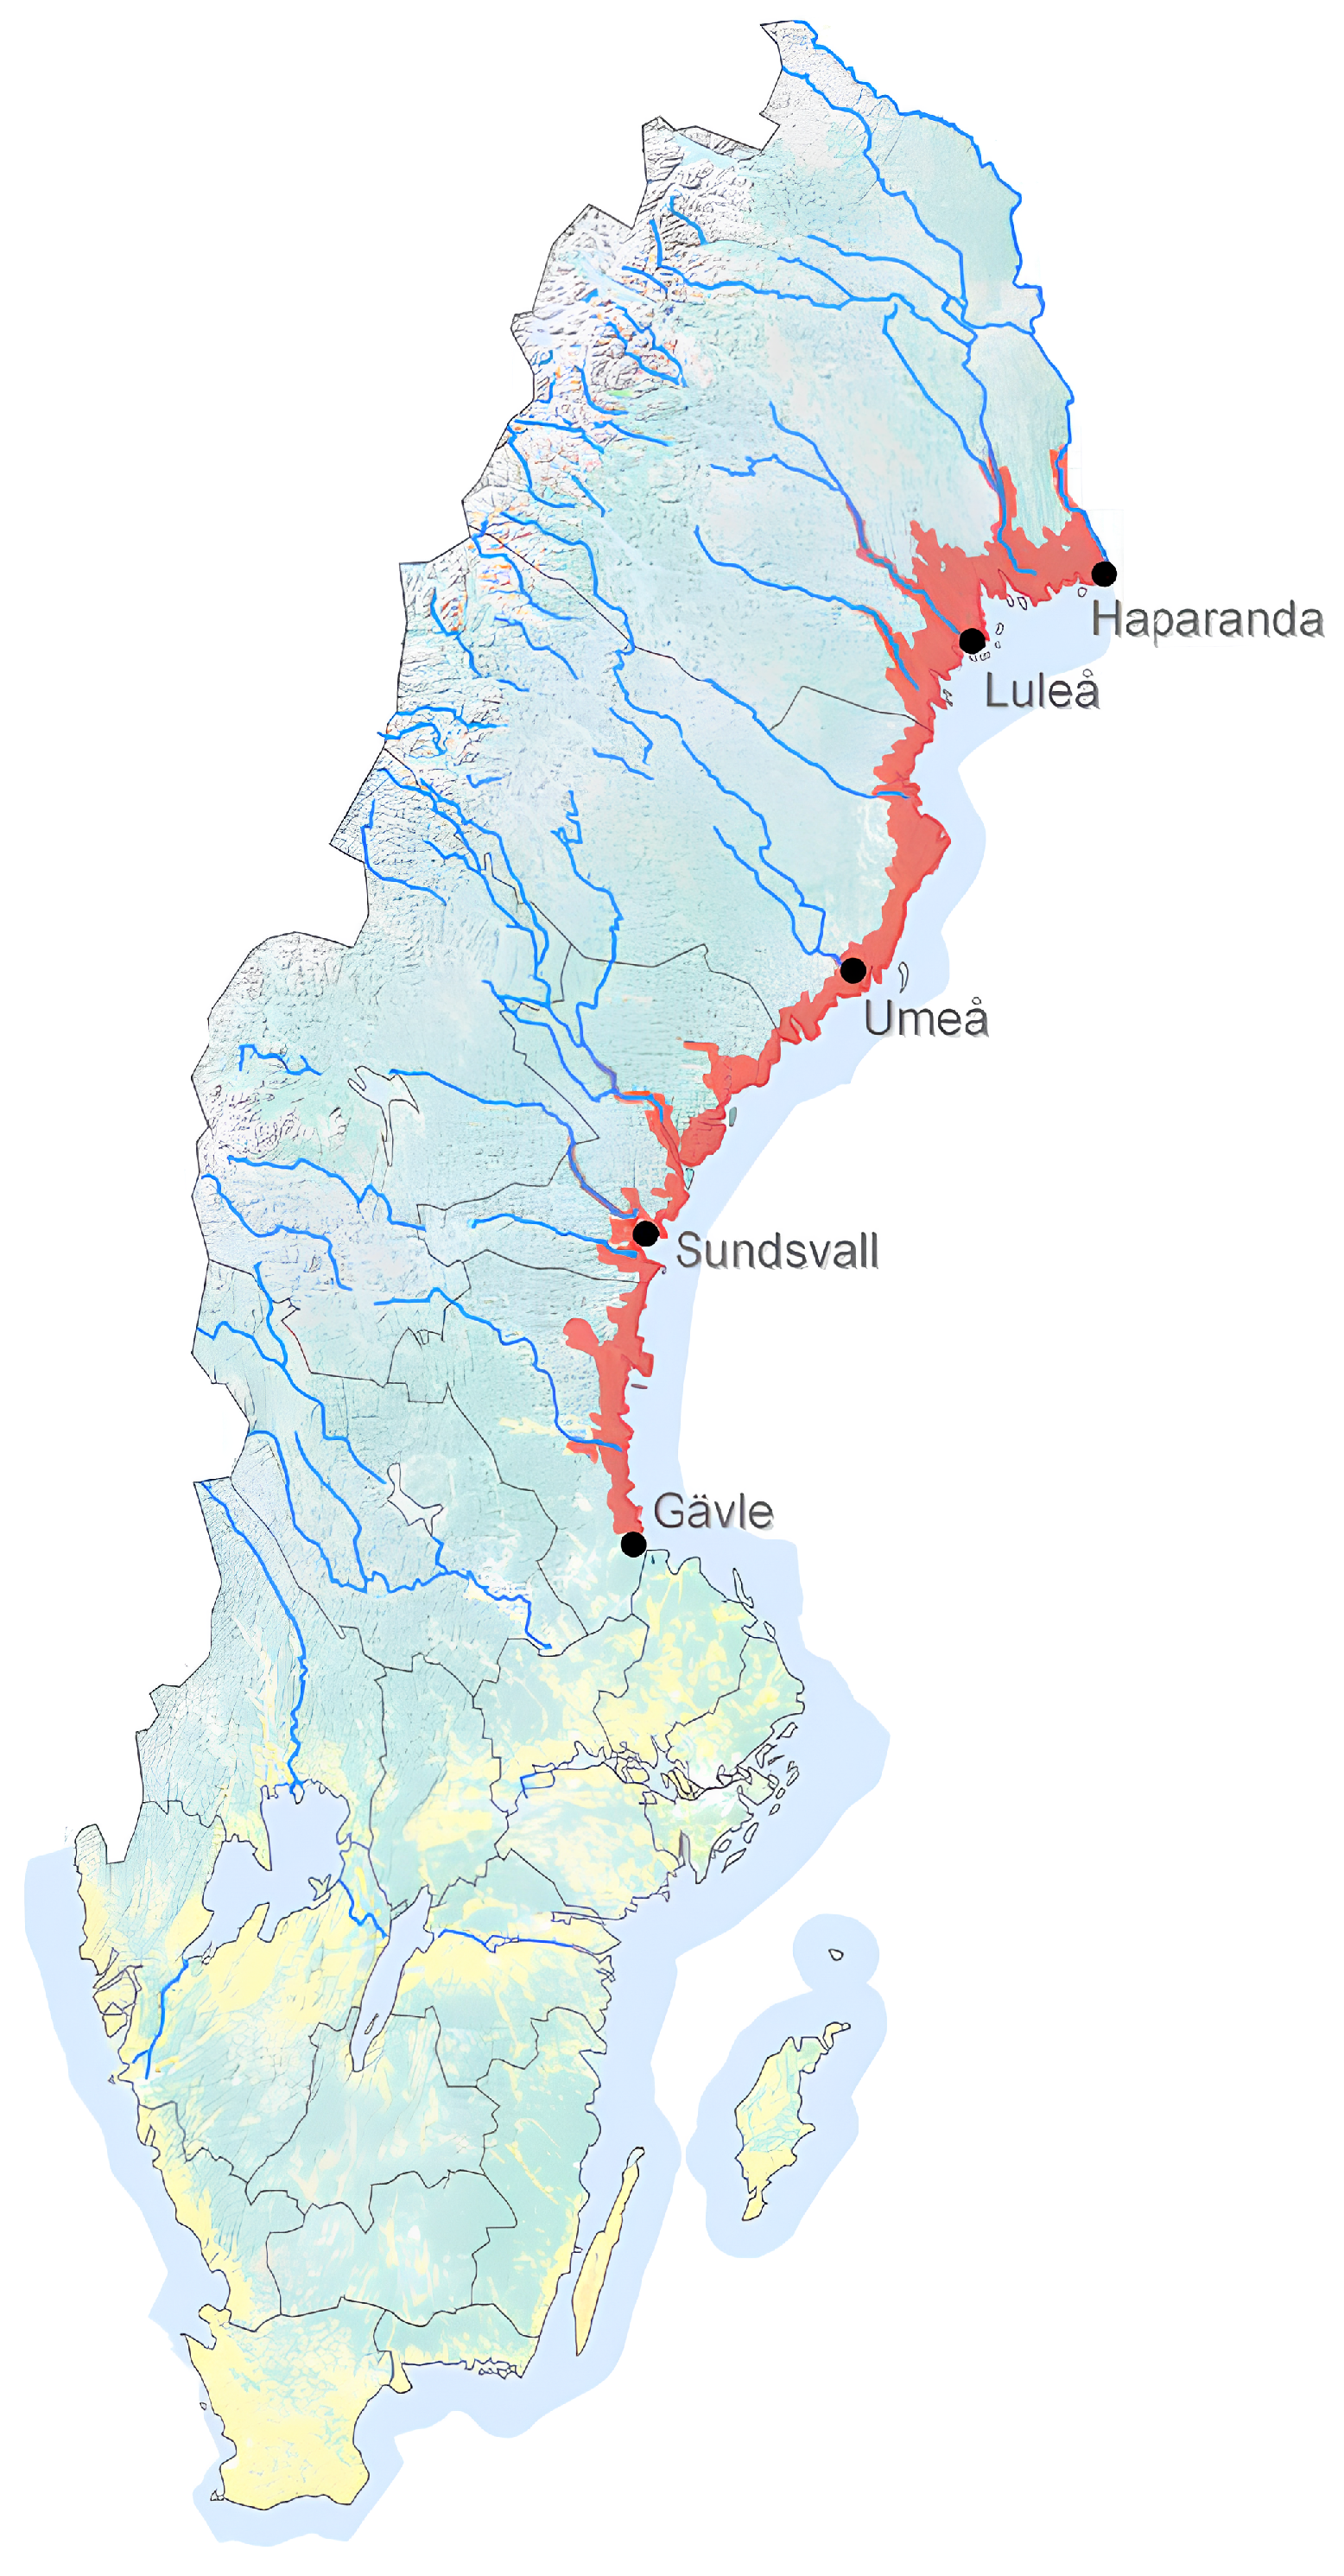
This paper focuses on the sulphide soil deposits along the Swedish Baltic coast (
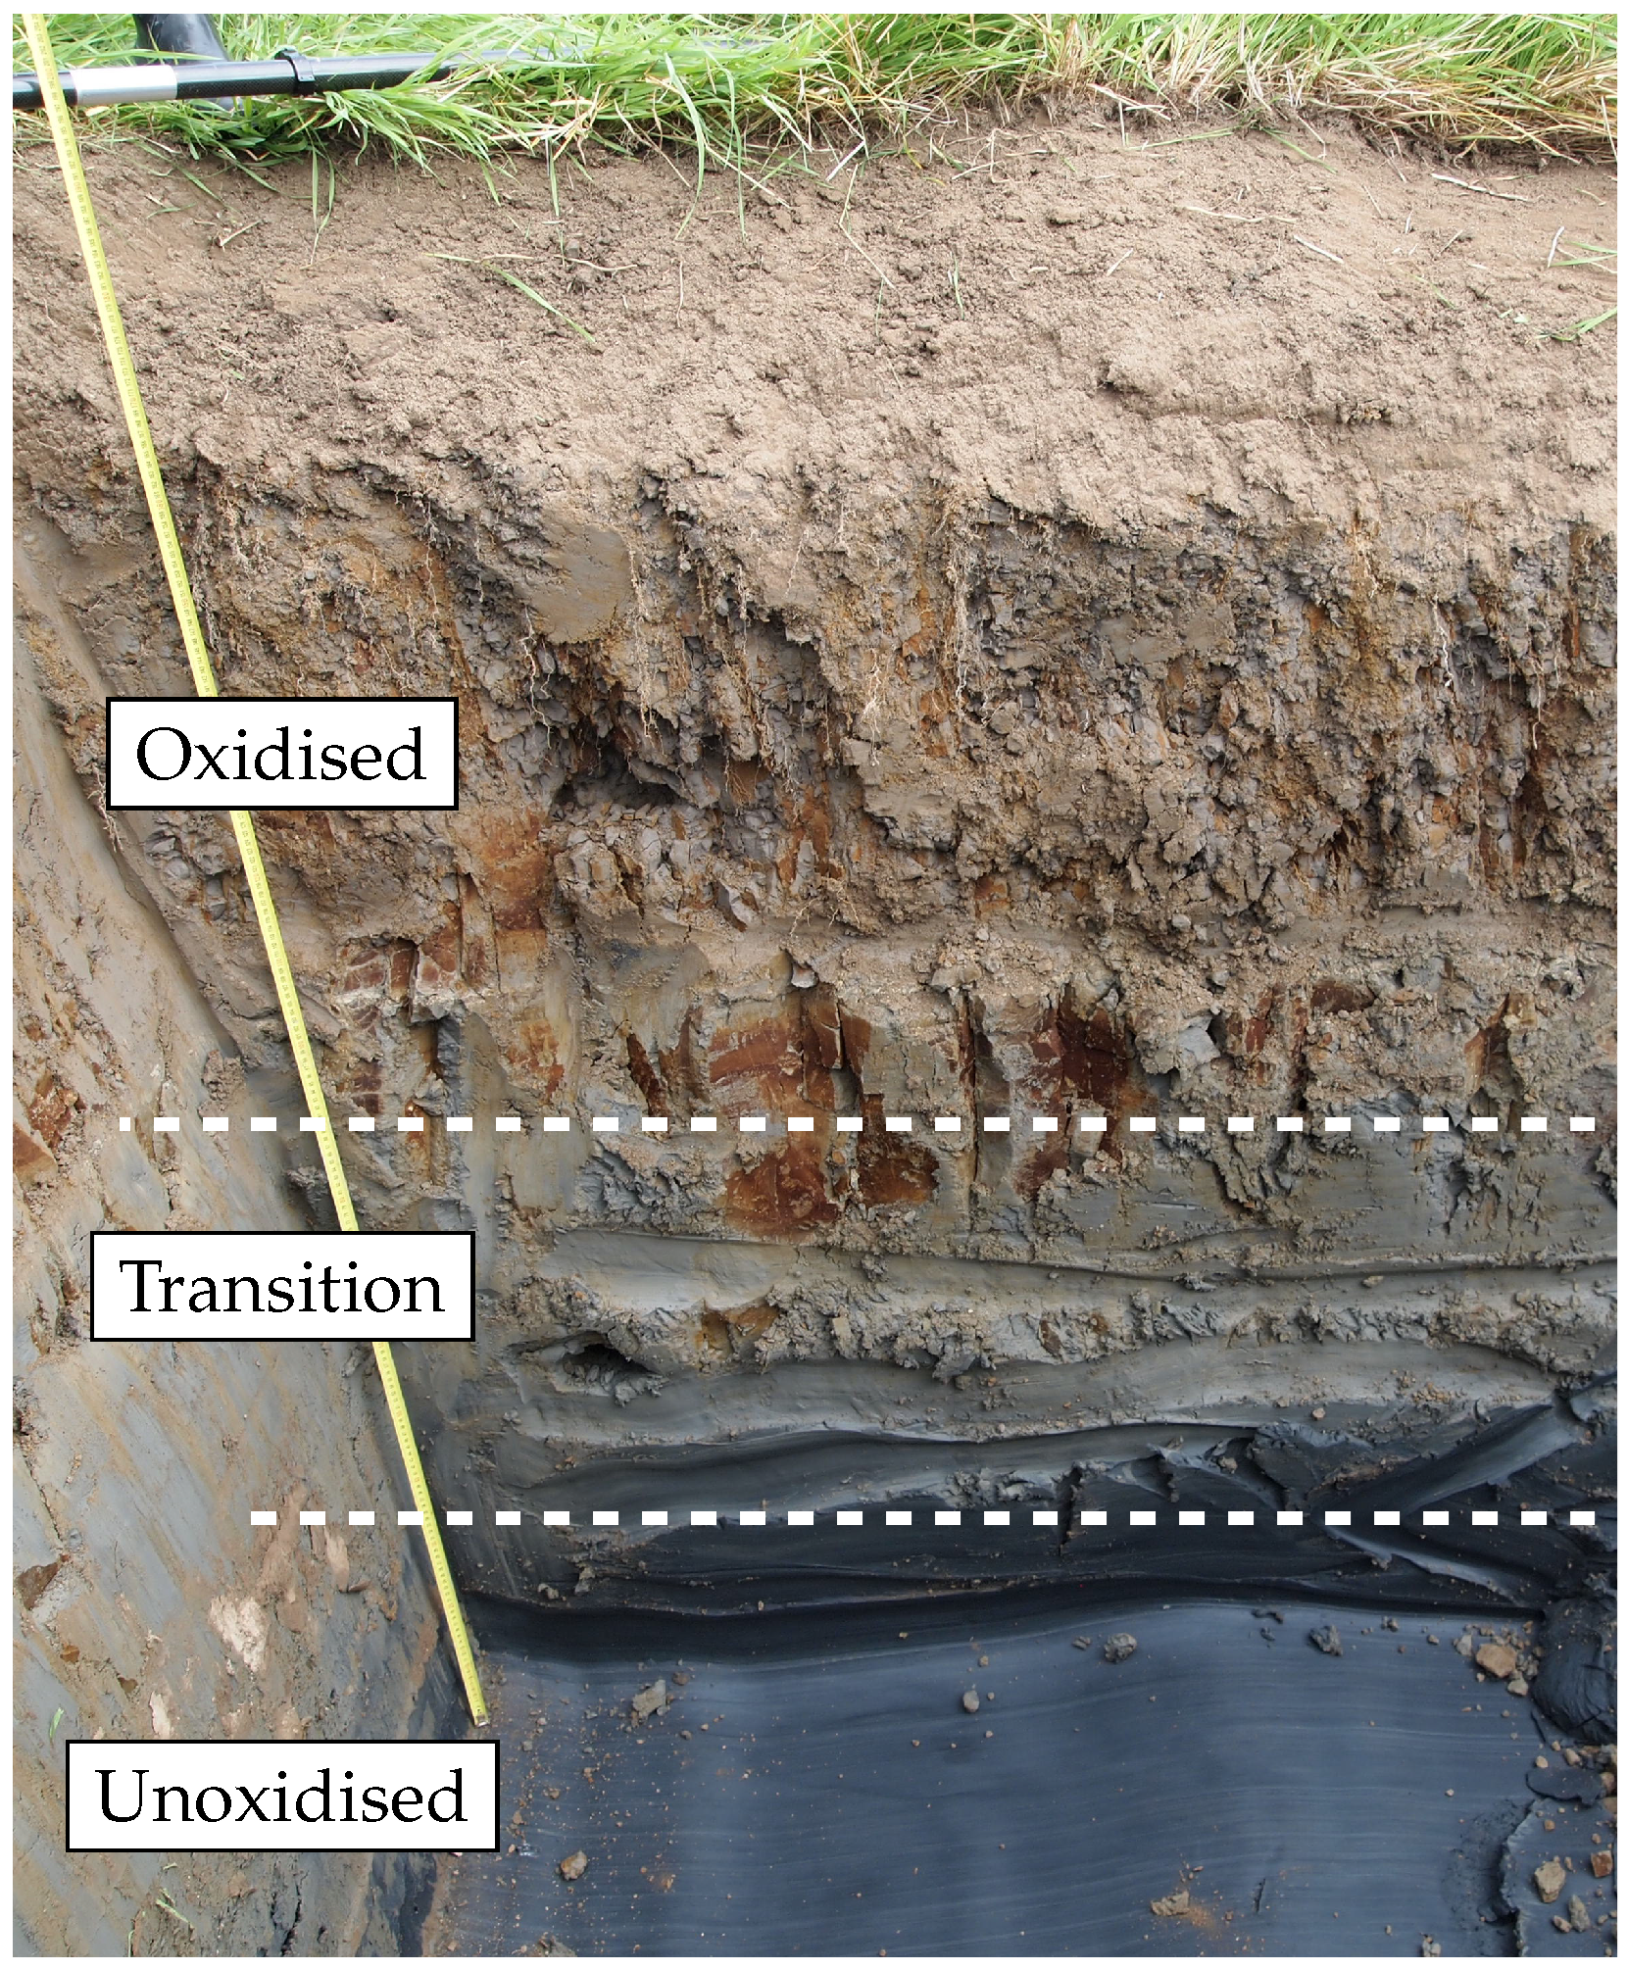
Figure 1). The sedimentation of sulphide soil in the Baltic area spans from the last glaciation (4000–7000 years ago) until today. The ongoing post-glacial rebound of the Fennoscandian peninsula has led to the prevalence of this soil type near and above the sea level in the Baltic coastal areas of Sweden and Finland. Consequently, some of these sediments have been exposed to air, causing their oxidation and creating its characteristic three-zone profile: an oxidised top layer, a transition zone, and an unoxidised (reduced) zone extending from the water table downward (
Figure 2).
The composition of sulphide soil varies with respect to local minerals, grain size distribution, and organic content [
15]. Based on its grain size distribution, it is classified as sulphide silt, clayey sulphide silt or sulphide clay. The shade of unoxidized soil varies from black to grey depending on the
content. Sulphide soil deposits can exceed depths of 20 m, being normally consolidated over depth, and slightly overconsolidated to overconsolidated near the ground surface [
16]. The soil type generally exhibits a low bulk density (1.2–1.8 t/m
3) and high water content (40–150%) derived from its porous structure and organic content [
7,
9,
15].
From a mechanical perspective, sulphide soils are generally considered soft soils with poor geotechnical properties. The typical range for undrained shear strength falls between 10 and 30 kPa but can be as low as 3–4 kPa. As outlined in [
1], sulphide soil has a high water content compared to similar inorganic soils at the same consolidation levels, in addition to high compressibility, viscosity, and creep susceptibility. Moreover, sulphide soil can present anisotropic behaviour due to banding from its sedimentary origin and localized oxidation. The influence of organic content on the behaviour of fine-grained soils was studied in [
17], suggesting that sulphide soil tends to have lower permeability compared to a non-sulphide soil with a similar grain size distribution, attributed to organic matter clogging the soil structure voids.
According to [
9], there can be some discrepancy between the results of laboratory and field testing on sulphide soil. Two well established field tests used in Swedish practice are the shear vane test and cone penetration test (CPT). Although results from these methods are of great value for determining trends in the variation of soil properties, they have limitations for defining the precise magnitudes of properties such as undrained shear strength [
13]. Field test interpretations often rely on empirical correlations, requiring corrections by laboratory tests to properly capture the mechanical properties of sulphide soils. It is also worth mentioning the sensitivity of CPT results to the skills and care of the technician performing the tests and the correct selection of the measuring range of the proof [
8].
Laboratory testing on intact samples of sulphide soil is a common procedure in projects involving this soil type, but to obtain reliable results, the samples must be of the highest quality possible. The low stiffness and relatively high sensitivity of sulphide soil make it challenging to sample, transport and test the soil without the possibility of introducing uncontrolled disturbances and exposition to oxygen that may impact the test results [
18]. To ensure the highest-quality samples, sampling guidelines are provided in [
19]. Consequently, significant scatter in results is often observed compared to similar studies conducted on less sensitive soil types [
8]. In addition, heterogeneities and layering in intact samples can further add to the scatter of the results, making the derived strength parameters imprecise or unrealistic [
20]. For a comprehensive understanding of sulphide soil cyclic behaviour, there is a need for representable, homogeneous, and repeatable samples for testing. This paper proposes an adaptation of the slurry deposition method [
10] for the reconstitution of disturbed sulphide soil samples to produce repeatable soil samples with the target properties of intact samples. Though the slurry deposition method is well-established, it has, to the authors’ knowledge, never been applied to sulphide soil.
3. Methodology
This work is centred around the comparison between monotonic triaxial tests performed on reconstituted and intact samples with the objective of using reconstituted samples as a reference for investigating the stress–strain behaviour of sulphide soil.
The debate on whether intact or reconstituted samples are the most suitable is a longstanding discussion within the field of geotechnics. Several studies have compared the behaviour of intact and reconstituted samples across various soil types, e.g., [
21,
22]. Generally, intact samples are considered the closest representation of the in situ conditions. However, as previously mentioned, intact soft soil samples are at risk of scattered or unrealistic laboratory test results. Samples generated through reconstitution methods tend to exhibit a higher level of repeatability, a quality highly desirable when examining the fundamental behaviour of soils [
23]. However, as noted in [
24], reconstitution methods often struggle to replicate the natural fabric or anisotropies observed in the in situ soil, factors that significantly impact soil behaviour. The use of reconstituted samples in this study serves to provide a standardized reference point for analysing the stress–strain characteristics of sulphide soil. While recognizing the inherent limitations of reconstitution in fully replicating natural soil conditions, the focus lies on leveraging the repeatability and controlled nature of reconstituted samples to gain valuable insights into the mechanical behaviour of sulphide soil.
3.1. Tested Material
The sulphide soil tested in this work was collected just outside the city of Luleå, Sweden, in an area with a sulphide soil deposit ranging from 6 to 12 m thickness. Soil from this location has been utilized in previous studies such as [
1,
6,
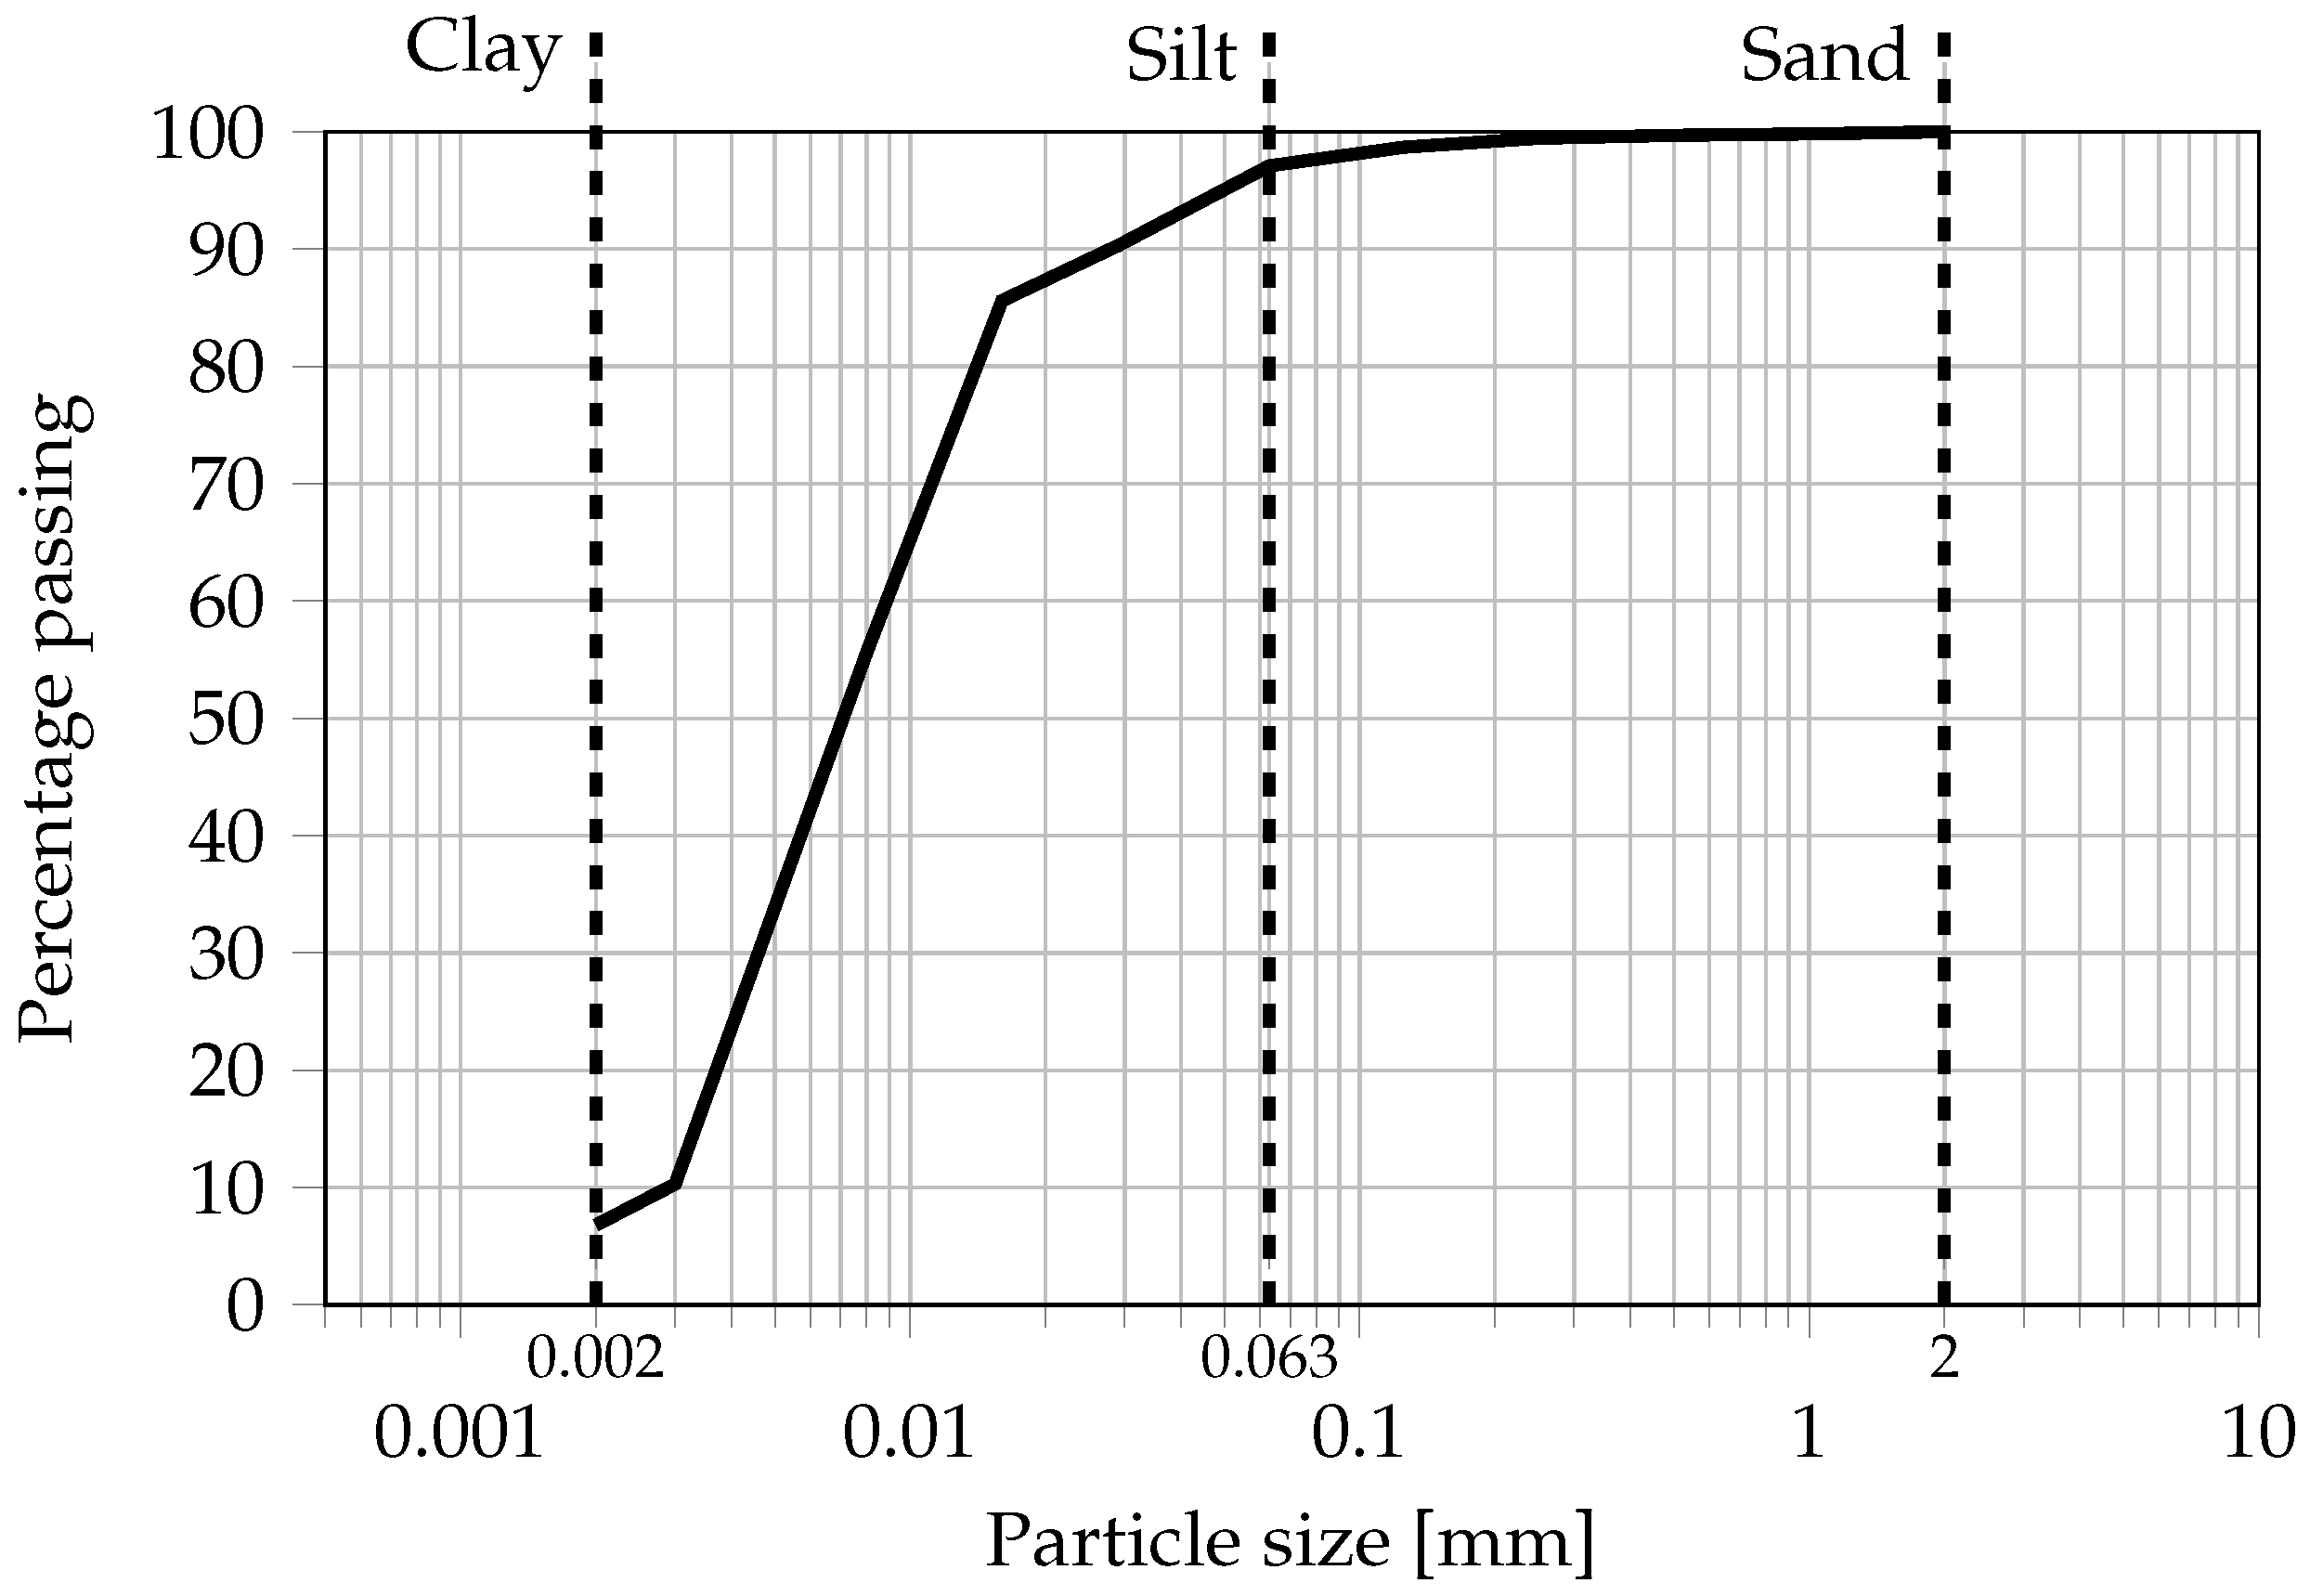
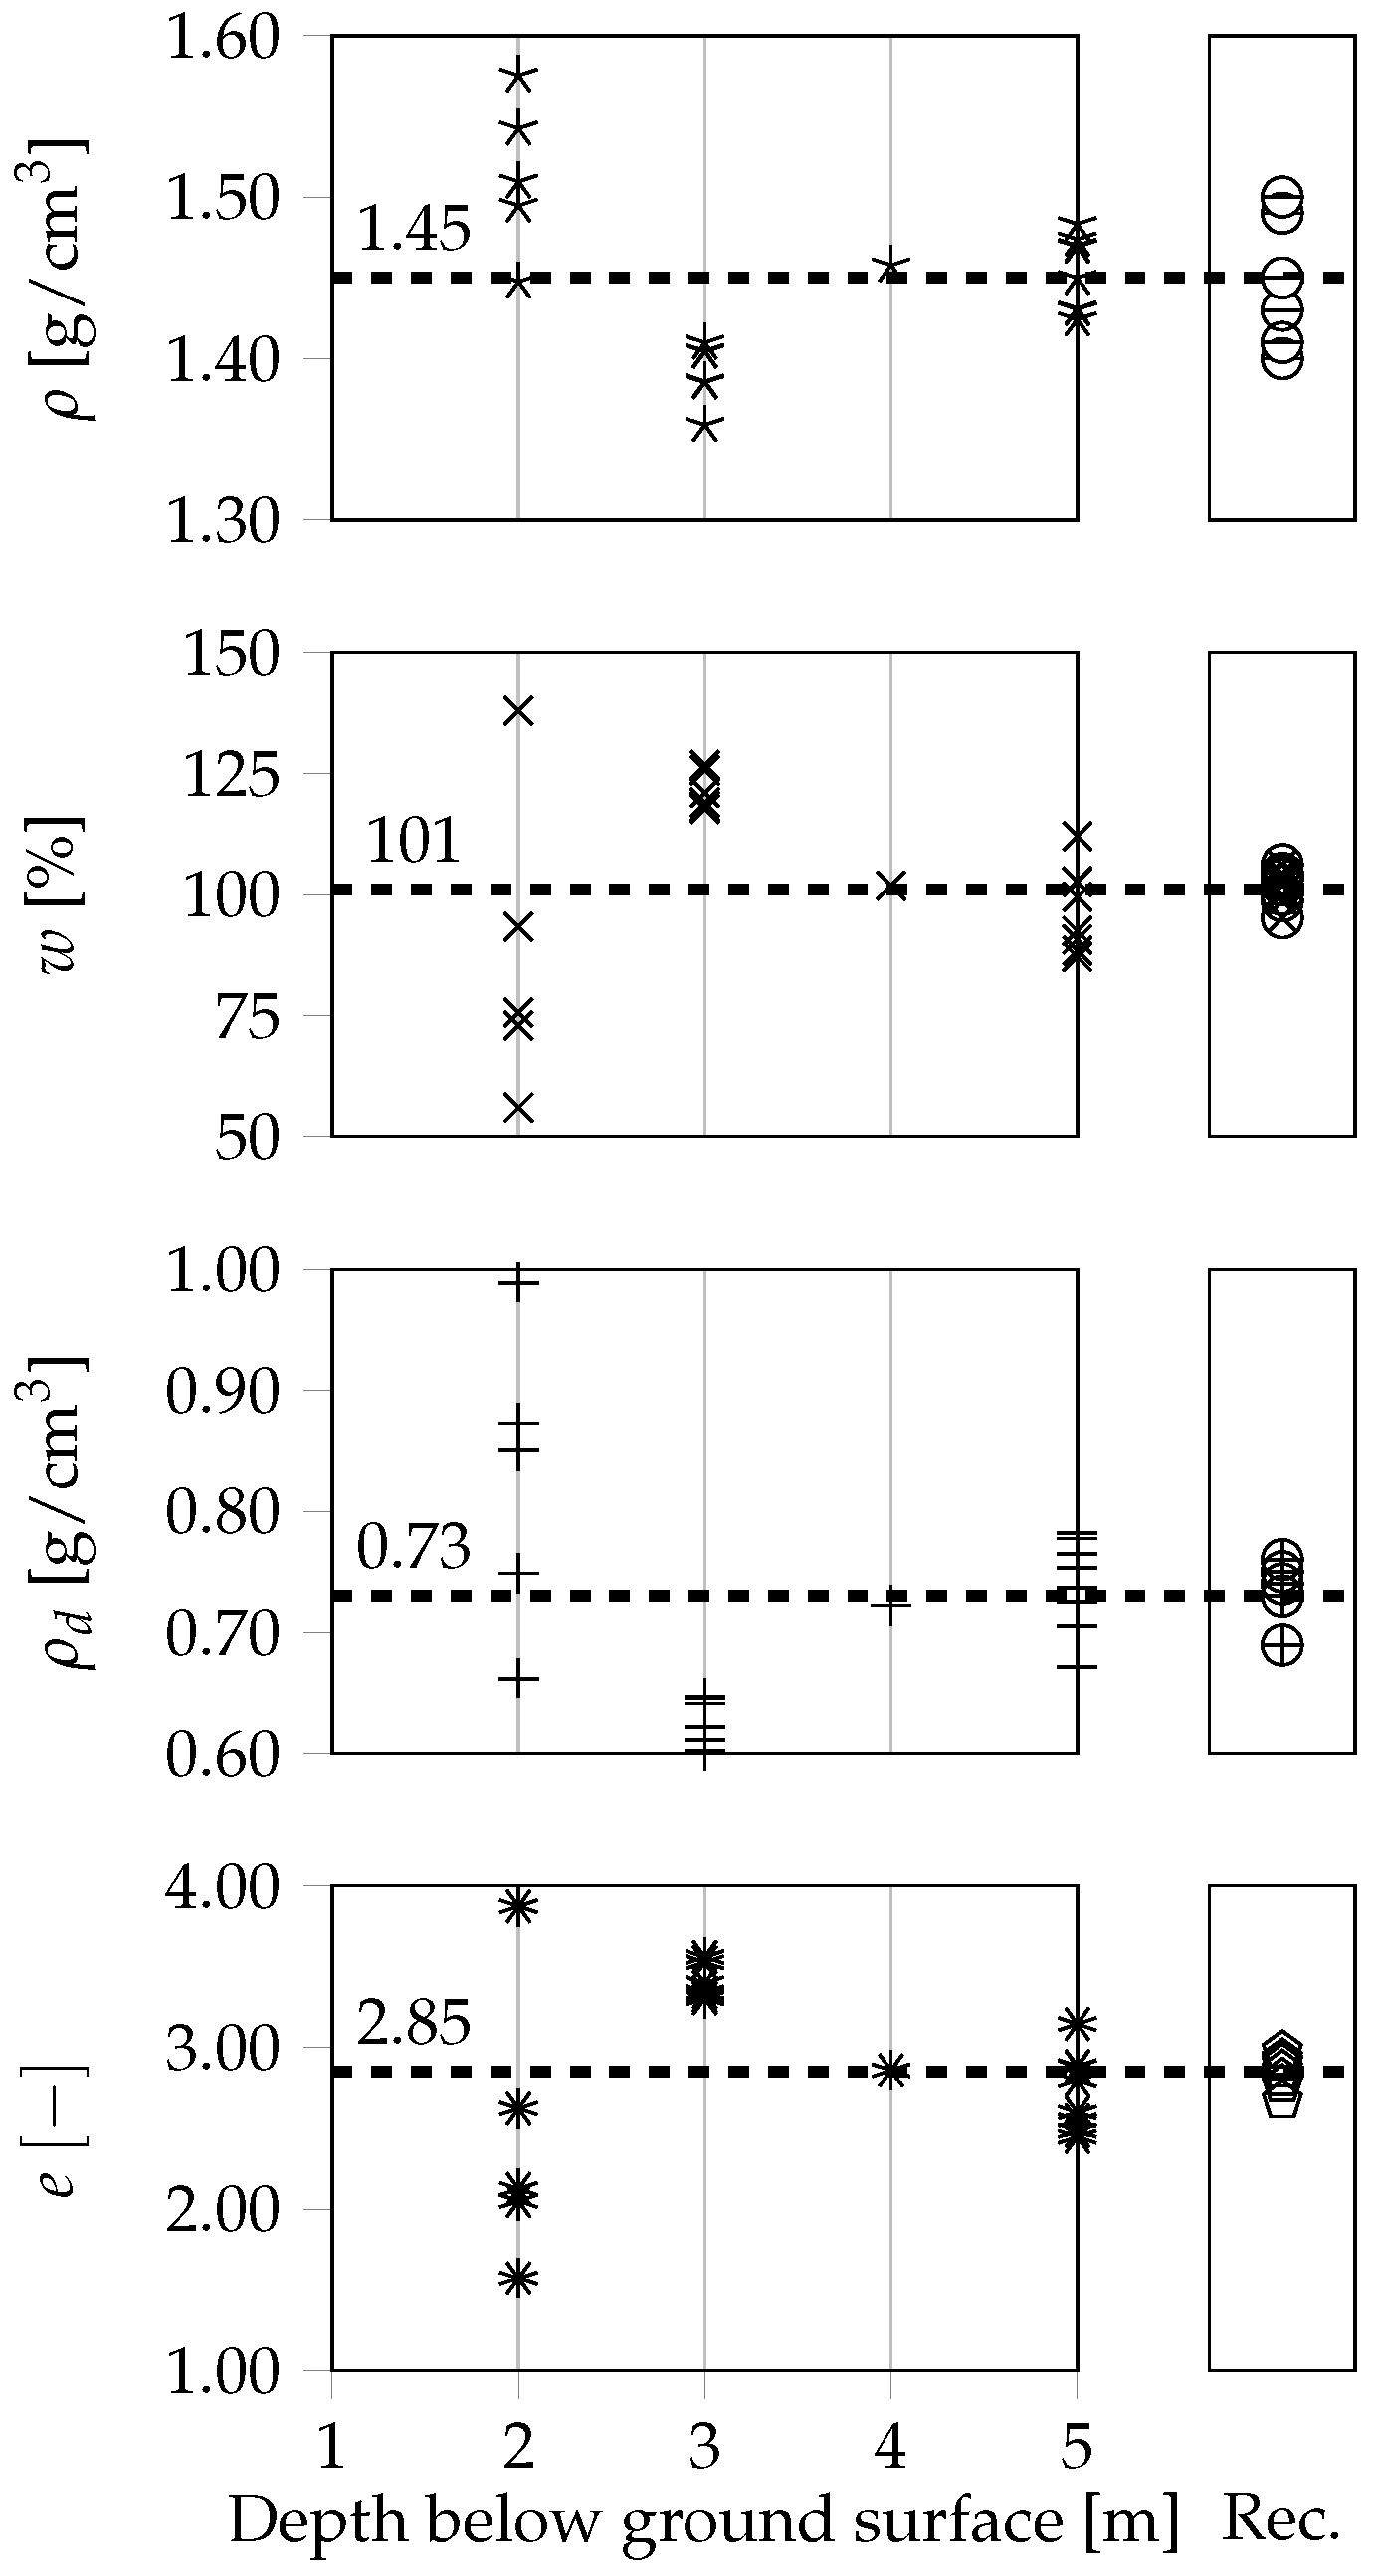
7]. The sulphide soil from the selected area exhibited an oxidised top crust, approximately 1 m thick, with a 0.5–1 m transition zone to the unoxidised soil beneath. The ground water table fluctuates between the ground surface during rainy or snow thawing periods to the depth of the transition zone during dry periods. The unoxidised soil layer extends from 1.5 m to 6–7 m depth, characterized by its distinctive black colour, below which signs of oxidation become apparent as the soil transitions to a grey colour. At 8 m depth, a sand layer with ground water flow was found, presumably the reason for the oxidation. Given the focus of this work on unoxidised soil, sampling was conducted from a depth of 2 m below the surface down to a 5 m depth. To establish the basic properties of the soil, soil classification and index property tests were conducted on all samples tested in the triaxial testing. The soil was classified as a sulphide silt (SuSi) with 8% clay content and no particles larger than 1–2 mm. The particle size distribution is shown in
Figure 3. The bulk density (
), dry density (
), water content (
w) and calculated void ratio (
e) are later presented in
Section 4.1. The intact samples were fully saturated or close enough to fully saturated that the difference was deemed negligible. A degree of saturation of 1 was expected, since the tested samples were unoxidised and sampled below the lowest ground water table. The particle density of the soil was, on average, 2.8 g/cm
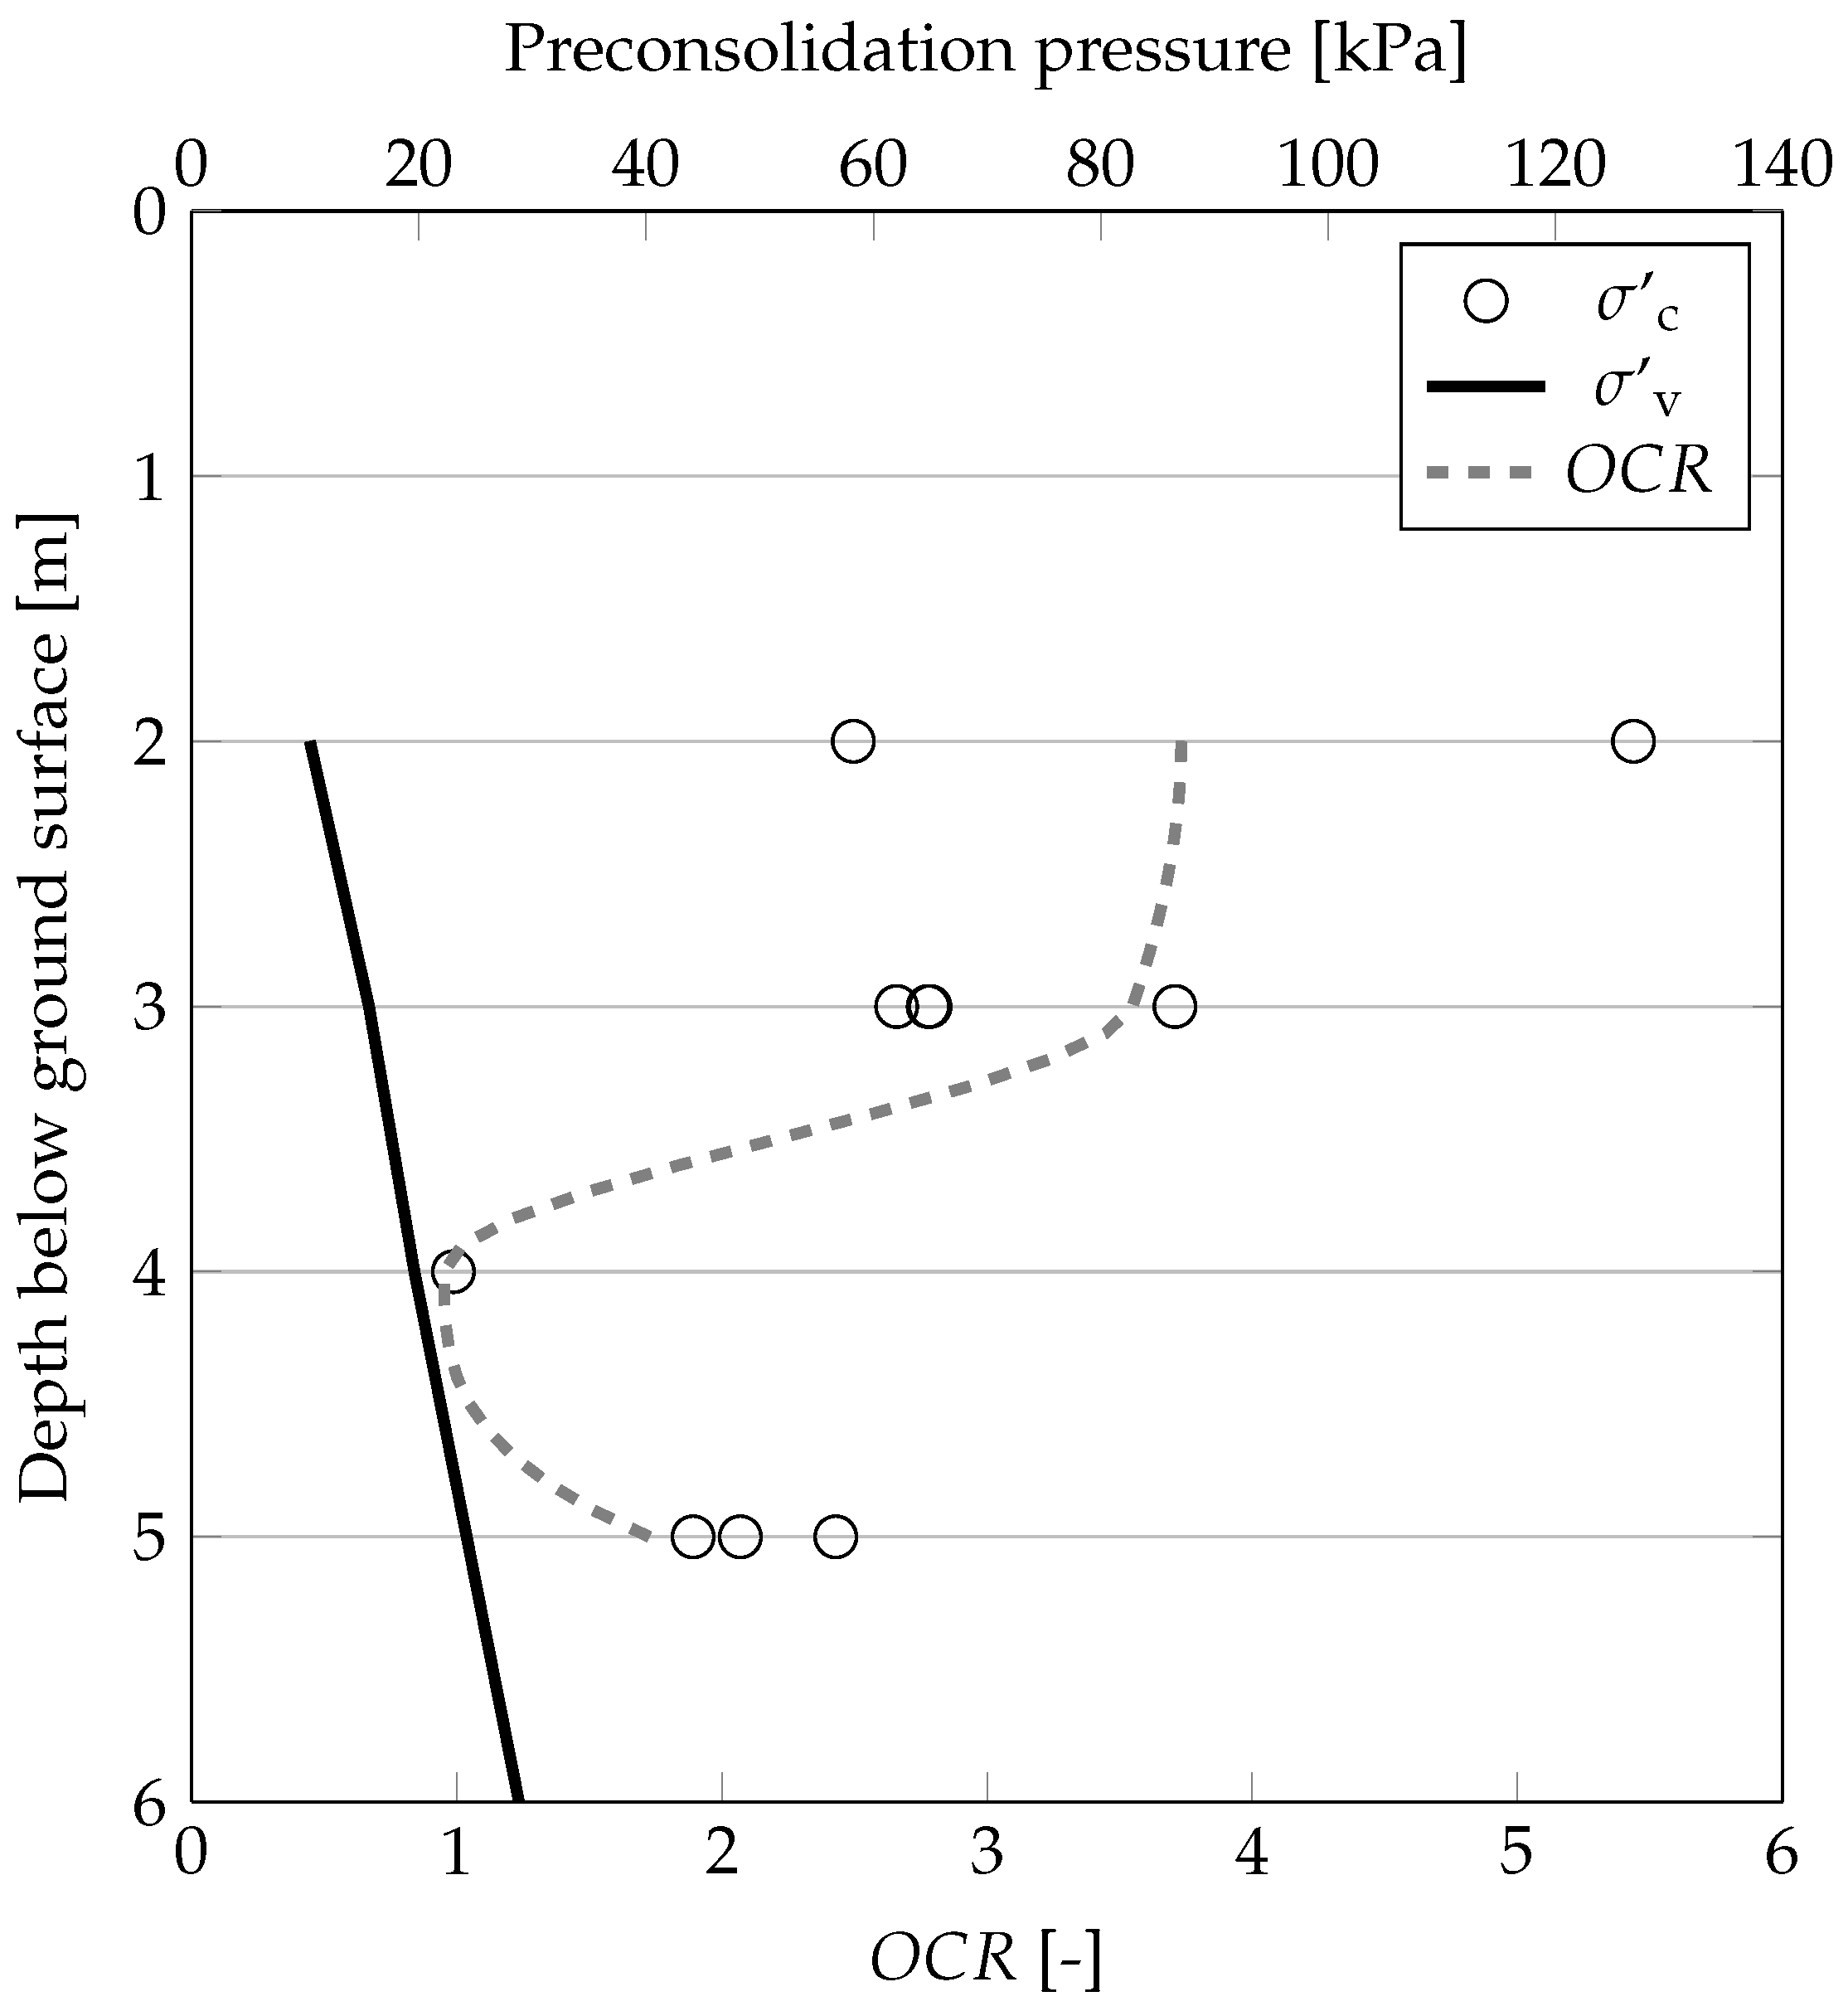
3, determined by pycnometer tests, and the organic content was, on average, 2.5%, determined by loss on ignition tests. Standard oedometer tests were primarily conducted to determine the preconsolidation pressure of the samples. Seven load steps were applied, starting at 10 kPa, doubling the load in every subsequent load step and letting the sample consolidate for 24 h between each load step. The upper section of the unoxidised layer exhibited overconsolidation ratios (OCRs) averaging 4, which gradually diminished with depth, as shown in
Figure 4. This overconsolidation profile is commonly found in similar deposits of this soil type [
7].
3.2. Intact Sampling
The soil was sampled by the Swedish standard piston sampler St:I, manually operated as per the guidelines [
25]. This sampling method produced three cylindrical samples measuring 5 cm in diameter and 17 cm in height for each metre of depth. The piston sampling technique is known for producing good-quality samples from soils with grain size distributions ranging from clay to fine sand. However, extracting high-quality samples from sensitive soils might be challenging, or in some cases, even impossible [
26]. The precautions recommended in [
27] were followed when sampling to optimise sample quality. The proximity of the sampling site to the soil mechanics laboratory at Luleå University of Technology minimised potential disturbances during sample transportation and facilitated easy access to fresh samples.
3.3. Sample Reconstitution
The reconstitution of samples is a common practice in laboratory investigations involving silts and sands. Various techniques have been proposed for this purpose, including moist tamping methods, water or air pluviation, and slurry deposition, as described in [
10,
28,
29]. A comparative analysis of these reconstitution methods can be found in [
20,
24,
30,
31].
For the reconstitution of sulphide soil samples, the chosen reconstitution method must satisfy the following requirements:
The reconstituted sample should be as homogeneous as possible.
The method should be adaptable to in situ conditions such as density or water content.
Oxidation should be avoided by minimising contact with air and maintaining full saturation during the reconstitution process.
Oven-drying of the material should be avoided due to the cementation tendency of sulphide soil when dried.
The reconstituted sample should resemble the in situ conditions of the soil, such as its deposition in river estuaries.
Minimisation of sample disturbances between manufacturing and testing is crucial.
In the context of these criteria, the popular undercompaction method developed in [
28] is considered unsuitable. This method needs drying of the material, lacks resemblance to the natural formation of the soil and, as the soil is compacted in layers, can lead to the development of distinct failure planes during testing. Air pluviation [
32] is also considered inappropriate primarily due to the need for soil drying. Among the available options, slurry deposition is the most suitable reconstitution method that fulfils all the necessary requirements. This choice is further supported by the laboratory studies in [
23,
33,
34], which have successfully utilized the slurry deposition method on silts and other fine-grained soils. Additionally, ref. [
30] compared samples reconstituted by the slurry deposition method and the undercompaction method to intact block samples and found that the slurry deposition method yielded the most uniform samples and exhibited behaviour resembling that of the intact samples. In a comparative study between intact and reconstituted fluvial sand samples [
24], it was found that the slurry deposition method was the only reconstitution technique capable of replicating the particle orientation and anisotropies found in sand deposited underwater. Reconstituted samples have extensively been used in the study of tailings. Intact and reconstituted samples from natural silts and silty sand tailings were studied in [
21]. Their reconstituted samples were made by tamping and slurry deposition. Both reconstitution methods gave similar results but showed lower strength and dilatant behaviour than the intact samples. Samples made by slurry deposition underwent strain hardening, ending with a significantly higher strength than the tamped samples. The same study pointed out that samples made by tamping did not show consistent stress–strain behaviour. Samples of silty tailings have been traditionally reconstituted by tamping, which show brittle behaviour matching that of tailing deposits. This is difficult to achieve with samples made by slurry deposition. Slurry deposition samples seem to show dilative behaviour with strain hardening response, changing to contractant behaviour with increasing plasticity [
31]. All the mentioned studies point out the difficulty of replicating the fabric of natural silts, and attribute the differences in mechanical behaviour between intact and reconstituted samples to the lack of similar fabric. It is also worth noting that the mentioned studies tested silty sands and non- or low-plasticity silts and tailings. Sulphide soil is a plastic silt, and to the authors’ knowledge, there is no study comparing different reconstitution methods for this type of soil.
Reconstitution Process
The concept of sample reconstitution through slurry deposition was initially presented in [
10]. Since then, this method has been used and modified for different applications. One of the most common uses of slurry deposition is in the study of tailings [
31]. Additionally, slurry deposition has been tailored as a method for determining the minimum void ratio of sands containing fines [
29]. In this paper, an adaptation of slurry deposition for the reconstitution of sulphide soil samples is presented.
Firstly, index properties such as water content, bulk and particle density, and liquid limit are determined from intact samples. If intact samples are not available, these properties can also be determined from collected lumps of soil, provided they are freshly collected and stored carefully.
Secondly, the water content of the slurry is determined based on the liquid limit of the intact soil sample. Typically, this water content ranges from 1.5 to 2 times the water content at the liquid limit [
35]. However, the precise slurry water content might require some trial and error, since it has implications for the density and void ratio of the reconstituted sample [
33]. The aim is a slurry consistency that allows flow of the slurry, since excessive liquidity might lead to particle segregation. A slurry with too low water content will not flow properly, trapping large air pockets when poured. Once the desired water content of the slurry is established, de-ionised water is added to the soil and thoroughly mixed to dissolve soil lumps. The slurry is then de-aired under vacuum. It is essential to check the weight of the slurry after de-airing, as water will evaporate under vacuum. If a significant difference in weight is noted, additional water should be added to compensate. The slurry is then gently mixed once more, avoiding splashing or introducing air. At this stage, the soil can be used for sample reconstitution immediately.
In this study, a large batch approach was adopted, where 2–3 kg batches of slurry were prepared with the leftover material from the intact sampling and stored in airtight jars. The prepared amount of slurry was sufficient for the reconstitution of 4–6 samples. This approach was found to enhance homogeneity, as the slurry properties were the same for multiple reconstituted samples. Additionally, preparing a large slurry batch takes approximately the same amount of time as a small batch, resulting in time efficiency. As the slurry settles slightly in the jars, a thin water film forms on the surface, providing protection against oxidation. Before use, the slurry was mixed thoroughly in the jars and de-aired once more.
The amount of slurry needed for one sample with the target density is calculated following the equation proposed in [
23],
where
corresponds to the mass of slurry to be poured,
h is the height of the final sample,
r denotes the radius of the final sample,
corresponds to the target dry density, and
is the water content of the slurry.
The proposed slurry deposition method underwent several iterations to increase its precision and accuracy [
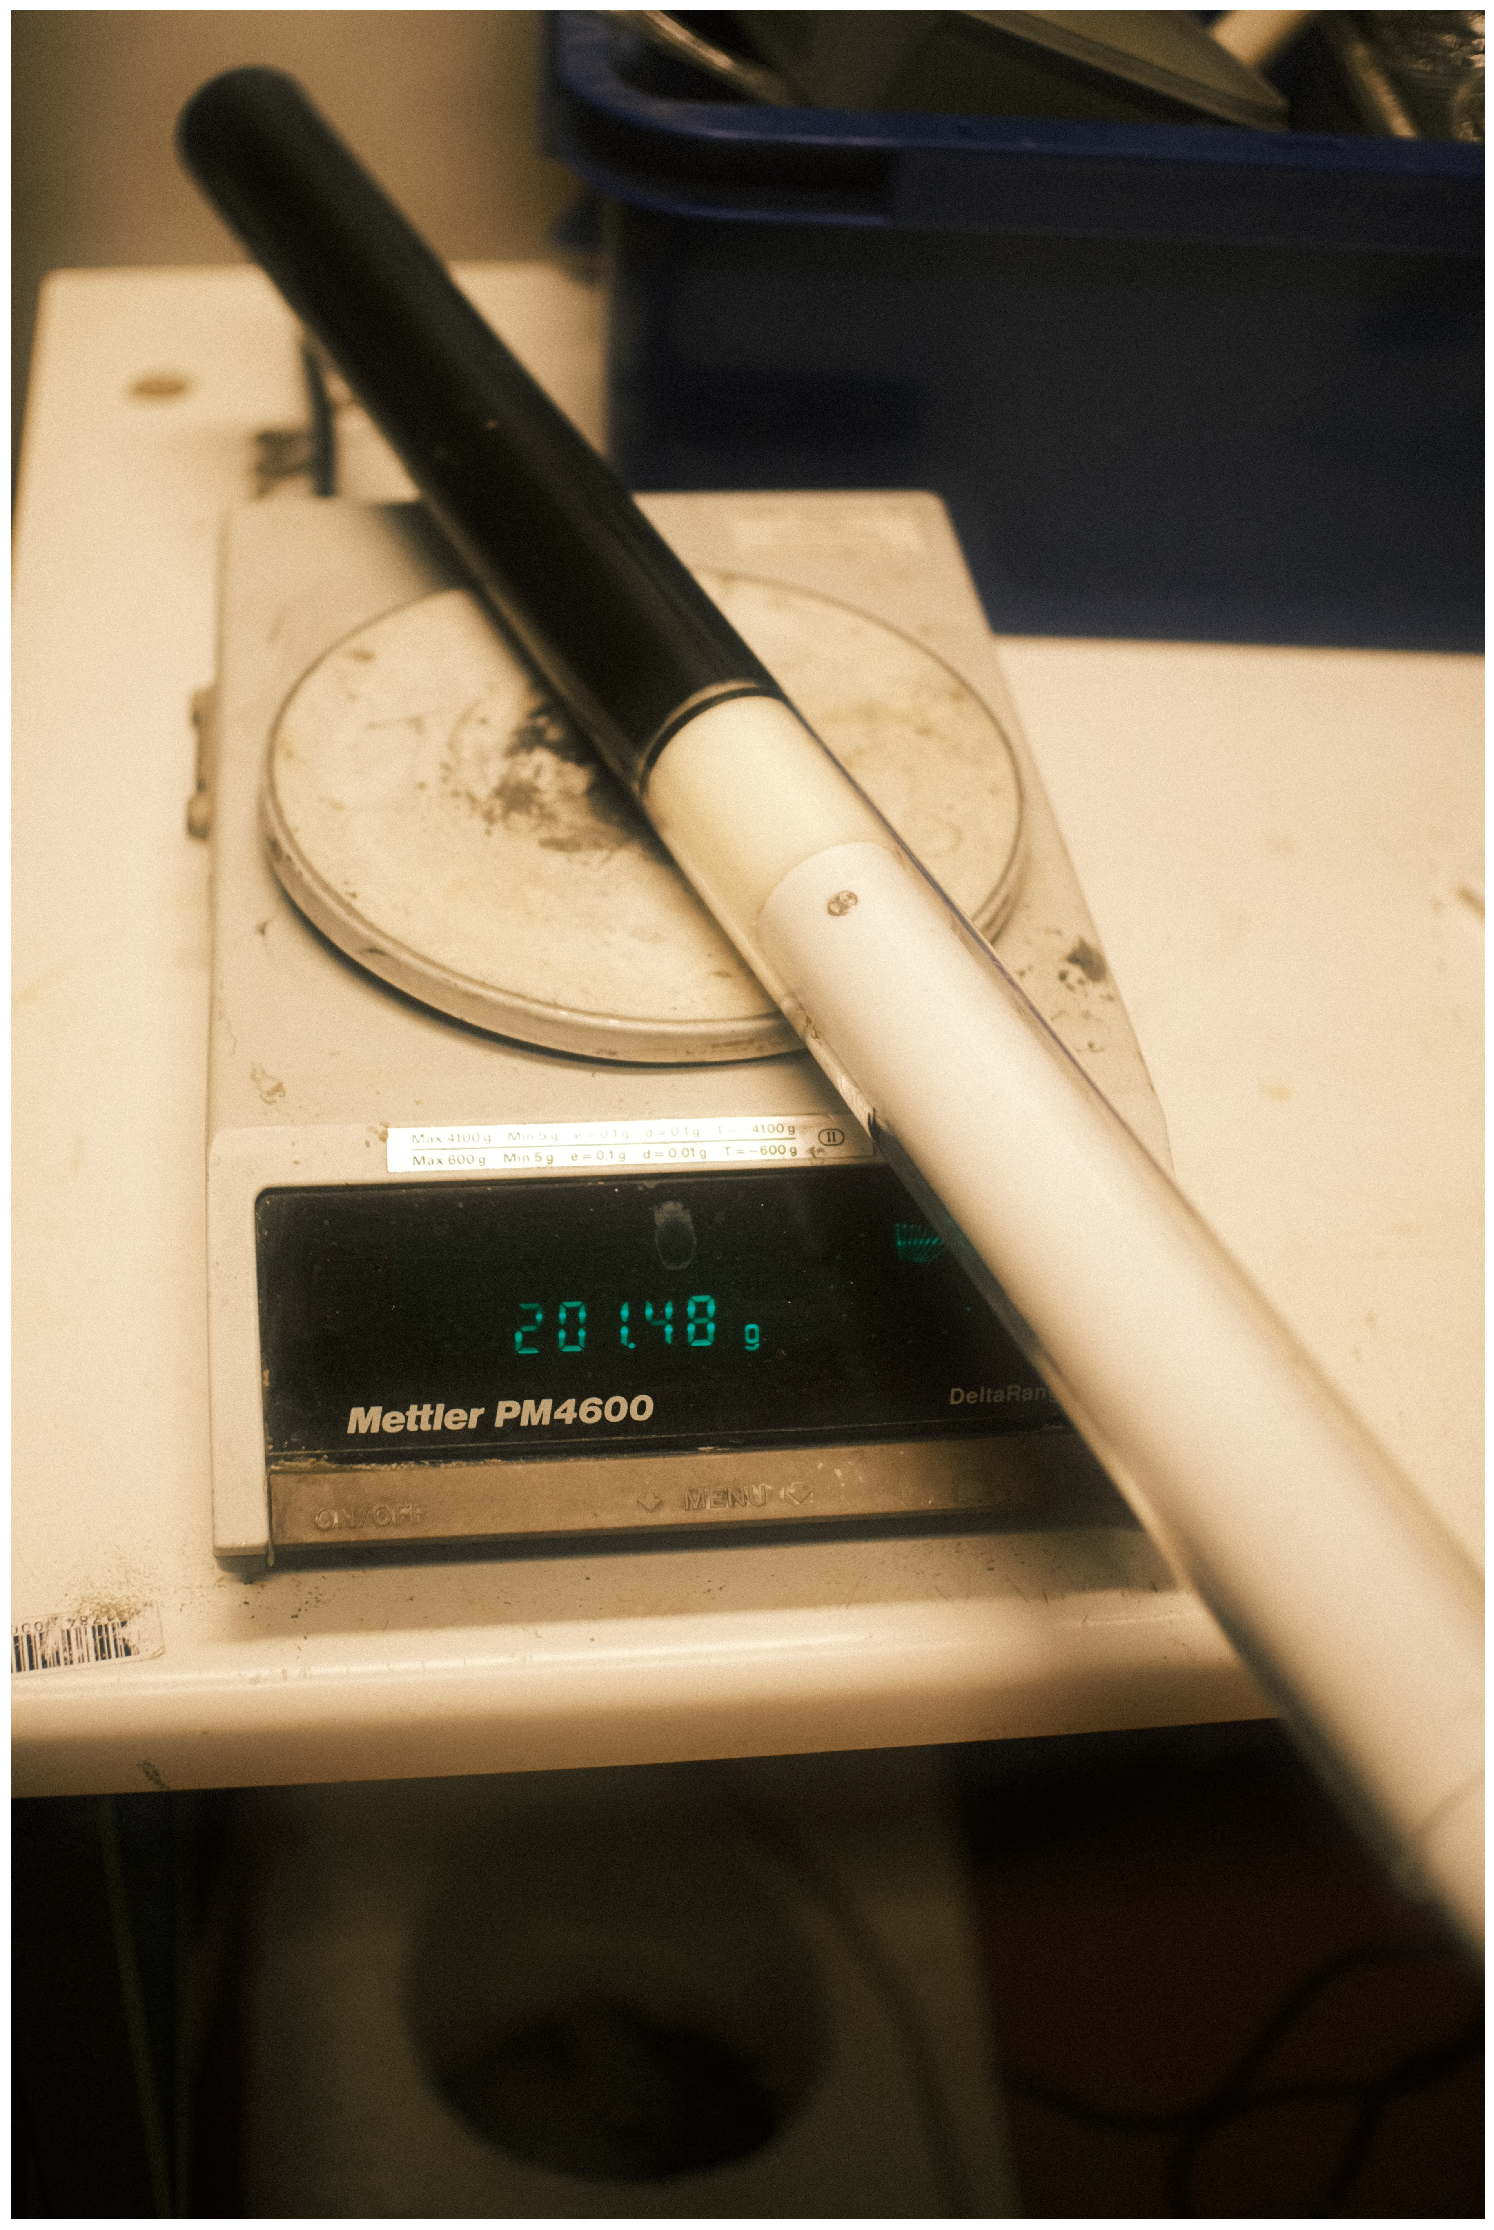
36]. Repeatability and homogeneity within each sample were checked in terms of bulk density, water content and grain size every time a change was made in the reconstitution procedure. The high viscosity of sulphide soil and its tendency to adhere to pouring containers made it challenging to precisely measure the amount of slurry poured into the sample mould. A dedicated “soil syringe” (
Figure 5) was manufactured to extract and pour an exact amount of slurry into the sample mould without any loss. The syringe consisted of a 36 mm inner diameter and 600 mm long plexiglass barrel with a plunger that tightly fit the barrel by a rubber o-ring.
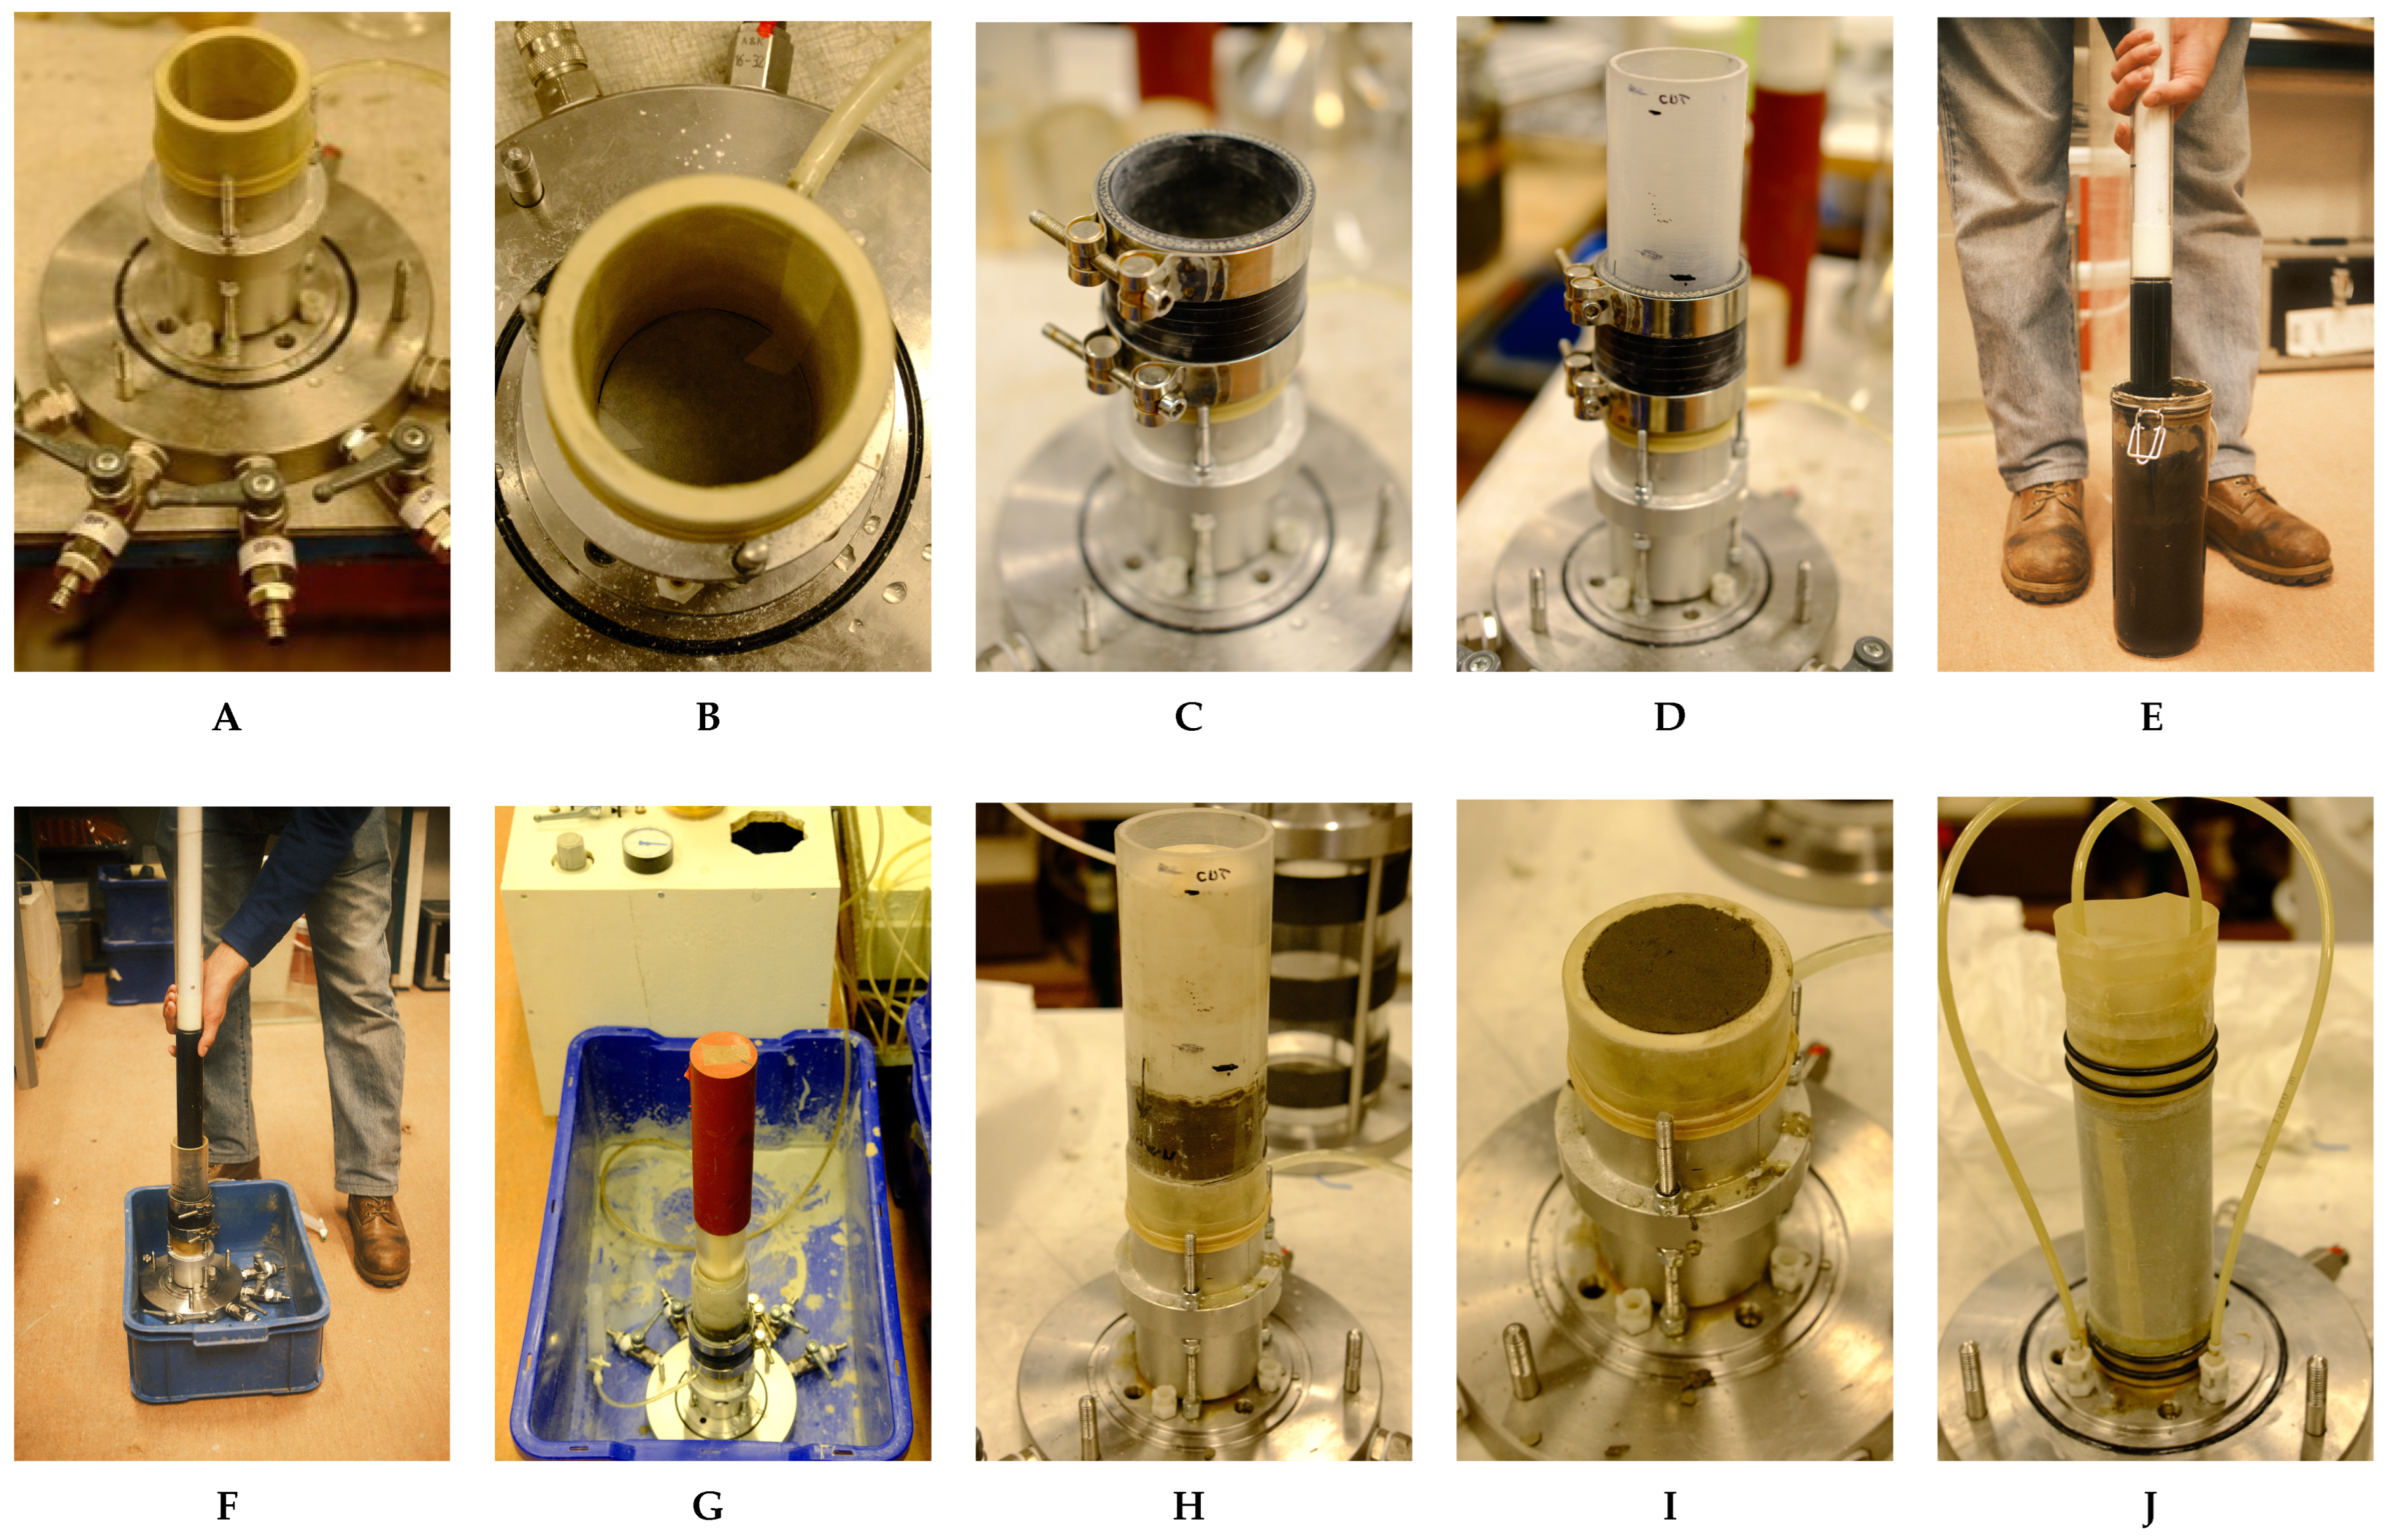
The final adopted sample preparation process is shown in
Figure 6 and described as follows:
- (a)
Assembly of the latex membrane, split mould, and bottom filter onto the triaxial apparatus base plate. Talc powder is applied to the mould exterior to prevent adhesion of the membrane.
- (b)
Three strips of filter paper are placed inside the membrane to enhance drainage and quicken the slurry consolidation.
- (c)
A rubber support with two clamps is fixed to the upper section of the split mould.
- (d)
An extension tube is inserted into the rubber support and secured using the upper clamp.
- (e)
The soil syringe is used to extract the predetermined mass of slurry (
). The outside of the syringe is then cleaned, its weight is checked, and the amount of slurry collected is corrected if needed (
Figure 5).
- (f)
The slurry is then slowly pressed out of the syringe into the mould while simultaneously lifting up the syringe and maintaining the tip at the surface of the poured slurry.
- (g)
A top filter and plug are placed on top of the poured slurry. The slurry is consolidated by adding a surcharge load atop the plug and vacuum pressure at the base. Both the surcharge and vacuum pressures are maintained at levels lower than the minimum confining pressure applied during the triaxial test to avoid overconsolidation. Water is added from the top to ensure that the sample remains fully saturated.
- (h)
Once the defined sample height (h) is reached, the surcharge load and vacuum pressure are removed, and the rubber support and clamps are detached.
- (i)
The soil sample is then cut at the top of the split mould. The remaining part of the sample in the extension tube is used to determine water content and soil density.
- (j)
The prepared sample is mounted onto the triaxial apparatus following the standard procedure.
3.4. Triaxial Testing
Consolidated drained and undrained monotonic triaxial tests were carried out on both intact and reconstituted samples. The initial dimensions of all samples were 10 cm height and 5 cm diameter (2:1). After mounting the sample in the triaxial apparatus, a saturation step was initiated. Nearly all intact and reconstituted samples were close to full saturation from the beginning; however, it was necessary to apply a back pressure of 500 kPa to achieve a target B-value of 95%, reached within a few hours. Back and cell pressure were increased simultaneously, keeping a difference of 10 kPa to ensure stability and avoid expansion of the sample.
After the saturation step, an isotropic consolidation step was performed by increasing the cell pressure to reach the desired consolidation pressure. For the reconstituted samples, a range of cell pressures from 30 to 200 kPa was selected to define the critical state line at various points. The intact samples were isotropically consolidated to the target confining stress within a similar range as that of the reconstituted samples. Primary consolidation was considered complete once the excess pore water pressure due to the consolidation stress had dissipated, as recommended in [
37].
Shearing was conducted at a constant strain of 0.01 mm/min. This rate was found to be suitable for drained testing, preventing pore pressure build-up, while also being sufficiently slow for undrained testing, allowing ample time for the pore pressures to even out within the sample. Pore pressure within the sample was constantly measured during all steps of the triaxial test, both for CU and CD tests. Sample height was monitored by an external LVDT. The sample area was derived from the measured axial and volumetric strains, considering the sample deforming as a right cylinder. The use of frictionless end-caps was not available.
3.5. Isotropic Consolidation
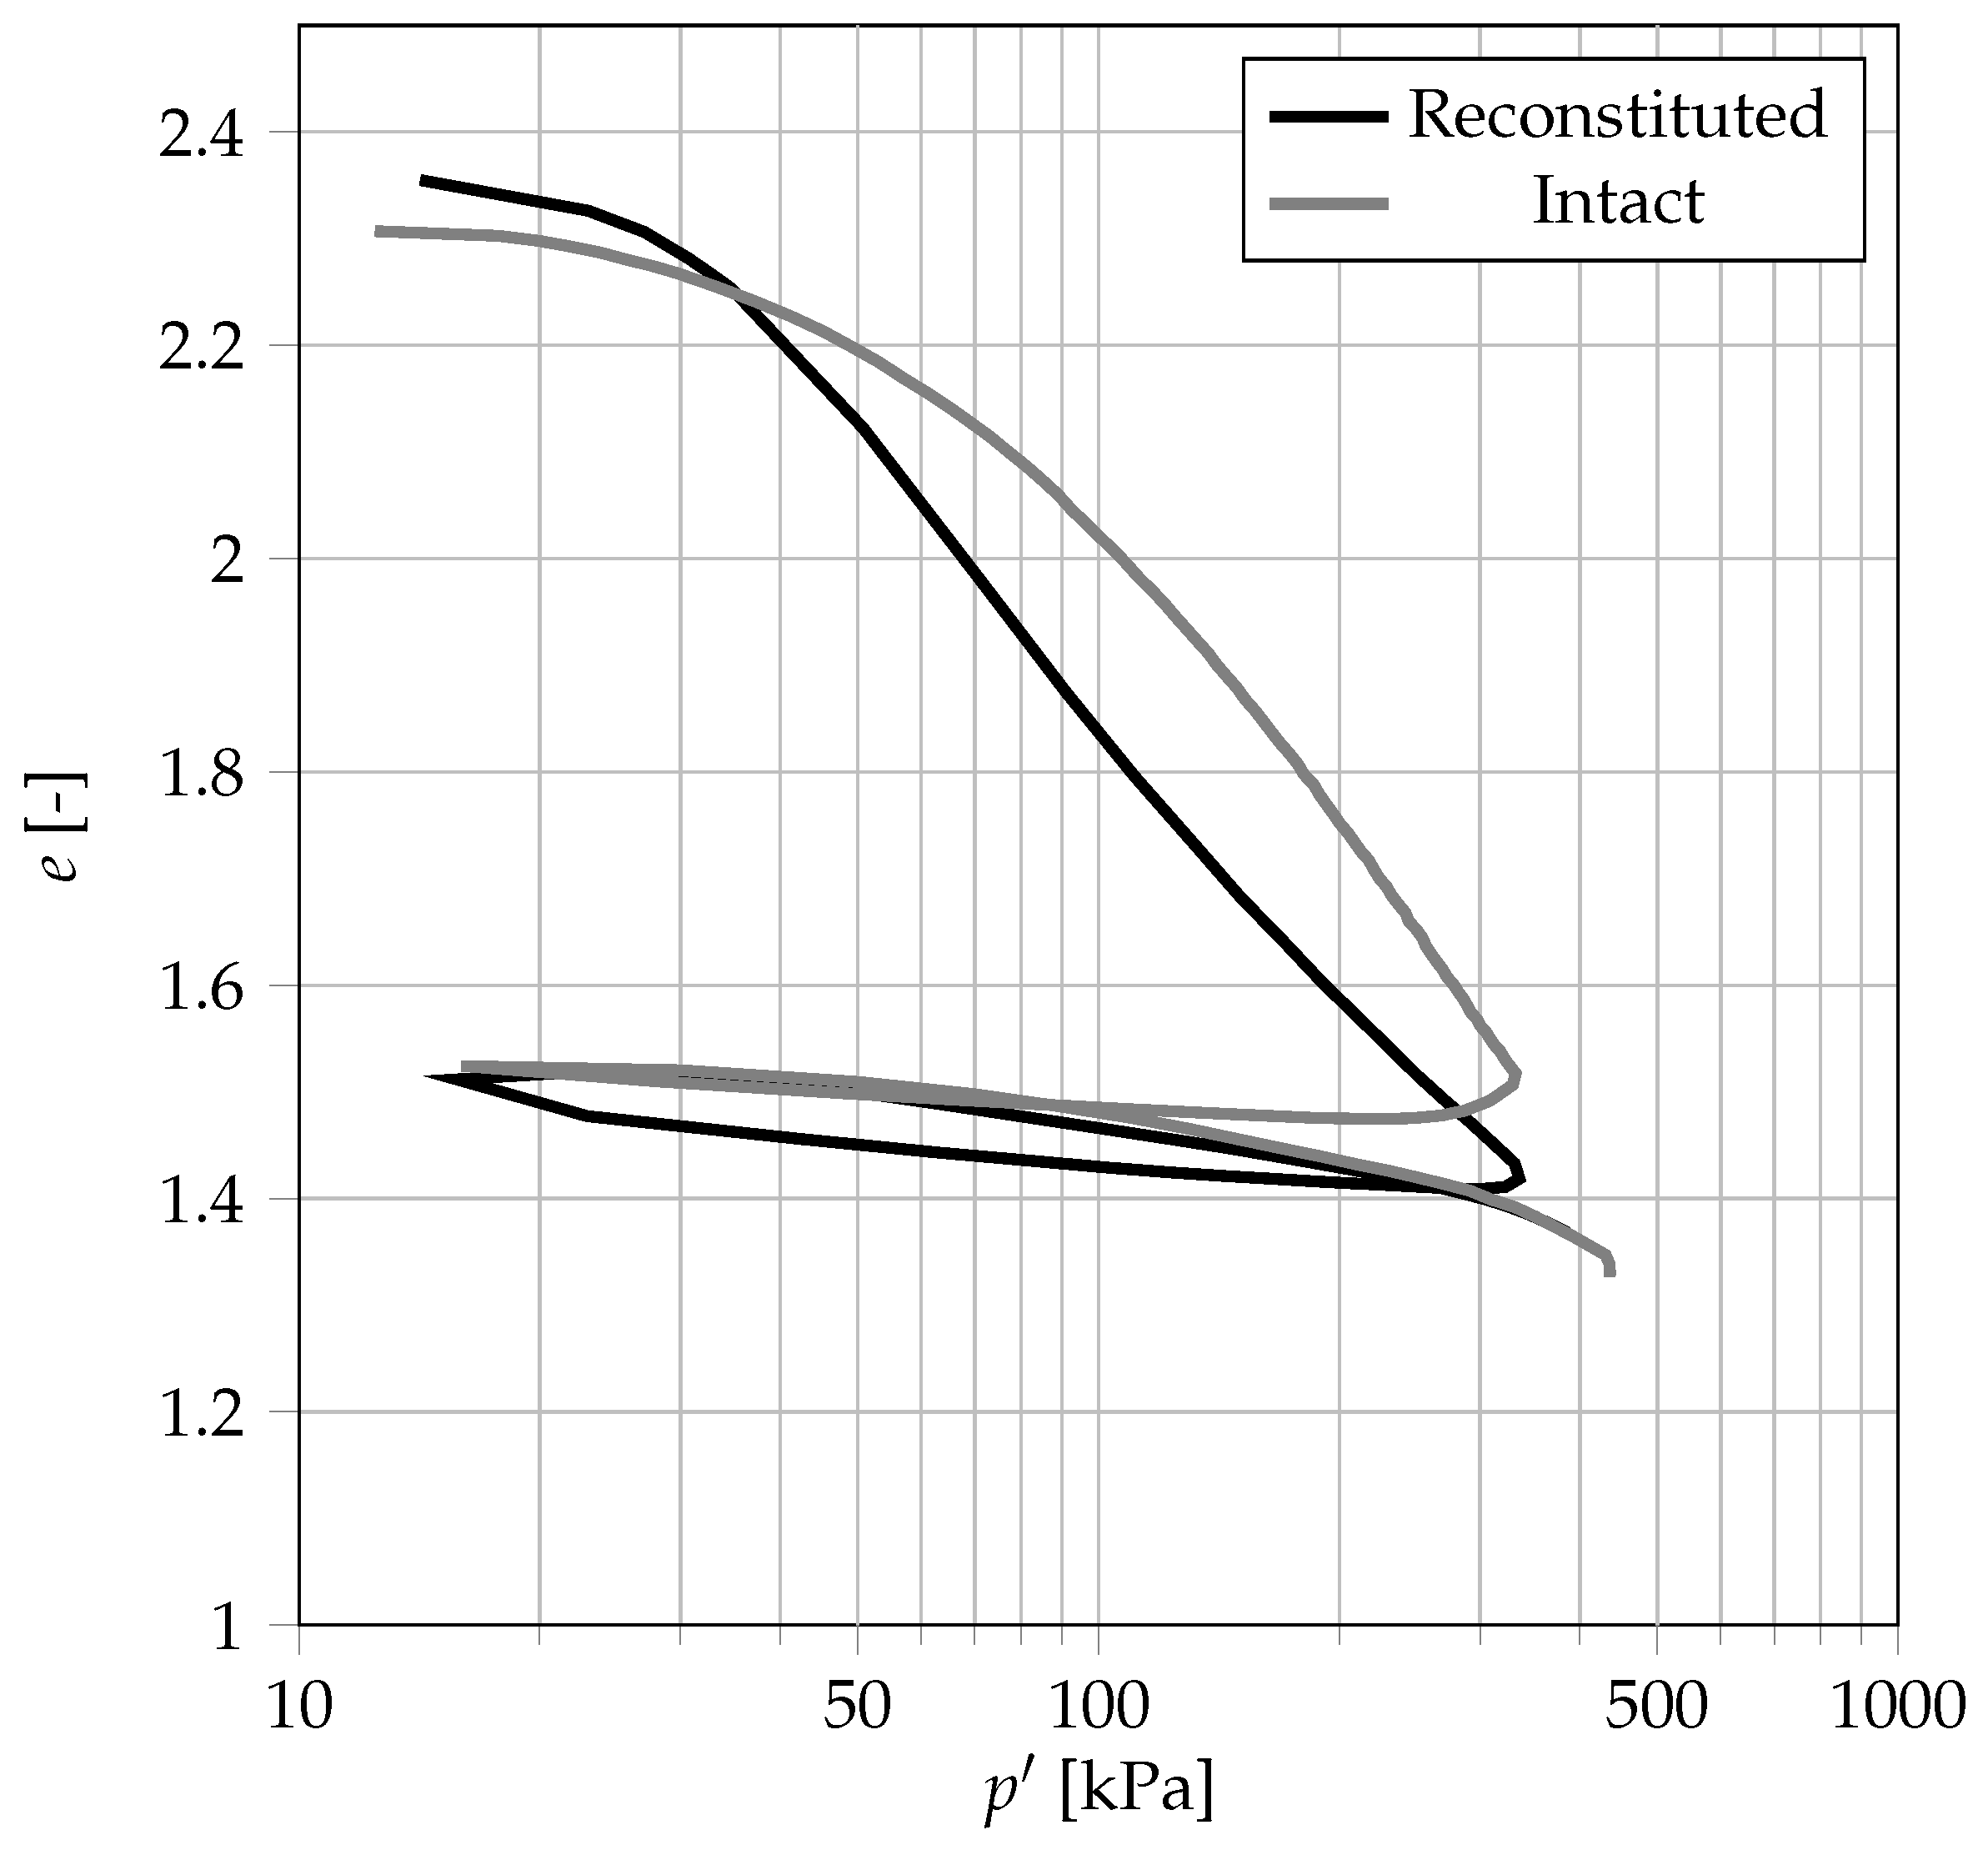
Due to the likelihood of inducing disturbances during the preparation and mounting of a reconstituted sample in an oedometer, the isotropic compression test was preferred for the comparison of the consolidation behaviour of intact and reconstituted samples. The samples were mounted in the triaxial cell and the same procedure as for triaxial testing of the samples was followed until reaching the consolidation step. The isotropic consolidation started by increasing the confining pressure until 320 kPa, followed by unloading to the saturation stress, and finally a re-load step to a 430 kPa confining pressure. The stress changes were performed at a constant rate of 0.002 kPa/s, ensuring that no excess pore pressure was induced.
5. Discussion
The suitability of reconstituted samples for studying the mechanical behaviour of sulphide soil is closely tied to the applied reconstitution method. In this study, the slurry deposition method was selected and modified to suit unoxidised sulphide soil reconstitution. Using the soil syringe when preparing reconstituted samples improved both the accuracy and precision when targeting specific initial conditions. The targeted initial conditions for the reconstituted samples were selected as the average of the intact samples mainly to serve as proof that precise initial condition values could be matched. It was also supported by the even particle size distribution of the intact samples along the depth of the deposit. The presented results show that the initial conditions of the reconstituted samples indeed matched the targeted values. This suggests that, for future studies, the initial conditions of the sulphide soil at each particular depth could be matched if needed.
The sulphide soil used for evaluating the applicability of the slurry deposition method was from one specific deposit. Considering sulphide soil regional variations, it is recommended to assess the suitability of the method following a procedure like the one presented in this study.
Despite careful handling of the intact samples, there might be signs of potential sampling-induced disturbances. As mentioned, three tubes with samples were obtained from each metre sampled. The outliers observed in the preconsolidation pressure and stress–strain response results, indicating heavy overconsolidation, belonged to the middle sample tube of each sampled metre. Considering how the piston sampler operates, the sampled soil passes through the aligned tubes and the friction against the tube walls could induce enough additional compressive stress to consolidate the soil. Consequently, the top tube was often not filled. A piston sampler with rotating head, e.g., the standard St:II, would have mitigated this sampling disturbance since it has been proven to deliver better-quality samples of sulphide soil [
8,
13], but it was not available for this project. Sampling-induced disturbances are not uncommon in sulphide soil investigations for practical applications. The severity of these disturbances is strongly affected by the sampling method, field technicians, type of sulphide soil, transport, and storage and handling of the samples. The effects of minor disturbances are what, to some extent, produces the scatter found in laboratory results from sulphide soils. Samples with higher degrees of disturbance usually display non-reasonable results and can be discarded. As an example, the intact sample from a 2 m depth tested at 40 kPa showed a much different CD behaviour, as well as displaying a much higher preconsolidation pressure. Obtaining fully intact samples of sulphide soil is virtually infeasible. The intact samples used for the CU test and the majority of the samples used for the CD test did not show signs of severe disturbances, and their results demonstrated the expected scatter from tests on intact sulphide soil samples, making them suitable for comparison.
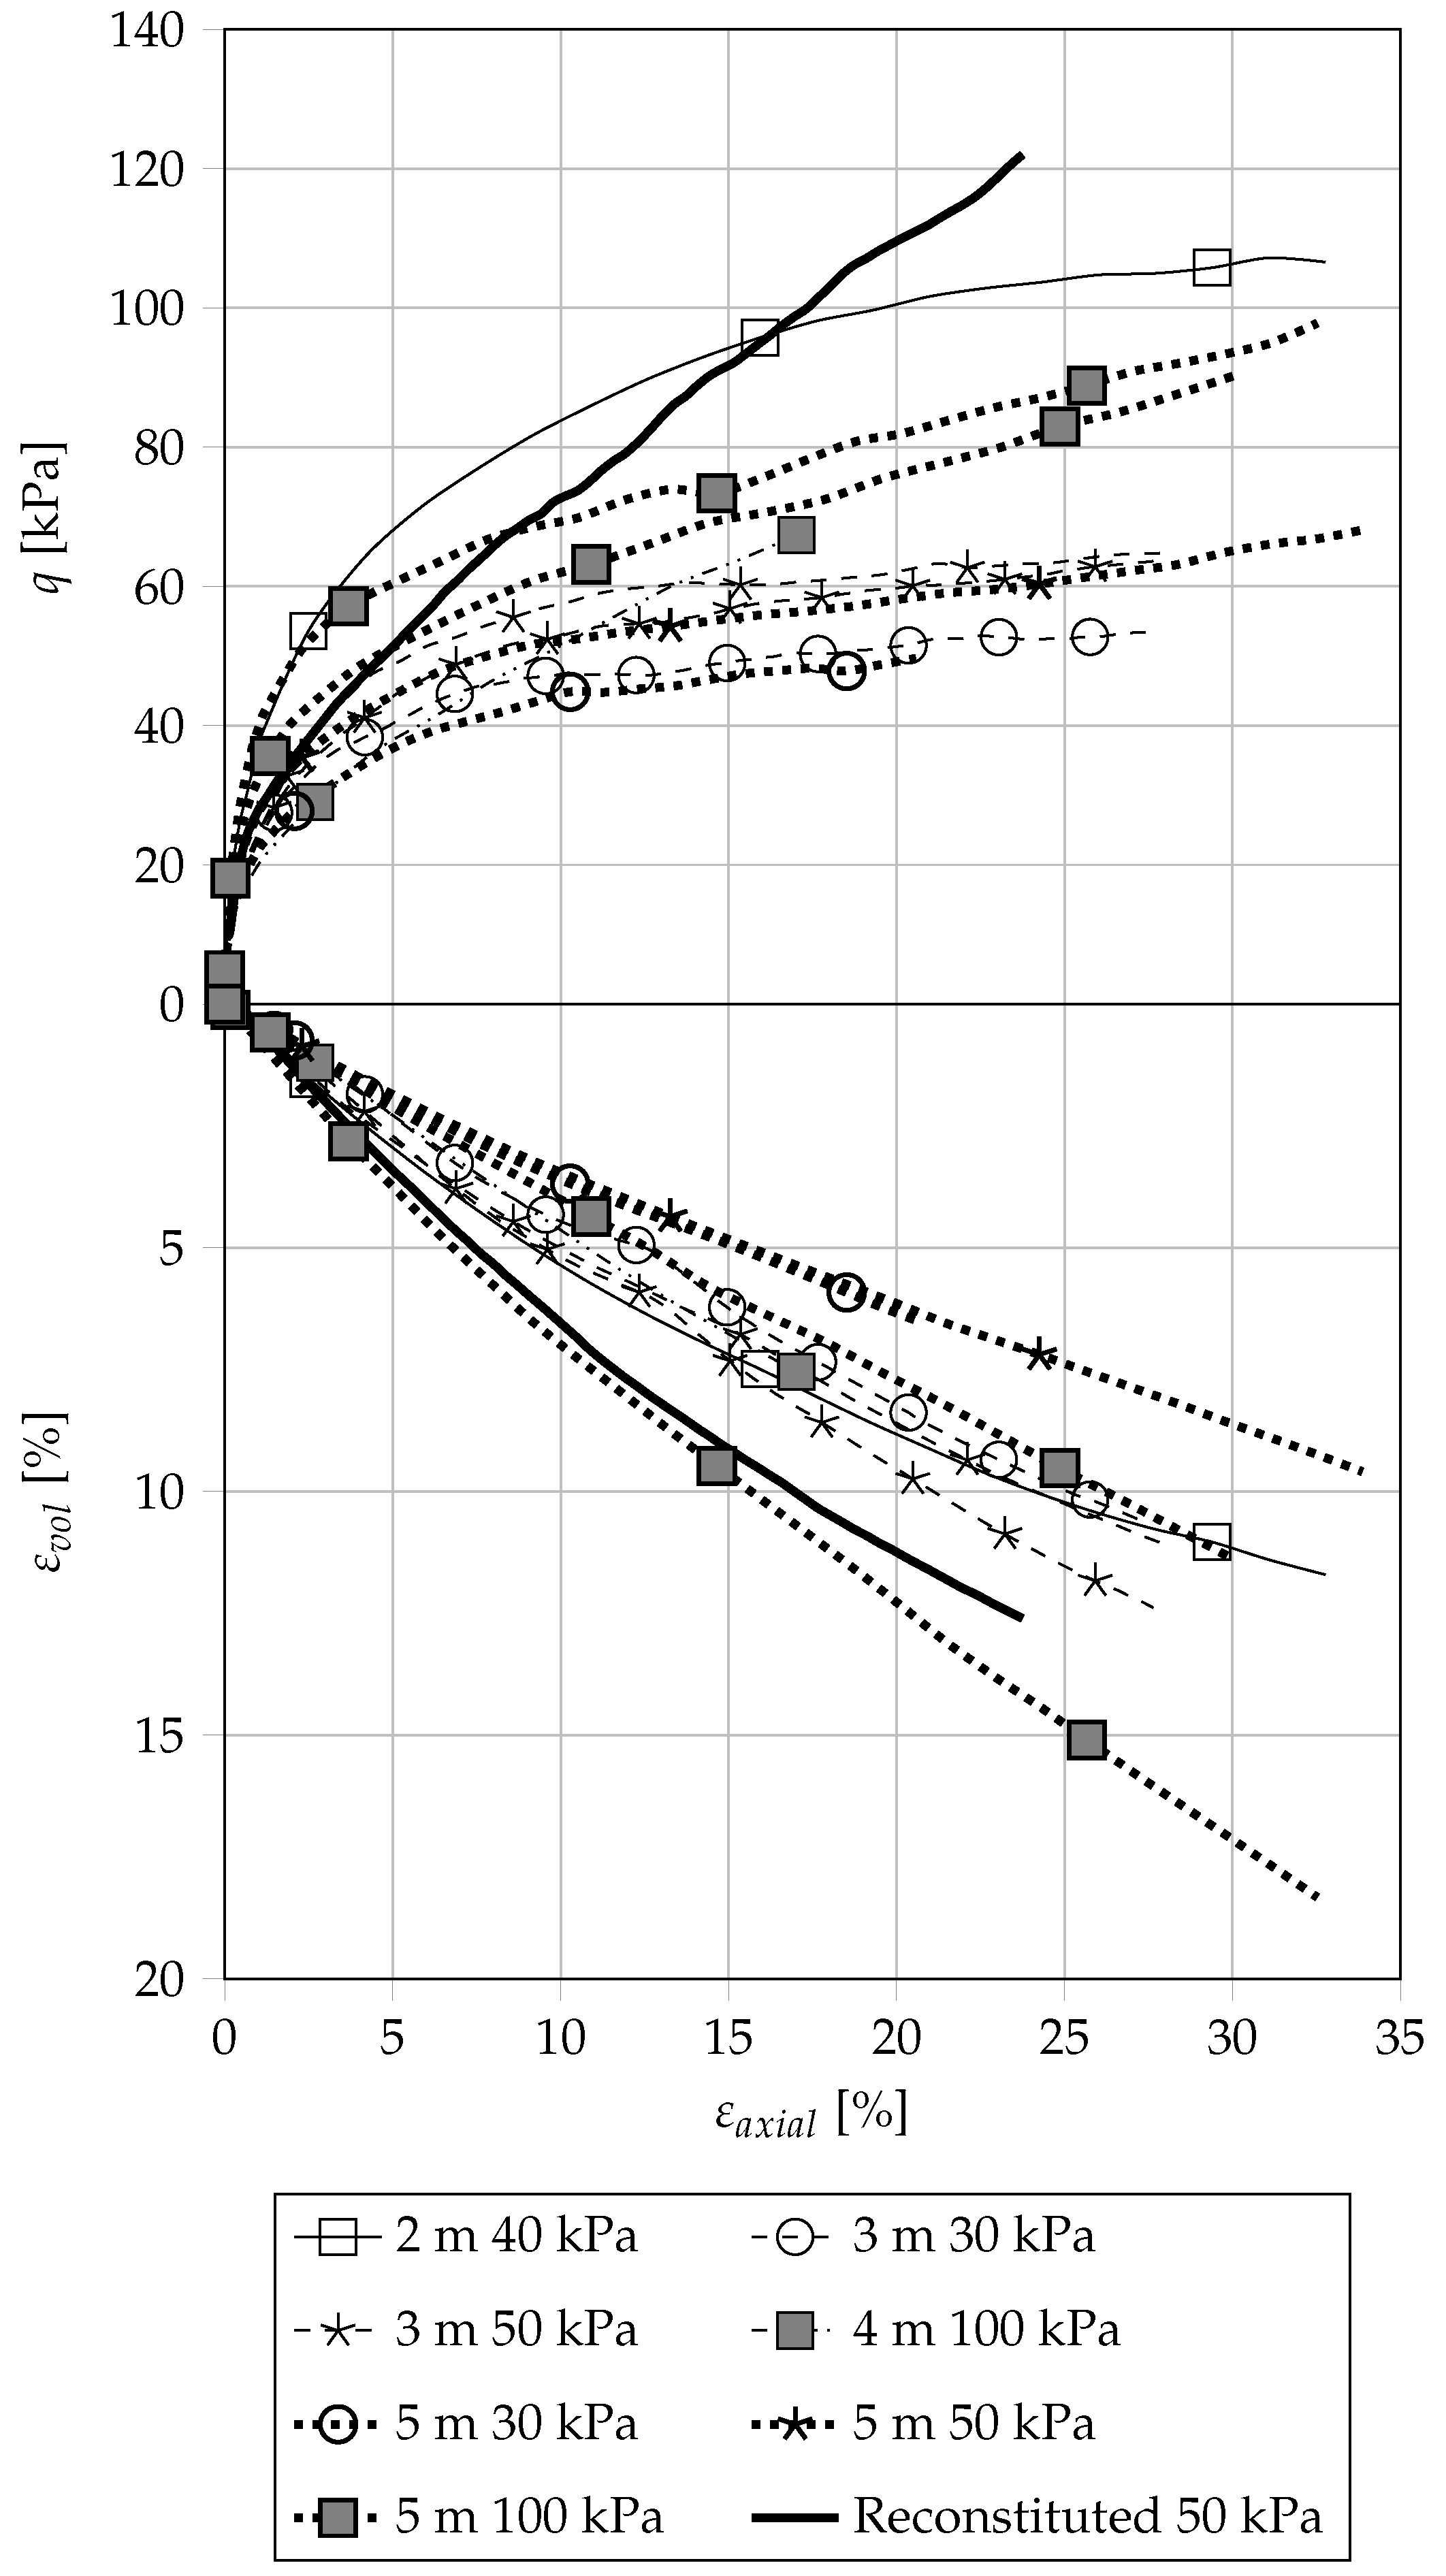
Despite the fact that CD triaxial tests were carried out until reaching large axial strains (some reaching the physical limit of the equipment), no sign of stabilisation to a constant
was observed. After 5–10% of
, there was a linear increase in
q for most samples tested, implying a dependency of
on
. This behaviour was previously observed for sulphide soil [
1] and in other studies on peat [
38,
39]. The impossibility of reaching critical state during drained shearing is attributed to the high compressibility of sulphide soil, leading to consolidation during shearing. As stated in [
39], a common practice for peat exhibiting this kind of behaviour is to define an arbitrary failure at
. However, the representativeness of this approach in relation to field conditions and its applicability to sulphide soil is not clear and requires careful consideration if it is to be used. The reconstituted sample followed the same
path as the intact samples tested at the same confining pressure until
= 4–5%, after which the path continued in a straight line with much greater inclination. This is an indication that the reconstituted sample underwent greater consolidation during the shearing stage than the intact samples, possibly attributed to the different stress history of the two sets of samples. The intact sample from 4 m tested at a 10 kPa confining pressure showed the closest behaviour to the reconstituted sample. Considering that the reconstituted sample was normally consolidated, the OCR value might play a role in the rate of the
q linear increase. With only one sample showing this behaviour, further testing is needed to prove the effects of the OCR. The obtained values of
from the reconstituted sample were in the same range as those from the intact samples. The closest match in the value of
between reconstituted and intact samples was with the 4 m depth sample. Despite two samples being around OCR = 1, cell pressure seemed to have a greater effect on the values of
for intact samples with OCR > 1, with higher cell pressures leading to higher values of
.
In summary, CD triaxial tests were considered unsuitable for the derivation of critical state parameters of sulphide soil in the present study. However, there are published results on monotonic drained triaxial tests on sulphide soil with stress paths reaching critical state, e.g., [
36,
40]. The main difference found was that the sulphide soils tested in those studies had a different particle size distribution than the sulphide soil tested in the present work. The inability to reach critical state led to the decision to not continue with CD triaxial tests on reconstituted samples for this study, but CD triaxial tests should not be ruled out if the reconstitution method is applied to other sulphide soils.
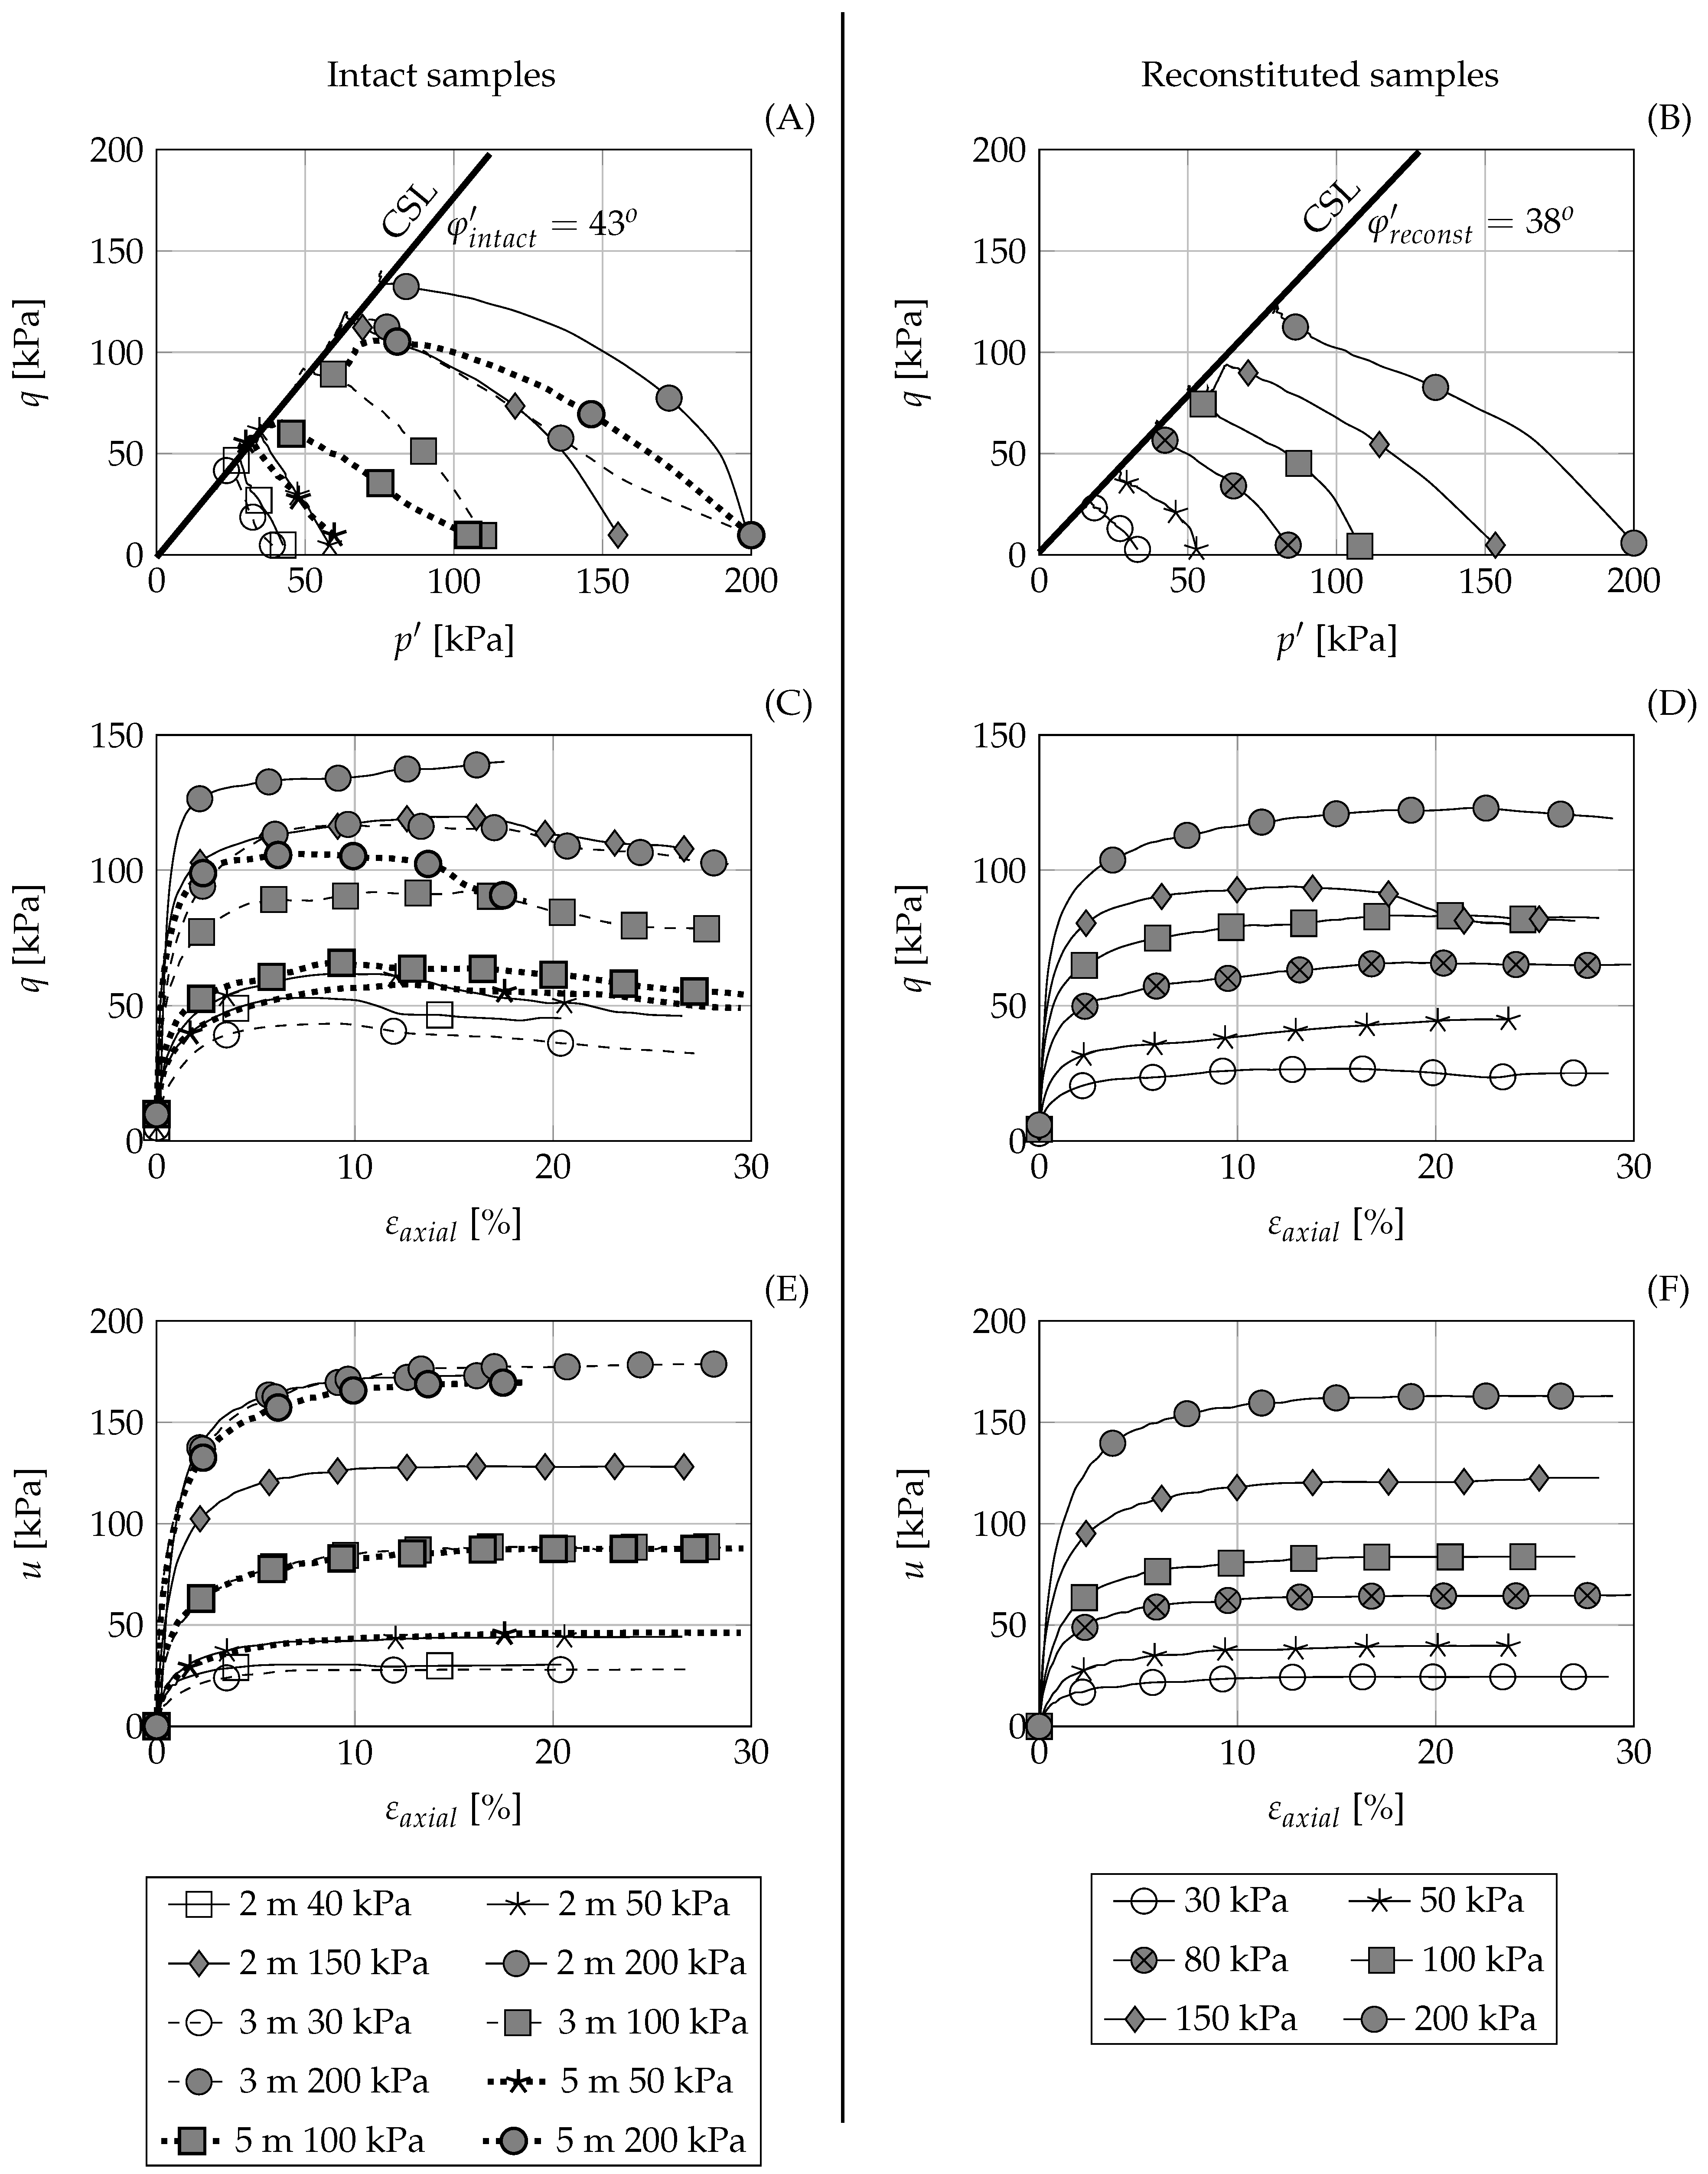
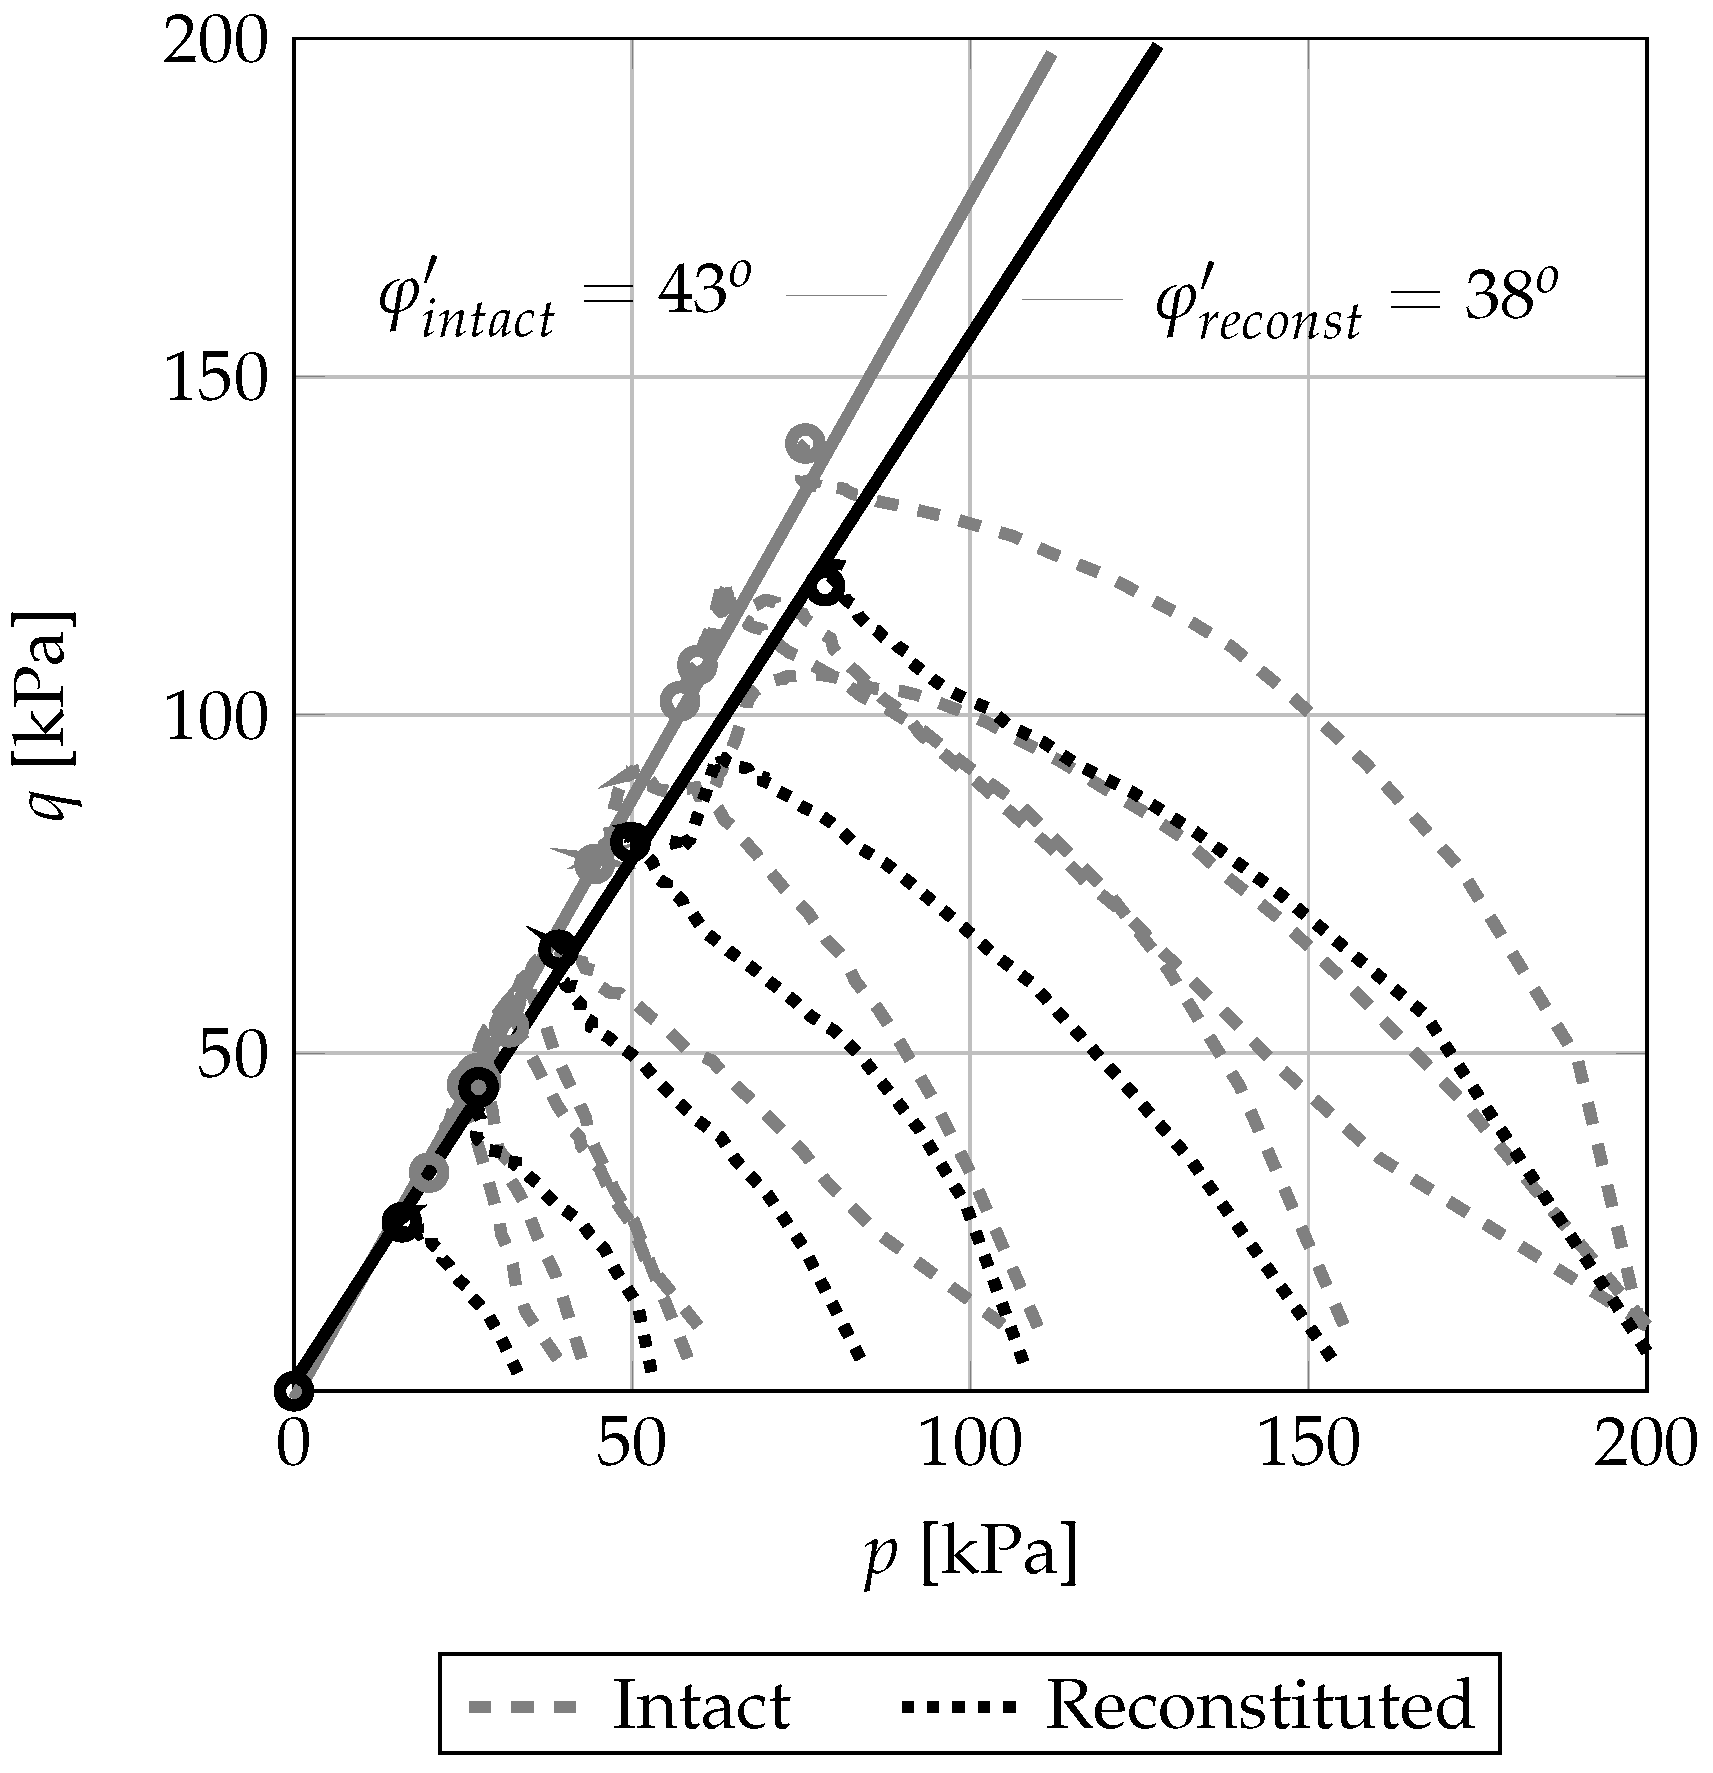
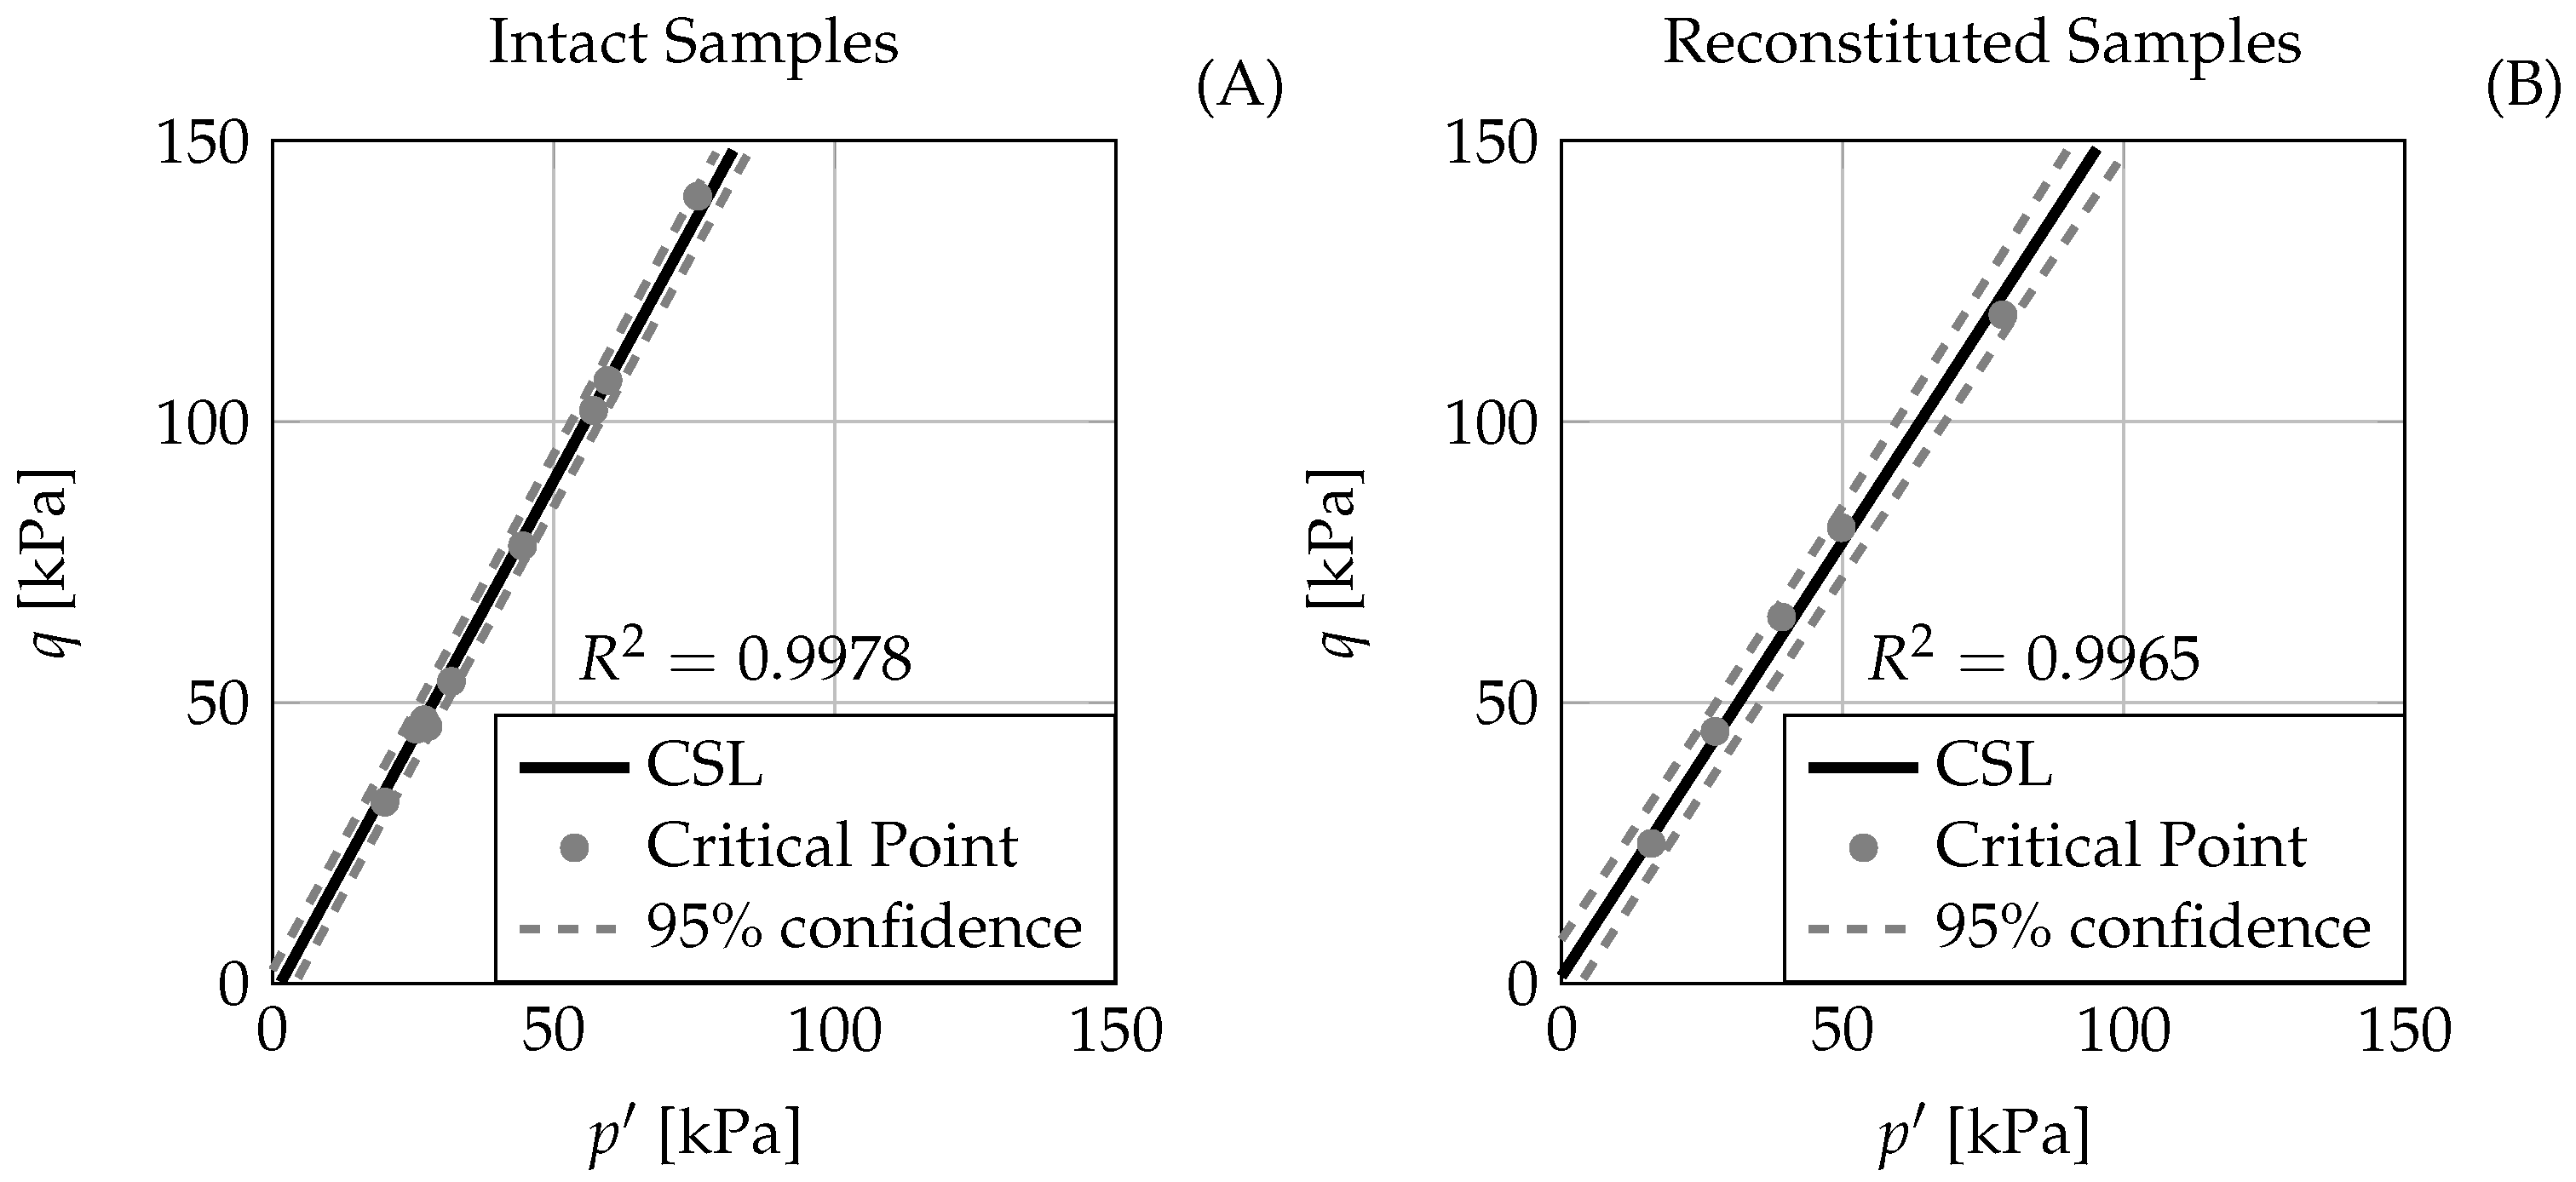
The results from the CU triaxial tests on both types of samples reached critical state and were suitable for the derivation of strength parameters. The relatively close proximity of the derived CSLs in the plane from each of the two sets of samples indicates that the slurry deposition method is capable of reproducing the strength–strain behaviour of the intact samples. The difference of the two critical state lines is attributed to:
Sampling disturbances induced by the piston sampler.
The different stress histories of the samples.
The slight anisotropy of the in situ samples from horizontal banding of the soil fabric.
The value of
obtained from the CU triaxial tests appeared high for this soil type. Expected
values are in the range of
–
, depending on factors such as grain size or organic content. For example, the sulphide soil tested in [
36] had
with 30% sand content; on the other hand, the sulphide soil in [
40] had
with a clay content of around 20%, both derived by CD triaxial tests. Similar results from CU tests on sulphide soil from the same region with high
were reported in previous studies [
1,
6,
8]. Surprisingly high values of
have also been observed in studies on other soils with significant organic content, high creep rates, or high water content, such as peat [
39] and soft organic Dutch soils [
41]. This effect can be attributed to a large development of
u during the shear step of the test due to the significant creep tendency of the soil and high water content. Thus, the minor principal effective stress (
) tends to 0 at critical state, making the test conditions closer to an unconfined compression test. For the extreme case of
, the inclination of the CSL will be
and
. Values of
u at critical state were often 80–90% of the confining pressure for the intact samples, and around 80% for the reconstituted samples (
Table 2). Reconstituted samples showed marginally higher compressibility in the isotropic consolidation tests, resulting in a lower
e for the same confining stress and, therefore, reducing the water content. This could be one of the reasons for the lower
derived from the reconstituted samples in comparison to the higher
seen in the intact samples. A recommendation for Dutch soft soils [
41] exhibiting unexpectedly large values of
is to determine
at
= 2–5%. For the tested soil, the effective friction angle ranged from
and
at
to
and
at
. Although it provides more reasonable values, this recommendation has not been tested for sulphide soils, and the great variation in
in such a small range of
indicates that this recommendation should be applied with care.
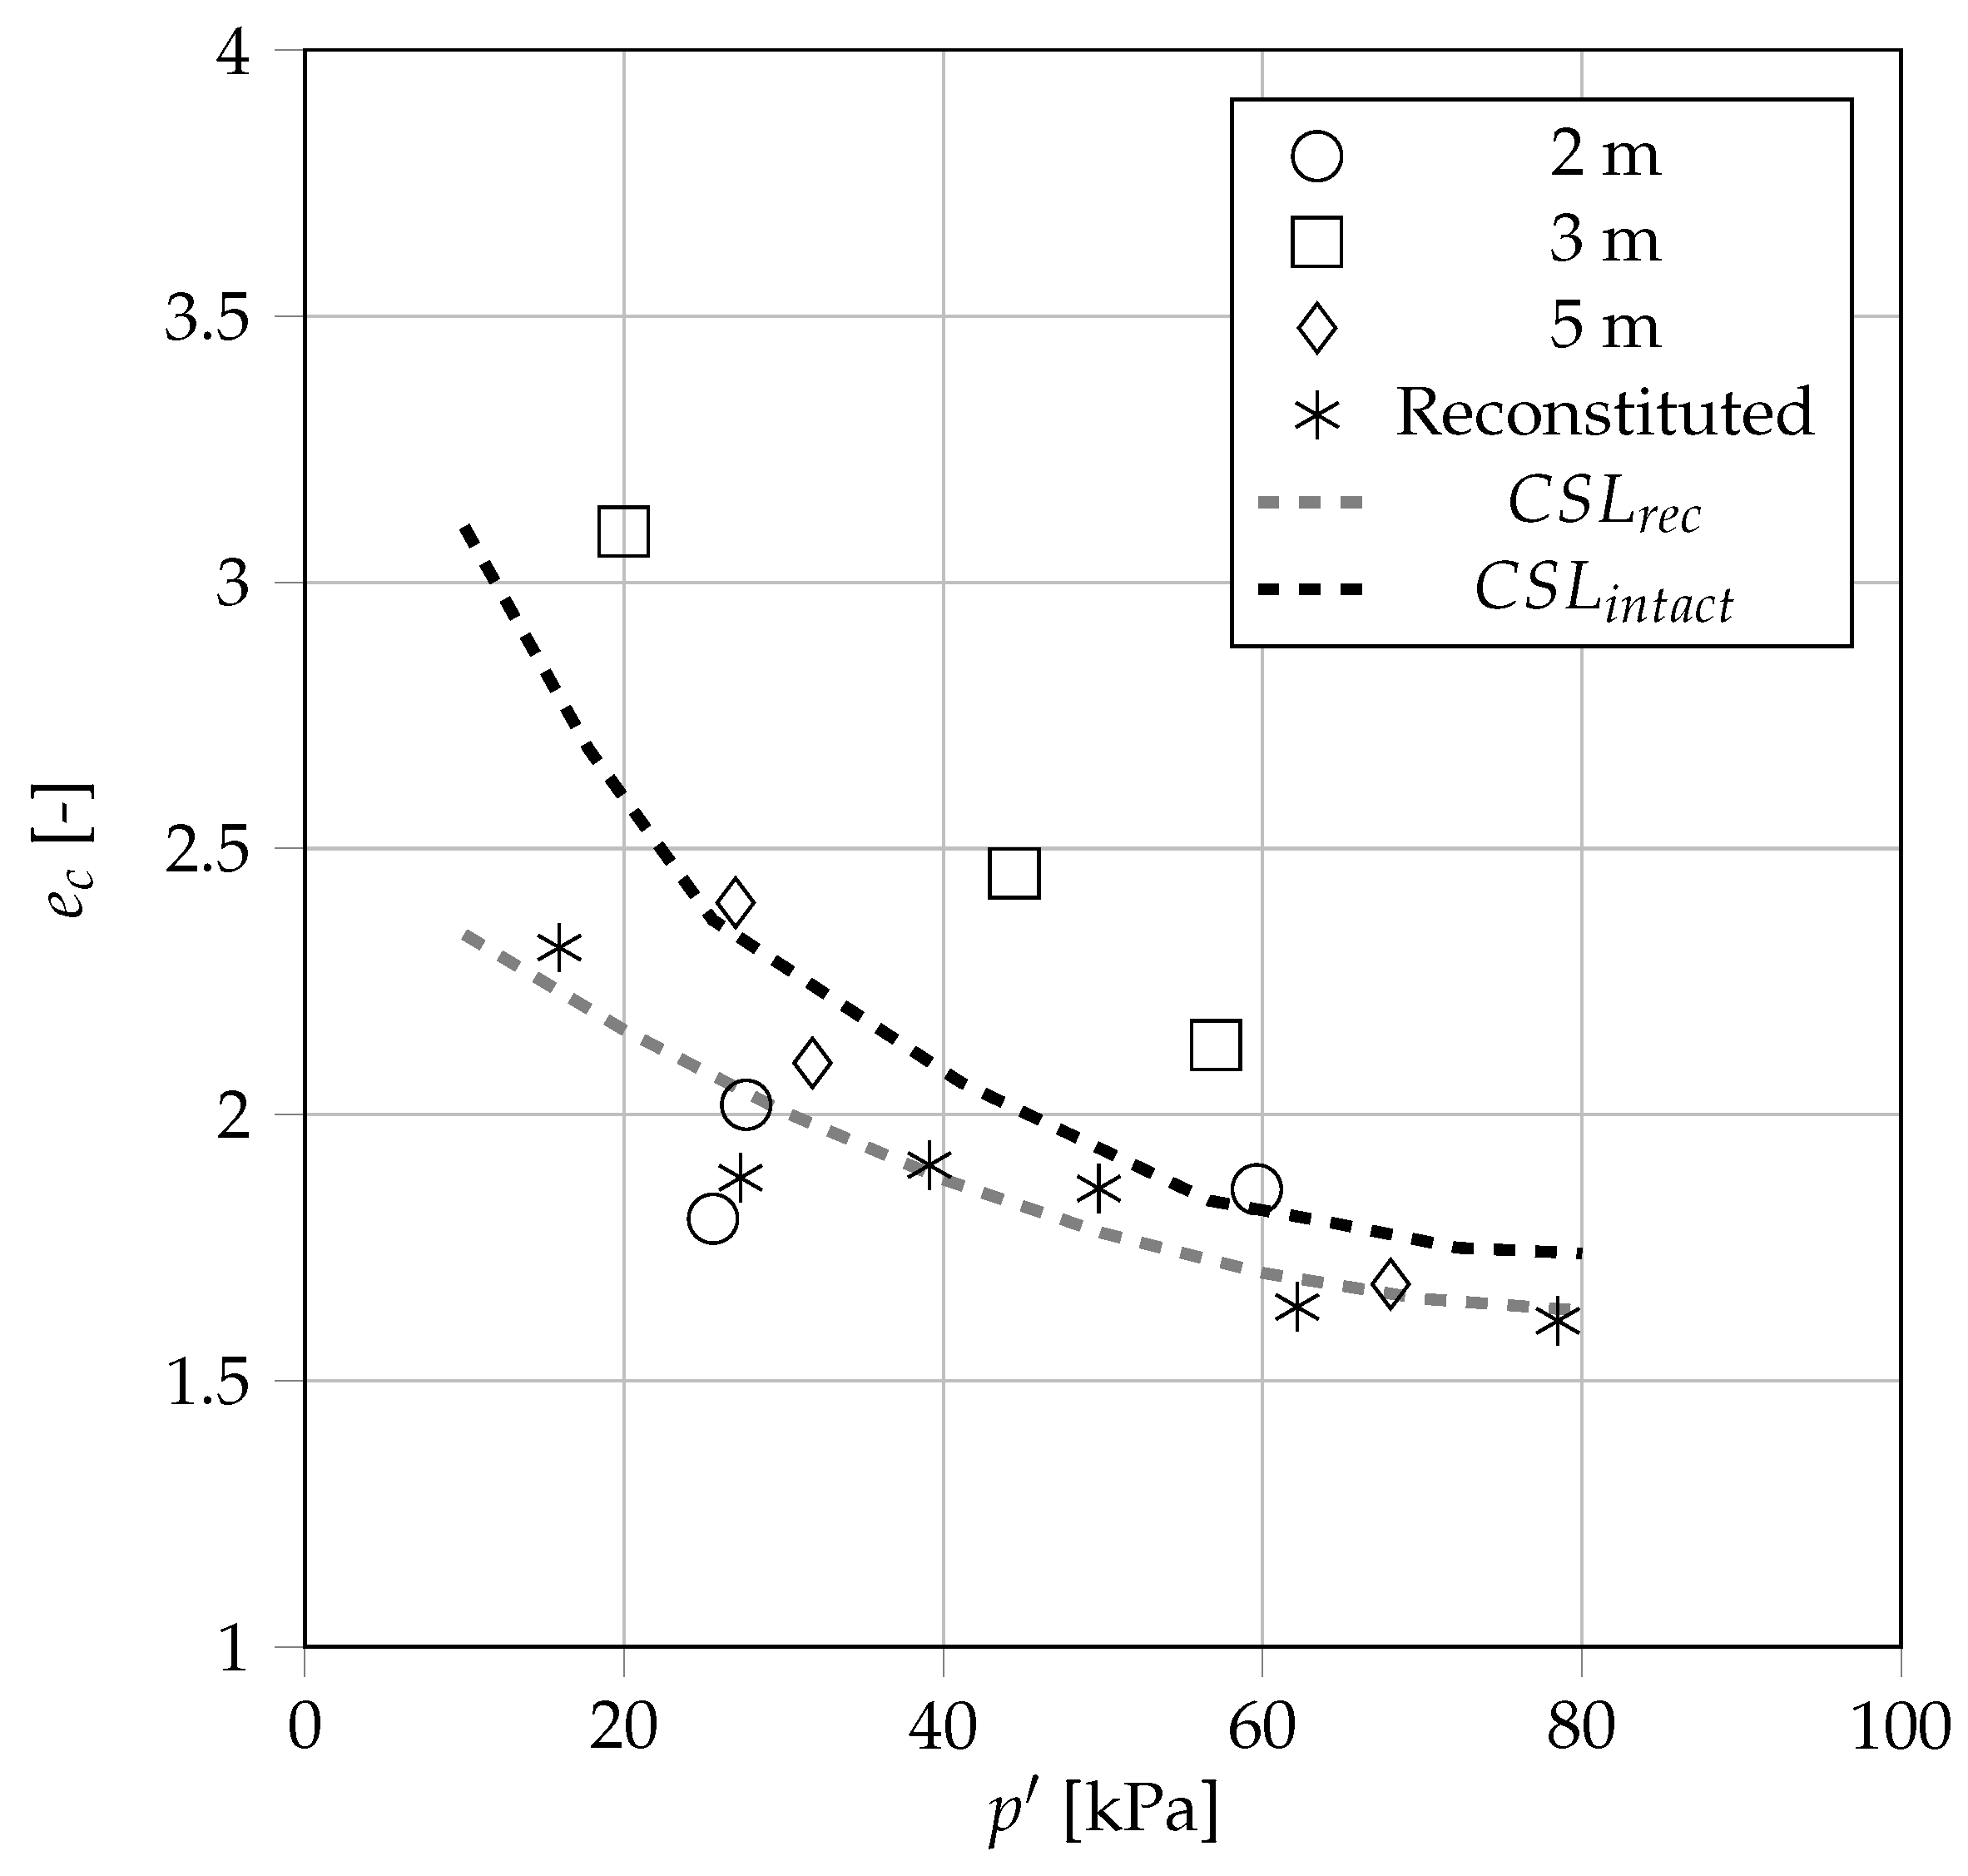
Deriving CSL lines in the plane was not as clear as in the plane. A CSL with acceptable agreement to the critical points could be derived for the reconstituted samples. Fitting a CSL for the intact samples resulted in a poor correlation, derived from the great scatter in the results. With the resulting low correlation parameters, it cannot be said that the derived CSL represents the intact data set. While the majority of the intact samples resulted in values of in the vicinity of the CSL fitted for the reconstituted samples, intact samples from a 3 m depth had a consistently higher . This is another example of the interpretation problems related to the large scatter in laboratory results from intact sulphide soil samples, and how reconstituted samples can help to minimise this.
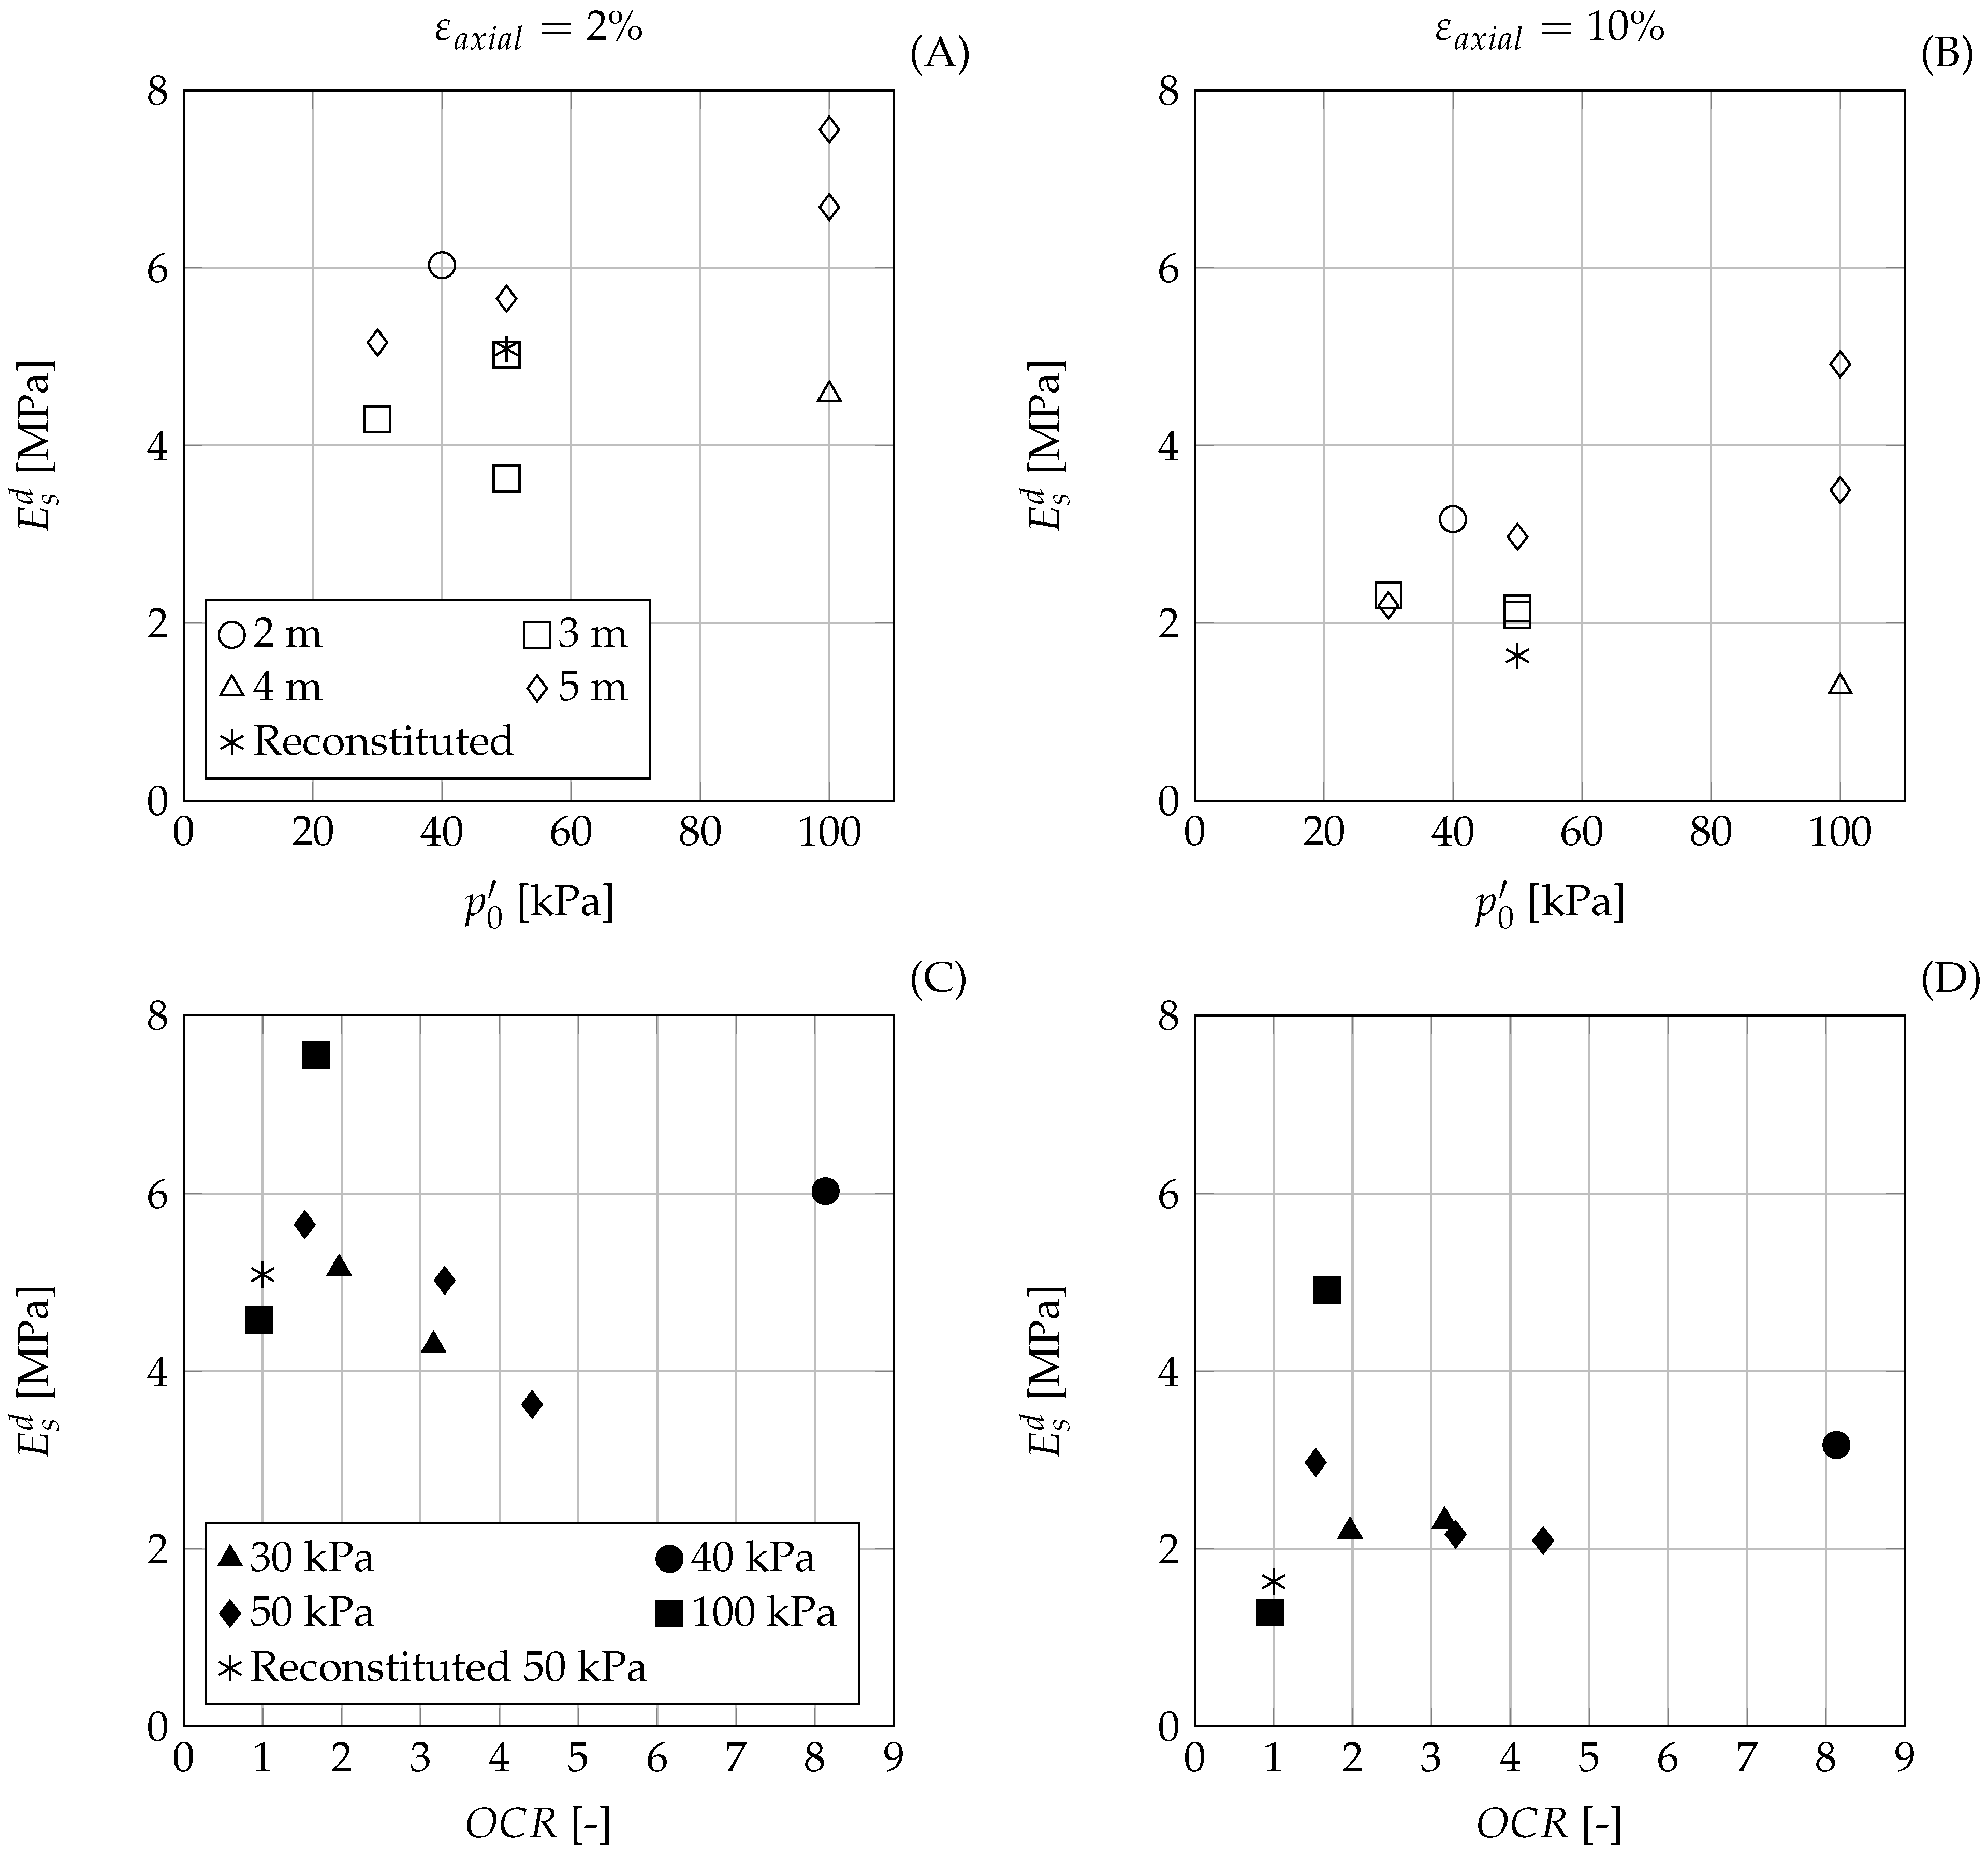
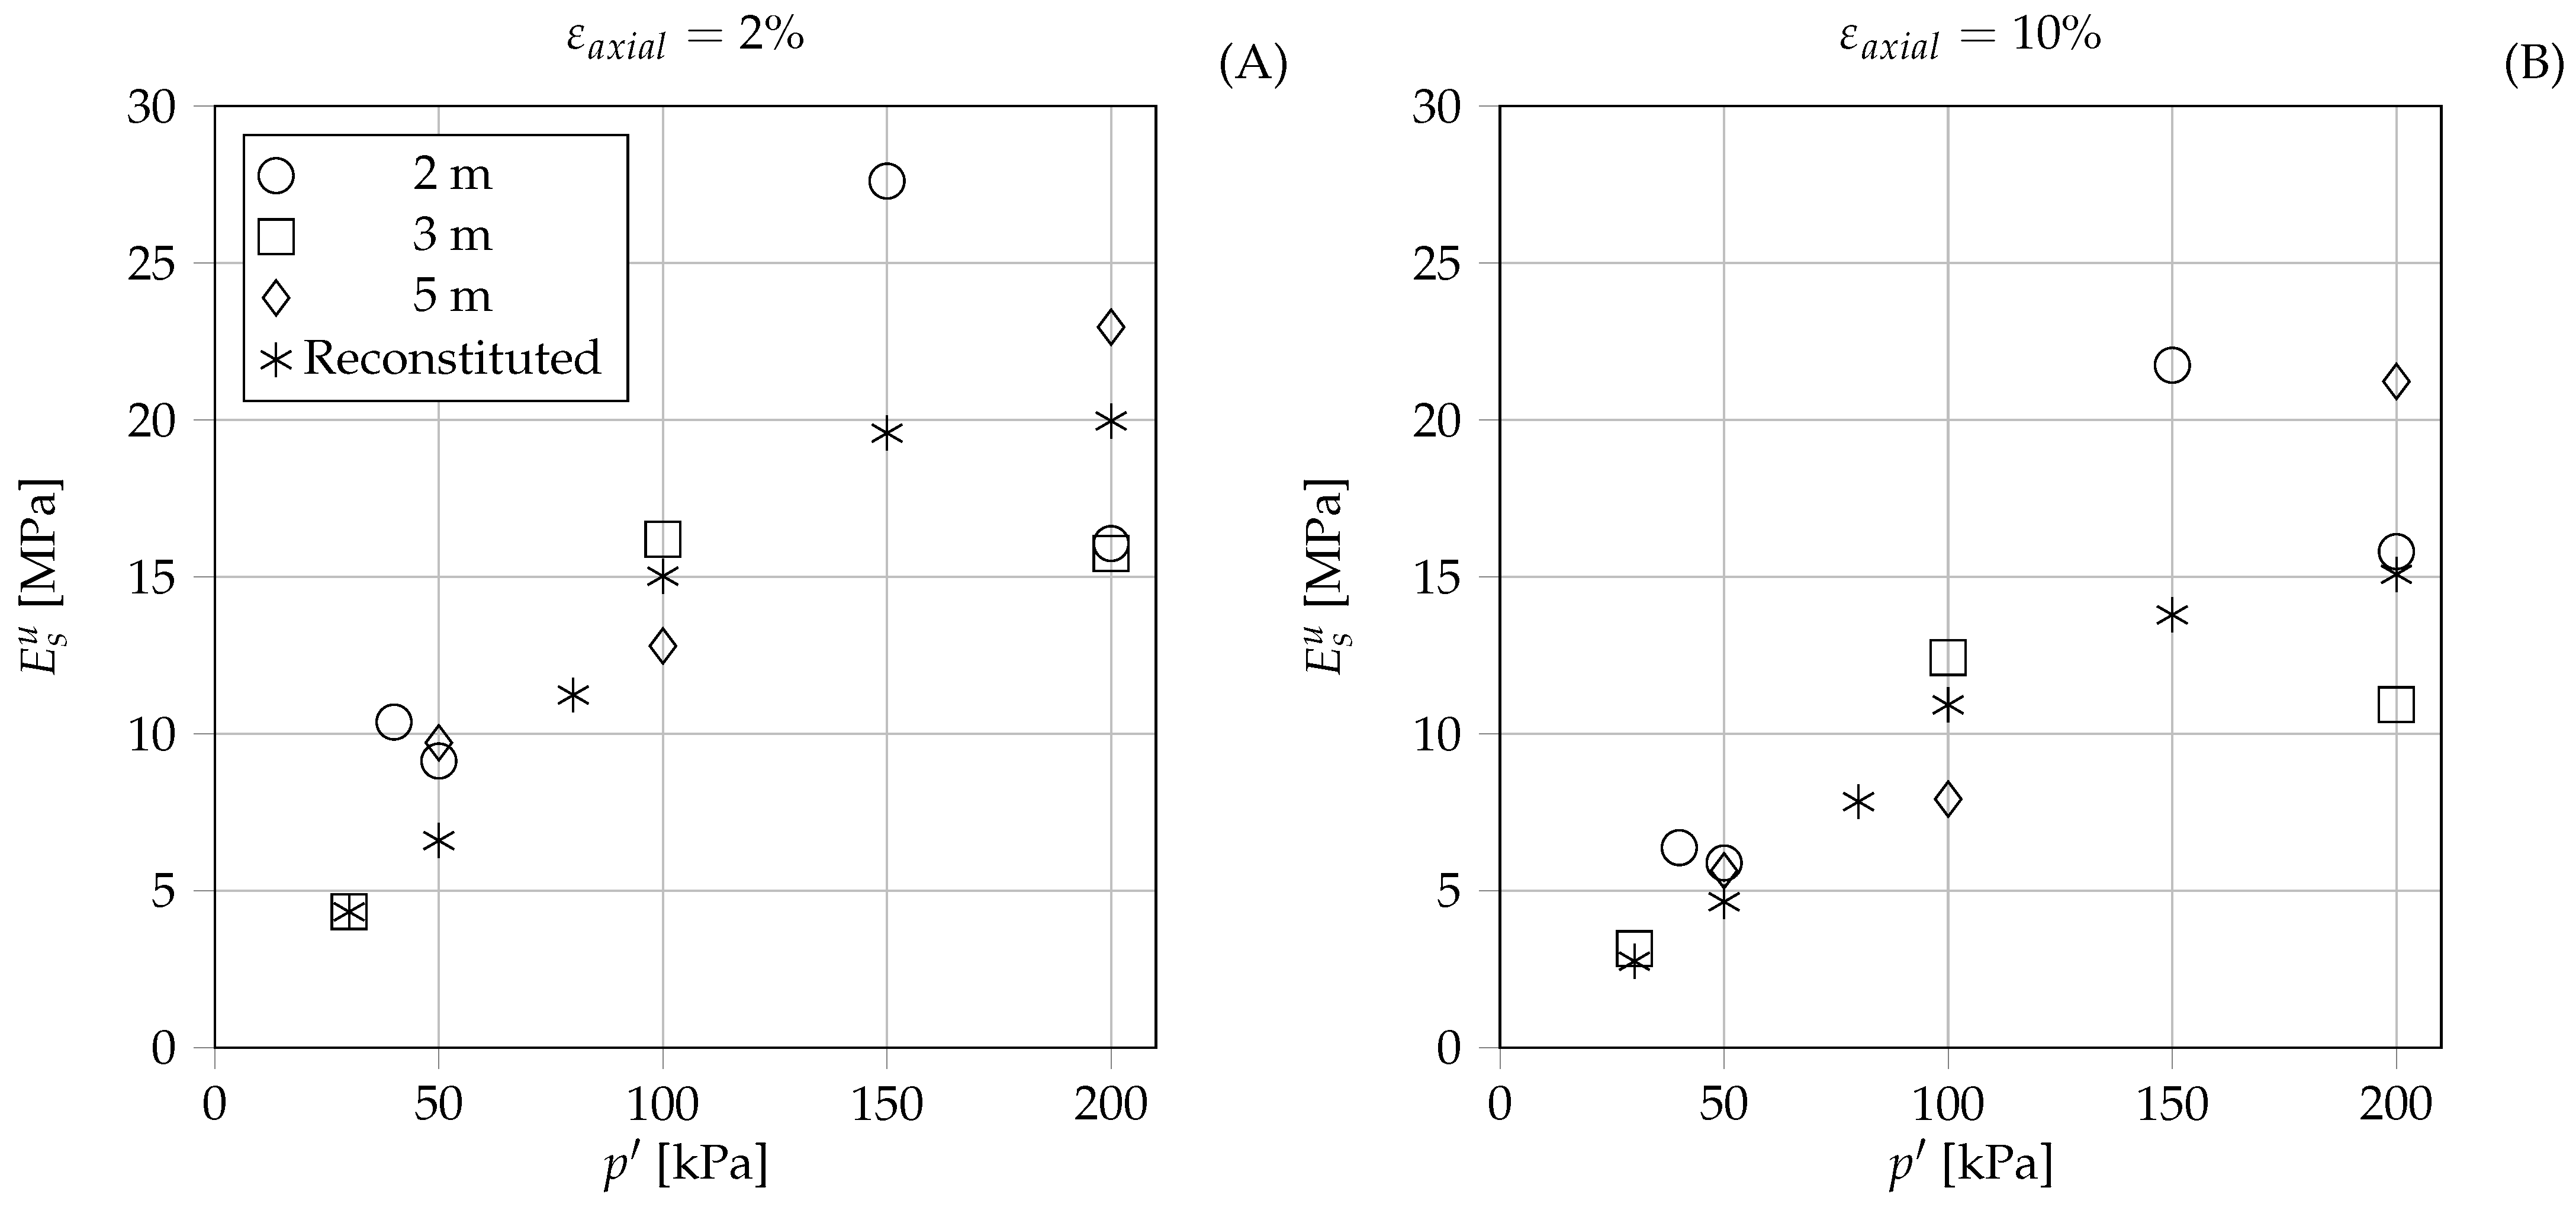
There is agreement between the derived values of from both intact and reconstituted samples, showing a clear linear increase in with an increasing cell pressure. This indicates a close undrained secant stiffness between intact and reconstituted samples.
The use of reconstituted samples is an aim for the future study of the mechanical behaviour of sulphide soil under cyclic loads, mainly for the calculation of accumulated settlements of road and railway embankments on sulphide soil subgrades. Although the resulting values of
differ by about
between intact and reconstituted samples, matching compressibility properties are of greater importance for the intended application. As shown in
Figure 8, almost identical consolidation parameters (inclination of NCL or inclination of unload–reload line) can be obtained from both intact and reconstituted samples. Nevertheless, the values of
from both the intact and reconstituted samples are higher than expected, as discussed before. The lower value of
from the reconstituted samples is closer to that expected and is considered on the safer side for design. Also, the
values from reconstituted samples are more conservative for the lower stress range and are of the same magnitude for higher stresses as the obtained values from intact samples.
6. Conclusions
In this paper, drained and undrained triaxial test results for reconstituted sulphide soil samples were compared against intact samples. The slurry deposition method was used as the reconstitution method, in which the sulphide soil was mixed with water to form a slurry and consolidated to the target initial conditions obtained from the intact samples.
To the authors’ knowledge, this work is the first attempt to obtain reconstituted samples of sulphide soil. To achieve this, the slurry deposition method was modified to suit the particular properties of sulphide soils. A large batch approach for producing slurry was adopted for enhancing the repeatability of the samples. In addition, the new implementation of the “soil syringe” for the careful and precise deposition of the slurry further increased the ability of the method to replicate the targeted initial conditions of the reconstituted samples.
Upon examining the results shown, it is evident that the initial conditions of the reconstituted samples in terms of , w, and e closely match the target value chosen from the intact samples. This suggests that the slurry deposition method can replicate the initial conditions of intact samples closely, producing homogeneous and repeatable samples of sulphide soil with controlled initial conditions.
It is important to note that the slurry deposition method may not fully replicate the anisotropies or soil fabric of intact soil. Nonetheless, given the often significant scatter in results obtained from intact samples and the likelihood of disturbances, having comparable and repeatable samples with overall similar behaviour to the in situ material is arguably preferable.
No monotonic CD triaxial tests on both intact and reconstituted samples reached critical state. This led to the decision to not continue with the CD investigation in the presented work. This limitation was attributed to the significant consolidation of the samples during shearing. Results reaching, as well as not reaching, critical state for CD tests on sulphide soils have been reported in other studies. Therefore, the suitability of CD triaxial tests for the derivation of critical state parameters strongly depends on the intrinsic properties of the tested material. The overall mechanical behaviour of reconstituted and intact samples was found to be comparable, but reconstituted samples experienced greater consolidation during shearing than the intact samples.
The mechanical behaviour observed in the monotonic CU triaxial tests for the intact and reconstituted samples was similar. It was possible to derive a CSL in the plane with a satisfactory fit to the critical stress state of each tested sample. However, the obtained from the reconstituted samples was slightly lower than that obtained from the intact samples. It is worth noting that both values of effective friction angle were higher than expected for this soil type, likely due to the high pore pressures reached during the shearing stage.
In conclusion, the slurry deposition method with the presented modification is considered a suitable method for the reconstitution of samples from the tested sulphide soil. This method provides a reliable means for obtaining consistent and comparable samples for the study of sulphide soil behaviour under various loading conditions. Considering the variability in properties between sulphide soil deposits, a similar testing approach is advised if the method is used for the reconstitution of other sulphide soils.