


Abstract
Precise identification and monitoring of small agricultural water bodies are essential for sustainable water resources management in arid and semi-arid regions, where even limited water losses can significantly affect agricultural productivity and local water security. However, the accurate detection of small ponds remains a major challenge in remote sensing, to address this challenge, this study proposes an integrated three-step framework that combines high-resolution remote sensing imagery, machine and deep learning techniques, and hydrological analysis to identify agricultural ponds and quantify their evaporation losses in Bastam, Iran. In the first step, a dedicated annotated dataset comprising 1061 RGB satellite images, each with a spatial size of 256 × 256 pixels and a ground resolution of 0.5 m, was developed for model training and evaluation. Using this dataset, three deep learning models BiSeNet, UNet3+, and SegNet and four traditional supervised classifiers Maximum Likelihood, Neural Network, Mahalanobis Distance, and Minimum Distance were implemented and compared for pond detection. The results demonstrated that deep learning models consistently outperformed conventional classifiers in delineating small agricultural ponds. Among all evaluated methods, BiSeNet achieved the highest segmentation performance, with an IoU of 82.08%, an F1-score of 90.15%, a precision of 91.86%, and a recall of 88.50%. Among the conventional classifiers, Maximum Likelihood combined with a 5 × 5 spatial kernel produced the best performance, achieving an IoU of 76.90%, an F1-score of 86.93%, a precision of 90.87%, and a recall of 83.32%, whereas simpler classifiers such as Minimum Distance showed only marginal improvements after kernelization. In the final step, the detected ponds were used to estimate evaporation losses through the Meyer method. The hydrological analysis revealed a clear periodic pattern in evaporation and a cumulative water loss of 388,636.7 m3 over a nine-month period, highlighting the considerable impact of evaporation on the efficiency of small agricultural water storage systems in dry environments. Based on these findings, practical mitigation strategies, including evaporation-reducing chemical surface films and floating covers, are discussed as potential options for reducing water loss. Overall, the proposed framework demonstrates the clear advantage of deep learning for the accurate identification of small agricultural ponds and provides an integrated methodological basis for monitoring water bodies and evaluating associated evaporation losses. The study offers a practical and transferable approach for supporting agricultural water management and improving water-use efficiency in arid and semi-arid regions.
1. Introduction
Water resources worldwide are under increasing pressure due to population growth, climate change, inefficient management practices, and ongoing environmental degradation. Collectively, these factors have intensified the long-standing imbalance between global water supply and demand [1,2,3,4,5]. This pressure is particularly severe in arid and semi-arid regions, where agriculture accounts for nearly 70% of global freshwater withdrawals and remains a cornerstone of food security and economic stability. Although irrigated lands constitute only about 18% of the world’s cultivated area, they produce nearly 40% of global agricultural output, underscoring the strong dependence of modern food systems on reliable water resources [6].
In Iran, the average annual precipitation is approximately 250 mm well below the global average while evaporation rates are nearly three times higher. Under such conditions, water scarcity has become a critical national challenge [7,8]. This imbalance, coupled with high interannual rainfall variability, rising temperatures, and unsustainable groundwater extraction, has led to severe consequences, including land subsidence, declining aquifer levels, and progressive salinization [9,10]. Collectively, these impacts pose serious threats to agricultural productivity, the resilience of rural communities, and the long-term sustainability of national food security [11]. Effectively addressing these challenges requires the adoption of modern and integrated water management strategies, including the implementation of advanced irrigation technologies, the optimization of cropping patterns, and the promotion of practices that enhance overall water-use efficiency [12]. Agricultural water reservoirs play a particularly critical role in this context. By capturing and storing water during wetter periods, they enhance irrigation efficiency, reduce losses associated with evaporation and seepage, and provide greater flexibility in scheduling irrigation for a variety of crops [13]. Consequently, agricultural ponds make a significant contribution to sustainable development by enhancing water management resilience and buffering agricultural systems against drought and water shortages [14]. Effective monitoring and proper maintenance of these reservoirs are essential to sustaining long-term agricultural productivity and reducing dependence on overexploited groundwater resources [15,16]. However, traditional field-based inspections face significant limitations. The large number of ponds, their dispersed and often unregulated distribution, and the considerable resources required for on-site assessments make manual monitoring both challenging and frequently impractical [17,18]. This situation underscores the growing need for scalable, high-resolution, and cost-effective monitoring approaches capable of providing timely and reliable information for effective water resource management.
Remote sensing (RS) technologies have emerged as essential tools for large-scale and near-real-time monitoring of surface water resources [19,20]. Remote sensing platforms, ranging from satellite systems to unmanned aerial vehicles (UAVs), enable the detection, delineation, and temporal analysis of water bodies without the need for direct field access [21,22]. This capability has enabled a wide range of applications in agricultural water management, including the assessment of water availability, the detection of land-use changes, and the optimization of irrigation planning [23,24]. Moreover, the high spatial resolution of modern sensors enables detailed monitoring of small water bodies, such as agricultural ponds. This capability makes it possible to accurately delineate pond extents, estimate stored water volumes, analyze seasonal dynamics, and assess the influence of surrounding land-use patterns [25,26]. While traditional image analysis techniques rely largely on manual thresholding and provide only limited automation, recent advances in machine vision particularly through deep learning (DL) and modern machine learning (ML) algorithms have substantially enhanced the accuracy and scalability of water body detection. Conventional supervised classifiers, such as the Maximum Likelihood method, depend on predefined statistical assumptions and manually derived features, which often restricts their performance in complex and heterogeneous landscapes [27,28]. However, conventional image analysis approaches often require extensive preprocessing and tend to struggle when applied to complex or heterogeneous imagery. In contrast, deep learning models are capable of automatically learning multi-scale features directly from raw data, making them particularly well suited for spatially and spectrally heterogeneous environments. Convolutional neural network (CNN) architectures, including SegNet and UNet, have been widely employed for semantic segmentation in remote sensing applications, enabling the precise extraction of complex spatial patterns and spectral characteristics from high-resolution imagery [29,30].
Accurate mapping and monitoring of ponds and other small water bodies are essential for sustainable water resource management. Traditional statistical classifiers, such as the Maximum Likelihood and Mahalanobis Distance methods, rely on predefined statistical rules and manually extracted features, often assuming specific data distributions. Although these approaches can perform well in relatively homogeneous and well-characterized environments, their effectiveness is frequently constrained in heterogeneous or complex landscapes. In contrast, classical machine learning algorithms including Support Vector Machines (SVM), Random Forest (RF), and k-Nearest Neighbors (KNN) learn classification or regression patterns directly from labeled training data, offering greater flexibility and improved generalization across diverse environmental conditions. Deep learning models, particularly Convolutional Neural Networks such as UNet3+, SegNet, and BiSeNet, further extend this capability by automatically extracting hierarchical and multi-scale features from raw imagery. This capacity enables the identification of complex spatial structures and spectral patterns that are often difficult to capture using conventional approaches. When integrated with temporally rich remote sensing datasets, these advanced analytical methods provide powerful tools for monitoring the dynamics of pond networks, thereby supporting more adaptive, efficient, and data-driven water resource management strategies [31,32].
Another critical hydrological component in arid and semi-arid regions is evaporation from open water surfaces, including ponds, reservoirs, and irrigation canals. Accurate estimation of evaporation is essential for assessing water availability and optimizing irrigation scheduling. Although direct measurements using evaporation pans (Class A pans) or lysimeters can provide reliable results, their application is often limited at larger spatial scales due to logistical and operational constraints. Consequently, empirical approaches, such as the Meyer model, and combination methods, including the Penman equation, have been widely adopted for estimating evaporation under a range of climatic conditions [33,34]. Although the Meyer approach is relatively simple, the Penman method incorporates multiple physical variables, providing more comprehensive and reliable estimates of evaporation. Despite substantial progress in remote sensing–based water body detection, agricultural ponds have received considerably less attention than larger hydrological systems such as lakes, rivers, and reservoirs. Given their critical role in local water supply, as well as their dynamic behavior and pronounced spatial heterogeneity, the development of automated and scalable monitoring approaches remains an important research priority. The integration of RS with ML and DL techniques offers a promising pathway for improving the identification, monitoring, and management of these systems. Nevertheless, further methodological development is required to effectively capture the small size, irregular geometry, and spectral variability that commonly characterize agricultural ponds. In general, current approaches for extracting water bodies from satellite imagery can be broadly categorized into three main groups: spectral index–based methods, machine learning classifiers, and deep learning algorithms. Each of these approaches presents distinct advantages and limitations, depending on data characteristics, spatial resolution, and the specific objectives of the application.
1.1. Spectral Index-Based Methods for Water Detection
Spectral index–based methods exploit the distinctive spectral reflectance characteristics of water in remote sensing imagery to construct indices that enhance the detection of water features. These approaches typically rely on band combinations or ratios, such as the Modified Normalized Difference Water Index (MNDWI), which amplifies water signals while suppressing interference from vegetation, soil, and built-up surfaces. Owing to their conceptual simplicity and computational efficiency, spectral indices have been widely applied for rapid water body extraction. However, their performance often declines in complex environments where shadows, dense vegetation, or turbid water conditions are present, frequently resulting in misclassification. For example, Nagaraj and Kumar compared spectral index–based techniques with machine learning and deep learning approaches for water body extraction and reported that spectral indices generally exhibited lower accuracy. This limitation was primarily attributed to their reduced adaptability and the spectral confusion that may occur between water and certain non-water features [35].
1.2. Traditional Machine Learning Classifiers
Traditional supervised classification methods, including the Maximum Likelihood Classifier and SVM, have been widely employed for water body mapping due to their well-established theoretical foundations. These approaches assign land-cover classes based on labeled training data, using statistical or geometric decision boundaries to differentiate between surface features. For example, Rimal and Kunwar (2018) applied both SVM and Maximum Likelihood Classifier to analyze land-cover changes in the Kathmandu Valley, Nepal, between 1988 and 2016, and reported that SVM achieved higher classification accuracy than Maximum Likelihood Classifier [36]. Similarly, Wang et al. employed machine learning algorithms in conjunction with preprocessing techniques such as FFT–IHS data fusion to classify Landsat-8 imagery into eight land-cover classes. Their results achieved an overall classification accuracy of 88.3% with a Kappa coefficient of 0.87. The study further demonstrated that applying post-classification majority filtering using 5 × 5 or 7 × 7 kernel windows substantially improved classification performance, increasing the overall accuracy to more than 91% [37]. However, these traditional classifiers are often sensitive to parameter selection and require careful calibration to achieve optimal performance. Their effectiveness may also decline in heterogeneous environments, particularly in areas characterized by small water bodies, fragmented landscapes, or complex land–water interfaces, where spectral variability and mixed pixels can lead to reduced classification accuracy.
1.3. Deep Learning-Based Methods for Water Body Extraction
Deep learning–based approaches have recently emerged as powerful alternatives for water body extraction due to their ability to learn high-level spatial and spectral representations from large datasets. Architectures such as U-Net, SegNet, and BiSeNet employ end-to-end training frameworks that enable automatic feature extraction and robust classification, even in the presence of noise and complex background conditions. For example, Yuting Dong et al. developed a Small Water Monitoring method using Landsat and Sentinel-2 imagery to evaluate water bodies across urban environments in China. Their proposed approach outperformed four states-of-the-art algorithms including supervised Random Forest classification, hierarchical clustering, multiband thresholding, and the MNDWI by more accurately detecting small water bodies and substantially reducing false positives. These improvements were confirmed by higher overall accuracy, producer’s accuracy, and user’s accuracy when validated against ground-truth data [38]. In another study, Nagaraj and Kumar reported that deep learning models outperformed both machine learning and spectral index–based approaches. This improved performance was attributed to advanced architectural components, including skip connections, attention mechanisms, and residual blocks, which enhance feature representation and facilitate the learning of complex spatial patterns within remote sensing imagery [35]. Furthermore, SegNet has consistently demonstrated strong performance in the automatic extraction of water bodies from satellite imagery. The architecture is capable of accurately delineating both large and fine-scale water features while requiring minimal human intervention, thereby improving the efficiency, consistency, and scalability of large-scale water resource monitoring [20]. Other architectures, including BiSeNet and U-Net3+, have also demonstrated strong effectiveness in delineating agricultural ponds and irrigation systems. Nevertheless, certain limitations persist, particularly in the accurate detection of very small or fine-scale water features, where spectral mixing, spatial resolution constraints, and complex surrounding land-cover patterns can still pose challenges [39,40,41].
1.4. Post-Classification Optimization Techniques
Post-classification optimization techniques have also been explored to improve mapping accuracy. Wang et al. specifically examined the influence of kernel size in majority filtering and demonstrated that kernel windows of 5 × 5 and 7 × 7 can enhance classification accuracy by reducing noise and isolated misclassified pixels. However, the study also found that larger kernels, such as 11 × 11 or 13 × 13, tend to degrade accuracy due to excessive smoothing, which can obscure fine spatial details and lead to the loss of small or narrow features [37]. These findings underscore the importance of post-processing parameter selection in improving water body delineation.
Despite substantial advances in remote sensing and machine learning–based approaches for water body detection, several important challenges remain, particularly in the context of small agricultural ponds located within heterogeneous arid and semi-arid landscapes. Accurate classification remains difficult in complex environments, where spectral variability, mixed pixels, shadows, vegetation cover, and irregular land–water boundaries can lead to considerable misclassification. In addition, many existing models demonstrate limited generalization when applied across different geographic regions or environmental conditions, which reduces their reliability for operational and large-scale monitoring applications. The detection of small, fragmented, or ephemeral water features remains especially challenging, as these features are often comparable to or smaller than the spatial resolution of commonly used satellite sensors and frequently exhibit strong temporal variability. Addressing these limitations is therefore essential for developing robust, scalable, and transferable monitoring frameworks capable of supporting adaptive agricultural water management. To address these gaps, the present study develops and evaluates an integrated framework for the identification and monitoring of agricultural ponds by combining traditional supervised classification techniques with advanced machine learning and deep learning models. A novel expert-labeled dataset is constructed to mitigate the limitations associated with the scarcity of high-quality training samples and to improve model reliability in complex agricultural environments. The proposed framework systematically benchmarks multiple classification and segmentation models using standard accuracy assessment metrics and further evaluates the impact of post-classification optimization strategies on pond delineation performance. Unlike many previous studies that have focused primarily on water body extraction, this research also integrates evaporation estimation to quantify potential water losses from detected ponds, thereby enabling a more comprehensive assessment of agricultural water availability. Collectively, these contributions improve the accuracy, robustness, and practical applicability of agricultural pond monitoring and provide a decision-support foundation for more effective water resource management in arid and semi-arid regions.
2. Materials and Methods
2.1. Workflow of Research Process
Figure 1 presents the methodological workflow employed in this research, outlining the complete classification process for agricultural pond identification. The workflow begins with the acquisition of high-resolution Bing satellite imagery, followed by the construction of a water-body sample dataset. The dataset is subsequently divided into training and testing subsets to support both model development and independent performance evaluation. Classification is conducted using two major groups of approaches: (i) traditional machine learning methods, including Support SVM, Maximum Likelihood, and Mahalanobis Distance, and (ii) deep learning architectures, comprising BiSeNet, SegNet, and UNet3+. The outputs generated by each model are further integrated through a majority-vote analysis to increase classification stability and reduce model-specific uncertainties. Finally, the classification results are assessed using standard accuracy metrics, enabling comparative evaluation across methods. This integrative workflow facilitates the extraction of reliable and high-quality water body features from the satellite imagery.
Figure 1.
Flowchart illustrating the methodological framework developed for agricultural pond detection and evaporation loss estimation.
2.2. Study Area
The study was conducted in the Bastam region of Shahrood County in Semnan province, Iran an area of considerable agricultural significance due to its limited water resources and the growing adoption of modern irrigation technologies. Bastam was selected as a representative semi-arid agricultural basin that has undergone a rapid transition from traditional to modern irrigation systems, while simultaneously experiencing increasing water scarcity and declining groundwater levels. Figure 2 illustrates the geographic location and spatial extent of the study area, situated at approximately 36.4841° N latitude and 55.0048° E longitude. The region encompasses Bastam and its surrounding farmlands and includes both mountainous terrain and adjacent plains, covering a total area of roughly 75 km2. Bastam lies within a semi-arid to arid climatic zone, characterized by low annual precipitation, elevated evaporation rates, and pronounced seasonal water scarcity. As one of the primary agricultural centers of Shahrud County, the region supports a substantial proportion of the county’s farming activities. Historically, water supply depended on qanats, springs, and shallow wells, with surface irrigation and basic water-storage systems serving as the dominant management practices. In recent decades, however, the construction of agricultural ponds and the implementation of advanced irrigation methods have significantly improved water availability and enhanced overall irrigation efficiency. Monitoring these ponds and estimating evaporation losses have therefore become essential components of sustainable water management and informed irrigation planning. These ponds now serve as critical infrastructure, facilitating year-round irrigation, improving accessibility to stored water, and supporting resilient agricultural production under increasingly challenging climatic conditions.
Figure 2.
Geographic location of the Bastam study area in Shahrood County, Semnan province, northeastern Iran. The blue outlines represent the provinces included in the dataset.
2.3. Remote Sensing Dataset for Pond Monitoring
A custom remote sensing dataset was developed for model training, comprising 1061 high-resolution RGB satellite images collected from multiple regions across Iran, including Alborz, Isfahan, Tehran, Qazvin, Shiraz, Semnan, and Khorasan Razavi provinces. The images were obtained from the Bing Maps platform using SAS Planet 2024 software. Each image has a spatial dimension of 256 × 256 pixels with an approximate ground sampling distance of 0.5 m per pixel, allowing the detection of small-scale water bodies such as agricultural ponds. The dataset encompasses a wide range of environmental and landscape conditions, including variations in illumination, vegetation cover, surrounding land use, and pond appearance, thereby providing a robust and diverse training foundation for machine learning and deep learning models. Figure 2 illustrates the boundaries of the study area. Within this region, satellite images were collected to capture the spatial distribution of ponds and other surface water features. The images represent a variety of pond shapes, sizes, and adjacent land-cover types, offering a comprehensive representation of the hydrological characteristics of the study area. Furthermore, the dataset was designed to support deep learning models that require spatial coherence and substantial visual diversity. A preliminary version of the agricultural pond dataset was presented in our earlier pilot study, which comprised 373 manually annotated very-high-resolution images collected from two regions (Karaj and Shiraz) and was developed primarily for benchmarking deep learning semantic segmentation models. In the present study, the dataset has been extensively expanded to 1061 manually annotated images acquired from seven provinces across Iran, encompassing a much wider range of climatic, environmental, and geographical conditions. This enhanced dataset provides greater spatial diversity and improves the robustness and generalization capability of the segmentation models. Beyond the expansion of the dataset, the scope of the present research has been considerably broadened. Rather than focusing solely on agricultural pond detection, the extracted pond boundaries are integrated with satellite imagery, meteorological observations, and the Meyer evaporation model to estimate evaporation losses and quantify water loss from agricultural water storage ponds. Consequently, this study establishes a comprehensive remote sensing framework for assessing agricultural water resources, extending the application of semantic segmentation from feature extraction to hydrological analysis and water resource assessment. Figure 3 presents representative samples from the dataset, highlighting the variability in pond environments and demonstrating the segmentation challenges associated with complex backgrounds, irregular boundaries, and varying illumination conditions.
Figure 3.
Selected samples from the dataset demonstrating the visual variability in pond environments, including differences in shape, size, land cover, and illumination.
2.4. Deep Learning-Based Semantic Segmentation
The first stage focuses on deep learning approaches and presents the architectures of the networks employed for semantic segmentation. These models consist of multiple interconnected layers designed to automatically learn hierarchical spatial features from high-resolution imagery. This section describes their architectural structure and operational mechanisms, highlighting their capability to accurately delineate agricultural ponds within complex landscapes.
2.4.1. BiSeNet
BiSeNet is a semantic segmentation architecture composed of two primary branches: a spatial path and a context path. The spatial path is designed to preserve high-resolution spatial information from the input image. Through a sequence of convolutional layers, the image resolution is gradually reduced while retaining critical spatial details, enabling accurate delineation of fine structures. In contrast, the context path focuses on extracting high-level semantic features. It employs a pre-trained ResNet-50 backbone to capture deep contextual representations at multiple scales. To enhance the discriminative capacity of these features, Attention Refinement Modules (ARMs) are applied to emphasize the most informative regions within the feature maps. The refined contextual features are then upsampled and combined with the spatial path output, enabling the integration of detailed spatial information with high-level semantic context. Finally, a feature fusion module aggregates the outputs of both paths using an attention mechanism that emphasizes relevant features while suppressing less informative responses, thereby improving the overall segmentation accuracy.
2.4.2. UNet3+
UNet3+ is an advanced semantic segmentation architecture that extends the original U-Net framework by redesigning the encoder–decoder structure and introducing full-scale skip connections for enhanced multi-scale feature fusion. The encoder extracts hierarchical features through a sequence of convolutional blocks, where each block reduces the spatial resolution via max-pooling while increasing the depth of feature representations. As the input progresses toward the bottleneck layer, the network captures progressively higher-level and more abstract semantic information. The decoder subsequently reconstructs the segmentation map by gradually upsampling the bottleneck feature maps. During this process, feature information from the encoder is incorporated through skip connections, enabling the integration of fine spatial details with broader contextual information. A distinctive characteristic of UNet3+ is its full-scale skip-connection design, which aggregates features from multiple encoder and decoder levels at each decoding stage rather than linking only corresponding layers. This multi-scale aggregation allows the model to simultaneously exploit low-level spatial details and high-level semantic context, leading to improved segmentation accuracy and robustness. The overall architecture of UNet3+ is illustrated in Figure 4.
Figure 4.
Multi-scale feature aggregation architecture illustrating encoder feature levels (X1–X5), decoder fusion layers (FX1–FX4), and the corresponding down-sampling, up-sampling, and skip-connection pathways.
2.4.3. SegNet
SegNet, introduced by researchers at the University of Cambridge in 2015, is a convolutional neural network architecture specifically designed for semantic segmentation. The model follows an encoder–decoder framework that enables accurate pixel-level classification, making it suitable for applications requiring detailed object delineation. The overall architecture of SegNet is illustrated in Figure 5. In the encoder stage, the input image is processed through a sequence of convolutional layers that progressively extract hierarchical feature representations. Each convolutional block is followed by a max-pooling operation, which reduces the spatial resolution while retaining the most informative features. A distinctive characteristic of SegNet is that the pooling indices generated during the encoding stage are stored and later reused in the decoding process. The decoder reconstructs the spatial resolution of the feature maps by performing upsampling using these stored pooling indices, which helps preserve boundary information and reduces the need for learning additional parameters. Subsequent convolutional layers further refine the reconstructed features to produce detailed segmentation outputs. Finally, a pixel-wise classifier assigns each pixel to its corresponding class, enabling accurate delineation of foreground and background regions.
Figure 5.
Architectural overview of the SegNet model employed for semantic segmentation of agricultural ponds in high-resolution satellite imagery.
2.4.4. Training Configuration
Loss Function
The Binary Cross-Entropy (BCE) loss function is commonly employed in binary classification problems to quantify the discrepancy between predicted probabilities and ground-truth labels. It measures the divergence between the true class labels and the probabilities estimated by the model, thereby guiding the optimization process during training. In this setting, the model predicts a probability value between 0 and 1 for each pixel, representing the likelihood of belonging to the target class. The BCE loss penalizes incorrect predictions by assigning higher loss values when predicted probabilities deviate from the corresponding ground-truth labels. Through iterative weight updates during training, minimizing this loss function enables the model to improve its predictive performance. The mathematical formulation of the BCE loss is presented in Equation (1):
Here, N denotes the total number of samples, represents the ground-truth label for the i-th sample, and corresponds to the predicted probability generated by the model. By minimizing this loss function during training, the model iteratively adjusts its parameters to reduce the discrepancy between predicted probabilities and true labels, thereby improving classification accuracy.
Hyperparameters
Hyperparameters in convolutional neural networks are predefined settings that govern the training process and significantly influence model performance. In this study, the hyperparameters were selected to achieve a balance between computational efficiency and segmentation accuracy. The learning rate was set to 0.003 to regulate the magnitude of weight updates during optimization, while a batch size of 4 was adopted to manage memory usage and stabilize training. The models were trained for 100 epochs, and the Adam optimizer was employed due to its adaptive learning rate mechanism and reliable convergence behavior. For model development, the dataset was initially divided into training and testing subsets, with 75% of the images used for training and 25% reserved for testing. To increase data diversity and improve model generalization, data augmentation techniques were applied to the training set, including rotation with a 45° angle and horizontal flipping. Following augmentation, 20% of the augmented training data were randomly selected as a validation set to monitor model performance during training. To ensure reproducibility, the dataset splitting procedure was controlled using a fixed random seed (101), and the same random seed was also applied during network initialization and training. Finally, to produce the agricultural reservoir map and assess model performance, imagery from the Bastam study area was processed using the trained networks. Agricultural reservoirs were manually delineated to generate reference labels, enabling the calculation of quantitative evaluation metrics for accuracy assessment.
2.5. Traditional Machine Learning-Based Classification Methods
2.5.1. Maximum Likelihood Classification
The Maximum Likelihood (ML) classifier is one of the most accurate and widely used supervised classification methods. It assigns each pixel to the class for which the spectral values have the highest statistical probability of occurrence. Assuming that the spectral response of each class follows a multivariate normal distribution, the probability that a pixel with feature vector x belongs to class is expressed as Equation (2):
where
is the spectral vector of the pixel,
μi is the mean vector of class Σi is the covariance matrix of class and n is the number of spectral bands.
Each pixel is assigned to the class with the maximum posterior probability , which under equal priors simplifies to maximum
By incorporating spectral covariance among bands, the ML classifier offers high precision in categorizing pixels based on multiband statistical relationships.
2.5.2. Neural Networks Classification
The Artificial Neural Network (ANN) classifier employs a multilayer perceptron (MLP) architecture to perform supervised classification. This method is based on a feed-forward network structure consisting of an input layer, one or more hidden layers, and an output layer. Each neuron in the network calculates a weighted sum of the input values, adds a bias term, and applies a nonlinear activation function to produce its output. As expressed in Equation (3), each neuron computes a weighted sum of inputs followed by a nonlinear activation function.
During training, the network adjusts its internal weights and biases through back-propagation to minimize classification error across the training samples. Once trained, the MLP model assigns each pixel to the most probable class based on learned patterns in the spectral feature space. The ANN classifier in ENVI has proven effective for complex and nonlinear data distributions, making it well-suited for remote sensing applications such as land-cover mapping and feature extraction.
2.5.3. Mahalanobis Distance
The Mahalanobis distance (MD) is a robust statistical classifier that measures the distance between a pixel’s spectral vector and the mean spectral vector of a predefined class, accounting for the covariance structure of the data. Unlike the Euclidean distance, the MD considers both the dispersion and the correlation between spectral bands, making it highly effective for classifying classes with distinct statistical distributions. For a pixel vector x and a class mean vector μ, the MD is calculated as the following equation. The distance is calculated using Equation (4).
where is the inverse of the class covariance matrix. As defined in Equation (4), the MD normalization by the covariance matrix effectively compensates for the varying scales and correlations of spectral bands. By assigning pixels to the class with the minimum MD, the classifier accurately handles datasets with complex or overlapping spectral signatures, which is critical for precise land-cover mapping and geological feature extraction in multispectral imagery.
2.5.4. Minimum Distance
The minimum distance-to-mean classifier assigns each pixel to the class whose mean spectral vector is closest in the feature space. This method calculates the Euclidean distance between a pixel spectral vector x and the class mean vector . The pixel is classified into the class i that minimizes the distance defined by Equation (5).
As shown in Equation (5), the classification relies solely on the proximity to the class centroid. While this approach is computationally efficient, it is sensitive to the variance of the spectral data and does not account for the covariance structure between bands. Consequently, the method assumes spherical class clusters, which may limit its accuracy in cases where spectral classes have high variance or significant overlap.
2.6. Evaluation Metrics
To quantitatively assess the performance of the deep learning models in extracting agricultural reservoirs, several standard evaluation metrics were employed. These metrics measure the agreement between the model outputs and the manually delineated ground truth. Each metric provides a different perspective on model performance.
2.6.1. Recall
Recall quantifies the proportion of actual positive pixels that are correctly predicted by the model. In image segmentation, it indicates the effectiveness of the model in identifying pixels belonging to the target class. Higher Recall values correspond to fewer false negatives. The mathematical expression of Recall is given in Equation (6).
Here, TP (True Positives) refers to the pixels accurately classified as part of the target class, and FN (False Negatives) refers to the target class pixels incorrectly classified as non-target. This metric is crucial in evaluating the model’s effectiveness in fully identifying the target class, particularly in tasks requiring comprehensive detection.
2.6.2. Precision
Precision quantifies the proportion of predicted positive pixels that are correctly classified by the model. In image segmentation, it evaluates the reliability of foreground predictions by measuring the ratio of true positives (TP) to all predicted positives, including false positives (FP). Higher Precision values indicate fewer false detections. The metric is defined in Equation (7).
This metric is particularly important in applications where minimizing false positives is critical, ensuring that detected features correspond to actual target objects.
2.6.3. F1-Score
The F1-score is a widely used evaluation metric that provides the harmonic mean of Precision and Recall. In image segmentation, it reflects the balance between correctly detecting target pixels and minimizing false classifications. This metric is particularly useful when both false positives and false negatives are important for performance assessment. The F1-score is defined in Equation (8):
Higher F1-score values indicate better overall agreement between the predicted output and the ground truth.
2.6.4. Intersection over Union (IoU)
Intersection over Union (IoU) is an evaluation metric used to quantify the degree of overlap between a predicted segmentation mask and the corresponding ground truth mask. It is defined as the ratio between the intersection area and the union area of the two masks. The intersection refers to the set of pixels that are correctly classified as foreground in both the predicted and reference masks, whereas the union represents all pixels that appear in either mask, including true positives, false positives, and false negatives. This metric is particularly useful because it simultaneously accounts for both types of classification errors, penalizing incorrect foreground predictions as well as missed foreground regions. The IoU formulation is expressed in Equation (9):
Higher IoU values reflect a stronger spatial agreement between the predicted segmentation mask and the reference ground truth.
2.7. Meyer Evaporation Method
To estimate evaporation from the open water surface, Meyer’s empirical method was applied using meteorological data obtained from the Shahrood synoptic station [42]. The dataset included minimum temperature, maximum temperature, mean temperature, relative humidity, vapor pressure deficit, and wind speed measured at the standard height. The Meyer evaporation equation is expressed as Equation (10).
where E is the evaporation rate from the open water surface (mm/day), U denotes the wind speed (km/h), C is an empirical coefficient set to 0.36 for deep-water bodies > 2 m, es represents the saturated vapor pressure, and ea is the actual vapor pressure (mmHg).
The agricultural ponds investigated in this study are engineered irrigation storage reservoirs constructed to maximize water storage for agricultural use throughout the irrigation season. Unlike ornamental, recreational, or landscape ponds, these reservoirs are designed with the primary objective of achieving the required storage capacity while minimizing the occupation of productive agricultural land. Consequently, increasing reservoir depth represents the most practical and commonly adopted engineering solution for providing the required storage volume within the limited surface area allocated for agricultural ponds. As a result, agricultural irrigation reservoirs are generally constructed with water depths exceeding 2 m, and considerably greater depths are frequently employed for ponds with larger storage capacities.
This design practice was further confirmed through consultation with agricultural engineering specialists and local authorities responsible for irrigation infrastructure in the study area, who indicated that the vast majority of agricultural storage ponds exceed the 2 m depth criterion. While the exact depth of every individual pond was not explicitly measured as part of this study, obtaining such information was not practically feasible because detailed pond-design records are generally not publicly accessible through the responsible organizations. In addition, field verification of pond depths was constrained by restricted access to privately owned agricultural ponds, as permission for on-site measurements is frequently not granted by landowners. Nevertheless, the common engineering design characteristics of agricultural irrigation reservoirs, together with information obtained through consultation with agricultural engineering specialists and local authorities responsible for irrigation infrastructure, indicate that the vast majority of these reservoirs exceed the 2 m depth criterion. Therefore, the use of the Meyer empirical coefficient (C = 0.36) is considered appropriate for estimating evaporation from the agricultural ponds investigated in this study.
3. Results
This section presents a comprehensive evaluation of the models applied to the semantic segmentation of agricultural ponds from high-resolution satellite imagery. The performance of both deep learning architectures and traditional machine learning classifiers was assessed using precision, recall, and F1-score metrics. Furthermore, the spatial accuracy of the extracted pond areas and their implications for surface water availability and evaporation dynamics were examined within the context of a semi-arid region. Additionally, the influence of spatial kernels on machine learning classification performance was analyzed to evaluate their role in enhancing spatial consistency. Finally, the environmental significance of accurate segmentation is emphasized through its integration into empirical evaporation modeling.
3.1. Performance of Deep Learning Models
The three deep learning architectures, namely BiSeNet, UNet3+, and SegNet, consistently demonstrated superior performance across all evaluation metrics (Table 1), significantly outperforming traditional machine learning classifiers in terms of overlap-based (IoU) and composite accuracy (F1-score), as well as pixel-wise evaluation metrics including precision and recall. Overall, BiSeNet emerged as the most robust model, achieving the best performance in three out of four evaluation metrics, namely IoU, F1-score, and recall.
Table 1.
Comparative performance of deep learning models and traditional machine learning classifiers for agricultural pond detection.
Specifically, BiSeNet achieved an IoU of 82.08%, an F1-score of 90.15%, recall of 88.50%, and precision of 91.86%. The highest IoU and F1-score confirm its superior spatial agreement with ground truth and overall segmentation quality, while its leading recall indicates the strongest sensitivity in detecting pond pixels, minimizing omission errors in hydrological mapping tasks. Although BiSeNet achieved a high precision value, it ranked third among the evaluated deep learning models in this metric, after UNet3+ (96.36%) and SegNet (95.97%). This indicates that, while BiSeNet provides the most balanced overall performance, it is slightly less conservative in suppressing false positives compared to the other two architectures. This performance can be attributed to the dual-path architecture of BiSeNet, where spatial and context branches jointly enable the integration of fine boundary details with global semantic context. This design is particularly effective in heterogeneous agricultural landscapes, where ponds exhibit complex spatial structures and are often embedded within spectrally similar backgrounds.
UNet3+ achieved an IoU of 80.31%, an F1-score of 89.08%, and the highest precision (96.36%), while its recall (82.82%) was comparatively lower. This reflects a strongly conservative prediction behavior, prioritizing minimization of false positives at the expense of increased omission errors. Consequently, despite its superior precision, the lower recall results in reduced spatial coverage compared to BiSeNet, as reflected in its lower IoU. SegNet also demonstrated strong and stable performance, achieving an IoU of 80.80%, an F1-score of 89.38%, precision of 95.97%, and recall of 83.63%. Its encoder–decoder architecture, combined with pooling index reuse during upsampling, enables effective boundary reconstruction. However, compared to BiSeNet, it exhibits slightly lower capability in capturing complex spatial variability, while still maintaining a strong balance between precision and recall.
Overall, the results indicate that BiSeNet is the most effective model in terms of overall segmentation performance, achieving the best results in IoU, F1-score, and recall, while maintaining a high (but not leading) precision. UNet3+ and SegNet follow closely, but exhibit more specialized behaviors characterized by precision-oriented and reconstruction-oriented segmentation strategies, respectively.
3.2. Performance of Traditional Machine Learning Models
The performance of the machine learning classifiers was rigorously evaluated under three spatial configurations: without kernel, with a 3 × 3 kernel, and with a 5 × 5 kernel, in order to examine the influence of spatial filtering on classification accuracy. The corresponding results, presented in Table 1, reveal distinct behavioral patterns among the evaluated models across multiple evaluation metrics, including F1-score, precision, recall, and Intersection over Union (IoU).
Among the traditional machine learning methods, the Maximum Likelihood classifier consistently achieved the strongest overall performance. Without kernel, it obtained an IoU of 74.18%, an F1-score of 85.17%, precision of 88.39%, and recall of 82.18%. With a 3 × 3 kernel, performance improved to an IoU of 75.53% and an F1-score of 86.05%, while precision and recall reached 89.84% and 82.57%, respectively. Under the 5 × 5 kernel configuration, the classifier achieved its best performance with an IoU of 76.90%, an F1-score of 86.93%, precision of 90.87%, and recall of 83.32%. This consistent improvement across all metrics indicates that spatial filtering effectively enhances spatial coherence and reduces isolated misclassifications, which is particularly important for accurately delineating small and fragmented water bodies. The probabilistic structure of the Maximum Likelihood classifier allows it to effectively exploit this additional spatial context by better modeling spectral variability in heterogeneous environments.
In contrast, the Neural Net classifier demonstrated a stable and gradually improving performance across kernel configurations. Without kernel, it achieved an IoU of 66.66%, an F1-score of 79.99%, precision of 73.93%, and recall of 87.13%. With a 3 × 3 kernel, these values increased to an IoU of 68.52%, an F1-score of 81.31%, precision of 76.06%, and recall of 87.35%. Under the 5 × 5 kernel, the classifier further improved, reaching an IoU of 69.59%, an F1-score of 82.07%, precision of 76.64%, and recall of 88.32%. These results clearly demonstrate that spatial filtering consistently enhances all evaluation metrics, including IoU, indicating improved overlap between predicted and reference classes. Despite the capability of neural networks to model non-linear relationships, the relatively shallow architecture and lack of explicit spatial feature extraction limit their ability to fully capture complex spectral heterogeneity; however, kernel-based smoothing effectively improves local spatial consistency and classification robustness.
The Mahalanobis Distance classifier exhibited a conservative classification behavior across all configurations. Without kernel, it achieved an IoU of 63.17%, an F1-score of 77.43%, precision of 87.22%, and recall of 69.61%. With a 3 × 3 kernel, the IoU slightly increased to 63.49%, while the F1-score reached 77.66%, precision 87.29%, and recall 69.95%. Under the 5 × 5 kernel configuration, the classifier achieved an IoU of 63.80%, an F1-score of 77.90%, precision of 87.07%, and recall of 70.47%. The marginal improvement across kernel sizes suggests that spatial filtering has limited impact on this classifier, due to its strong reliance on spectral covariance structures, which reduces its flexibility in modeling non-linear spectral variability in heterogeneous land cover.
Finally, the Minimum Distance classifier showed the weakest performance among all evaluated models. Without kernel, it produced an IoU of 22.08%, an F1-score of 36.17%, precision of 28.09%, and recall of 50.76%. With a 3 × 3 kernel, performance improved slightly to an IoU of 25.55%, an F1-score of 40.70%, precision of 33.82%, and recall of 51.08%. Under the 5 × 5 kernel configuration, it reached an IoU of 29.83%, an F1-score of 45.95%, precision of 41.08%, and recall of 52.12%. Despite these incremental gains, the classifier remains substantially inferior to the other methods, primarily due to its reliance on simple Euclidean distance measures, which are inadequate for separating spectrally overlapping classes such as water and dark soil in high-resolution imagery.
Overall, the results indicate that spatial filtering generally improves classification performance across all models, with consistent gains observed in IoU, F1-score, precision, and recall. However, the magnitude of improvement varies depending on the underlying assumptions of each method. Probabilistic and learning-based classifiers benefit more effectively from spatial context, whereas rigid distance-based methods show only limited sensitivity to kernel-based smoothing.
3.3. Impact of Kernelization on Spatial Accuracy
The quantitative results presented in Table 2 and Figure 6 demonstrate that spatial filtering via kernel application proved to be a decisive factor in enhancing the segmentation quality of the traditional machine learning models. This approach significantly improved spatial coherence and classification homogeneity, particularly within highly fragmented and textured agricultural landscapes. In the case of the Maximum Likelihood classifier, the 5 × 5 kernel improved area estimation accuracy, effectively reducing underestimation and increasing the correctly segmented area from 23.60 ha (no kernel) to 23.93 ha (5 × 5). Similarly, the Neural Net classifier benefited from kernel-based processing, which reduced spectral noise and aligned the predicted pond geometries more closely with the ground truth (improving identified area from 25.02 ha to 25.37 ha). In contrast, the Mahalanobis and Minimum Distance classifiers exhibited only marginal or inconsistent performance gains, underscoring their limited adaptability to spatial support. Essentially, kernelization serves as a form of local context regularization, assisting models in simulating the spatial correlation inherent in water body features. However, it should be noted that while increasing kernel size improves spatial consistency, the gain tends to saturate at larger kernels, suggesting a trade-off between spatial smoothing and boundary preservation, particularly for small or narrow ponds.
Table 2.
Comparison of agricultural pond area estimates derived from different detection methods (ha).
Figure 6.
Comparison of misclassified irrigation pond areas across different models.
The qualitative comparisons presented in Figure 7 and Figure 8 further corroborate the quantitative findings. Figure 7 presents representative segmentation outputs generated by the deep learning models and traditional machine learning classifiers, highlighting noticeable differences in boundary delineation, spatial continuity, and the detection of agricultural ponds. Consistent with the quantitative evaluation, the deep learning models produced more accurate and spatially coherent segmentation maps, whereas the traditional classifiers exhibited greater fragmentation and more frequent misclassification in spectrally heterogeneous regions. Figure 8 complements this comparison by illustrating the spatial distribution of correctly detected pond areas together with false negatives and false positives. The error overlays reveal that the deep learning models substantially reduced both omission and commission errors compared with the traditional classifiers, particularly along complex pond boundaries and for small agricultural ponds, thereby providing visual confirmation of their superior segmentation performance.
Figure 7.
Representative outputs of deep learning models and traditional machine learning classifiers for agricultural pond identification.
Figure 8.
Qualitative comparison of segmentation performance over the study area. White regions indicate correctly detected pond areas, green regions represent false negatives (missed detections), and red regions denote false positives (over-segmented areas). The overlays highlight the spatial distribution of model prediction errors and are intended solely for qualitative performance assessment; therefore, they are not georeferenced maps.
Qualitative comparison demonstrates that BiSeNet provides the most robust and spatially consistent pond delineation under varying illumination, vegetation cover, and background complexity, while the remaining models exhibit occasional under-segmentation, over-segmentation, or false detections.
3.4. Estimation of Evaporation Losses Using the Meyer Method
Evaporation from agricultural ponds was estimated using the empirical Meyer method based on meteorological observations from March to November 2024. The results indicate that the cumulative potential evaporation from an open water surface during this period reached 1404.52 mm, assuming an average water presence of 15 days per month. Under continuous 30-day water presence, the estimated cumulative evaporation increases to 2902.72 mm, with a mean evaporation rate of 10.4 mm day−1. The seasonal pattern reveals clear temporal variability, with minimum evaporation occurring in early spring (March) and late autumn (November), and maximum values observed during the summer, particularly in July. This trend closely follows the seasonal increase in air temperature and solar radiation (Figure 9).
Figure 9.
Temporal variation in monthly evaporation from March to November 2024.
A detailed summary of the monthly meteorological variables and corresponding evaporation estimates is provided in Table 3. The correlation analysis (Figure 10) reveals that evaporation exhibits an exceptionally strong positive correlation with vapor pressure deficit (es − ea; r = 0.998), indicating that atmospheric dryness is the primary climatic factor associated with increased evaporation. Wind speed (U) also shows a very strong positive correlation (r = 0.984), highlighting its important role in enhancing turbulent exchange and facilitating moisture transport from the water surface. Maximum temperature (Tmax) is likewise strongly and positively correlated with evaporation (r = 0.968), suggesting that higher temperatures provide favorable thermal conditions for increased evaporative losses. In contrast, relative humidity (RH) demonstrates a strong negative correlation with evaporation (r = −0.873), reflecting the reduction in evaporative demand under more humid atmospheric conditions. These relationships collectively confirm the dominant influence of atmospheric moisture deficit, wind speed, and temperature on evaporation dynamics.
Table 3.
Monthly meteorological variables and evaporation estimates calculated using the Meyer method.
Figure 10.
Correlation analysis between key meteorological variables and evaporation over the study period.
A detailed summary of the monthly meteorological inputs and the corresponding modeled evaporation values is provided in Table 3, which formed the basis for the subsequent volumetric water loss calculations.
3.5. Estimation of Water Volume Losses
The delineated pond surface represents the maximum geometric water surface of the agricultural reservoirs and was therefore used to estimate the potential evaporation loss. Because irrigation reservoirs are filled and emptied asynchronously according to irrigation schedules and water allocation policies, a single image acquired on any given date cannot reliably represent the average monthly water surface of all ponds. Consequently, the use of a single reference image provides a consistent basis for estimating the potential evaporation losses at the regional scale.
To quantify the total water loss from the agricultural ponds, the estimated evaporative depth was converted into volumetric losses by applying the pond surface area derived from the remote sensing model (approximately 27.67 ha or 276,700 m2). Monthly evaporative volumes were calculated by multiplying the specific evaporation depth for each month by this consistent surface area, as summarized in Table 4.
Table 4.
Total volumetric water loss due to evaporation from agricultural ponds.
The resulting volumetric water losses exhibit pronounced seasonal variability, as illustrated in Figure 11. The peak water loss was recorded in July (79,623.7 m3), closely followed by August (75,825.53 m3), which aligns with the highest evaporative demand during the mid-summer period. Conversely, the lowest monthly loss occurred in November (15,061.03 m3), reflecting the decrease in solar radiation and thermal energy. Over the nine-month study period from March to November 2024, the cumulative volume of water evaporated from the open-water surfaces was estimated to be 388,636.7 m3.
Figure 11.
Monthly volumetric water loss due to evaporation from agricultural ponds.
A detailed summary of the monthly meteorological variables and the corresponding modeled evaporation values is presented in Table 3. To further quantify the relationships between evaporation and the investigated climatic variables, Pearson correlation coefficients (r), coefficients of determination (R2), and statistical significance levels (p-values) were calculated, as summarized in Table 5 and Figure 12. The results demonstrate that all investigated variables exhibited statistically significant relationships with evaporation (p < 0.01), indicating that the selected meteorological variables effectively captured the seasonal variability of open-water evaporation during the study period.
Table 5.
Pearson correlation coefficients (r), coefficients of determination (R2), and p-values between monthly evaporation and the investigated meteorological variables.
Figure 12.
Pearson correlation coefficients (r) between monthly evaporation and the investigated meteorological variables. Blue bars represent positive correlation coefficients, whereas the red bar represents a negative correlation coefficient.
Among all variables, the vapor pressure deficit (es − ea) exhibited the strongest positive correlation with evaporation (r = 0.9976, R2 = 99.52%), indicating that atmospheric moisture demand was the dominant factor controlling evaporation. This result is physically consistent with the Meyer equation, in which the vapor pressure deficit appears as the principal driving term governing the moisture gradient between the water surface and the surrounding atmosphere. Consequently, periods characterized by larger vapor pressure deficits resulted in substantially higher evaporation rates.
Wind speed also showed a very strong positive correlation with evaporation (r = 0.9845, R2 = 96.92%). Although its influence was slightly weaker than that of the vapor pressure deficit, wind contributes directly to the Meyer equation through the aerodynamic term (1 + U/16), enhancing turbulent air exchange above the water surface and continuously replacing moist air with drier air, thereby promoting evaporation.
Both minimum and maximum air temperatures demonstrated very strong positive correlations with evaporation (r = 0.9740 and 0.9683, respectively). Although temperature is not an explicit input variable in the Meyer equation, its influence is reflected indirectly through its effect on the saturation vapor pressure (es), which subsequently increases the vapor pressure deficit. The high correlation observed for both temperature variables therefore reflect the strong seasonal dependence of atmospheric evaporative demand rather than a direct mathematical contribution to the evaporation equation.
Conversely, relative humidity exhibited a strong negative correlation with evaporation (r = −0.8727, R2 = 76.16%), indicating that increasing atmospheric moisture suppresses evaporation by reducing the vapor pressure gradient between the water surface and the surrounding air. Although the magnitude of this relationship was lower than that of the other investigated variables, it remained statistically significant (p = 0.0021), confirming the important role of atmospheric humidity in regulating evaporation under semi-arid climatic conditions.
Overall, the correlation analysis demonstrates that the observed relationships closely follow the physical principles governing open-water evaporation and are fully consistent with the mathematical structure of the Meyer equation. The results further indicate that atmospheric moisture demand, represented by the vapor pressure deficit, exerts a substantially stronger control on evaporation than the remaining meteorological variables, thereby providing additional confidence in the applicability of the Meyer method for estimating evaporation losses from agricultural water storage ponds.
4. Discussion
Strategies for Reducing Evaporation from Agricultural Ponds
Evaporative losses from open-water storage can account for up to 40% of the total stored water in farm ponds located in arid and semi-arid climates. Consequently, a variety of mitigation approaches including chemical, physical, and structural interventions have been investigated to reduce evaporation losses. The following discussion summarizes several practical strategies that have demonstrated effectiveness in previous empirical studies. One widely investigated approach involves the use of chemical surface films. Monomolecular films formed by long-chain fatty alcohols such as hexadecanol (C16) and octadecanol (C18) create extremely thin layers at the air–water interface. In these films, the hydrophilic –OH group is oriented toward the water while the hydrophobic hydrocarbon chain extends toward the air. This configuration allows gaseous exchange while forming a molecular barrier that reduces the escape of water molecules, thereby suppressing evaporation. The effectiveness of these monolayers is attributed to the increased resistance to mass transfer generated by the densely packed molecular layer that water molecules must cross. Experimental studies have shown that long-chain alcohol films can significantly decrease evaporation rates from water surfaces. Their performance depends strongly on the hydrocarbon chain length and the degree of molecular ordering at the interface. Well-ordered films exhibit molecules oriented nearly perpendicular to the water surface with hydrogen bonding between –OH groups, whereas disordered layers allow greater permeability to water vapor. Such monolayers have been studied for evaporation control in reservoirs, open water bodies, and even concrete curing applications. However, their effectiveness under field conditions can be reduced by environmental factors such as wind, wave action, and temperature fluctuations, which can destabilize the film and reduce its persistence [43,44,45].
Physical surface covers represent another widely explored evaporation-reduction strategy. Floating modular elements such as interlocking plastic disks or expanded polystyrene sheets partially cover the water surface, thereby reducing the exposed area available for evaporation. These floating structures form a self-assembling layer that limits direct solar radiation and wind interaction at the air–water interface while also modifying the local microclimate above the water surface by reducing convective mass transfer. The effectiveness of such systems depends on factors including the fractional surface coverage, geometry and material properties of the floating units, and prevailing climatic conditions such as wind speed, air temperature, and humidity. Field and laboratory experiments have demonstrated that well-designed floating modular systems can reduce evaporation by approximately 40–60%, indicating strong potential for application in reservoirs, canals, and agricultural water storage systems. In addition to reducing evaporation, these structures may also contribute to improved water quality by limiting light penetration and suppressing algal growth, and they can potentially serve as platforms for integrated technologies such as floating solar energy systems or environmental monitoring devices [46]. Another physical approach involves suspended shading structures installed above the pond surface. Porous shade fabrics or polyethylene tarps can reduce incoming solar radiation and cool the microclimate above the water surface, thereby decreasing evaporation rates. Studies conducted in Mediterranean climates have reported evaporation reductions of approximately 14–21% when such shading systems are installed above small reservoirs or ponds [47].
Wind reduction strategies also play an important role in limiting evaporative losses. Vegetative buffers or semi-permeable windbreak fences installed around ponds can significantly reduce near-surface wind velocity. By attenuating airflow and creating sheltered microclimatic conditions above the water surface, these structures decrease the turbulent transport of water vapor away from the air–water interface, which directly reduces convective evaporation. Previous studies have demonstrated that windbreak systems can lead to measurable and sustained reductions in annual evaporation from ponds and small reservoirs [48,49,50]. In practice, the most effective approach often involves combining multiple evaporation mitigation techniques. Integrated strategies that incorporate surface films, floating or shading structures, and windbreaks can produce synergistic benefits, resulting in greater reductions in water loss than any single technique applied independently. However, the selection of appropriate methods should consider local climatic conditions, pond morphology, operational requirements, and economic feasibility in order to achieve optimal performance and cost-effectiveness in agricultural water management systems [51].
5. Limitations and Future Research Direction
Although the proposed framework demonstrated satisfactory performance in identifying agricultural water storage ponds and estimating evaporation, this study, like other investigations based on remote sensing and climatic data, is subject to several limitations that should be considered when interpreting the results and planning future research.
First, the exact depth of individual agricultural ponds was not measured through field surveys. Detailed engineering records and design specifications of these ponds are generally not publicly accessible through the responsible organizations. Moreover, since most agricultural ponds are privately owned, comprehensive field inspections and direct geometric measurements, including pond depth, are often restricted due to limited site accessibility and the inability to obtain permission from landowners. Nevertheless, based on the common engineering design practices of agricultural irrigation reservoirs, as well as consultations with specialists in modern irrigation systems, these ponds are typically designed to maximize water storage capacity within a limited surface area and therefore generally have depths exceeding 2 m. Consequently, the use of the Meyer empirical coefficient (C = 0.36) for deep-water bodies is considered appropriate for the conditions of the present study. Future studies incorporating detailed pond-depth measurements could further reduce uncertainty and improve the accuracy of evaporation estimates.
Another limitation is that the volumetric evaporation calculations were performed using the delineated pond surface extracted from a single reference VHR image. Although seasonal fluctuations in water surface area may occur due to irrigation schedules and water withdrawals, agricultural storage ponds are engineered to operate near their storage capacity whenever water is available. More importantly, irrigation reservoirs are filled and emptied asynchronously according to individual irrigation schedules, water allocation policies, and farmers’ management practices. Consequently, even the use of monthly or seasonal imagery would only capture the water surface conditions on the image acquisition date and would not necessarily represent the average water surface area throughout the corresponding period. Reliable estimation of temporally varying pond surface areas would require high-frequency observations together with detailed operational information, including irrigation schedules, water allocation timing, inflow and outflow records, and reservoir management data, which are generally unavailable. Therefore, the use of a single reference pond surface provides a consistent basis for estimating the potential regional evaporation losses from agricultural water storage ponds. Future studies integrating high-frequency remote sensing observations and operational reservoir data may further improve temporal representation of water surface dynamics.
Second, a very-high-resolution (VHR) image obtained from Bing Maps was used as the reference dataset for delineating agricultural pond boundaries. Although multi-temporal VHR imagery would provide a more detailed representation of seasonal water-surface variations, such imagery is generally not updated at short temporal intervals, and acquiring images corresponding to multiple observation dates requires access to commercially available multi-temporal VHR imagery, which is not always readily available for the desired acquisition dates. Furthermore, unlike natural water bodies, agricultural water storage ponds are engineered structures with stable geometry, and their boundaries remain essentially unchanged after construction. Seasonal variations primarily affect the stored water volume rather than the physical extent of the pond itself. Therefore, the use of a single high-resolution reference image for pond delineation is considered geometrically appropriate for the purposes of this study. Nevertheless, future research utilizing multi-temporal VHR imagery could provide a more comprehensive assessment of seasonal water-surface dynamics and improve evaporation monitoring.
Third, evaporation was estimated using the Meyer method. This method was selected because it requires fewer meteorological variables than many physically based evaporation models, while relying on meteorological observations that are routinely available at most weather stations. In contrast, methods such as the FAO Penman–Monteith model require a more extensive set of climatic variables that are not always available, particularly for regional-scale studies. Therefore, the Meyer method provides a practical balance between data availability, computational simplicity, and acceptable estimation accuracy. Nevertheless, future studies could compare the performance of the Meyer method with other evaporation models under different climatic conditions to further evaluate its applicability and robustness.
Fourth, the proposed framework was evaluated using agricultural water storage ponds located in Bastam, Shahrud County, Semnan province, Iran. Although the methodology is primarily based on remote sensing imagery and meteorological data and is therefore potentially transferable to other regions, variations in climatic conditions, pond geometry, irrigation practices, and local management strategies may influence its performance. Consequently, further validation in different climatic regions and agricultural environments would enhance the generalizability and robustness of the proposed framework.
Finally, the absence of direct field measurements of evaporation from the studied agricultural ponds limited the possibility of performing direct validation of the estimated evaporation values. Future investigations integrating long-term field observations or direct evaporation measurements could improve model calibration, reduce uncertainty, and further enhance the reliability of evaporation estimates.
Overall, several promising research directions can further enhance the applicability and robustness of the proposed framework. First, future studies should investigate the performance of alternative evaporation models, such as the FAO Penman–Monteith, Priestley–Taylor, Hargreaves, and Dalton methods, and compare their results with those obtained using the Meyer method under different climatic and environmental conditions. Second, the integration of future climate projections derived from CMIP6 scenarios would enable the assessment of climate change impacts on evaporation dynamics from agricultural water storage ponds, thereby supporting long-term irrigation water management and climate adaptation planning. Third, the use of multi-temporal very-high-resolution (VHR) imagery would facilitate more detailed monitoring of seasonal variations in water surface dynamics and improve the temporal accuracy of evaporation assessments. In addition, integrating unmanned aerial vehicle (UAV)-based observations could provide highly detailed geometric and surface information, enabling more accurate delineation of pond boundaries, improved field validation, and enhanced evaporation estimation. Finally, validating the proposed framework across different climatic regions, agricultural systems, and pond characteristics would further demonstrate its transferability and strengthen its general applicability.
6. Conclusions
Water scarcity has emerged as one of the most critical challenges facing agricultural systems in semi-arid regions, where increasing temperatures, declining precipitation, and inefficient water management practices have intensified pressure on limited freshwater resources. In such environments, agricultural ponds play a pivotal role in buffering seasonal water shortages by storing surface water for irrigation. However, substantial water losses due to evaporation from open pond surfaces significantly undermine their effectiveness, making accurate monitoring and loss assessment essential for sustainable agricultural water management.
In this research, an integrated framework for detecting agricultural ponds and analyzing evaporation loss in Bastam, Iran, was proposed using deep learning and high-resolution satellite imagery. Deep learning models including BiSeNet, UNet3+, and SegNet were implemented and evaluated against traditional machine learning classifiers. Among them, BiSeNet achieved the best performance, demonstrating its capability for fine-scale water body delineation and outperforming conventional methods in mapping small and spectrally heterogeneous ponds. This improved delineation strengthened the reliability of subsequent evaporation assessment, highlighting the value of combining image-based pond detection with empirical hydrological analysis. Evaporation analysis based on the Meyer method indicated substantial water loss from agricultural ponds during the warm season, reflecting the sensitivity of open-water storage systems to climatic conditions such as vapor pressure deficit, temperature, and wind speed. These findings emphasize that accurate surface water mapping is not only important for inventorying pond extent, but also for understanding water availability and evaporative stress at the farm scale. The integration of remote sensing and evaporation modeling therefore provides a practical basis for evaluating water loss dynamics in semi-arid agricultural settings.
Implementation of mitigation measures such as surface films, shade cloths, and windbreaks is expected to reduce evaporation under controlled conditions, contributing to improved water conservation in water-scarce agricultural systems. Overall, this research provides a scalable and transferable framework that supports more reliable pond monitoring, evaporation loss estimation, and data-driven water management in semi-arid regions. Future research should focus on improving model generalization across diverse geographic regions, integrating multi-sensor satellite observations to enhance robustness, and exploring lightweight architectures for operational or near-real-time pond monitoring.
Author Contributions
For this research articles authors have contributed as: S.K.; writing—original draft preparation, S.G., F.K., M.A.C.; writing—review and editing, S.K., M.A.C.; software analysis, S.G.; supervision, A.G., M.Z.S.; Data collection and training dataset, S.G.; visualization and result. All authors have read and agreed to the published version of the manuscript.
Funding
This research received no external funding.
Data Availability Statement
The original contributions presented in this study are included in the article. Further inquiries can be directed to the corresponding author(s).
Acknowledgments
We would like to acknowledge the Water Authority Organization of Semnan Province for providing the datasets used in this research.
Conflicts of Interest
The authors declare no conflicts of interest.
References
- Goshu, B.S.; Ridwan, M. Earth: The Nexus of Science, Spirituality, and Societal Strife. Lakhomi J. Sci. J. Cult. 2024, 5, 34–50. [Google Scholar]
- De Luca, D.A.; Cocca, D.; Egidio, E.; Lasagna, M. Earthwater Resources: A Quantitative Evaluation and Future Challenges. In Water Reuse and Unconventional Water Resources: A Multidisciplinary Perspective; Springer: Cham, Switzerland, 2024; pp. 13–38. [Google Scholar]
- Mishra, B.K.; Kumar, P.; Saraswat, C.; Chakraborty, S.; Gautam, A. Water security in a changing environment: Concept, challenges and solutions. Water 2021, 13, 490. [Google Scholar] [CrossRef] [Scilit]
- Tzanakakis, V.A.; Paranychianakis, N.V.; Angelakis, A.N. Water supply and water scarcity. Water 2020, 12, 2347. [Google Scholar] [CrossRef] [Scilit]
- Khoshnevisan, S.; Emamgholizadeh, S.; Ashouri, R. Predicting Temperature and Precipitation Changes in the Shahrood Region Using CMIP6 Climate Models with a Novel Multi-Criteria Decision-Making Approach: OPLO-POCOD. Adv. Technol. Water Effic. 2025. [Google Scholar] [CrossRef]
- Bukhari, S.R.H.; Khan, A.U.; Noreen, S. Optimizing Water Resource Governance for Sustainable Agricultural and Hydroelectric Development in Pakistan: An In-Depth Examination and Policy Prescriptions. J. Dev. Soc. Sci. 2024, 5, 280–293. [Google Scholar] [CrossRef] [Scilit]
- Soltani, S.; Mosavi, S.H.; Saghaian, S.H.; Azhdari, S.; Alamdarlo, H.N.; Khalilian, S. Climate change and energy use efficiency in arid and semiarid agricultural areas: A case study of Hamadan-Bahar plain in Iran. Energy 2023, 268, 126553. [Google Scholar] [CrossRef] [Scilit]
- Jahanshahi, A.; Booij, M.J.; Patil, S.D.; Gupta, H. An ensemble-based projection of future hydro-climatic extremes in Iran. J. Hydrol. 2024, 642, 131892. [Google Scholar] [CrossRef] [Scilit]
- Stringer, L.C.; Mirzabaev, A.; Benjaminsen, T.A.; Harris, R.M.; Jafari, M.; Lissner, T.K.; Stevens, N.; Tirado-von Der Pahlen, C. Climate change impacts on water security in global drylands. One Earth 2021, 4, 851–864. [Google Scholar] [CrossRef] [Scilit]
- Khoshnevisan, S.; Emamgholizadeh, S.; Asli Charandabi, M.; Khakzad, S.F. Comparative Evaluation of Machine Learning Algorithms for Groundwater Level Modeling and Prediction: A Case Study of the Shahrood Plain. J. Aquifer Qanat 2025, 6, 77–96. [Google Scholar] [CrossRef]
- Mal, S.; Panchal, S. Drought and salt stress mitigation in crop plants using stress-tolerant auxin-producing endophytic bacteria: A futuristic approach towards sustainable agriculture. Front. Plant Sci. 2024, 15, 1422504. [Google Scholar] [CrossRef] [Scilit] [PubMed]
- Yasmeen, K.; Yasmin, K.; Adnan, M. Traits impacting water crisis management. Discov. Water 2024, 4, 12. [Google Scholar] [CrossRef] [Scilit]
- Barbosa Llauet, O. Mitigation of Floods and Droughts in Tropical Wet & Dry Climate Regions Through Water Resource Management. A Case Study in Lake Tana, Ethiopia; Universitat Politècnica de Catalunya: Barcelona, Spain, 2022. [Google Scholar]
- Shang, M.; Xie, J. Agricultural sustainable development: Soil, water resources, biodiversity, climate change, and technological innovation. Adv. Resour. Res. 2024, 4, 181–204. [Google Scholar]
- Suna, T.; Kumari, A.; Paramaguru, P.K.; Kushwaha, N. Enhancing agricultural water productivity using deficit irrigation practices in water-scarce regions. In Enhancing Resilience of Dryland Agriculture Under Changing Climate: Interdisciplinary and Convergence Approaches; Springer: Singapore, 2023; pp. 177–206. [Google Scholar]
- Paria, B.; Pani, A.; Mishra, P.; Behera, B. Irrigation-based agricultural intensification and future groundwater potentiality: Experience of Indian states. SN Appl. Sci. 2021, 3, 449. [Google Scholar] [CrossRef] [Scilit]
- Donchyts, G.; Winsemius, H.; Baart, F.; Dahm, R.; Schellekens, J.; Gorelick, N.; Iceland, C.; Schmeier, S. High-resolution surface water dynamics in Earth’s small and medium-sized reservoirs. Sci. Rep. 2022, 12, 13776. [Google Scholar] [CrossRef] [Scilit] [PubMed]
- Yang, L.; Driscol, J.; Sarigai, S.; Wu, Q.; Lippitt, C.D.; Morgan, M. Towards synoptic water monitoring systems: A review of AI methods for automating water body detection and water quality monitoring using remote sensing. Sensors 2022, 22, 2416. [Google Scholar] [CrossRef] [Scilit] [PubMed]
- Paheding, S.; Saleem, A.; Siddiqui, M.F.H.; Rawashdeh, N.; Essa, A.; Reyes, A.A. Advancing horizons in remote sensing: A comprehensive survey of deep learning models and applications in image classification and beyond. Neural Comput. Appl. 2024, 36, 16727–16767. [Google Scholar] [CrossRef] [Scilit]
- Khoshnevisan, S.; Gharechelou, S.; Mortazavi, R.; Khakzad, F. Water Bodies Extraction from Remote Sensing Data by Comparison of Deep Learning Models. Iran. J. Ecohydrol. 2024, 11, 321–336. [Google Scholar]
- Li, W.; Dai, R.; Zeng, M.; Wang, Q. Review of two types of surface modification on pool boiling enhancement: Passive and active. Renew. Sustain. Energy Rev. 2020, 130, 109926. [Google Scholar] [CrossRef] [Scilit]
- Kumar, S.; Meena, R.S.; Sheoran, S.; Jangir, C.K.; Jhariya, M.K.; Banerjee, A.; Raj, A. Remote sensing for agriculture and resource management. In Natural Resources Conservation and Advances for Sustainability; Elsevier: Amsterdam, The Netherlands, 2022; pp. 91–135. [Google Scholar]
- Ubina, N.A.; Cheng, S.-C. A review of unmanned system technologies with its application to aquaculture farm monitoring and management. Drones 2022, 6, 12. [Google Scholar] [CrossRef] [Scilit]
- Tian, P.; Liu, Y.; Li, J.; Pu, R.; Cao, L.; Zhang, H.; Ai, S.; Yang, Y. Mapping coastal aquaculture ponds of China using sentinel SAR images in 2020 and google earth engine. Remote Sens. 2022, 14, 5372. [Google Scholar] [CrossRef] [Scilit]
- Cacciuttolo, C.; Cano, D. Spatial and Temporal Study of Supernatant Process Water Pond in Tailings Storage Facilities: Use of Remote Sensing Techniques for Preventing Mine Tailings Dam Failures. Sustainability 2023, 15, 4984. [Google Scholar] [CrossRef] [Scilit]
- Tahmasebi, P.; Kamrava, S.; Bai, T.; Sahimi, M. Machine learning in geo-and environmental sciences: From small to large scale. Adv. Water Resour. 2020, 142, 103619. [Google Scholar] [CrossRef] [Scilit]
- Fu, G.; Jin, Y.; Sun, S.; Yuan, Z.; Butler, D. The role of deep learning in urban water management: A critical review. Water Res. 2022, 223, 118973. [Google Scholar] [CrossRef] [Scilit] [PubMed]
- Rajendiran, N.; Kumar, L.S. Pixel level feature extraction and machine learning classification for water body extraction. Arab. J. Sci. Eng. 2023, 48, 9905–9928. [Google Scholar]
- Endo, T. Analysis of Conventional Feature Learning Algorithms and Advanced Deep Learning Models. J. Robot. Spectr. 2023, 1, 001–012. [Google Scholar]
- Mortazavi, R.; Gharechelou, S.; Khoshnevisan, S.; Khoshnevisan, E.; Khakzad, S.F. Improved semantic segmentation for urban mapping with a combined loss function approach. Int. J. Remote Sens. 2025, 46, 7320–7343. [Google Scholar] [CrossRef] [Scilit]
- Sit, M.; Demiray, B.Z.; Xiang, Z.; Ewing, G.J.; Sermet, Y.; Demir, I. A comprehensive review of deep learning applications in hydrology and water resources. Water Sci. Technol. 2020, 82, 2635–2670. [Google Scholar] [CrossRef] [Scilit] [PubMed]
- Sagan, V.; Peterson, K.T.; Maimaitijiang, M.; Sidike, P.; Sloan, J.; Greeling, B.A.; Maalouf, S.; Adams, C. Monitoring inland water quality using remote sensing: Potential and limitations of spectral indices, bio-optical simulations, machine learning, and cloud computing. Earth-Sci. Rev. 2020, 205, 103187. [Google Scholar] [CrossRef] [Scilit]
- Cabrera, M.; Anache, J.A.; Youlton, C.; Wendland, E. Performance of evaporation estimation methods compared with standard 20 m2 tank. Rev. Bras. Eng. Agríc. Ambient. 2016, 20, 874–879. [Google Scholar] [CrossRef] [Scilit]
- Jeon, M.S.; Lee, K.W.; Kim, D.Y.; Maeng, S.J.; Park, I.S.; Lee, J.J. Observation of water surface evaporation in agricultural reservoirs. Crisis Emerg. Manag. Theory Prax. 2022, 18, 63–73. [Google Scholar] [CrossRef] [Scilit]
- Nagaraj, R.; Kumar, L.S. Extraction of Surface Water Bodies using Optical Remote Sensing Images: A Review. Earth Sci. Inform. 2024, 17, 893–956. [Google Scholar] [CrossRef] [Scilit]
- Rimal, B.; Rijal, S.; Kunwar, R. Comparing support vector machines and maximum likelihood classifiers for mapping of urbanization. J. Indian. Soc. Remote Sens. 2020, 48, 71–79. [Google Scholar]
- Wang, W.; Li, W.; Zhang, C.; Zhang, W. Improving object-based land use/cover classification from medium resolution imagery by Markov chain geostatistical post-classification. Land 2018, 7, 31. [Google Scholar] [CrossRef] [Scilit]
- Dong, Y.; Fan, L.; Zhao, J.; Huang, S.; Geiß, C.; Wang, L.; Taubenböck, H. Mapping of small water bodies with integrated spatial information for time series images of optical remote sensing. J. Hydrol. 2022, 614, 128580. [Google Scholar] [CrossRef] [Scilit]
- Pham, H.N.; Dang, K.B.; Nguyen, T.V.; Tran, N.C.; Ngo, X.Q.; Nguyen, D.A.; Phan, T.T.H.; Nguyen, T.T.; Guo, W.; Ngo, H.H. A new deep learning approach based on bilateral semantic segmentation models for sustainable estuarine wetland ecosystem management. Sci. Total Environ. 2022, 838, 155826. [Google Scholar] [CrossRef] [Scilit] [PubMed]
- Sun, D.; Gao, G.; Huang, L.; Liu, Y.; Liu, D. Extraction of water bodies from high-resolution remote sensing imagery based on a deep semantic segmentation network. Sci. Rep. 2024, 14, 14604. [Google Scholar] [CrossRef] [Scilit] [PubMed]
- Khakzad, S.F.; Firozjaee, T.T.; Mortazavi, R.; Khoshnevisan, E.; Khoshnevisan, S. Comparative Analysis of Convolutional Neural Networks Performance in Remote Sensing for Solar Panel Detection. In Proceedings of the 2024 10th International Conference on Signal Processing and Intelligent Systems (ICSPIS), Virtual, 12–14 November 2024; pp. 11–16. [Google Scholar]
- Gorjizade, A.; Akhondali, A.M.; Zarei, H.; Seyyed, K.H. Evaluation of eight evaporation estimation methods in a semi-arid region (Dez reservoir, Iran). Int. J. Adv. Biol. Biomed. Res. 2014, 2, 1823–1836. [Google Scholar]
- Henry, D.J.; Dewan, V.I.; Prime, E.L.; Qiao, G.G.; Solomon, D.H.; Yarovsky, I. Monolayer structure and evaporation resistance: A molecular dynamics study of octadecanol on water. J. Phys. Chem. B 2010, 114, 3869–3878. [Google Scholar] [CrossRef] [Scilit] [PubMed]
- Miles, R.E.; Davies, J.F.; Reid, J.P. The influence of the surface composition of mixed monolayer films on the evaporation coefficient of water. Phys. Chem. Chem. Phys. 2016, 18, 19847–19858. [Google Scholar] [CrossRef] [Scilit] [PubMed]
- Karimzadeh, M.; Zahiri, J.; Nobakht, V. Efficiency of monolayers in evaporation suppression from water surface considering meteorological parameters. Environ. Sci. Pollut. Res. 2023, 30, 50783–50794. [Google Scholar] [CrossRef] [Scilit]
- Aminzadeh, M.; Lehmann, P.; Or, D. Evaporation suppression and energy balance of water reservoirs covered with self-assembling floating elements. Hydrol. Earth Syst. Sci. 2018, 22, 4015–4032. [Google Scholar] [CrossRef] [Scilit]
- Álvarez, V.M.; Baille, A.; Martínez, J.M.M.; Real, M.M.G. Effect of black polyethylene shade covers on the evaporation rate of agricultural reservoirs. Span. J. Agric. Res. 2006, 4, 280–288. [Google Scholar] [CrossRef] [Scilit]
- Hipsey, M.R.; Sivapalan, M. Parameterizing the effect of a wind shelter on evaporation from small water bodies. Water Resour. Res. 2003, 39, 1339. [Google Scholar] [CrossRef] [Scilit]
- Hipsey, M.; Sivapalan, M.; Clement, T. A numerical and field investigation of surface heat fluxes from small wind-sheltered waterbodies in semi-arid Western Australia. Environ. Fluid Mech. 2004, 4, 79–106. [Google Scholar] [CrossRef] [Scilit]
- Helfer, F.; Zhang, H.; Lemckert, C. Evaporation Reduction by Windbreaks: Overview, Modelling and Efficiency; Urban Water Security Research Alliance: Brisbane, Australia, 2009. [Google Scholar]
- Gallego-Elvira, B.; Martínez Alvarez, V.; Pittaway, P.; Symes, T.; Hancock, N. The combined use of shade-cloth covers and monolayers to prevent evaporation in irrigation reservoirs. In Proceedings of the International Conference on Agricultural Engineering: Towards Environmental Technologies (2010), Clermont-Ferrand, France, 6–8 September 2010. [Google Scholar]
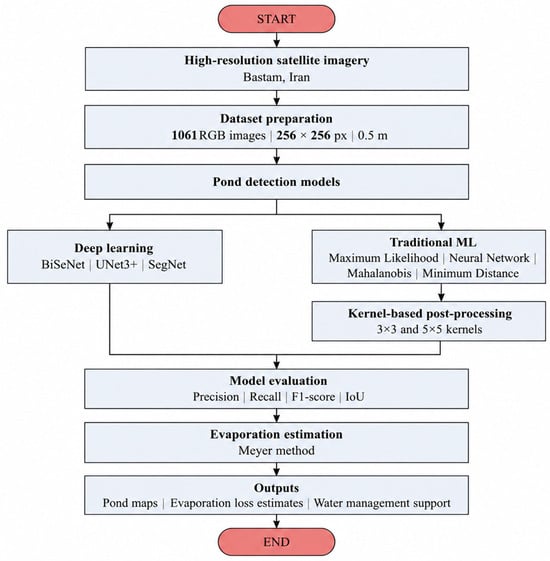
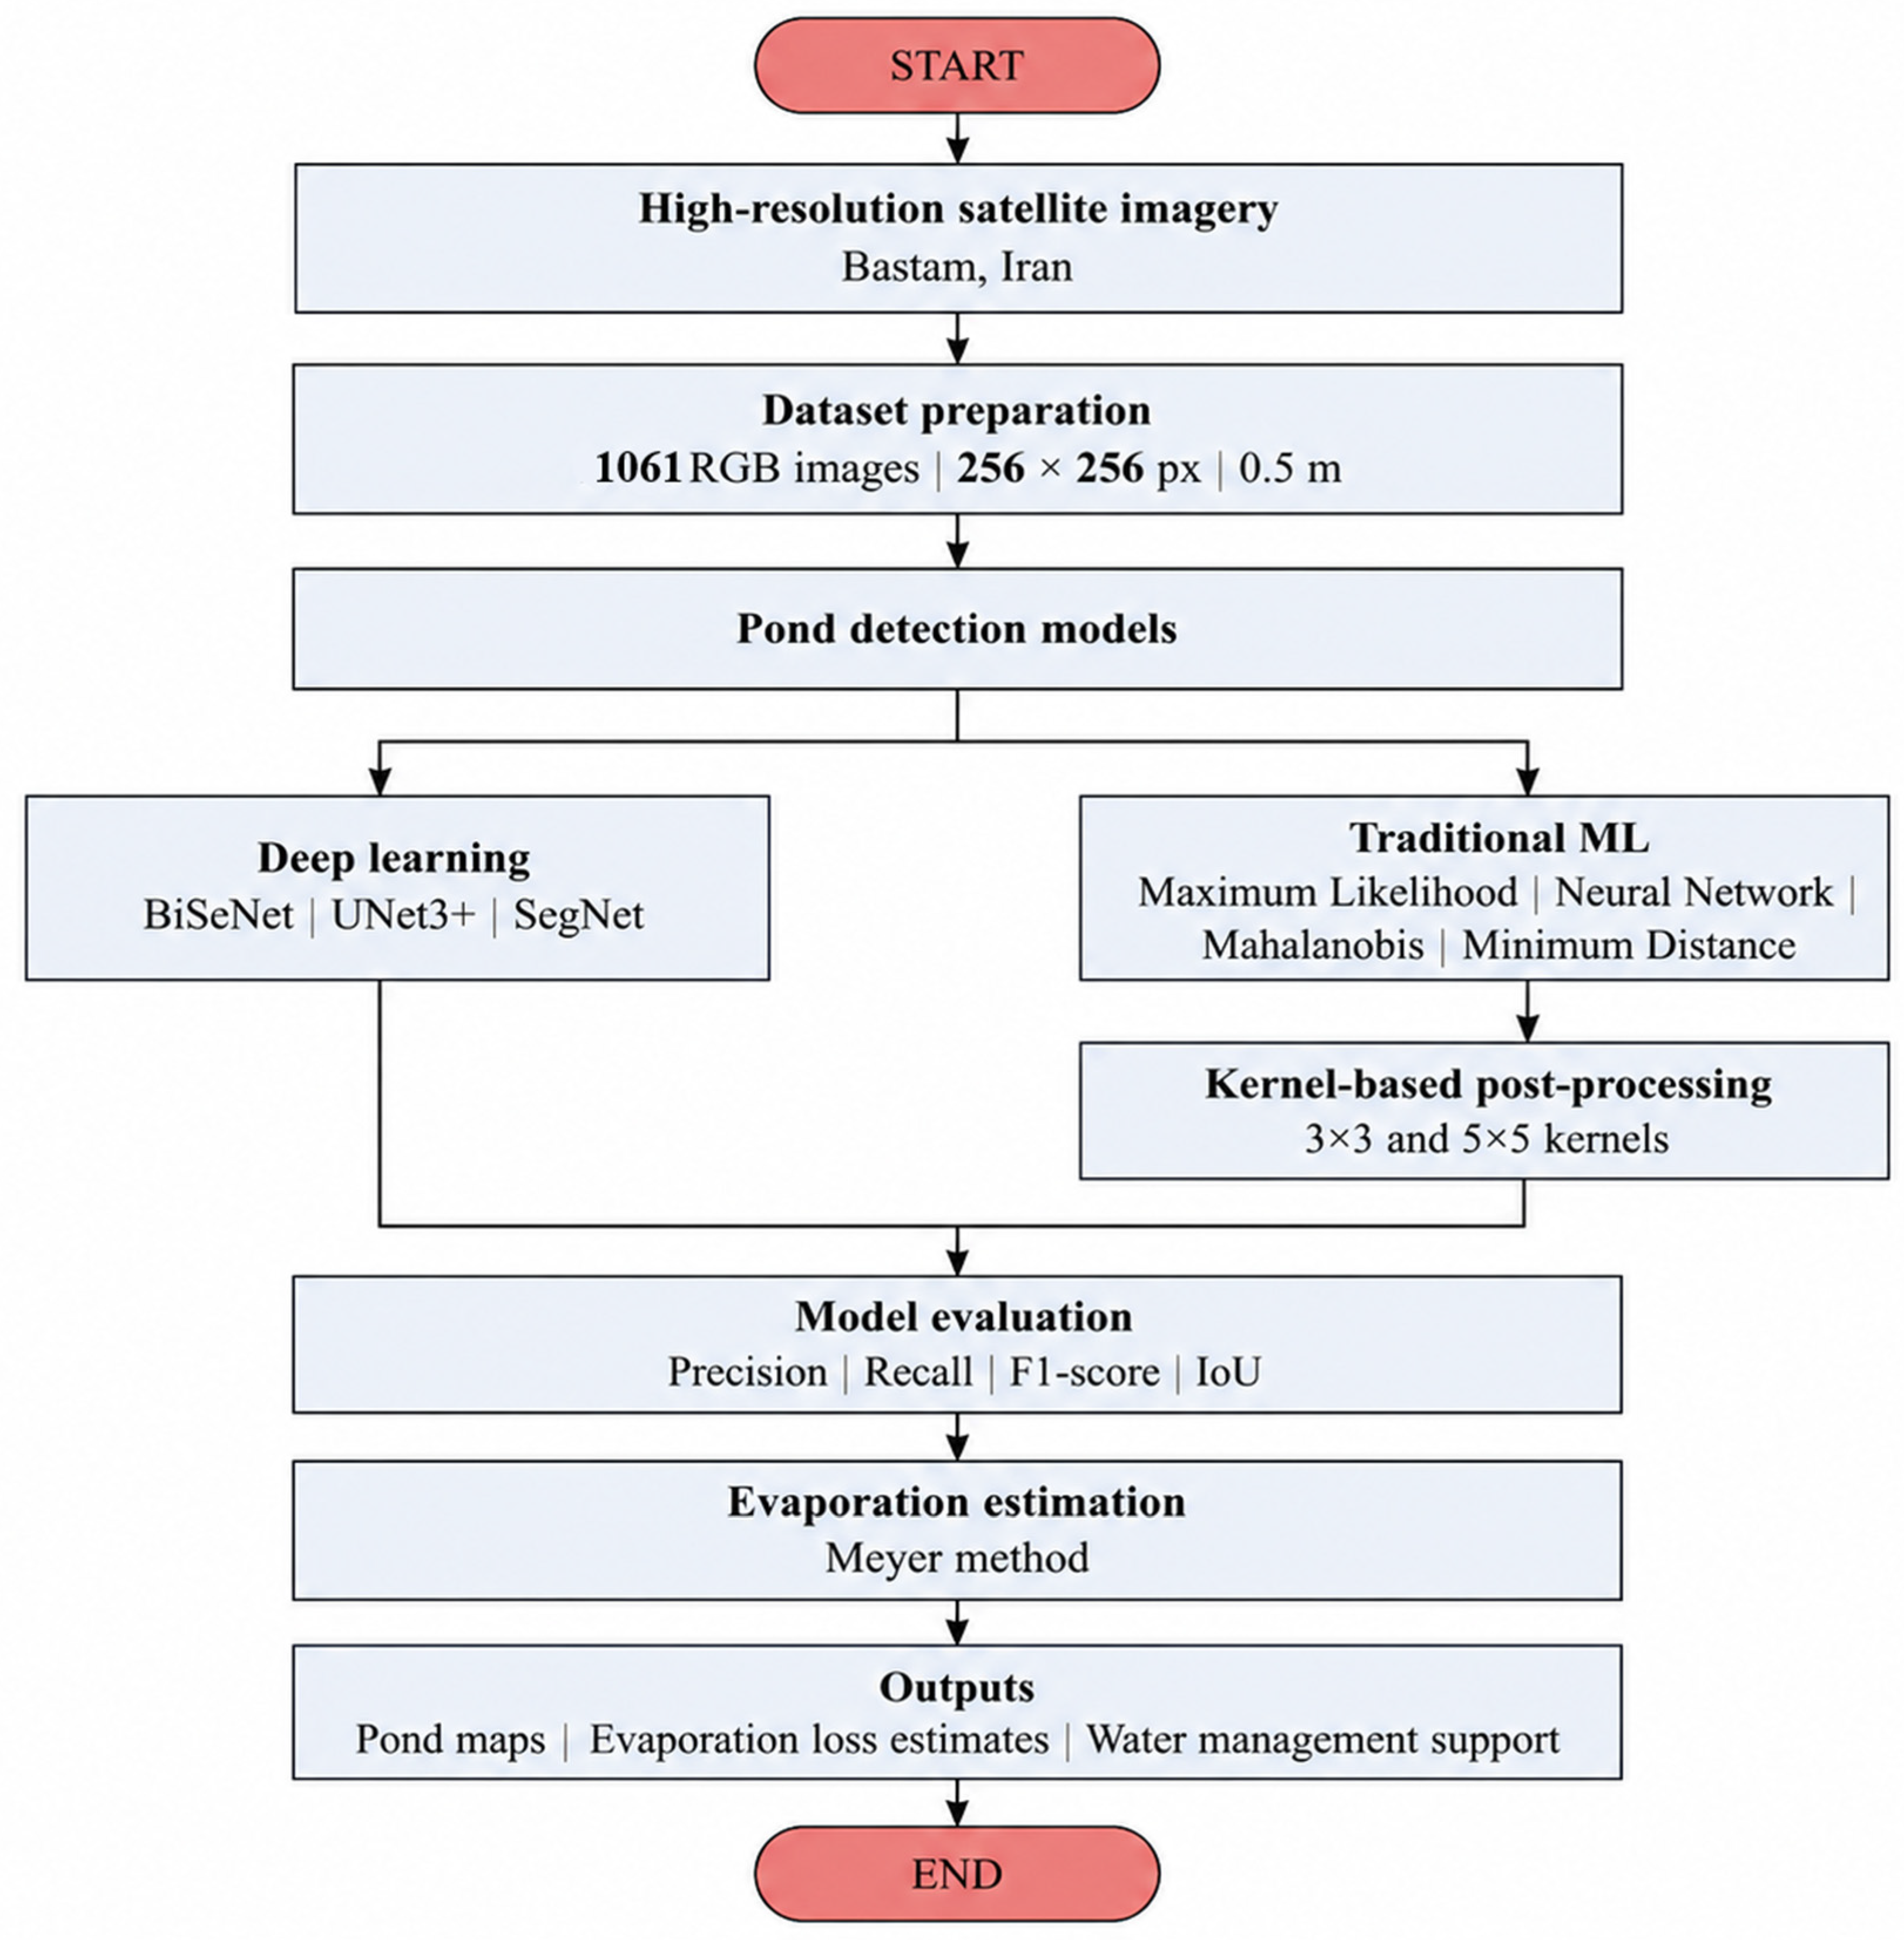
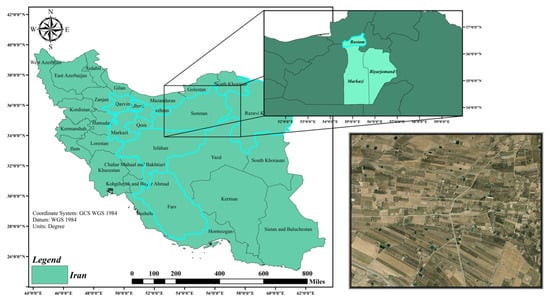
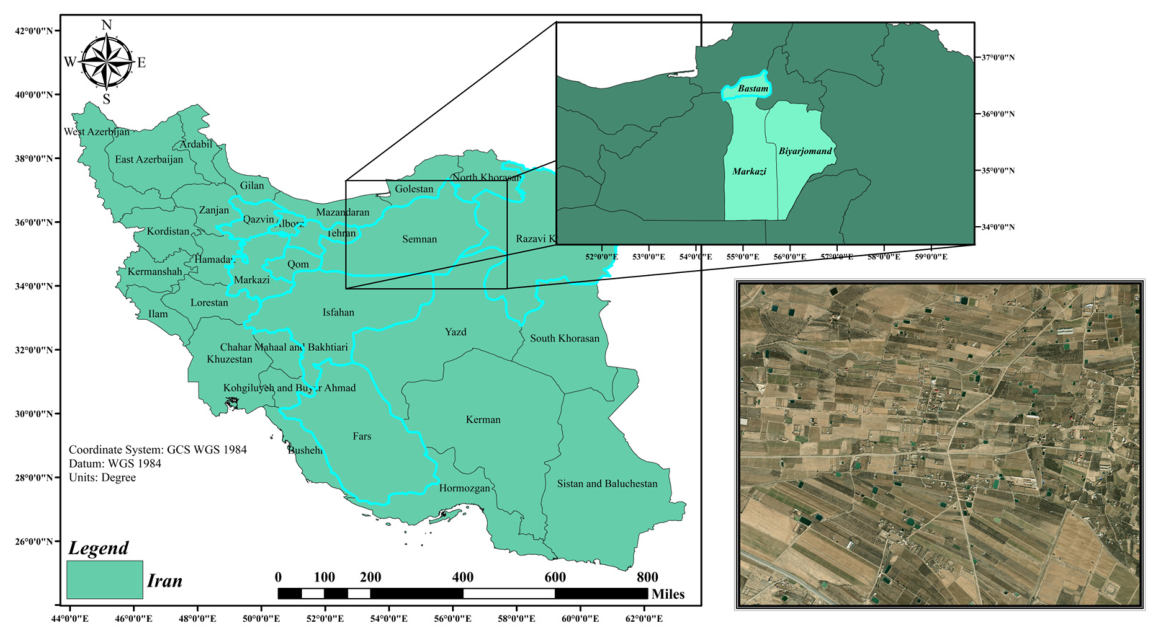
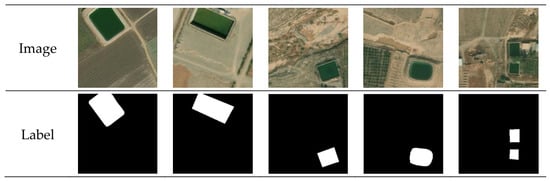
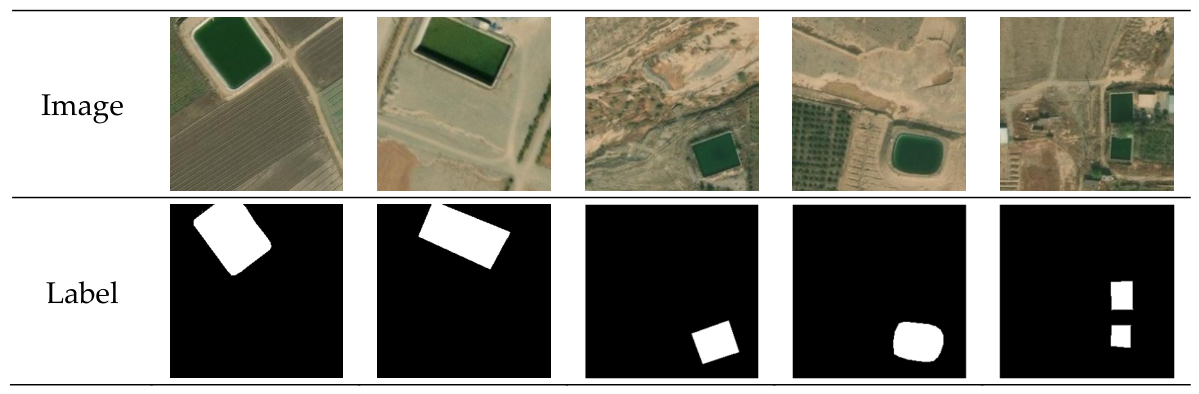
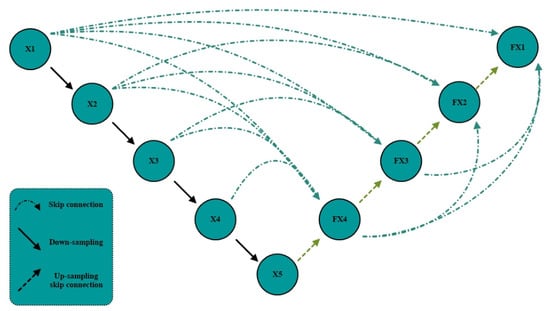
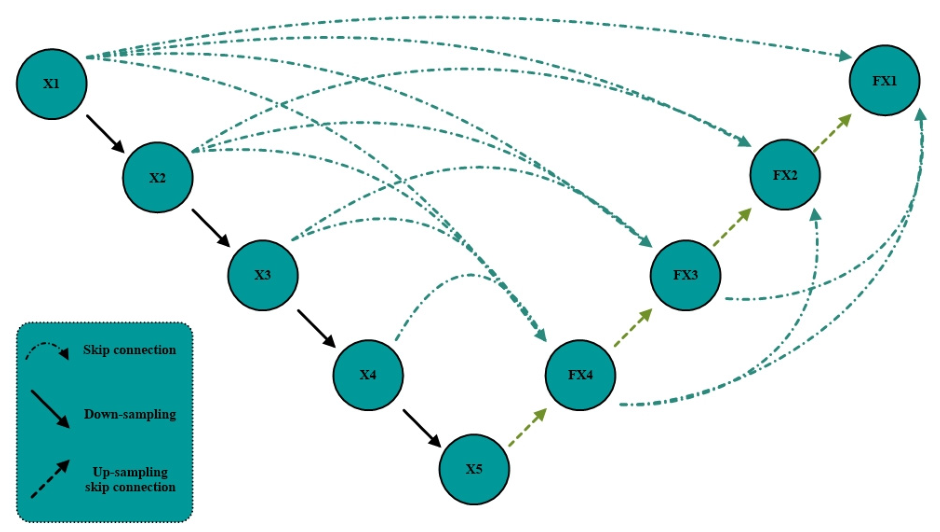
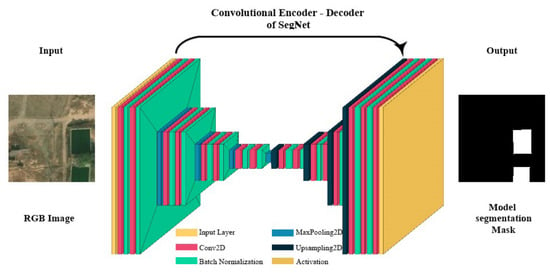
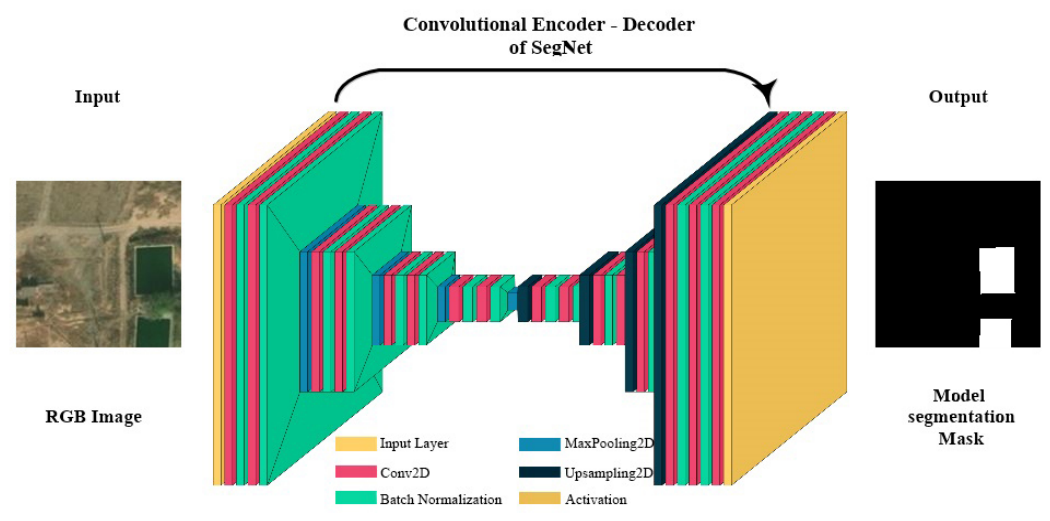
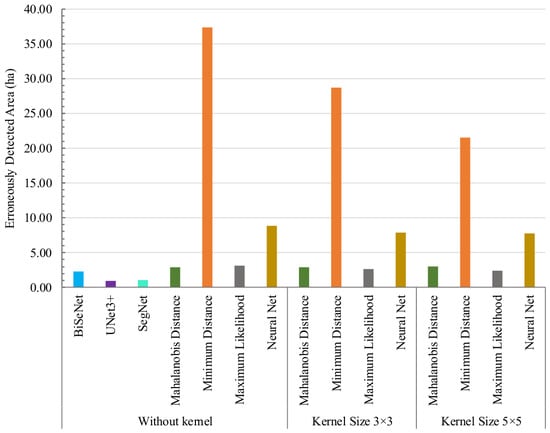
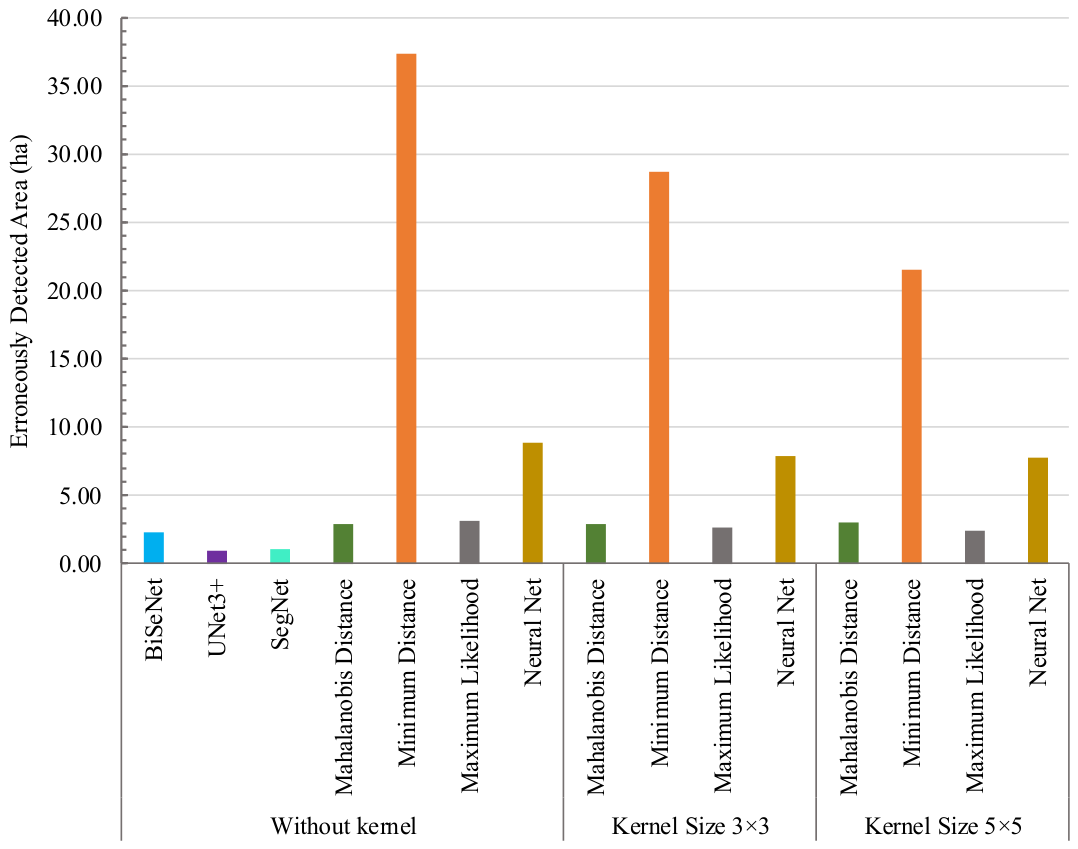
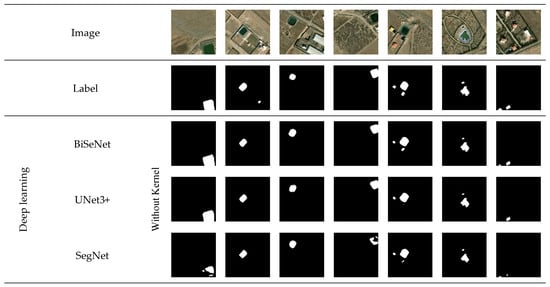
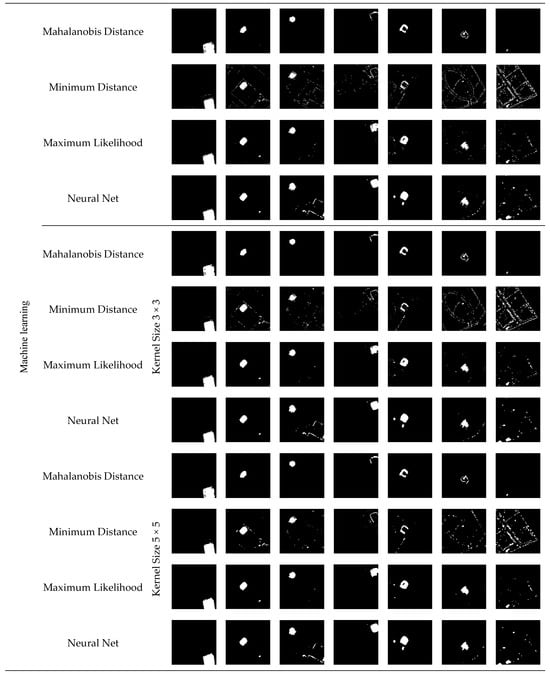
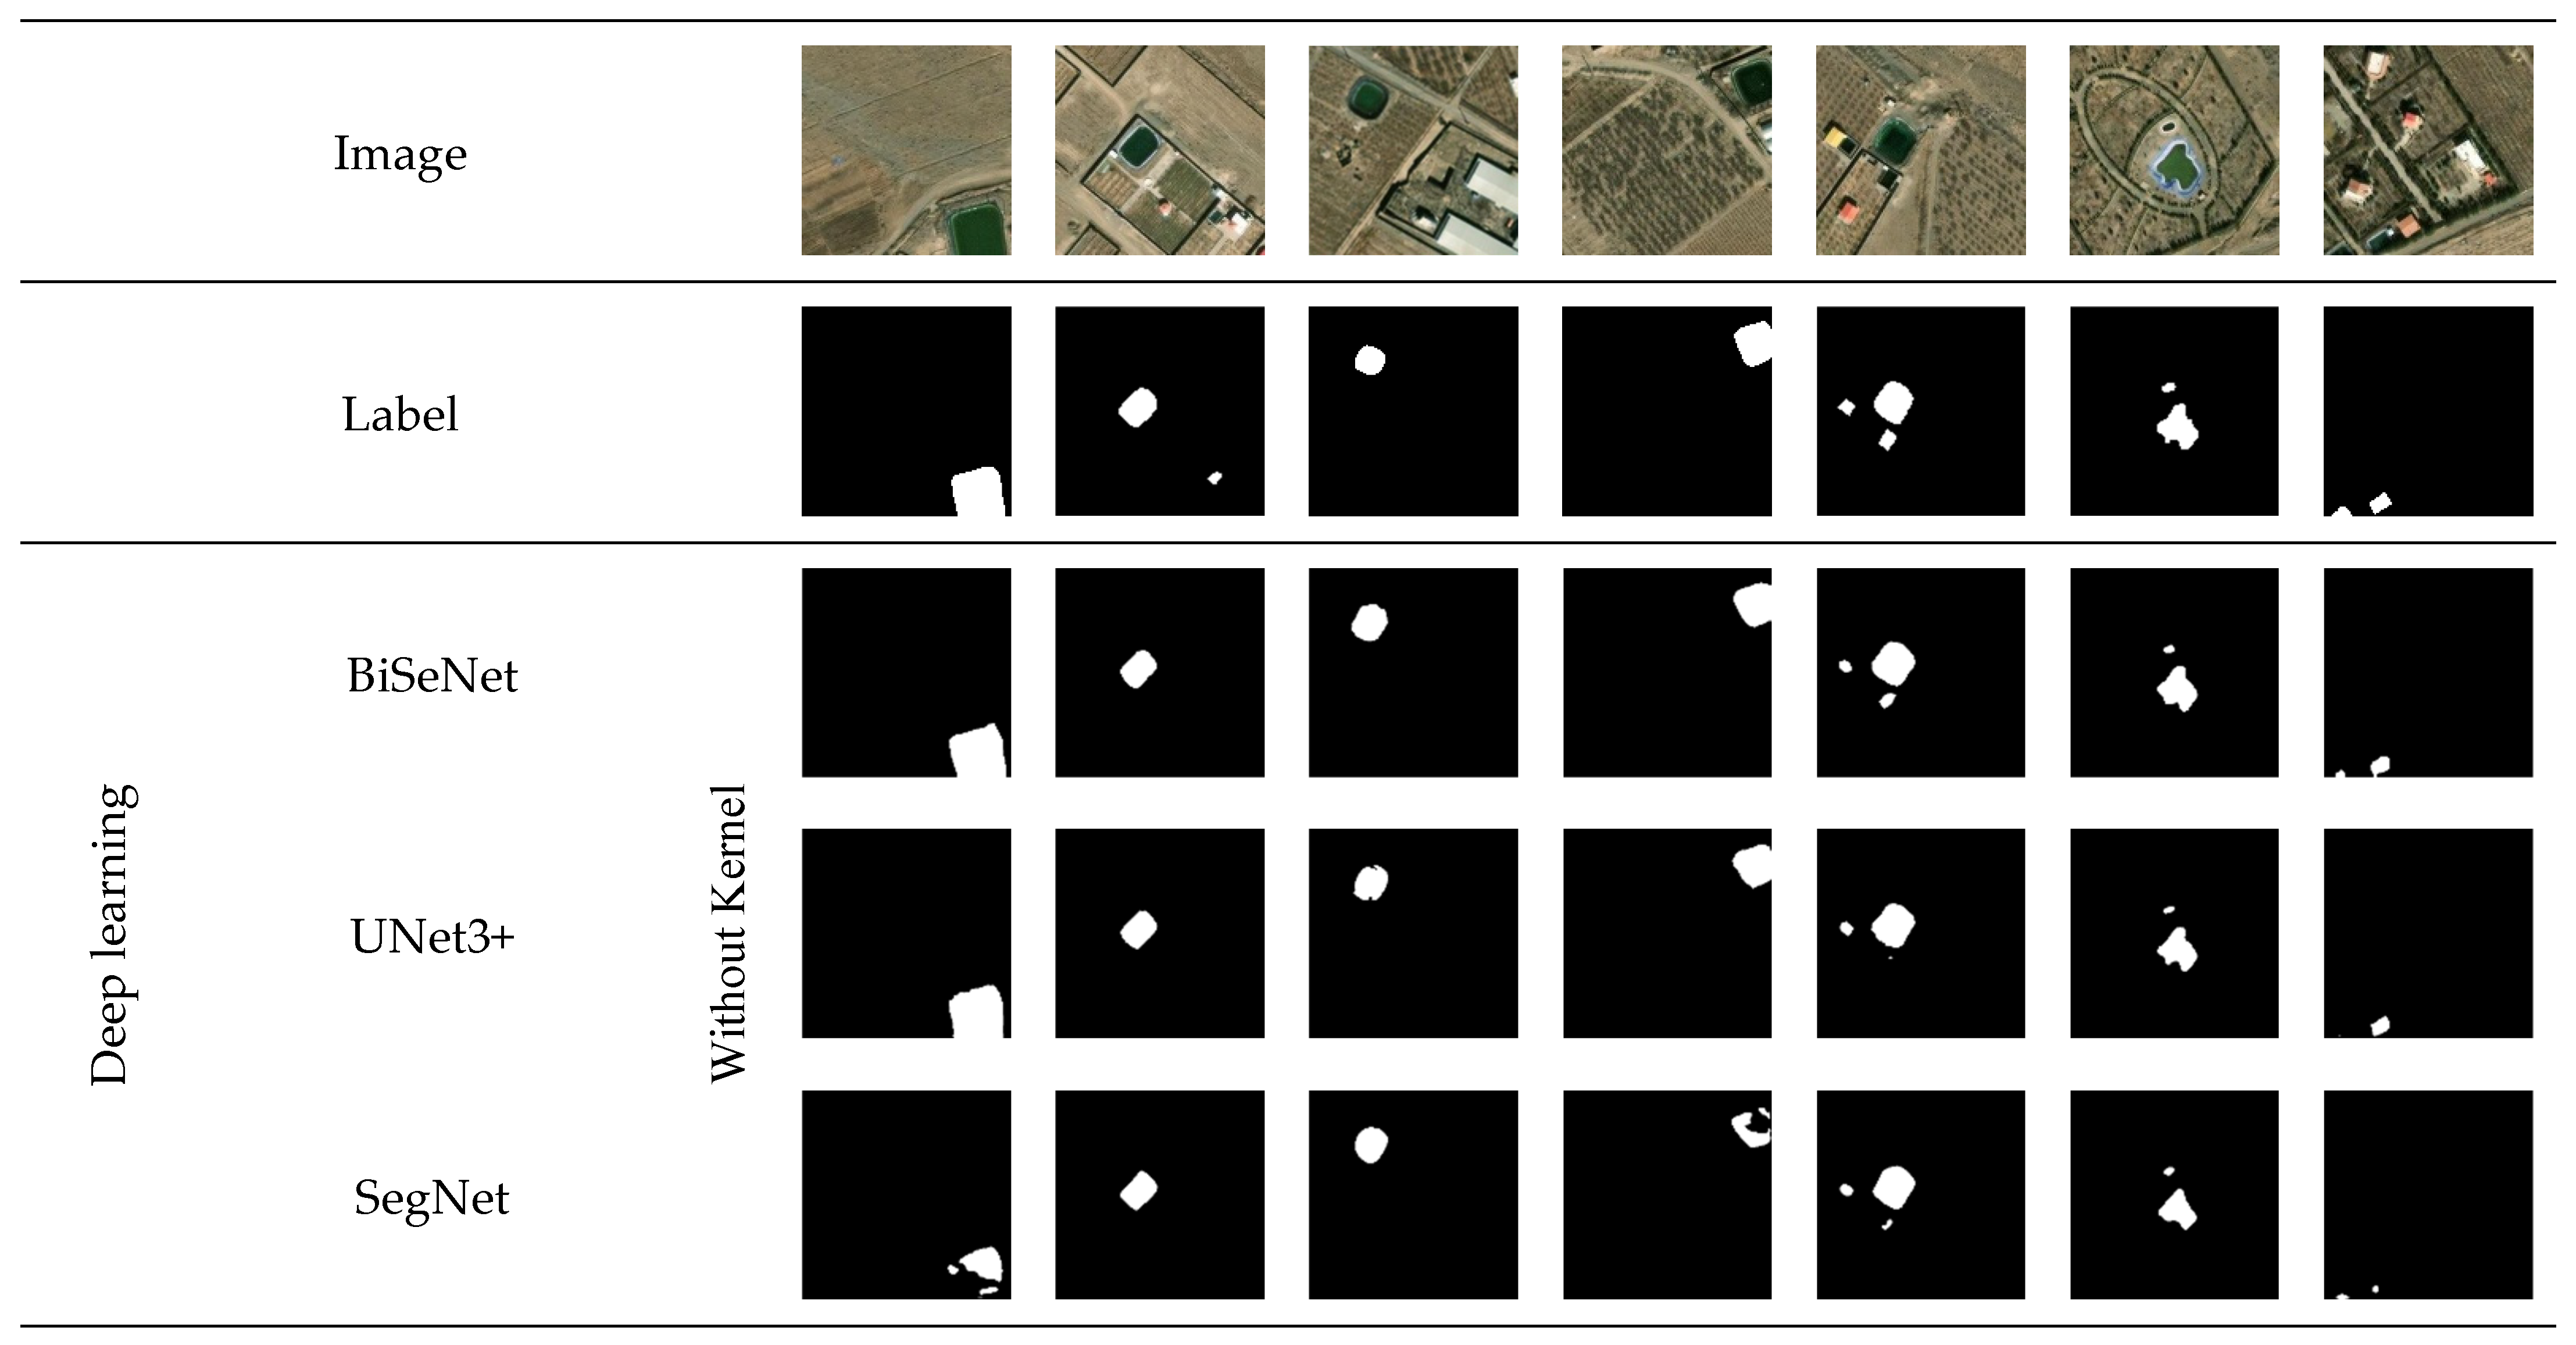
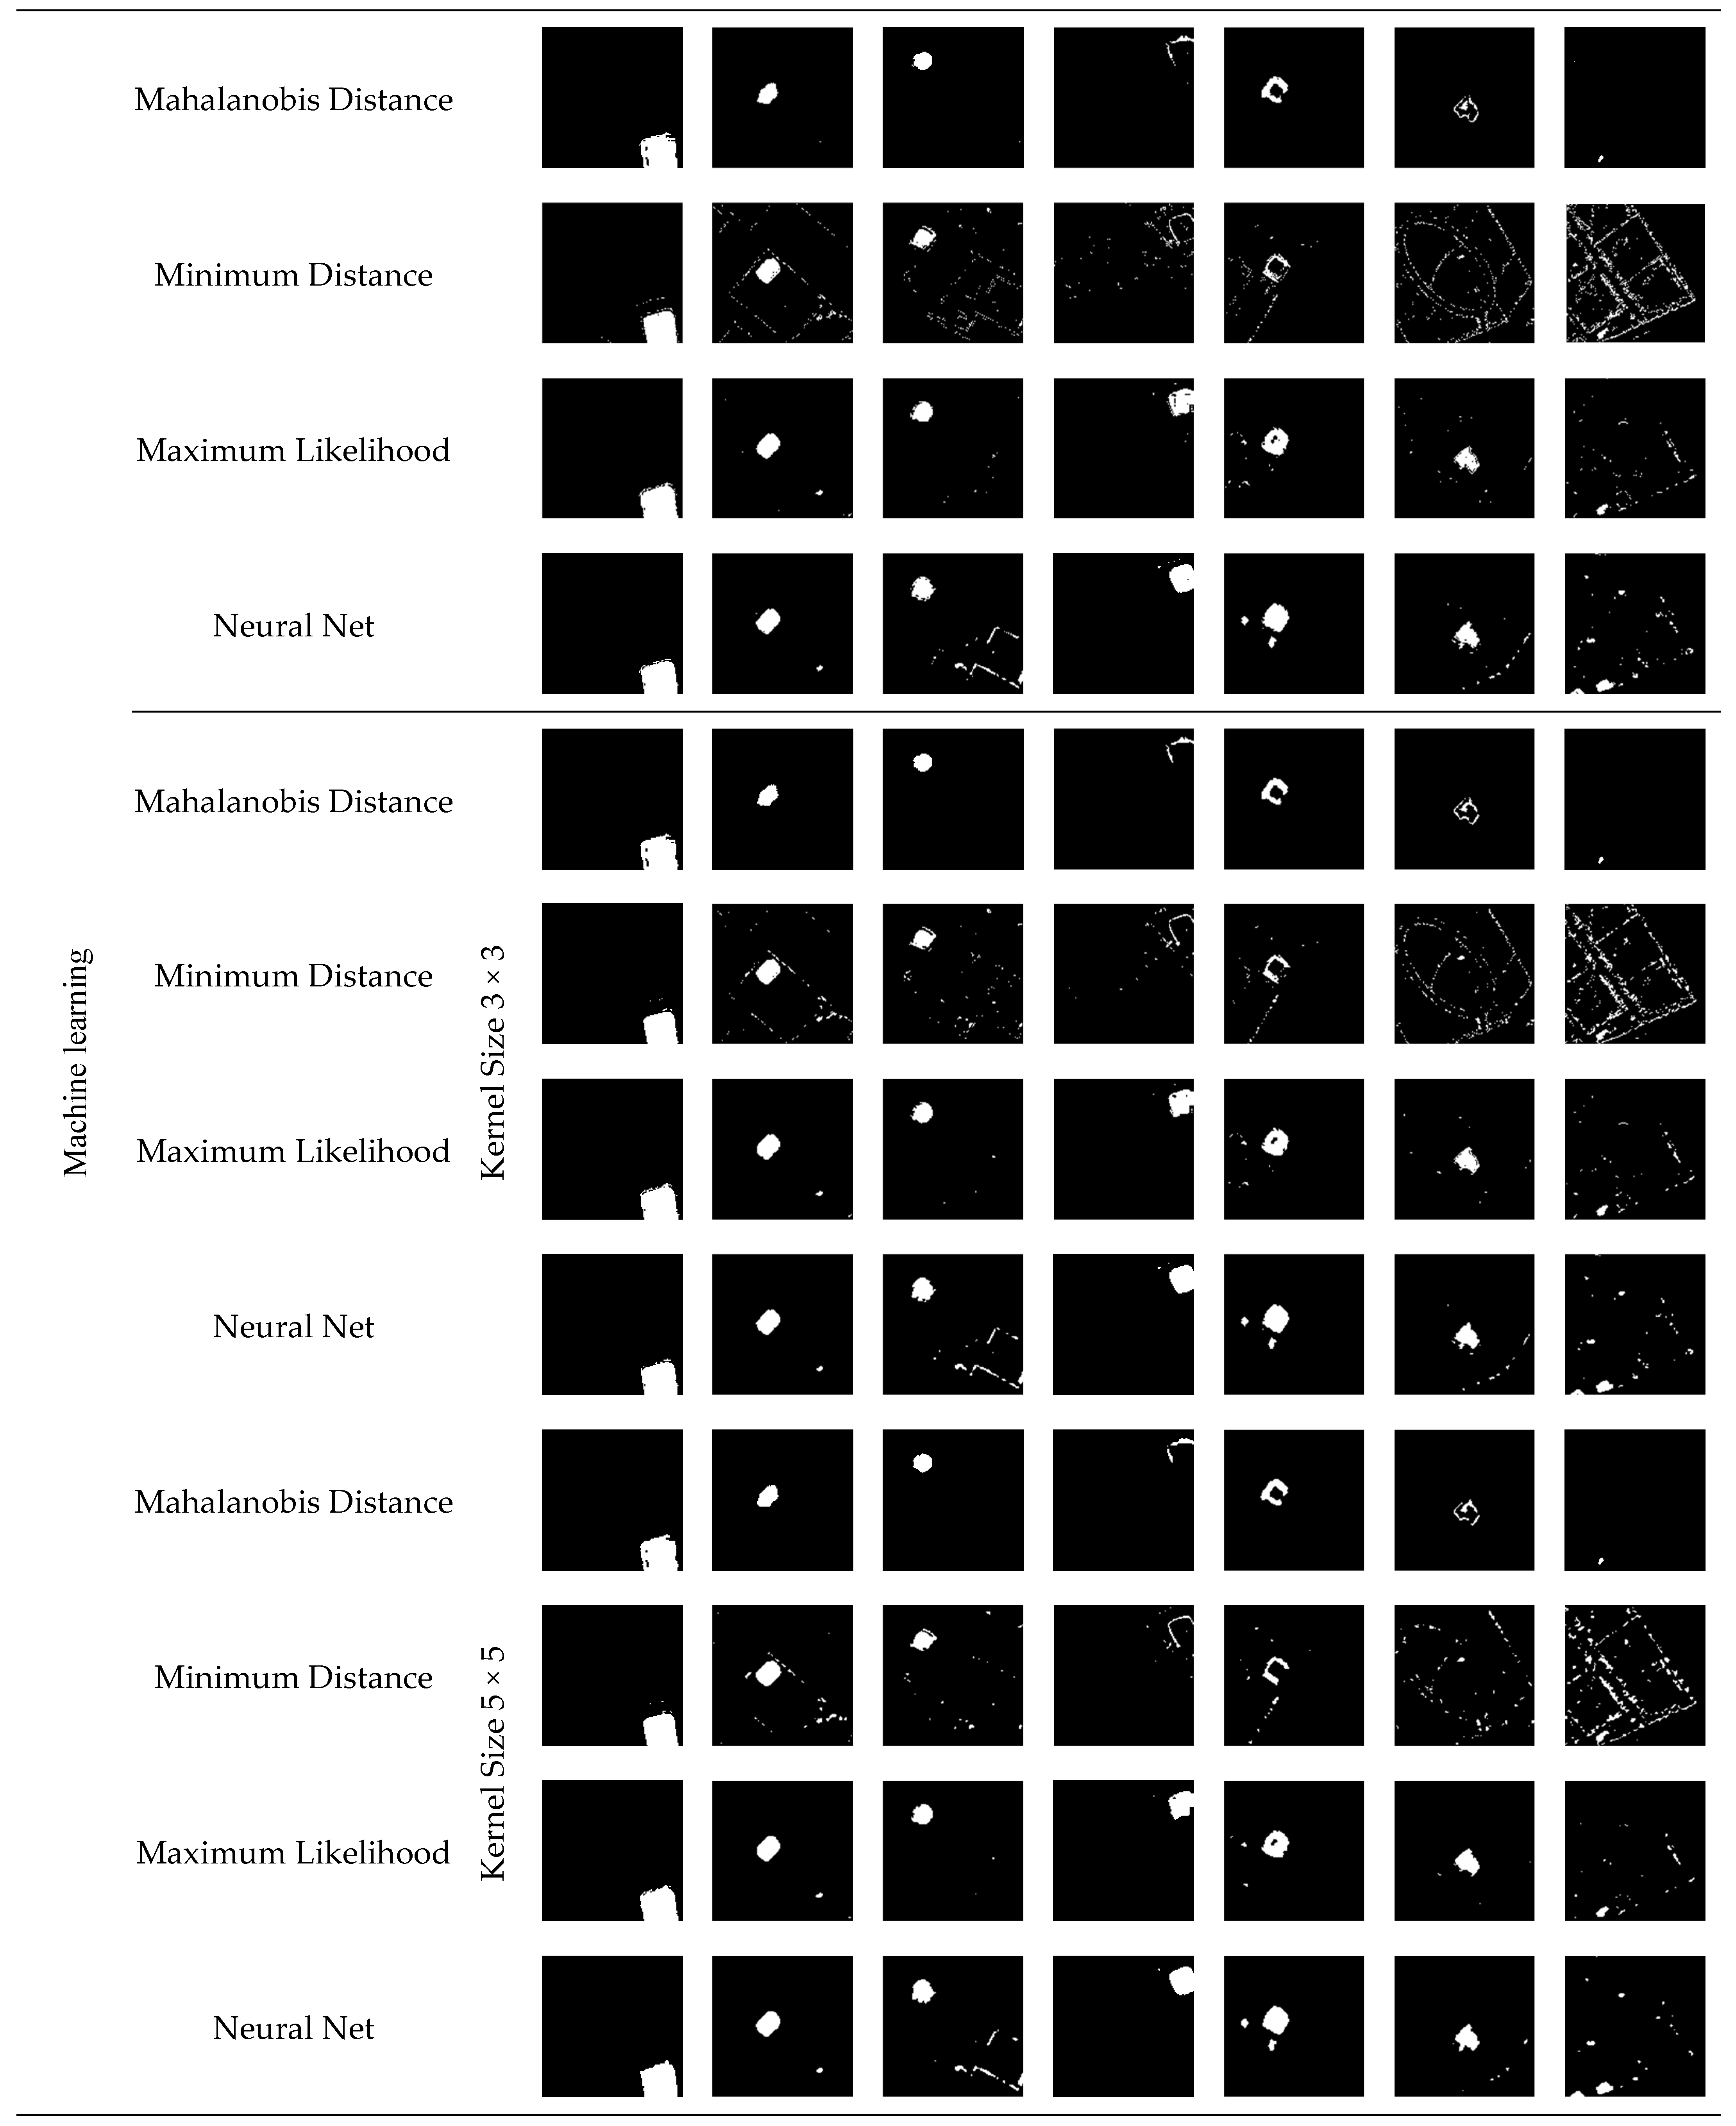
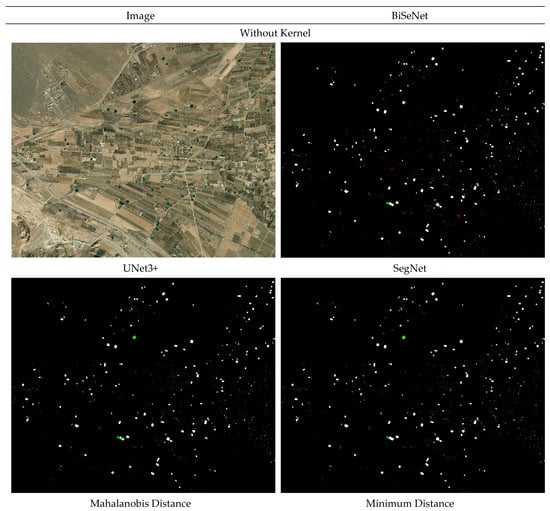
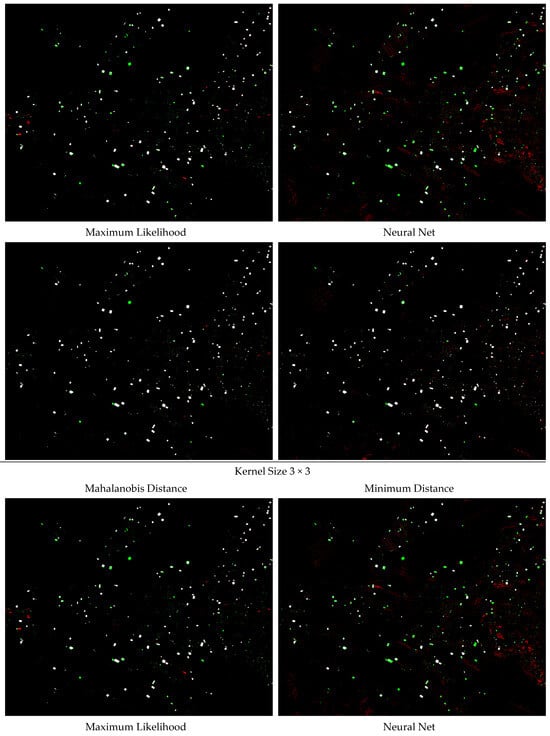
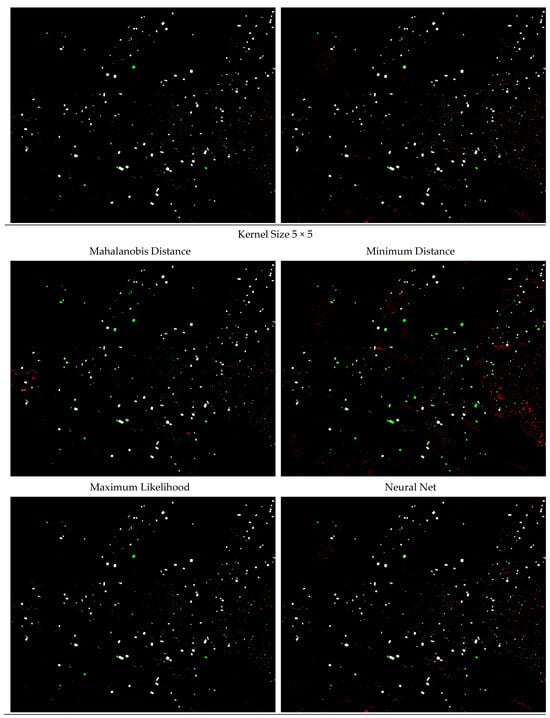
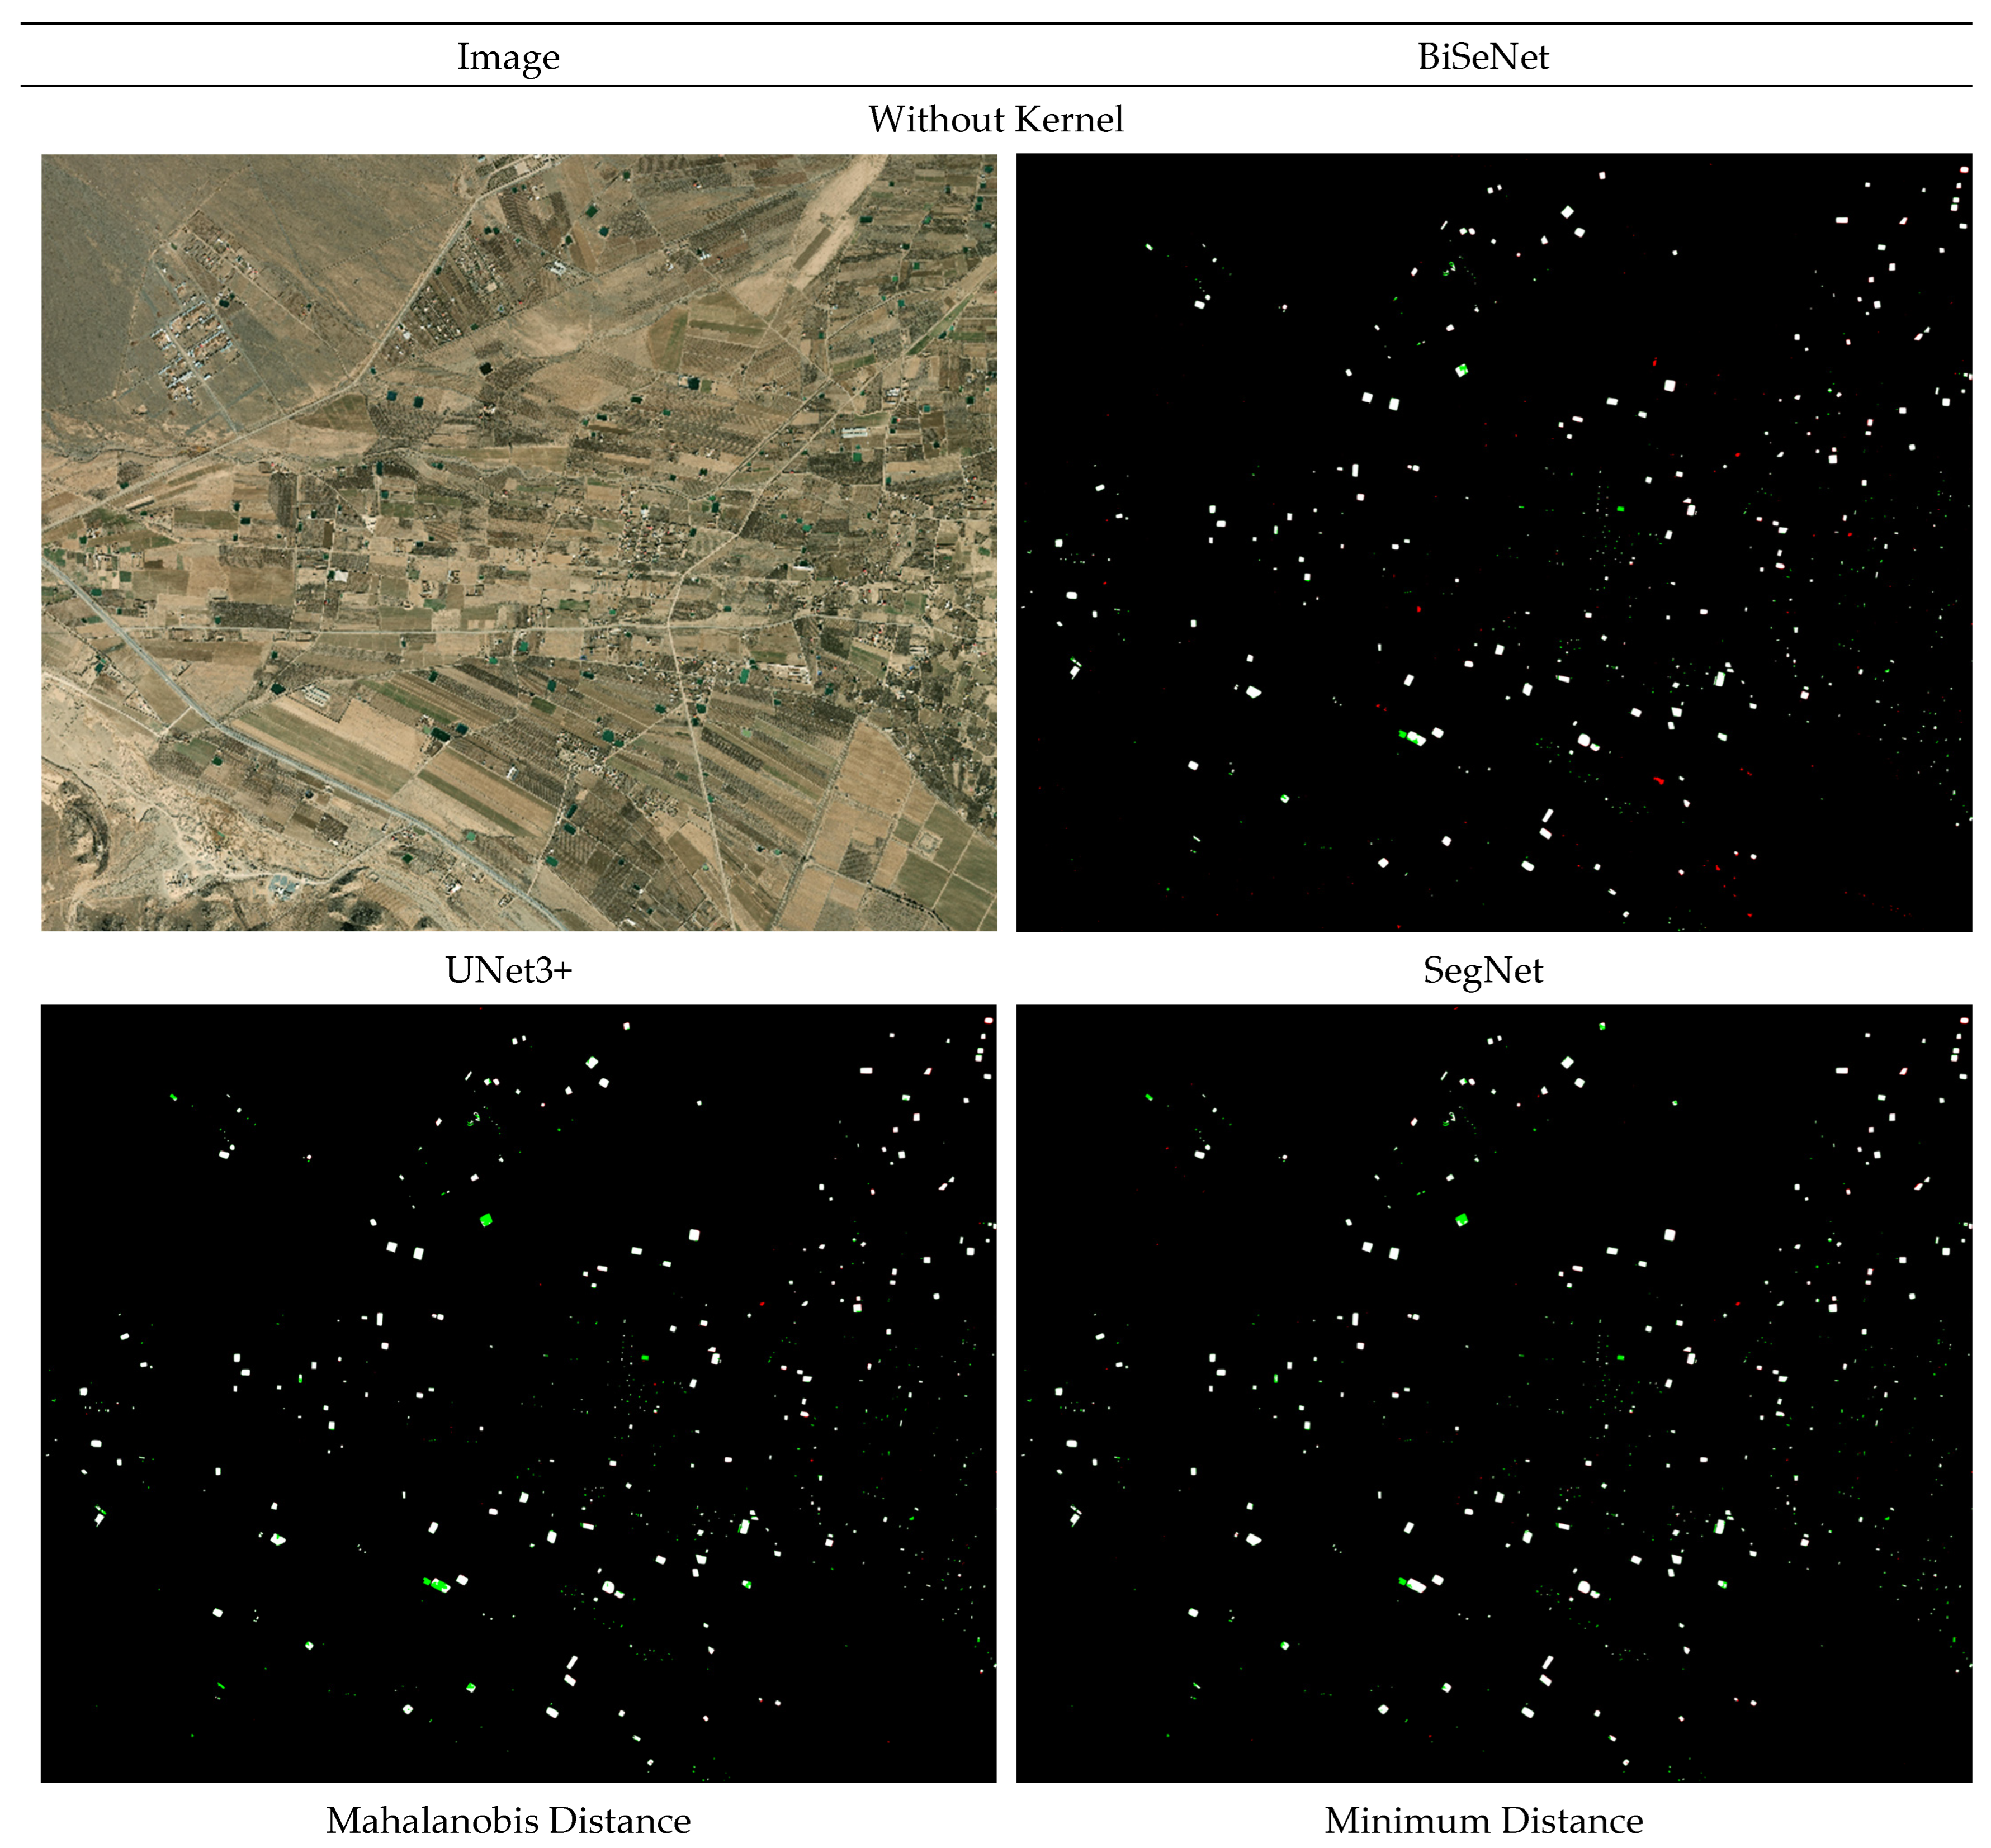
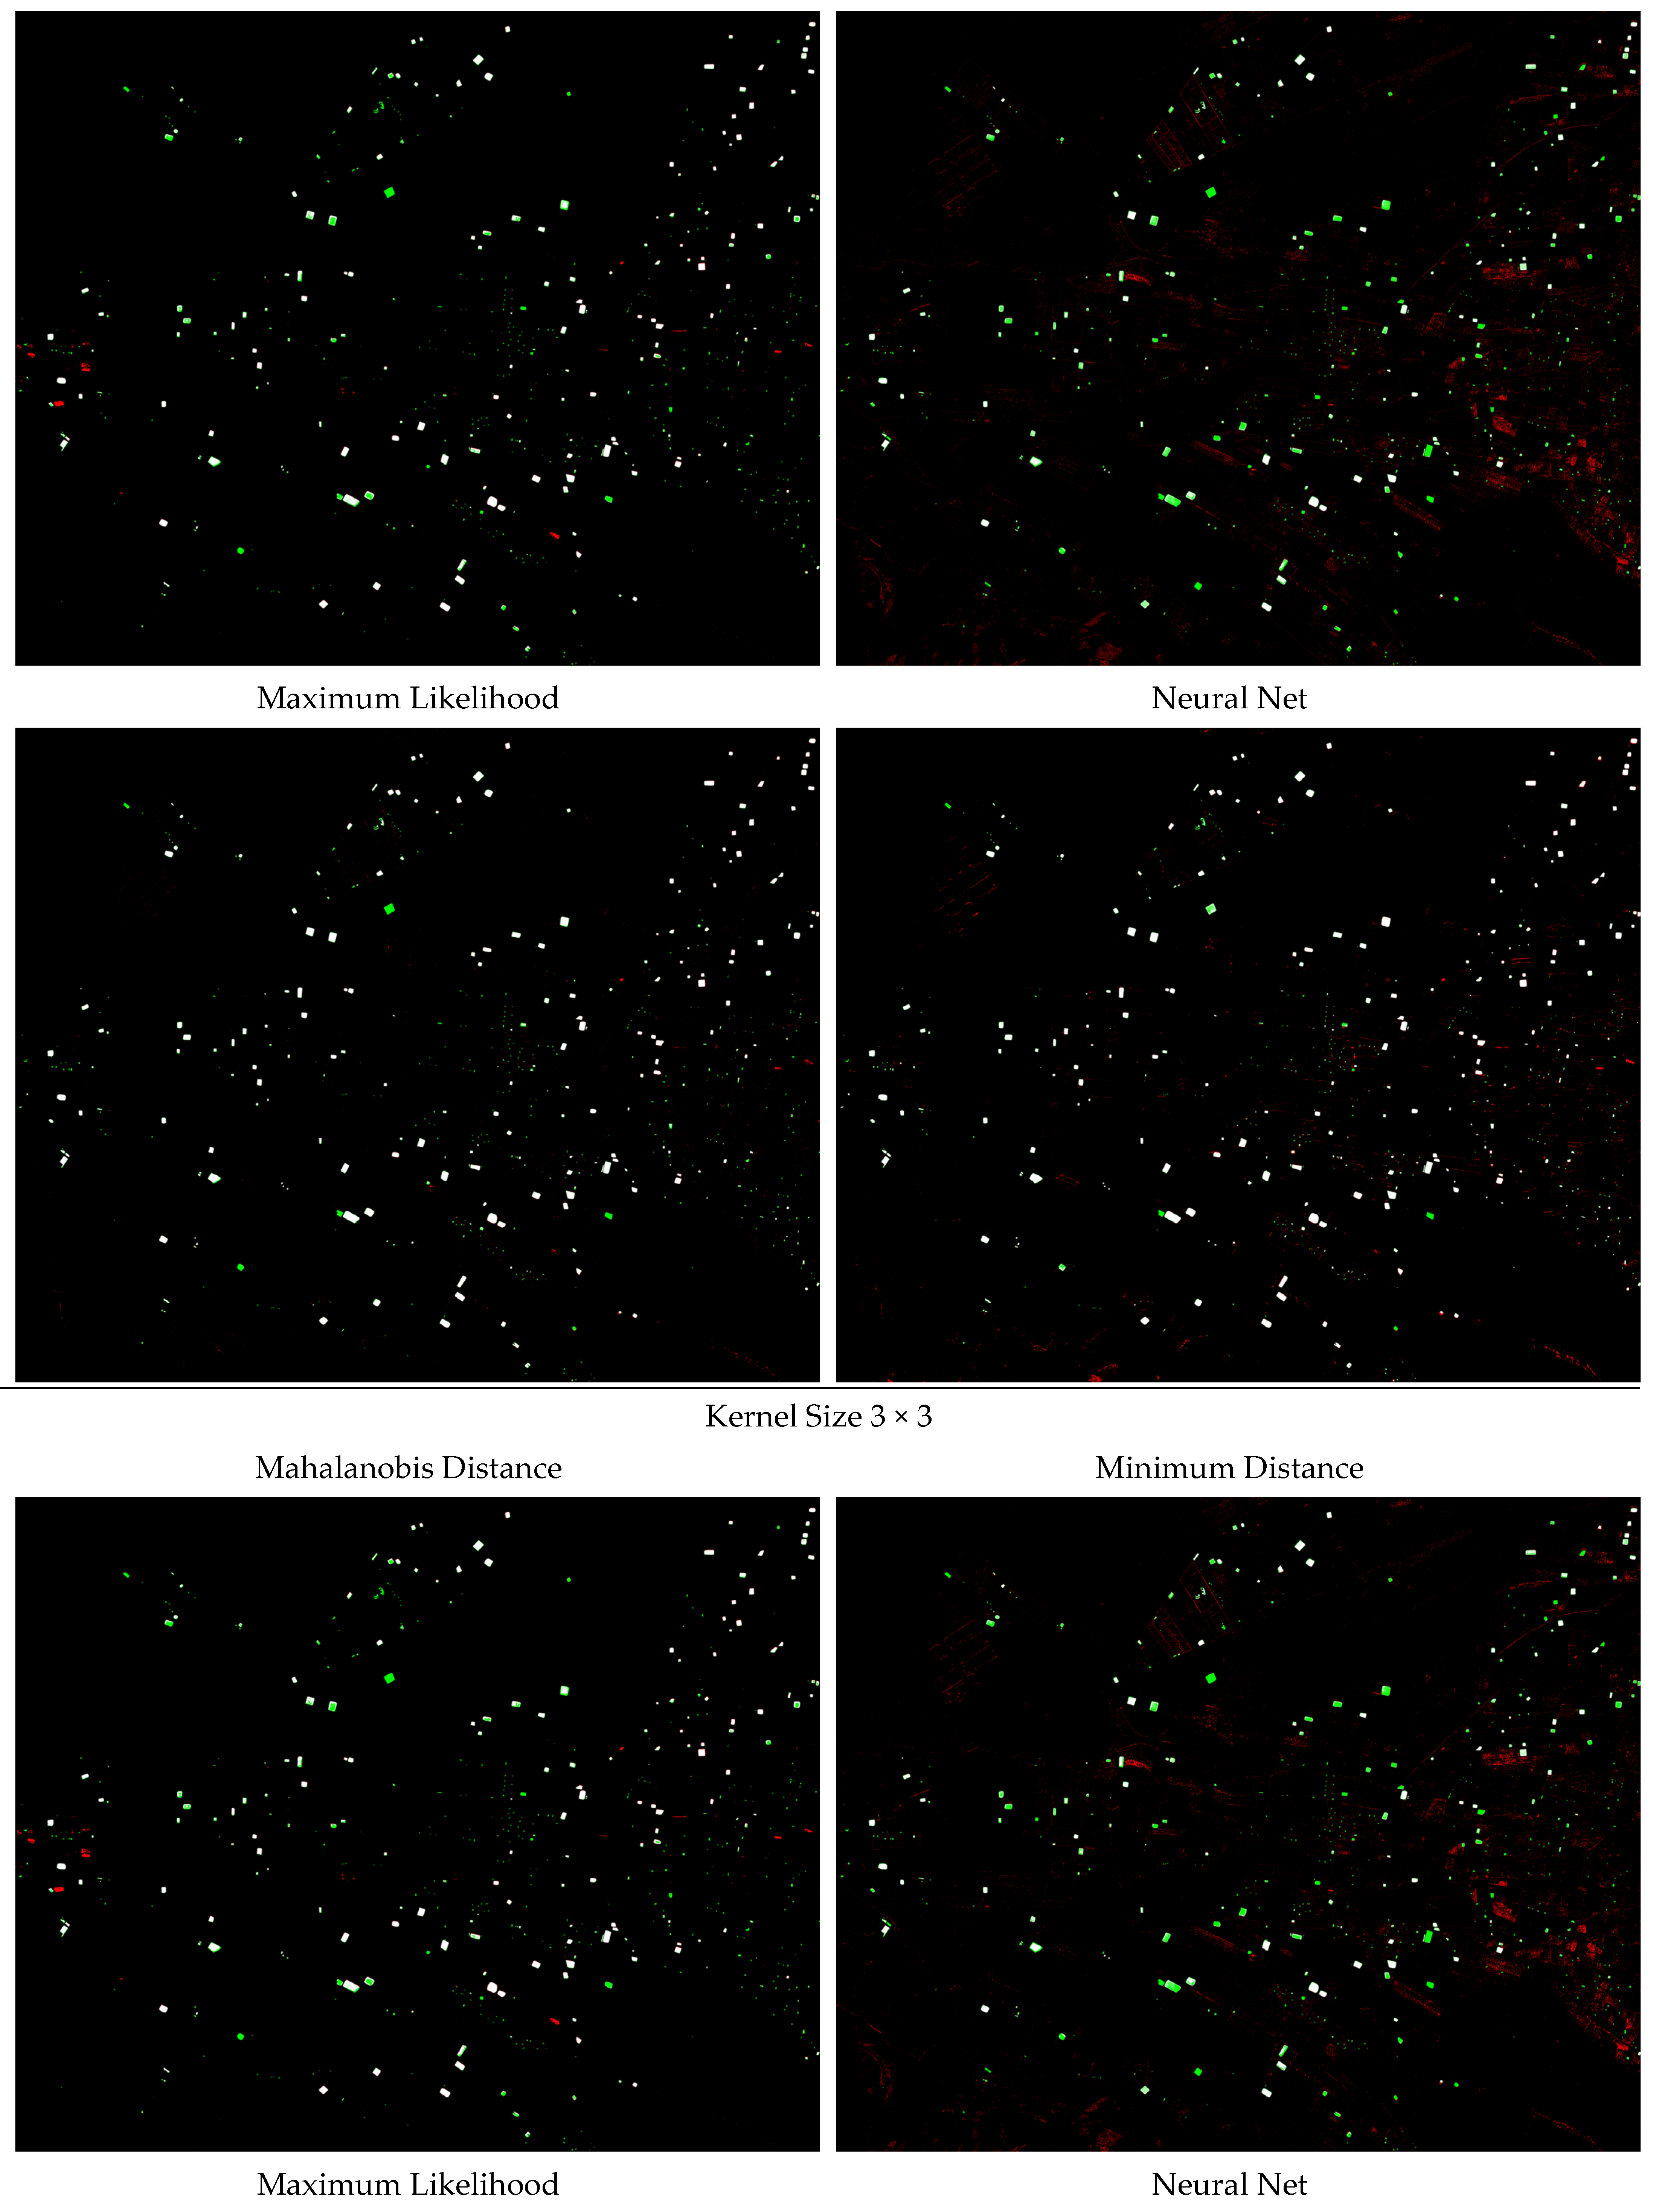
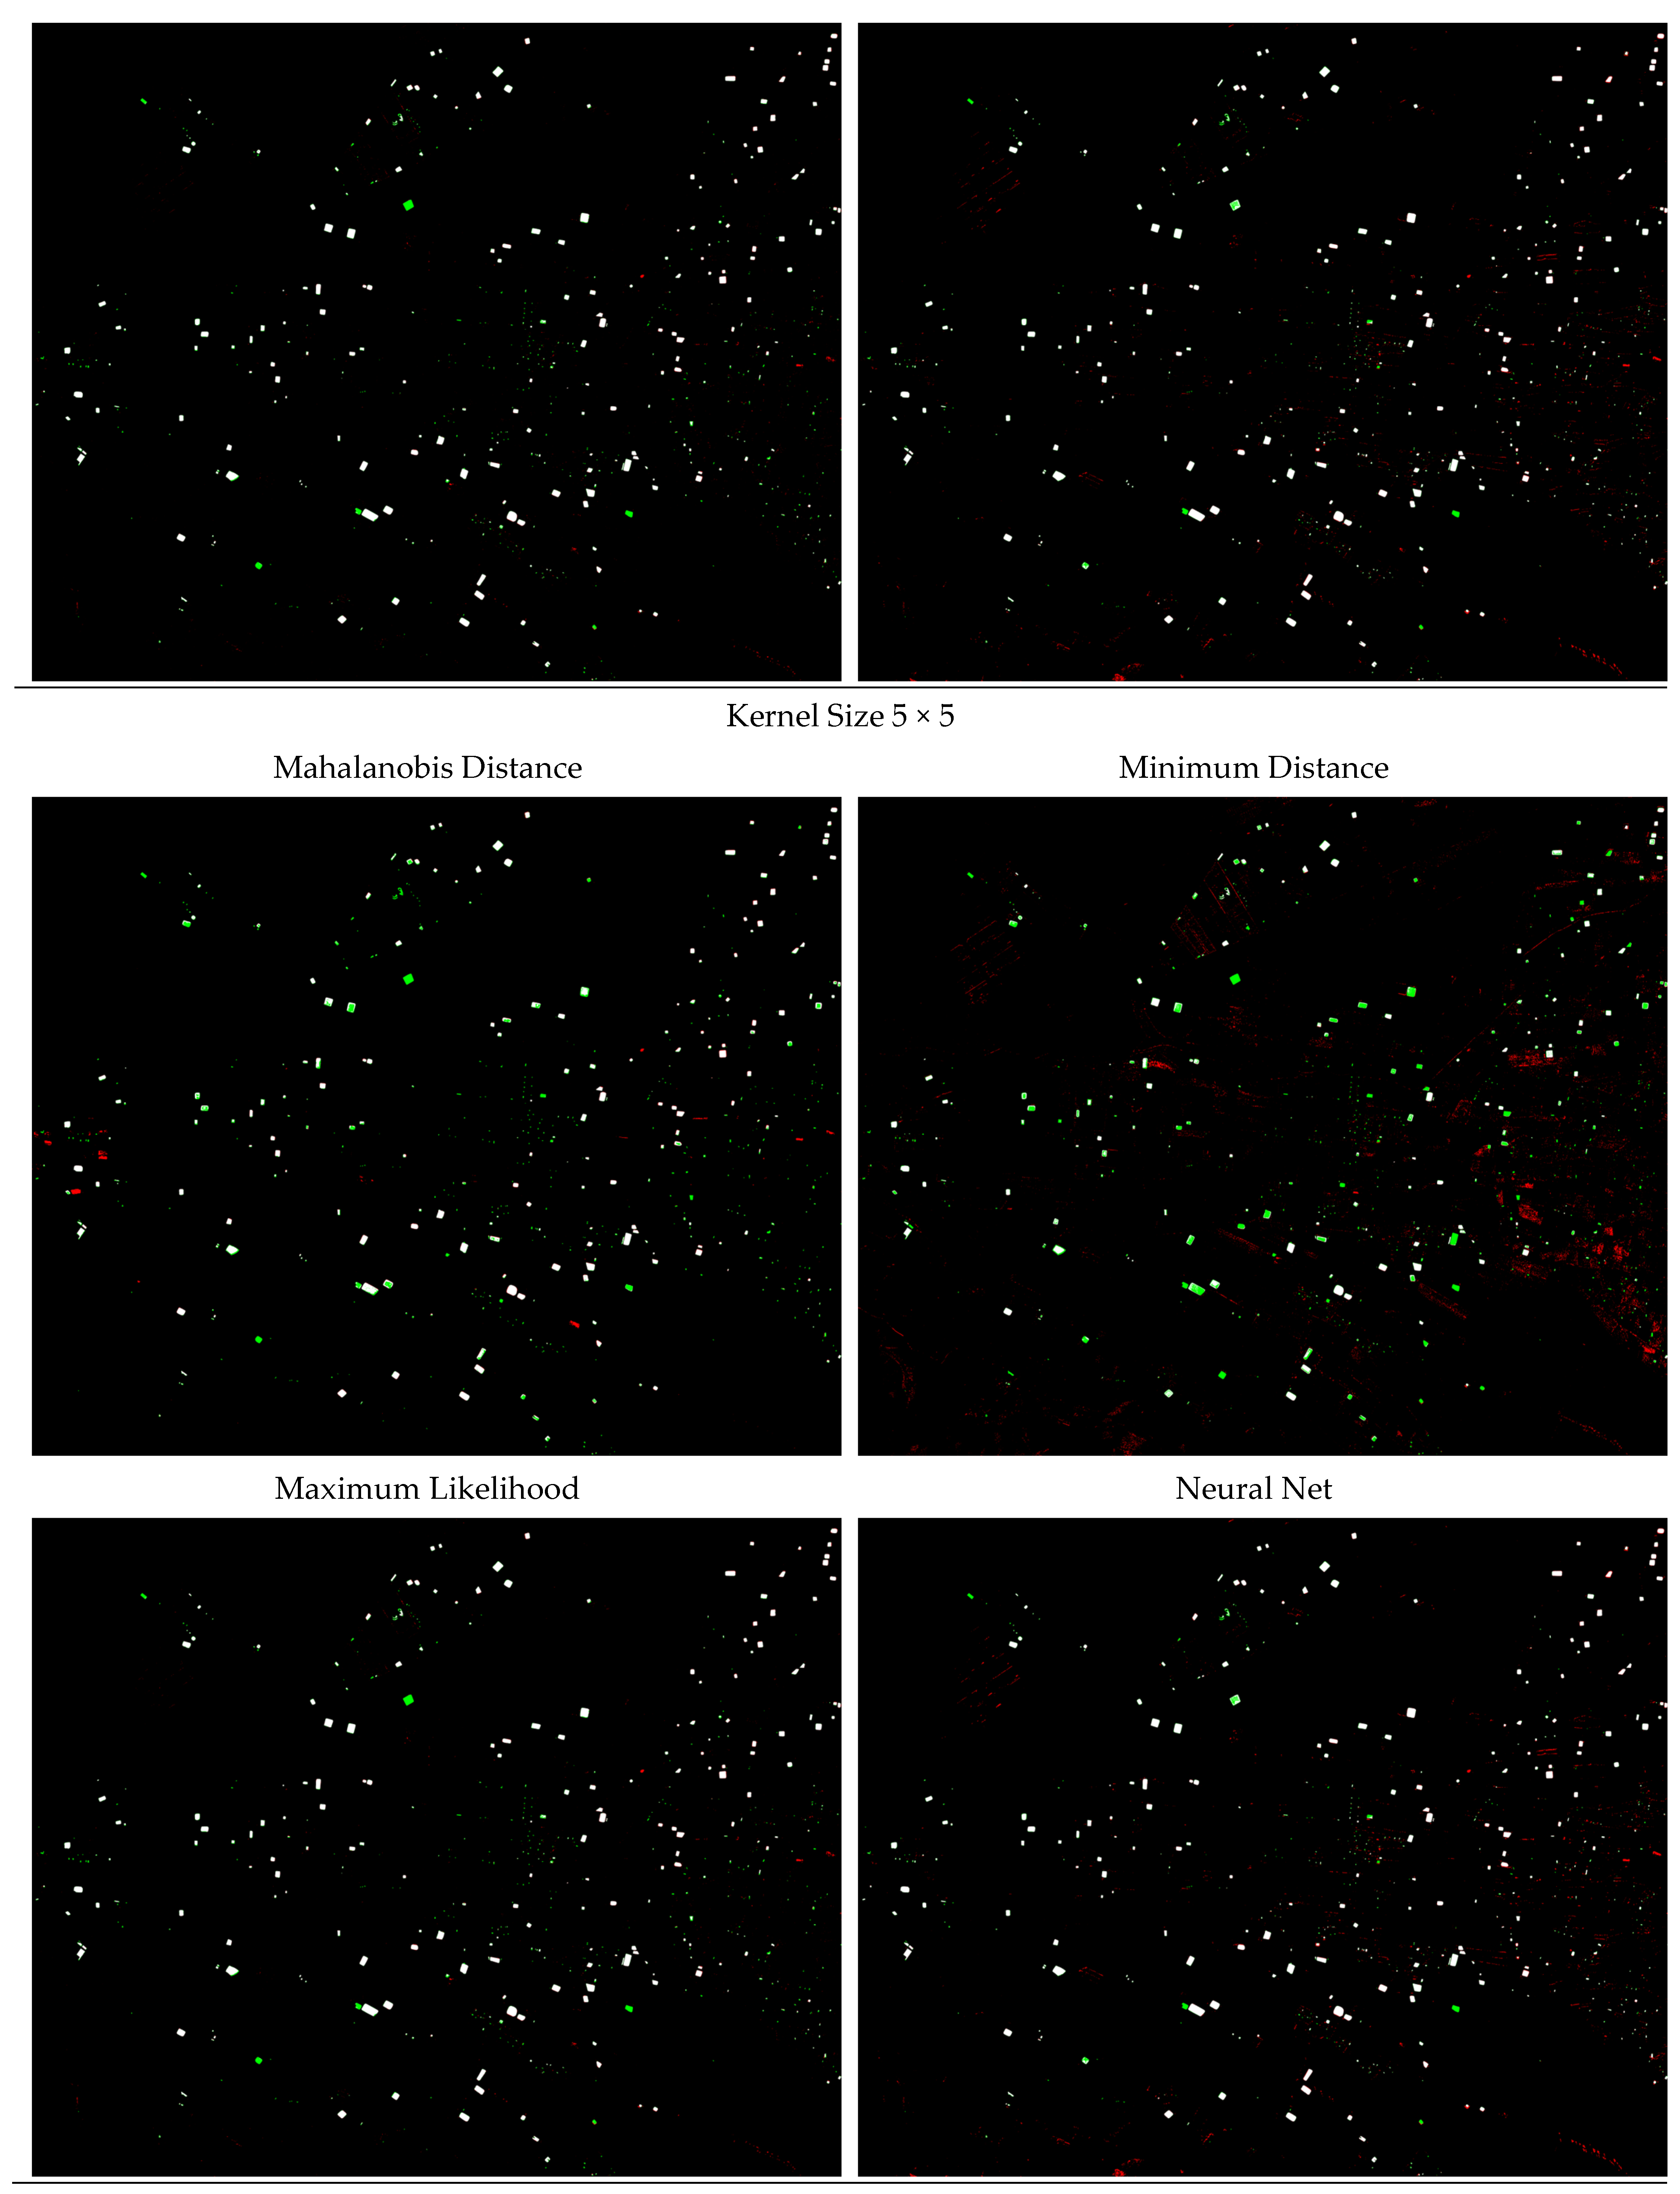
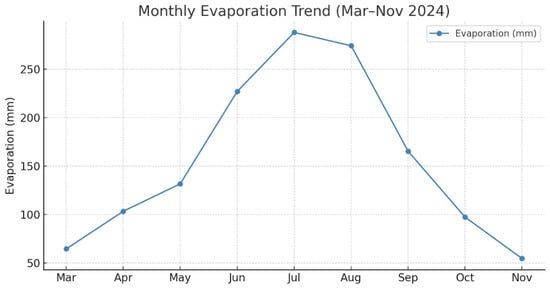
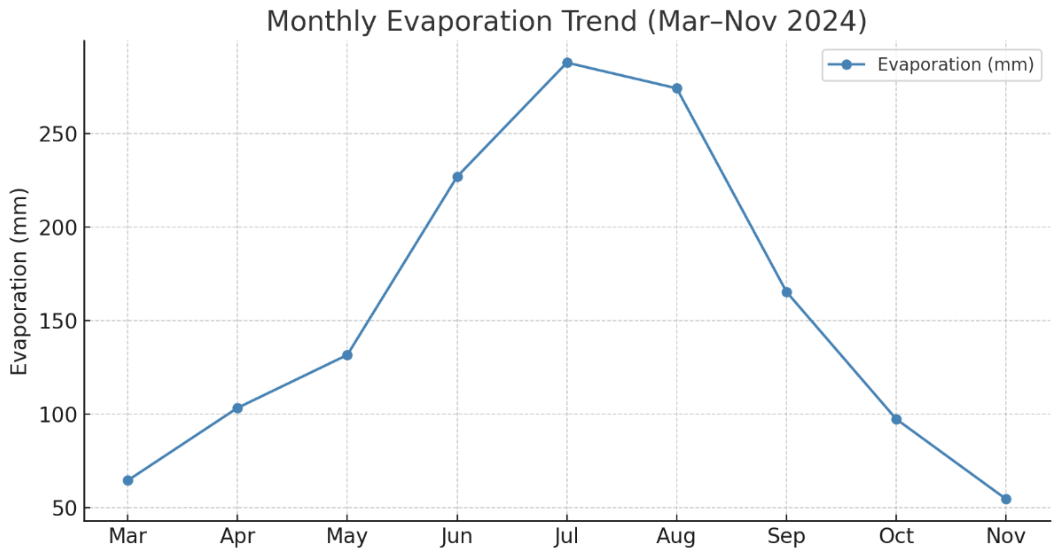
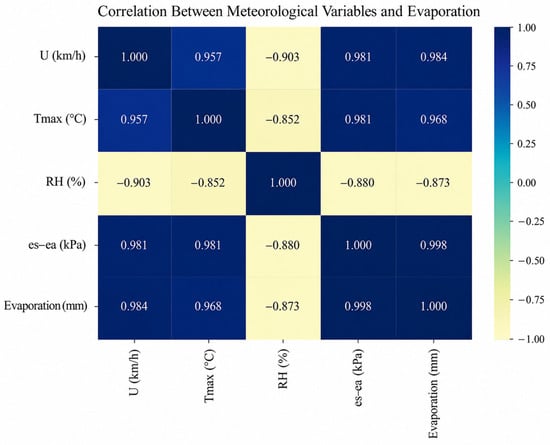
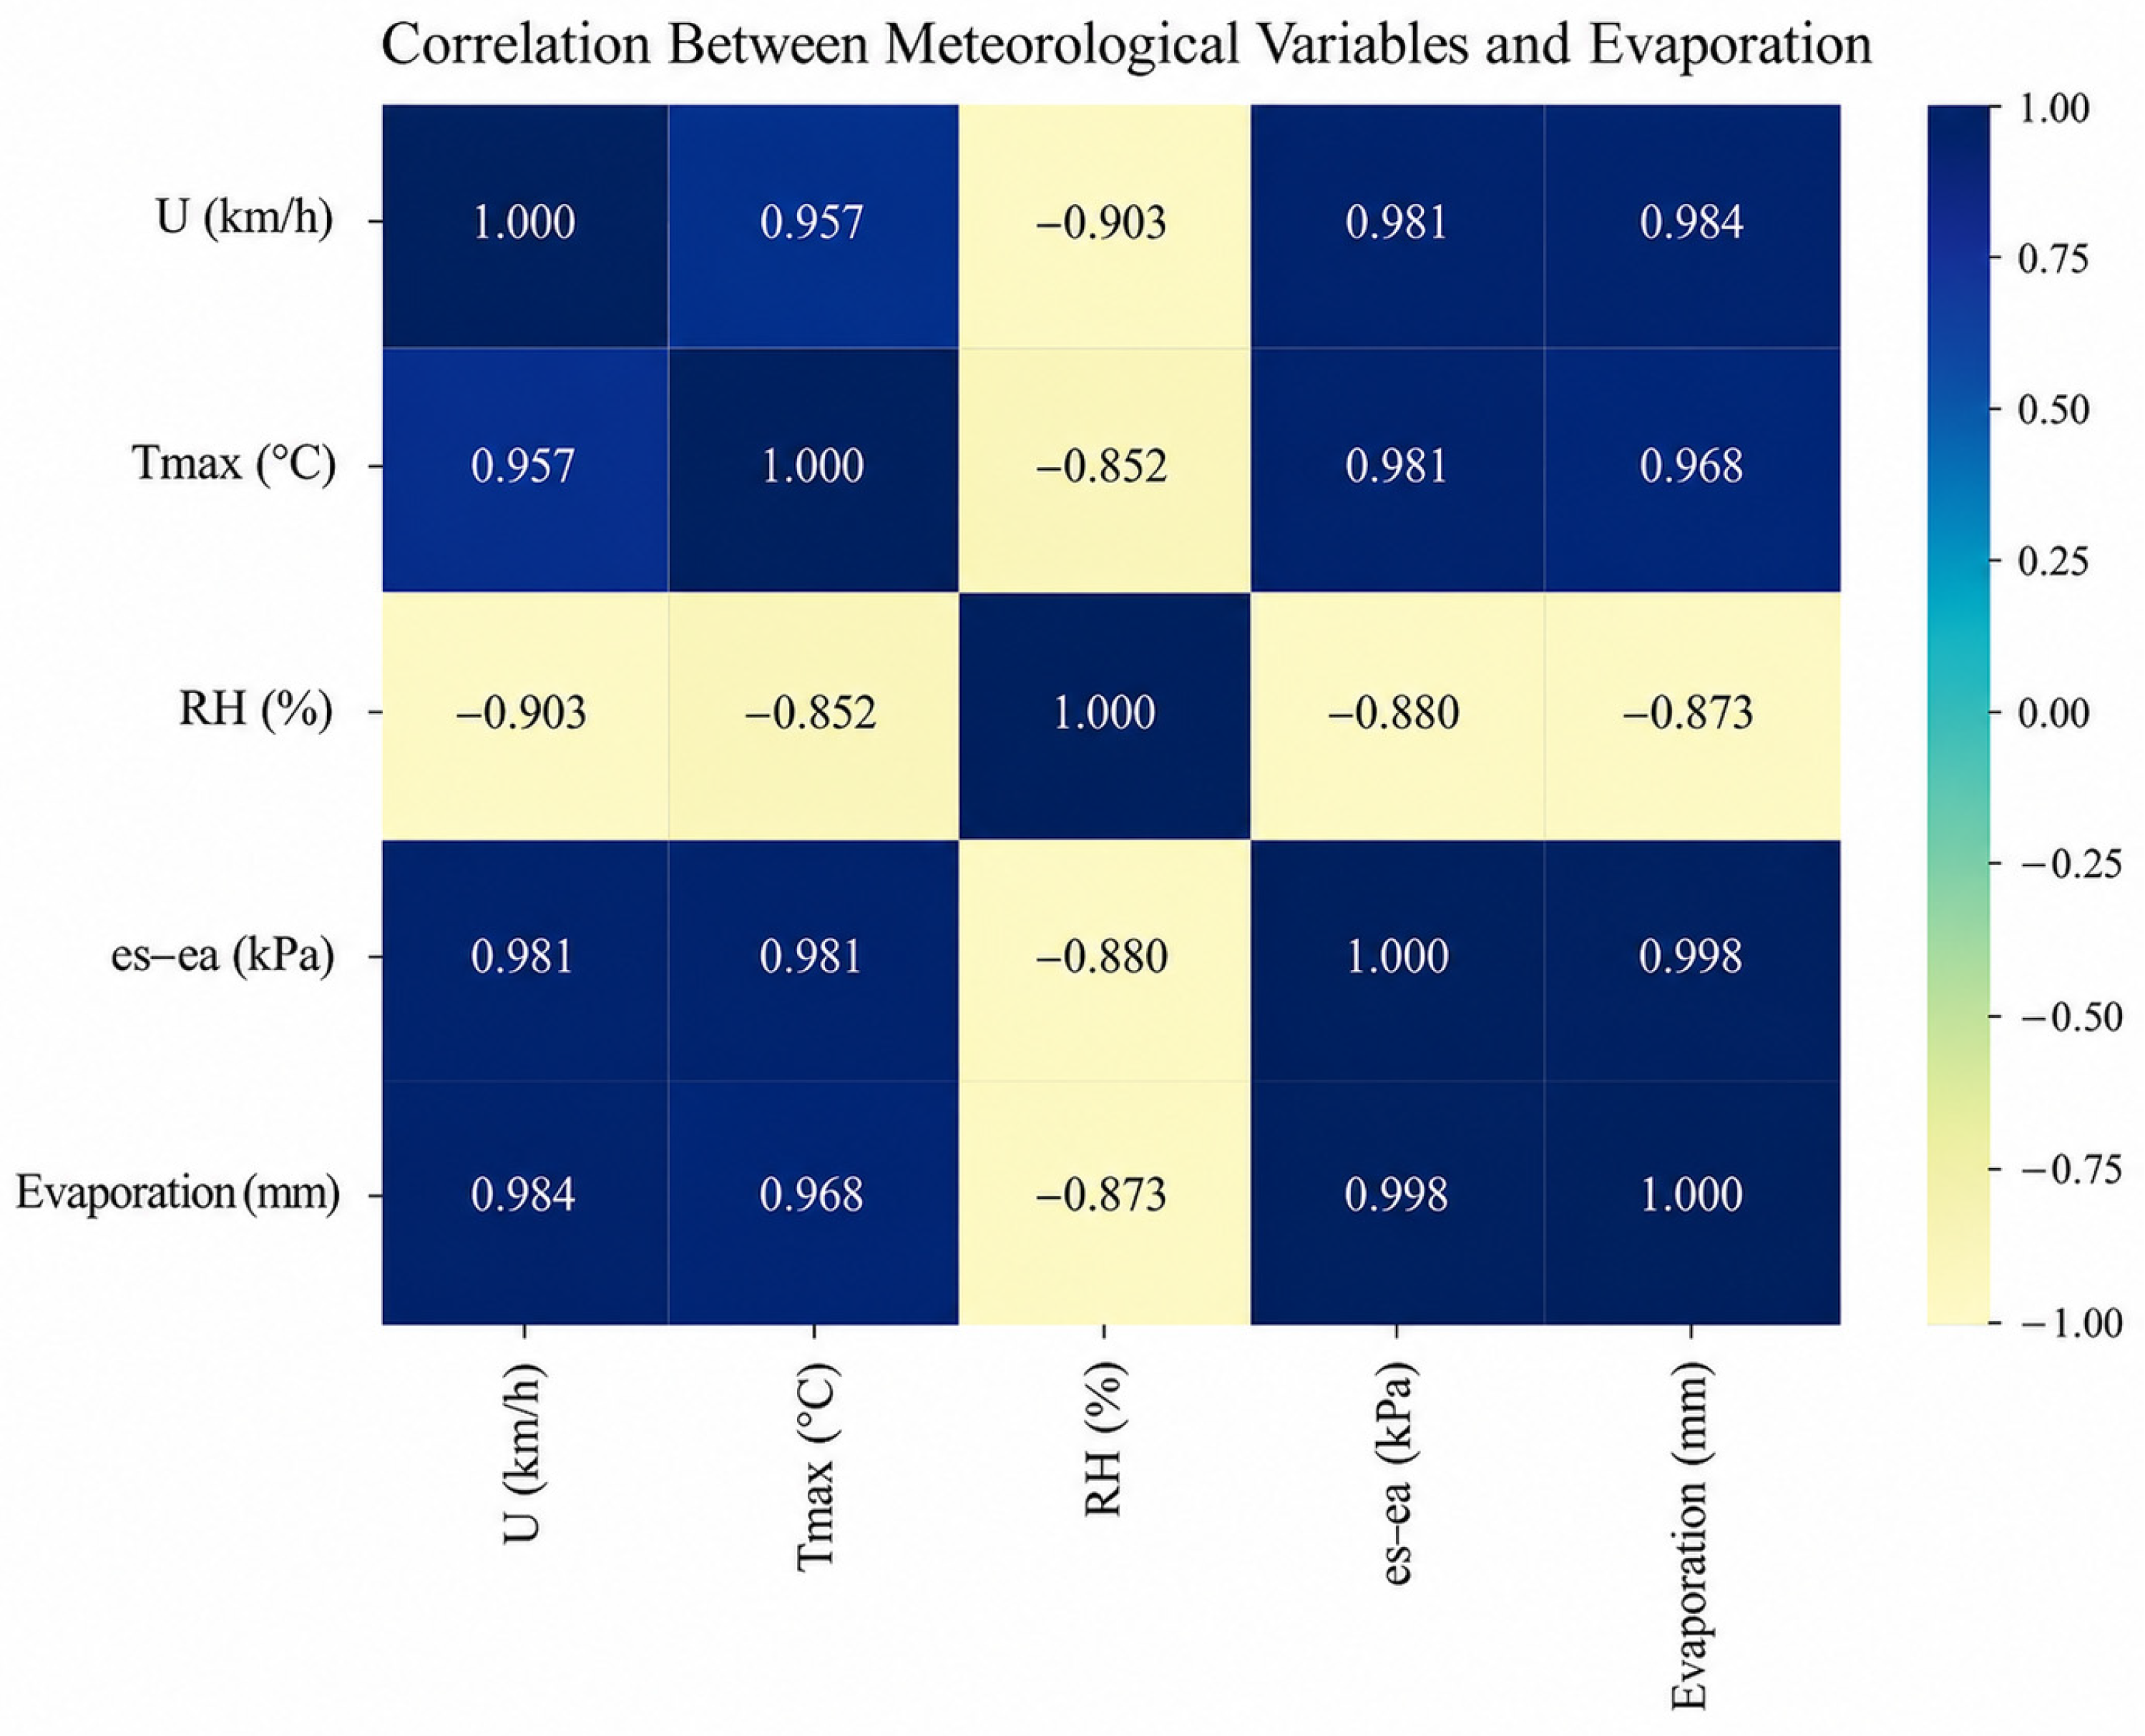
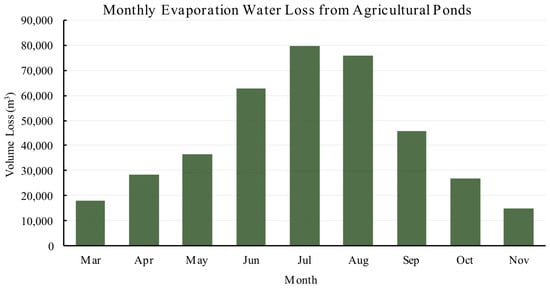
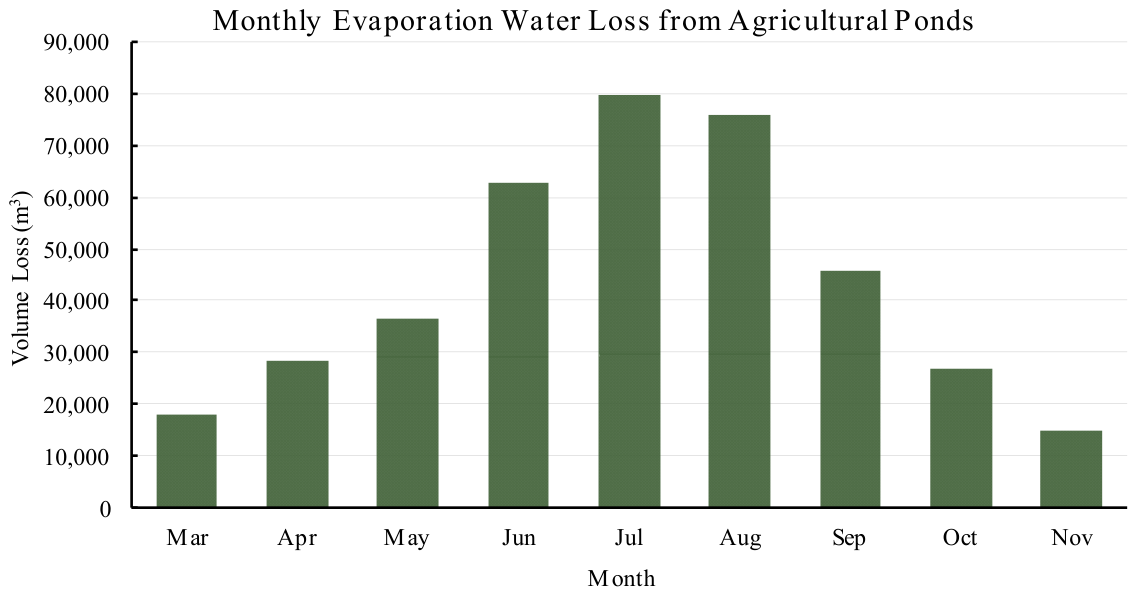
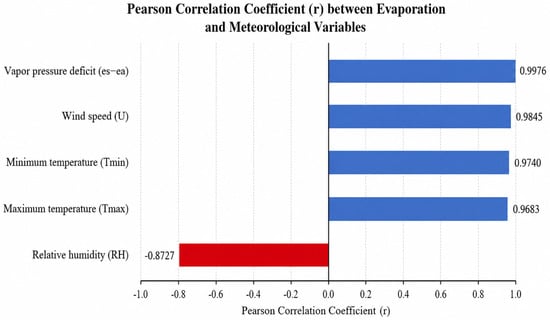
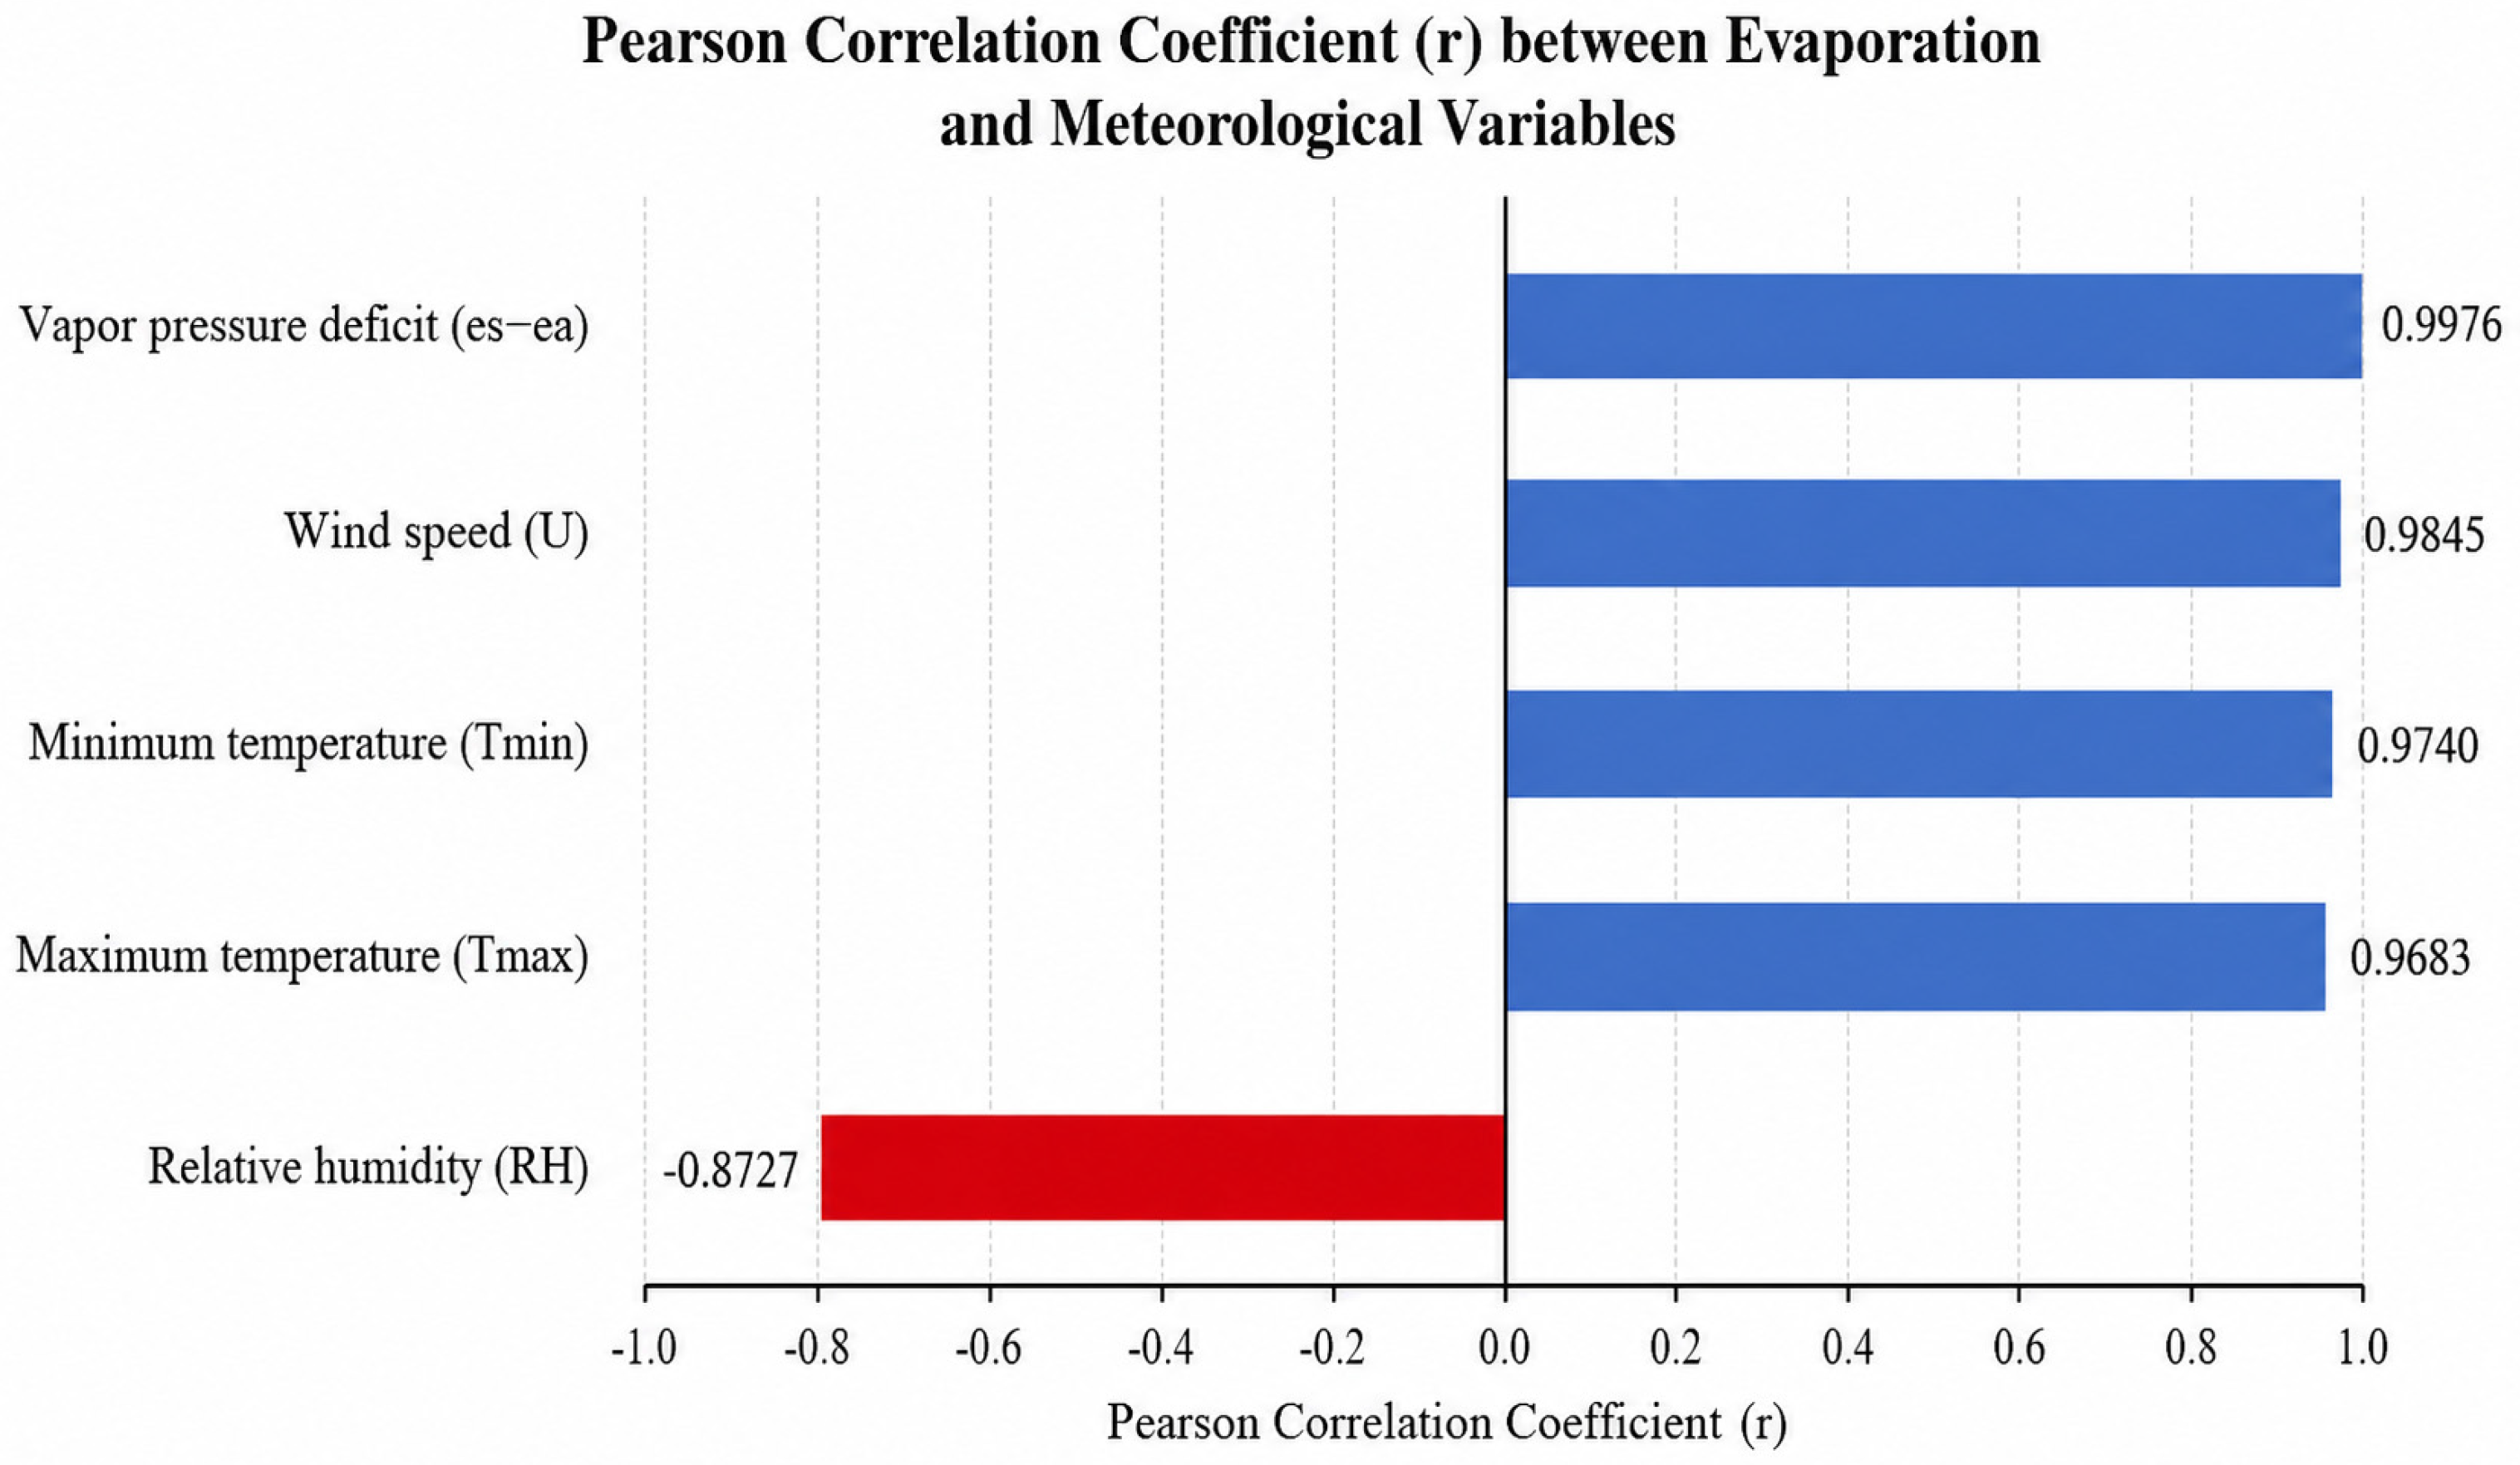

Disclaimer/Publisher’s Note: The statements, opinions and data contained in all publications are solely those of the individual author(s) and contributor(s) and not of MDPI and/or the editor(s). MDPI and/or the editor(s) disclaim responsibility for any injury to people or property resulting from any ideas, methods, instructions or products referred to in the content. |
© 2026 by the authors. Licensee MDPI, Basel, Switzerland. This article is an open access article distributed under the terms and conditions of the Creative Commons Attribution (CC BY) license.