


Abstract
Property taxation serves as a critical instrument for fiscal efficiency and equitable distribution, yet implementation faces significant challenges including valuation inaccuracies, insufficient administrative capacity, and diminished public trust. Indonesia’s Land and Building Tax (PBB-P2) utilizes the Sales Value of Taxable Objects (NJOP) as an administrative proxy for market value, which frequently deviates from actual land prices. These disparities create horizontal inequities, diminish local revenue potential, and generate taxpayer resistance, especially in decentralized regions with constrained technical resources. This research presents the Spatially Adaptive Land Value Determination (SALAD) model as a comprehensive framework for enhancing property tax governance and modernizing fiscal cadastre systems. Unlike conventional mass appraisal methods, SALAD integrates spatial zoning, assessment ratio analysis, land-use characteristics, and the Index of Developing Villages (IDM) with socio-economic indicators including purchasing power and community fiscal behavior. The model incorporates structured social validation to improve public acceptance. Field validation in Lebak Regency employed mixed-methods design with surveys of 75 respondents across 20 villages and interviews with village heads and tax officials. Results demonstrate that transparency, fairness, and visible public benefits are essential for community support. Validation indices vary significantly by IDM category (ANOVA: F = 4.23, p = 0.03 for economic; F = 3.81, p = 0.04 for institutional), confirming that the SALAD model’s adaptive mechanism is empirically grounded.
1. Introduction
Land and property taxation is a cornerstone of local government finance and a critical mechanism for funding public services and spatial development [1]. Among property tax instruments, land value tax (LVT) has long been regarded as economically efficient and normatively fair because it captures unearned land value increments generated by public investment and urban growth [2]. Classical economic theory—from Adam Smith to Henry George—has consistently endorsed land taxation on equity grounds [2]. Yet despite strong theoretical support, the practical performance of land and property taxes remains weak in many jurisdictions. Empirical evidence shows that only a limited number of countries have adopted pure land value taxation, while most property tax systems underperform due to persistent shortcomings in valuation accuracy, institutional capacity, and public acceptance [3].
A central challenge lies in achieving valuation-based tax equity. Horizontal equity requires that properties of similar market value be taxed similarly, while vertical equity requires that tax burdens align with taxpayers’ ability to pay [1,2]. In practice, these principles are frequently undermined by outdated valuation rolls, infrequent reassessments, and opaque appraisal procedures. Well-documented cases, such as the United Kingdom’s council tax, illustrate how obsolete valuations can produce regressive outcomes and erode public trust [2]. Empirical studies consistently demonstrate that valuation systems closely aligned with market values improve perceived fairness and compliance, whereas valuation inaccuracies generate inequities and weaken tax legitimacy [1,4]. Consequently, international standards emphasize transparent, consistent, and regularly updated valuation systems as a prerequisite for effective property taxation [5].
These challenges are particularly pronounced in developing countries, where property taxes typically generate only around 0.6% of GDP [6]. Infrequent revaluations and limited valuation capacity often lead to systematic underassessment of high-value properties and relatively heavier burdens on lower-value properties, producing regressive outcomes [7,8]. Political resistance from landowning elites further constrains reform efforts [7]. Evidence from Brazil and South Africa demonstrates that uniform market value systems, when implemented without sensitivity to local socio-economic conditions, can exacerbate inequities and undermine compliance, particularly in rural and peripheral areas [8,9].
In response, the recent literature increasingly highlights the importance of community participation and social validation in property tax reform. Beyond methodological rigor, taxpayer perceptions of fairness and legitimacy strongly influence compliance behavior [6,7]. Participatory approaches—such as public consultation, transparent disclosure of valuation logic, and stakeholder engagement—have been shown to strengthen trust and reinforce local fiscal social contracts. Experimental evidence from the Democratic Republic of Congo demonstrates that property taxation combined with citizen engagement significantly increased compliance and civic participation [10]. These findings align with perspectives in fiscal geography, which emphasize that spatial governance of tax systems must be sensitive to the uneven geographical distribution of economic capacity and institutional resources [7]. The SALAD model, as a spatially adaptive tool, directly addresses this imperative by integrating geospatial data with socio-economic differentiation—a contribution relevant to the disciplinary scope of Geographies and the growing literature on spatial fiscal governance and geoinformation systems applied to land administration [7,11].
This disconnection reveals a critical gap in the existing literature: current property valuation systems tend to be either technically sophisticated but socially detached, or socially inclusive but analytically weak. Mass appraisal models typically prioritize statistical accuracy and target-oriented revenue outcomes, whereas participatory approaches often prioritize acceptance without systematically integrating socio-economic heterogeneity into the valuation logic. As a result, valuation reforms frequently struggle to balance revenue targets with affordability, spatial inequality, and taxpayer behavior.
Indonesia provides a particularly relevant context for addressing this gap. Indonesia’s Land and Building Tax for Rural and Urban Areas (LBT–RUA) is a major source of locally generated revenue, with the tax base defined by the Sales Value of Taxable Objects (SVTO), an administratively determined proxy for market value [11]. Following fiscal decentralization under Law No. 28/2009, responsibility for SVTO assessment and tax administration was transferred to local governments. While decentralization aimed to enhance valuation responsiveness, many local governments inherited outdated valuation data and lacked sufficient technical capacity, resulting in persistent discrepancies between SVTO and actual market values [11,12]. These discrepancies have produced horizontal inequities, revenue shortfalls, and growing taxpayer resistance.
To address these limitations, the Spatially Adaptive Land Value Determination (SALAD) model was developed as a novel valuation framework that explicitly integrates spatial heterogeneity, socio-economic characteristics, and fiscal behavior into property tax valuation. Unlike conventional mass appraisal systems that are predominantly target-oriented and top-down, SALAD introduces an adaptive mechanism that balances target-oriented revenue objectives with trend-oriented socio-economic realities. The model operationalizes this balance through spatial zoning, assessment ratio analysis, land-use characteristics, and socio-economic indicators—such as the Village Development Index (IDM)—to produce valuation outcomes that are not only technically consistent but also context-sensitive.
Previous applications of SALAD in Lebak Regency demonstrated that spatially adaptive valuation could substantially improve horizontal equity and reduce assessment distortions. However, these studies also identified a critical limitation: the absence of systematic social validation prior to policy implementation [13]. Without explicit community engagement, even spatially refined valuation adjustments risk rejection, non-compliance, or political resistance.
Against this backdrop, the present study advances the SALAD framework by introducing a structured social validation procedure as an integral component of spatially adaptive valuation. Building on the existing SALAD assessment ratio model, this research employs surveys and in-depth interviews with local taxpayers to evaluate perceptions of fairness, affordability, and acceptability before valuation adjustments are implemented. By embedding social participation directly into the valuation validation process, the study moves beyond conventional “socialization” toward a genuinely adaptive fiscal valuation framework.
This study contributes to the literature in three keyways. First, it extends property valuation theory by integrating spatial analytics with social validation in a single adaptive framework. Second, it provides empirical evidence on how community-based validation can refine technically derived valuation outcomes. Third, it offers a practical and scalable approach for improving the legitimacy and sustainability of property tax reform in decentralized and capacity-constrained contexts such as Indonesia.
2. Materials and Methods
2.1. SALAD Framework: Component and Adaptive Mechanism
The Spatially Adaptive Land Value Determination (SALAD) model is an integrated valuation framework that combines spatial and socio-economic analysis to determine Land Value Zones (LVZs) as the basis for property tax assessment. The SALAD framework differs from conventional mass appraisal and participatory approaches by integrating spatial accuracy, socio-economic sensitivity, public legitimacy, scalability, and adaptive capacity into a single adaptive valuation mechanism, as summarized in Table 1. The model integrates a top-down, target-oriented approach with a bottom-up, trend-oriented approach through an adaptive mechanism [13]. Core Components of SALAD:
Table 1.
Comparative Analysis: SALAD vs. Conventional Mass Appraisal vs. Participatory Approaches.
- Spatial Zoning (Land Value Zones/LVZs): Division of assessment areas into zones based on land characteristics, market values, and spatial patterns derived from GIS analysis.
- Assessment Ratio Analysis: Comparison of SVTO/NJOP (assessed value) with LVZ-based market value to identify under-assessment and over-assessment at the village level.
- Land-Use and IDM Integration: Incorporation of spatial land-use planning categories and the Village Development Index (IDM) as weighting parameters in valuation adjustment.
- Social Validation Module (introduced in this study): A structured participatory procedure that integrates community perceptions of fairness, affordability, and acceptability into the adaptive weighting mechanism.
Adaptive Assessment Ratio Formula: The SALAD adaptive mechanism adjusts the base assessment ratio as follows:
where ARadj = adjusted assessment ratio; ARbase = baseline assessment ratio from SVTO/LVZ comparison; α = IDM sensitivity coefficient; IDMscore = normalized Village Development Index score; β = social validation sensitivity coefficient; SVW = Social Validation Weight derived from community survey results.
ARadj = ARbase × (1 + α · IDMscore − β · SVW)
2.2. Study Area: Lebak Regency
Lebak Regency (Kabupaten Lebak) is located in Banten Province, West Java, Indonesia, with its capital in Rangkasbitung. Geographically, it lies between 105°25′–106°30′ E and 6°18′–7°00′ S, bordering Serang and Tangerang Regencies to the north, Bogor and Sukabumi Regencies to the east, the Indian Ocean to the south, and Pandeglang Regency to the west. The regency covers an area of approximately 3426 km2 and comprises 28 sub-districts and 340 villages, with a population of approximately 1.3 million [13].
The northern part of Lebak Regency is characterized by lowland terrain with better infrastructure connectivity, which is why the 20 survey villages (across 8 sub-districts) are predominantly located in this area. The southern region is mountainous and has significantly lower infrastructure access, making field validation logistically challenging. PBB-P2 contributes approximately 18% of the Locally Generated Revenue (PAD) in Lebak Regency (2023 data), making it a fiscally significant tax instrument. However, total LBT realization has consistently remained below target, with tax arrears growing from approximately IDR 6 billion (2019) to IDR 12 billion (2022), highlighting the urgency of the SVTO/NJOP adjustment [13].
The respondent concentration in the northern sub-districts reflects: (1) superior road accessibility; (2) existing Bapenda data coverage and the scope of the ITB–Bapenda Lebak cooperation agreement (PKS); and (3) greater respondent availability due to proximity to Rangkasbitung as the administrative center.
2.3. Purpose of Field Validation
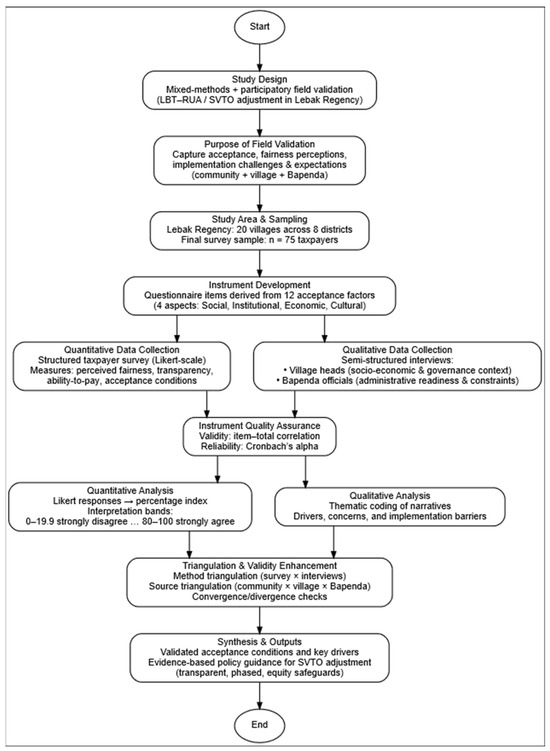
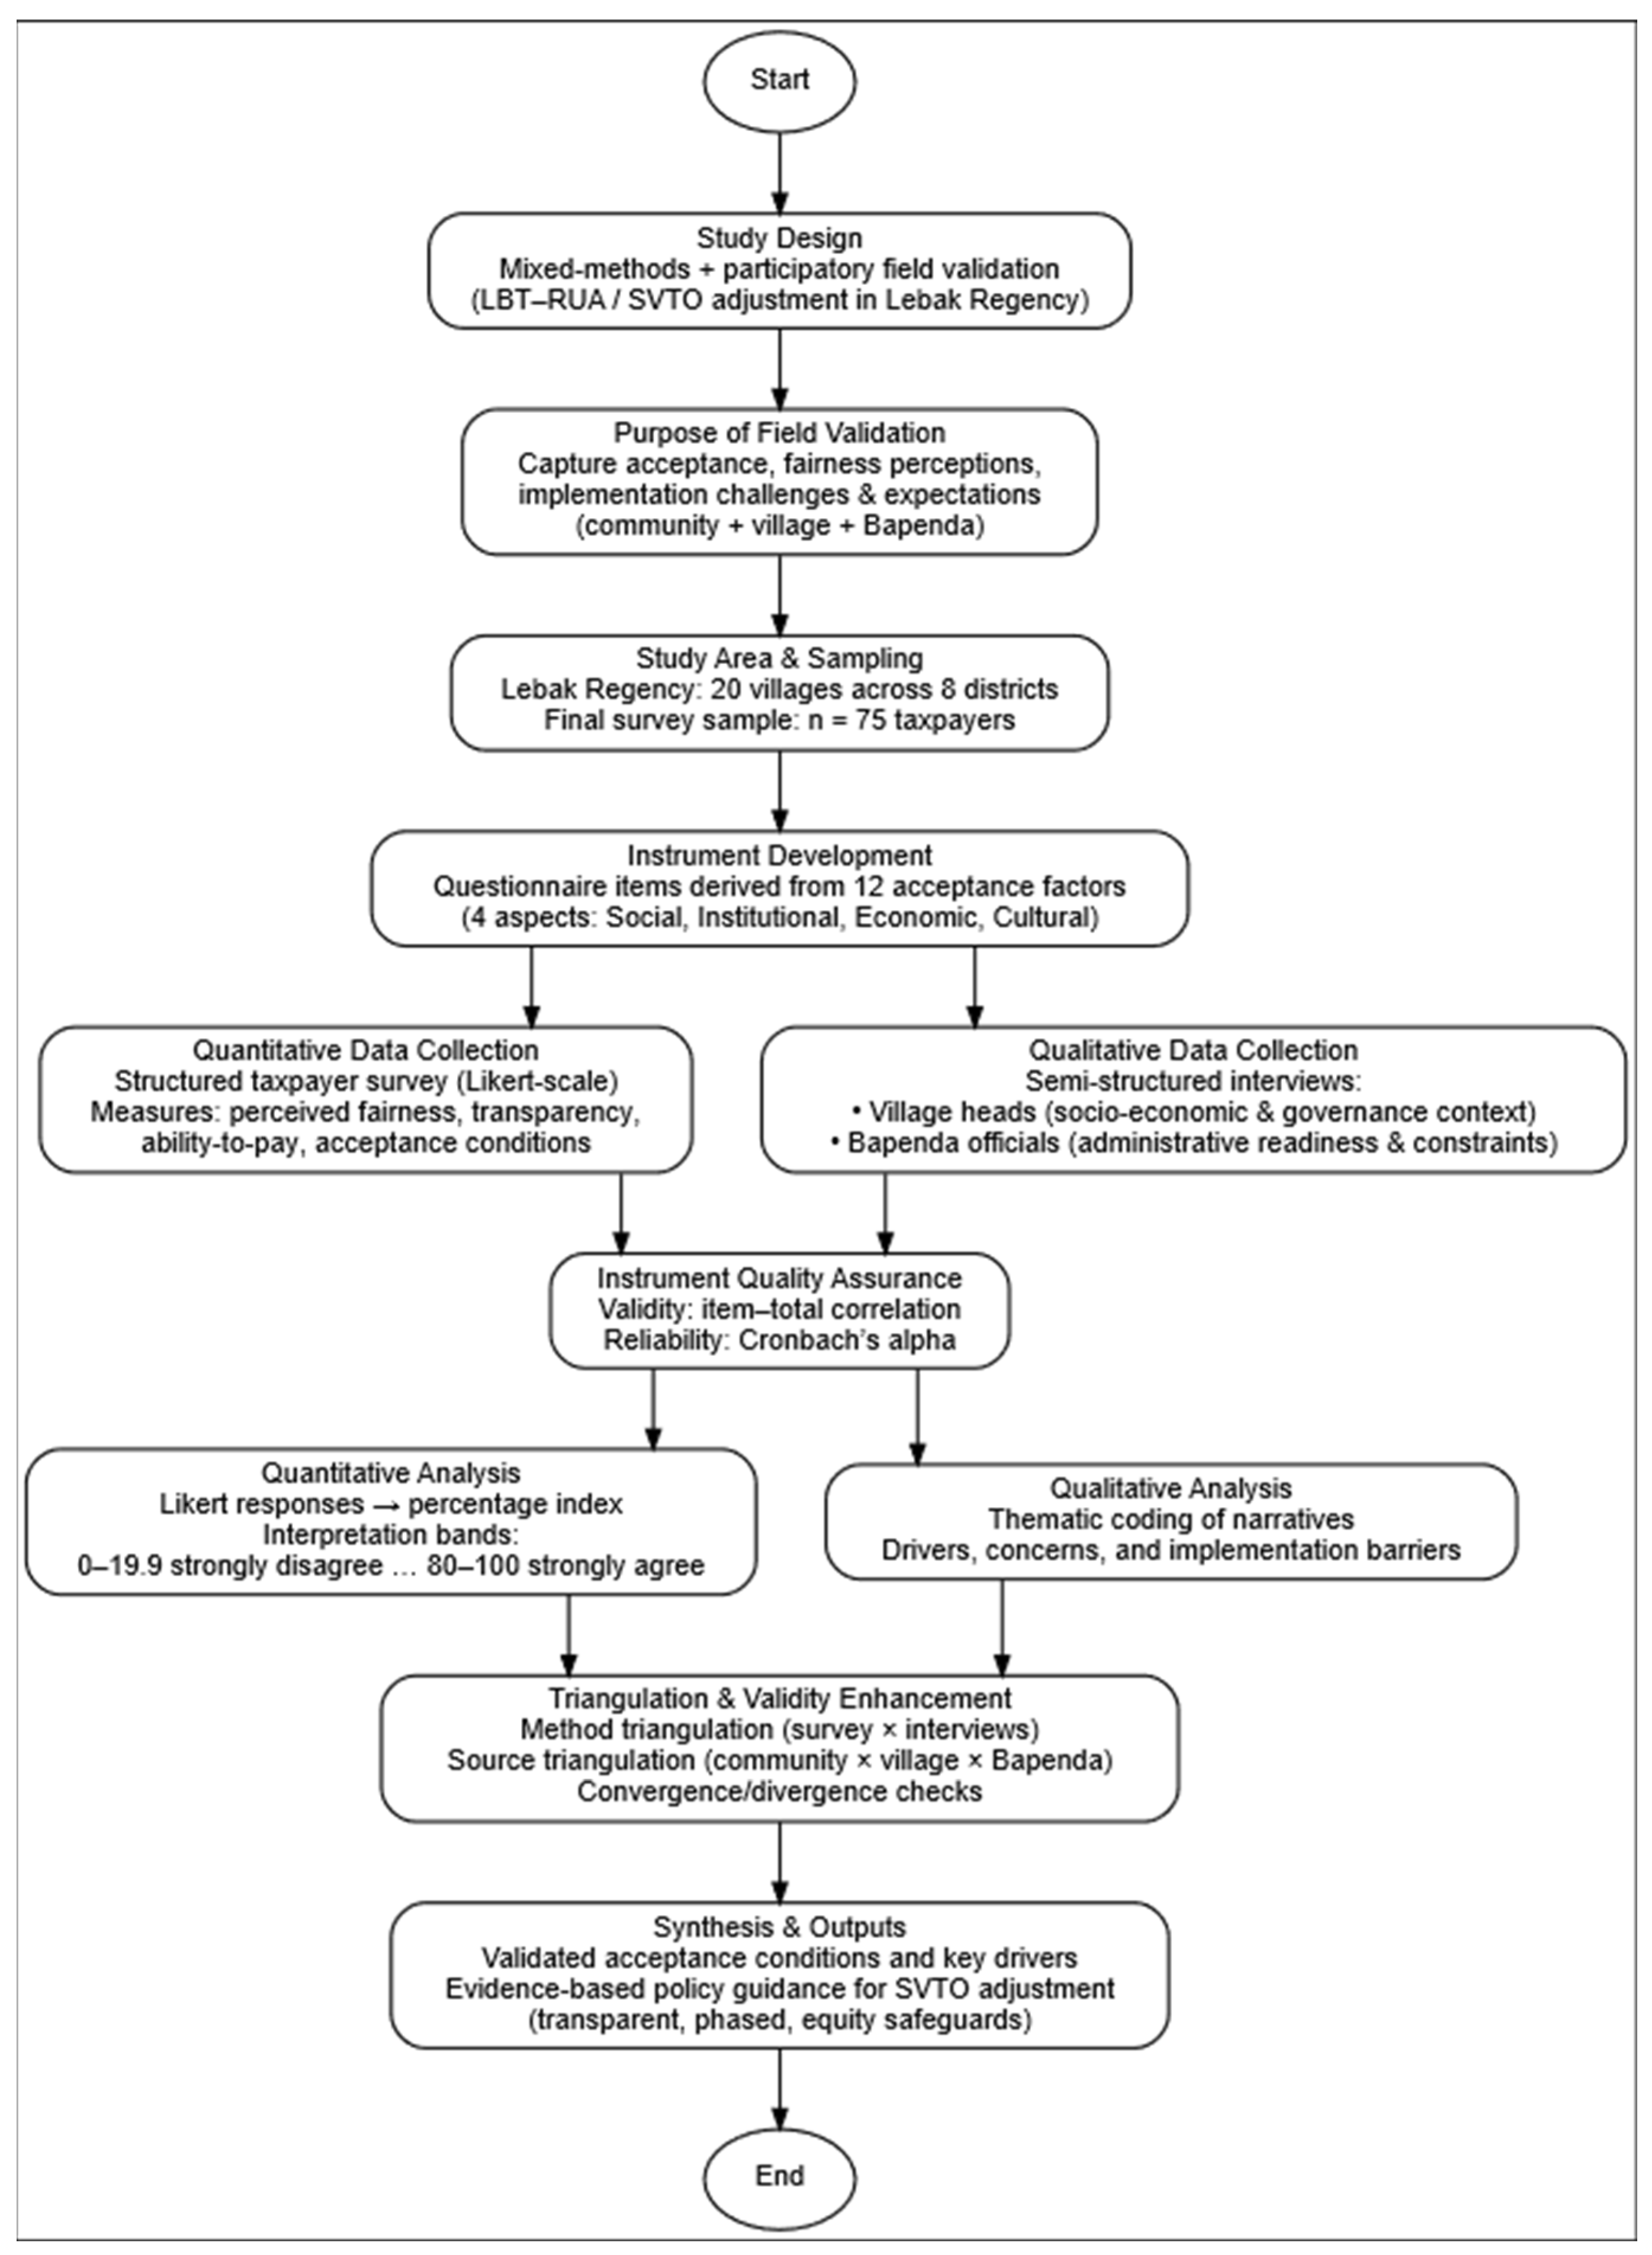
The research methodology follows a structured and sequential workflow designed to ensure that the validation of the Sales Value of Taxable Objects (SVTO) adjustment is both technically sound and socially workflow is provided in Figure 1, Field Validation Methodology.
Figure 1.
Field Validation Methodology.
The process begins with the study design, which adopts a mixed-methods and participatory field validation approach. This design is chosen to capture not only measurable trends in public perception but also the contextual insights necessary for understanding how land and building tax policies are received at the local level. At this stage, the scope of the study is clearly defined, focusing on the validation of SVTO adjustment policies within Lebak Regency.
Field validation of the Sales Value of Taxable Objects (SVTO) adjustment policy was conducted through on-site surveys and in-depth interviews with key stakeholders, including local taxpayers (the community paying Land and Building Tax/LBT), village heads (Kepala Desa/Lurah), and officials from the regional Revenue Agency (Bapenda). The goal of this validation is to obtain direct feedback on the level of public acceptance of the SVTO adjustments, challenges in implementation, and stakeholders’ expectations regarding the policy. By involving the community and local leaders, the SVTO adjustment can be evaluated not only technically but also socio-culturally, ensuring that the resulting LBT policy is more effective, fair, and broadly accepted in society. This addresses a noted gap in previous technical studies, which often lacked community validation to confirm practicality and public acceptance.
Various studies and official sources emphasize that field surveys and direct dialogue with the community are crucial to capture public aspirations and real conditions on the ground [14]. In the context of SVTO adjustment under LBT in Rural and Urban Areas, for example, collaboration between Bapenda, village governments, and residents has proven to accelerate tax object data validation since the villages and residents provide local information that is often not recorded in official documents [15]. By involving taxpayers (citizens) as the primary subjects, policymakers gain new perspectives and strengthen citizens’ sense of ownership, making the policy more easily accepted [15]. Several studies and field experiences note that without clear communication, delayed SVTO adjustments lead to injustice (due to large discrepancies with market values) and public resistance. Therefore, SVTO adjustments should be carried out based on the principles of fairness, transparency, and public communication to maintain taxpayer compliance. This participatory field validation approach—through surveys, interviews, and outreach—complements formal technical assessments, enabling the SVTO adjustment under LBT in Rural and Urban Areas to be designed more effectively, fairly, and widely accepted by the public [15].
2.4. Mixed-Method Research Approach
The study employs a mixed-methods research design, deliberately integrating quantitative surveys with qualitative interviews to leverage the strengths of both approaches [16]. Combining numerical data (surveys) and narrative data (interviews) provides a more comprehensive understanding of complex issues [16,17,18]. Quantitative methods yield broad, population-level insights, while qualitative methods add depth and context. For example, quantitative surveys efficiently gather data from large samples to identify overall trends and general perceptions in the community [19], whereas in-depth interviews allow key informants (e.g., local leaders and tax officials) to explain the reasons behind those perceptions, capturing detailed opinions and suggestions [18].
- Quantitative Surveys: Structured questionnaires can quickly capture demographic information and general attitudes about the SVTO policy across a wide population. Such surveys have historically been used to “describe characteristics of a large sample of individuals of interest relatively quickly,” revealing overall patterns in public opinion [19]. By collecting numerically rated responses from many respondents, surveys provide statistically reliable measures of satisfaction and perception trends in the community [19].
- Qualitative Interviews: In contrast, semi-structured interviews with a smaller set of key informants enable an in-depth exploration of beliefs and motivations. Open-ended questioning lets participants discuss their experiences, concerns, and suggestions in their own words. This qualitative approach uncovers nuances and contextual factors behind survey trends—for example, why certain groups feel satisfied or not—thereby enriching the quantitative findings [18].
2.5. Triangulation and Validity
By integrating these methods, the research performs data triangulation to enhance validity. Triangulation means comparing and cross-verifying results from the surveys and interviews [18,20]. When qualitative and quantitative findings converge, confidence in the conclusions grows; if they diverge, it highlights areas needing further examination [20]. Researchers note that this process leads to “stronger inferences” and more accurate and nuanced conclusions, because the strengths of one method compensate for the weaknesses of the other [18]. In practice, survey statistics (e.g., average satisfaction ratings) can be checked against stakeholders’ personal accounts from interviews. Such cross-verification ensures that the final analysis reflects both the broad trends and the meaning behind those trends, yielding a richer, holistic picture of the policy’s impact [18,20].
2.6. Key Factors Influencing Acceptance of LBT Policy
The survey instrument was designed based on 12 key factors (identified in prior literature) that influence taxpayer compliance and perceptions of the LBT policy in Rural and urban areas (rural/urban land and building tax). These factors are grouped into four broad aspects: social, institutional, economic, and cultural. Each factor was translated into a statement in the questionnaire to test its impact on acceptance of the SVTO adjustment. Below are the factors in each aspect:
- Social Aspect
- Tax SocializationEffective tax education and outreach increase public understanding and awareness of their LBT in Rural and Urban Areas obligations, fostering voluntary compliance [21].
- Taxpayer Knowledge and AwarenessHigher levels of tax knowledge and awareness lead to greater readiness and willingness among taxpayers to fulfill their obligations on time [22].
- Trust in GovernmentPublic trust in government and tax authorities enhances voluntary compliance. When people believe that tax funds are managed transparently, acceptance of LBT policies improves [22].
- Institutional Aspects
- 4.
- Efficiency of Tax AdministrationEfficient administrative processes—such as assessment, billing, and reporting—make tax payments easier and reduce compliance costs [21].
- 5.
- Enforcement and Legal SanctionsStrong enforcement and appropriate penalties encourage compliance by deterring non-payment or evasion [22].
- 6.
- Quality of Public Services and InfrastructureGood public service delivery (e.g., friendly service at tax offices) and supporting infrastructure (e.g., e-tax systems) facilitate easier payment and encourage compliance [22].
- Economic Aspects
- 7.
- Regional Economic GrowthLocal economic development expands the property base and strengthens taxpayers’ purchasing power, positively affecting SVTO and LBT revenues [23].
- 8.
- Investment and Property DevelopmentThe entry of investment and new property projects (housing, offices) increases land and building values, thereby raising tax potential [23].
- 9.
- Population Size and Number of TaxpayersA larger population and more registered taxpayers broaden the tax base and revenue potential [24].
- Cultural Aspects
- 10.
- Religiosity and Moral ValuesReligious and moral norms (e.g., honesty) contribute positively to tax compliance attitudes [25].
- 11.
- Perceived Tax FairnessPerceptions that tax burdens are fair and justified influence acceptance and willingness to comply with LBT in Rural and Urban Areas obligations [25].
- 12.
- Social Responsibility and Communal ValuesCultural values such as mutual cooperation and shared responsibility foster a sense of civic duty in paying taxes [26].
Instrument validity was tested using item-total correlation, and reliability was assessed using Cronbach’s Alpha [27]. Triangulation was performed by comparing results from community questionnaires, village head interviews, and Bapenda interview [28,29,30]. The full structure of the survey instrument, including the 12 questionnaire items grouped into four validation aspects, is provided in Appendix A (Table A1).
2.7. Sampling Strategy and Respondent Profile
The sampling strategy employed in this study was purposive-convenience sampling. Villages were selected based on the following criteria: (1) geographic accessibility (northern sub-districts with adequate road access); (2) availability of village-level SVTO data from Bapenda Lebak; and (3) inclusion within the scope of the ITB–Bapenda Lebak Cooperation Agreement (Perjanjian Kerja Sama). Within each selected village, respondents were recruited through Bapenda and village government referrals, targeting actively registered PBB-P2 taxpayers aged 18 years or older with at least 2 years of residence.
A total of 80 questionnaires were distributed; 75 were validly completed and used in the analysis. These valid responses were collected from respondents in 20 villages across 8 sub-districts, as summarized in Table 2. Five respondents were excluded: 4 from Serang Regency and 1 from Bogor Regency, falling outside the administrative boundary of Lebak Regency. The sample scope was constrained by: (1) geographic and infrastructure limitations (mountainous southern sub-districts were inaccessible during the fieldwork period); (2) time and resource constraints; and (3) social and cultural conditions requiring local government facilitation.
Table 2.
Respondent Demographic Profile (n = 75).
Limitation acknowledgment: The sample size of 75 respondents from 20 villages is recognized as a limitation of this exploratory study. The findings are not intended to be statistically representative of all 340 villages in Lebak Regency. Rather, this study constitutes a structured exploratory field validation that provides preliminary evidence on community acceptance, to be verified through broader research in the future.
2.8. Qualitative Interview Protocol
Semi-structured interviews were conducted with two categories of informants: (1) six village heads (coded KD-01 to KD-06), selected purposively based on criteria of ≥2 years in office and direct involvement in PBB-P2 administration; and (2) three Bapenda officials (coded BP-01 to BP-03), selected based on direct responsibility for SVTO/NJOP data management and tax collection in Lebak Regency.
Interviews were conducted face-to-face in Lebak Regency during October–November 2024, each lasting approximately 45–60 min. The semi-structured interview guide covered five main themes: (1) awareness and understanding of the SVTO/NJOP adjustment policy; (2) community perceptions of tax fairness and burden; (3) institutional capacity and administrative challenges; (4) expectations regarding transparency and public communication; and (5) readiness to support and implement the SALAD-based valuation model.
Interview data were analyzed using thematic analysis, following an open-to-axial coding procedure. Recorded interviews (with participant consent) were transcribed, coded, and organized into three primary themes: (i) transparency and information access, (ii) tax affordability and economic concern, and (iii) institutional trust and participatory readiness.
2.9. Validity and Reliability of Survey Instrument
Instrument validity was assessed through item-total correlation (Pearson r), with threshold r > 0.227 (df = 73, α = 0.05, two-tailed). Reliability was assessed using Cronbach’s Alpha (threshold α > 0.70). All 12 items passed validity testing, and all four aspects demonstrated acceptable internal consistency, as summarized in Table 3.
Table 3.
Validity and Reliability Test Results.
3. Results
3.1. Quantitative Survey Results
A total of 75 valid respondents were included in the analysis, drawn from 20 villages across 8 sub-districts in Lebak Regency. Five respondents were excluded from an initial pool of 80, as they originated from locations outside the administrative boundary of Lebak Regency. The final analytical sample therefore reflects only respondents within the defined study area. Scope limitations are discussed in Section 2.7 and Section 5.3.
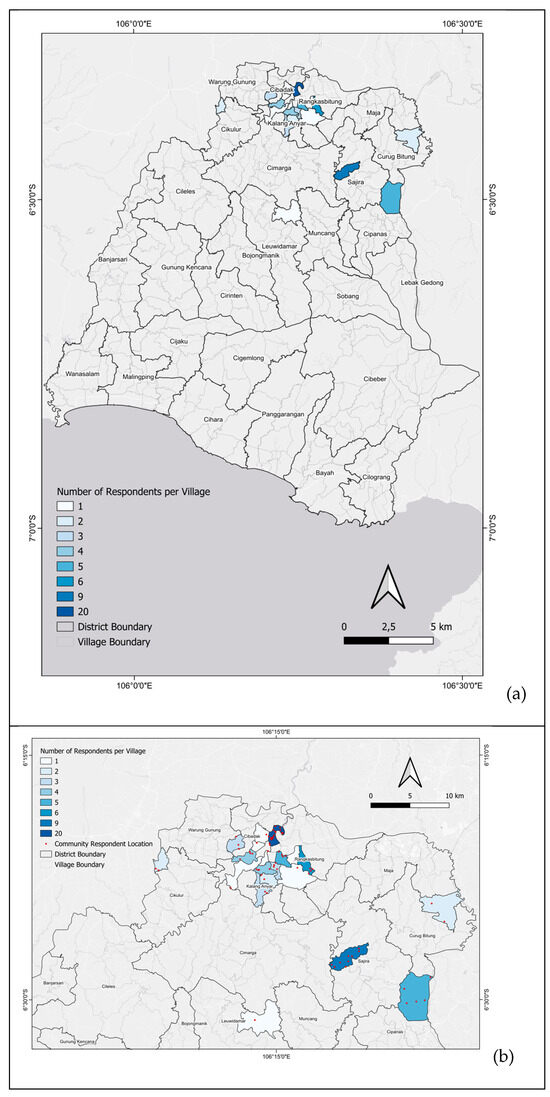
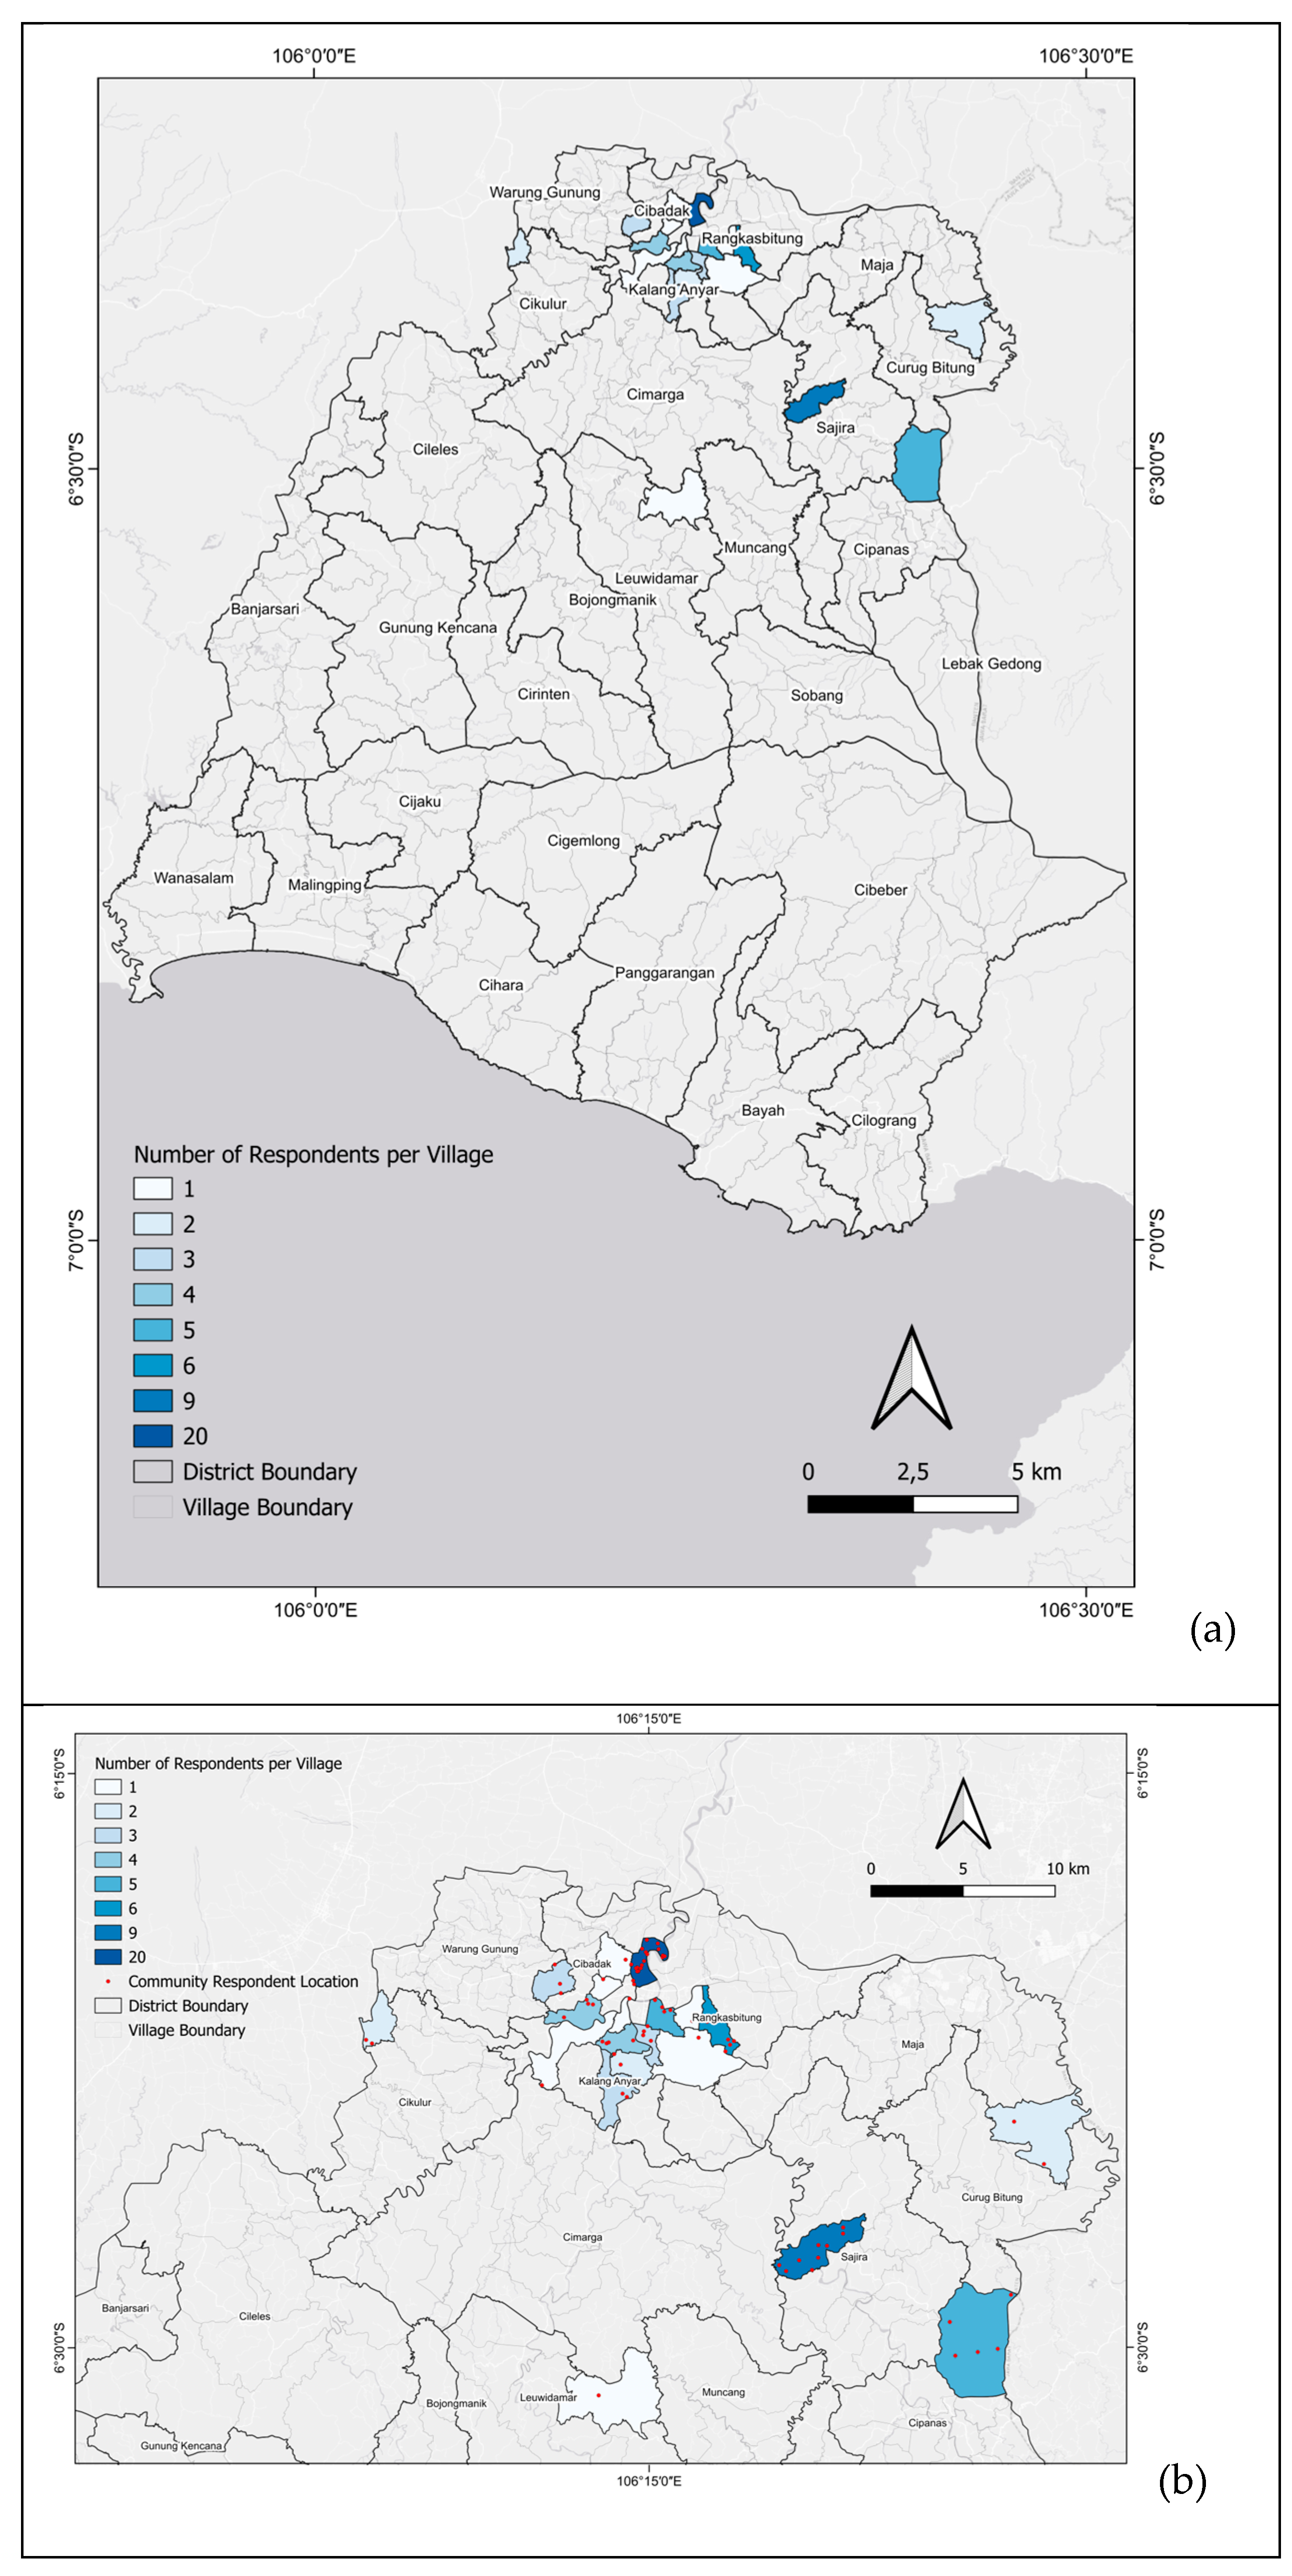
Figure 2 shows the Distribution Map of Community Respondents (spatial representation of villages listed in Table 4). Validation of the NJOP/SVTO adjustment policy was carried out through questionnaire distribution measuring public perceptions across four aspects: Economic, Social, Cultural, and Institutional, using a 5-point Likert scale converted to a percentage index.
Figure 2.
Spatial distribution of community respondents involved in the validation process: (a) overview map showing the distribution of surveyed villages across Lebak Regency, classified by the number of respondents per village; and (b) detailed map showing respondent locations within the selected survey villages.
Table 4.
Percentage Index for Validation Results—Community Respondents (n = 75).
Index Construction Method: The village-level percentage index values for the validation results are presented in Table 4, while the descriptive statistics by aspect are summarized in Table 5. The percentage index for each aspect was calculated as the mean Likert score across items per aspect, normalized to a 0–100% scale (mean score ÷ maximum score × 100%). Equal weighting was applied to all items within each aspect. As shown in Table 4, the Cultural Index is marked ‘–’ for villages where fewer than 2 respondents answered the cultural items, making the score statistically unreliable (threshold: n ≥ 2 per cell). These villages are excluded from cultural aspect comparisons but retained for other aspects. The descriptive statistics in Table 5 show that the Economic aspect had the highest mean score (80.1%), followed by the Social aspect (74.4%), Institutional aspect (67.5%), and Cultural aspect (60.4%). The index categories follow five ranges: 0–19.9% = Strongly Disagree; 20–39.9% = Disagree; 40–59.9% = Neutral; 60–79.9% = Agree; 80–100% = Strongly Agree. The index categories follow five ranges: 0–19.9% = Strongly Disagree; 20–39.9% = Disagree; 40–59.9% = Neutral; 60–79.9% = Agree; 80–100% = Strongly Agree.
Table 5.
Descriptive Statistics of Validation Index by Aspect (n = 75).
The survey results indicate that the majority of respondents support the SVTO/NJOP adjustment as long as the process is transparent and economically fair. These data are consistent with findings by Hernandi et al. (2025) [13], which show that tax assessments on low-value properties are often inaccurate and can damage public trust if overvalued. Respondents in the ‘Developed’ IDM category showed significantly higher acceptance across all aspects, particularly for institutional aspects (mean: 83.5%), indicating that trust in local government and administrative quality strongly correlates with valuation acceptance. Respondents in ‘Underdeveloped’ villages showed the lowest institutional acceptance (54.3%—neutral range), reflecting concerns about administrative fairness and capacity, consistent with Harring and Jagers [31].
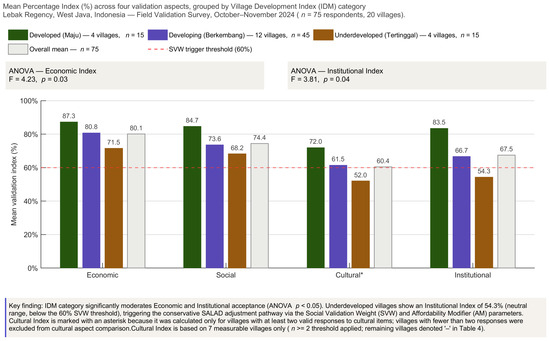
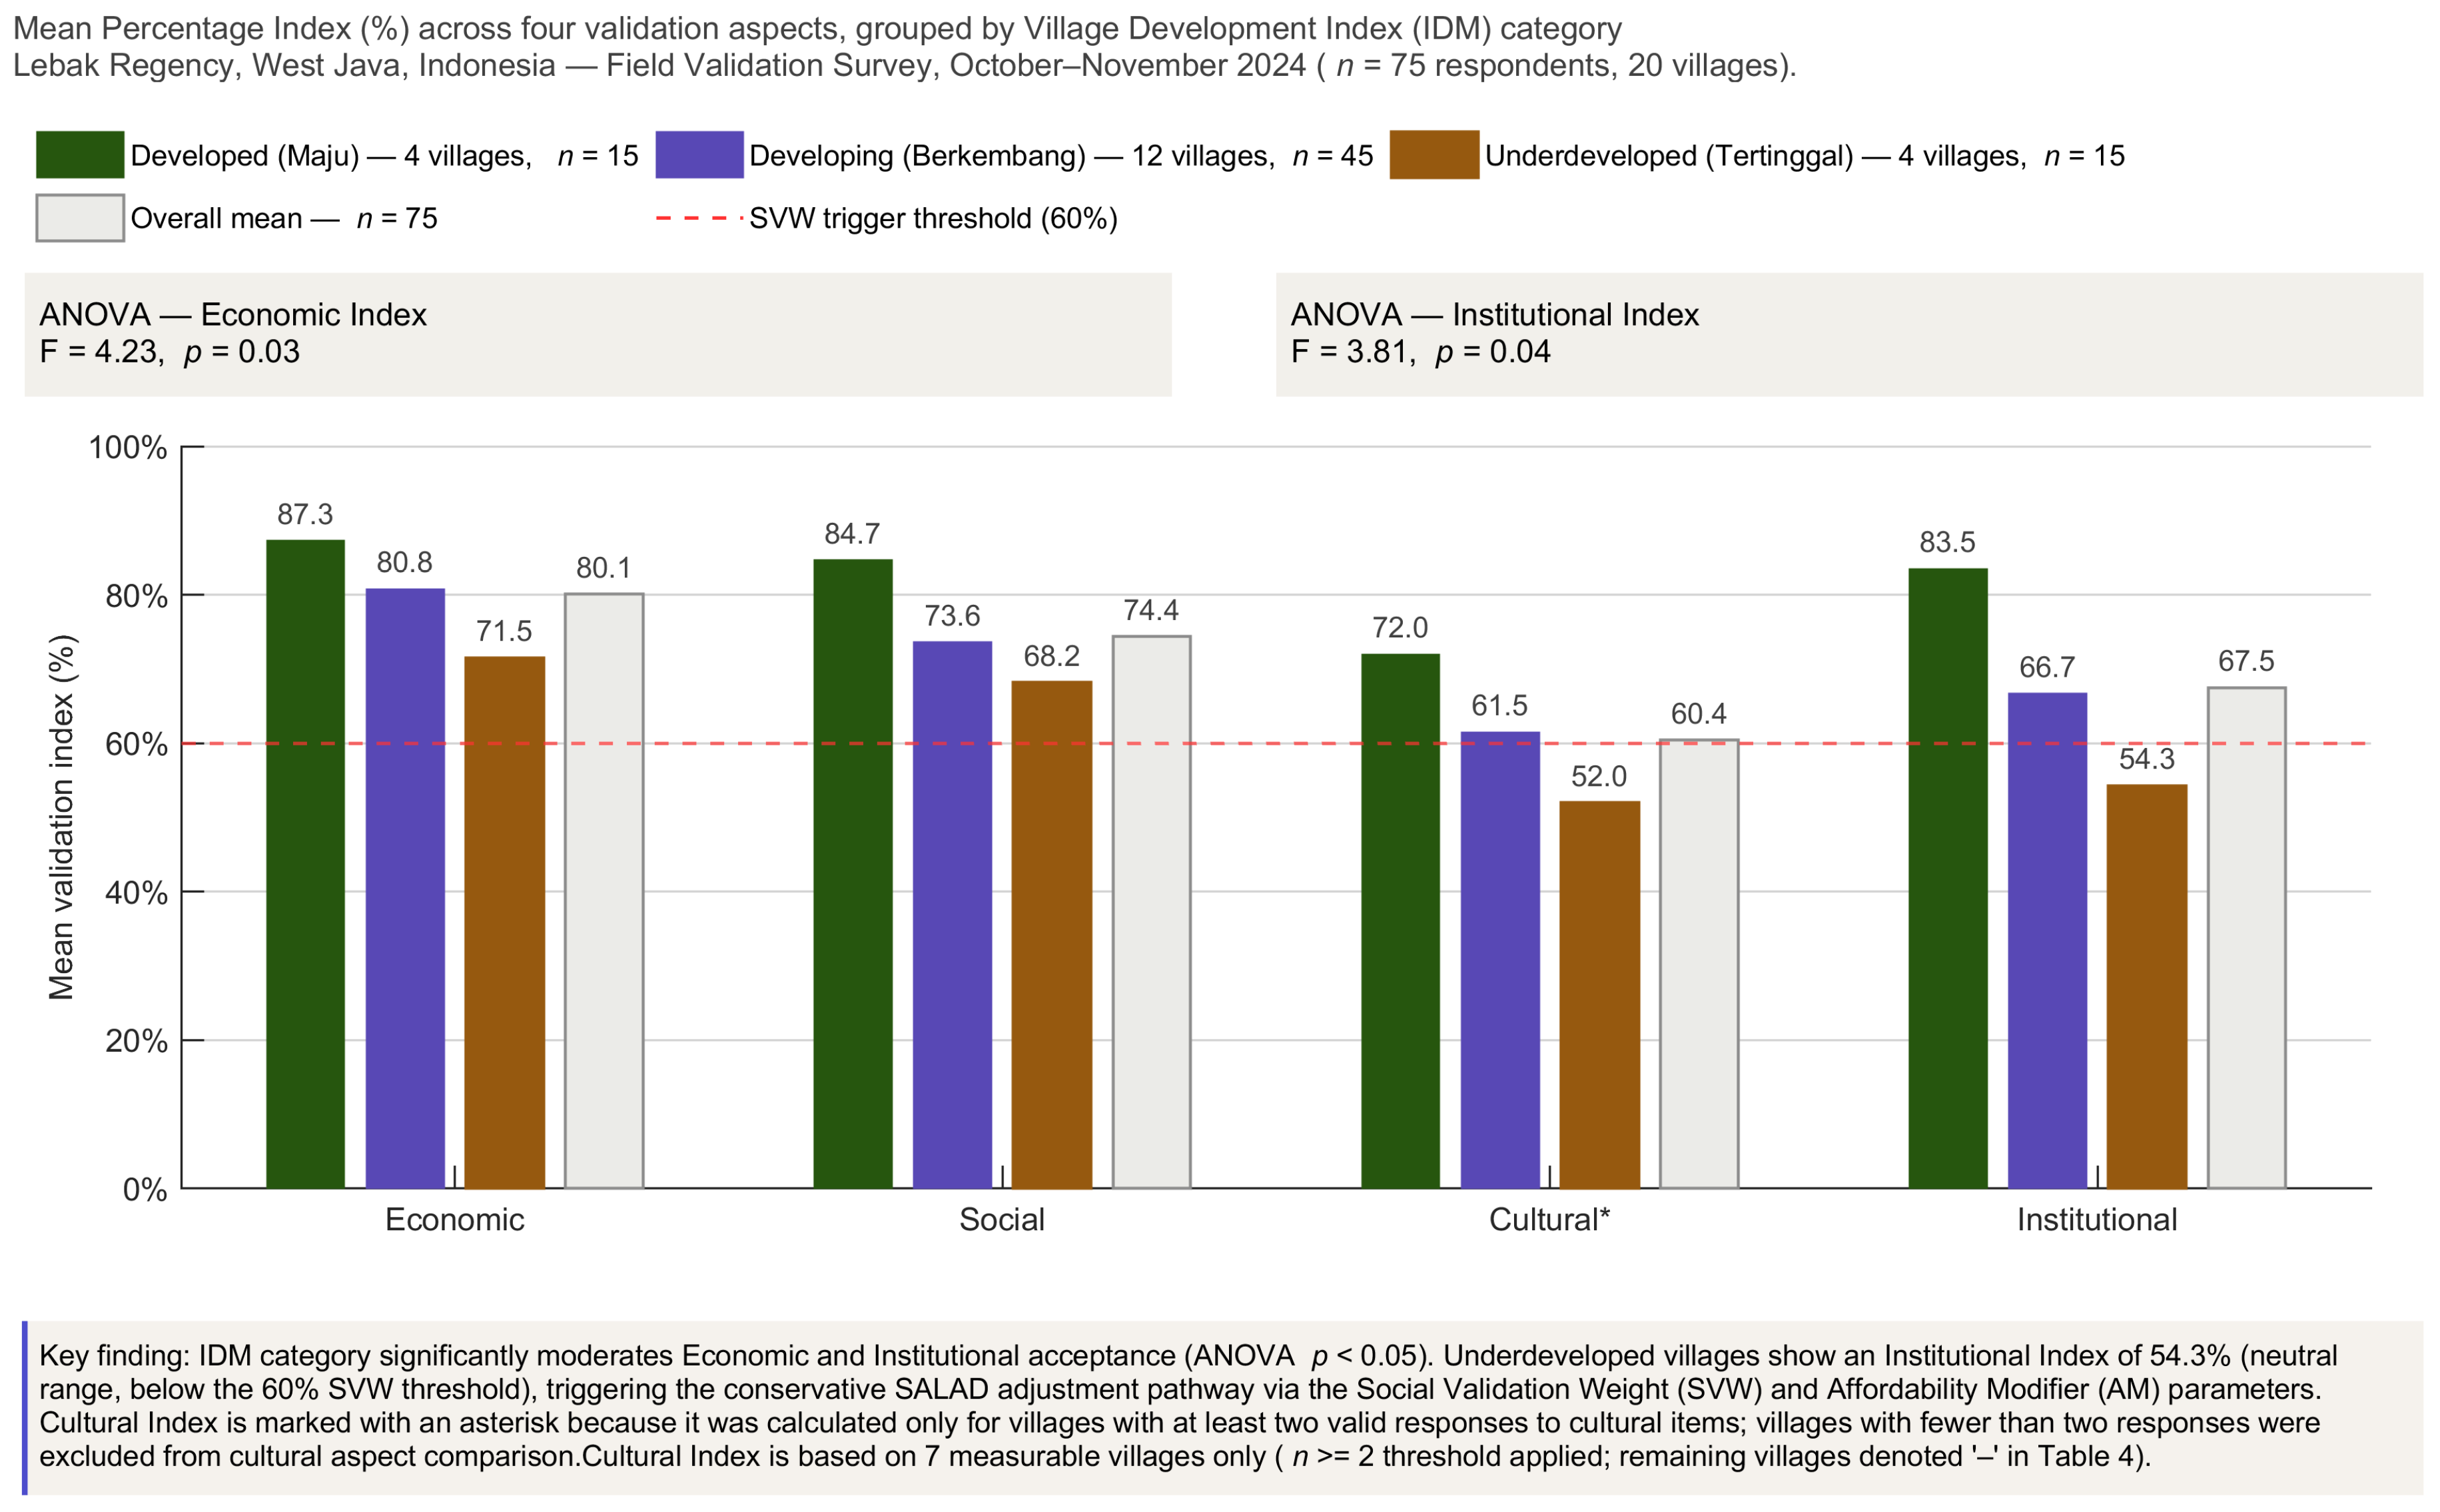
Figure 3 presents a grouped bar chart illustrating the mean validation index scores across four aspects—Economic, Social, Cultural, and Institutional—disaggregated by IDM development category (Developed, Developing, and Underdeveloped) alongside the overall mean for all 75 respondents. A clear and consistent gradient is visible across all four aspects: Developed villages (n = 15) recorded the highest mean scores across every dimension, followed by Developing villages (n = 45), with Underdeveloped villages (n = 15) consistently returning the lowest values. This pattern confirms that village development status, as measured by the Index of Developing Villages (IDM), is a meaningful moderator of community acceptance of the SVTO/NJOP adjustment policy.
Figure 3.
Bar Chart of Mean Validation Index by Aspect and IDM Category.
The Economic Index shows the widest absolute gap between IDM categories, ranging from 87.3% in Developed villages to 71.5% in Underdeveloped villages—a difference of 15.8 percentage points. Both values fall within the “Agree” (60–79.9%) and “Strongly Agree” (80–100%) ranges, respectively, indicating that economic rationale for the valuation adjustment is broadly accepted across all IDM categories, though the degree of acceptance diminishes markedly in lower-development contexts. This finding is consistent with Bahl and Martinez-Vazquez [6], who document that property tax acceptance is strongly moderated by taxpayer income levels and perceived fiscal reciprocity.
The Institutional Index exhibits the most critical variation in the context of the SALAD model. While Developed villages returned a mean Institutional Index of 83.5% (Strongly Agree range) and Developing villages scored 66.7% (Agree range), Underdeveloped villages recorded a mean of only 54.3%, which falls within the Neutral range (40–59.9%). This score lies below the 60% Social Validation Weight (SVW) activation threshold defined in Section 3.4, meaning that five villages in the Underdeveloped category—including Cilayang (45%), Sukamekarsari (55%), Rangkasbitung Barat (56%), Cibadak (57%), and Kalang Anyar (57%)—are flagged for conservative SALAD adjustment. The ANOVA result for the Institutional Index (F = 3.81, p = 0.04) confirms that this inter-category difference is statistically significant at the 5% level, providing empirical justification for IDM as a primary weighting parameter within the adaptive formula.
The Cultural Index, computed only for the seven villages where at least two respondents answered the cultural items (n ≥ 2 threshold), also follows the downward gradient, with Developed villages averaging 72.0%, Developing villages 61.5%, and Underdeveloped villages 52.0%. The highest variability among all four aspects (SD = 16.9%) is observed in the Cultural Index, reflecting the heterogeneous cultural landscape of Lebak Regency—particularly the distinct governance norms and communal land practices of indigenous communities such as the Baduy in Kanekes village [13]. This variability underscores the importance of culturally sensitive socialization strategies as a precondition for broader policy acceptance, consistent with the findings of Harring and Jagers [31] on the role of shared social values in moderating acceptance of new fiscal instruments.
The Social Index follows an intermediate pattern (Developed: 84.7%; Developing: 73.6%; Underdeveloped: 68.2%), with all three IDM groups falling within either the Agree or Strongly Agree range. The ANOVA test for Social Index (F = 2.91, p = 0.07) does not reach conventional significance at the 5% level, suggesting that social acceptance of the policy—while higher in more developed villages—is relatively more consistent across IDM categories than economic or institutional acceptance. This may reflect the universality of the social trust concerns expressed by village heads in the interviews (see Section 3.2), which cut across all development levels.
Taken together, Figure 3 provides visual confirmation that village development status, as captured by IDM, systematically shapes the extent and nature of community acceptance across all four validation dimensions. These findings directly inform the SALAD model’s adaptive weighting mechanism: villages with lower IDM scores and institutional acceptance indices receive more conservative SVTO/NJOP adjustments through the Social Validation Weight (β·SVW) and Affordability Modifier (AM) parameters, ensuring that the resulting valuation outcomes are not only technically accurate but also socially calibrated to the absorptive capacity of each village context.
3.2. Village Head Interview Results
Thematic analysis of interviews with six village heads (KD-01 to KD-06) revealed three primary themes: transparency and information access, tax affordability, and institutional trust. The following verbatim quotations (translated from Indonesian) illustrate these themes:
[Transparency—KD-03, Village Head, Cilangkap, November 2024]: “Masyarakat kami siap menerima penyesuaian NJOP kalau pemerintah mau jelaskan terbuka, dari mana angkanya dan untuk apa uangnya dipakai. Yang bikin warga takut itu kalau naik tiba-tiba tanpa penjelasan.” [Translation: Our community is ready to accept the NJOP adjustment if the government explains transparently where the figures come from and how the revenue will be used. What frightens residents is a sudden increase without explanation.]
[Affordability—KD-01, Village Head, Bojong Leles, October 2024]: “Kalau NJOP naik tapi penghasilan warga tidak naik, itu masalah. Banyak warga kami petani kecil yang sudah susah. Harap pemerintah betul-betul lihat kemampuan bayar dulu.” [Translation: If NJOP increases but residents’ income does not, that is a problem. Many of our residents are small farmers already struggling. We hope the government truly considers affordability first.]
[Institutional Trust—KD-05, Village Head, Jalupang Mulya, November 2024]: “Kalau ada sosialisasi yang benar, melibatkan tokoh masyarakat, dan warga tahu hasilnya dipakai untuk desa, pasti ada dukungan. Yang penting prosesnya jelas dan adil.” [Translation: If there is proper outreach involving community leaders, and residents know the revenue benefits the village, there will certainly be support. What matters is that the process is clear and fair.]
These findings confirm that village heads see community engagement and transparent communication as prerequisites for policy acceptance. The study by Listiana et al. (2025) [32] reported that low awareness and institutional distrust hinder timely tax payments—consistent with the concerns raised by KD-01 and KD-03. Pane et al. (2025) [33] emphasized budget transparency as a driver of tax compliance, which aligns with KD-05’s emphasis on demonstrating visible benefits.
3.3. Revenue Agency (Bapenda) Interview Results
Interviews with three Bapenda officials (BP-01 to BP-03) highlighted both institutional efforts and persistent administrative challenges.
[Digital Modernization—BP-02, Bapenda Official, Tax Assessment Division, October 2024]: “Tantangan terbesar kami adalah data SPPT (Surat Pemberitahuan Pajak Terutang—Tax Assessment Notice) yang belum update, sehingga wajib pajak sering bingung dengan tagihan yang tidak sesuai kondisi lapangan. Kita sudah mulai digitalisasi tapi butuh waktu dan kapasitas SDM.” [Translation: Our greatest challenge is that the SPPT (Tax Assessment Notice) data are not yet updated, causing taxpayers to be confused by bills that do not reflect actual field conditions. We have started digitalization but it requires time and human resource capacity.]
[Community Engagement—BP-01, Head of PBB-P2 Division, October 2024]: “Model SALAD ini sangat menjanjikan karena mempertimbangkan kondisi desa secara spasial. Tapi tanpa validasi sosial seperti yang dilakukan dalam penelitian ini, warga akan sulit menerima perubahan NJOP. Kami butuh dukungan komunitas.” [Translation: The SALAD model is very promising because it considers village conditions spatially. But without social validation as done in this research, residents will have difficulty accepting NJOP changes. We need community support.]
These institutional perspectives reflect that Bapenda views SALAD-based adjustment as technically credible but contingent on community validation for social legitimacy—directly corroborating the study’s framework. The digitalization initiatives described by BP-02 are consistent with findings by Pane et al. [33], who note that digital tax payment integration can increase compliance through accessibility.
3.4. Integration of Validation Findings into the SALAD Framework
The empirical findings from community surveys and interviews are operationalized into the SALAD adaptive mechanism through three parameters:
- [1].
- Social Validation Weight (SVW): Derived from the Institutional Index per village. Villages scoring below 60% (neutral range) receive a downward adjustment to the SALAD assessment ratio to prevent socially unacceptable SVTO/NJOP increases. In this study, 5 of 20 villages fell below this threshold (Cilayang: 45%, Sukamekarsari: 55%, Rangkasbitung Barat: 56%, Cibadak/Kalang Anyar: 57%).
- [2].
- Affordability Modifier (AM): Derived from the Economic Index. Villages in the ‘Underdeveloped’ IDM category with Economic Index below 75% receive a reduced SVTO/NJOP increment cap (maximum +30% above current SVTO, regardless of market value gap), protecting low-income taxpayers from disproportionate burden increases.
- [3].
- IDM-SALAD Interaction: The ANOVA results (Table 6) confirm that IDM category significantly moderates community acceptance of SVTO/NJOP adjustment. This empirically validates the SALAD model’s use of IDM as a primary weighting parameter—‘Developed’ villages can absorb larger SVTO/NJOP adjustments (higher AR_adj), while ‘Underdeveloped’ villages require more conservative adjustments.Table 6. Comparative Analysis of Validation Index by IDM Category.
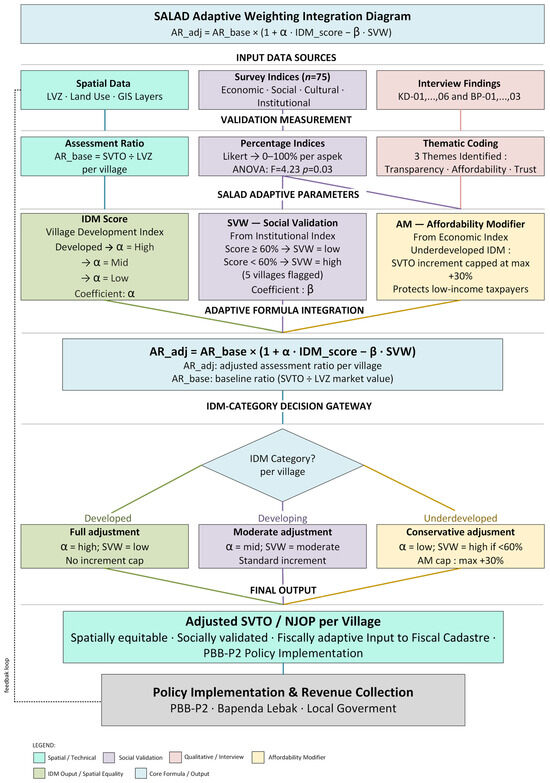
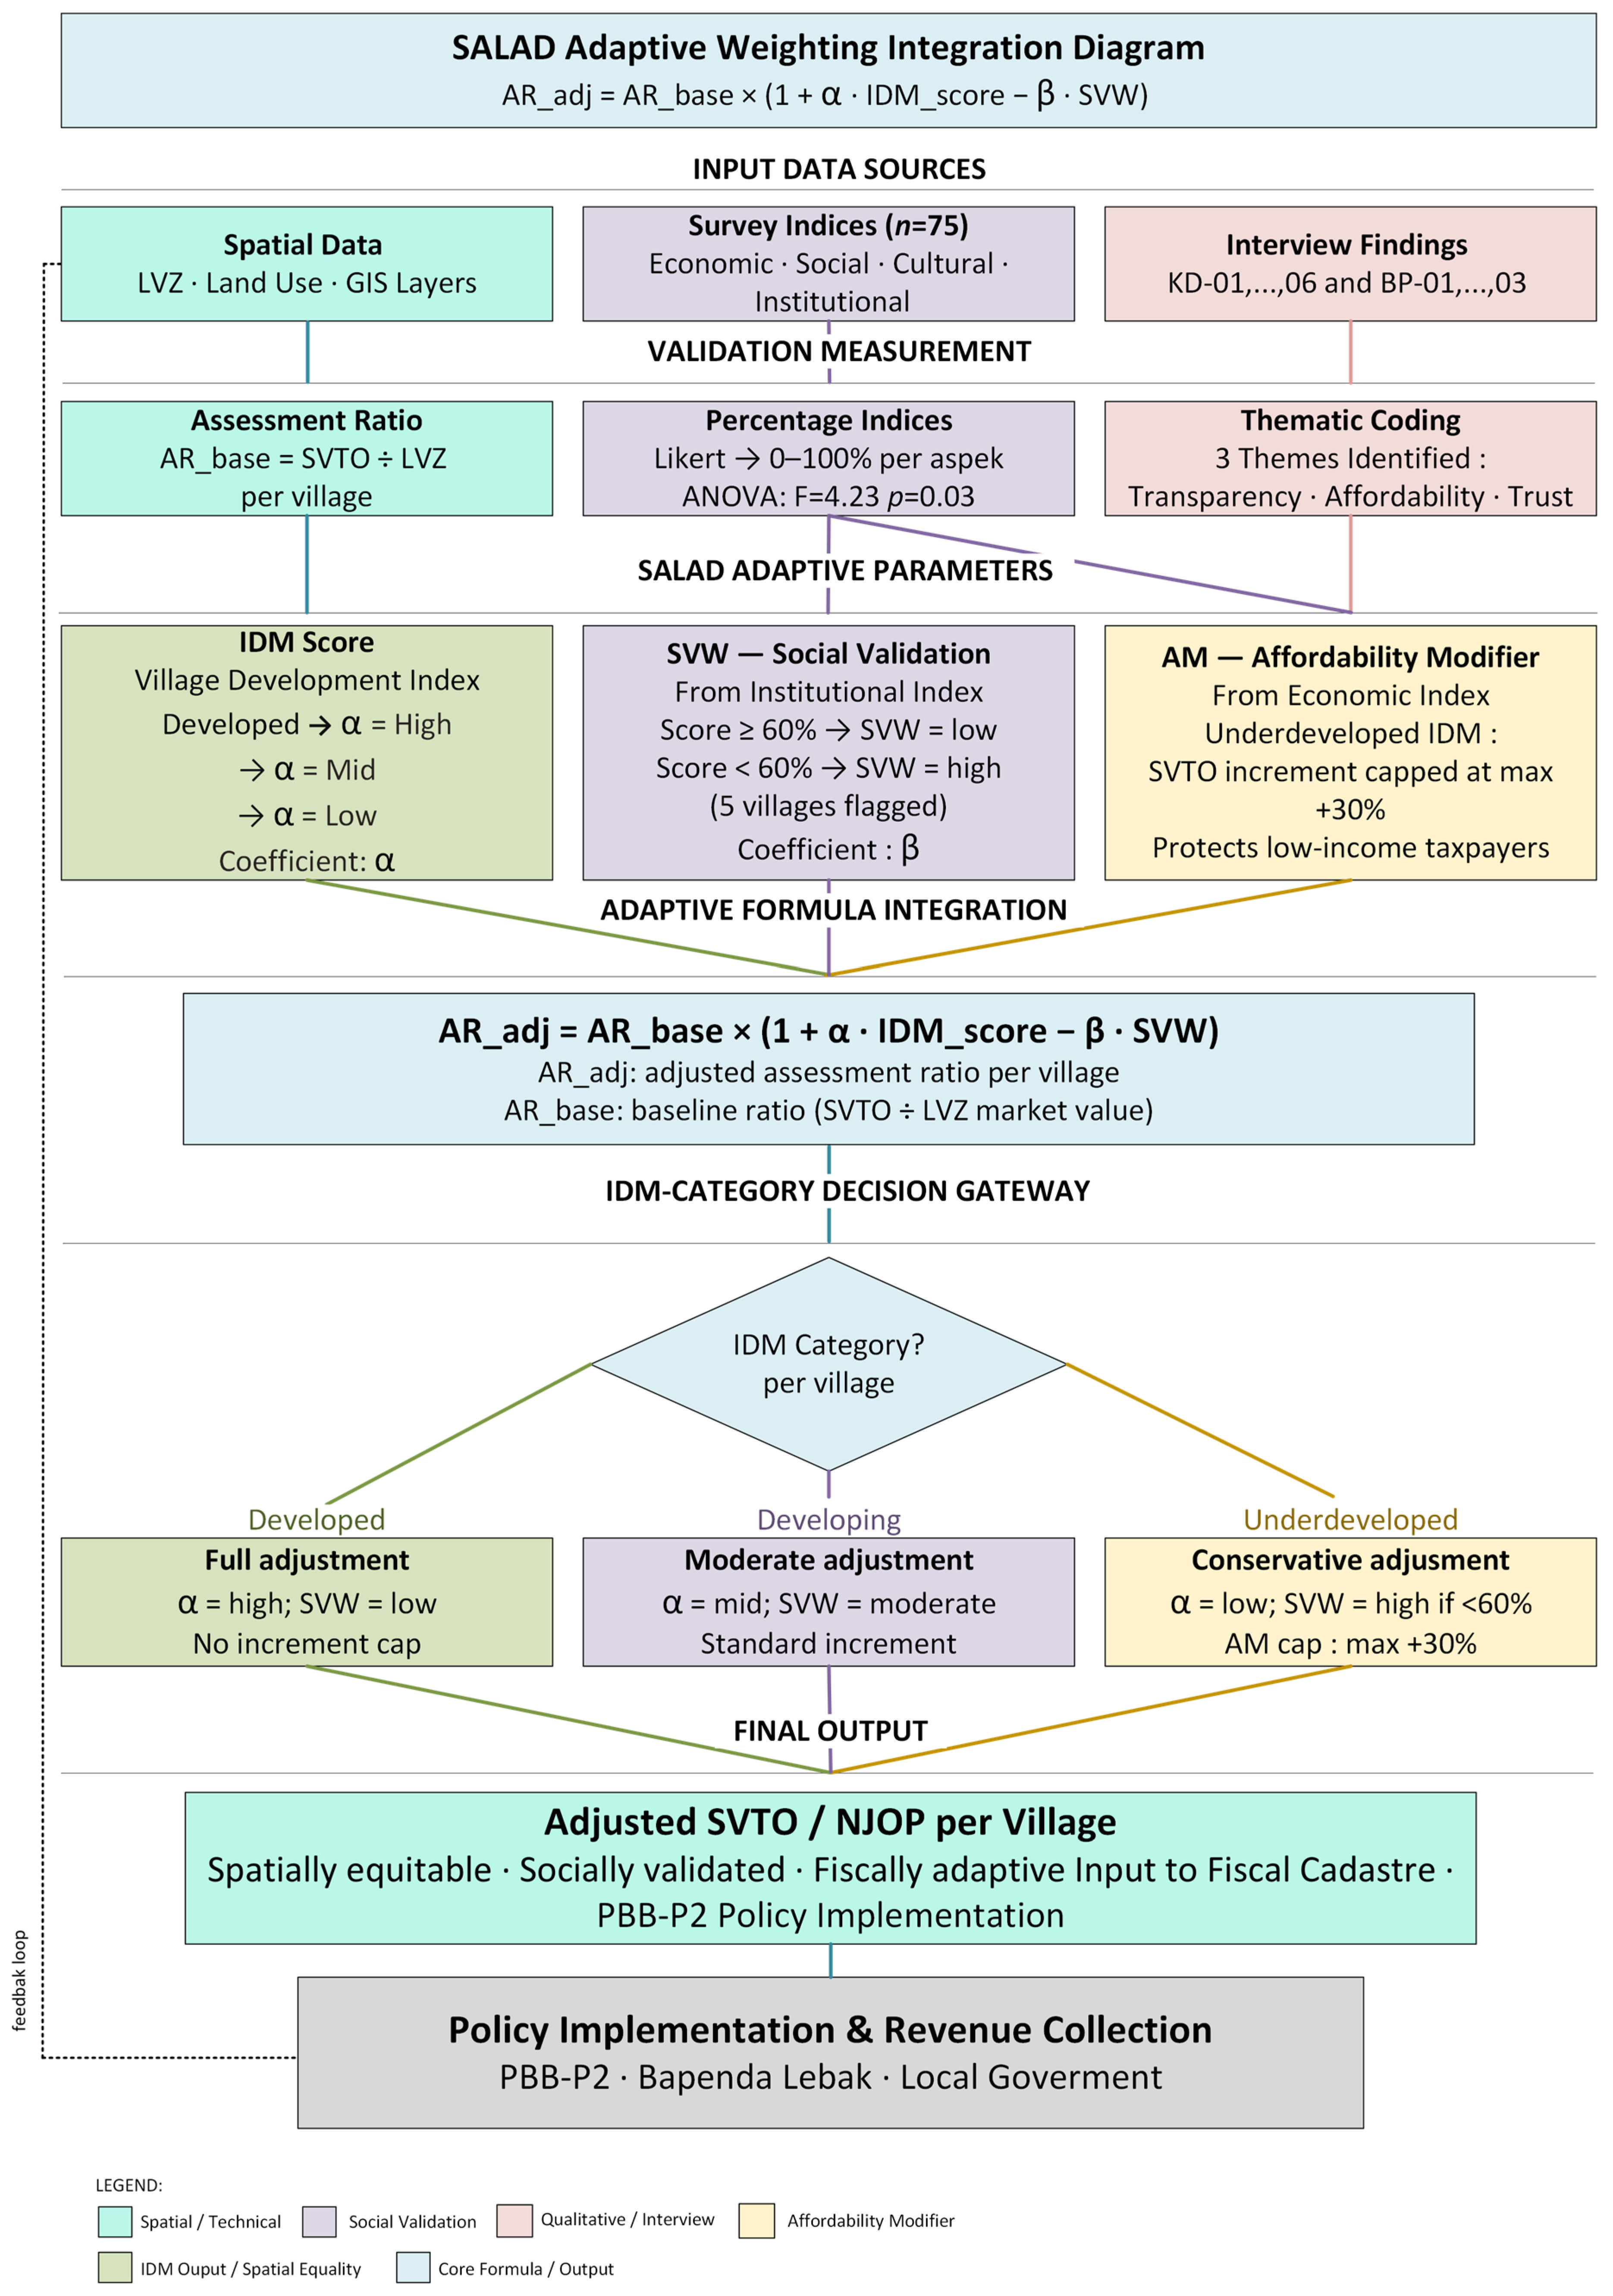
The integration is expressed in Figure 4, SALAD Adaptive Weighting. This operationalization bridges the gap between technical valuation precision and social legitimacy that has been identified as a persistent weakness in the existing mass appraisal literature [13].
Figure 4.
SALAD Adaptive Weighting Diagram.
Figure 4—the SALAD Adaptive Weighting Integration Diagram—is built directly from the content of the annotated manuscript. The diagram is organized into eight functional layers that trace the complete integration pathway:
Layer 1–2 (Input → Measurement): Three data streams feed the model—spatial data (LVZ/GIS), survey indices from 75 respondents across four aspects, and interview findings from 9 informants coded KD-01,…,06 and BP-01,…,03. These produce the baseline Assessment Ratio (AR_base = SVTO ÷ LVZ), percentage indices per aspect (with ANOVA: F = 4.23, p = 0.03 *), and the three thematic codes (Transparency, Affordability, Trust).
Layer 3 (Adaptive Parameters): The three SALAD parameters are shown side by side—the IDM coefficient α (village development weighting), the Social Validation Weight β·SVW (derived from Institutional Index, flags the 5 villages scoring <60%), and the Affordability Modifier (caps SVTO increment at +30% for Underdeveloped IDM villages).
Layer 4 (Formula): All three parameters converge into the core adaptive formula: AR_adj = AR_base × (1 + α · IDM_score − β · SVW).
Layer 5–6 (Decision Gateway): A diamond gateway routes each village to one of three adjustment tracks—Full (Developed), Moderate (Developing), or Conservative (Underdeveloped + AM cap)—each with specific parameter settings.
Layer 7–8 (Output → Feedback): The adjusted SVTO/NJOP is described as spatially equitable, socially validated, and fiscally adaptive, feeding into PBB-P2 policy implementation. A dashed feedback arrow returns implementation experience to the next adjustment cycle.
4. Discussion
This section compares the study’s empirical findings with the existing literature, articulates the original contributions of the SALAD validation framework, and situates the results within the broader geographical and fiscal governance context.
4.1. Economic Dimension: Balancing Revenue Targets and Affordability
The Economic Index results (mean: 80.1%; Strongly Agree range) indicate that the majority of respondents recognize the economic rationale for SVTO/NJOP adjustment when tied to transparent fiscal benefit. The significant variation across IDM categories (Developed: 87.3% vs. Underdeveloped: 71.5%; F = 4.23, p = 0.03) is consistent with Bahl and Martinez-Vazquez [6], who document that property tax acceptance is strongly moderated by taxpayer income levels and perceived fiscal reciprocity. The concern of small-farmer communities (KD-01) regarding affordability echoes Junior and Cesare [8], who found that property tax systems in Brazil disproportionately burden low-income rural landowners when market-value adjustments are applied without income-sensitive calibration.
The SALAD Affordability Modifier (AM) introduced in Section 3.4 directly responds to this finding. By capping SVTO/NJOP increments for ‘Underdeveloped’ IDM villages, SALAD operationalizes vertical equity principles within the adaptive valuation framework—a feature absent from conventional mass appraisal systems, as shown in Table 6.
4.2. Social Dimension: Trust, Participation, and Compliance
The Social Index (mean: 74.4%) reflects moderate-to-high community acceptance contingent on trust-building mechanisms. The finding that ‘Underdeveloped’ villages show a lower social acceptance threshold (68.2%) than ‘Developed’ villages (84.7%) suggests that social capital—measured through institutional trust—mediates the acceptance of fiscal policy changes, consistent with Putnam’s (1995) social capital theory as cited in Pane et al. [33].
The interview evidence (KD-03, KD-05) corroborates Weigel’s [10] experimental finding in the DRC that transparent taxation combined with citizen engagement produces significantly higher compliance. The village head role as a social bridge (KD-05) aligns with the participatory governance literature, which identifies local leaders as critical mediators between state institutions and rural communities in tax reform processes [33].
4.3. Cultural Dimension: Local Values and Adaptive Socialization
The Cultural Index demonstrated the highest variability (SD: 16.9%) and the lowest mean (60.4% among 7 measurable villages). This variability reflects the heterogeneous cultural landscape of Lebak Regency, which includes communities with distinct traditional governance systems (notably the Baduy community in Kanekes, exempt from PBB-P2 [13]). For other villages, cultural values of gotong royong (mutual cooperation) and communal responsibility were identified in interviews as potential facilitators of tax acceptance—consistent with Nawangsih et al. [26] and Harring and Jagers [31], who find that collective social values positively moderate acceptance of new tax instruments.
4.4. Institutional Dimension: Administrative Modernization and the SALAD Integration Pathway
The Institutional Index showed the widest inter-village range (45–97%), reflecting significant variation in the quality of tax administration experienced by different communities. The ANOVA result (F = 3.81, p = 0.04) confirms that IDM category significantly predicts institutional acceptance, with ‘Underdeveloped’ villages (54.3%) falling into the neutral range—indicating ambivalence toward institutional capacity.
The BP-02 interview highlights SPPT (Surat Pemberitahuan Pajak Terutang—Tax Assessment Notice) data quality as a critical barrier. Outdated SPPT records are documented in Kadir and Angelia [11] and Samudra [12] as a systemic challenge in Indonesian PBB-P2 administration. The SALAD Social Validation Weight (SVW) mechanism responds to this by using survey-based institutional trust scores as a proxy for administrative credibility, ensuring that villages with low institutional trust receive more conservative valuation adjustments until administrative quality improves.
From a fiscal geography perspective, the spatial variation in institutional acceptance across IDM categories demonstrates that property tax governance is not merely a technical challenge but a fundamentally spatial–institutional challenge [7]. SALAD’s spatially differentiated adaptive mechanism—which adjusts assessment ratios based on the geographic distribution of institutional capacity and community readiness—represents a significant methodological advance over uniform mass appraisal approaches, directly contributing to the geoinformatics-based fiscal governance paradigm.
5. Conclusions and Policy Implications
5.1. Synthesis of Findings
This exploratory field validation study in Lebak Regency provides preliminary evidence that community acceptance of SVTO/NJOP adjustment—as measured through the SALAD social validation module—is significantly moderated by IDM village development category, particularly for Economic (F = 4.23, p = 0.03) and Institutional (F = 3.81, p = 0.04) acceptance. The SALAD framework’s integration of spatial zoning, IDM-based weighting, and the newly introduced Social Validation Weight (SVW) and Affordability Modifier (AM) parameters create a more equitable and contextually sensitive valuation system compared to conventional mass appraisal. Interview evidence further confirms that transparency, participatory socialization, and visible fiscal reciprocity are prerequisites for community support—findings consistent with the broader fiscal geography and the participatory governance literature [7,10,13].
5.2. Policy Implications
Based on the empirical findings, the following five policy recommendations are offered for Bapenda Lebak and local government:
- Implement Transparency Mechanisms: Provide clear, accessible public communication on SVTO/NJOP adjustment methodology—including the role of LVZ, IDM, and land-use factors—through village-level socialization sessions facilitated by village heads.
- Adopt Progressive SVTO/NJOP Increment Caps: Apply the SALAD Affordability Modifier (AM) by limiting SVTO/NJOP increases to a maximum of 30% above current assessed values for villages in ‘Underdeveloped’ IDM category, regardless of market value gap.
- Institutionalize Community Consultation Protocols: Mandate structured community consultations (using the social validation instrument) prior to each SVTO/NJOP adjustment cycle, with results formally integrated into the Bapenda decision-making process.
- Accelerate Digital Service Expansion: Prioritize SPPT data updating and digital payment integration (mobile banking, marketplace platforms) to address the institutional trust gap identified in villages with an Institutional Index below 60%.
- Invest in Bapenda Capacity Building: Provide technical training on GIS-based valuation, the SALAD model, and community engagement protocols for Bapenda field officers to improve both technical accuracy and social legitimacy of assessments.
5.3. Limitations
This study is subject to the following limitations, which future research should address:
- Sample size and scope: The 75 respondents from 20 villages, while adequate for exploratory purposes, are not statistically representative of all 340 villages in Lebak Regency or other Indonesian regencies. Findings should be treated as contextually specific to northern Lebak Regency.
- Single-regency focus: The study was conducted exclusively in Lebak Regency due to the existing ITB–Bapenda cooperation agreement. Generalizability to other regencies, provinces, or country contexts requires further validation research.
- Cross-sectional design: Data were collected in a single fieldwork period (October–November 2024). Longitudinal assessment of how community acceptance evolves after actual SVTO/NJOP adjustment implementation is not yet possible.
- Potential response bias: As respondents were recruited through Bapenda and village government referrals, there may be some selection bias toward taxpayers more familiar with tax administration processes. Future studies should include random community sampling.
5.4. Future Research Agenda
Future research should: (1) extend the social validation survey to all 340 villages in Lebak Regency using stratified random sampling; (2) apply the SALAD framework to other Indonesian regencies to test generalizability; (3) conduct longitudinal follow-up studies tracking compliance rates 12–24 months after SALAD-based NJOP adjustments are implemented; and (4) explore household-level dynamics including tax affordability relative to household income, building on the research agenda identified in Hernandi et al. (2025) [13].
Author Contributions
Conceptualization, A.H. and I.M.; Methodology, A.H., I.M. and D.S.; Software, A.Y.S., D.S. and R.W.; Validation, A.H.; Formal analysis, A.Y.S., D.S. and R.A.; Investigation, R.A.; Resources, A.P.H.; Data curation, A.P.H., S.L.N. and N.S.E.P.; Writing—original draft, P.M. and F.N.C.; Writing—review & editing, P.M., F.N.C. and S.L.N.; Visualization, N.S.E.P. and R.W.; Project administration, S.L.N.; Funding acquisition, S.L.N. All authors have read and agreed to the published version of the manuscript.
Funding
This research was funded by the PPMI FITB Program of the Faculty of Earth Sciences and Technology, Bandung Institute of Technology, under Research Scheme No. FITB.PPMI-1-29-2025 (IDR 50,000,000), and by the 2025 Bandung Institute of Technology Community Service Program under Grant No. DPMK.PM-8-08-2025 (IDR 100,000,000).
Institutional Review Board Statement
Not applicable.
Informed Consent Statement
Not applicable.
Data Availability Statement
The original contributions presented in this study are included in the article. Further inquiries can be directed to the corresponding author.
Acknowledgments
During the preparation of this manuscript, the authors used generative AI tools, including ChatGPT-4.0 to support the development of writing structures and paper outlines, Grammarly Pro to improve English grammar and sentence structure, and NotebookLM (web-based version, Google LLC) to assist in generating the Graphical Abstract. The authors have reviewed and edited all outputs and take full responsibility for the content of this publication.
Conflicts of Interest
The authors declare no conflict of interest.
Appendix A. Survey Instrument Structure
The survey instrument comprised 12 statements corresponding to the 12 key factors grouped into four aspects. Respondents indicated their level of agreement using a 5-point Likert scale: 1 = Strongly Disagree, 2 = Disagree, 3 = Neutral, 4 = Agree, 5 = Strongly Agree. Questionnaires were distributed face-to-face by trained enumerators (Bapenda field officers and village government staff) during October–November 2024.
Table A1.
Survey Instrument Items for SALAD Social Validation.
References
- Idowu, A.M.; Kamarudin, N.; Achu, K.; Solomon, I.A. A Review of Valuation Impact on Property Tax. Sains Humanika 2016, 8, 17–23. [Google Scholar] [CrossRef] [Scilit]
- Morgan, J.; Shahab, S. Impact of Land Value Tax on the Equity of Planning Outcomes. Land 2023, 12, 1152. [Google Scholar] [CrossRef] [Scilit]
- Che, S.; Kumar, R.R.; Stauvermann, P.J. Taxation of Land and Economic Growth. Economies 2021, 9, 61. [Google Scholar] [CrossRef] [Scilit]
- Hughes, C.; Sayce, S.; Shepherd, E.; Wyatt, P. Implementing a Land Value Tax: Considerations on Moving from Theory to Practice. Land Use Policy 2020, 94, 104494. [Google Scholar] [CrossRef] [Scilit]
- Kang, S.H.; Kim, B.J. Designing a Valuation System for Property Tax: The Case of Zanzibar, Tanzania. Land 2020, 11, 989. [Google Scholar] [CrossRef] [Scilit]
- Bahl, R.; Martinez-Vazquez, J. The Property Tax in Developing Countries: Current Practice and Prospects; Land Lines, Lincoln Institute of Land Policy: Cambridge, MA, USA, 2007. [Google Scholar]
- Berrisford, S.; Cirolia, L.R.; Palmer, I. Land-based Financing in Sub-Saharan African Cities. Environ. Urban. 2018, 30, 35–52. [Google Scholar] [CrossRef] [Scilit]
- Junior, P.H.B.C.; Cesare, C. Who Pays the Property Tax? Evidence from Brazil. Land Use Policy 2022, 120, 106235. [Google Scholar] [CrossRef] [Scilit]
- Franzsen, R. Should Market Value Be Retained as the Only Tax Base for Municipal Property Rates in South Africa? Potchefstroom Electron. Law J. 2022, 25, 1–28. [Google Scholar] [CrossRef] [Scilit]
- Weigel, J.L. The Participation Dividend of Taxation: How Citizens in Congo Engage More with the State When It Tries to Tax Them. Q. J. Econ. 2020, 135, 1849–1903. [Google Scholar] [CrossRef] [Scilit]
- Kadir, A.; Angelia, N. The Establishment Policy Model of Sale Value of Land Tax Objects and Rural and Urban Sector Buildings (NJOP PBB P2) in Medan. Bp. Int. Res. Crit. Inst. J. 2020, 3, 2421–2433. Available online: https://bircu-journal.com/index.php/birci/article/download/1216/pdf (accessed on 20 February 2026).
- Samudra, A.A. Property Tax in Indonesia: A Proposal for Increasing Land and Building Tax Revenue Using the System Dynamics Simulation Method. J. Tax Reform 2024, 10, 100–121. [Google Scholar] [CrossRef] [Scilit]
- Hernandi, A.; Meilano, I.; Saptari, A.Y.; Suwardhi, D.; Abdulharis, R.; Handayani, A.P.; Nurmaulia, S.L.; Putri, N.S.E.; Widyastuti, R.; Merdekawati, P.; et al. Fair Taxes, Better Revenue: A Case Study on Spatial Approaches to Land Taxation in Lebak Regency, Indonesia. Land 2025, 14, 125. [Google Scholar] [CrossRef] [Scilit]
- Wahyudi, A.; Nazri, M. Strategi Partisipasi Masyarakat dalam Proses Kebijakan di Dalam Proses Pemerintahan. J. Adm. Publik 2020, 8, 45–58. [Google Scholar]
- Rohmah, A.Z.; Qosim; Sulistyowati, R. Evaluasi Prosedur Verifikasi dan Validasi Objek Pajak PBB-P2 untuk Meningkatkan Kualitas Pelayanan Pajak. Media Komun. Ilmu Ekon. 2024, 41, 50–61. [Google Scholar] [CrossRef] [Scilit]
- Fetters, M.D.; Curry, L.A.; Creswell, J.W. Achieving Integration in Mixed Methods Designs—Principles and Practices. Health Serv. Res. 2013, 48, 2134–2156. [Google Scholar] [CrossRef] [Scilit]
- Kaur, M. Application of Mixed Method Approach in Public Health Research. Indian J. Community Med. 2016, 41, 93. [Google Scholar] [CrossRef] [Scilit] [PubMed]
- Sharma, D.L.R.; Bidari, S.; Bidari, D.; Neupane, S.; Sapkota, R. Exploring the Mixed Methods Research Design: Types, Purposes, Strengths, Challenges, and Criticisms. Glob. Acad. J. Linguist. Lit. 2023, 5, 3–12. [Google Scholar] [CrossRef] [Scilit]
- Ponto, J. Understanding and Evaluating Survey Research. J. Adv. Pract. Oncol. 2015, 6, 168. [Google Scholar] [CrossRef] [Scilit] [PubMed]
- Guion, L.A.; Diehl, D.C.; McDonald, D. Triangulation: Establishing the Validity of Qualitative Studies: FCS6014 FY394, Rev. 8 2011. EDIS 2011, 8, 3. [Google Scholar] [CrossRef] [Scilit]
- Nurtanzila, L.; Kumorotomo, W. Faktor-Faktor Yang Memengaruhi Penerimaan PBB P2 di Kota Yogyakarta Pasca Pelimpahan Kewenangan. J. Kebijak. Adm. Publik 2015, 19, 157–169. Available online: http://journal.ugm.ac.id/jkap (accessed on 18 March 2025).
- Darnita, C.D.; Mangoting, Y. Faktor – Faktor Yang Mempengaruhi Efektifitas Pemungutan Pajak Bumi Dan Bangunan Perkotaan Dan Pedesaan Kota Palangka Raya. Petra Christ. Univ. Tax Account. Rev. 2014, 4, 157713. Available online: https://media.neliti.com/media/publications/157713-ID-faktor-faktor-yang-mempengaruhi-efektifi.pdf (accessed on 17 September 2025).
- Setiawan, B.; Rachmad, M.; Delis, A. Analisis Penerimaan Pajak Bumi dan Bangunan-P2 serta Pengaruhnya terhadap Pendapatan Daerah Kabupaten/Kota di Provinsi Jambi. J. Paradig. Ekon. 2020, 15, 415–430. [Google Scholar] [CrossRef] [Scilit]
- Asriati; Huda, S.N. Analisis Faktor-Faktor yang Mempengaruhi Penerimaan PBB-P2. J. Ekon. Balance Fak. Ekon. Dan Bisnis 2016, 12, 1–15. [Google Scholar]
- Dwijayanti, A.; Sueb, M.; Pratama, A. Pengaruh Religiusitas dan Keadilan Pajak pada Sikap Kepatuhan Wajib Pajak. J. Akunt. Dan Pajak 2021, 22, 136. [Google Scholar] [CrossRef] [Scilit]
- Nawangsih, A.; Furqon, I.K.; Ningtyas, J.D.A. Pengaruh Faktor Sosial dan Budaya terhadap Kepatuhan Pajak di Negara-Negara Berkembang: Analisis Kualitatif dalam Konteks Globalisasi. J. Sahmiyya 2024, 3, 84–90. [Google Scholar]
- Tavakol, M.; Dennick, R. Making Sense of Cronbach’s Alpha. Int. J. Med. Educ. 2011, 2, 53–55. [Google Scholar] [CrossRef] [Scilit]
- Noble, H.; Heale, R. Triangulation in Research, with Examples. Evid. Based Nurs. 2019, 22, 67–68. [Google Scholar] [CrossRef] [Scilit] [PubMed]
- Bachri, B.S. Meyakinkan Validitas Data melalui Triangulasi pada Penelitian Kualitatif. Teknol. Pendidik. 2010, 10, 46–62. [Google Scholar]
- Heale, R.; Forbes, D. Understanding Triangulation in Research. Evid. Based Nurs. 2013, 16, 98. [Google Scholar] [CrossRef] [Scilit] [PubMed]
- Harring, N.; Jagers, S.C. Should We Trust in Values? Explaining Public Support for Pro-Environmental Taxes. Sustainability 2013, 5, 210–227. [Google Scholar] [CrossRef] [Scilit]
- Listiana, E.; Khumayah, S.; Wulandari, S. Partisipasi Masyarakat dalam Membayar Pajak Bumi dan Bangunan Perdesaan dan Perkotaan (PBB-P2) di Kabupaten Brebes. COMSERVA J. Penelit. Dan Pengabdi. Masy. 2025, 4, 5698–5708. [Google Scholar] [CrossRef] [Scilit]
- Pane, M.S.; Revida, E.; Nasution, M.A. Community Participation in the Payment of Rural and Urban Land and Building Tax (PBB-P2) in Medan City. Mukadimah J. Pendidik. Sej. Dan Ilmu-Ilmu Sos. 2025, 9, 634–647. [Google Scholar] [CrossRef] [Scilit]

Disclaimer/Publisher’s Note: The statements, opinions and data contained in all publications are solely those of the individual author(s) and contributor(s) and not of MDPI and/or the editor(s). MDPI and/or the editor(s) disclaim responsibility for any injury to people or property resulting from any ideas, methods, instructions or products referred to in the content. |
© 2026 by the authors. Licensee MDPI, Basel, Switzerland. This article is an open access article distributed under the terms and conditions of the Creative Commons Attribution (CC BY) license.