


Abstract
Global gridded population datasets are widely used in urban analysis, risk assessment, and sustainability monitoring, including the calculation of indicators for the Sustainable Development Goals (SDGs). Despite their broad use, their behaviour at local scales in shrinking cities remains insufficiently understood. This study evaluates three global population datasets—WorldPop, GHS-POP, and GPWv4—in seven Croatian city cores using official census data as reference. Croatia represents a relevant case due to long-term population decline combined with relatively stable built-up extents. Population estimates were compared at the city-core level for the period 2001–2021, and spatial differences between datasets were examined using pixel-level residuals, built-up intensity metrics, and land-cover stratification. The results show that WorldPop and GHS-POP achieve similar accuracy in city-total estimates, with relative errors generally ranging between about 2% and 10%, but differ systematically in their spatial allocation of population. GHS-POP concentrates population within built-up areas, while WorldPop redistributes a substantial share into non-built-up land-cover classes, exceeding GHS-POP by approximately 290,000 inhabitants outside built-up areas, whereas GHS-POP concentrates over one million additional inhabitants within built-up zones. GPWv4 often shows the smallest city-level errors but produces spatially uniform population surfaces that limit its suitability for intra-urban analysis. The findings highlight that model choice can strongly influence spatial indicators used in SDG-related and sustainability assessments, highlighting the need for context-specific evaluation of global population datasets in shrinking urban environments.
1. Introduction
Accurate and spatially detailed population data are essential for urban planning, risk assessment, service provision, and policy development. They are also critical for measuring progress toward global goals such as the Sustainable Development Goals (SDGs) [1] and climate adaptation strategies in urban areas [2,3]. In recent decades, global population datasets such as WorldPop, Gridded Population of the World Version 4 (GPWv4), and Global Human Settlement - Population (GHS-POP) have provided open, high-resolution data that enable cross-country comparisons and large-scale spatial analyses [4,5,6]. These datasets model population distribution based on census inputs and auxiliary variables, including built-up data, land use, and night-time lights. While their availability has supported many applications, their reliability at local scales—especially in smaller and transitional European cities—remains insufficiently tested [7].
In Central and Eastern Europe, countries have been experiencing strong demographic shifts since the 1990s. Croatia is no exception. It has undergone a significant population decline due to emigration, aging, and low birth rates, combined with spatial processes like suburbanization and internal migration [8,9,10]. The 2021 national census revealed that Croatia has lost nearly 10% of its population since 2011 [11], with urban cores shrinking while suburban zones have expanded. This has created spatial patterns that are difficult to capture using top-down global models. Although some studies have assessed the accuracy of population datasets globally [12,13], few have focused on cities undergoing long-term structural and demographic transitions, with complex urban morphologies and changing administrative boundaries.
Despite the increasing amount of literature on gridded population data accuracy, most validation efforts focus either on rapidly growing cities, informal settlements, or national-scale aggregates. Urban contexts characterised by long-term population decline, particularly in Europe, remain largely underexplored. As a result, the behaviour of widely used global population models in shrinking cities is still insufficiently understood.
This gap is especially relevant given the increasing use of gridded population datasets as denominators in Sustainable Development Goal indicators, including those related to SDG 11 [14,15]. In such applications, population grids are often treated as neutral spatial inputs, while their potential systematic bias in contexts of demographic decline is rarely examined.
This study addresses this gap by explicitly evaluating global population datasets in cities experiencing sustained demographic decline. Using Croatian cities as a representative urban context, the analysis demonstrates that discrepancies in population models are not random, but systematically linked to built-up structure and modelling assumptions. In this sense, the case of Croatia is not treated as an isolated example, but as indicative of patterns that may occur in shrinking cities with comparable demographic and urban characteristics, particularly in Central and Eastern Europe.
This study aims to evaluate the performance of three global population datasets— WorldPop, GPWv4, and GHS-POP—across seven Croatian cities using official census data as a reference. Beyond quantifying city-level errors, the analysis demonstrates that discrepancies between global population models are systematically linked to built-up structure and modelling assumptions, rather than to observed demographic dynamics in shrinking cities.
Unlike most previous studies, this paper combines temporal population trends, intra-urban spatial residuals, and built-up intensity metrics within a unified analytical framework. This study addresses the following research question: How do global gridded population datasets differ in their spatial allocation of population within shrinking cities, and how are these differences related to built-up structure and land cover?
The existing literature has primarily evaluated global population models by comparing them to national census totals or broad administrative units, often overlooking spatial discrepancies, land use variation, and built-up intensity [5,16]. Several recent studies have also focused on the production and harmonization of large-scale gridded population datasets derived from official statistics. For example, McKeen et al. [17] describe the generation of high-resolution (approximately 100 m) gridded population datasets for 40 countries in Latin America and the Caribbean using a top-down disaggregation approach based on official census data and ancillary geospatial layers. Such datasets provide consistent spatial population estimates but remain modelled products whose accuracy may vary across geographic contexts.
More recent research has further expanded the methodological landscape of population modelling by incorporating Earth observation data and machine learning approaches. For example, Georganos et al. [18] demonstrated the potential of combining multisource satellite imagery with deep learning architectures to produce detailed intra-urban population maps, particularly in data-scarce environments. Their work illustrates how remotely sensed information can capture complex spatial relationships between urban morphology and population density, enabling the production of high-resolution population distribution maps even where detailed census data are limited. Similarly, Metzger et al. [19] introduced a population mapping framework that relies solely on open-access Sentinel-1 and Sentinel-2 imagery together with aggregated census counts, illustrating how modern machine learning techniques can generate accurate population estimates without reliance on proprietary datasets or extensive ancillary data. Beyond methodological advances, the broader role of spatial modelling in supporting demographic estimation has also been emphasized in demographic research. For instance, Darin et al. [20] discuss how satellite imagery and spatial modelling techniques can complement traditional census approaches, particularly in contexts where census coverage is incomplete or outdated. Their work highlights the growing importance of gridded population datasets for supporting policy planning, humanitarian operations, and spatial demographic analysis.
These insights collectively underscore the importance of geographically specific evaluations—especially in smaller and less-represented European contexts. In Croatia, local validation efforts remain scarce. Although some demographic studies exist at the national level [9,10,21], they generally lack spatial detail. National policy documents do acknowledge the demographic decline and its spatial heterogeneity [8], but correlation with open geospatial datasets is still underutilized in policy and academic research. This highlights the need for more spatially disaggregated analyses that examine how global models align—or diverge—from observed patterns on the ground in diverse urban environments.
Recent studies have highlighted the variability in performance of population models across different geographies and urban conditions. Thomson et al. [13] showed that population datasets tend to underestimate density in informal settlements, particularly in African cities, due to missing or outdated ancillary data. Similarly, Yin et al. [12] examined model differences in Southeast Asia, finding systematic over- or underestimation depending on the degree of urbanization and quality of built-up inputs. Zhang et al. [7] demonstrated how the choice of population model significantly impacts the calculation of urbanization metrics, even within the same region. This issue is especially relevant for urban planning and policy monitoring.
This study therefore considers three working hypotheses: (1) Global population datasets produce similar city-level totals but differ substantially in their spatial allocation, (2) Built-up structure influences how population is distributed within urban areas, (3) Differences between datasets are primarily linked to modelling assumptions rather than to observed demographic change.
2. Data and Study Area
The study focuses on seven main Croatian cities which represent a range of urban sizes and geographic locations, providing a comprehensive overview of urban and demographic dynamics in Croatia.
2.1. Study Area
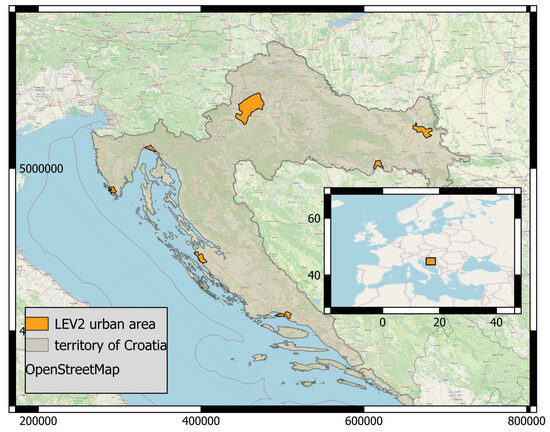
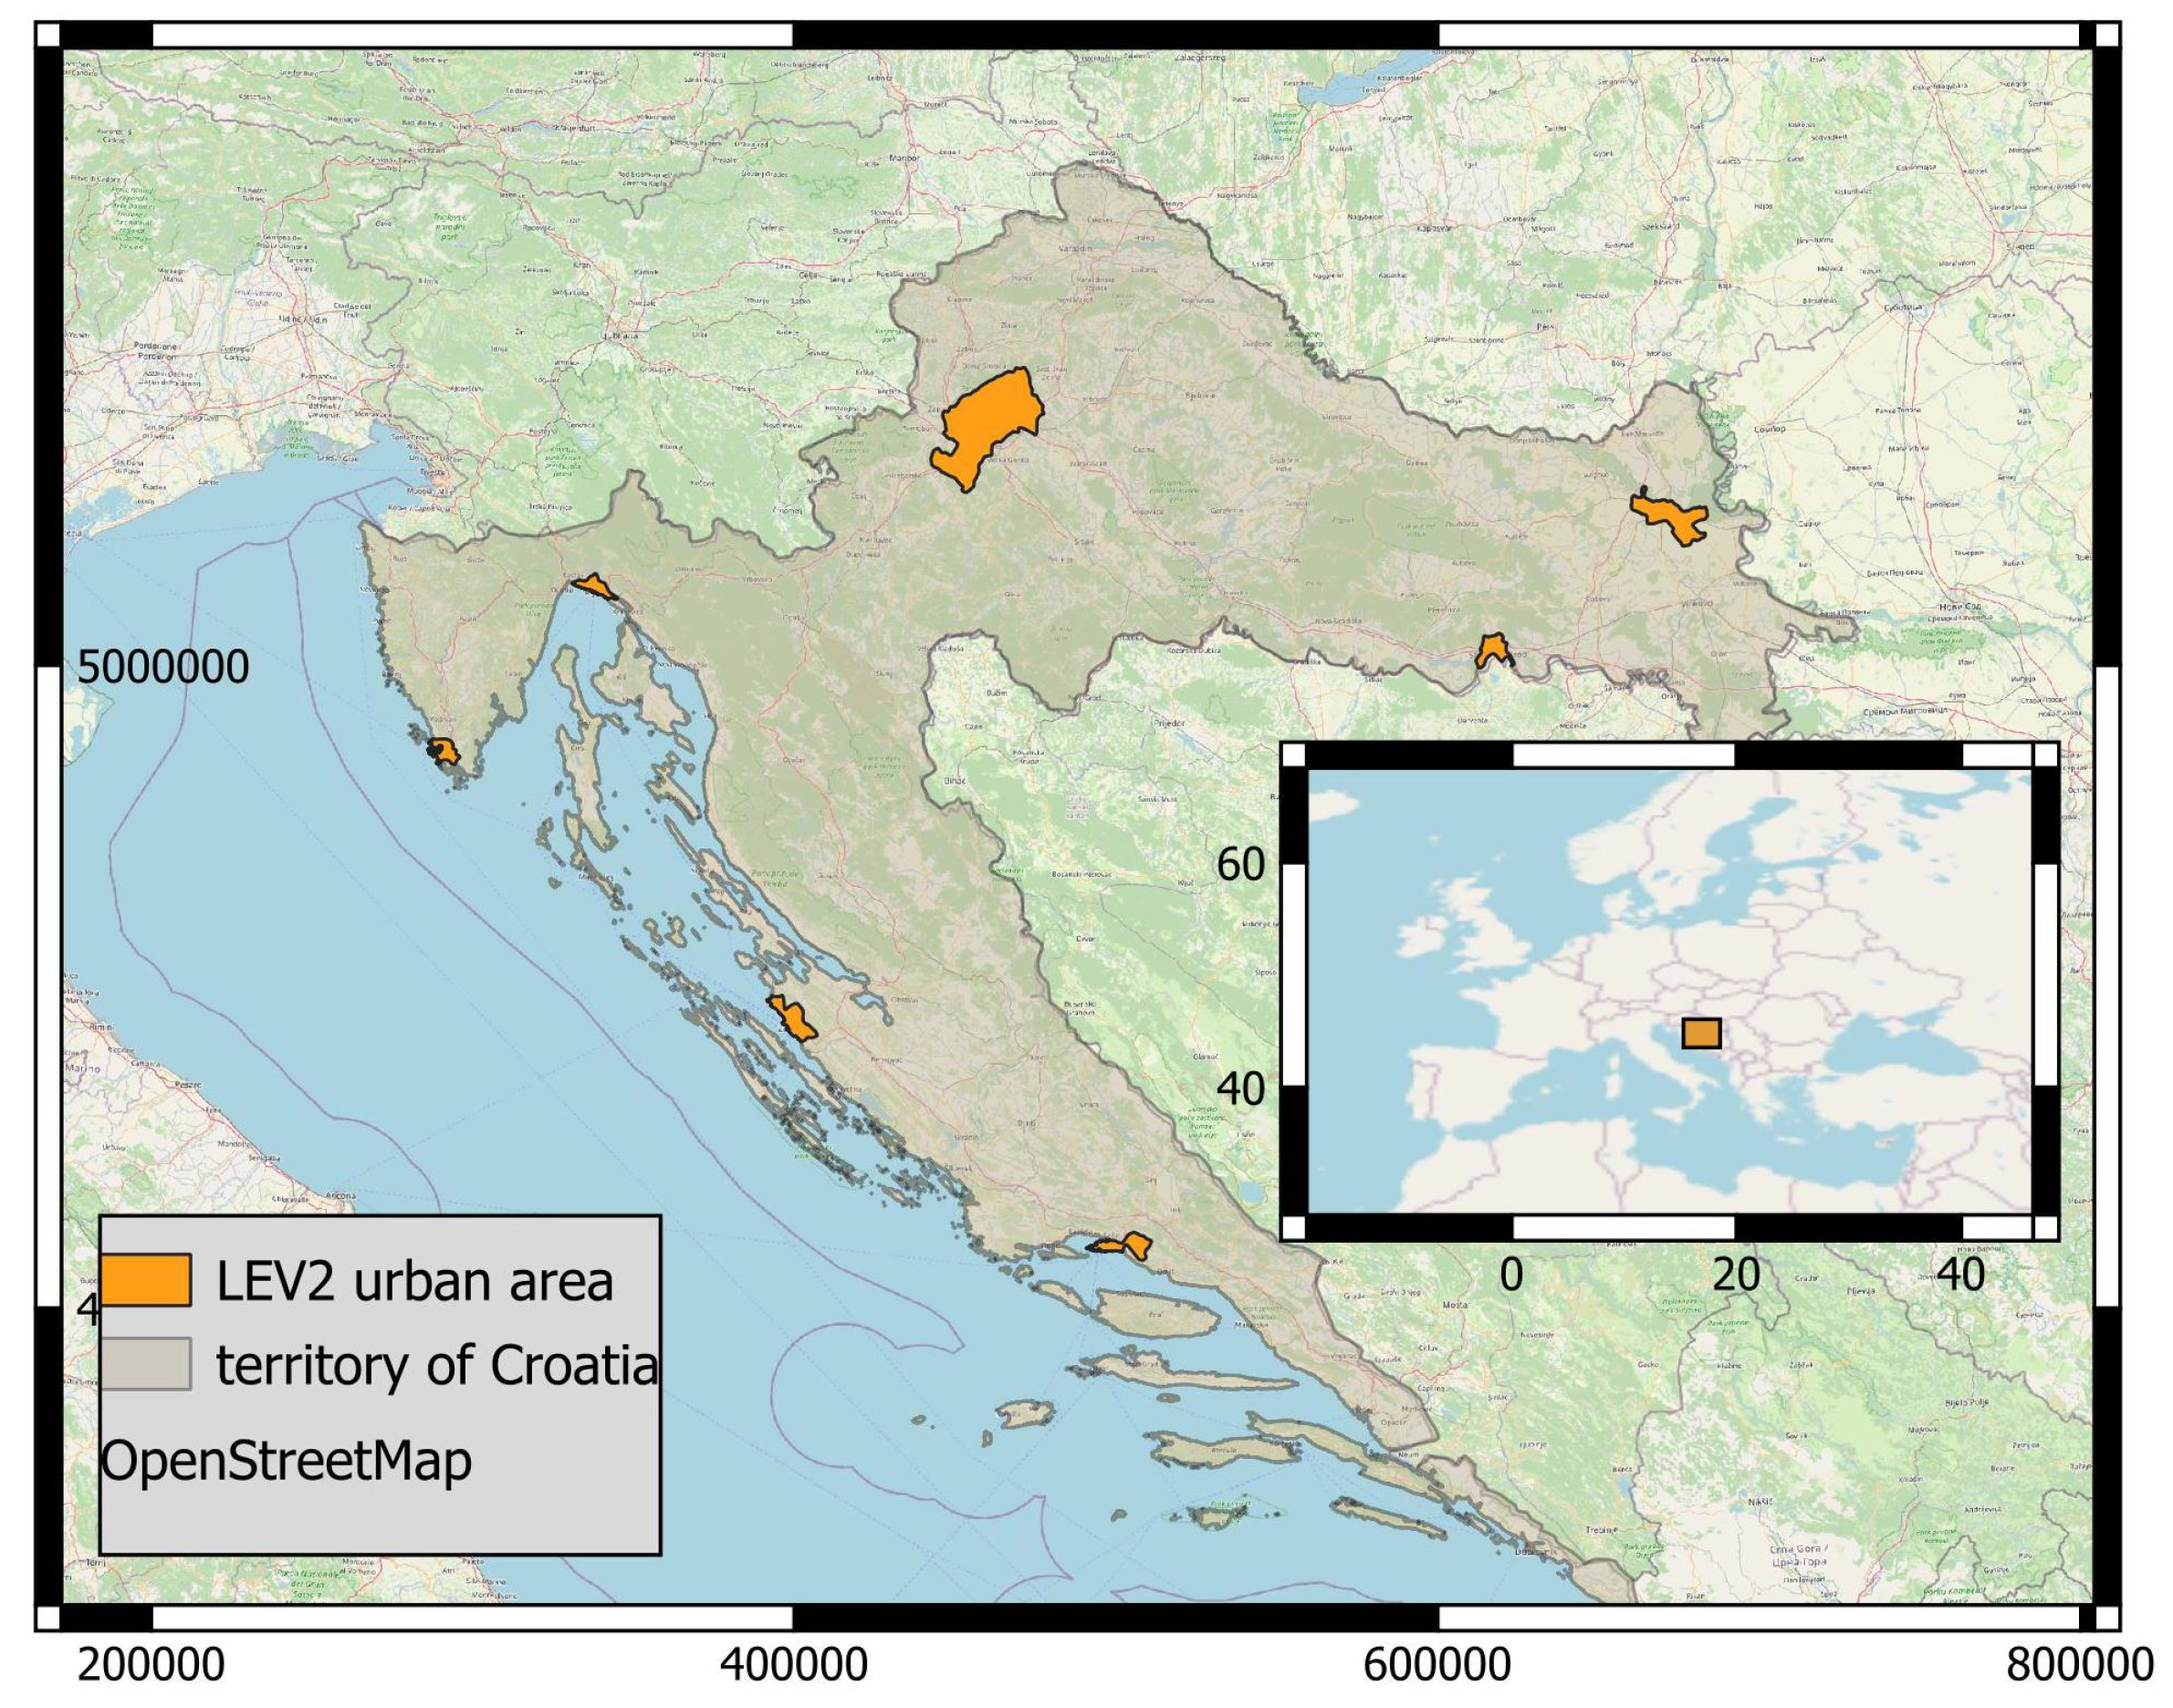
The analysis focuses on the seven major urban areas in Croatia: Zagreb, Split, Rijeka, Osijek, Zadar, Pula, and Slavonski Brod. These cities represent the primary urban centers across different parts of the country—Zagreb as the capital in the northwest; Split, Zadar, and Pula along the coast; Rijeka in the northern Adriatic; and Osijek and Slavonski Brod in the inland east. They provide a mix of urban forms: from Zagreb’s dense core and sprawling suburbs to smaller cities with compact centers and surrounding rural areas. Each city was analyzed using its delineated Level 2 administrative boundary [22], representing the core urban extent rather than the broader metropolitan area ensuring consistency with census geography. These boundaries better reflect the dense, populated zones that are most relevant to gridded population model validation, as seen in Figure 1.
Figure 1.
The seven selected Croatian cities included in the analysis, delineated by their Level 2 (core city) boundaries.
The combined population of these cities was about 1.4 million in 2011, declining to roughly 1.3 million by 2021 according to census results [11,21].
2.2. Data
Multiple datasets covering population, land cover, and built-up environment, as well as official census counts, were used as follows:
WorldPop (Unconstrained): Gridded population counts at ∼100 m resolution for each year 2001–2020. The “unconstrained” WorldPop dataset, which provides an estimated number of people per cell, produced via a random-forest dasymetric redistribution of census data using covariates like land cover, night-time lights, and infrastructure [6] was used in this study. WorldPop offers annual time steps, allowing us to observe population trends over two decades. Data were downloaded for Croatia’s extent (for each year) from the WorldPop project repository. The unconstrained WorldPop product was selected because it is widely used in comparative evaluations of global population datasets and allows the analysis of model behaviour across different land-cover contexts.
Gridded Population of the World, Version 4 (GPWv4): Population counts at ∼1 km (30 arc-second) resolution for five-year intervals between 2000 and 2020. GPWv4 is produced by the Center for International Earth Science Information Network (CIESIN) and interpolates census counts into grid cells based on area-weighting within administrative units [23]. It does not use ancillary data, and thus provides a baseline assuming uniform population distribution.
Global Human Settlement–Population (GHS-POP): Gridded population data at 100 m resolution for five-year intervals between 2000 and 2020. The GHS-POP dataset (R2022 release) is produced by the European Commission’s Joint Research Centre. It disaggregates population counts using built-up presence from GHSL and other sources [24].
GHSL Built-up Surface (2018): A 10 m resolution raster indicating the extent of built-up areas, derived from Sentinel-2 imagery. The Global Human Settlement Layer built-up surface dataset (GHS-BUILT-S) to quantify the built-up footprint per city [25] was used in this study. By summing pixel values, total built-up area was calculated and used to examine a correlation between built-up density and population model errors.
ESA WorldCover Land Use/Land Cover (2020): A global land cover map at 10 m resolution for the year 2020, produced by the European Space Agency [26]. Each pixel is classified into land use categories (e.g., built-up, cropland, forest). It is used in this study to characterize urban land use within and around cities and to evaluate population model performance across LULC types.
Croatian Census Data (2001–2021): Official population counts from the three most recent decennial census rounds were obtained from the Croatian Bureau of Statistics (DZS) [11,21,27]. These are used as ground truth for evaluating population model performance across the selected Croatian cities.
3. Methodology
To assess the reliability and spatial behaviour of global population models in the Croatian urban context, three widely used gridded datasets—WorldPop, GHS-POP, and GPWv4—against official census data for the years 2001, 2011, and 2021, corresponding to the most recent census rounds conducted in Croatia, were systematically compared. Annual population change in the analysed cities is relatively small compared to the spatial uncertainty of global population models. Based on census totals between 2011 and 2021, the average annual population change ranges between approximately 0.4% and 1% across the studied cities. Therefore, the one-year difference between the 2020 population grids and the 2021 census reference can be considered negligible for the purposes of spatial error assessment. This assumption is considered reasonable in shrinking urban contexts like in this study, where demographic decline typically occurs gradually over longer periods rather than through abrupt spatial redistribution.
Official census population data were collected for seven major Croatian cities and used as the reference datasets. Census values were extracted for Level 2 city-core administrative boundaries to ensure spatial consistency with subsequent analyses. These data were used to describe long-term demographic trends and to provide a benchmark for evaluating global gridded population datasets.
Population estimates from three global datasets, WorldPop, GHS-POP, and GPWv4, were obtained for the same city-core boundaries. Raster datasets were spatially harmonised and aggregated by summing pixel values within each city core to derive city-level population totals. Temporal population trajectories from the global datasets were compared with census trends to assess consistency in both absolute population levels and the direction and magnitude of change over time. To enable consistent pixel-wise comparisons, the GPWv4 population grid (1 km resolution) was resampled to a 100 m grid to match the spatial resolution of WorldPop and GHS-POP.
All analyses and computations were performed using the Google Earth Engine web platform, which provides open and free access to large-scale geospatial datasets and cloud-based processing. The analytical workflow was implemented in the Google Earth Engine web-based Code Editor environment, and all scripts used in the analysis are made available at the end of the paper. Basic visualisations and time-series plots were generated in Google Earth Engine, while more advanced cartographic visualisations were produced using QGIS, an open-source and freely available GIS software.
To examine spatial differences in population allocation independent of census timing, a pixel-wise comparison between datasets was conducted for a common reference year, 2020. Pairwise residuals between datasets were calculated at pixel level within city-core boundaries and analysed to identify systematic spatial patterns related to model design and urban structure.
Built-up characteristics of city cores were derived from the GHSL Built-up Surface dataset. Built-up surface area and built-up share were calculated for each city core and used as indicators of urban form. The relationship between built-up intensity and population model performance was analysed by relating built-up share to relative population errors at the city-core level, using Census 2021 data as the reference for 2020 model outputs. For validation, a 2021 census counts was used as the reference for gridded population datasets nominally representing the year 2020. This choice reflects the availability of the most recent official census and the fact that population change between 2020 and 2021 in Croatian shrinking cities is relatively modest compared to longer-term decline. Because this analysis focuses on relative differences between datasets rather than precise estimation of annual demographic change, this one-year temporal mismatch is not expected to materially affect the main conclusions.
City-level population errors were quantified as absolute relative differences between modelled population totals and census values. This assessment provided a basis for distinguishing between discrepancies caused by total population mismatches and those resulting from internal spatial redistribution.
To investigate how population is allocated across urban and non-urban space, population totals were aggregated separately within built-up and non-built-up areas using land-cover masks derived from European Space Agency (ESA) WorldCover and GHSL datasets. Differences between WorldPop and GHS-POP were analysed to identify contrasting allocation strategies.
Furthermore, pixel-level differences between WorldPop and GHS-POP were analysed by aggregated land-cover groups. Land-cover classes were grouped into built-up, green areas, cropland, and other categories. Mean population differences were calculated for each group and weighted by spatial extent to assess how inter-model differences vary across major functional components of the urban landscape.
4. Results
To establish a baseline for evaluating global population models, official census figures for the seven largest Croatian cities over the past two decades were first examined, given in Table 1. The values represent total population within each city’s Level 2 administrative boundaries and serve as a reference for subsequent comparison with gridded population models.
Table 1.
Official census population totals for seven Croatian cities and the national total for the years 2001, 2011, and 2021. Source: Croatian Bureau of Statistics.
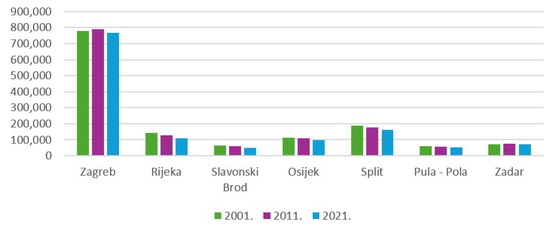
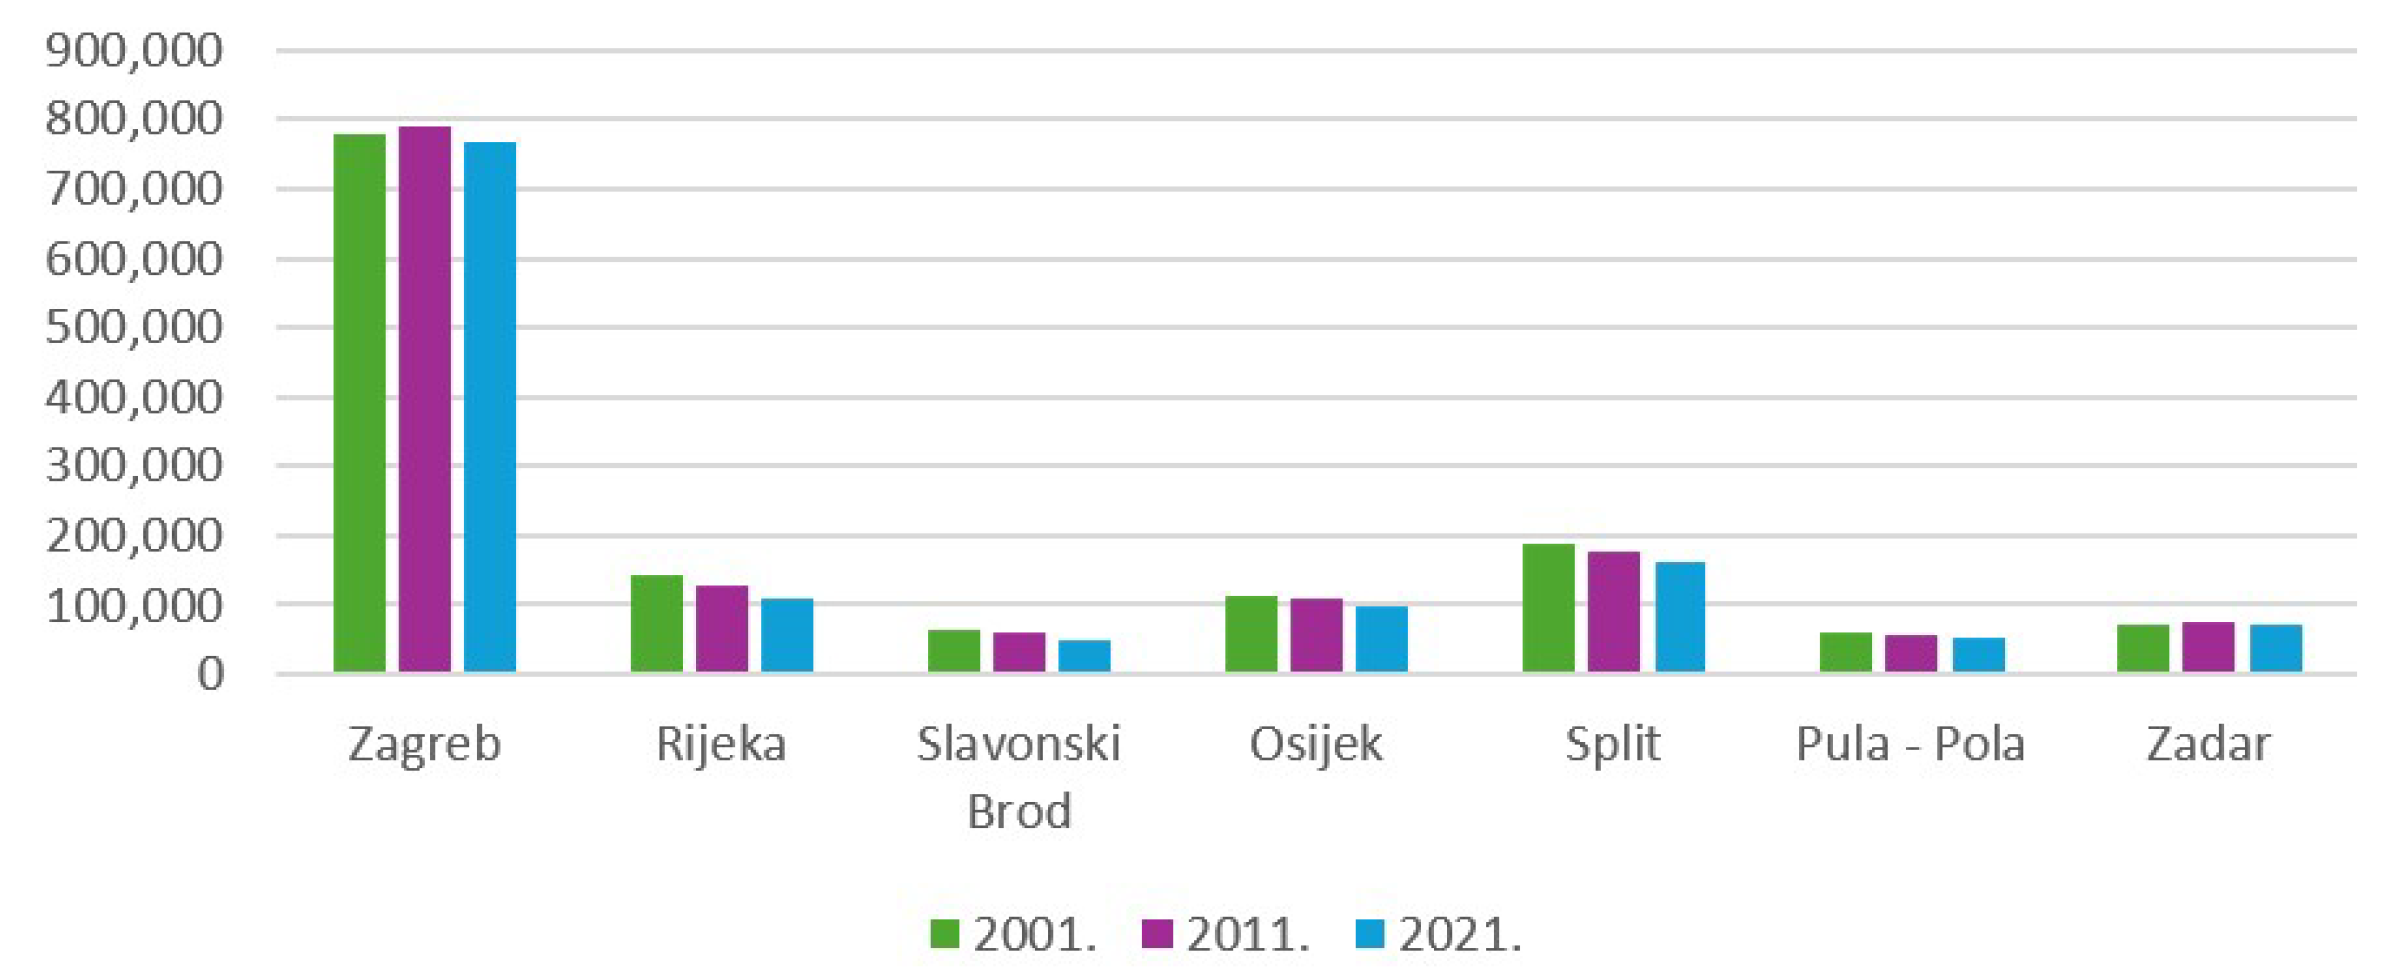
In 2021, all analyzed cities recorded lower population totals than in 2001, reflecting broader national demographic decline, with Croatia’s total population decreasing from 4,437,460 in 2001 to 3,871,833 in 2021 according to the official national census. Population decline in the continental cities of Osijek and Slavonski Brod reflects broader demographic trends in eastern Croatia, including emigration and ageing. The contrasting trends between Slavonski Brod or Osijek compared to Zadar, a city on the coast, reflect broader regional dynamics, with population decline linked to industrial restructuring and outmigration in eastern Croatia, while Zadar shows more stable demographic patterns associated with tourism-driven coastal development. However, Zagreb and Zadar stand out as the only cities that recorded a slight population increase between 2001 and 2011, before declining again by 2021, as shown in Table 1 and Figure 2. In contrast, cities such as Split, Rijeka, Osijek, Pula, and Slavonski Brod followed a steady downward trajectory across all three census years. These contrasting trajectories reflect heterogeneous demographic dynamics among Croatian cities. These census trends provide a reference for evaluating whether global population models are able to reproduce not only absolute population levels, but also the direction and magnitude of demographic change at the city-core scale between census rounds.
Figure 2.
Official census population counts for the seven largest Croatian cities in 2001, 2011, and 2021.
4.1. Global Population Trends Across the Study Area
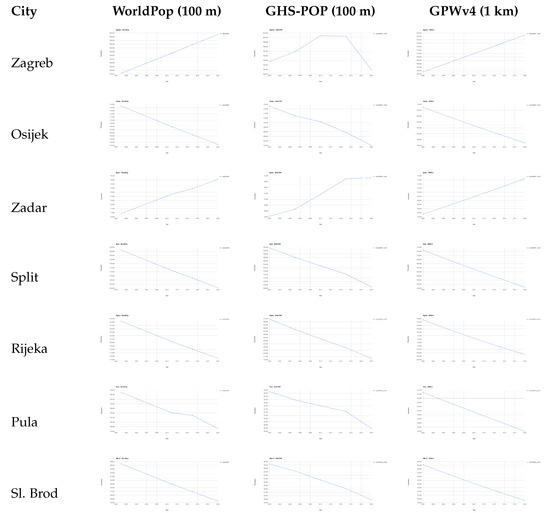
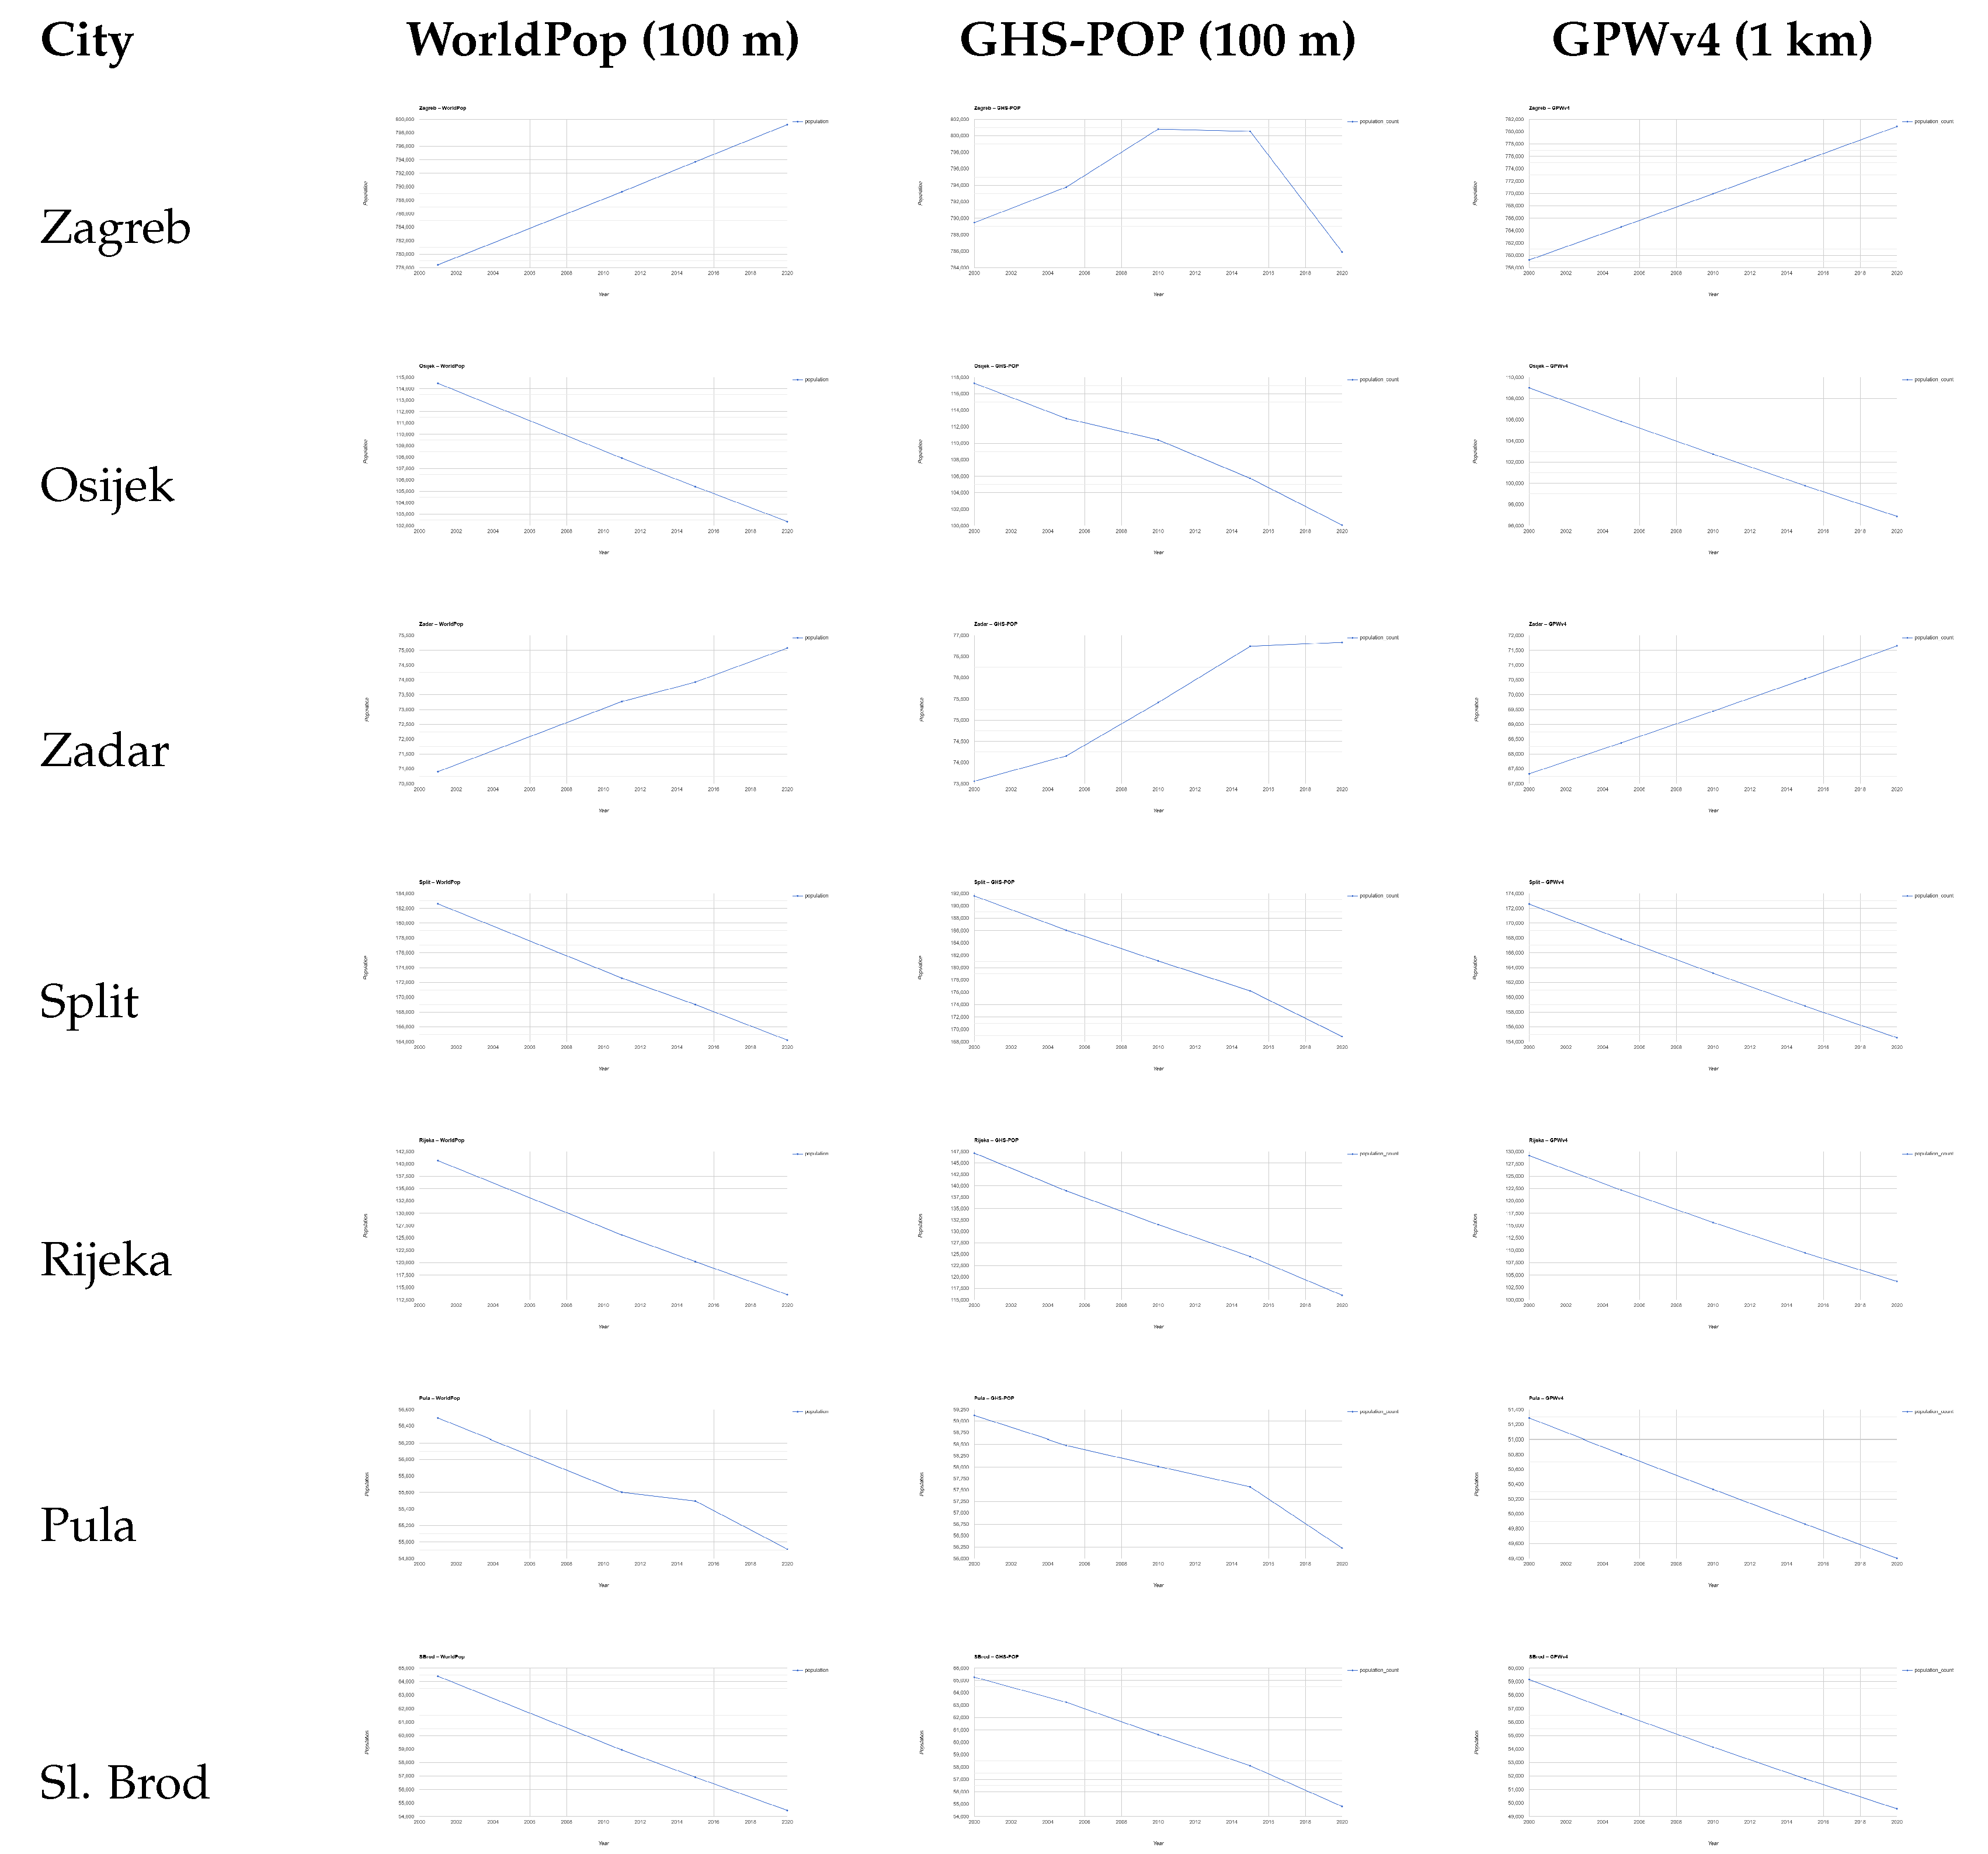
Figure 3 shows population time series for the seven analysed cities derived from WorldPop, GHS-POP, and GPWv4. The comparison highlights clear differences in both absolute population values and temporal behaviour of the datasets within Croatian city cores. This difference reflects the distinct modelling strategies of the two datasets. WorldPop redistributes census counts using a broader set of ancillary covariates and interpolation procedures, which tends to produce smoother temporal trajectories, whereas GHS-POP relies more directly on changes in mapped built-up surfaces, making it more sensitive to updates in the built environment.
Figure 3.
Population totals derived from three global population datasets across seven Croatian core-city (Level 2) boundaries. Each row corresponds to a city; columns show WorldPop, GHS-POP, and GPWv4 time-series plots.
In absolute terms, the three datasets operate on different population scales. GPWv4 consistently produces the lowest population estimates, WorldPop occupies an intermediate position, while GHS-POP generally reports the highest values across most cities and reference years. These systematic offsets reflect differences in modelling approaches: GPWv4 relies on census-based interpolation with limited spatial redistribution, WorldPop redistributes population using ancillary covariates, while GHS-POP allocates population exclusively to mapped built-up areas, which can lead to higher concentrations within urban cores.
WorldPop and GPWv4 display very similar temporal behaviour, characterised by smooth, linear, and monotonic trends without changes in direction over time. Cities experiencing population decline show continuous decreases, while Zagreb and Zadar exhibit steady growth throughout the study period.
GHS-POP shows a different temporal pattern. While general trends remain consistent with expected demographic developments, slight changes in trend direction are visible for Zagreb and Zadar. These shifts are not observed in WorldPop or GPWv4 and are likely related to changes in mapped built-up areas rather than purely demographic processes, potentially indicating a stronger sensitivity of GHS-POP to urban form dynamics.
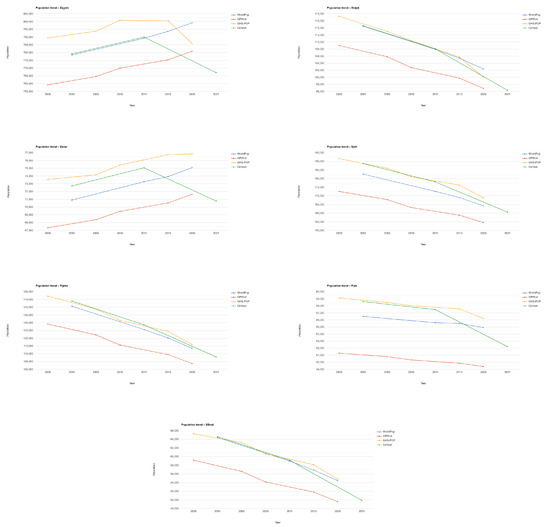
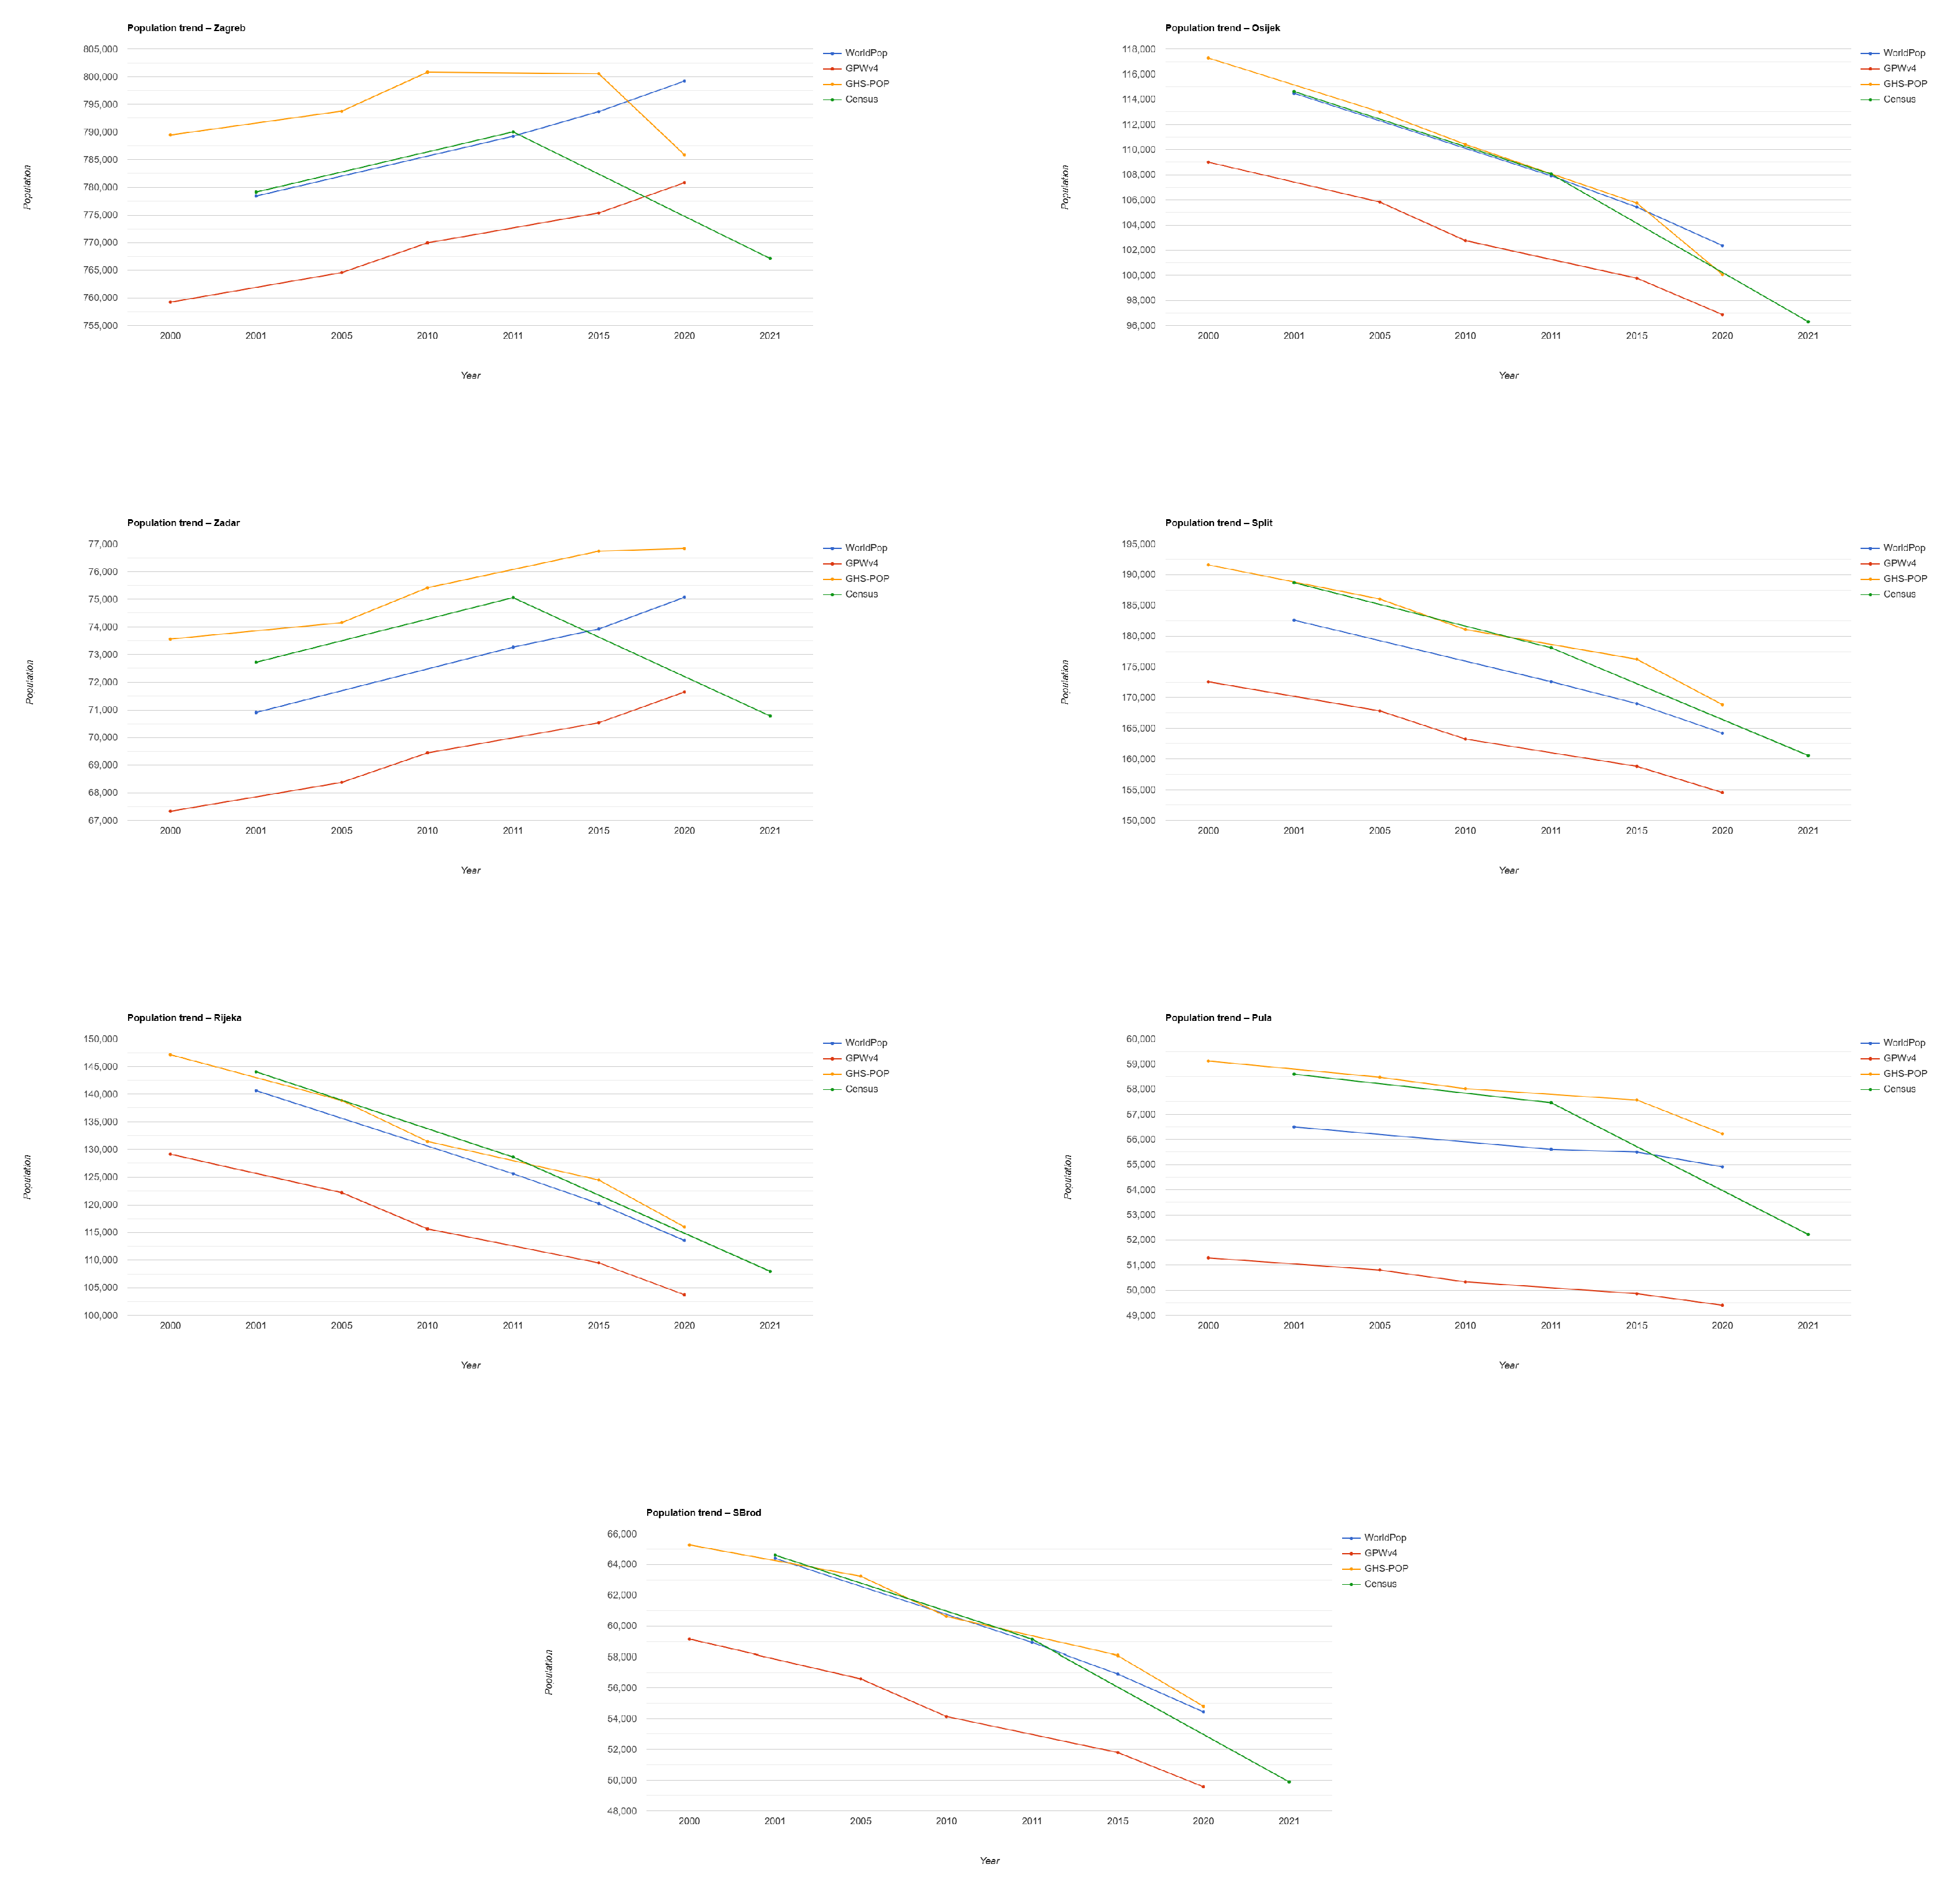
To evaluate how these modelled trajectories relate to real demographic change, Figure 4 directly compares city-level population estimates from three global population models with official census counts for the same urban core boundaries. This comparison enables assessment of both absolute population levels and the direction and magnitude of temporal change captured by global population models.
Figure 4.
Population trends in seven Croatian cities comparing three global datasets and official census data.
Across all analysed cities, census population values generally lie between the estimates produced by WorldPop and GHS-POP. WorldPop tends to underestimate population relative to the census, while GHS-POP more often overestimates it. In individual cases and years, the census aligns more closely with one dataset or the other, indicating that both WorldPop and GHS-POP fit census values reasonably well in absolute terms. GPWv4 consistently produces the lowest population estimates across all cities and reference years.
Despite similar performance in absolute values, WorldPop and GHS-POP differ in their representation of temporal population dynamics. WorldPop shows smooth, monotonic trends without changes in direction, closely reflecting census-based interpolation and redistribution. GHS-POP, by contrast, exhibits higher sensitivity to changes in population trends. This behaviour is most evident in Zagreb and Zadar, where GHS-POP partially captures changes in growth dynamics that are not visible in WorldPop or GPWv4.
In cities characterised by sustained depopulation, such as Rijeka, Osijek, Pula, Slavonski Brod, and Split, all datasets reproduce the general direction of population decline observed in the census. However, the modelled declines are typically smoother and weaker than those recorded by census data, particularly in the period after 2011, when population loss accelerates in several cities.
These results highlight important differences in how global population datasets represent urban demographic change. While WorldPop and GHS-POP approximate census values equally well in absolute terms, GHS-POP appears more responsive to shifts in population dynamics, whereas WorldPop and GPWv4 provide more temporally stable but less sensitive representations of change.
4.2. Pixel-Wise Residual Comparison of Global Datasets
To isolate differences in spatial population allocation that arise from model design rather than temporal mismatches with census data, subsequent analyses focus on inter-model comparisons for a common reference year (2020).
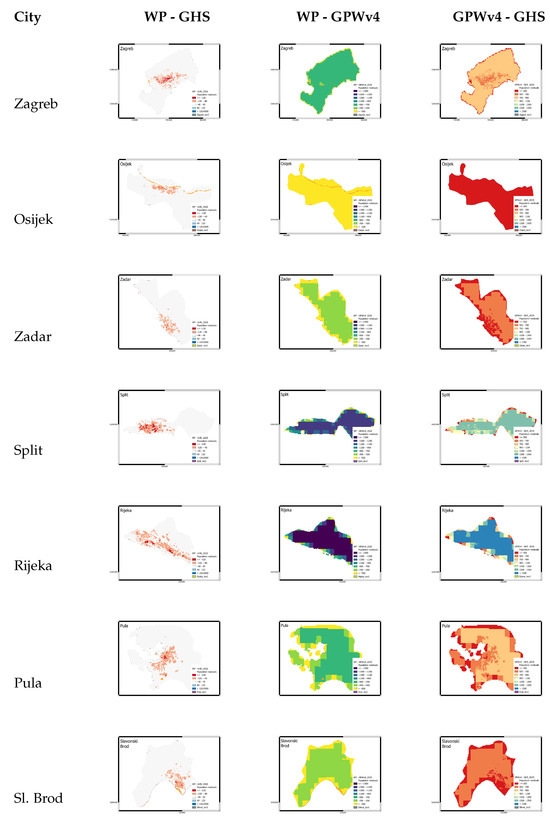
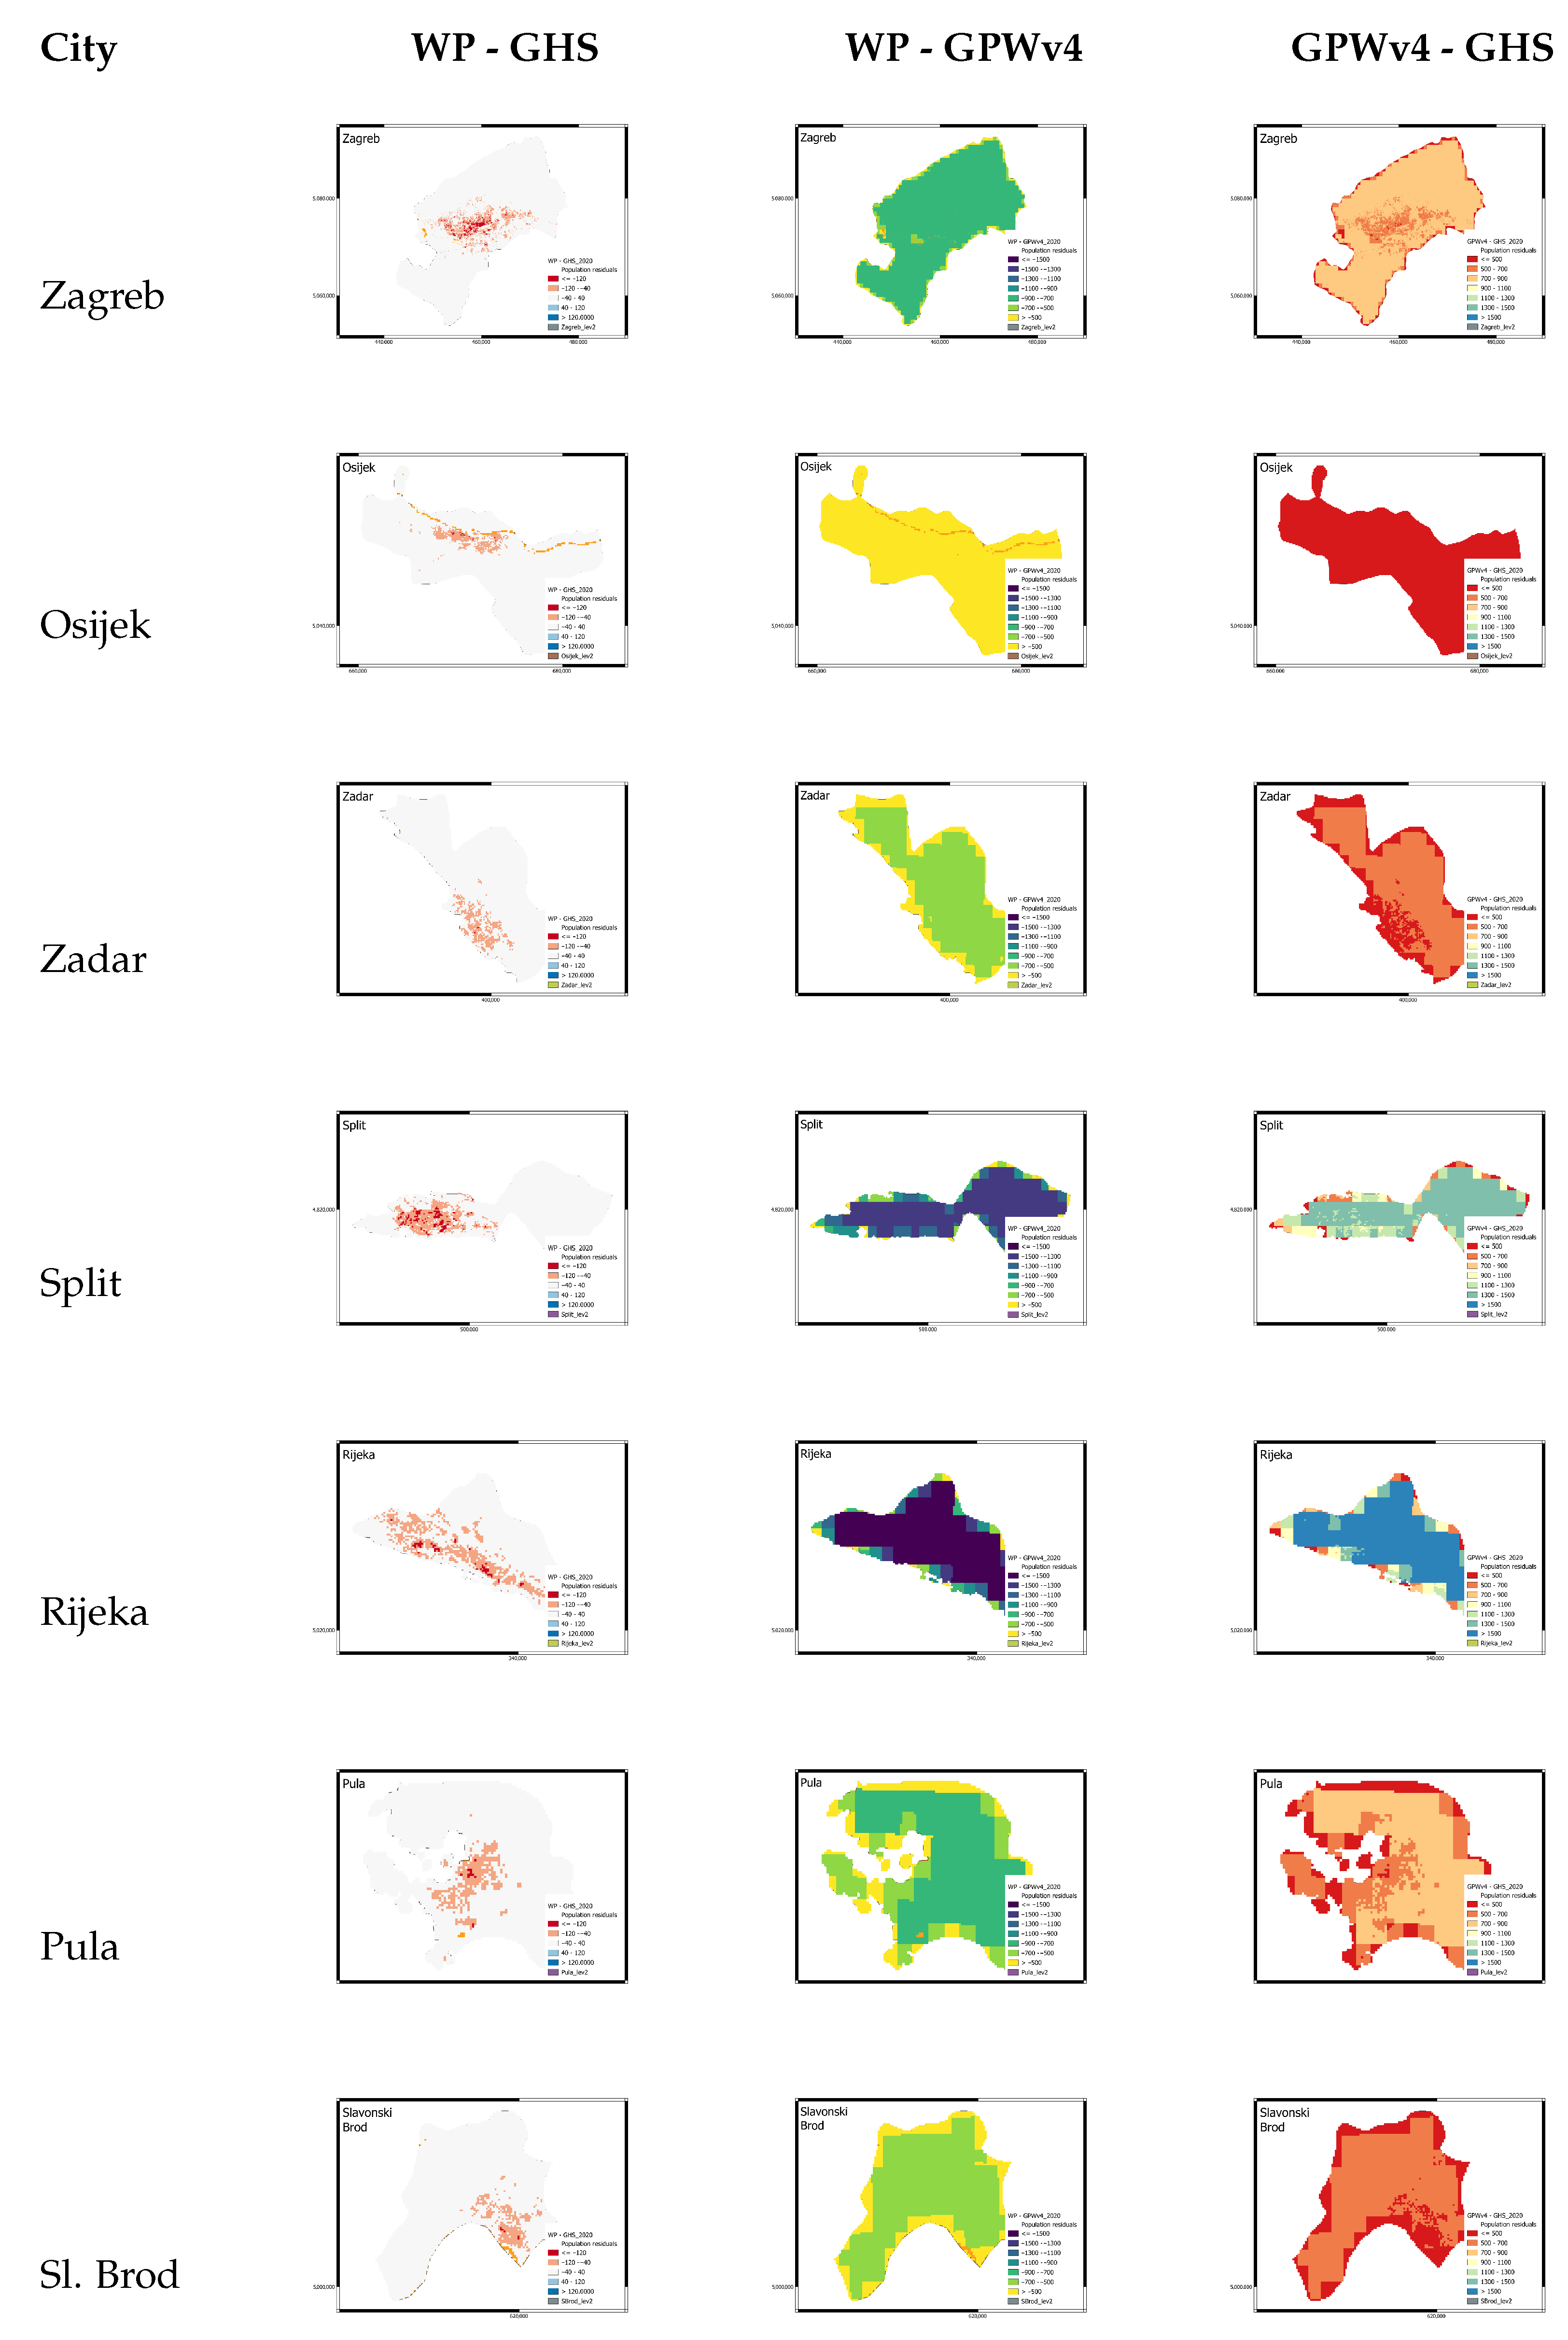
Figure 5 presents pixel-wise residual differences between the three global population datasets for the seven Croatian city cores. Larger differences are generally observed in dense urban areas and zones with higher built-up intensity, where allocation strategies diverge more strongly between models. Peripheral and more fragmented urban zones tend to show weaker residuals because population densities are generally lower and more spatially diffuse, reducing the magnitude of allocation differences between population models.
Figure 5.
Pixel-wise population residuals in 2020 for each of the seven Croatian cities. Columns represent the difference between WorldPop and GHS-POP, WorldPop and GPWv4, and GPWv4 and GHS-POP, respectively. Residuals were calculated in Google Earth Engine and visualized per city using QGIS.
The analysis uses 2020 as a common reference year because it is available across all datasets and represents a methodologically mature stage for both WorldPop and GHS-POP. Although GPWv4 applies a simpler areal-weighted redistribution, its 2020 version provides the closest temporal approximation to current population conditions and aligns well with the 2021 census reference. In addition, the built-up layer used in the analysis is temporally closer to 2020 than to earlier census years, reducing temporal mismatch and allowing observed differences to be interpreted primarily as a result of dataset design rather than demographic change.
The residual maps reveal clear and systematic spatial patterns, indicating that differences between datasets are strongly related to how the population is redistributed within an urban space. In Figure 5, the contrast between Osijek and Zadar illustrates how differences between GPWv4 and GHS-POP become more pronounced in cities with more fragmented built-up structures, such as Osijek, whereas in more compact coastal cities like Zadar the spatial discrepancies are less pronounced.
The comparison between WorldPop and GHS-POP (first column) is the most informative at the level of urban spatial structure. In Zagreb, Split, and Rijeka, WorldPop consistently assigns lower population values to dense urban cores than GHS-POP, resulting in pronounced negative residuals in central areas. At the same time, peripheral zones and more fragmented urban areas tend to show weaker residuals or near-neutral differences. This pattern is characteristic of a model that redistributes population using proxies derived from the built environment, leading to stronger contrasts within compact city centres. In smaller or morphologically simpler cities such as Zadar and Slavonski Brod, residual patterns are less pronounced and more spatially uniform. In Osijek, residuals follow a clear linear pattern along the Drava River, indicating that population allocation responds to urban structure rather than administrative boundaries.
The second comparison, between WorldPop and GPWv4 (second column), shows large and spatially uniform negative residuals across almost the entire extent of all analysed city cores. These homogeneous patterns reflect fundamental differences in redistribution logic rather than local spatial variation.
The third comparison, between GPWv4 and GHS-POP (third column), completes the interpretation of the previous two comparisons. GHS-POP generally assigns higher population values to dense urban cores than GPWv4, leading to positive residuals in central areas and negative residuals toward the urban periphery. This pattern is particularly clear in Rijeka and Split. In Zagreb, the residual map closely reflects the internal urban structure, with clear contrasts between high-density central zones and less densely developed areas. These results provide a clear illustration of the conceptual difference between built-up-driven population allocation and areal-weighted redistribution.
4.3. Built-Up Intensity and Population Model Errors
Urban population models are expected to respond differently to variations in urban form. The degree to which a city core is built-up may influence how the population is distributed within the modelling framework and how estimation errors emerge at the intra-urban scale. This subsection examines whether differences in built-up intensity are associated with population model errors across city cores.
Table 2 presents built-up characteristics of the analysed city cores derived from the GHSL Built-up Surface dataset for 2018. Built-up surface represents the total extent of built structures within each city core, while built-up share expresses their proportion relative to the total city-core area. The observed differences in built-up share reflect distinct urban morphologies among the analysed city cores. Rijeka and Split show the highest built-up shares, which is consistent with their compact urban form constrained by coastal and topographic conditions, resulting in dense and spatially concentrated development. In contrast, Osijek and Zagreb show the lowest built-up shares, reflecting more dispersed urban structures, flatter terrain, and a greater proportion of open, green, and infrastructural areas within their city-core boundaries. These characteristics provide structural context for interpreting population model errors at the city-core scale.
Table 2.
Built-up characteristics of city cores derived from GHSL Built-up Surface (2018). Source: GHSL Built-up Surface dataset (2018), European Commission Joint Research Centre.
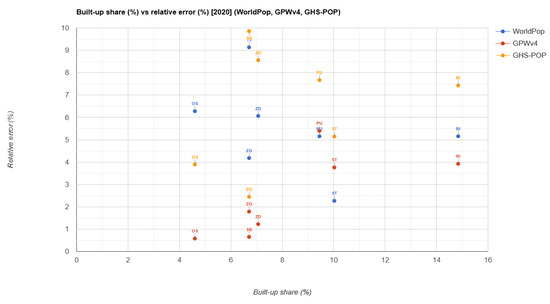
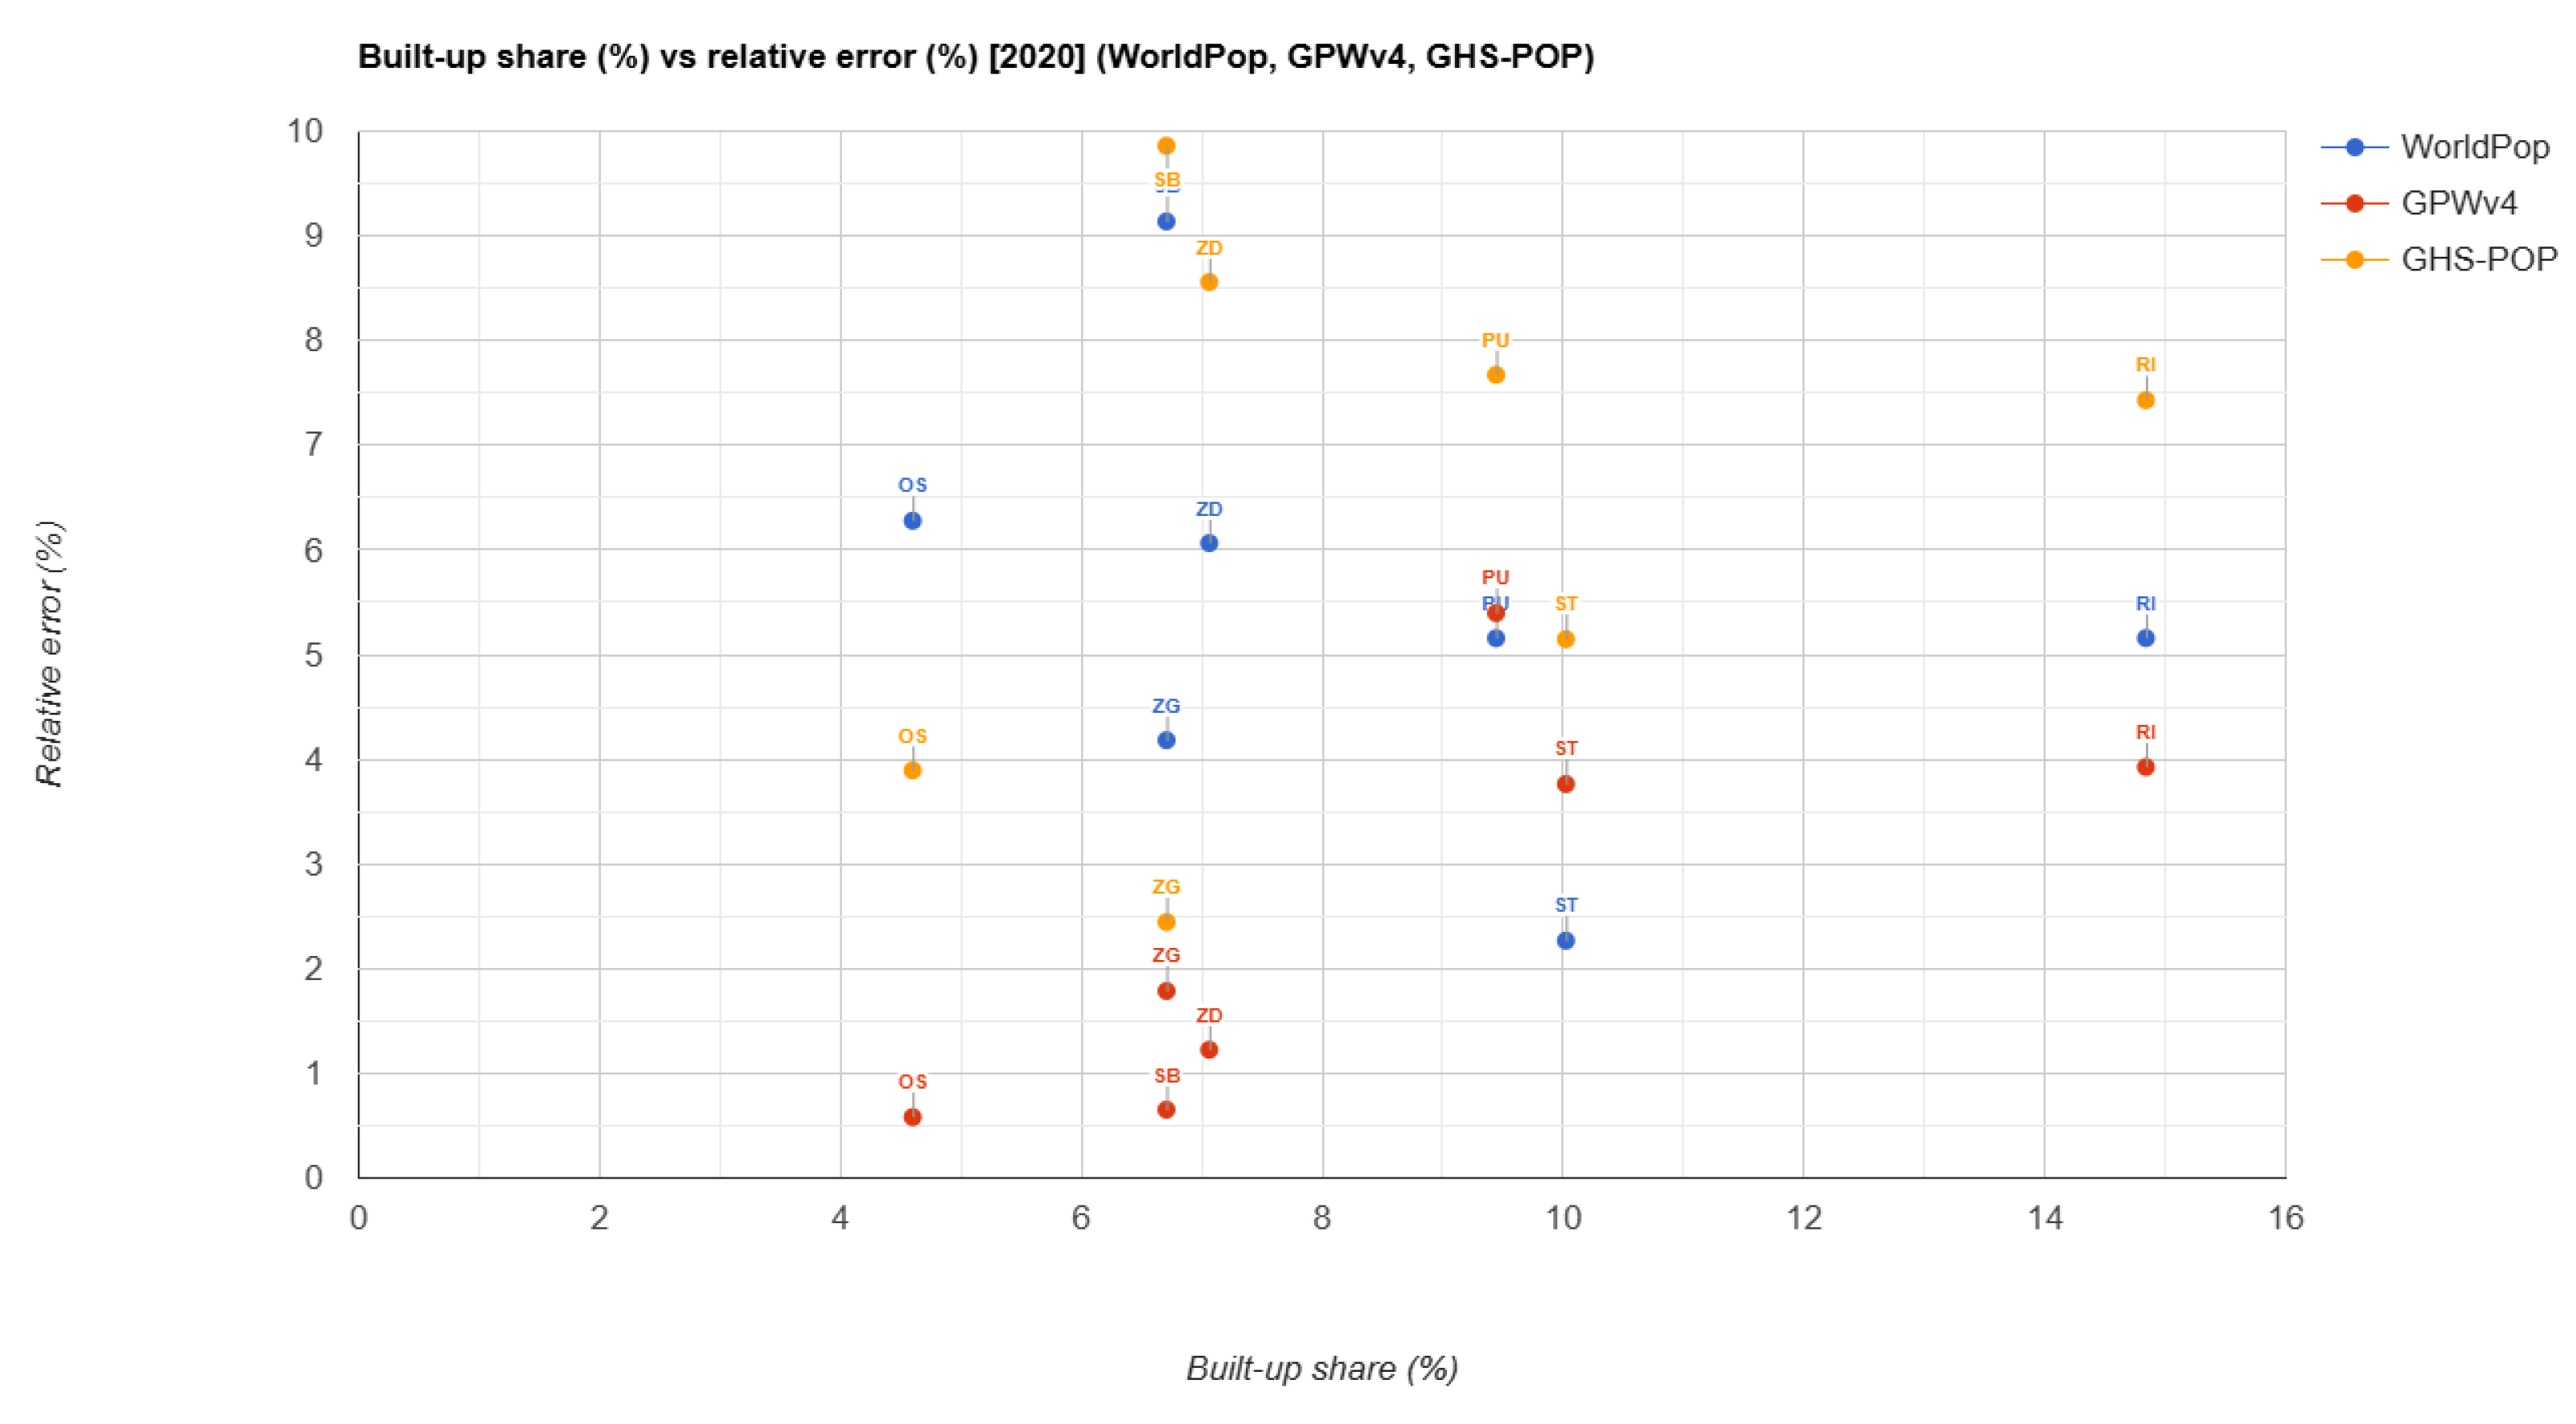
The relationship between built-up share and population model performance is analysed using scatter plots that relate built-up share (%) to relative population error (%) for WorldPop, GPWv4, and GHS-POP (Figure 6). Each point represents one city core, with relative errors calculated with respect to official Census 2021 population counts, used as the closest available reference to the 2020 model year.
Figure 6.
Built-up share versus relative population error across city cores. Each point represents one city core.
The relationship between built-up share and relative population error shown in Figure 6 is weak and non-linear for all three datasets. Cities with similar built-up shares often exhibit substantially different error magnitudes, indicating that built-up intensity alone does not control model performance at the city-core scale.
GPWv4 shows relatively low and stable errors across the full range of built-up shares, reflecting its areal-weighted redistribution approach and coarse spatial resolution, which limits sensitivity to internal urban structure. WorldPop displays moderate errors with no clear trend as built-up share increases, suggesting that factors beyond the proportion of built-up area influence model accuracy. GHS-POP exhibits the largest variability and higher errors in several cities with higher built-up shares, although this pattern is not consistent across all cases. Figure 6 indicates that built-up share itself does not explain population estimation errors but it provides contextual information on urban form. The comparison between datasets also highlights differences in how population is spatially allocated within the same urban boundaries. While GPWv4 tends to distribute population more uniformly across administrative units, GHS-POP concentrates population within built-up pixels, and WorldPop redistributes population using ancillary covariates, producing more dispersed spatial patterns.
To quantify the relationships between built-up share and population allocation errors, a Pearson and Spearman correlation coefficients between city-core built-up share (%) and city-core relative error (%) were calculated in R studio.
In contrast, GPWv4 exhibited a stronger positive association with built-up share (Pearson r = 0.731, p = 0.062, Spearman Ro = 0.829, p = 0.021), suggesting that model errors increase in cities with higher proportions of built-up areas, given in Table 3.
Table 3.
Pearson and Spearman correlation coefficients between built-up share and relative population error across the seven analysed cities ().
The relationship between built-up share and population error was explored using both Pearson and Spearman correlation coefficients across the seven analysed cities (). Weak and statistically non-significant correlations were observed for WorldPop and GHS-POP, indicating only limited linear or monotonic relationships between built-up share and model error. In contrast, GPWv4 exhibited a stronger positive association with built-up share (Pearson , , Spearman , ), suggesting that model errors increase in cities with higher proportions of built-up areas. This pattern likely reflects the sensitivity of coarse, areal-weighted population redistribution to the proportion of built-up area at the city-core scale rather than a meaningful representation of intra-urban population structure. Given the small sample size, these correlations should be interpreted as exploratory rather than definitive.
4.4. City-Level Population Errors Relative to Census Data
Before examining spatial patterns of population differences within built-up areas, it is necessary to assess how closely global population datasets reproduce total population counts at the city-core level. This provides a reference for interpreting whether subsequent spatial discrepancies reflect local redistribution effects or simply mismatches in aggregated population totals.
Table 4 reports city-level population errors (%) for three global gridded population datasets (WorldPop, GHS-POP, and GPWv4) relative to official census totals for each city core. For each model, population totals were obtained by summing raster values within city-core boundaries. Model estimates for 2020 were compared with census data from 2021, which represents the closest available reference year.
Table 4.
Relative population errors (%) between global population datasets (2020) and Census 2021 population counts.
Population error is expressed as an absolute relative error, computed as . This measure indicates the magnitude of deviation from census values, without preserving the sign of over- or under- estimation.
Across the analysed cities, all three population datasets show non-negligible deviations from census totals. WorldPop and GHS-POP generally exhibit moderate errors in the range of approximately 2–10%, while GPWv4 shows smaller errors in several cities, particularly in Osijek and Slavonski Brod where GPWv4 shows very low relative errors (0.65% and 0.58%, respectively), indicating that areal-weighted redistribution performs well in reproducing city-level totals despite differences in spatial allocation patterns. However, lower city-level error does not necessarily imply better spatial representation within the urban area. These results therefore provide an overall assessment of population totals at the city-core scale, while subsequent analyses focus on the spatial distribution of differences within urban space. At the city-core level, population errors remain generally below 10%, indicating that major discrepancies between models do not arise from mismatches in aggregated totals but from differences in their internal spatial allocation.
4.5. Population Differences Within Built-Up and Non-Built-Up Areas
Aggregated population sums conditioned on built-up and non-built-up areas are used to examine differences in spatial population allocation between WorldPop and GHS-POP, with GPWv4 excluded from this analysis due to its coarse spatial resolution.
Outside of built-up areas defined by ESA WorldCover, WorldPop assigns substantially higher population counts than GHS-POP. Across all analysed cities, WorldPop exceeds GHS-POP by approximately 290,000 inhabitants in non-built-up classes, including peri-urban, agricultural, and green areas, as shown in Table 5. Although Zagreb contributes the largest share due to its population size, similar allocation patterns are visible across multiple cities. This indicates that WorldPop redistributes a significant share of population beyond strictly built-up land-cover classes, while GHS-POP remains more conservative outside built-up zones.
Table 5.
Aggregated population sums by built-up definition for all analysed cities (2020).
Within built-up areas defined by WorldCover, the opposite pattern is observed. GHS-POP allocates more than three times the population assigned by WorldPop, resulting in a negative WorldPop–GHS-POP difference exceeding one million inhabitants. This indicates a strong concentration of population within built-up pixels in GHS-POP, whereas WorldPop assigns a smaller proportion of population to the same areas.
To assess whether this pattern depends on the definition of built-up areas, the analysis was repeated using the GHSL built-up surface as an alternative mask. The results remain consistent. Even when using GHSL’s own built-up definition, GHS-POP assigns substantially higher population counts within built-up areas than WorldPop, and the magnitude of the difference increases further. This confirms that negative WorldPop–GHS-POP differences within built-up areas are not artefacts of land-cover classification choice or grid harmonisation.
The results demonstrate that WorldPop and GHS-POP differ not only in total population estimates, but more importantly in their spatial logic of population distribution. GHS-POP systematically concentrates population within built-up areas, reflecting its direct reliance on the GHSL built-up layer for population allocation, while WorldPop redistributes a considerable share of population into non-built-up classes. In shrinking cities, where built-up extents remain relatively stable despite population decline, these differences in allocation strategies become particularly pronounced. As a result, WorldPop tends to exceed GHS-POP outside built-up areas, while remaining consistently lower within built-up zones, even when total population estimates are similar or higher.
At the aggregated city-core level, WorldPop totals (shown in Table 5) show closer agreement with official census figures, indicating that its broader spatial redistribution results in more balanced population estimates when summed across built-up and non-built-up areas. In contrast, GHS-POP produces systematically higher totals, driven by strong concentration within built-up zones, which can lead to overestimation at the city-core scale despite accurate representation of urban morphology.
4.6. Population Model Differences by Aggregated Land-Cover Groups
The aggregated population sums presented in the previous subsection explain how population is redistributed between built-up and non-built-up areas across the analysed cities. To complement these results, an additional land-cover-based analysis was conducted to quantify the average intensity of inter-model differences at the pixel level across major functional components of the urban landscape.
Pixel-level differences between WorldPop and GHS-POP for 2020 were analysed using land-cover information from the ESA WorldCover dataset. Individual land-cover classes were aggregated into four groups reflecting urban relevance: Built-up, Green (tree cover, grassland, shrubland), Cropland, and Other land-cover types. For each city core, mean population differences (WorldPop minus GHS-POP) were calculated per group and area-weighted by land-cover class extent, expressed as pixel counts at 100 m resolution. Aggregated values across all cities were derived using the same pixel-count weights, so that larger spatial extents exerted a proportionally greater influence. The resulting weighted mean differences are reported in Table 6.
Table 6.
Weighted mean differences between WorldPop and GHS-POP by aggregated land-cover groups (2020). Positive values indicate higher WorldPop estimates.
Built-up areas exhibit a consistently negative mean difference across all cities, indicating that WorldPop assigns lower population densities than GHS-POP within dense urban fabric. In contrast, Green and Cropland areas show small positive mean differences, suggesting only minor divergence between the models outside built-up zones. The Other land-cover group also displays positive values on average, although its interpretation is limited by a comparatively small number of pixels. These pixel-level patterns are consistent with the aggregated population totals reported in Table 5, where GHS-POP allocates substantially higher population totals within built-up areas, while WorldPop exceeds GHS-POP in non-built-up classes.
Together with the aggregated population totals, the values reported in Table 6 indicate that differences between WorldPop and GHS-POP are driven primarily by contrasting spatial allocation strategies rather than by overall population magnitude. GHS-POP systematically concentrates population within built-up areas, while WorldPop distributes a larger share of population into non-built-up land-cover classes. The land-cover-based pixel-level analysis therefore provides a consistent and complementary explanation for the negative WorldPop–GHS-POP differences observed within built-up areas and the positive differences observed outside them. The strongly negative value for built-up areas (−39.51) indicates that GHS-POP concentrates substantially higher population densities within built-up pixels compared to WorldPop, reflecting the stronger dependence of the GHSL-based allocation on built-up surface detection.
5. Discussion
This study examined how three global gridded population datasets allocate population within shrinking cities and how these spatial patterns relate to built-up structure and land cover. The results provide evidence that the datasets produce comparable city-level totals but diverge substantially in their internal spatial allocation. This finding supports the first hypothesis that global population datasets may appear consistent at aggregated scales while exhibiting significant spatial differences at the intra-urban level.
While city-level errors (Table 4) remain relatively low across all datasets, generally within 2–10%, with GPWv4 often showing the smallest deviations, these results demonstrate that lower aggregate error does not imply better spatial representation, as GPWv4 produces the most spatially uniform distributions. Hence, such results can mask substantial variation in spatial allocation, which is critical for SDG-related indicators that depend on the spatial distribution of population rather than total counts.
At the city scale, the differences between datasets were moderate, indicating that global products can reproduce overall population magnitudes reasonably well. However, the spatial distribution within cities varied considerably. This pattern confirms previous research [28] showing that global gridded population datasets are strongly influenced by modelling assumptions and ancillary datasets used for population redistribution since top-down disaggregation models often rely on built-up layers, land-cover information, or night-time lights to redistribute census counts across grid cells, which can introduce systematic biases depending on the characteristics of the urban environment.
The spatial allocation patterns observed in this study are also consistent with the second hypothesis that built-up structure influences population distribution within urban areas. GHS-POP tends to concentrate population within mapped built-up pixels, which leads to strong spatial clustering of population estimates. This behaviour reflects the dataset’s reliance on the Global Human Settlement Layer for population redistribution. In contrast, WorldPop distributes population more broadly across surrounding land-cover classes through the use of multiple ancillary covariates and machine-learning modelling. These differences are quantitatively substantial: across all analysed cities, WorldPop allocates approximately 290,000 more inhabitants to non-built-up areas, whereas GHS-POP concentrates over one million additional inhabitants within built-up zones (Table 5), indicating fundamentally different spatial allocation strategies. Such approaches can increase spatial detail but may also redistribute population into areas that are not strictly residential, particularly in low-density urban regions. In practical terms, this implies that GHS-POP may be more suitable for analyses focused on built-up density and compact urban structures, whereas WorldPop may better capture population presence across heterogeneous and low-density urban areas, albeit with a risk of spatial over-dispersion. These contrasting allocation strategies can directly affect SDG-related indicators that rely on population density, built-up extent, or exposure estimates, potentially leading to different interpretations of urban sustainability and land-use efficiency.
These differences are particularly relevant in shrinking cities, where demographic decline is often accompanied by spatially dispersed settlement structures. European cities frequently display a decoupling between demographic trends and land consumption, with built-up areas continuing to expand even in regions experiencing population stagnation or decline [29]. In such contexts, population redistribution models that rely heavily on built-up proxies may over-concentrate population in physical structures while underrepresenting the spatial heterogeneity of residential patterns.
The results also support the third hypothesis that differences between datasets are primarily linked to modelling assumptions rather than to observed demographic change. Each dataset applies a distinct redistribution strategy. GHS-POP is closely tied to built-up detection, GPW distributes population uniformly within administrative units, and WorldPop uses covariate-based modelling. These methodological differences directly influence where population is allocated within the urban fabric. This behaviour reflects the broader modelling strategies used in global population mapping, where built-settlement layers and ancillary geospatial covariates are used to redistribute census counts across grid cells. It aligns with some previous studies, which have shown that the choice and spatial accuracy of built-environment proxies can strongly influence the resulting population distribution patterns [30] and that modelling choices and input data quality are major drivers of spatial discrepancies in global population datasets [28].
The results align with recent assessments demonstrating systematic biases in global gridded population datasets, where global validation work has shown that these products can substantially underestimate population in certain spatial contexts, particularly where settlement patterns are heterogeneous or poorly represented in ancillary datasets [31]. Such findings reinforce the need for careful interpretation when using these datasets in urban analysis, especially in regions where settlement patterns differ from those used in model calibration. Analysis from this study demonstrates that global population datasets should not be treated as interchangeable when examining intra-urban spatial patterns. While they provide valuable and accessible representations of population distribution, their outputs remain strongly conditioned by modelling assumptions and input data structures. Dataset selection should therefore be aligned with the specific analytical objective rather than based solely on availability or resolution, particularly in SDG-related and policy-oriented applications.
Limitations
This study has several limitations that should be considered when interpreting the results. First, the analysis is based on a relatively small sample of seven cities within a single national context, which limits the statistical generalization of the findings. In addition, the analysis relies on administrative city-core boundaries and does not include neighbourhood-level ground-truth population data, which could further improve validation of model performance at finer spatial scales.
The use of Level 2 administrative boundaries focuses the analysis on core urban areas that contain the majority of functionally urban and suburban zones relevant for census reporting and population modelling. Although some peripheral fragments may fall outside these limits, their exclusion is limited and intentional, ensuring spatial consistency across datasets and avoiding additional uncertainty associated with heterogeneous metropolitan delineations. Consequently, the analysis prioritizes comparability and robustness over exhaustive coverage of peri-urban fringes, and these findings should not be generalized to entire functional urban regions.
Comparing 2020 model estimates with Census 2021 introduces a minor temporal mismatch. However, given the short interval and the focus on relative differences between population models rather than absolute demographic change, this effect is likely smaller than the systematic spatial allocation differences observed between datasets.
While this case study focuses on Croatian cities, shrinking urban areas exhibit different spatial and demographic characteristics across global contexts. For example, population decline in Japanese cities is largely driven by natural change, while in U.S. Rust Belt cities it is often associated with long-term industrial decline. In informal settlements, as shown by Thomson et al. [13], gridded population datasets tend to underestimate population due to high building density, informality, and data gaps. In contrast, in European shrinking-city contexts, different biases are observed, including overestimation in dense built-up cores and underestimation in low-density legacy neighbourhoods. These differences highlight the importance of context-specific validation before applying global datasets for local SDG monitoring.
The results of this study are most applicable to shrinking or demographically stagnant cities with relatively stable built-up extents, reliable census data, and predominantly formal urban structures. They are less directly transferable to rapidly growing metropolitan regions, informal settlement contexts, or cities where population growth and land expansion are strongly coupled. In such contexts, global gridded population datasets should not be used “off-the-shelf” for SDG 11 monitoring or other local sustainability assessments, but require local validation and, where necessary, calibration to account for context specific demographic and spatial patterns.
6. Conclusions
This study evaluated three global gridded population datasets (WorldPop, GHS-POP, and GPWv4) in seven Croatian city cores undergoing long-term demographic decline, using official census data and spatial diagnostics based on built-up structure and land cover. The results show that the datasets can produce similar city-level population totals while distributing population very differently within the same urban boundaries, highlighting the need to distinguish between numerical accuracy and fitness for intra-urban applications. GPWv4 often matches census totals at the city-core scale but produces spatially uniform surfaces that limit its usefulness for neighbourhood-level analysis, whereas WorldPop and GHS-POP differ systematically in how they allocate population across built-up and non-built-up areas. WorldPop and GHS-POP showed city-level errors generally in the range of about 2–10%, where WorldPop allocated approximately 290,000 more inhabitants outside built-up areas than GHS-POP, while GHS-POP concentrated over one million additional inhabitants within built-up zones across the analysed cities, whereas differences in total population estimates remained comparatively moderate.
These differences are not random but are linked to modelling assumptions and the treatment of built-up surfaces. GHS-POP tends to concentrate population within built-up pixels, while WorldPop redistributes a larger share into surrounding land-cover classes. In shrinking cities, where built-up extents often remain relatively stable despite population decline, such allocation strategies can bias estimates of density, accessibility, and exposure even when city totals appear reasonable. This has direct implications for the use of gridded population datasets as denominators in SDG 11 indicators and other sustainability metrics, where uncritical dataset choice may lead to divergent or misleading assessments.
The Croatian case illustrates a broader need for context-specific validation of global population models in demographically declining urban areas. In shrinking cities, global gridded population products should therefore not be used “off the shelf”, but should be evaluated against recent census data and, where necessary, calibrated to account for local patterns of demographic decline, housing vacancy, and land-use heterogeneity. Future research could extend this approach to functional urban regions and to other shrinking-city contexts, providing a stronger basis for reliable SDG monitoring and more informed urban policy design.
Author Contributions
Conceptualization, O.B.O.; methodology, O.B.O. and S.Š.; software, O.B.O.; validation, S.Š.; formal analysis, O.B.O. and S.Š.; investigation, O.B.O. and S.Š.; resources, O.B.O. and D.Š.; data curation, O.B.O., S.Š. and D.Š.; writing—original draft preparation, O.B.O. and S.Š.; writing—review and editing, D.Š. and V.C.; visualization, O.B.O. and S.Š.; supervision, O.B.O.; project administration, O.B.O.; funding acquisition, O.B.O. All authors have read and agreed to the published version of the manuscript.
Funding
This research was funded within the scientific project “Potential of Sentinel-1 InSAR Data for Generating Digital Elevation Models in Geodetic Applications”, project number UNIN-TEH-25-1-10, and part of scientific project “The influence of the 3D structure of a city on the intensity of the urban heat island”, project number UNIN-TEH-26-1-4, both funded by the University of North, Varaždin, Croatia.
Institutional Review Board Statement
Not applicable.
Informed Consent Statement
Not applicable.
Data Availability Statement
Data used in this research is open and free satellite data obtained through Google Earth Engine platform, and open and free official statistics from Croatian Bureau of Statistics. Also, complete author’s own GEE processing script used in this study is publicly available at GitHub [32] for reproducibility and adaptation to other study areas.
Acknowledgments
This research was conducted as part of the scientific project “Potential of Sentinel-1 InSAR Data for Generating Digital Elevation Models in Geodetic Applications”, and part of scientific project “The influence of the 3D structure of a city on the intensity of the urban heat island”.
Conflicts of Interest
The authors declare no conflicts of interest.
References
- Cetl, V.; Markovinović, D.; Šamanović, S.; Matijević, H.; Bjelotomić Oršulić, O.; Rezo, M. Geodesy and geomatics in the support of the sustainable development goals (SDGS). Environ. Eng. 2024, 11, 1–6. [Google Scholar] [CrossRef] [Scilit]
- Guo, H.; Liang, D.; Sun, Z.; Chen, F.; Wang, X.; Li, J.; Zhu, L.; Bian, J.; Wei, Y.; Huang, L.; et al. Measuring and Evaluating SDG Indicators with Big Earth Data. Sci. Bull. 2022, 67, 1792–1801. [Google Scholar] [CrossRef] [Scilit]
- Chen, J.; Peng, S.; Chen, H.; Zhao, X.; Ge, Y.; Li, Z. A Comprehensive Measurement of Progress toward Local SDGs with Geospatial Information: Methodology and Lessons Learned. ISPRS Int. J. Geo-Inf. 2020, 9, 522. [Google Scholar] [CrossRef] [Scilit]
- Eurostat. Demography of Europe—2023 Edition. Available online: https://ec.europa.eu/eurostat/web/interactive-publications/demography-2023 (accessed on 5 June 2025).
- Leyk, S.; Gaughan, A.E.; Adamo, S.B.; de Sherbinin, A.; Balk, D.; Freire, S.; Rose, A.; Stevens, F.R.; Blankespoor, B.; Frye, C.; et al. The Spatial Allocation of Population: A Review of Large-scale Gridded Population Data Products and Their Fitness for Use. Earth Syst. Sci. Data 2019, 11, 1385–1409. [Google Scholar] [CrossRef] [Scilit]
- Tatem, A.J. WorldPop, open data for spatial demography. Sci. Data 2017, 4, 170004. [Google Scholar] [CrossRef] [Scilit]
- Zhang, W.-B.; Woods, D.; Olowe, I.D.; Schiavina, M.; Fang, W.; Hornby, G.; Bondarenko, M.; Maes, J.; Dijkstra, L.; Tatem, A.J.; et al. Assessing the Impacts of Gridded Population Model Choice on Degree of Urbanisation Metrics. Cities 2025, 166, 106293. [Google Scholar] [CrossRef] [Scilit]
- Croatia.eu. Demographics. Available online: https://www.croatia.eu/index.php/en/home-en/geography-and-population/demographics (accessed on 5 June 2025).
- Government of the Republic of Croatia. Strategy for the Demographic Revitalization of the Republic of Croatia until 2033. Nar. Novine 2024, 36, 580. Available online: https://narodne-novine.nn.hr/clanci/sluzbeni/2024_03_36_580.html (accessed on 5 June 2025). (In Croatian)
- Šterc, S. Croatia’s demographic and migration imbalance. Kroatologija 2023, 14, 13–15. Available online: https://hrcak.srce.hr/file/442321 (accessed on 5 June 2025). (In Croatian) [CrossRef] [Scilit]
- Croatian Bureau of Statistics. Statistical Postcards of Cities. Available online: https://podaci.dzs.hr/media/0rtoyqmb/statisti%C4%8Dke-razglednice-gradova_hr.pdf (accessed on 5 June 2025). (In Croatian)
- Yin, X.; Li, P.; Feng, Z.; Yang, Y.; You, Z.; Xiao, C. Which Gridded Population Data Product Is Better? Evidences from Mainland Southeast Asia. ISPRS Int. J. Geo-Inf. 2021, 10, 681. [Google Scholar] [CrossRef] [Scilit]
- Thomson, D.R.; Gaughan, A.; Stevens, F.; Yetman, G.; Elias, P.; Chen, R. Evaluating the Accuracy of Gridded Population Estimates in Slums: A Case Study in Nigeria and Kenya. Urban Sci. 2021, 5, 48. [Google Scholar] [CrossRef] [Scilit]
- Aquilino, M.; Tarantino, C.; Adamo, M.; Barbanente, A.; Blonda, P. Earth Observation for the Implementation of Sustainable Development Goal 11 Indicators at Local Scale: Monitoring of the Migrant Population Distribution. Remote Sens. 2020, 12, 950. [Google Scholar] [CrossRef] [Scilit]
- Tu, W.; Chen, D.; Cao, R.; Xia, J.; Zhang, Y.; Li, Q. Towards SDG 11: Large-Scale Geographic and Demographic Characterisation of Informal Settlements Fusing Remote Sensing, POI, and Open Geo-Data. ISPRS J. Photogramm. Remote Sens. 2024, 217, 199–215. [Google Scholar] [CrossRef] [Scilit]
- Melchiorri, M.; Pesaresi, M.; Florczyk, A.; Corbane, C.; Kemper, T. Principles and Applications of the Global Human Settlement Layer as Baseline for the Land Use Efficiency Indicator—SDG 11.3.1. ISPRS Int. J. Geo-Inf. 2019, 8, 96. [Google Scholar] [CrossRef] [Scilit]
- McKeen, T.; Bondarenko, M.; Kerr, D.; Esch, T.; Marconcini, M.; Palacios-Lopez, D.; Zeidler, J.; Valle, R.C.; Juran, S.; Tatem, A.J.; et al. High-Resolution Gridded Population Datasets for Latin America and the Caribbean Using Official Statistics. Sci. Data 2023, 10, 436. [Google Scholar] [CrossRef] [Scilit]
- Georganos, S.; Hafner, S.; Kuffer, M.; Linard, C.; Ban, Y. A Census from Heaven: Unraveling the Potential of Deep Learning and Earth Observation for Intra-Urban Population Mapping in Data Scarce Environments. Int. J. Appl. Earth Obs. Geoinf. 2022, 114, 103013. [Google Scholar] [CrossRef] [Scilit]
- Metzger, N.; Daudt, R.C.; Tuia, D.; Schindler, K. High-Resolution Population Maps Derived from Sentinel-1 and Sentinel-2. Remote Sens. Environ. 2024, 314, 114383. [Google Scholar] [CrossRef] [Scilit]
- Darin, E.; Kuépié, M.; Bassinga, H.; Boo, G.; Tatem, A.J. The Population Seen from Space: When Satellite Images Come to the Rescue of the Census. Population 2022, 77, 437–464. [Google Scholar] [CrossRef] [Scilit]
- Croatian Bureau of Statistics. Population Trends in the Republic of Croatia, 2011–2021. Available online: https://dzs.gov.hr/hr/statistike/statistika-u-nizu/stanovnistvo-i-migracije/645 (accessed on 5 June 2025). (In Croatian)
- GADM. Database of Global Administrative Areas, Version 4.0. Available online: https://gadm.org (accessed on 5 June 2025).
- Doxsey-Whitfield, E.; MacManus, K.; Adamo, S.B.; Pistolesi, L.; Squires, J.; Borkovska, O.; Baptista, S.R. Taking Advantage of the Improved Availability of Census Data: A First Look at the Gridded Population of the World, Version 4. Pap. Appl. Geogr. 2015, 1, 226–234. [Google Scholar] [CrossRef] [Scilit]
- Freire, S.; MacManus, K.; Pesaresi, M.; Doxsey-Whitfield, E.; Mills, J. Development of New Open and Free Multi-temporal Global Population Grids at 250 m Resolution. 2016. Available online: https://publications.jrc.ec.europa.eu/repository/handle/JRC100523 (accessed on 5 June 2025).
- Pesaresi, M.; Ehrlich, D.; Ferri, S.; Florczyk, A.; Carneiro Freire, S.M.; Haag, F.; Halkia, S.; Julea, A.; Kemper, T.; Soille, P. Global Human Settlement Analysis for Disaster Risk Reduction. 2016. Available online: https://publications.jrc.ec.europa.eu/repository/handle/JRC92461 (accessed on 15 February 2026).
- European Space Agency. WorldCover 10m 2020 v100. Available online: https://esa-worldcover.org/en (accessed on 5 June 2025).
- Croatian Bureau of Statistics. Final Results of the 2021 Census Published. Available online: https://dzs.gov.hr/vijesti/objavljeni-konacni-rezultati-popisa-2021/1270 (accessed on 5 June 2025). (In Croatian)
- Kuffer, M.; Owusu, M.; Oliveira, L.; Sliuzas, R.; van Rijn, F. The Missing Millions in Maps: Exploring Causes of Uncertainties in Global Gridded Population Datasets. ISPRS Int. J. Geo-Inf. 2022, 11, 403. [Google Scholar] [CrossRef] [Scilit]
- Schiavina, M.; Melchiorri, M.; Corbane, C.; Freire, S.; Batista e Silva, F. Built-up areas are expanding faster than population growth: Regional patterns and trajectories in Europe. J. Land Use Sci. 2022, 17, 591–608. [Google Scholar] [CrossRef] [Scilit]
- Palacios-Lopez, D.; Esch, T.; MacManus, K.; Marconcini, M.; Sorichetta, A.; Yetman, G.; Zeidler, J.; Dech, S.; Tatem, A.J.; Reinartz, P. Towards an Improved Large-Scale Gridded Population Dataset: A Pan-European Study on the Integration of 3D Settlement Data into Population Modelling. Remote Sens. 2022, 14, 325. [Google Scholar] [CrossRef] [Scilit]
- Láng-Ritter, J.; Keskinen, M.; Tenkanen, H. Global gridded population datasets systematically underrepresent rural population. Nat. Commun. 2025, 16, 2170. [Google Scholar] [CrossRef] [Scilit] [PubMed]
- Bjelotomić Oršulić, O. Geospatial Analysis of Urban Population Model Discrepancies Through Land Use and the Built Environment. GitHub Repository. 2026. Available online: https://github.com/obo-code/population (accessed on 15 February 2026).

Disclaimer/Publisher’s Note: The statements, opinions and data contained in all publications are solely those of the individual author(s) and contributor(s) and not of MDPI and/or the editor(s). MDPI and/or the editor(s) disclaim responsibility for any injury to people or property resulting from any ideas, methods, instructions or products referred to in the content. |
© 2026 by the authors. Licensee MDPI, Basel, Switzerland. This article is an open access article distributed under the terms and conditions of the Creative Commons Attribution (CC BY) license.