


Abstract
This study combines low biochar loading with raster-path programming to control directional heat transport in extrusion-printed polymer composites. Here, bamboo-derived biochar was incorporated into thermoplastic polyurethane (TPU) to manufacture B-TPU composite filaments and fused deposition modeling (FDM)-printed heat-spreading structures. Biochar incorporation increased thermal conductivity in both measured directions, with a markedly greater enhancement in the in-plane (IP) direction. At 7.5 wt% biochar, the IP thermal conductivity increased from 0.23 W m−1 K−1 for neat TPU (N-TPU) to 1.06 W m−1 K−1, whereas the through-plane (TP) value increased from 0.20 to 0.38 W m−1 K−1, producing an effective IP/TP ratio of 2.79. The directly controlled raster and layered architecture governed this effective anisotropy, with the morphology of the dispersed biochar providing an additional contribution to heat-transfer-path continuity. In arrow-shaped specimens, the [0°, 0°] configuration produced a lower heated-tail temperature and a higher distal-arrowhead temperature than the [90°, 90°] configuration after 240 s, demonstrating more effective longitudinal heat spreading. In the finned demonstration, the [0°, 0°] B-TPU structure showed a base-to-fin temperature difference of 15.9 °C, compared with 33.5 °C for N-TPU under the same conditions. Finite-element analysis captured the observed temperature ordering and linked component-scale heat spreading to the measured directional thermal properties. Biochar incorporation also increased the apparent tensile modulus while reducing tensile strength and failure strain, with the largest losses at 7.5 wt% biochar. These results establish a sustainable additive-manufacturing strategy that combines renewable carbon filler content and raster-path design to program directional heat propagation in lightweight, geometrically customizable TPU structures.
1. Introduction
High-performance thermal-management materials are increasingly required for compact electronic systems [1,2,3], thermally regulated energy-storage components [4,5,6,7], and flexible or wearable devices [8]. Polymer-based materials are attractive for these applications because of their relatively low density and mechanical compliance [9,10], together with their electrical insulation capability [2,11]. Their compatibility with extrusion, coating, molding, and additive-manufacturing processes also enables the fabrication of components with complex and application-specific geometries [10,12,13]. However, most neat polymers possess intrinsically low thermal conductivity and therefore require compositional or structural modification before they can be used as effective heat-spreading materials.
The incorporation of thermally conductive fillers is one of the most widely used approaches for improving heat transport in polymer matrices. Metallic particles can provide high thermal conductivity but may increase composite density and compromise electrical insulation [14,15]. Electrically insulating ceramic fillers, particularly boron nitride and alumina, are frequently used when simultaneous heat conduction and electrical insulation are required [2,11,16,17]. Carbonaceous fillers such as graphene, carbon nanotubes, graphite, and other carbon particles can form highly conductive networks at suitable concentrations [3,14,18,19]. Nevertheless, substantial improvements in bulk composite thermal conductivity often require relatively high filler loadings. Such loadings can increase material cost and melt viscosity, hinder homogeneous dispersion and extrusion, reduce mechanical flexibility, and introduce voids or processing defects [2,11,14,15]. These limitations have motivated the exploration of lower-cost carbonaceous fillers and structural strategies capable of improving heat-transfer-pathway continuity at practically processable filler contents.
Biochar is a carbon-rich porous material produced through thermochemical conversion of biomass under oxygen-limited conditions. Its pore structure, carbonization degree, surface chemistry, particle morphology, and thermal stability depend strongly on feedstock composition, pyrolysis temperature, residence time, and post-treatment conditions [20,21]. Compared with highly processed nanocarbon fillers, biochar can provide advantages associated with abundant biomass resources, waste valorization, scalable preparation, and potentially lower cost and environmental burden [20,21]. Biochar has consequently been investigated as a functional filler in thermosetting and thermoplastic polymers [21,22]. In material-extrusion additive manufacturing, representative systems include recycled PET/biochar composites [23], polypropylene/biochar composites [24,25], PLA/biochar composites [26,27], and HDPE/biochar composites [22,28]. Studies on these systems have shown that biochar loading and particle characteristics can influence filament extrusion and printability [25,26,27,28], melt rheology [25,28], elastic modulus and tensile behavior [22,23,24,25,26,27,28], electrical conductivity [25,28], and thermal stability [25,28]. Recent reviews have further summarized the effects of feedstock, pyrolysis conditions, particle size, loading level, and compatibilization on the performance and sustainability of biochar-containing 3D-printing filaments [29,30]. These studies establish the processability and multifunctional potential of biochar/polymer filaments, but they do not by themselves demonstrate enhanced or direction-dependent thermal conductivity. Biochar has also been processed with TPU by FDM to produce nano-biochar/TPU films, although that work focused on mechanical, barrier, water-absorption, and mulching performance rather than directional thermal transport [31]. Separately, ball-milled biochar in biobased TPU has shown composition-dependent reinforcing behavior associated with filler morphology and preferential embedment within the polymer microstructure [32].
Biochar has also been investigated for regulating thermal transport in organic phase-change materials. Lv et al. incorporated rice-husk-derived biochar into paraffin, stearic acid, and polyethylene glycol and reported thermal-conductivity increases of 46%, 13.8%, and 27.1%, respectively, relative to the corresponding pristine matrices [4]. Xiong et al. further reported that the addition of 5 wt% garlic-stem-derived biochar increased the liquid-phase thermal conductivity of paraffin by 7.2% [5]. These findings demonstrate that biochar can improve heat transport in selected organic matrices. Nevertheless, the magnitude and even the direction of the change should not be generalized to all biochar/polymer systems because biochars produced from different feedstocks and pyrolysis conditions can possess substantially different carbon structures, porosities, surface chemistries, ash contents, and intrinsic thermal properties [20,21,22].
Heat is carried through the polymer and carbon framework and transferred across particle–matrix and particle–particle contacts. Compared with highly ordered graphite or graphene, biochar contains more structural disorder and pores, so its carbon content alone does not determine its contribution to heat conduction [14,20,21]. At low loading, elongated particles can shorten polymer-rich gaps and extend heat-transfer paths along deposited roads. This provides a route to directional enhancement without requiring a large filler volume fraction.
The effective thermal conductivity of a particle-filled polymer composite is governed not only by the intrinsic properties of its constituents but also by filler loading, dispersion, connectivity, orientation, interfacial thermal resistance, and void content [2,14,15,33]. In randomly dispersed composites, isolated particles, limited point contacts, and polymer-rich regions interrupt heat-transfer pathways, while particle–matrix interfaces and microscopic voids introduce additional thermal resistance. Consequently, interconnected and aligned filler architectures have been developed to improve pathway continuity and directional heat transport [33,34]. Examples include interconnected ceramic networks [16,17,35,36], aligned fillers [37], and architectures that improve carbon contacts or organize interfaces [18,19,38,39]. Representative strategies include three-dimensional ceramic pathways [35], vertically interconnected SiC nanowire networks [36], magnetically aligned diamond fillers [37], branched alumina networks [16], interconnected alumina spheres [17], compression-enhanced carbon contacts [18], bioinspired temperature-responsive structures [38], nacre-inspired layered architectures [39], and interface-localized graphene networks [19]. These studies establish the importance of network architecture in thermally conductive polymer composites; however, comparable continuous networks have not yet been demonstrated in biochar-filled thermoplastics.
The anisotropic structure inherited from biomass provides another possible route for regulating directional heat transport. Yang et al. prepared shape-stable phase-change composites by impregnating PEG6000 into anisotropic hemp-stem-derived biochar. The retained biochar scaffold produced direction-dependent thermal conductivity [6]. The thermal conductivities of CPCM-900 were 0.32 W m−1 K−1 in the radial direction and 0.29 W m−1 K−1 in the lateral direction, compared with 0.26 W m−1 K−1 for pure PEG6000 [6]. Direction-dependent heat transport has also been demonstrated in aligned cellulose-nanofiber/silver-nanowire phase-change composites, illustrating more broadly how oriented structures can regulate heat-transfer pathways [7]. Nevertheless, these phase-change composites retained a continuous macroscopic scaffold or intentionally assembled framework. The directional thermal behavior of thermoplastic composites containing ground and dispersed biochar particles remains much less understood.
Additive manufacturing provides an attractive route for constructing geometrically customizable thermal structures. Among the available techniques, fused deposition modeling (FDM), also known as fused filament fabrication, produces components through layer-by-layer deposition of thermoplastic filaments along prescribed raster paths [12,13]. Printing parameters and slicing strategies provide direct control over raster direction, layer sequence, infill pattern, and external component geometry [12,40]. Meanwhile, the arrangement of deposited filaments and the interfaces between adjacent rasters and successive layers generate a characteristic mesostructure that strongly influences mechanical and transport properties [40,41]. FDM therefore directly controls the macroscopic architecture of the deposited filaments, rather than necessarily providing precise control over the microscopic distribution of individual filler particles.
In addition to this macroscopic architectural effect, shear and converging flows within the extrusion nozzle may promote orientation of anisotropic fillers along the deposition direction. The extent of alignment, however, depends on filler geometry, loading, melt viscosity, nozzle dimensions, extrusion rate, and printing conditions [33,42,43,44]. Direct FDM studies have demonstrated the ability of printing-induced structural orientation to generate highly anisotropic thermal transport. Guo et al. reported a through-plane thermal conductivity of 12 W m−1 K−1 for a 3D-printed TPU composite containing 45 wt% graphene [42]. In a related BN/TPU system, a thermal conductivity of 6.45 W m−1 K−1 was achieved along the printing direction at a BN loading of 60 wt% [43]. Jing et al. similarly demonstrated that solid-state shear processing combined with FDM promoted graphene alignment and directional heat transport in polyethylene composites [44]. These studies establish the effectiveness of extrusion and printing-path design for regulating heat transport, but they predominantly rely on relatively high loadings of non-bio-derived fillers, which may adversely affect melt processability and mechanical compliance [2,12,13,14].
Previous studies have established the material-extrusion processing of biochar in PET, PP, PLA, HDPE, and TPU matrices [22,23,24,25,26,27,28,29,30]. However, direct quantitative comparisons the in-plane (IP) and through-plane (TP) thermal conductivities of FDM-printed biochar/polymer structures remain scarce, and prior biochar/TPU studies have not addressed raster-programmed component-scale heat spreading [31,32]. The central manufacturing question is therefore how biochar loading and toolpath-controlled deposited-road architecture jointly regulate directional heat transport while retaining filament processability and structural compliance.
In this study, bamboo-shaving-derived biochar was prepared by high-temperature pyrolysis and compounded with TPU through a two-step solution–extrusion route to produce FDM-printable B-TPU filaments. Material formulation, filament manufacturing, raster-path programming, direct IP/TP thermal-conductivity measurements, transient arrow and fin heat-spreading demonstrations, finite-element analysis, and tensile testing were combined to establish the relationships among processing, printed architecture, directional heat transport, and mechanical response. The main contribution is the link between low-loading bamboo-biochar formulations, measured directional conductivity, and raster-controlled heat redistribution in printed components.
2. Materials and Methods
2.1. Materials
Bamboo shavings were commercially purchased (Zhumeng Bamboo Inc., Xuancheng, China) and used as the raw material for biochar preparation. Thermoplastic polyurethane (TPU, 95A, white) was provided by Toprene Enterprise Co., Ltd. Dongguan, China, and N,N-dimethylformamide (DMF, analytical reagent grade, 96%) was purchased from Shanghai Aladdin Biochemical Technology Co., Ltd., Shanghai, China. Unless otherwise specified, all materials were used as received. The approximate molecular weight of the TPU was taken as 1.5 × 10⁶ g mol−1 based on our previous report [45]. Following the soft-segment description in the Materials Studio model of that study, a polyether-type structure is adopted here as a working assumption for discussing polymer–filler interactions. A density of 1.20 g cm−3 was used for N-TPU in the thermal simulations (Table S2).
2.2. Preparation of Biochar
The bamboo shavings were dried at 60 °C for 2 h to remove residual moisture and were subsequently placed in a tube furnace. Before heating, the furnace chamber was purged with nitrogen for 30 min. Under a continuous nitrogen flow, the temperature was increased from room temperature to 800 °C at a heating rate of 5 °C min−1 and maintained at 800 °C for 1 h. After pyrolysis, the furnace was allowed to cool to room temperature under nitrogen. The resulting bamboo-derived biochar was collected, manually ground using a mortar and pestle, and passed through a 400-mesh sieve. The sieved powder was stored under dry conditions before composite preparation.
2.3. Preparation of B-TPU Composite Filaments
TPU pellets were dissolved in DMF, and bamboo-derived biochar was dispersed in the TPU solution to obtain mixtures containing 0, 1.5, 3.0, and 7.5 wt% biochar. The mixtures were stirred for 12 h before drying at 80 °C for 2 h. The resulting composite films were cut into pieces and melt-compounded using a WLG-10G twin-screw extruder (Shanghai Xinshuo Precision Machinery Co., Ltd., Shanghai, China).
The extrudate was collected as a composite masterbatch and dried at 80 °C for 4 h. This solution blending was used to wet and pre-distribute the biochar in dissolved TPU before melt compounding. Drying incorporated the powder into polymer-rich films that could be fed to the extruder as a combined material. This sequence facilitates powder incorporation at low filler loadings, while the twin-screw step provides further mixing and forms the masterbatch.
The dried masterbatch was then processed using a D12 single-screw extruder (Shanghai Xinshuo Precision Machinery Co., Ltd., Shanghai, China) to obtain filaments for fused deposition modeling (FDM). During the single-screw filament-extrusion step, the screw speed was maintained at 30 rpm, and the four barrel zones from the hopper to the die were set to 150, 183, 195, and 200 °C, respectively. The extruded filament was cooled at room temperature and wound onto a spool. Its diameter was monitored and was maintained at 1.75 ± 0.10 mm. Importantly, together with the FDM nozzle temperature of 225 °C specified in Section 2.4, the final extrusion-zone settings of 195 and 200 °C define an operational melt-processing interval of approximately 195–225 °C. This interval describes the processing conditions used to obtain continuous filaments and printed structures, rather than a calorimetric melting transition.
2.4. Fabrication of FDM 3D-Printed B-TPU Samples
Three-dimensional models were designed in SolidWorks 2022 and sliced using ideaMaker software V5.2.4. Subsequently, printing was performed by an FDM 3D printer (Raise3D Pro2,Raise3D Technologies, Inc., Irvine, CA, USA) using a nozzle temperature of 225 °C, a printing speed of 10 mm s−1, a bed temperature of 60 °C, nominal 100% infill, and a layer height of 0.1 mm. Prior to printing, the B-TPU filament was dried at 60 °C for 6 h to prevent moisture-induced nozzle clogging. It should be noticed that nominal infill density is a slicer setting and does not imply that the printed part is free of voids. For adjacent roads, the signed gap is the center-to-center spacing minus the deposited-road width; negative values indicate overlap. This road-to-road gap is distinct from the overlap specified between infill and the outer walls.
For thermal-diffusivity measurements, specimens with final dimensions of 20 mm × 20 mm × 1 mm were printed in two build orientations (Figure S1). The in-plane (IP) configuration was designed so that the measurement direction was within the plane of the deposited layers, whereas the through-plane (TP) configuration placed the measurement direction normal to the deposited layers.
To experimentally evaluate the transient heat-spreading behavior, arrow-shaped specimens were fabricated from 7.5 wt% B-TPU with overall dimensions of approximately 30 mm × 20 mm × 1 mm (Figure S2). Three periodic stacking sequences were investigated: [0°, 0°], [0°, 90°], and [90°, 90°].
A finned structure was also fabricated to evaluate proof-of-concept heat-spreading behavior (Figure S3). The vertical backplate, hereafter referred to as the heat-sink base, measured 40 mm × 20 mm × 4 mm and was printed using the [0°, 0°] sequence. Each fin measured 20 mm × 20 mm × 1 mm and was printed using either [0°, 0°] or [90°, 90°] stacking. The lower edge of the backplate was placed in contact with the heating platform during testing. Therefore, heat initially propagated upward along the height of the backplate before spreading into the fins; it did not primarily travel across the 4 mm backplate thickness. The base geometry and base printing sequence were kept constant for all tested configurations.
2.5. Directional Heat-Spreading Measurements
To experimentally evaluate the heat transfer performance, the arrow-shaped specimen was placed on the test stage, and the output of a solar simulator (7IS0503A, Beijing Saifan Optoelectronic Instrument Co., Ltd., Beijing, China) was focused onto the tail region using a focusing lens. The local incident irradiance was adjusted to 0.40 W cm−2, as measured using a light-intensity monitor. An infrared camera (FLUKE TiS55+, Fluke Corporation, Everett, WA, USA) recorded the temperatures at the distal arrowhead and heated tail at 0.1 Hz during the 240 s heating period. The infrared data were processed using SmartView Classic version 4.4 and Origin 2024.
To further evaluate the heat transfer performance of B-TPU in the finned heat-spreading demonstration, the finned structures were placed with the lower edge of the base in contact with a heating plate (KT-25A, Kamjove, Guangdong Haili Group Co., Ltd., Chaozhou, China) and heated for 1500 s under fixed operating conditions. An infrared camera recorded the surface-temperature distribution, while a multichannel temperature recorder logged the temperatures at the heated base and distal fin positions. The infrared images were used to visualize the temperature distribution qualitatively, whereas the temperature–time curves were obtained from the multichannel recorder.
2.6. Numerical Simulations
A simplified finite-element model was established using the Heat Transfer Module of COMSOL Multiphysics V 6.2 to examine the qualitative influence of the assigned directional thermal properties on transient temperature distributions. The measured material properties listed in Tables S1 and S2 were assigned to homogeneous orthotropic domains, and the same simplified natural-convection boundary condition was applied to the exposed surfaces of all configurations.
For arrow-shaped structures, the heating source located in the tail region was applied with a prescribed heat-flux boundary of 0.40 W cm−2. For the finned structure, an estimated heat-flux boundary of 0.08 W cm−2 was applied to the heated lower region of the base. Because the two transverse directions both contained printed interfaces, ky and kz were approximated as equal in the simplified model. The model assigned the measured higher conductivity to the raster direction and the lower conductivity to the two transverse directions to examine the qualitative influence of raster orientation.
The model was designed for comparative analysis of printing configurations. It incorporated the dominant measured anisotropy and common thermal boundary conditions while excluding local thermal contact resistance, deposited-road-scale voids, and spatial variations in absorptivity and emissivity. These factors were considered when interpreting quantitative differences between simulation and experiment.
2.7. Characterizations
The surface morphology of all samples was examined using a field-emission scanning electron microscope (FE-SEM, SU8020, Hitachi, Hitachi-shi, Japan) operated at an accelerating voltage of 10 kV.
X-ray diffraction (XRD) analysis was conducted to investigate the phase structure and carbon ordering of the materials in the three sample types: N-TPU, B-TPU, and biochar. Measurements were performed using a PANalytical X-ray diffractometer (X’Pert, Malvern Panalytical B.V., Almelo, Netherlands), operated at 40 kV and 40 mA. The scanning range was set from 10° to 80° (2θ) with a scan rate of 10°/min.
To investigate the evolution of organic functional groups during high-temperature thermochemical conversion, Fourier-transform infrared spectroscopy (Nicolet iS50R, Thermo Fisher Scientific Inc., Waltham, MA, USA) was employed to analyze both the raw bamboo precursor and the resulting biochar.
The rheological behavior of B-TPU composites with varying biochar loadings was characterized at 230 °C. Disk-shaped samples with a diameter of 8 mm and a thickness of 1 mm were used to measure the complex viscosity, storage modulus, and loss modulus.
The thermal conductivity of the samples was calculated from thermal diffusivity, specific heat capacity, and density. Thermal diffusivity was measured using laser flash analyzer (LFA 457, NETZSCH-Gerätebau GmbH, Selb, Germany). Specific heat capacity was determined by differential scanning calorimetry (DSC 214) at a heating rate of 5 °C min−1 over a temperature range of −10 to 50 °C. Density was obtained via the liquid-displacement method based on Archimedes’ principle. The thermal conductivity (k) was then calculated using the following equation:
where k was the thermal conductivity, α was the thermal diffusivity, ρ was the density, and cp was the specific heat capacity.
k = cp ⋅ ρ ⋅ α
Thermogravimetric analysis to evaluate the composition and thermal stability of various composites (TGA2, Mettler-Toledo GmbH, Greifensee, Switzerland). Approximately 10 mg of each sample was heated from room temperature to 800 °C under nitrogen atmosphere at the rate of 10 °C/min. The residual weights of the different samples were subsequently carefully measured.
UV-Vis-NIR absorbance spectra were recorded using a UV-3600 spectrophotometer over 400–1000 nm. Samples were ultrasonically dispersed in DMF at 0.1 mg mL−1 and magnetically stirred for 3 h before measurement.
Uniaxial tensile tests were performed on FDM-printed N-TPU and B-TPU specimens using a universal testing machine (AGS-X2kN, Shimadzu Corp., Kyoto, Japan) at a crosshead speed of 50 mm/min, based on ISO 37 [46]. Dumbbell-shaped specimens had an overall length of 75 mm, a width of 12.5 mm at the enlarged ends, a narrow-section width of 7.5 mm, and a thickness of 2 mm. The specimens were printed with [0°, 0°] and [90°, 90°] raster orientations to evaluate the influence of printing direction on tensile behavior. At least three independently printed specimens were tested for each composition and printing orientation. Tensile strength was defined as the maximum engineering stress, failure strain was obtained from the strain at specimen failure, and the apparent tensile modulus was determined from the slope of the engineering stress–strain curve over the strain range of 1–5%. The apparent tensile modulus and tensile strength are reported as the mean ± standard deviation.
3. Results and Discussion
3.1. Preparation and Characterization of Bamboo-Derived Biochar and B-TPU Composite Filaments
Figure 1a illustrates the preparation of bamboo-derived biochar and its subsequent incorporation into thermoplastic polyurethane (TPU) to produce composite filaments for fused deposition modeling (FDM). Briefly, bamboo shavings were pyrolyzed at 800 °C for 60 min under a continuous nitrogen atmosphere, using a heating rate of 5 °C min−1. Nitrogen purging before and during pyrolysis minimized oxidation of the biomass and the resulting carbonaceous product. The obtained biochar was subsequently ground and passed through a 400-mesh sieve to obtain a particle fraction suitable for composite processing.
Figure 1.
Preparation and characterization of bamboo-derived biochar and B-TPU composite filaments. (a) Schematic illustration of the preparation of bamboo-derived biochar and B-TPU composites with different biochar loadings. (b) Photograph of an extruded B-TPU filament prepared for fused deposition modeling (FDM). (c) Cross-sectional scanning electron microscopy (SEM) image of the extruded 7.5 wt% B-TPU filament. SEM images of biochar (d) after pyrolysis, (e) after grinding, and (f) after grinding and sieving through a 400-mesh screen. (g) X-ray diffraction (XRD) patterns of bamboo-derived biochar, neat TPU (N-TPU), and the 7.5 wt% B-TPU filament. (h) Fourier-transform infrared (FTIR) spectra of the raw bamboo precursor and the resulting biochar. Frequency-dependent (i) storage modulus, (j) loss modulus, and (k) complex viscosity of N-TPU and B-TPU composites containing different biochar loadings.
The sieved biochar was incorporated into TPU at loadings of 1.5, 3.0, and 7.5 wt%. TPU without biochar was processed using the same procedure and is denoted N-TPU. Biochar and TPU were first mixed in DMF to promote the predispersion of biochar before melt compounding. After solvent removal, the resulting composite films were cut into smaller pieces and processed using a twin-screw extruder to produce a composite masterbatch. The dried masterbatch was then extruded using a single-screw extruder, cooled, and wound onto a spool. Continuous B-TPU filaments with a diameter of 1.75 ± 0.10 mm were obtained at all investigated biochar loadings (Figure 1b).
Figure 1c shows the cross-section of the extruded 7.5 wt% B-TPU filament. No large cavities were evident within the selected field of view, and biochar-containing regions appeared embedded in the TPU matrix. This morphology was consistent with the successful fabrication of a continuous composite filament. However, the selected image does not provide a quantitative assessment of the overall biochar dispersion or interfacial adhesion.
The morphological changes introduced by grinding and sieving are presented in Figure 1d–f. The as-prepared biochar consisted of irregular particles with residual fibrous and ribbon-like features. Grinding fragmented the larger biochar pieces, whereas subsequent sieving selected a finer particle fraction while retaining a considerable proportion of elongated fragments. It is interesting that these processing steps altered the projected size and shape distributions of the biochar particles. It should be noticed that these powder images were obtained before incorporation into TPU, and the elongated shape was therefore already present before filament extrusion and printing.
Two-dimensional image analysis yielded apparent mean aspect ratios of 1.41 ± 0.33 for the as-prepared biochar, 1.82 ± 0.42 after grinding, and 3.47 ± 1.80 after sieving. The change primarily reflected mechanical fragmentation and the shape-selective effect of sieving. Because the values were obtained from two-dimensional SEM projections, they represent projected rather than true three-dimensional aspect ratios. Additional SEM observations at different magnifications (Figure S4) showed that the processed biochar retained fibrous or ribbon-like morphological features, suggesting partial preservation of the anisotropic architecture inherited from the bamboo precursor. Such elongated particles could favor extended particle–particle contact if preferentially oriented during extrusion or printing. However, the present SEM images do not quantitatively establish particle orientation or the formation of continuous face-to-face thermal-conduction networks in the printed composite.
The XRD patterns of bamboo-derived biochar, N-TPU, and the 7.5 wt% B-TPU filament are shown in Figure 1g. The biochar exhibited a broad diffraction feature at approximately 2θ = 24° and a weaker feature near 2θ = 43°, commonly associated with the (002) and (100) reflections, respectively, of disordered or turbostratic carbon. The broadness of these features indicates limited short-range carbon ordering rather than a highly graphitized structure. Therefore, the XRD results support the formation of a predominantly disordered carbonaceous framework after pyrolysis but do not demonstrate a high degree of graphitization. N-TPU displayed a broad diffraction halo without distinct sharp peaks, indicating that the TPU was predominantly amorphous under the investigated conditions. The pattern of the 7.5 wt% B-TPU filament contained the broad features associated with both TPU and biochar. No additional sharp diffraction peaks were observed, suggesting that composite processing did not generate a new crystalline phase detectable by XRD.
FTIR spectroscopy was used to compare the chemical structures of the raw bamboo precursor and the pyrolyzed biochar (Figure 1h). The raw bamboo spectrum contained prominent bands at 3023, 1684, 1557, 1195, and 793 cm−1. These bands were associated with vibrations arising from hydroxyl or C–H-containing groups, carbonyl and aromatic structures, C–O bonds, and aromatic C–H groups in the lignocellulosic precursor. Following pyrolysis, most of these bands were markedly attenuated, especially those associated with oxygen-containing functional groups. This decrease was consistent with extensive devolatilization, dehydration, and deoxygenation during high-temperature carbonization. Together, the FTIR and XRD results support the conversion of bamboo into a carbon-rich, predominantly disordered biochar.
The optical attenuation of N-TPU and 7.5 wt% B-TPU was qualitatively compared using samples prepared in DMF at a concentration of 0.1 mg mL−1 (Figure S5). The B-TPU sample exhibited higher apparent absorbance over the measured wavelength range than N-TPU. At 500 nm, its absorbance was 0.270, approximately 3.4 times the value measured for N-TPU (0.079). This difference was mainly associated with the broadband light attenuation introduced by the carbonaceous biochar particles. Because the measurements were performed on dilute DMF dispersions rather than solid printed specimens, they provide only qualitative evidence of increased optical attenuation and are not interpreted as the solid-state absorptance or photothermal-conversion efficiency of B-TPU.
The melt-rheological behavior of N-TPU and the B-TPU composites was investigated at 230 °C to assess their response under oscillatory deformation (Figure 1i–k). For all formulations, both the storage modulus (G’) and loss modulus (G’’ increased with increasing angular frequency, whereas the complex viscosity (η) decreased continuously. The decrease in η with frequency describes the frequency-dependent melt response under oscillatory deformation. Across most of the investigated frequency range, N-TPU exhibited a higher storage modulus and complex viscosity than the biochar-containing composites, and these values generally decreased as the biochar loading increased. Differences in loss modulus were less pronounced, particularly at higher frequencies, where the curves tended to converge.
These results indicate that the incorporation of up to 7.5 wt% biochar did not produce a strong rheologically percolated filler network under the tested conditions. The reduction in melt viscoelasticity may reflect changes in TPU-chain interactions, composite morphology, or residual processing effects, but the current measurements do not distinguish among these possible mechanisms. The observed melt response was compatible with extrusion-based processing, consistent with the successful production of continuous filaments and stable FDM processing at biochar loadings up to 7.5 wt%.
Changes in molecular weight during processing may also contribute to the lower TPU viscosity. For example, moisture introduced during melt compounding with a filler has been reported to reduce the viscosity and elasticity of a TPU composite through hydrolysis [47]. Figure S6 presents the TGA curves of filaments containing 0, 1.5, 3.0, and 7.5 wt% biochar. The curves show broadly similar main mass-loss profiles, while the residual mass at 800 °C increases with biochar loading. This trend is consistent with a contribution from biochar-derived residue; however, these TGA results do not exclude molecular-weight changes introduced during processing. The rheological results are therefore interpreted as processing behavior without assigning the viscosity decrease to a single mechanism.
3.2. Orientation-Dependent Thermal Conductivity of FDM-Printed B-TPU Composite Structures
To evaluate the effect of FDM-induced architecture on thermal transport, B-TPU specimens were printed in two configurations for thermal-conductivity measurements (Figure 2a,b). In the IP configuration, the measurement direction lay within the plane of the deposited layers, whereas in the TP configuration, heat flow was normal to the layer plane and therefore crossed successive printed layers. These definitions describe the direction of thermal-conductivity measurement relative to the printed architecture rather than two intrinsic phases of the composite. During FDM processing, B-TPU filaments with a diameter of 1.75 ± 0.10 mm were fed through a heated nozzle and deposited along paths defined by the slicing software ideaMaker V5.2.4. The printing path, build orientation, and layer-stacking sequence were controlled to produce the IP and TP specimen configurations shown in Figure 2b. Consequently, the measured thermal conductivities represent the effective properties of the as-printed structures, including the contributions of the TPU matrix, biochar particles, deposited roads, inter-road contacts, layer interfaces, and printing-induced voids.
Figure 2.
Orientation-dependent thermal conductivity of FDM-printed B-TPU composite structures. (a) Schematic illustration of the fused deposition modeling (FDM) process. (b) Schematic illustration of the printing strategies used to prepare specimens for thermal-conductivity measurements in the in-plane (IP) and through-plane (TP) directions. (c) Cross-sectional scanning electron microscopy (SEM) image of the FDM-printed 7.5 wt% B-TPU composite. (d) Higher-magnification SEM image of the region outlined in (c), showing biochar-containing regions embedded within the TPU matrix. (e) IP and TP thermal conductivities of B-TPU composites with different biochar loadings. Data are presented as the mean ± standard deviation.
The cross-sectional SEM image in Figure 2c shows the characteristic layered morphology produced by FDM. Boundaries between adjacent deposited roads and layers remained discernible in the printed structure. At higher magnification (Figure 2d), biochar-containing regions were observed within the TPU matrix, and some particles retained irregular, elongated, or flake-like features after grinding, filament extrusion, and FDM processing. No large-particle agglomerates were evident within the selected field of view. The SEM images confirm the layered printed architecture and show irregular or elongated biochar-containing regions within the TPU matrix, but they do not quantify particle orientation within individual deposited roads.
As shown in Figure 2e, thermal conductivity increased monotonically with increasing biochar content in both measurement directions. The IP thermal conductivity increased from 0.23 W m−1 K−1 for N-TPU to 1.06 W m−1 K−1 for the composite containing 7.5 wt% biochar, corresponding to an approximately 4.6-fold increase. Over the same composition range, the TP thermal conductivity increased from 0.20 to 0.38 W m−1 K−1, representing an approximately 1.9-fold increase. Thus, biochar incorporation produced a substantially larger enhancement in the IP direction than in the TP direction. Based on the mean thermal-conductivity values, the effective IP/TP conductivity ratio increased from approximately 1.15 for N-TPU to 2.79 for the 7.5 wt% B-TPU composite. The modest directional difference observed for N-TPU indicates that the FDM architecture itself introduced a degree of thermal anisotropy, even in the absence of biochar. The progressive increase in the IP/TP ratio with biochar loading indicates that the addition of biochar amplified the orientation-dependent heat-transport behavior of the printed structures. Because the IP and TP values were obtained from separately printed configurations, the IP/TP ratio represents the effective anisotropy of the printed structures rather than the intrinsic anisotropy of the biochar.
The overall increase in thermal conductivity was consistent with the incorporation of a carbonaceous dispersed phase and the reduced average separation between biochar particles at higher filler loadings, which increased the likelihood of particle-mediated heat-transfer pathways [14,33]. The comparatively large increase in IP thermal conductivity from 3.0 to 7.5 wt% is consistent with improved particle connectivity, although the present composition series does not define a percolation threshold. Partial orientation of elongated or flake-like biochar particles during extrusion may have contributed to the stronger IP enhancement. The directional response is therefore attributed primarily to the deposited-road and layered architecture, with particle orientation regarded as a possible secondary contribution [42,43]. Heat transfer in the IP configuration could proceed more readily along the deposited roads and within the layer plane. By contrast, TP heat flow crossed multiple layer and road interfaces, where imperfect contact and local voids could provide additional thermal resistance. This interpretation is consistent with the layered morphology visible in Figure 2c and with previously reported orientation-dependent heat transport in FDM-printed thermally conductive composites [42,43].
Air-filled voids reduce heat conduction by interrupting solid pathways and decreasing the contact area between adjacent roads. Layer deposition can improve contact while the underlying material remains warm, but this also depends on road geometry and cooling. For scale, the self-weight pressure beneath a 20 mm column with a density of 1200 kg m−3 is approximately 0.24 kPa. The SEM sections do not establish a porosity gradient caused by the weight of later layers.
As for the N-TPU specimens already show an IP/TP ratio of 1.15, which provide a filler-free reference for the printed architecture. A spherical-carbon control would help separate particle-shape effects, provided filler volume fraction, size, surface chemistry, and printing conditions were also matched. The present comparison establishes the combined effect of biochar addition and raster architecture.
3.3. Directional Heat-Spreading Behavior of Arrow-Shaped B-TPU Structures with Different Raster-Stacking Configurations
Based on the orientation-dependent thermal conductivity observed in Figure 2e, the effect of raster stacking on transient heat spreading was further investigated using arrow-shaped specimens fabricated from 7.5 wt% B-TPU. Three stacking configurations were compared: (∥) [0°, 0°], (+) [0°, 90°], and (⊥) [90°, 90°]. Here, 0° denotes a deposited-road direction parallel to the longitudinal axis of the arrow, whereas 90° denotes a direction perpendicular to that axis. For the [0°, 90°] configuration, the two raster directions were alternated between successive layers. As illustrated in Figure 3a, simulated solar irradiation was localized at the tail of each arrow-shaped specimen at an incident irradiance of 0.40 W cm−2, and the surface-temperature distribution was monitored using an infrared camera for 240 s. Because all specimens had the same composition, external geometry, and nominal irradiation conditions, their temperature responses were primarily compared to evaluate the effect of raster stacking. Nevertheless, differences in surface texture, local absorptance, and effective infrared emissivity among the printing configurations may also have influenced the measured surface temperatures.
Figure 3.
Experimental characterization of transient heat spreading in arrow-shaped B-TPU structures with different raster-stacking configurations. (a) Schematic illustration of the localized-irradiation experiment. Temperature evolution at the (b) distal arrowhead and (c) irradiated tail under simulated solar irradiation at an incident irradiance of 0.40 W cm−2. (d) Schematic illustration of the deposited-road arrangements in the (∥) [0°, 0°], (+) [0°, 90°], and (⊥) [90°, 90°] configurations. A raster angle of 0° is parallel to the longitudinal arrow axis, whereas 90° is perpendicular to it. (e) Infrared thermal images recorded at 10, 60, 120, 180, and 240 s under the same nominal irradiation conditions (a fixed 10–80 °C scale was applied to all infrared images; pixels above 80 °C are displayed at the upper color limit).
The temperature profiles recorded at the distal arrowhead and irradiated tail are presented in Figure 3b and Figure 3c, respectively. At the irradiated tail, the temperature increased rapidly after illumination, indicating localized conversion of the incident energy into heat. Heat subsequently spread from the irradiated region toward the arrowhead, resulting in a gradual temperature increase at the distal end. The experiment was used to compare transient heat-spreading behavior among the raster configurations rather than to quantify photothermal-conversion efficiency. At the arrowhead, all three specimens exhibited a gradual temperature increase during irradiation. After 240 s, the (∥) [0°, 0°] configuration reached the highest head temperature of 28.3 °C, followed by the (+) [0°, 90°] configuration at 27.5 °C and the (⊥) [90°, 90°] configuration at 25.8 °C. The pairwise temperature differences were 0.8 °C between the [0°, 0°] and [0°, 90°] configurations and 1.7 °C between the [0°, 90°] and [90°, 90°] configurations. The overall difference between the [0°, 0°] and [90°, 90°] configurations was 2.5 °C. A stronger dependence on raster stacking was observed at the directly irradiated tail. After 240 s, the (⊥) [90°, 90°] configuration exhibited the highest tail temperature of 120.5 °C, followed by the (+) [0°, 90°] configuration at 109.0 °C and the (∥) [0°, 0°] configuration at 100.3 °C. The corresponding differences were 11.5 °C between the [90°, 90°] and [0°, 90°] configurations and 8.7 °C between the [0°, 90°] and [0°, 0°] configurations. The total difference between the [90°, 90°] and [0°, 0°] configurations was 20.2 °C. The opposite ordering of the head and tail temperatures provides evidence of different heat-spreading behaviors. The [0°, 0°] specimen exhibited the highest temperature at the distal head and the lowest temperature at the irradiated tail, consistent with more rapid redistribution of heat along the longitudinal direction. Conversely, the [90°, 90°] specimen retained more heat near the irradiated tail while producing the lowest temperature rise at the head, indicating more restricted longitudinal heat spreading. The [0°, 90°] specimen showed an intermediate response.
The structural basis of these differences is illustrated schematically in Figure 3d. In the [0°, 0°] configuration, the deposited roads were oriented parallel to the longitudinal heat-spreading direction. This arrangement provided comparatively continuous paths along individual deposited roads, although interfaces between adjacent roads and layers remained present. In the [90°, 90°] configuration, the roads were oriented transverse to the arrow axis. Consequently, longitudinal heat flow crossed multiple interfaces between adjacent deposited roads within each layer, which could increase the effective thermal resistance. The [0°, 90°] architecture alternated between these two arrangements and therefore exhibited an intermediate effective response. Because the number and thickness of printed layers were nominally similar, the difference was more consistently associated with the greater number of inter-road crossings along the longitudinal heat-spreading direction in the [90°, 90°] configuration.
The infrared images captured at 10, 60, 120, 180, and 240 s are shown in Figure 3e. In each configuration, the high-temperature region developed first at the irradiated tail and then expanded toward the arrowhead. The [0°, 0°] configuration produced the most extended longitudinal temperature field, the [90°, 90°] configuration retained the strongest heat localization near the tail, and the [0°, 90°] specimen showed an intermediate distribution. Although the absolute arrowhead-temperature separations were small, the consistent ordering of both the distal and heated-region curves, together with the spatial evolution of the thermal field, demonstrates raster-dependent redistribution of heat within the printed structures.
To determine whether the observed temperature ordering could be reproduced by a simplified orthotropic heat-transfer model, finite-element simulations were conducted using the parameters summarized in Table S1. The experimentally measured IP and TP thermal conductivities were assigned to the corresponding principal directions of the model. For the [0°, 90°] configuration, the alternating raster layers were represented using homogenized in-plane thermal properties. Because the orientation-dependent thermal-conductivity tensors were prescribed using the experimental IP and TP values, the simulations did not independently predict the emergence of thermal anisotropy from the printed microstructure. Instead, they examined the temperature distributions expected from the assumed mapping between raster orientation and effective thermal conductivity.
The simulated temperature maps at 10, 60, 120, 180, and 240 s are shown in Figure 4a. For all configurations, the high-temperature region initially appeared at the heated tail and gradually extended toward the arrowhead. The [0°, 0°] model produced more rapid temperature propagation along the longitudinal direction, whereas the [90°, 90°] model retained a larger fraction of the heat near the tail. The [0°, 90°] configuration again showed an intermediate response. Figure 4b presents the simulated temperature evolution at the arrowhead. After 240 s, the calculated head temperatures were approximately 31.0 °C for the [0°, 0°] configuration, 27.7 °C for the [0°, 90°] configuration, and 22.4 °C for the [90°, 90°] configuration. The corresponding differences were 3.3 °C between [0°, 0°] and [0°, 90°], 5.3 °C between [0°, 90°] and [90°, 90°], and 8.6 °C between [0°, 0°] and [90°, 90°]. The simulated tail-temperature profiles are presented in Figure 4c. After 240 s, the [90°, 90°] configuration reached approximately 118.0 °C, followed by the [0°, 90°] configuration at 106.2 °C and the [0°, 0°] configuration at 99.6 °C. The calculated differences were 11.8 °C between [90°, 90°] and [0°, 90°], 6.6 °C between [0°, 90°] and [0°, 0°], and 18.4 °C between [90°, 90°] and [0°, 0°].
Figure 4.
Qualitative finite-element analysis of transient heat transfer in arrow-shaped B-TPU structures with different raster-stacking configurations. (a) Simulated temperature maps at 10, 60, 120, 180, and 240 s (a fixed 25–105 °C scale was applied to all temperature maps; pixels above 105 °C are displayed at the upper color limit). Simulated temperature evolution at the (b) arrowhead and (c) heated tail for the (∥) [0°, 0°], (+) [0°, 90°], and (⊥) [90°, 90°] configurations. The indicated ΔT values represent the temperature differences between configurations after 240 s.
The model reproduced the experimentally observed temperature ordering: the [0°, 0°] configuration transported heat farther toward the arrowhead and maintained a lower temperature at the heated tail, whereas the [90°, 90°] configuration produced greater heat accumulation near the source. This agreement supports the structure–property mapping between raster direction, measured directional conductivity, and component-scale heat spreading. Because the measured IP and TP conductivities were model inputs and the external boundaries were simplified, the comparison validates the mapped thermal response rather than constituting an independent measurement of anisotropy.
3.4. Heat-Spreading Behavior of Finned B-TPU Structures
Based on the orientation-dependent heat-spreading behavior observed in the arrow-shaped specimens, finned B-TPU and N-TPU structures were fabricated to compare internal heat propagation from the heated base toward the distal fin regions. The experimental configuration is illustrated in Figure 5a, while the dimensions and printing orientations of the assembled structures are shown in Figure 5b and Figure S3. The vertical backplate, hereafter referred to as the base, was printed using the [0°, 0°] raster-stacking configuration for all samples. This base configuration was held constant to provide a common structural background. Fins fabricated using either [0°, 0°] or [90°, 90°] stacking were then attached to the base. In the [0°, 0°] fin configuration, the deposited roads were oriented predominantly along the intended heat-spreading direction from the base–fin junction toward the distal fin region; in the [90°, 90°] configuration, the roads were oriented transverse to that direction.
Figure 5.
Experimental evaluation of heat spreading in finned N-TPU and B-TPU structures. (a) Schematic illustration of the heating and temperature-monitoring setup. (b) Geometry and assembly of the finned structure, with the base printed using a constant [0°, 0°] raster-stacking configuration and the fins printed using either [0°, 0°] or [90°, 90°] stacking. (c–f) Photographs and corresponding infrared thermal images of N-TPU and 7.5 wt% B-TPU structures recorded at 50, 300, 600, 1200, and 1500 s. (g–j) Temperature evolution at the heated base region and distal fin monitoring position for the four material–orientation combinations. Infrared images are presented as qualitative temperature-distribution maps; the quantitative temperature curves in (g–j) were obtained using contact temperature sensors.
Heat-sink-shaped structures were fabricated from N-TPU and 7.5 wt% B-TPU and placed with the lower edge of the base in contact with a temperature-controlled heating platform. Each structure was heated continuously for 1500 s. Heat therefore propagated upward along the 40 mm height of the base and subsequently into the attached fins. It did not primarily pass through the 4 mm thickness of the base. The effects of material composition and fin raster orientation were evaluated by monitoring temperatures at the heated base region and the designated distal fin location.
The infrared images recorded at 50, 300, 600, 1200, and 1500 s are shown in Figure 5c–f. In all configurations, the heated region initially developed near the lower portion of the base and progressively extended toward the upper and distal regions of the fins. The B-TPU structures displayed a broader apparent temperature distribution than the corresponding N-TPU structures, consistent with more extensive heat spreading after biochar incorporation. Among the B-TPU specimens, the [0°, 0°] fin configuration showed a somewhat more extended temperature field along the nominal fin heat-spreading direction than the [90°, 90°] configuration. Because N-TPU and B-TPU differ in color and surface emissivity, the infrared images are used only as qualitative visualizations. The quantitative temperature–time curves were obtained from the contact temperature sensors connected to the multichannel recorder.
For the B-TPU structure with [0°, 0°] fins, the temperatures at both monitoring positions increased rapidly during the initial heating period and then changed more gradually (Figure 5g). After 1500 s, the base temperature reached approximately 52.0 °C, while the distal fin temperature reached 36.1 °C, giving a base-to-fin temperature difference of 15.9 °C. The relatively small temperature gradient was consistent with heat being distributed from the heated base region toward the fins. The B-TPU structure with [90°, 90°] fins exhibited a base temperature of approximately 53.6 °C and a distal fin temperature of 34.6 °C after 1500 s (Figure 5h), corresponding to a temperature difference of 19.0 °C. Relative to the [0°, 0°] B-TPU structure, the [90°, 90°] structure had a 1.6 °C higher base temperature, a 1.5 °C lower fin temperature, and a 3.1 °C larger base-to-fin temperature difference. This ordering was consistent with more effective heat propagation when the deposited roads were oriented along the nominal fin heat-spreading direction. However, because the 3.1 °C difference between the two B-TPU fin orientations was modest, it is discussed as a qualitative orientation trend. A much larger difference was observed between the B-TPU and N-TPU structures. For N-TPU with [0°, 0°] fins, the base temperature reached approximately 61.1 °C after 1500 s, whereas the distal fin temperature reached only 27.6 °C, producing a temperature difference of 33.5 °C (Figure 5i). For N-TPU with [90°, 90°] fins, the corresponding base and fin temperatures were approximately 63.7 and 27.0 °C, respectively, resulting in a temperature difference of 36.7 °C (Figure 5j). At the same [0°, 0°] fin orientation, incorporation of 7.5 wt% biochar decreased the base temperature by approximately 9.1 °C and increased the distal fin temperature by approximately 8.5 °C relative to N-TPU. The base-to-fin temperature difference consequently decreased from 33.5 to 15.9 °C. Similar differences were observed for the [90°, 90°] structures: B-TPU exhibited a base temperature approximately 10.1 °C lower and a fin temperature approximately 7.6 °C higher than those of N-TPU, while the base-to-fin temperature difference decreased from 36.7 to 19.0 °C.
These comparisons indicate that material composition exerted a substantially greater effect than fin raster orientation under the tested conditions. The smaller base-to-fin temperature gradients of the B-TPU structures were consistent with the higher effective thermal conductivity measured after biochar incorporation and with more extensive redistribution of heat from the heated base toward the fins. The slightly smaller gradient obtained with [0°, 0°] fins was also consistent with the orientation-dependent thermal conductivity reported in Figure 2e.
The smaller base-to-fin temperature differences are interpreted as indicators of more uniform internal heat redistribution rather than as quantitative measures of cooling power or device-level thermal resistance. In addition, thermal contact resistance at the heating-platform/base and base/fin interfaces may have contributed to the measured temperature gradients. The observed orientation effect can be attributed most directly to the deposited-road architecture. In the [0°, 0°] fins, heat could propagate more readily along the printed roads, whereas heat flow in the [90°, 90°] fins crossed a greater number of inter-road boundaries. The current experiment does not establish that biochar particles themselves were aligned within the fins. Accordingly, the orientation effect is assigned primarily to the deposited-road architecture rather than to confirmed alignment of the biochar particles.
To extend the experimentally established composition- and orientation-dependent thermal response to the finned geometry, finite-element simulations were performed for the N-TPU and 7.5 wt% B-TPU structures. The material parameters are summarized in Table S2, and the simulations map the measured directional properties onto the local raster coordinate system of the base and fins.
The simulated temperature fields at 50, 300, 600, 1200, and 1500 s are shown in Figure 6a. In all cases, heat propagated from the heated lower region of the base toward the distal fin regions. The B-TPU models produced more extensive heat spreading than the N-TPU models. Within each material, the model assigned higher effective conductivity along the heat-spreading direction of the [0°, 0°] fins than that of the [90°, 90°] fins and therefore produced a smaller predicted base-to-fin temperature gradient for the [0°, 0°] configuration.
Figure 6.
Qualitative finite-element analysis of heat transfer in finned N-TPU and B-TPU structures. (a) Simulated temperature distributions at 50, 300, 600, 1200, and 1500 s for 7.5 wt% B-TPU and N-TPU structures with [0°, 0°] or [90°, 90°] fin raster-stacking configurations (a fixed 20–70 °C scale was applied to all temperature maps; pixels above 70 °C are displayed at the upper color limit). (b–e) Simulated temperature evolution at the heated base and distal fin monitoring positions for the four material–orientation combinations.
For the B-TPU model with [0°, 0°] fins, the base and distal fin temperatures after 1500 s were approximately 56.6 and 40.0 °C, respectively, giving a temperature difference of 16.6 °C (Figure 6b). For the B-TPU model with [90°, 90°] fins, the corresponding temperatures were approximately 66.2 and 32.9 °C, resulting in a much larger difference of 33.3 °C (Figure 6c). The N-TPU model with [0°, 0°] fins reached a base temperature of approximately 74.0 °C and a distal fin temperature of 25.8 °C, giving a temperature difference of 48.2 °C (Figure 6d). For N-TPU with [90°, 90°] fins, the base and distal fin temperatures were approximately 75.7 and 24.8 °C, respectively, corresponding to a temperature difference of 50.9 °C (Figure 6e). Thus, the model produced the same general ordering as the experiment: B-TPU showed more extensive heat propagation toward the fins than N-TPU, and the [0°, 0°] fin arrangement produced a smaller axial temperature gradient than the [90°, 90°] arrangement.
However, appreciable quantitative differences were observed between the simulations and experiments. For the [90°, 90°] B-TPU structure, the experimentally measured base-to-fin temperature difference was 19.0 °C, whereas the simulated difference was 33.3 °C. The model therefore overestimated both the absolute gradient and the influence of raster orientation in this configuration. The experimental change in the B-TPU base-to-fin temperature difference between [0°, 0°] and [90°, 90°] was only 3.1 °C, compared with a simulated change of 16.7 °C. The model also overestimated the base-to-fin gradients for both N-TPU configurations.
Quantitative discrepancies were attributed to the homogeneous orthotropic approximation, simplified heat-input and boundary conditions, and omission of local contacts, voids, and deposited-road geometry. The model reproduced the general composition- and orientation-dependent ordering but was not used as a quantitative prediction.
Overall, the finned demonstrators show that biochar incorporation substantially promotes heat redistribution from the heated base toward the fins, while raster orientation provides an additional means of directing the preferred heat-spreading pathway. The printed structures therefore offer a lightweight and geometrically customizable platform for directional heat spreading in low-power, flexible, or shape-constrained components where structural adaptability and low density are central design requirements.
3.5. Tensile Properties of FDM-Printed B-TPU Composites
Tensile tests were conducted on FDM-printed N-TPU and B-TPU specimens containing 0, 1.5, 3.0, and 7.5 wt% biochar. Two raster-stacking configurations, [0°, 0°] and [90°, 90°], were investigated to evaluate the combined effects of biochar content and deposited-road orientation on tensile behavior. In the [0°, 0°] configuration, the deposited roads were parallel to the tensile loading direction, whereas in the [90°, 90°] configuration, they were perpendicular to it. Representative engineering stress–strain curves are shown in Figure 7a,b. The corresponding apparent tensile modulus and tensile strength values are summarized in Figure 7c–f.
Figure 7.
Tensile properties of FDM-printed N-TPU and B-TPU composites. Representative engineering stress–strain curves of specimens printed using (a) [0°, 0°] and (b) [90°, 90°] raster-stacking configurations. Apparent tensile modulus and tensile strength of specimens printed using (c,d) [0°, 0°] and (e,f) [90°, 90°] configurations, respectively. The 0° raster direction was parallel to the tensile loading direction, whereas the 90° raster direction was perpendicular to it. Data in (c–f) are presented as the mean ± standard deviation.
For both printing configurations, the apparent tensile modulus increased progressively with increasing biochar content. This trend indicates that biochar incorporation increased the resistance of the printed composites to initial tensile deformation. The increase in apparent tensile modulus is consistent with the addition of a comparatively rigid dispersed phase. From the plotted means in Figure 7c,e, increasing the biochar content from 0 to 7.5 wt% raised the apparent tensile modulus from approximately 13 to 16 MPa for [0°, 0°] specimens and from 11 to 14 MPa for [90°, 90°] specimens.
In contrast to the modulus, tensile strength decreased overall as the biochar content increased. For the [0°, 0°] specimens, tensile strength decreased progressively over the investigated composition range. For the [90°, 90°] specimens, the 3.0 wt% composite showed a tensile strength similar to or slightly higher than that of the 1.5 wt% composite, indicating that the decrease was not strictly monotonic at the intermediate loadings. Nevertheless, all biochar-containing [90°, 90°] specimens exhibited lower tensile strength than the corresponding N-TPU specimen, and the 7.5 wt% B-TPU composite showed the lowest tensile strength. The endpoints of the representative stress–strain curves shifted toward lower strain with increasing biochar content, indicating a general reduction in failure strain. The 7.5 wt% B-TPU specimens exhibited the most pronounced reduction in failure strain for both printing configurations. Biochar incorporation therefore produced a mechanical trade-off: the apparent stiffness increased, whereas tensile strength and extensibility decreased. A clear orientation dependence was also observed. At the same biochar loading, the [0°, 0°] specimens generally exhibited a higher apparent tensile modulus and tensile strength than the corresponding [90°, 90°] specimens. The [0°, 0°] specimens also sustained deformation to a higher strain before failure. In this configuration, the deposited roads were aligned with the loading direction, enabling individual printed roads to carry tensile load more directly and reducing the number of inter-road boundaries intersected by the principal load path.
Over the same 0–7.5 wt% range, the plotted mean tensile strength decreased from approximately 32 to 17 MPa in [0°, 0°] specimens and from 18 to 9 MPa in [90°, 90°] specimens. The failure strains read from the representative curves decreased from about 850% to 600% and from about 600% to 300%, respectively (Figure 7a,b).
By contrast, tensile loading of the [90°, 90°] specimens was applied perpendicular to the deposited roads. Load transfer therefore depended more strongly on bonding between adjacent roads and on the integrity of the interfaces formed during FDM deposition. These interfaces can act as mechanically weaker regions than the continuous material within a deposited road, producing lower tensile strength and failure strain. This behavior is consistent with the raster architecture: the [0°, 0°] specimens carried load more directly along the deposited roads, whereas the [90°, 90°] specimens depended more strongly on inter-road bonding. Several mechanisms may have contributed to the reduction in tensile strength and failure strain at higher biochar contents. Rigid particles can produce localized stress concentrations within a deformable elastomeric matrix, while increasing filler content can interrupt the continuity of the TPU phase and reduce the amount of matrix available for large-strain deformation. Biochar agglomeration, incomplete particle–matrix stress transfer, local printing voids, and inter-road defects may also contribute to premature failure.
The present SEM images do not resolve the individual failure origins; therefore, the strength reduction is interpreted as the combined result of particle-induced stress concentration, disruption of the deformable TPU phase, and mechanically weaker printed-road interfaces. The mechanical results are relevant when considering the thermal–mechanical balance of the printed composites. The 7.5 wt% B-TPU formulation exhibited the highest IP thermal conductivity but also the largest losses in tensile strength and extensibility. Thus, the composition that provided the greatest improvement in directional heat spreading did not provide the best overall mechanical performance. Selection of the biochar content should therefore depend on the relative importance of thermal transport, stiffness, tensile strength, and deformation capacity in the intended application.
It is assumed that further improving biochar–TPU adhesion would be a practical route to reducing this loss of strength and extensibility. Controlled surface oxidation followed by silane treatment is one option: related carbon-fiber/TPU work has shown improved interfacial bonding after this treatment [48]. For bamboo biochar, the treatment should promote wetting and stress transfer while retaining the carbon framework and avoiding a thick coating that adds thermal resistance.
Overall, biochar loading and raster orientation provided two means of modifying the tensile response of the printed composites. Increasing biochar content produced a modest stiffening effect but progressively reduced strength and large-strain deformability, while alignment of the deposited roads with the tensile loading direction improved load-bearing performance relative to transverse printing. These materials may therefore be suitable for lightweight and mechanically compliant heat-spreading structures in which high tensile load-bearing capacity is not the primary design requirement.
4. Conclusions
The results demonstrate that biochar loading and raster-path design provide complementary and independently programmable manufacturing variables. At 7.5 wt% biochar, the effective IP/TP thermal-conductivity ratio reached 2.79, and the same directional response was expressed at the component scale in both arrow-shaped and finned structures. This approach enables lightweight and geometrically customizable directional heat spreaders without the very high filler loadings commonly used in conventional graphene- or boron-nitride-filled TPU systems.
At 7.5 wt% biochar, the IP and TP thermal conductivities reached 1.06 and 0.38 W m−1 K−1, respectively, compared with 0.23 and 0.20 W m−1 K−1 for N-TPU. The resulting effective IP/TP ratio of 2.79 demonstrates that composition and the deposited-road/layered architecture can be combined to engineer anisotropic heat transport in an extrusion-printed elastomeric composite.
- Arrow-shaped specimens translated the measured anisotropy into raster-dependent component-scale heat redistribution. After 240 s, the [0°, 0°] configuration had a heated-tail temperature 20.2 °C lower and a distal-arrowhead temperature 2.5 °C higher than the [90°, 90°] configuration. In the finned demonstration, the [0°, 0°] B-TPU structure produced a base-to-fin temperature difference of 15.9 °C, compared with 33.5 °C for N-TPU, confirming more effective transfer of heat from the base into the printed fins.
- Finite-element analysis captured the measured composition- and raster-dependent temperature ordering and clarified how the directional conductivity tensor controls heat propagation through the printed geometry.
- Tensile testing showed that increasing biochar content increased the apparent tensile modulus while reducing tensile strength and failure strain. At 7.5 wt%, the greatest gain in heat spreading was accompanied by the largest losses in tensile strength and extensibility.
Supplementary Materials
The following supporting information can be downloaded at https://www.mdpi.com/article/10.3390/nanomanufacturing6040029/s1, Figure S1: FDM-printed B-TPU specimens used for through-plane (TP) and in-plane (IP) thermal-conductivity measurements. Figure S2: Arrow-shaped B-TPU specimens fabricated with three distinct stacking configurations: [0°, 0°], [0°, 90°], and [90°, 90°]. Figure S3: Geometry and raster configurations of the FDM-printed finned heat-spreading structure. Table S1: Parameters used for anisotropic heat transfer simulations of arrow-shaped structures. Table S2: Parameters used for anisotropic heat-transfer simulations of the finned heat-spreading structures. Figure S4: SEM images of bamboo-derived biochar powder at different magnifications. Figure S5: UV–Vis–NIR absorbance spectra of 7.5 wt% B-TPU and N-TPU. Figure S6: TGA tests of B-TPU filaments containing 0, 1.5, 3.0, and 7.5 wt% biochar.
Author Contributions
J.G.: Writing—original draft, Data curation. D.Z.: Data curation, Formal analysis, Writing—review & editing. J.Z.: Writing—review & editing, Supervision. N.L.: Writing—review & editing, Supervision. S.Z.: Writing—review & editing, Supervision. C.L.: Writing—review & editing. Z.K.: Formal analysis. S.L.: Data curation, Formal analysis. Z.X.: Formal analysis. A.U.: Formal analysis, Writing—review & editing. M.X.: Writing—review & editing, Software, Methodology. Z.W.: Writing—review & editing, Supervision, Project administration, Funding acquisition. All authors have read and agreed to the published version of the manuscript.
Funding
This work was funded by the National Key Research and Development Project (Grant No. 2022YFA1203600), CAS Project for Young Scientists in Basic Research (Grant No. YSBR-070), the National Natural Science Foundation of China (Grant No. 62571513).
Data Availability Statement
The data that support the findings of this study are available from the corresponding author upon reasonable request.
Conflicts of Interest
The authors declare no conflicts of interest.
References
- Moore, A.L.; Shi, L. Emerging Challenges and Materials for Thermal Management of Electronics. Mater. Today 2014, 17, 163–174. [Google Scholar] [CrossRef] [Scilit]
- Zhao, C.; Li, Y.; Liu, Y.; Xie, H.; Yu, W. A Critical Review of the Preparation Strategies of Thermally Conductive and Electrically Insulating Polymeric Materials and Their Applications in Heat Dissipation of Electronic Devices. Adv. Compos. Hybrid Mater. 2023, 6, 27. [Google Scholar] [CrossRef] [Scilit]
- Song, H.; Liu, J.; Liu, B.; Wu, J.; Cheng, H.M.; Kang, F. Two-Dimensional Materials for Thermal Management Applications. Joule 2018, 2, 442–463. [Google Scholar] [CrossRef] [Scilit]
- Lv, L.; Wang, J.; Ji, M.; Zhang, Y.; Huang, S.; Cen, K. Effect of Structural Characteristics and Surface Functional Groups of Biochar on Thermal Properties of Different Organic Phase Change Materials: Dominant Encapsulation Mechanisms. Renew. Energy 2022, 195, 1238–1252. [Google Scholar] [CrossRef] [Scilit]
- Xiong, T.; Ok, Y.S.; Dissanayake, P.D.; Tsang, D.C.W.; Kim, S.; Kua, H.W.; Shah, K.W. Preparation and Thermal Conductivity Enhancement of a Paraffin Wax-Based Composite Phase Change Material Doped with Garlic Stem Biochar Microparticles. Sci. Total Environ. 2022, 827, 154341. [Google Scholar] [CrossRef] [Scilit] [PubMed]
- Yang, R.; Guo, X.; Wu, H.; Kang, W.; Song, K.; Li, Y.; Huang, X.; Wang, G. Anisotropic Hemp-Stem-Derived Biochar Supported Phase Change Materials with Efficient Solar-Thermal Energy Conversion and Storage. Biochar 2022, 4, 38. [Google Scholar] [CrossRef] [Scilit]
- Li, Y.; Chen, Y.; Huang, X.; Jiang, S.; Wang, G. Anisotropy-Functionalized Cellulose-Based Phase Change Materials with Reinforced Solar-Thermal Energy Conversion and Storage Capacity. Chem. Eng. J. 2021, 415, 129086. [Google Scholar] [CrossRef] [Scilit]
- Li, S.; Wang, H.; Mao, H.; Li, L.; Shi, H. Enhanced Thermal Management Performance of Comb-like Polymer/Boron Nitride Composite Phase Change Materials for the Thermoregulated Fabric Application. J. Energy Storage 2021, 40, 102826. [Google Scholar] [CrossRef] [Scilit]
- Li, J.; Qin, M.; Feng, W. Recent Advances in the Thermal Management Performance of Polymer-Based Composite Materials. Mater. Horiz. 2026, 13, 122–149. [Google Scholar] [CrossRef] [Scilit] [PubMed]
- Oliveira, J.; Correia, V.; Castro, H.; Martins, P.; Lanceros-mendez, S. Polymer-Based Smart Materials by Printing Technologies: Improving Application and Integration. Addit. Manuf. 2018, 21, 269–283. [Google Scholar] [CrossRef] [Scilit]
- Ouyang, Y.; Bai, L.; Tian, H.; Li, X.; Yuan, F. Recent Progress of Thermal Conductive Polymer Composites: Al2O3 Fillers, Properties and Applications. Compos. Part A Appl. Sci. Manuf. 2022, 152, 106685. [Google Scholar] [CrossRef] [Scilit]
- Valino, A.D.; Dizon, J.R.C.; Espera, A.H.; Chen, Q.; Messman, J.; Advincula, R.C. Advances in 3D Printing of Thermoplastic Polymer Composites and Nanocomposites. Prog. Polym. Sci. 2019, 98, 101162. [Google Scholar] [CrossRef] [Scilit]
- Brenken, B.; Barocio, E.; Favaloro, A.; Kunc, V.; Pipes, R.B. Fused Filament Fabrication of Fiber-Reinforced Polymers: A Review. Addit. Manuf. 2018, 21, 1–16. [Google Scholar] [CrossRef] [Scilit]
- Xu, X.; Chen, J.; Zhou, J.; Li, B. Thermal Conductivity of Polymers and Their Nanocomposites. Adv. Mater. 2018, 30, 1705544. [Google Scholar] [CrossRef] [Scilit] [PubMed]
- Tan, J.; Zhang, Y. Thermal Conductive Polymer Composites: Recent Progress and Applications. Molecules 2024, 29, 3572. [Google Scholar] [CrossRef] [Scilit] [PubMed]
- Ouyang, Y.; Hou, G.; Bai, L.; Li, B.; Yuan, F. Constructing Continuous Networks by Branched Alumina for Enhanced Thermal Conductivity of Polymer Composites. Compos. Sci. Technol. 2018, 165, 307–313. [Google Scholar] [CrossRef] [Scilit]
- Ouyang, Y.; Ding, F.; Bai, L.; Li, X.; Hou, G.; Fan, J.; Yuan, F. Design of Network Al2O3 Spheres for Significantly Enhanced Thermal Conductivity of Polymer Composites. Compos. Part A Appl. Sci. Manuf. 2020, 128, 105673. [Google Scholar] [CrossRef] [Scilit]
- Ohayon-lavi, A.; Buzaglo, M.; Ligati, S.; Peretz-damari, S.; Shachar, G.; Pinsk, N.; Riskin, M.; Schatzberg, Y.; Genish, I.; Regev, O. Compression-Enhanced Thermal Conductivity of Carbon Loaded Polymer Composites. Carbon 2020, 163, 333–340. [Google Scholar] [CrossRef] [Scilit]
- Huang, J.; Zhu, Y.; Xu, L.; Chen, J.; Jiang, W.; Nie, X. Massive Enhancement in the Thermal Conductivity of Polymer Composites by Trapping Graphene at the Interface of a Polymer Blend. Compos. Sci. Technol. 2016, 129, 160–165. [Google Scholar] [CrossRef] [Scilit]
- Qian, K.; Kumar, A.; Zhang, H.; Bellmer, D.; Huhnke, R. Recent Advances in Utilization of Biochar. Renew. Sustain. Energy Rev. 2015, 42, 1055–1064. [Google Scholar] [CrossRef] [Scilit]
- Giorcelli, M.; Khan, A.; Pugno, N.M.; Rosso, C.; Tagliaferro, A. Biochar as a Cheap and Environmental Friendly Filler Able to Improve Polymer Mechanical Properties. Biomass Bioenergy 2019, 120, 219–223. [Google Scholar] [CrossRef] [Scilit]
- Zhang, Q.; Khan, M.U.; Lin, X.; Cai, H.; Lei, H. Temperature Varied Biochar as a Reinforcing Filler for High-Density Polyethylene Composites. Compos. Part B Eng. 2019, 175, 107151. [Google Scholar] [CrossRef] [Scilit]
- Idrees, M.; Jeelani, S.; Rangari, V. Three-Dimensional-Printed Sustainable Biochar-Recycled PET Composites. ACS Sustain. Chem. Eng. 2018, 6, 13940–13948. [Google Scholar] [CrossRef] [Scilit]
- Mohammed, Z.; Jeelani, S.; Rangari, V. Effective Reinforcement of Engineered Sustainable Biochar Carbon for 3D Printed Polypropylene Biocomposites. Compos. Part C Open Access 2022, 7, 100221. [Google Scholar] [CrossRef] [Scilit]
- Petousis, M.; Maravelakis, E.; Kalderis, D.; Saltas, V.; Mountakis, N.; Spiridaki, M.; Bolanakis, N.; Argyros, A.; Papadakis, V.; Michailidis, N.; et al. Biochar for Sustainable Additive Manufacturing: Thermal, Mechanical, Electrical, and Rheological Responses of Polypropylene-Biochar Composites. Biomass Bioenergy 2024, 186, 107272. [Google Scholar] [CrossRef] [Scilit]
- Anerao, P.; Kulkarni, A.; Munde, Y.; Shinde, A.; Das, O. Biochar Reinforced PLA Composite for Fused Deposition Modelling (FDM): A Parametric Study on Mechanical Performance. Compos. Part C Open Access 2023, 12, 100406. [Google Scholar] [CrossRef] [Scilit]
- Vidakis, N.; Kalderis, D.; Petousis, M.; Maravelakis, E.; Mountakis, N.; Bolanakis, N.; Papadakis, V. Biochar Filler in MEX and VPP Additive Manufacturing: Characterization and Reinforcement Effects in Polylactic Acid and Standard Grade Resin Matrices. Biochar 2023, 5, 39. [Google Scholar] [CrossRef] [Scilit]
- Vidakis, N.; Petousis, M.; Kalderis, D.; Michailidis, N.; Maravelakis, E.; Saltas, V.; Bolanakis, N.; Papadakis, V.; Spiridaki, M.; Argyros, A. Reinforced HDPE with Optimized Biochar Content for Material Extrusion Additive Manufacturing: Morphological, Rheological, Electrical, and Thermomechanical Insights. Biochar 2024, 6, 37. [Google Scholar] [CrossRef] [Scilit]
- Coronado, D.R.R.; Chen, W.H.; Ubando, A.T. Advancements in Biochar-Reinforced 3D Printing Filaments for Material Extrusion: A Review on Material Performance, Sustainability, and Circular Economy. Compos. Part C Open Access 2026, 19, 100687. [Google Scholar] [CrossRef] [Scilit]
- Day, R.; Han, N.; Adhikari, S.; Wie, J.J.; Yoo, C.G.; Zhao, X.; Webb, E.; Ozcan, S.; Ragauskas, A.; Pu, Y. Biochar–Polymer Composites for 3D Printing: A Review. Biochar 2026, 8, 18. [Google Scholar] [CrossRef] [Scilit]
- Mayakrishnan, V.; Mohamed, J.K.; Selvaraj, N.; SenthilKumar, D.; Annadurai, S. Effect of Nano-Biochar on Mechanical, Barrier and Mulching Properties of 3D Printed Thermoplastic Polyurethane Film. Polym. Bull. 2023, 80, 6725–6747. [Google Scholar] [CrossRef] [Scilit]
- Manna, K.; Wan, C.; Gupta, J.; Busfield, J.J.C.; Chen, B.; Peijs, T. Microstructural Characterization of Ball-Milled Biochar and Its Reinforcing Efficiency in Biobased Thermoplastic Polyurethane through Preferential Embedment in the Soft Segment. ACS Sustain. Resour. Manag. 2025, 2, 1719–1730. [Google Scholar] [CrossRef] [Scilit] [PubMed]
- Xie, B.; Zhao, W.; Luo, X.; Hu, R. Alignment Engineering in Thermal Materials. Mater. Sci. Eng. R Rep. 2023, 154, 100738. [Google Scholar] [CrossRef] [Scilit]
- Li, W.; Yang, T.; Shi, J.; Wu, X.; Zhang, T.; Tang, S.; Chen, L.; Lu, H.; Song, J. Thermal Conductivity Enhancement for Multi-Functional Phase Change Materials: From Random Fillers to Oriented Networks in Viscous Systems. iScience 2025, 28, 113957. [Google Scholar] [CrossRef] [Scilit] [PubMed]
- Wu, Y.; Ye, K.; Liu, Z.; Wang, B.; Yan, C.; Wang, Z.; Lin, C.; Jiang, N.; Yu, J. Cotton Candy-Templated Fabrication of Three-Dimensional Ceramic Pathway within Polymer Composite for Enhanced Thermal Conductivity. ACS Appl. Mater. Interfaces 2019, 11, 44700−44707. [Google Scholar] [CrossRef] [Scilit] [PubMed]
- Yao, Y.; Zhu, X.; Zeng, X.; Sun, R.; Xu, J.; Wong, C. Vertically Aligned and Interconnected SiC Nanowire Networks Leading to Significantly Enhanced Thermal Conductivity of Polymer Composites. ACS Appl. Mater. Interfaces 2018, 10, 9669–9678. [Google Scholar] [CrossRef] [Scilit] [PubMed]
- Sun, M.; Dai, B.; Liu, K.; Yao, K.; Zhao, J.; Lyu, Z.; Wang, P.; Ding, Y.; Yang, L.; Han, J.; et al. Enhancement in Thermal Conductivity of Polymer Composites Using Aligned Diamonds Coated with Superparamagnetic Magnetite. Compos. Sci. Technol. 2018, 164, 129–135. [Google Scholar] [CrossRef] [Scilit]
- Jia, Y.; Mao, Z.; Zhang, H.; Zhang, J.; Zhang, Z.; Abidi, N.; Lucia, L.A. “Snakeskin” Bioinspired Design for Polymer Composite with Enhanced Positive Temperature-Dependent Thermal Conductivity. Nano Lett. 2025, 25, 1084–1092. [Google Scholar] [CrossRef] [Scilit] [PubMed]
- Zhang, T.; Sun, J.; Ren, L.; Yao, Y.; Wang, M.; Zeng, X.; Sun, R.; Xu, J.B.; Wong, C.P. Nacre-Inspired Polymer Composites with High Thermal Conductivity and Enhanced Mechanical Strength. Compos. Part A Appl. Sci. Manuf. 2019, 121, 92–99. [Google Scholar] [CrossRef] [Scilit]
- Webbe Kerekes, T.; Lim, H.; Joe, W.Y.; Yun, G.J. Characterization of Process–Deformation/Damage Property Relationship of Fused Deposition Modeling (FDM) 3D-Printed Specimens. Addit. Manuf. 2019, 25, 532–544. [Google Scholar] [CrossRef] [Scilit]
- Alaimo, G.; Marconi, S.; Costato, L.; Auricchio, F. Influence of Meso-Structure and Chemical Composition on FDM 3D-Printed Parts. Compos. Part B Eng. 2017, 113, 371–380. [Google Scholar] [CrossRef] [Scilit]
- Guo, H.; Zhao, H.; Niu, H.; Ren, Y.; Fang, H.; Fang, X.; Lv, R.; Maqbool, M.; Bai, S. Highly Thermally Conductive 3D Printed Graphene Filled Polymer Composites for Scalable Thermal Management Applications. ACS Nano 2021, 15, 6917–6928. [Google Scholar] [CrossRef] [Scilit] [PubMed]
- Guo, H.; Niu, H.; Zhao, H.; Kang, L.; Ren, Y.; Lv, R.; Ren, L.; Maqbool, M.; Bashir, A.; Bai, S. Highly Anisotropic Thermal Conductivity of Three-Dimensional Printed Boron Nitride-Filled Thermoplastic Polyurethane Composites: Effects of Size, Orientation, Viscosity, and Voids. ACS Appl. Mater. Interfaces 2022, 14, 14568–14578. [Google Scholar] [CrossRef] [Scilit] [PubMed]
- Jing, J.; Chen, Y.; Shi, S.; Yang, L.; Lambin, P. Facile and Scalable Fabrication of Highly Thermal Conductive Polyethylene/Graphene Nanocomposites by Combining Solid-State Shear Milling and FDM 3D-Printing Aligning Methods. Chem. Eng. J. 2020, 402, 126218. [Google Scholar] [CrossRef] [Scilit]
- Kang, Z.; Xi, M.; Li, N.; Zhang, S.; Wang, Z. Anisotropic Thermal Conductivity of 3D Printed Graphene Enhanced Thermoplastic Polyurethanes Structure toward Photothermal Conversion. Carbon 2025, 234, 120023. [Google Scholar] [CrossRef] [Scilit]
- Wang, K.; Prasetia, K.; Zou, W.; Qin, Y.; Enrique Garcia, J. The Tensile Stress–Strain Properties of Silicone Elastomers Are Not Affected by Specimen Type. J. Test. Eval. 2026, 54, 817–825. [Google Scholar] [CrossRef] [Scilit]
- Guangyu, L.; Kalyon, D.M.; Yilgör, I.; Yilgör, E. Rheology and Processing of BaSO4-Filled Medical-Grade Thermoplastic Polyurethane. Polym. Eng. Sci. 2004, 44, 1941–1948. [Google Scholar] [CrossRef] [Scilit]
- Syed, N.A.; Tariq, M.; Utkarsh, U.; Behravesh, A.H.; Guo, Q.; Pop-Iliev, R.; Rizvi, G. Experimental Investigation of Electrolytically Treated and Silane Grafted Carbon Fiber-Reinforced Thermoplastic Polyurethane Composites. J. Compos. Mater. 2023, 57, 2189–2200. [Google Scholar] [CrossRef] [Scilit]
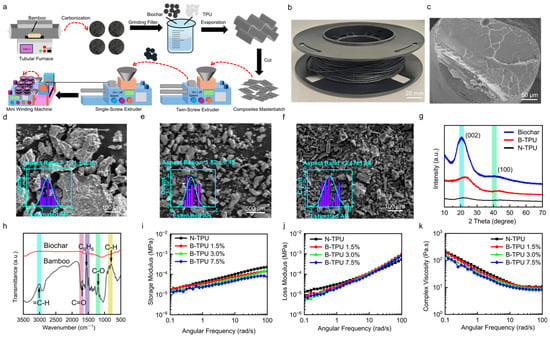
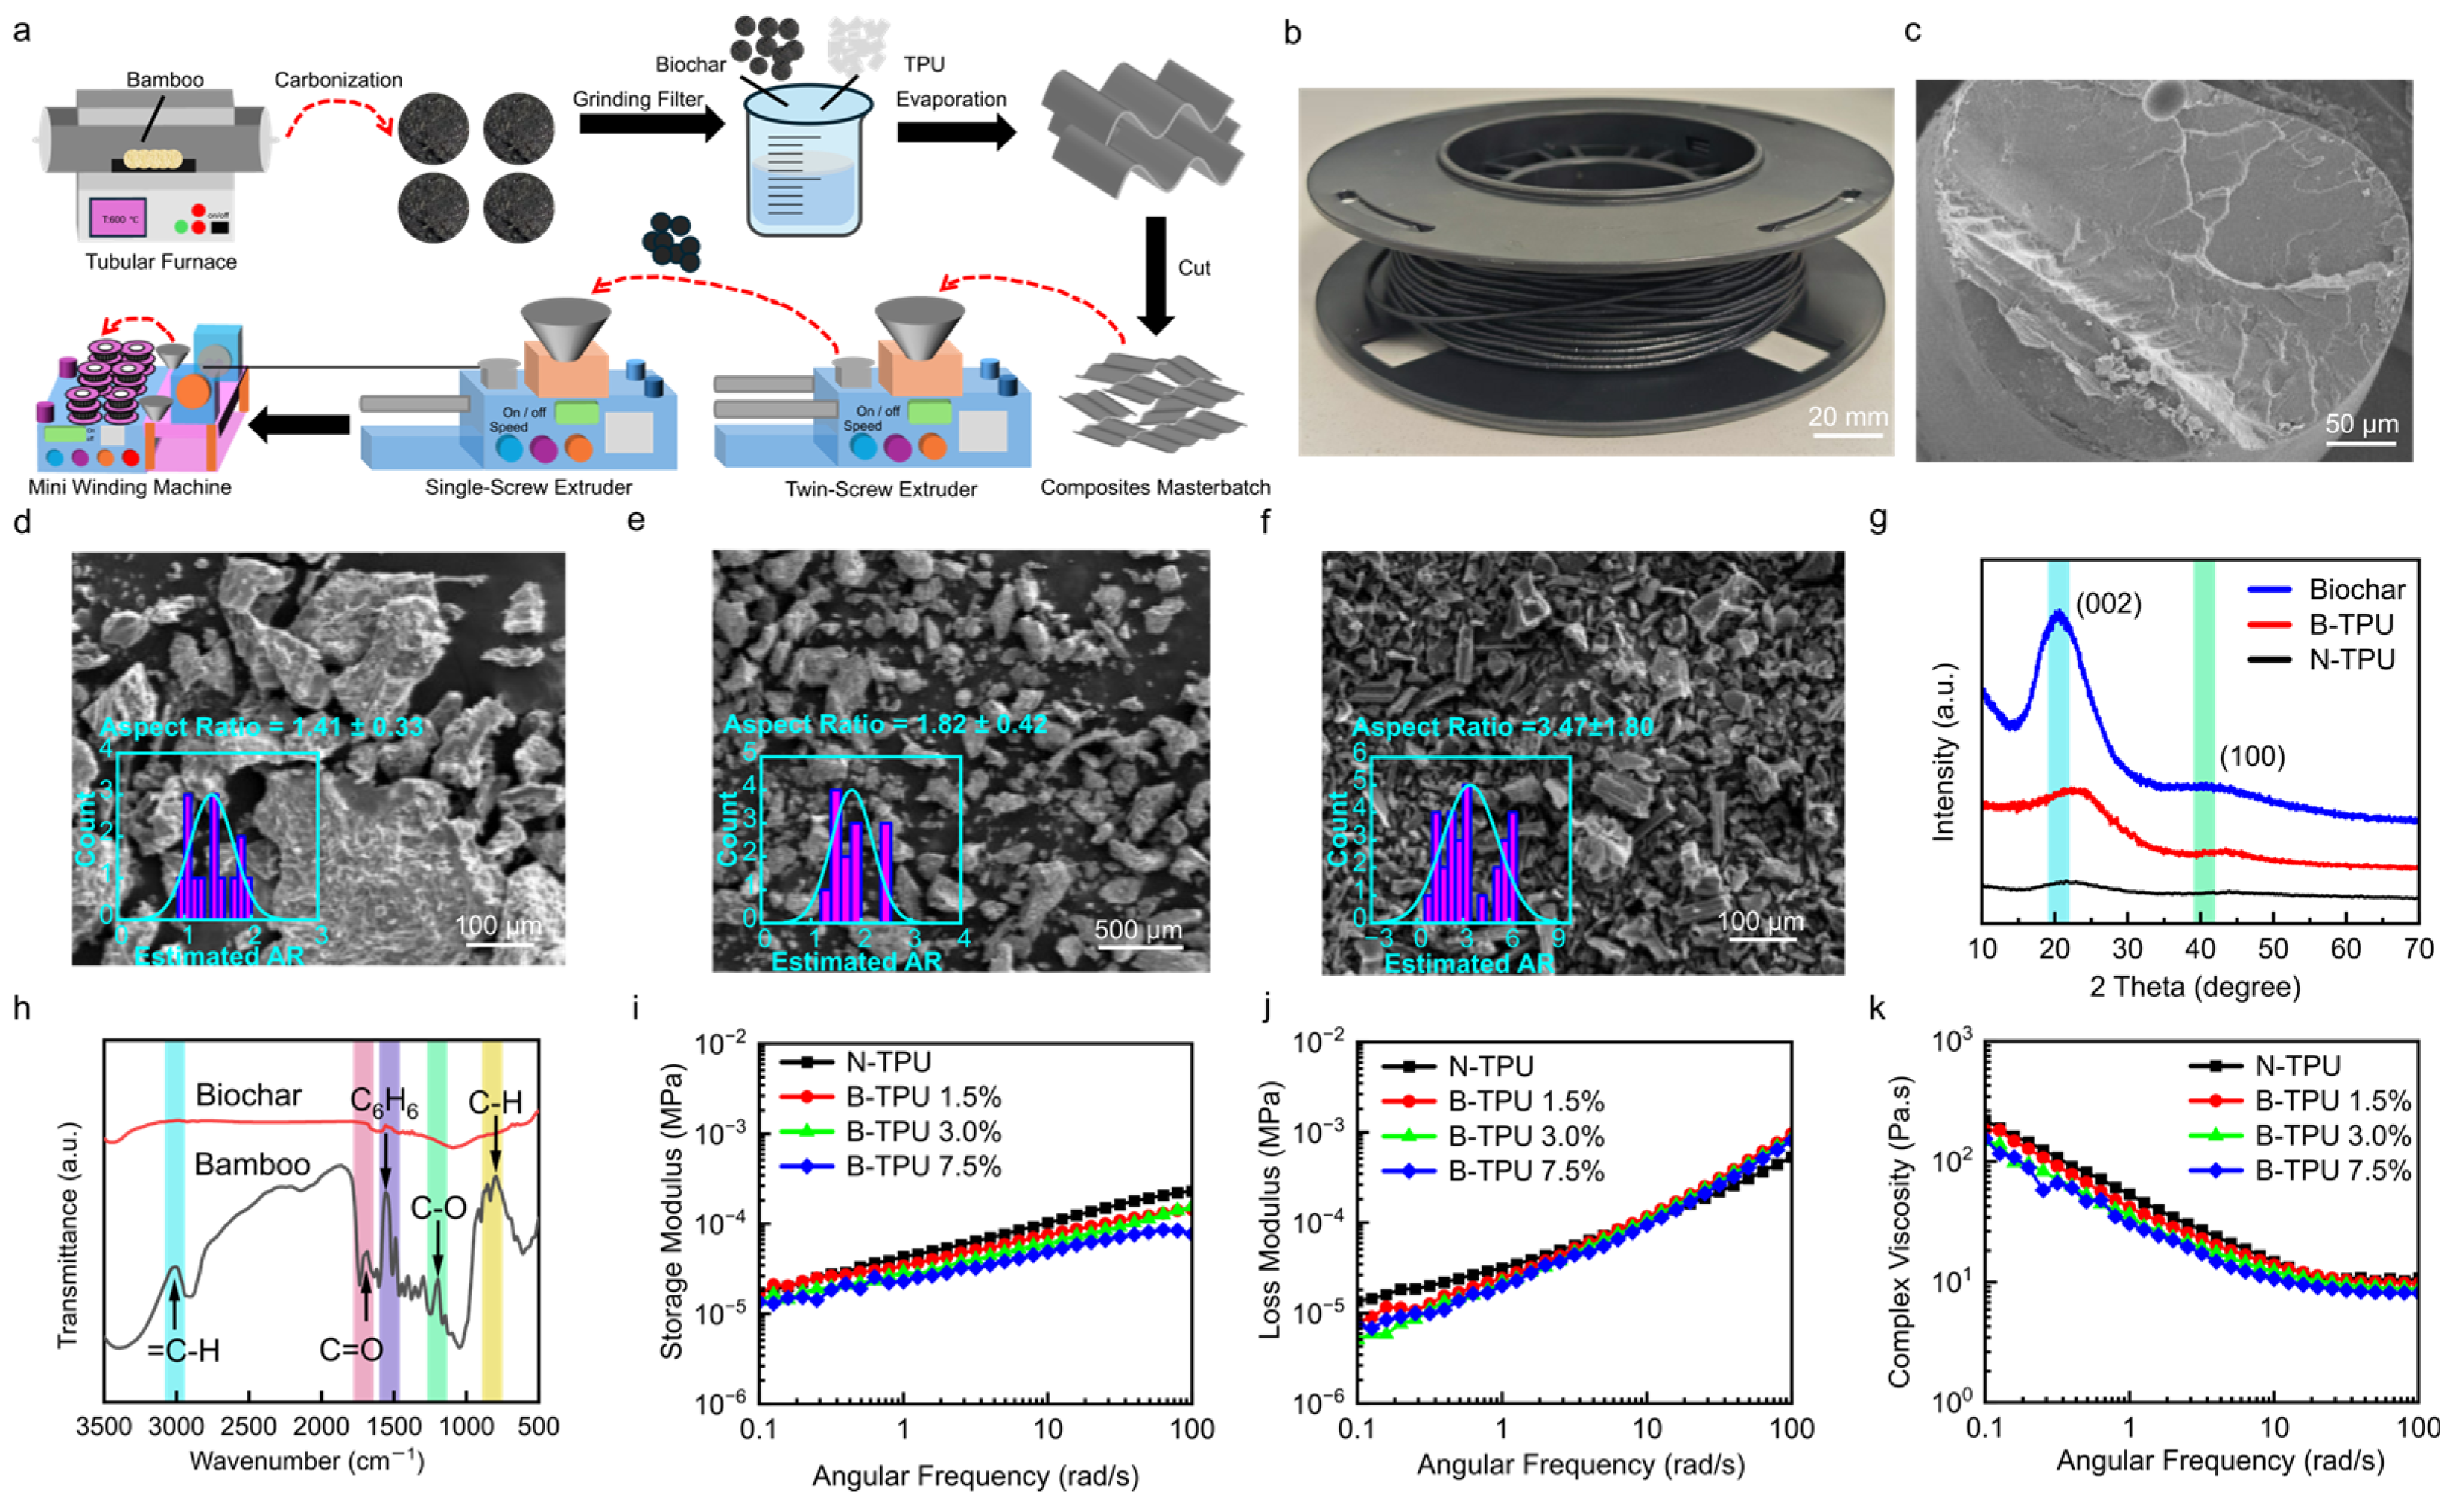
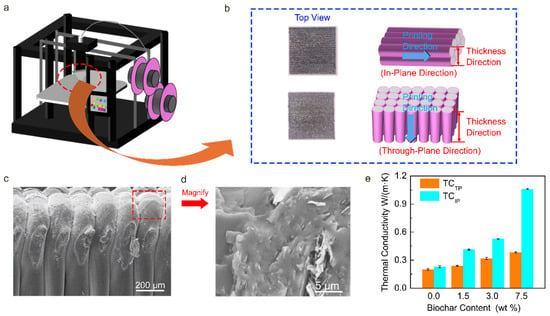
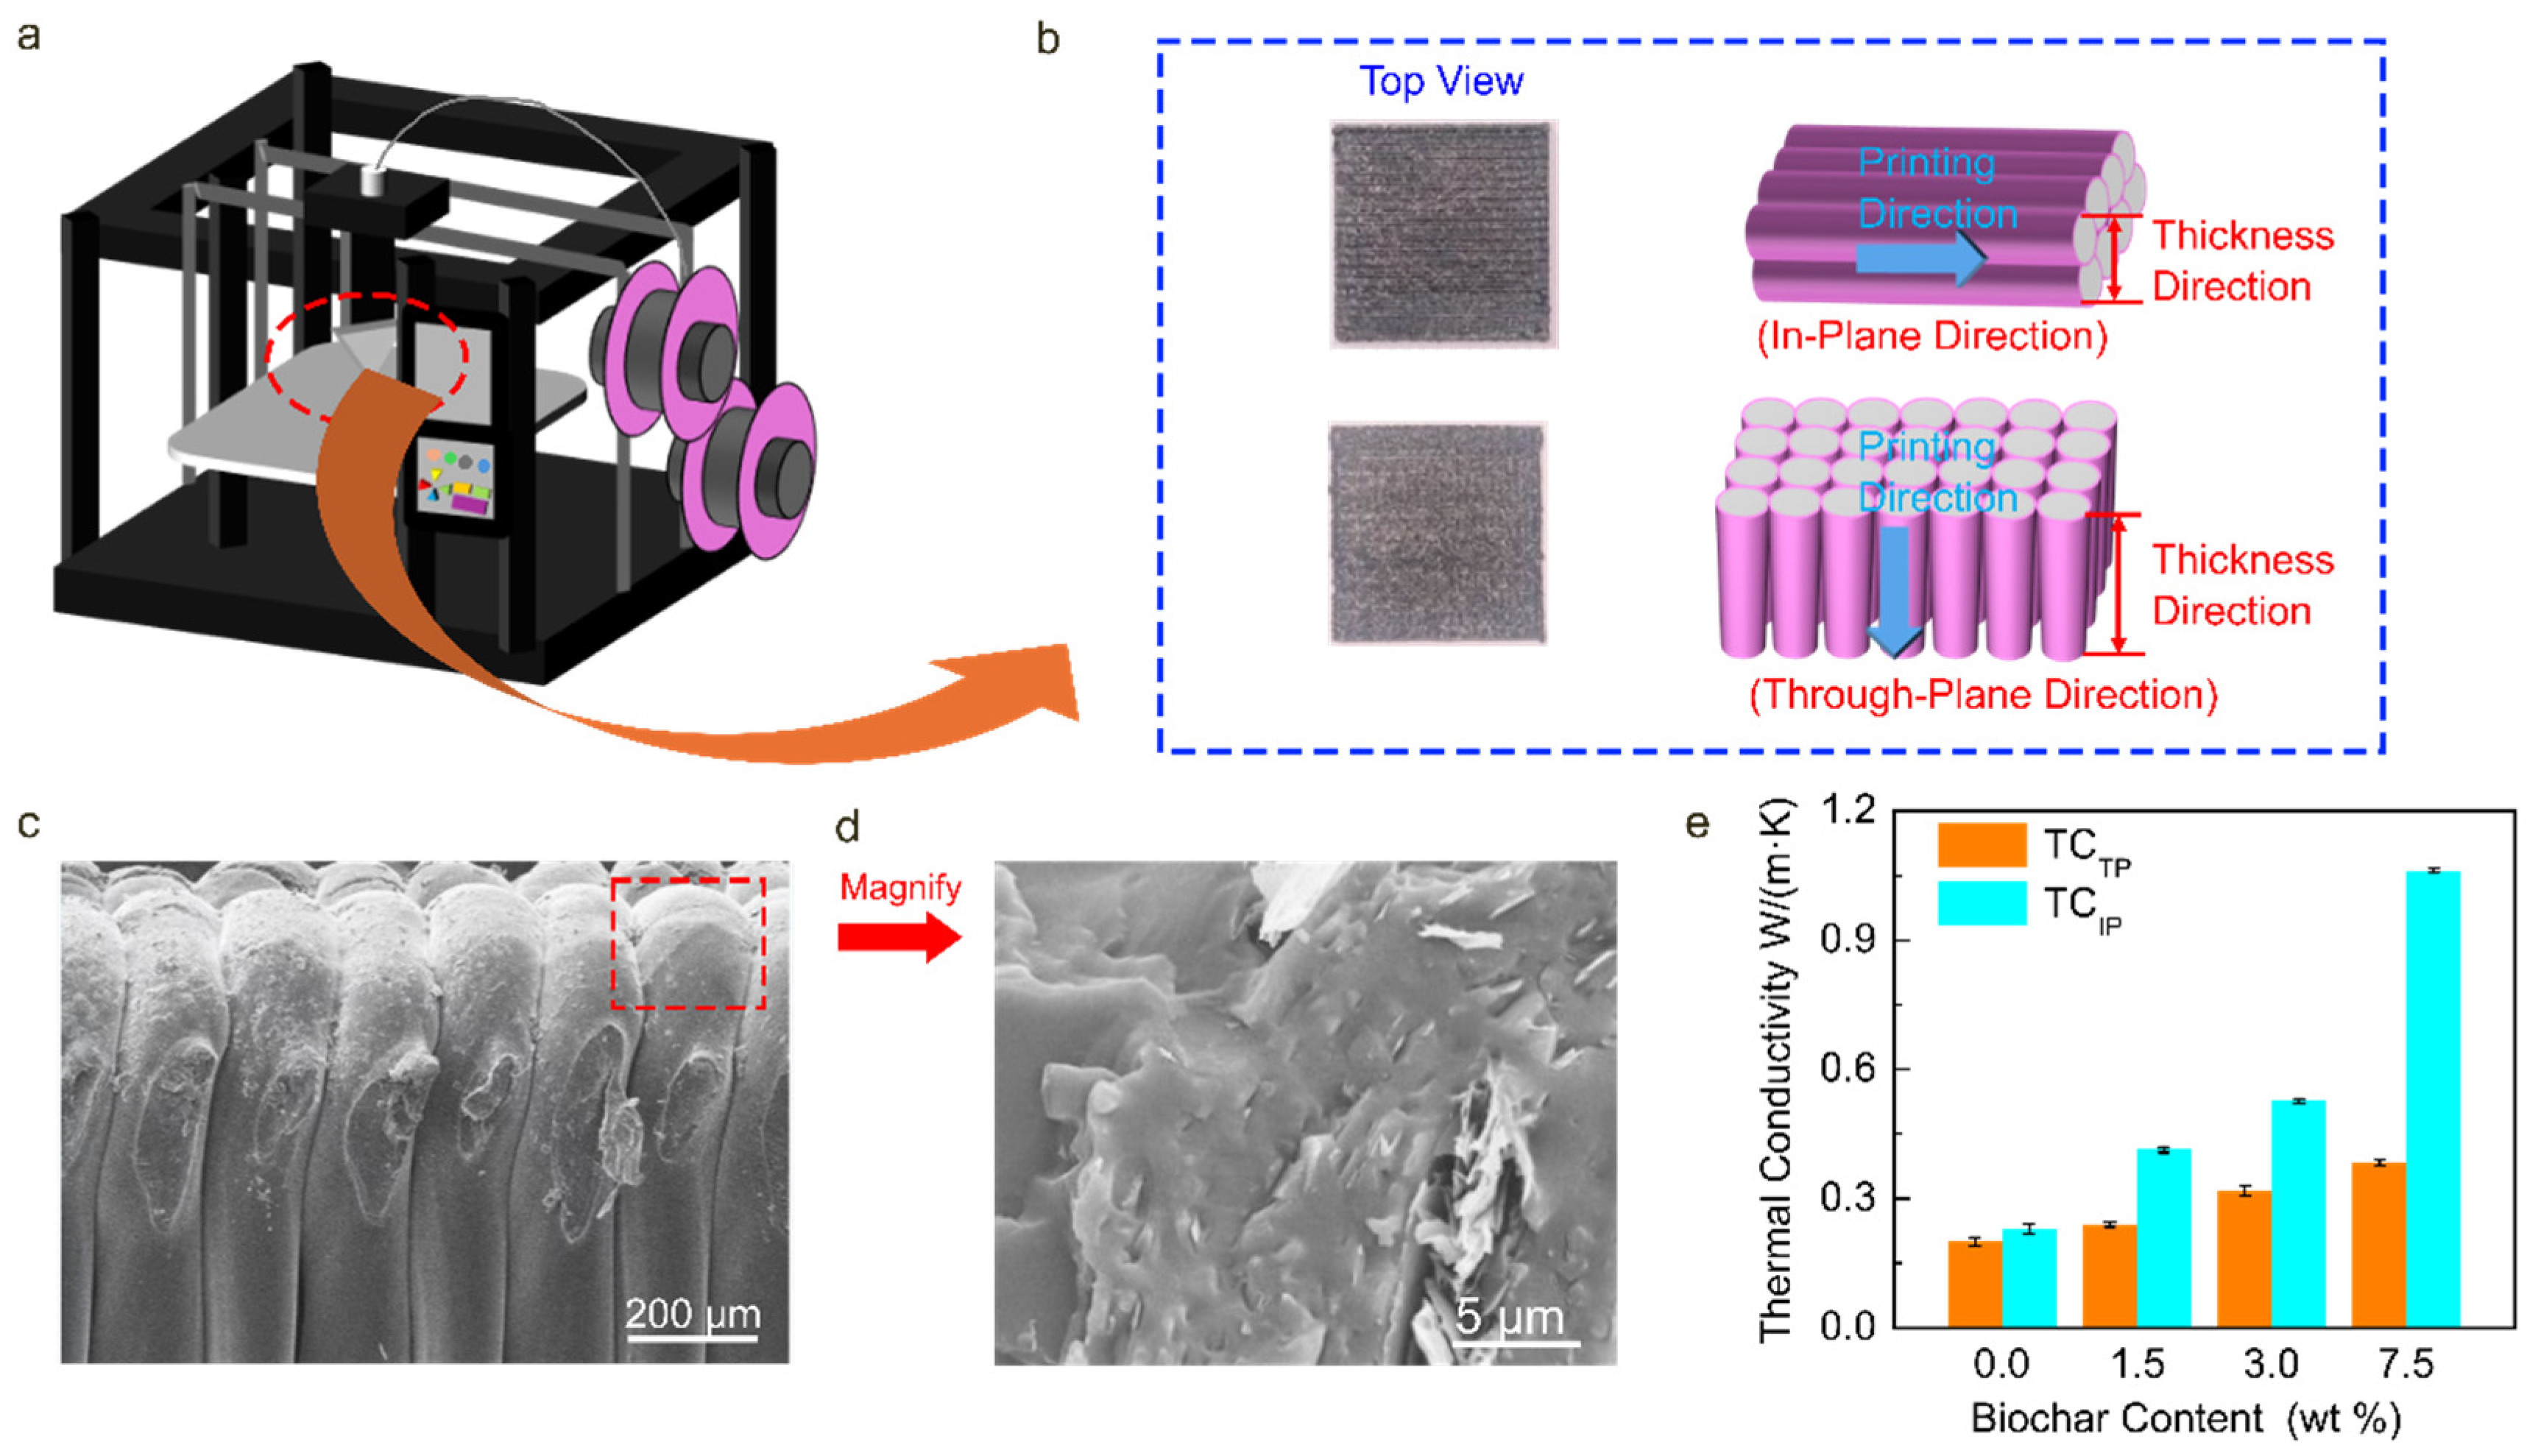
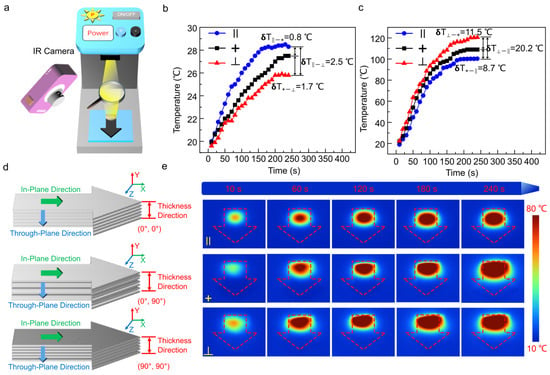
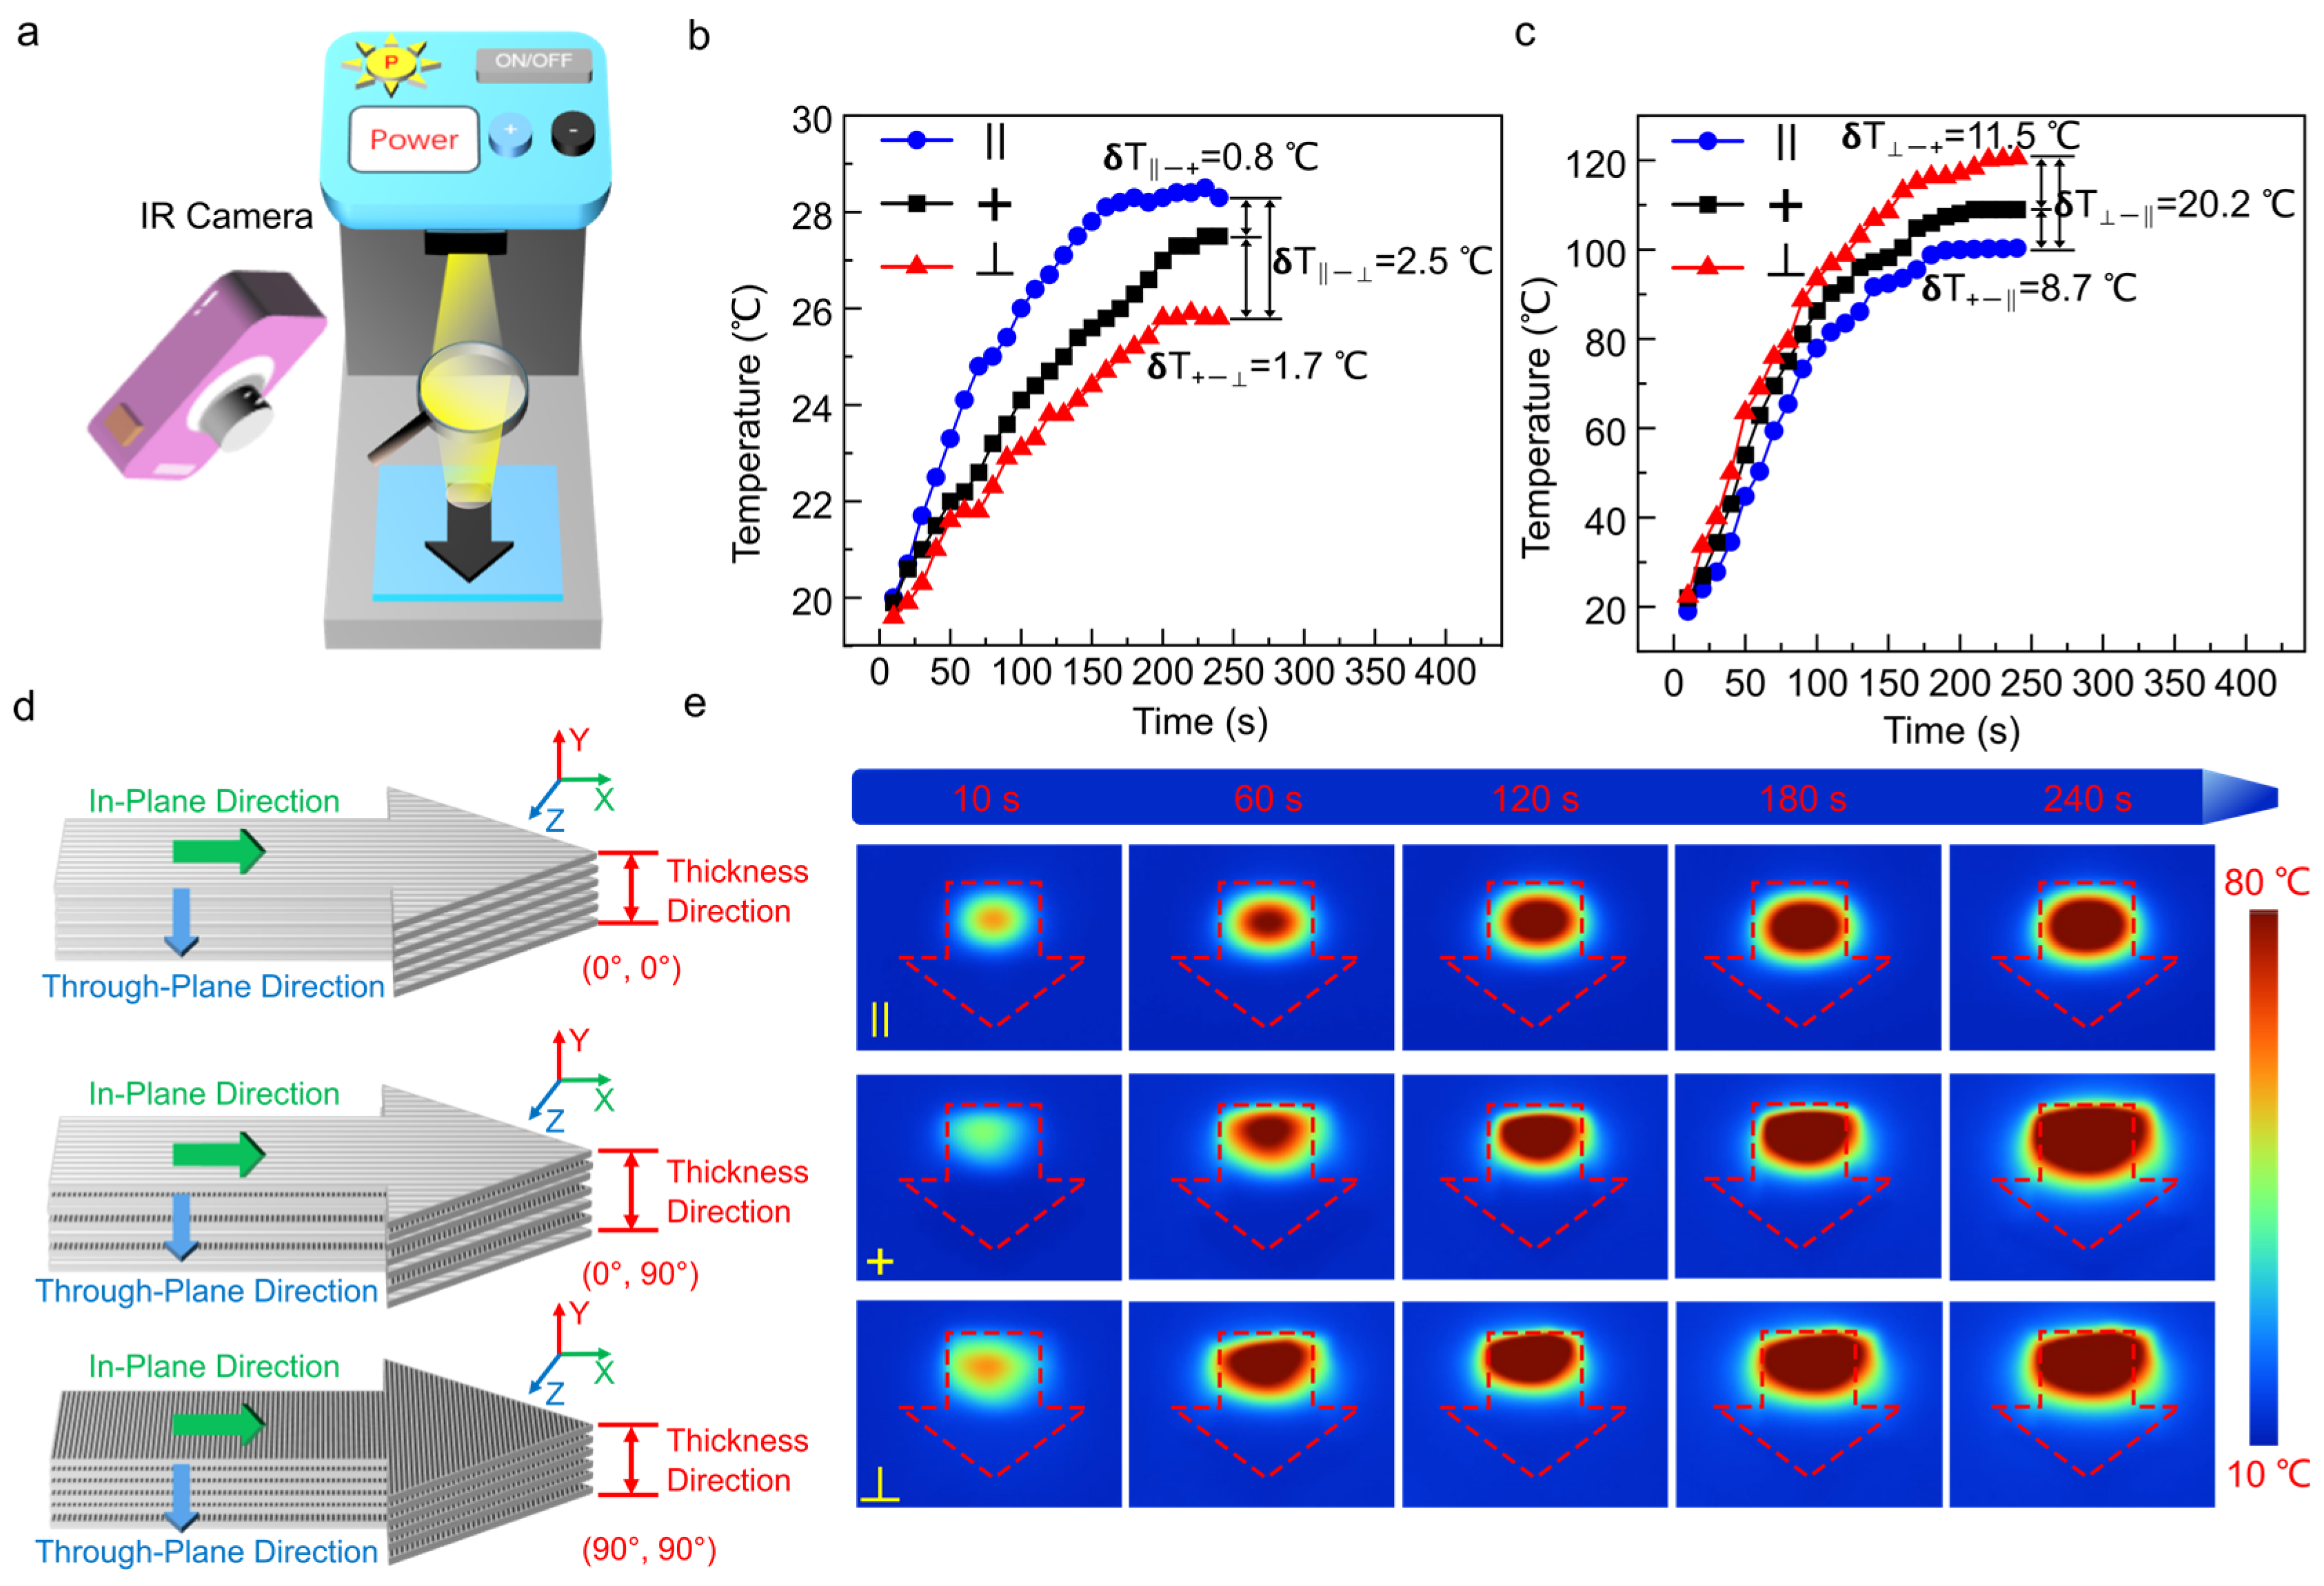
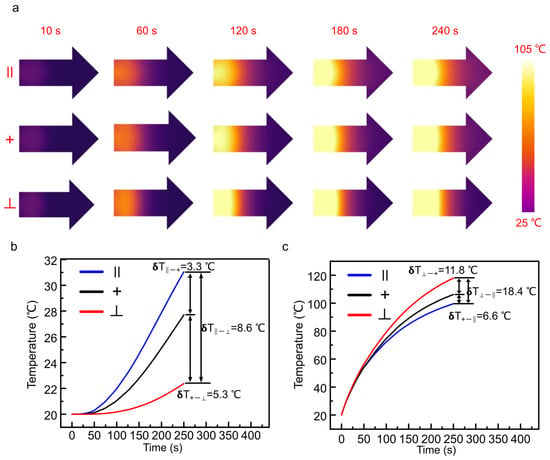
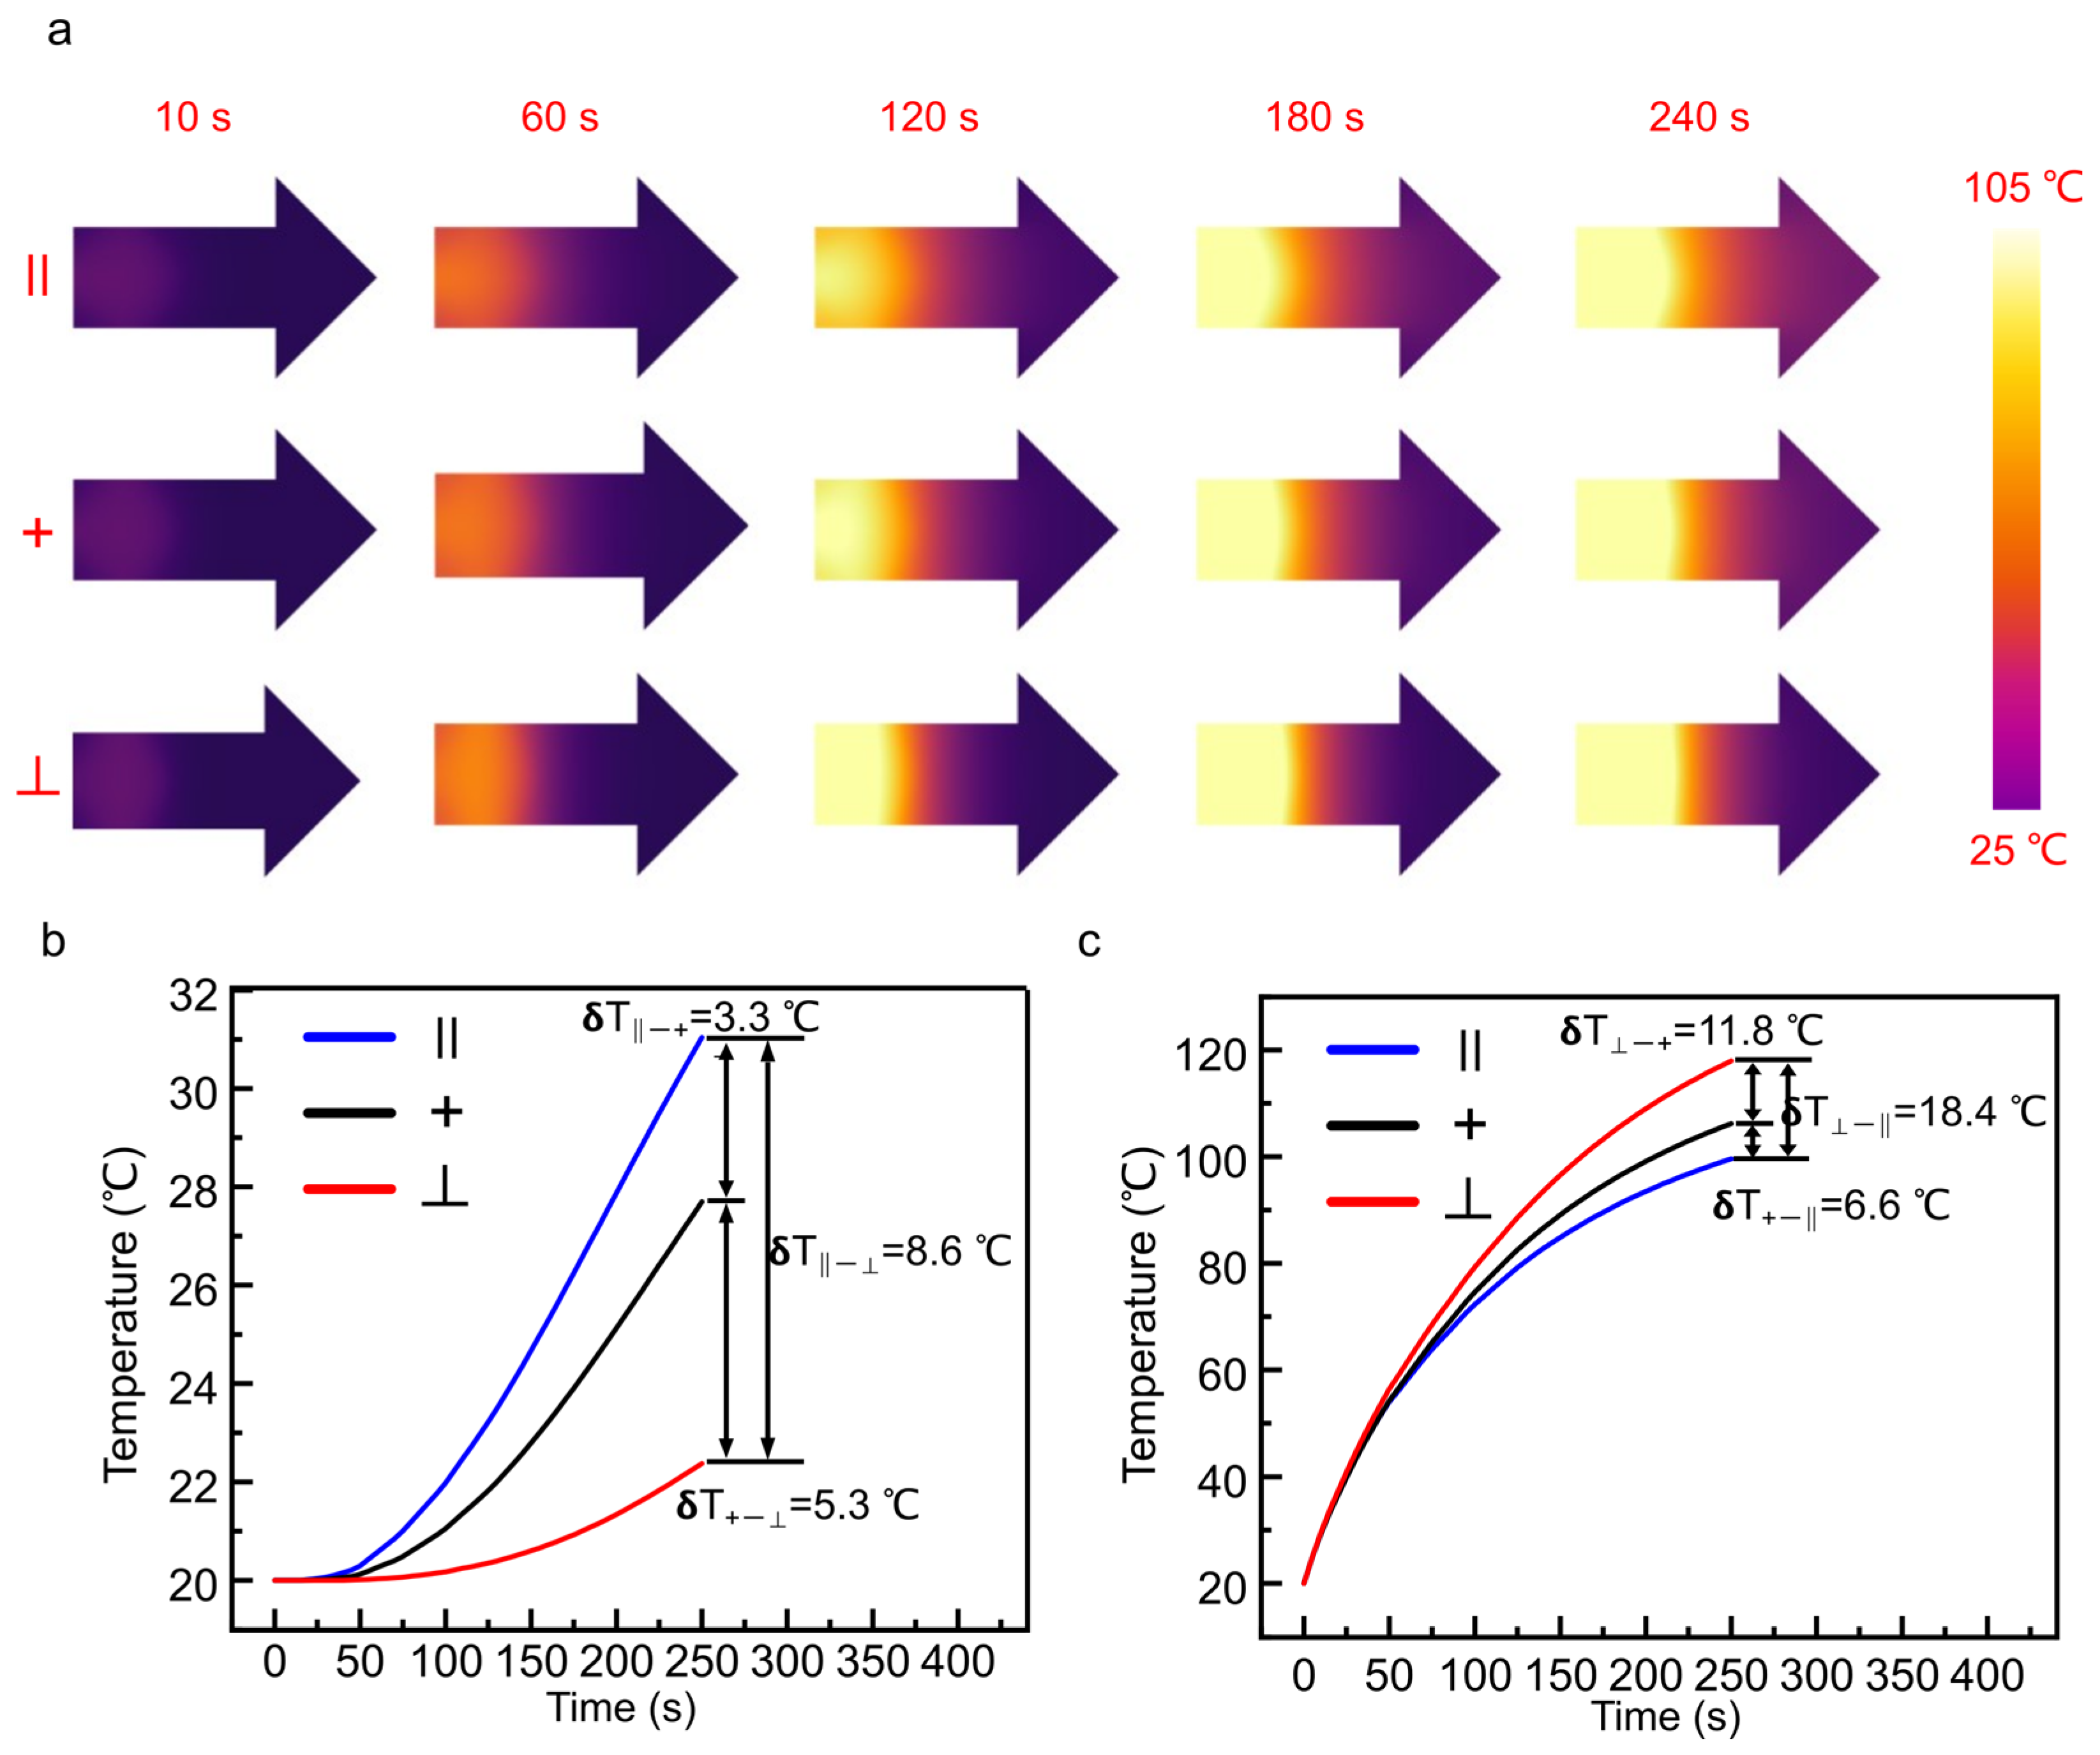
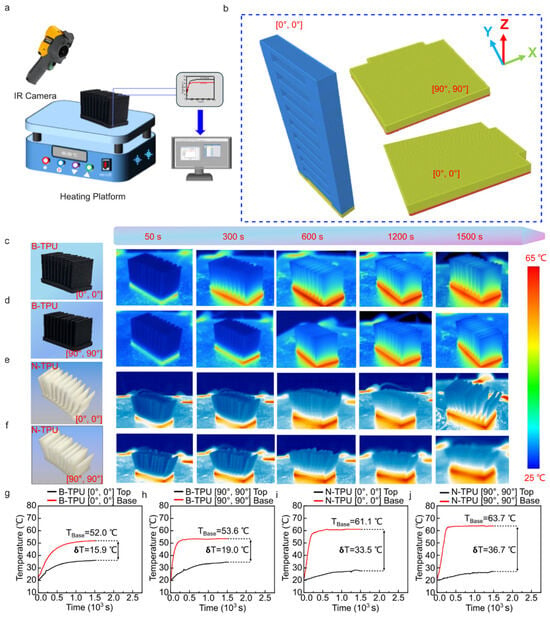
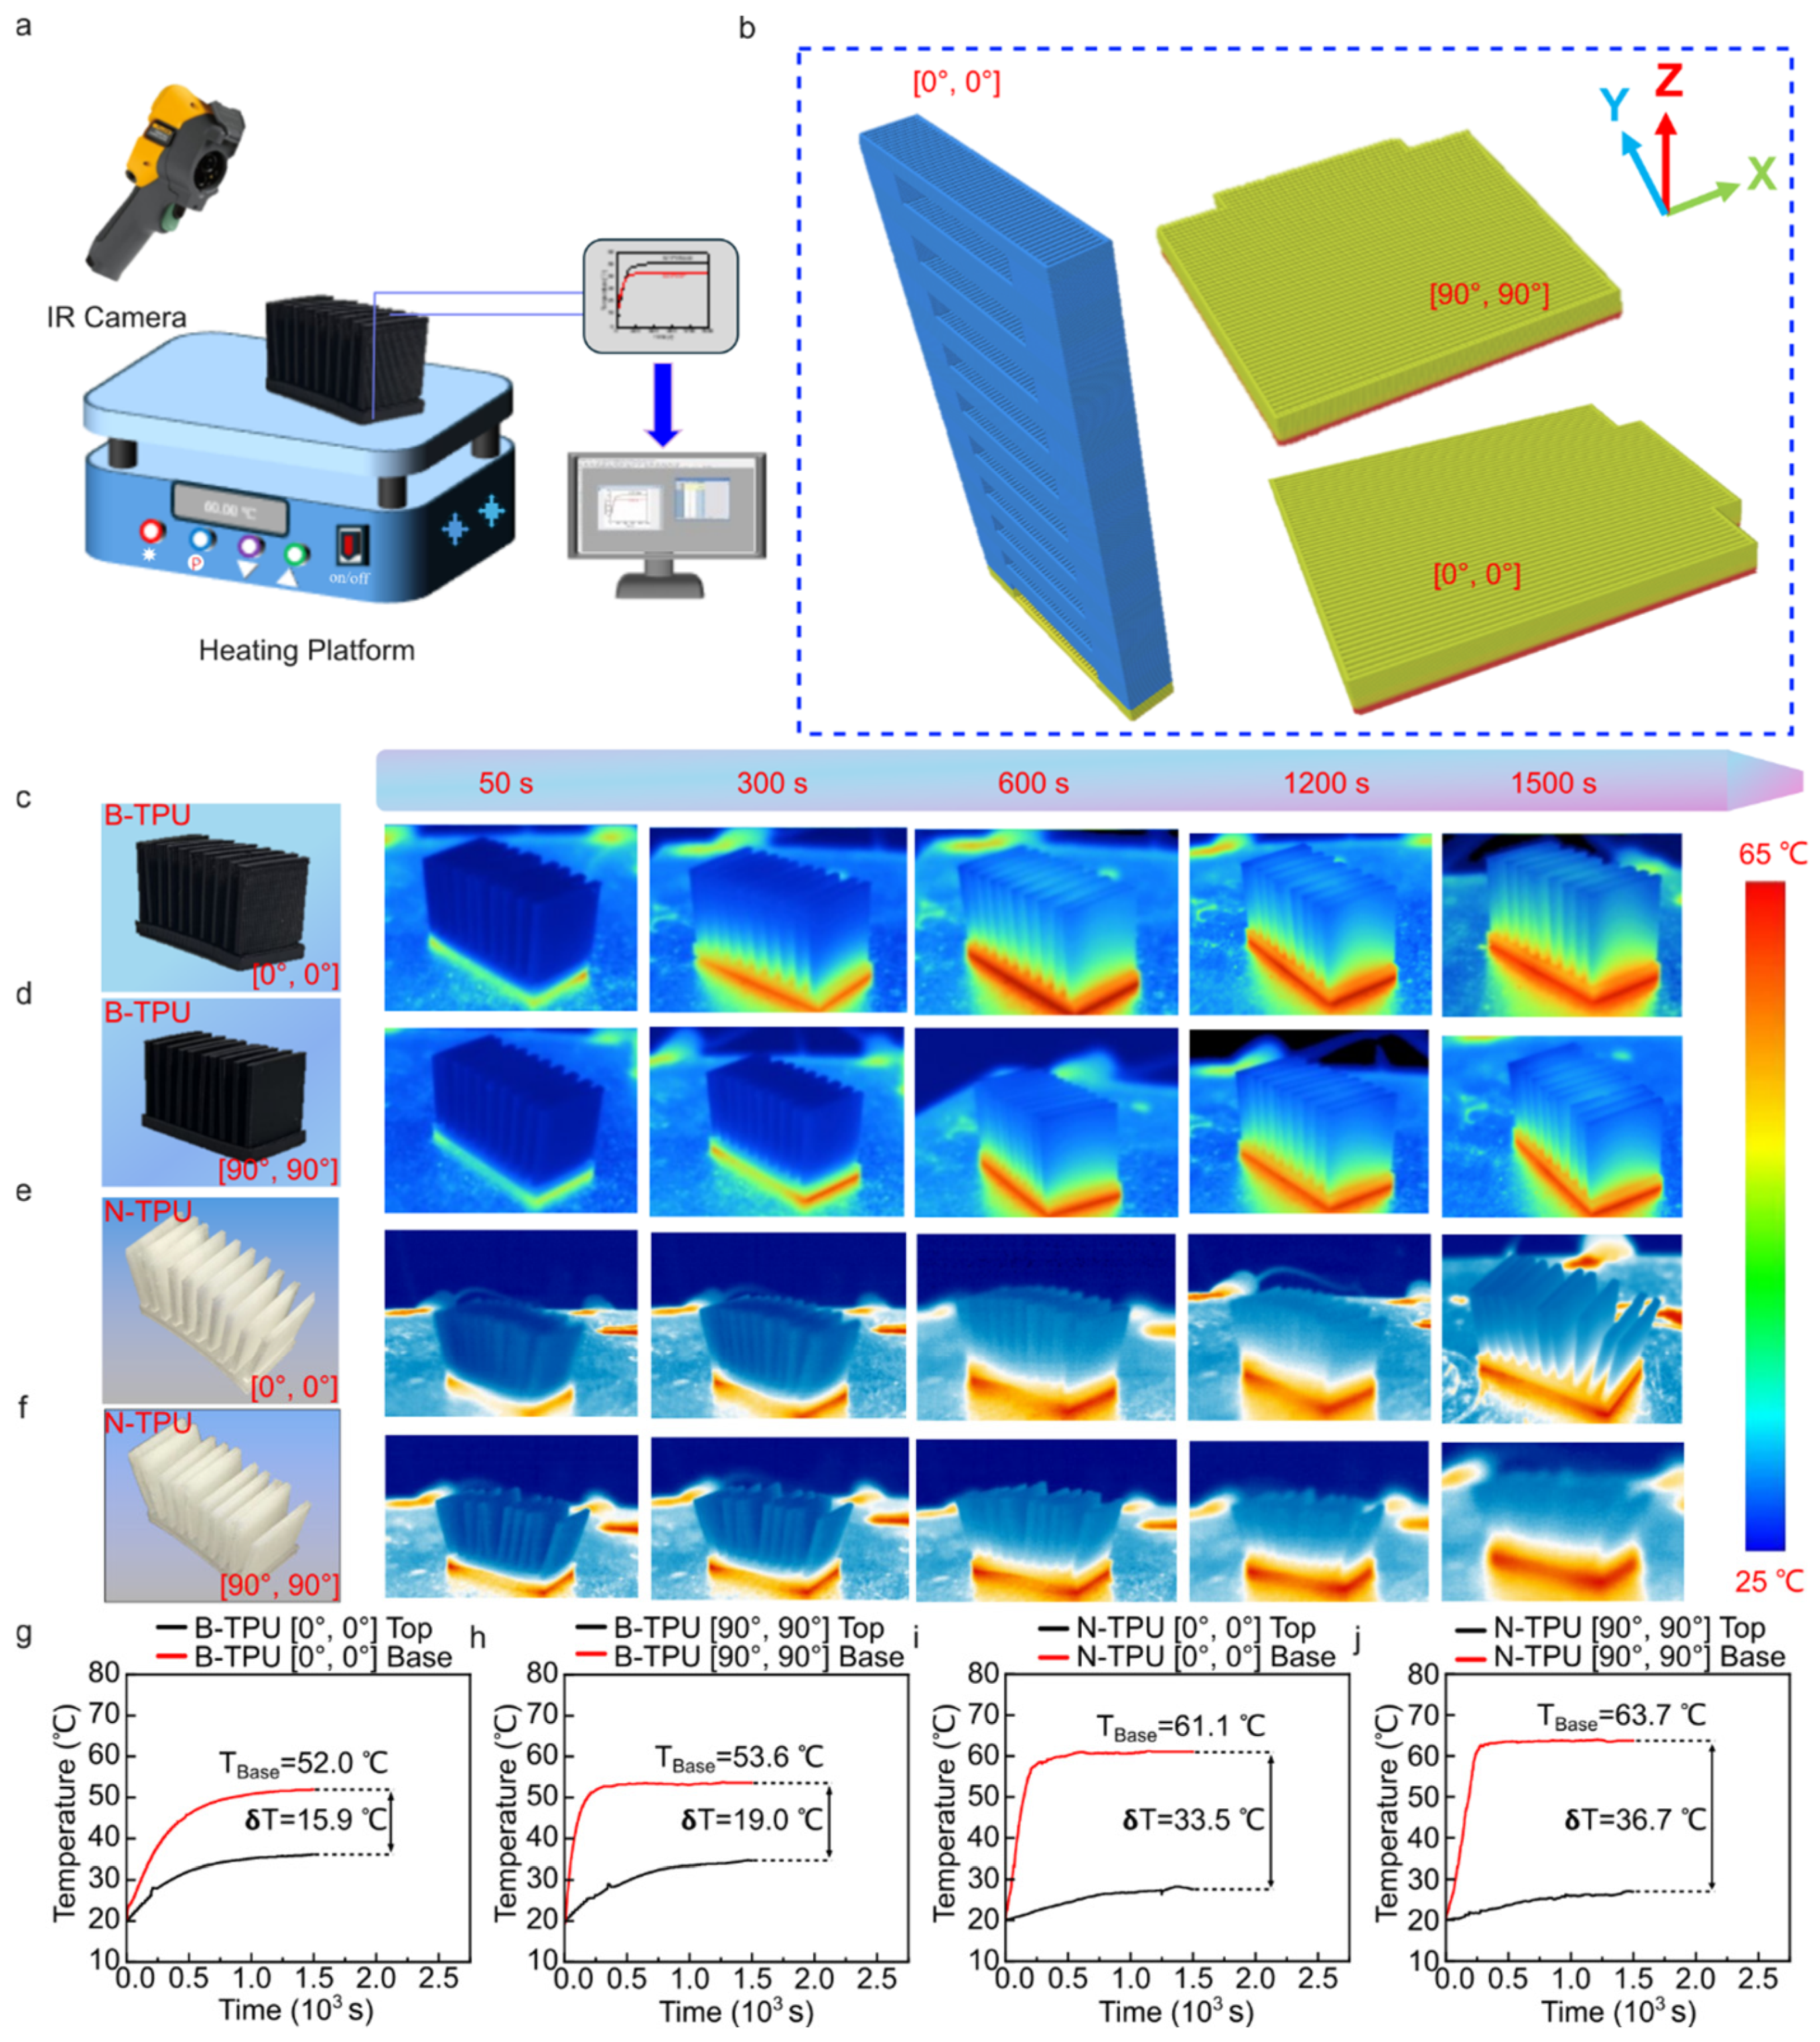
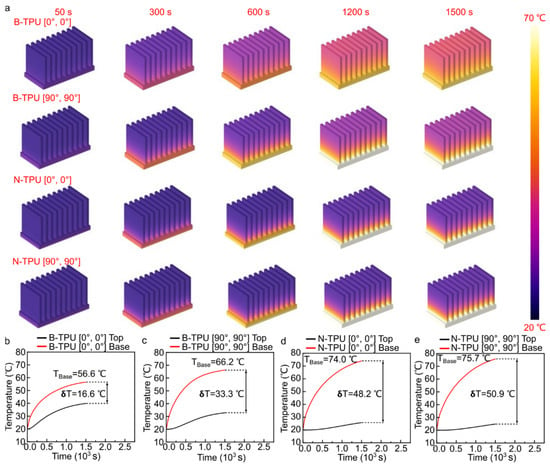
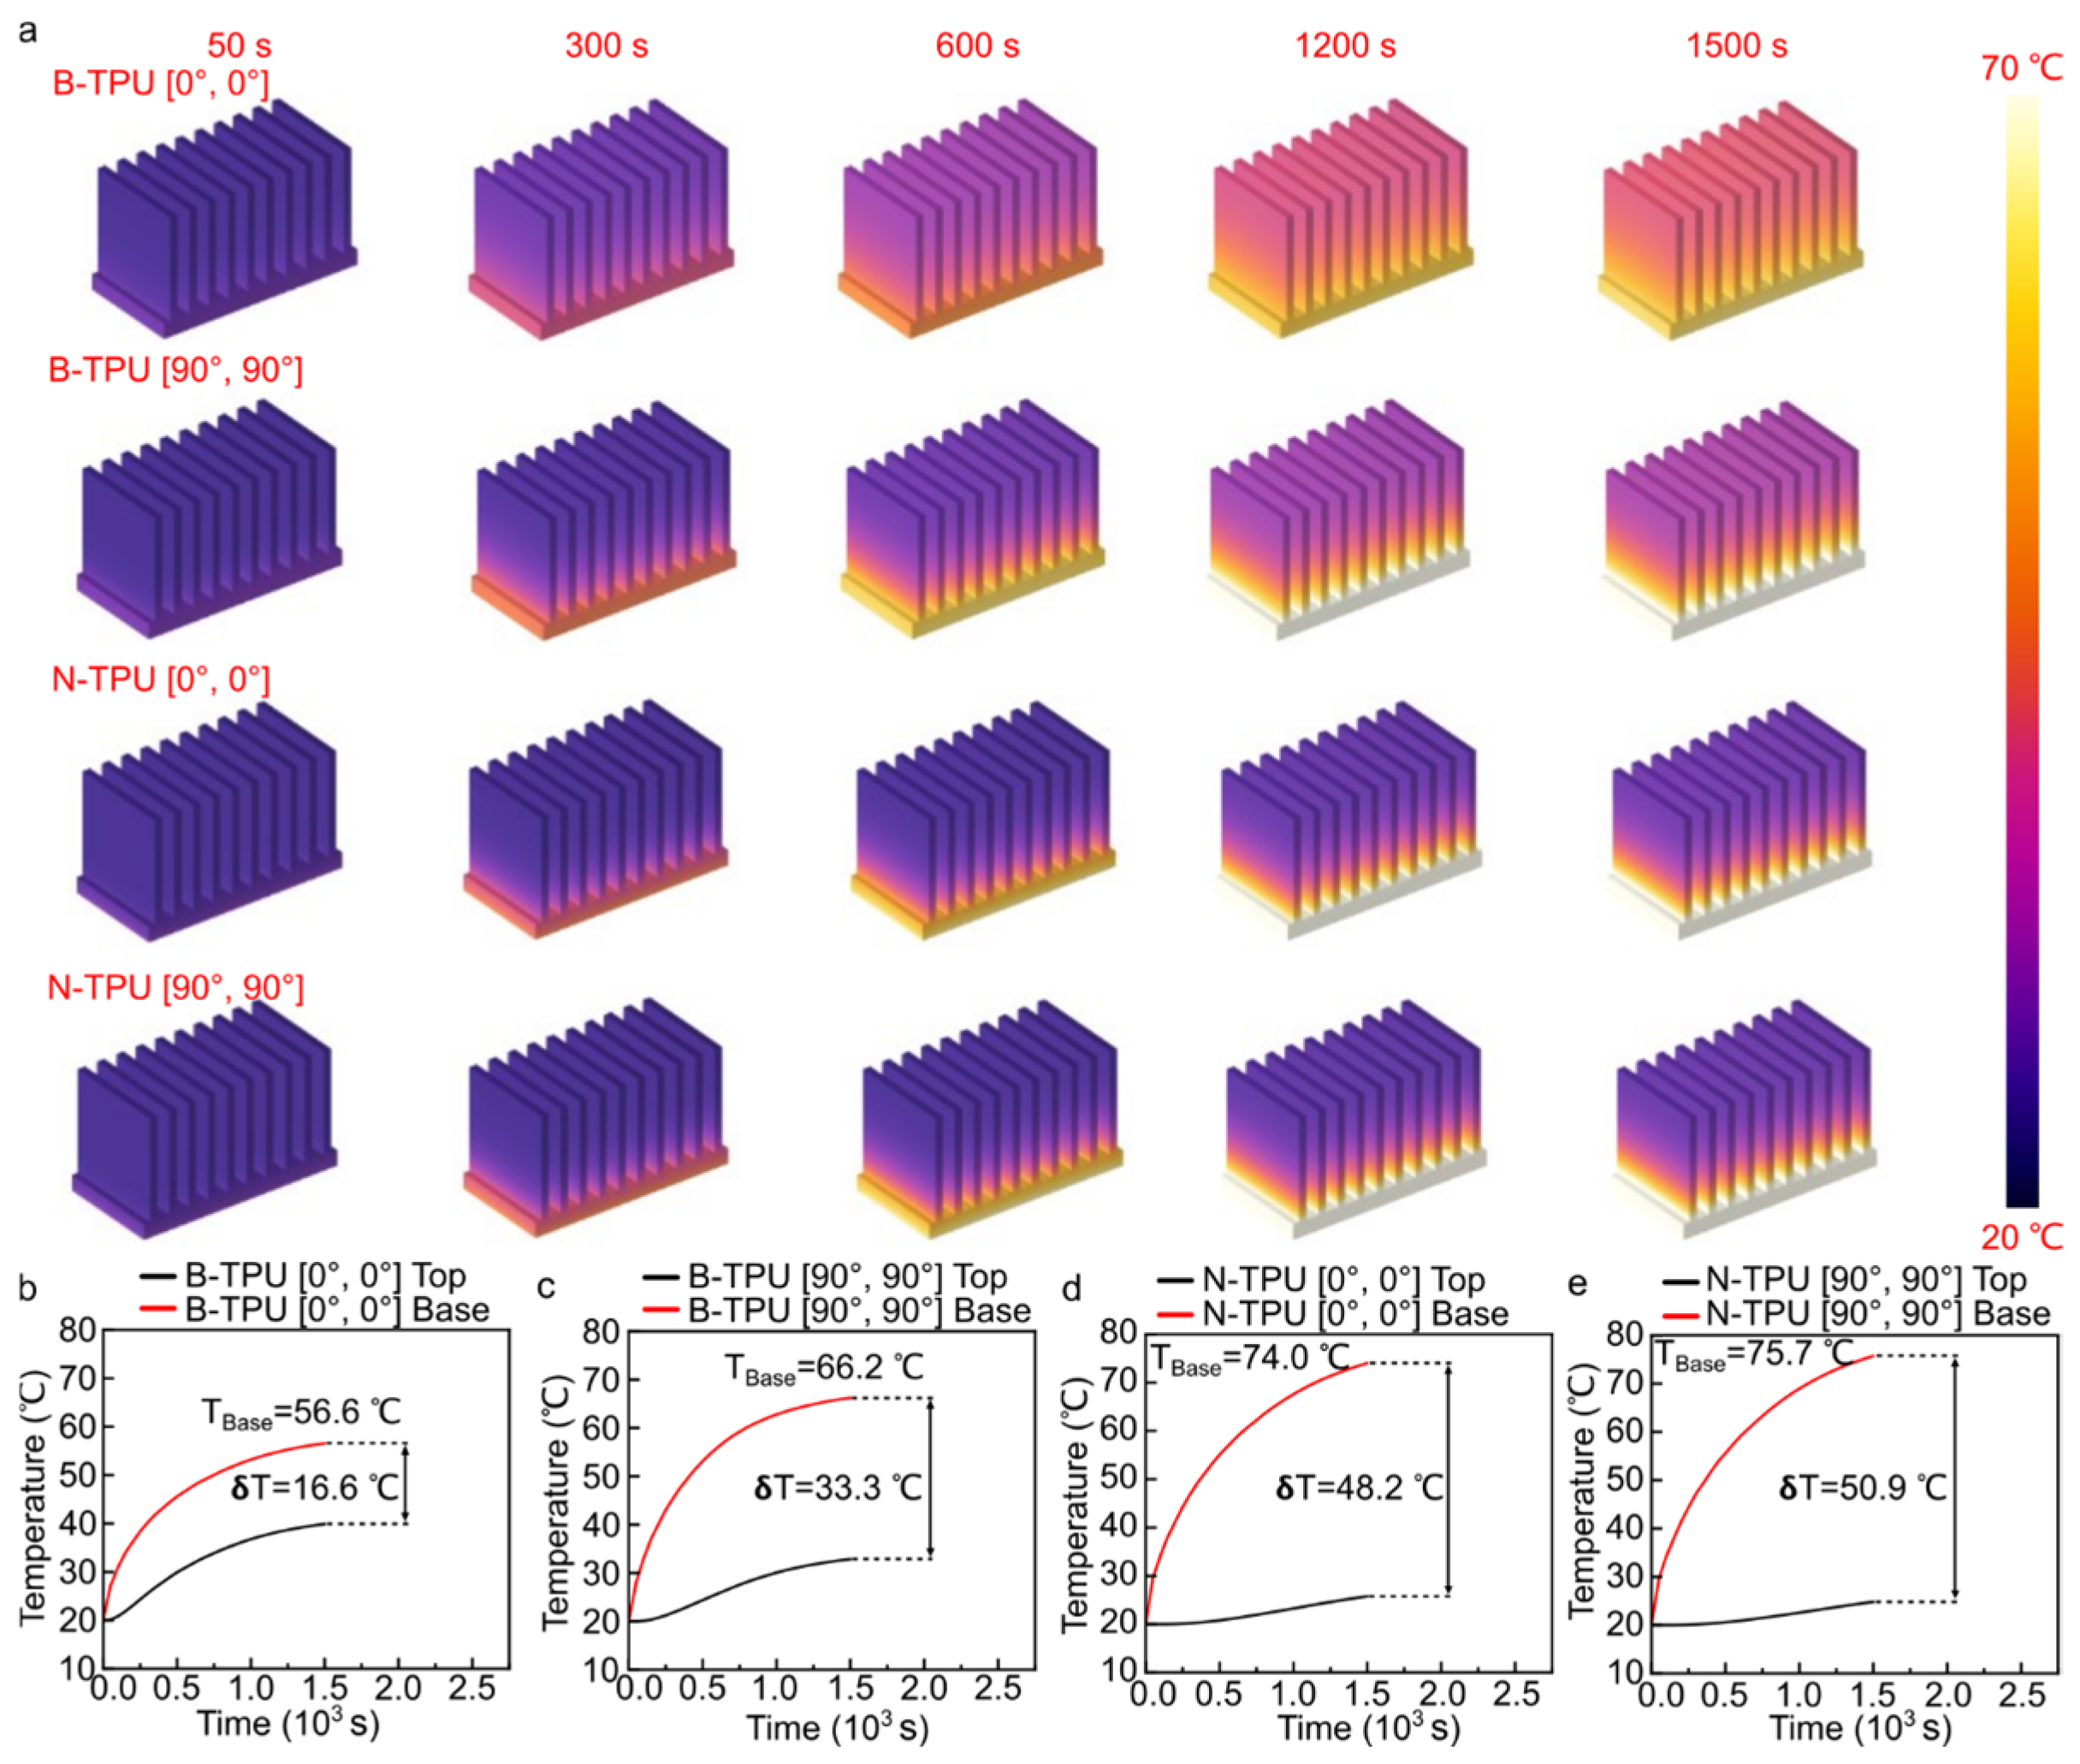
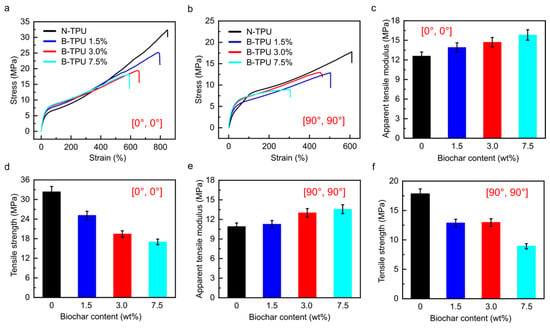
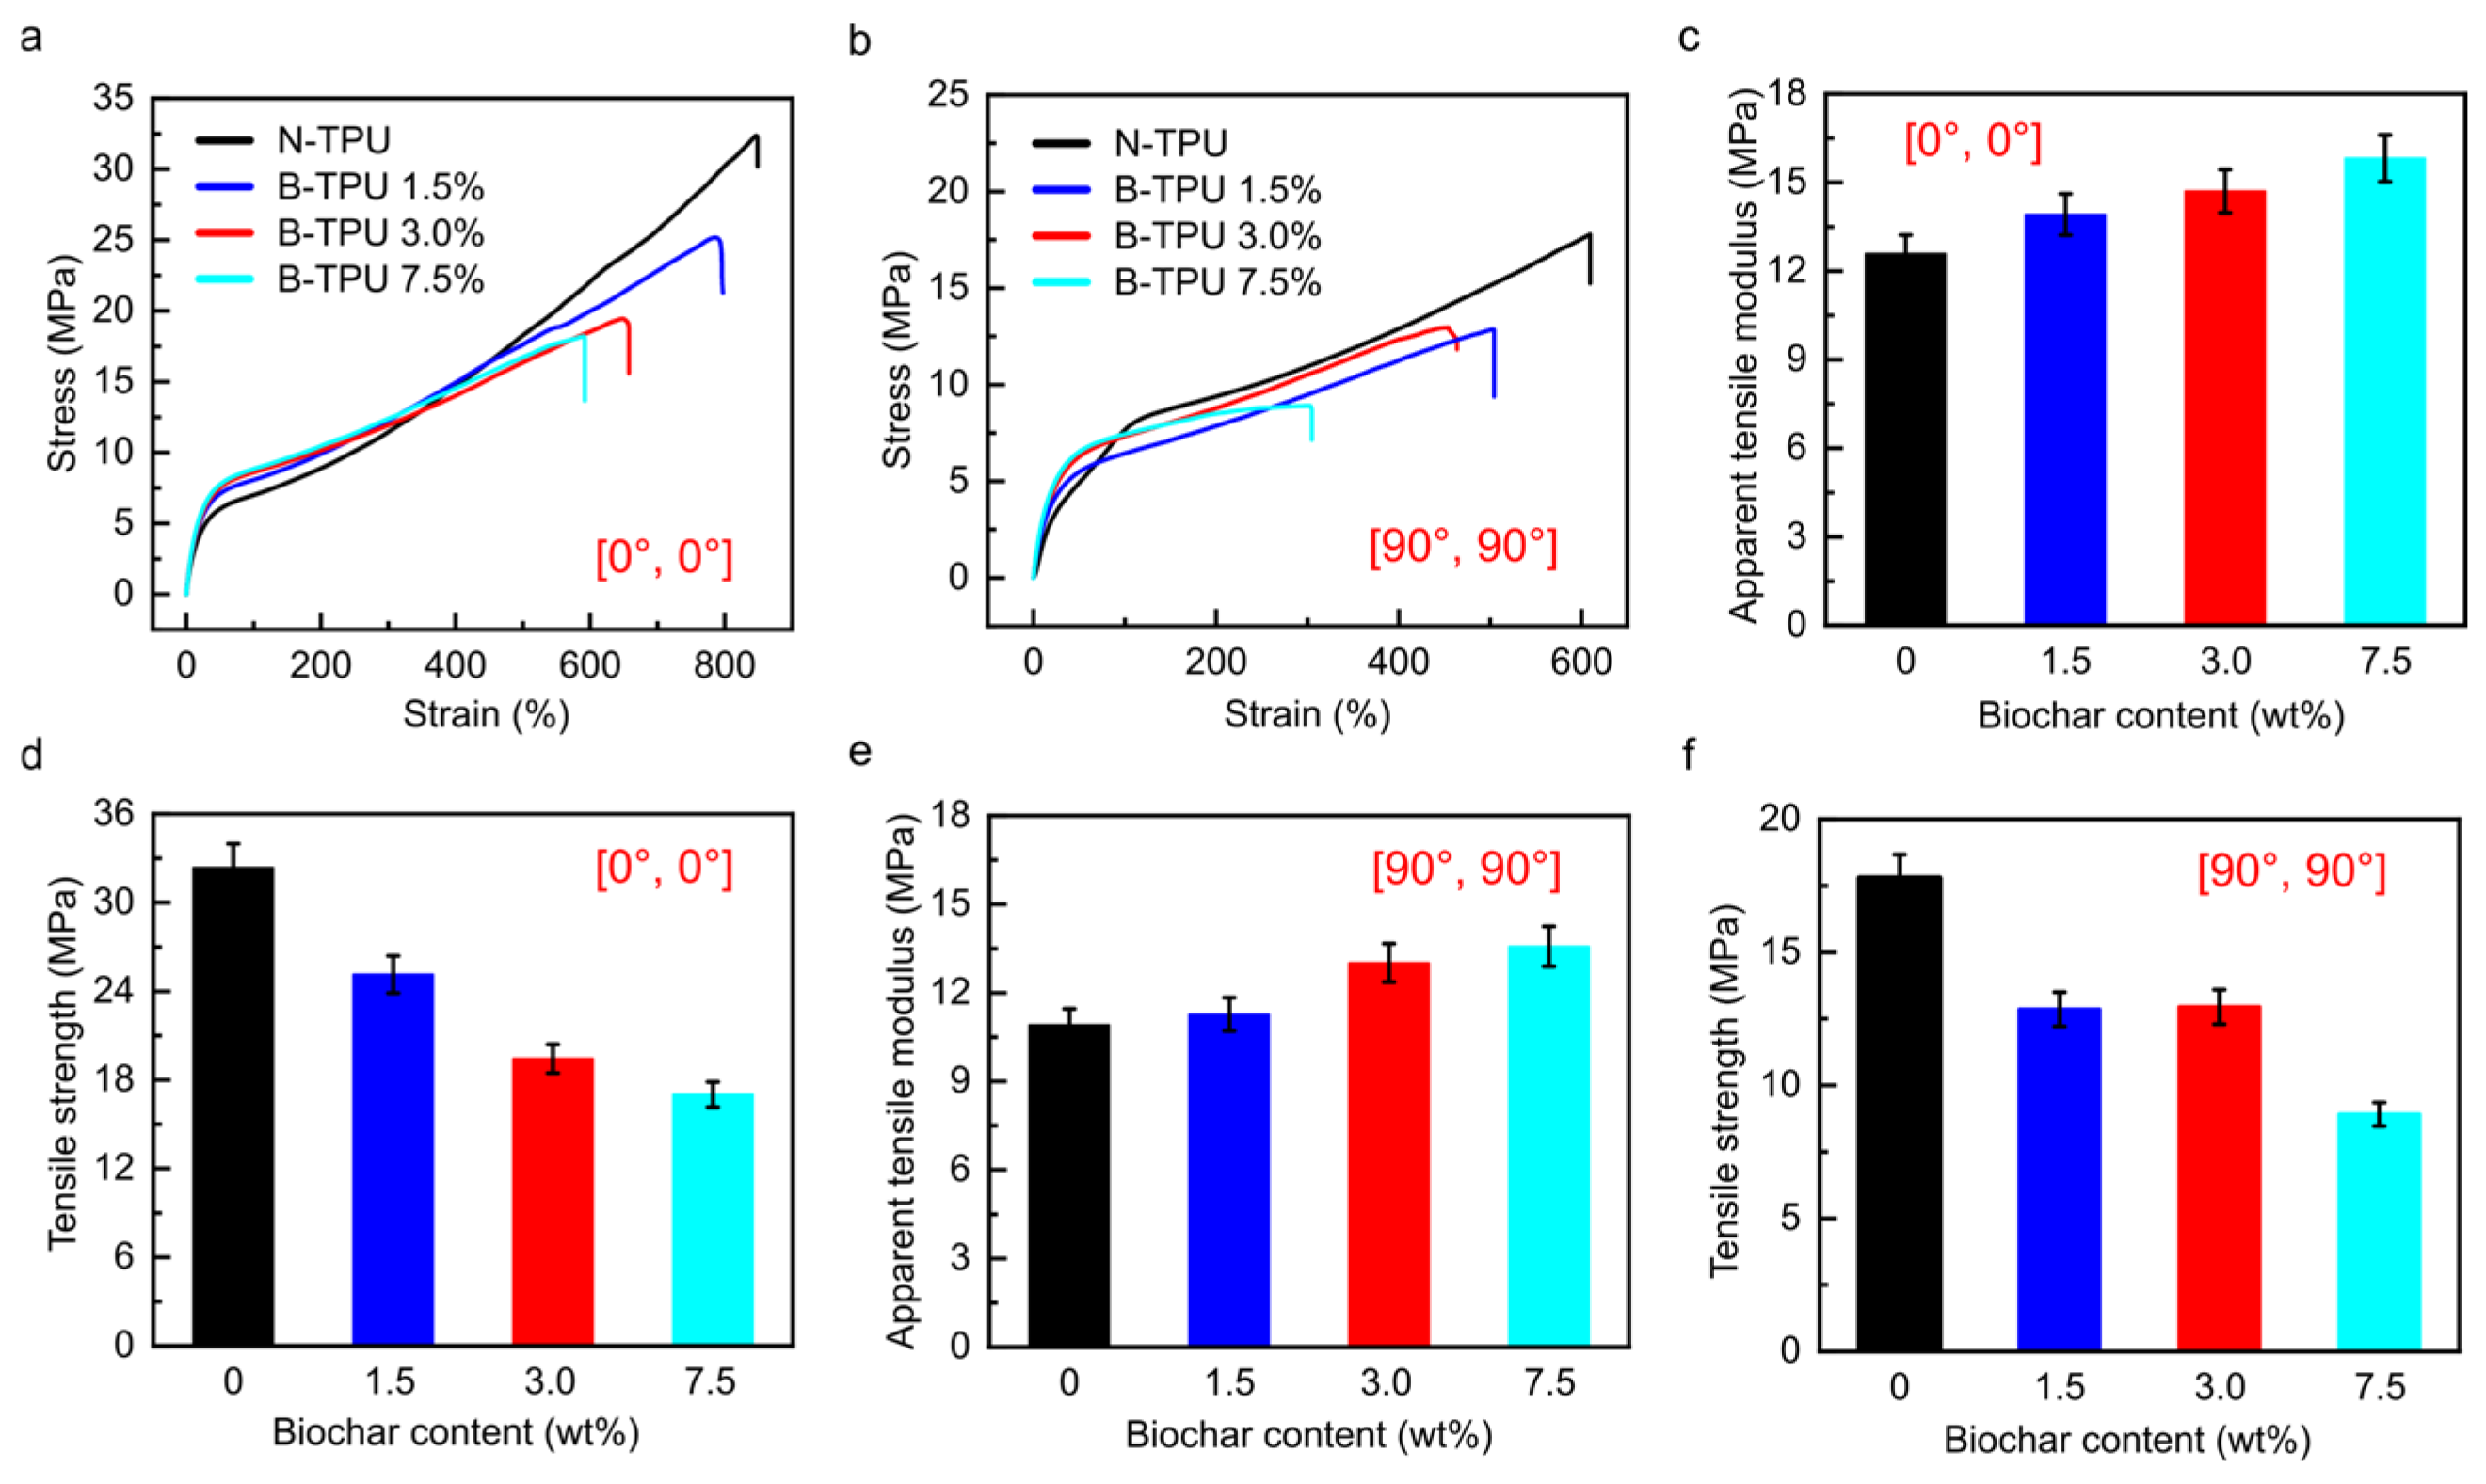
Disclaimer/Publisher’s Note: The statements, opinions and data contained in all publications are solely those of the individual author(s) and contributor(s) and not of MDPI and/or the editor(s). MDPI and/or the editor(s) disclaim responsibility for any injury to people or property resulting from any ideas, methods, instructions or products referred to in the content. |
© 2026 by the authors. Licensee MDPI, Basel, Switzerland. This article is an open access article distributed under the terms and conditions of the Creative Commons Attribution (CC BY) license.