


Abstract
Background: The characterization of documented violence among individuals under forensic psychiatric supervision is challenging because violent behaviour is heterogeneous and influenced by multiple clinical, behavioural, and contextual factors. Machine learning may provide a useful approach for examining associations between these characteristics and documented violence severity. Objective: To develop and internally evaluate an Extreme Gradient Boosting (XGBoost) model for retrospectively classifying documented violence severity using clinico-administrative information extracted from judicial decisions of Quebec’s Commission d’examen des troubles mentaux (CETM). Methods: This retrospective observational study included 1386 anonymized judicial records. Documented offence severity was categorized using a five-level scoring system based on the MacArthur framework and subsequently dichotomized into lower (scores 0–1) and elevated (scores 2–4) severity categories. A two-stage feature-selection procedure incorporating LASSO regression and permutation feature importance was used to identify informative variables. Classification performance was evaluated using stratified five-fold cross-validation. Shapley Additive exPlanations (SHAP) were used to examine the relative contribution of individual predictors. Results: Of the 1386 observations, 825 (59.5%) were classified in the elevated-severity category and 561 (40.5%) in the lower-severity category. The model achieved an overall classification accuracy of 0.702, with precision of 0.752, recall of 0.744, and an F1 score of 0.748 for the elevated-severity class. The originally reported area under the receiver operating characteristic curve was 0.820. Recent aggression, police involvement, and rule violations were identified as influential variables in the reported SHAP analysis. Conclusions: This study demonstrates the feasibility of using machine learning to retrospectively classify documented violence severity from forensic psychiatric judicial records. The findings provide insight into associations between clinical and forensic characteristics and historical offence severity. However, the model was not designed or validated to predict future violent behaviour. External validation, assessment of calibration, and prospective evaluation would be necessary before considering any clinical or forensic application.
1. Introduction
1.1. Violence in Forensic Psychiatry
Violence remains one of the most complex and pressing challenges across mental healthcare systems, particularly in forensic psychiatry, where clinicians must simultaneously address therapeutic needs and public safety. A substantial proportion of the public overestimates the association between severe mental illness and violent behaviour [1]. However, research indicates that public perception often overestimates the link between mental illness and violent behavior, mostly fueled by media portrayals of rare but sensational incidents [2]. The reality is that individuals with severe mental illness are responsible for only a small fraction of violent crimes [3]. Also, to evaluate the risk of violence of individuals, contemporary research in violence risk assessment has distinguishes static and dynamic risk factors, emphasizing that recent behavioral instability and contextual variables are among the strongest predictors of violence [4]. Despite decades of research, predicting violent behavior remains challenging [5]. Most studies have investigated risk factors in violent behavior, but could not predict the risk of violence accurately, due to the complex and very heterogeneous nature of violence occurrence for each person [5,6,7].
From a legal perspective, when violence is directly linked to a mental health disorder, the justice system may divert the individual toward forensic psychiatric care under the not criminally responsible on account of mental disorder (NCRMD) or unfit to stand trial [8]. The objective is to focus on risk management and clinical rehabilitation. For that, the clinician must prepare a detailed psychiatric report with evidence-based assessments that the individual demonstrated a risk of recidivism if not taking care of with psychiatric care [8]. Nonetheless, the psychiatric report is only a recommendation, and the mental health review boards can disagree with it and take another decision.
1.2. The Role of the CETM
In Quebec, the Commission d’examen des troubles mentaux (CETM) renders decisions regarding individuals found not criminally responsible or unfit to stand trial due to mental disorders. These decisions rely on a complex synthesis of clinical, forensic, and contextual factors to determine an individual’s potential threat to others. However, these judicial deliberations often remain difficult to formalize, highlighting a need for a new model to better understand the determinants of high-stakes decisions. To support these decisions, clinicians and legal experts traditionally employ structured tools or actuarial scales, such as the Historical-Clinical-Risk Management-20 (HCR-20) and the Brøset Violence Checklist (BVC), to determine the violent risk levels of the patients. Although these tools are widely implemented in psychiatric and forensic settings, their predictive validity often varies by population, type of outcome, and follow-up period [9]. These instruments may not always capture the nuances in the rich narrative documentation of the legal system. In this regard, the Société Québécoise d’information juridique (SOQUIJ) serves as a unique data source for these judgments, containing a vast amount of clinico-administrative data extracted from forensic psychiatric hearings.
1.3. The Emerging Role of Machine Learning
Despite advances in structured risk assessment, important limitations remain, including moderate predictive accuracy, limited adaptability to complex data, and difficulty integrating large volumes of heterogeneous information [10,11]. Artificial intelligence (AI) offers a promising avenue for identifying patterns in complex data. Specifically, machine learning (ML) algorithms, such as Extreme Gradient Boosting (XGBoost), can be used to classify outcomes and to minimize classification errors in structured clinical datasets [12]. Recent studies suggest that ML models can achieve predictive accuracy comparable to and even exceeding traditional risk assessment tools [13]. To better understand how individual predictors contribute to model outputs, some techniques, such as Shapley Additive exPlanation (SHAP), are used to better understand the model prediction. In a forensic context, SHAP helps assign an importance for each value in a particular prediction [14]. It helps understand the reasons behind certain high-risk classifications by informing which variables have the most influence on violence risk assessment [14]. In the present study, the model was developed to classify documented violence levels based on information extracted from CETM judicial decisions, rather than to predict the occurrence of future violent behaviors.
In the context of forensic psychiatric care, existing violence risk assessment approaches may not fully explore all available information. However, the potential of machine learning (ML) to predict violence risk remains insufficiently explored. Such a model could be used as a support tool in the decision making by clinicians and professionals involved in the assessment of individuals under the CETM. Rather than replacing established clinical judgment or structured risk assessment tools, the model is intended to complement existing approaches by integrating multiple risk factors into a single predictive framework.
The consideration of potential sources of bias is particularly important when developing predictive models for violence risk assessment. The information contained in publicly accessible judicial records may be influenced by differences in clinical documentation, legal processes, and the availability of information across cases. Consequently, the models developed may reflect existing differences or bias within the data. In addition, the publicly available dataset was limited to information that could be extracted from available judicial records, which restricted the assessment of more comprehensive sociodemographic characteristics and potential health inequalities.
1.4. Objectives of This Study
The primary objective of this study was to develop and internally evaluate a machine learning (ML) model to classify violence-risk levels, categorized using the MacArthur Violence Scale, from clinico-administrative data extracted from SOQUIJ judgments. Specifically, this research aimed to evaluate the classification performance of an XGBoost classifier and use SHAP analysis to identify the most influential retrospective predictors contributing to the model classifications within the CETM population.
2. Methods
2.1. Study Design and Data Source
This retrospective observational study used clinico-administrative data extracted from publicly accessible judicial decisions issued by the CETM in Quebec and available through the Société québécoise d’information juridique (SOQUIJ) database. A total of 1386 judicial records were analyzed. Each record was assigned a violence severity category based on the MacArthur Violence Risk Scale, which was dichotomized into low and elevated categories. The dataset consisted of structured information derived from forensic psychiatric hearings, including socio-demographic characteristics, clinical variables, and forensic history. Therefore, the data did not provide sufficient information to establish a complete and reliable date range for all included records. The analysis was therefore restricted to information available and extractable from these publicly accessible records, and no additional information was accessed for the purposes of this study. Machine learning methods were then applied to these categorized records to examine the contribution of clinico-administrative variables to the classification of documented violence severity. This study is reported in accordance with the TRIPOD+AI statement for studies developing and evaluating multivariable prediction models using machine-learning methods [15].
The initial dataset was inspired by a structured coding framework based on the methodology proposed by Myszak et al. [2]. It was specifically developed to systematically extract clinico-administrative and forensic information from CETM judicial decisions [2]. According to the dataset, it includes different predictors, including: medico-administrative information (e.g., hearing characteristics, legal representation, duration under CETM supervision), socio-demographic characteristics (e.g., age, sex, social context), clinical history (e.g., psychiatric diagnoses, prior hospitalizations, substance use), clinical presentation in the past year (e.g., psychotic symptoms, aggression, treatment adherence), judicial history (e.g., prior offenses, rule violations, police involvement), and other variables to the verdict (e.g., treatment team recommendation) [2]. In this study, they placed a particular emphasis on dynamic risk factors, such as recent aggression, non-compliance with treatment or institutional rules, and acute symptomatology [2]. Unlike static factors, dynamic risk factors are modifiable and reflect the individual’s current clinical and behavioral state. That is why emphasis was placed on dynamic risk factors; it has also been shown that these factors play a role in short-term violence risk prediction, as they capture fluctuations in symptom severity, treatment adherence, and environmental stability [16]. Additionally, to ensure methodological rigor and minimize potential data leakage, variables directly referring to judicial decisions or procedural aspects of hearings (e.g., legal outcomes, court requests, final decisions) were excluded from the present study.
2.2. Ethical Considerations
Ethical approval was not required for this study, as it relied on publicly accessible judicial decisions available through the SOQUIJ dataset. No additional private data were accessed or collected for the purposes of this study.
2.3. Relationship to Previous Publications
The present study used a publicly accessible judicial decisions obtained through the SOQUIJ database. Previous publications have also examined CETM decisions retrieved from this database [2,8]. However, the present study addressed a distinct research objective, focusing on the classification of documented violence levels using the MacArthur Violence Risk Scale and machine learning methods. Differences in study objectives, eligibility criteria and sample sizes are reported across these publications. As the records are anonymized and no unique identifiers are available, a potential overlap in the judgments or individuals included across studies could not be determined. The present study should therefore be interpreted as a separate research analysis, while the possibility of overlapping source records cannot be excluded.
2.4. Population
The study population comprised judicial records concerning individuals under CETM supervision, including individuals found not criminally responsible on account of mental disorder (NCRMD) or unfit to stand trial. Because the dataset is publicly accessible, information regarding the original clinical setting, the recruitment process and some individual characteristics was limited to what was documented in the available records. All eligible records accessible from the SOQUIJ that contained the outcome and predictors were included in this study. Records that could not contribute to the definition of the outcome or model predictors were excluded from the analyses. All eligible records available in the dataset were included in the analysis. No a priori sample-size calculation was performed; the analytic sample size was therefore determined by the number of records meeting the inclusion criteria and containing sufficient information to define the outcome and candidate predictors. Due to the anonymization of the dataset, unique personal identifiers were unavailable, preventing the verification of whether certain individuals accounted for multiple judicial decisions.
The unit of analysis was the judicial record rather than the individual patient. Because the source records were anonymized and did not contain unique patient identifiers, it was not possible to determine whether multiple judicial records corresponded to the same individual. Consequently, the 1386 observations could not be confirmed to represent 1386 distinct individuals, and subject-level grouping during cross-validation was not feasible.
2.5. Outcome Definition
The outcome of this study was the severity of documented violence extracted from CETM judicial decisions, using a study-specific ordinal classification adapted from the MacArthur violence severity framework [17]. The classification comprised five levels ranging from 0 to 4. A score of 0 represented offenses without documented interpersonal violence, such as theft, property damage, or breaches of probation conditions. A score of 1 corresponded to threatening or intimidating behavior, including verbal threats and criminal harassment, without documented physical assault. A score of 2 represented physical aggression or confrontational behavior, including assault-related offenses without documented weapon involvement or aggravated assault, as well as obstruction of a peace officer. A score of 3 corresponded to weapon-related offenses, including assault with a weapon. Finally, a score of 4 represented severe interpersonal violence, including aggravated assault involving serious bodily harm or endangerment of another person’s life.
For each judicial record, a severity score was assigned based on the nature of the documented offenses, irrespective of the year in which they occurred. Outcome coding was performed independently by two reviewers (SG, AH) using a standardized coding procedure, with disagreements resolved through consensus. For model development, the ordinal outcome was dichotomized into lower documented violence (scores 0–1) and elevated documented violence (scores 2–4). This dichotomization was motivated by the limited number of observations in certain ordinal categories and was intended to improve model stability and interpretability. Importantly, this classification reflects the severity of documented offenses rather than the prospective probability of future violent behavior.
2.6. Predictor Selection
Feature selection was conducted using a two-step procedure combining statistical and machine learning (ML) approaches. This approach was chosen to balance classification performance, model interpretability and robustness.
First, Least Absolute Shrinkage and Selection Operator (LASSO) regression with cross-validation was applied to the full set of predictors to identify variables with non-zero coefficients. LASSO is a penalized regression method that applies L1 regularization, shrinking less informative coefficients toward zero and retaining predictors that contribute most strongly to the outcome [18].
Second, permutation feature importance derived from ensemble tree models was used to rank the contribution of the remaining variables to the classification process. This method assesses the decrease in model performance when the values of a given feature are randomly permuted, thereby quantifying its importance in the classification process. Unlike traditional regression-based approaches, permutation importance captures non-linear relationships and interactions between variables. In addition, to help the clinical interpretability and consistency, prior research has been established with the literature on violence risk assessment. It has identified factors such as recent aggression, substance use, treatment non-adherence, and prior criminal involvement as key contributors to violence risk in psychiatric populations [19,20,21]. This process resulted in the identification of the ten most informative predictors:
- Aggression in the past year;
- Police involvement in the past year;
- Non-compliance with rules or conditions;
- History of incarceration;
- Prior psychiatric hospitalizations;
- Substance use disorder;
- Presence of paranoid delusions;
- Aggressive behavioral symptoms;
- Duration under CETM supervision;
- Age.
To minimize potential information leakage and obtain an internally validated estimate of model performance, feature selection was incorporated within a stratified five-fold cross-validation framework. At each iteration, four fifths (80% of the observations) were used for model development, while the remaining fifth (20%) was reserved exclusively for performance evaluation. All preprocessing procedures, including missing-value imputation, categorical variable encoding, and feature selection, were performed using the training partition only.
Within each training partition, LASSO-based variable selection and permutation feature importance were conducted before fitting the XGBoost classifier. Hyperparameters were optimized through an additional cross-validation procedure restricted to the training data. The resulting model was subsequently evaluated on the held-out validation fold, which had not contributed to preprocessing, feature selection, or model optimization.
This process was repeated across all observations, and performance metrics were aggregated to estimate internal classification performance. Following cross-validation, the final model was refitted using the complete dataset, and the ten retained predictors were reported for interpretability and subsequent SHAP analyses. Importantly, the final full-dataset predictor selection was distinct from the fold-specific selection procedures used to estimate model performance.
2.7. Data Preprocessing
Prior to model training, several preprocessing steps were performed to improve data quality, reduce bias and optimize model performance.
- Missing values in continuous variables were imputed using the median.
- Categorical variables were encoded using one-hot encoding.
- Continuous predictors were standardized when appropriate.
- Class imbalance between violence categories was addressed using class weight adjustment during model training.
2.8. Machine Learning Model
The classification model was developed using XGBoost, a tree-based ensemble algorithm widely used for structured clinical datasets. XGBoost constructs decision trees using gradient boosting to minimize classification error while controlling overfitting through regularization. The algorithm operates by sequentially constructing multiple decision trees, where each tree attempts to correct the prediction errors generated by previous trees [12].
Hyperparameter tuning was performed using grid search combined with cross-validation to identify the parameter combination associated with optimal predictive performance. The hyperparameters explored included the following:
- Learning rate;
- Maximum tree depth;
- Number of estimators;
- Subsampling rate.
At the end, to enhance transparency and interpretability, SHAP values were used to quantify the contribution of each predictor to model predictions. SHAP values provide a consistent framework for estimating individual variables to the model classification outputs.
2.9. Model Validation
Model performance was evaluated using stratified 5-fold cross-validation to ensure that the distribution of violence risk categories was preserved in each fold. Performance metrics included, precision, recall, F1 score, accuracy, and area under the Receiver Operating Characteristic Curve (AUC). The F1 score was selected as the primary evaluation metric because it combines precision and recall into a single measure. However, it should be interpreted alongside other performance metrics, such as accuracy and the AUC to a better interpretation. Also, a p-value of less than 0.05 was considered statistically significant. The AUC was calculated in Python 3.9 using the roc_auc_score function from scikit-learn. An approximate 95% confidence interval was estimated using the Hanley–McNeil analytical method, which derives the standard error from the AUC and the number of observations in each outcome category. The confidence limits were calculated using the normal approximation.
To minimize potential data leakage, data preprocessing, feature selection, and hyperparameter optimization were incorporated within the cross-validation framework. For each of the five stratified folds, missing values were imputed using the median values calculated exclusively from the corresponding training partition. Feature selection, combining LASSO regression and permutation feature importance, was performed using training data only. Hyperparameter optimization was conducted through grid search with cross-validation restricted to the training partition. The resulting model was subsequently evaluated on the held-out validation fold, which was not used during preprocessing, feature selection, or hyperparameter tuning. Performance metrics were aggregated across the five validation folds to estimate internal classification performance.
A multivariable logistic regression classifier was also evaluated as a baseline comparator using the same ten predictors, preprocessing procedures, and stratified five-fold cross-validation partitions as the XGBoost model. A fixed probability threshold of 0.50 was applied to both classifiers to generate binary classifications and calculate accuracy, precision, sensitivity, specificity, and F1 score. No threshold optimization was performed. The ROC AUC was calculated from predicted probabilities across classification thresholds.
3. Results
The source dataset contained 1 386 observations, including 825 classified with higher levels of violence risk (MacArthur score ≥ 2) and 561 classified with lower risk (MacArthur score < 2). The records were anonymized; therefore, it was not possible to establish whether some observations referred to the same individual. Consequently, these counts represent observations in the dataset rather than confirmed numbers of unique individuals. The dataset comprised observations extracted from CETM judgments and included demographic, clinical, behavioral, and forensic variables. After excluding variables reflecting judicial decisions or procedural elements of hearings in order to minimize potential information leakage, the analytic dataset was used to develop a predictive model of violence risk based on the MacArthur Violence Scale. The original ordinal outcome was dichotomized to distinguish individuals with higher levels of violence risk (MacArthur score ≥ 2) from those with lower risk (MacArthur score < 2).
Using the feature selection procedure described above, ten predictors were retained for model development. These variables reflected domains commonly associated with violence risk in forensic psychiatry, including recent violent behavior, indicators of rule non-compliance, criminal justice involvement, psychiatric history, symptom severity, and demographic characteristics. The final model was trained using an XGBoost classifier and evaluated through stratified five-fold cross-validation. The results of multivariable logistic regression using LASSO-selected predictors are presented in Table 1.
Table 1.
Multivariable logistic regression using predictors selected by LASSO.
Aggression during the last year emerged as the strongest predictor of elevated violence risk (OR = 2.56, 95% CI [1.89–3.47], p < 0.001). Individuals presenting documented aggression within the year preceding the hearing were therefore more than twice as likely to belong to the high-risk violence category compared with individuals without recent aggression. Other predictors demonstrated a high risk of violence, such as; police involvement (OR = 2.05, 95% CI [1.55–2.73], p < 0.001), rule violation (OR = 1.82, 95% CI [1.37–2.41], p < 0.001), history of incarceration (OR = 1.71, 95% CI [1.28–2.29], p = 0.002), substance use disorder (OR = 1.62, 95% CI [1.21–2.17], p = 0.004), aggressive behavior (OR = 1.52, 95% CI [1.10–2.08], p = 0.011), and paranoid delusion (OR = 1.46, 95% CI [1.06–2.01], p = 0.021). Prior psychiatric hospitalization also demonstrated a significant association with elevated risk of violence, but a smaller association (OR = 1.36, 95% CI [1.01–1.83], p = 0.0043). Although duration under CETM supervision and age were retained during feature selection, neither variable reached conventional statistical significance.
Overall, the XGBoost model demonstrated an ability to discriminate between the two documented violence-severity categories between observations classified into lower and higher documented violence categories, by achieving an accuracy of 0.702, a precision of 0.752, a recall of 0.744, an F1 score of 0.748 ± 0.04 across cross-validation folds and an AUC of 0.82. These results indicate that the model was generally able to differentiate between the two categories, although it does not establish its ability to predict future violent behavior. Taken together, these findings support the feasibility of using XGBoost to classify documented violence levels from clinico-administrative information extracted from CETM judgements. Performance of the XGBoost are reported in Table 2.
Table 2.
Performance of the XGBoost model for predicting elevated violence risk (MacArthur score ≥ 2).
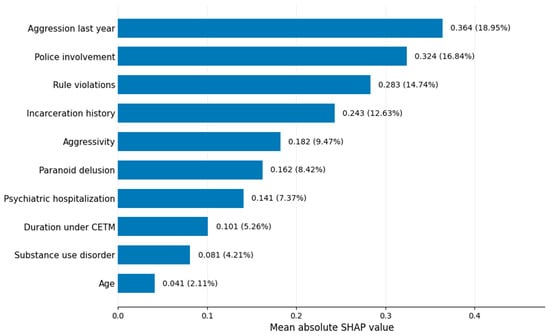
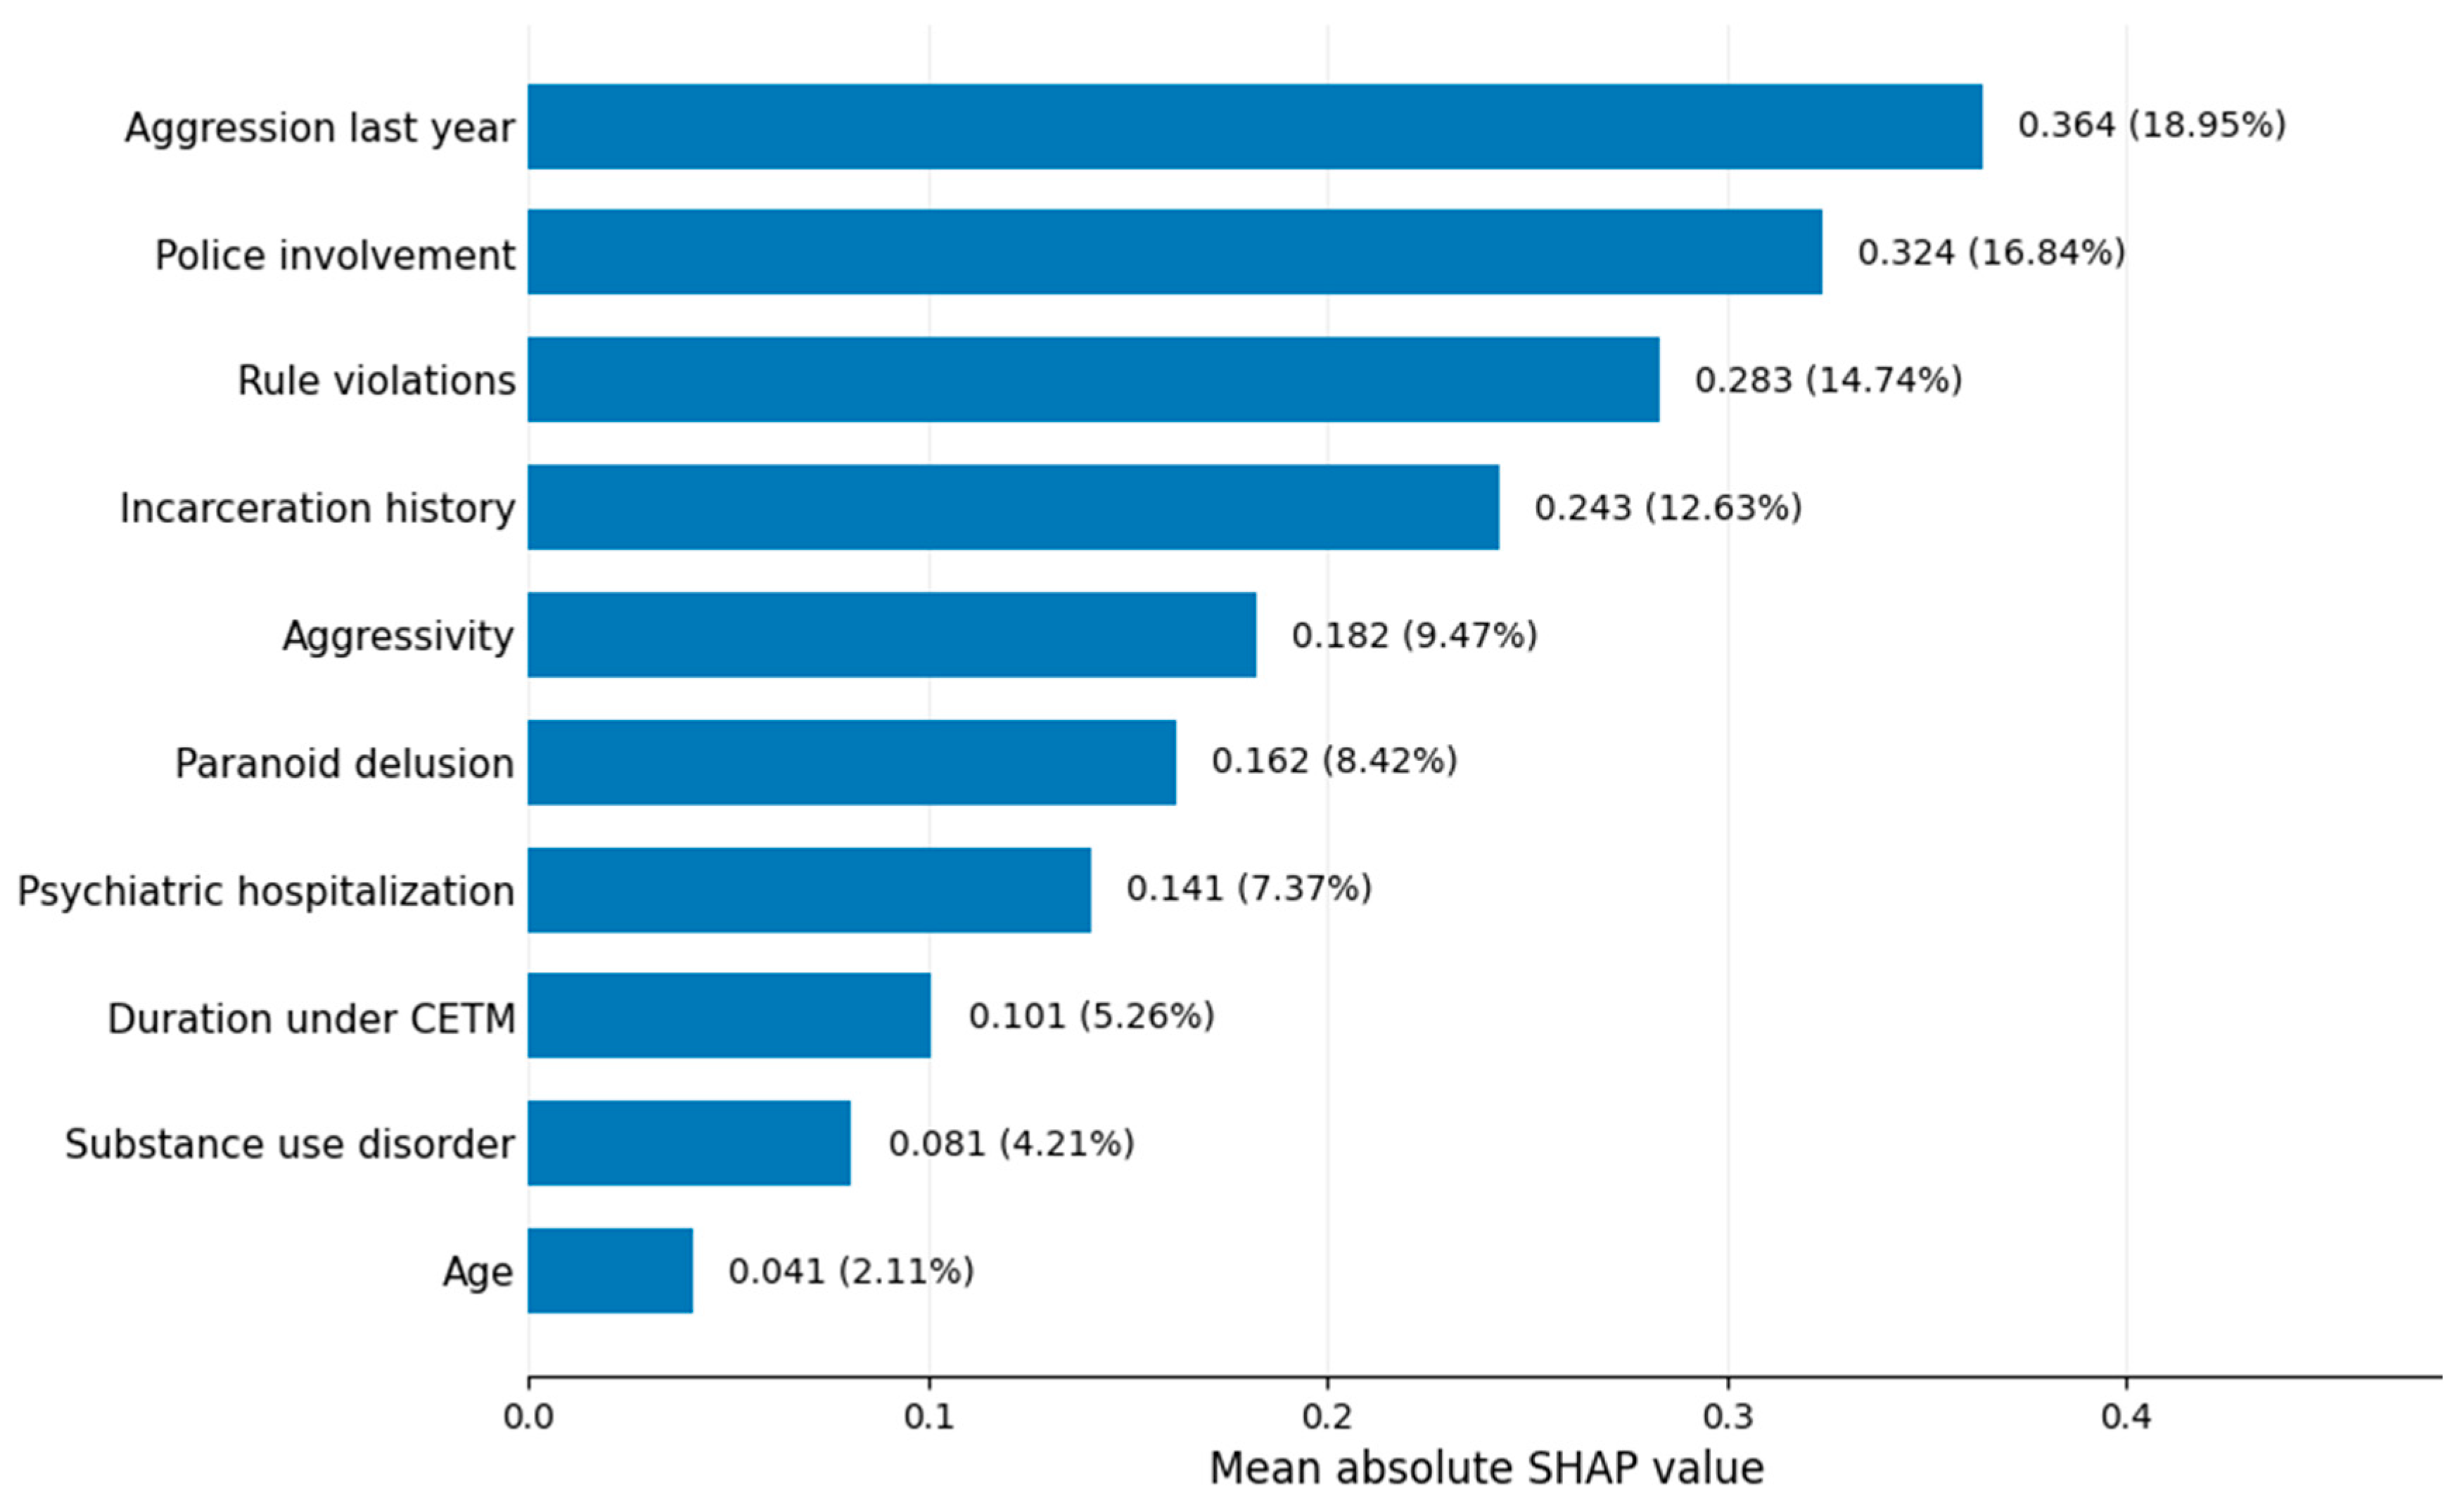
To improve transparency and interpretability, SHAP analyses were used to quantify the contributions of individual variables to model outputs. SHAP analyses provide a framework for estimating the marginal contribution of each feature. The results indicated that variables reflecting recent behavioral instability were among the most influential predictors of elevated violence risk. In particular, aggression within the previous year, police involvement, and documented violations of rules or conditions exerted the largest positive contributions to predicted risk. Clinical variables, including substance use disorder, paranoid delusions, and behavioral aggressivity, also contributed substantially to the model’s predictions, suggesting that both behavioral instability and active psychopathology play central roles in violence risk prediction. Additionally, indicators of psychiatric chronicity, such as prior hospitalizations and duration under CETM supervision, further increased predicted risk in several cases, although their influence was generally smaller than recent dynamic risk factors. Age demonstrated a more modest but consistent contribution to model predictions. The SHAP findings, shown in Table 3, suggest that the model relied primarily on dynamic and clinical variables when estimating the risk of violence. A SHAP summary plot is presented in Figure 1. Relative importance was calculated by dividing each predictor’s mean absolute SHAP value by the sum of the mean absolute SHAP values across all ten predictors and multiplying by 100.
Table 3.
Contribution of each predictor using SHAP analyses.
Figure 1.
SHAP summary plot.
In general, the results indicate that a relatively small set of clinically meaningful predictors can be used to achieve good predictive performance in identifying individuals at elevated violence risk within the CETM population. The model’s strongest predictors correspond closely to domains previously identified in violence risk assessment research, including recent violent behavior, substance use, psychiatric symptom severity, and social or legal instability. These findings support the feasibility of applying machine learning methods to structured forensic psychiatric data to assist in the identification of individuals at higher risk of violence. The confusion matrix of the results is presented in Table 4 and performance metrics are presented in Table 5.
Table 4.
Confusion matrix of the model.
Table 5.
Comparison of XGBoost and logistic regression performance with 95% confidence intervals.
Fairness
The present study used a publicly accessible dataset derived from judicial records. Consequently, the analyses were restricted to the demographic and clinical information available within these records. A formal assessment of model fairness across multiple sociodemographic groups was not conducted because the available dataset did not provide sufficiently comprehensive information to support such an analysis. Potential differences in documentation across cases may therefore influence model classification and constitute an important consideration for future external validation studies. No subgroup-specific performance analyses or algorithmic fairness mitigation procedures were performed because sufficiently complete sociodemographic information was unavailable.
4. Discussion
This study demonstrated the feasibility and utility of applying an XGBoost framework to clinic-administrative data extracted from the CETM judicial decisions via the SOQUIJ. Our model achieved a good discriminative performance, with an AUC of 0.82 and an F1 score of 0.748. Also, SHAP was able to identify several variables that contributed the more to an elevated classification. Although, several variables identified have already been described in the forensic psychiatry literature, the contribution of this study does not lie in identifying previously unknown risk factors. Rather, integrating these factors into a machine learning framework, it provides an approach for examining how multiple clinical, behavioural and administrative data contribute to the classification of documented violence with this specific population. These results demonstrate the feasibility of using machine learning to classify documented violence levels in CETM judicial records. Previous studies have suggested that machine learning approaches may achieve performance comparable to or greater than traditional structured actuarial tools, which often fail to capture the complex non-linear interactions in rich narrative [12,13,22]. However, the present study did not directly compare XGBoost with traditional risk assessment tools. Therefore, in this context, no conclusion can be drawn regarding the superiority of the XGBoost model over traditional risk assessment tools.
Structured risk assessment tools such as the HCR-20 remain a widely used instrument for violence risk assessment. However, these instruments generally require detailed clinical assessments and professional judgment, whereas machine learning approaches may offer a complementary way of identifying patterns and associations within a large volume of administrative data. Although the model achieved an AUC of 0.82, this result should not be interpreted as evidence of equivalent or superior performance compared with established instruments such as the HCR-20. The two approaches serve different purposes: the HCR-20 supports prospective clinical risk assessment, whereas our model classified documented violence severity based on information extracted from judicial records. Nevertheless, some of the variables identified as influential in the model are also relevant to clinical violence risk assessment, such as recent aggression and rule violations. This overlap suggests that the model identified indicators already recognized in forensic psychiatric practice. However, further research is needed to determine whether machine learning approaches based on judicial and clinical administrative data could complement structured actuarial tools.
4.1. Dynamic and Behavioral Predictors
A major finding of this study is the influence of dynamic and recent behavioral variables. Both the LASSO and the SHAP analyses identified recent aggression within the past year as the most robust predictor of elevated risk of violence (OR = 2.56, 95% CI [1.89–3.47], p < 0.001). These findings are consistent with the work of Greer et al. [16], who emphasized that short-term violence risk is heavily driven by acute behavioral instability and non-compliance to treatment. This supports the clinical utility of focusing heavily on dynamic risk factors, as they capture critical short-term fluctuations in symptom severity and behavioral states [16].
4.2. Clinical Variables and Psychiatric Chronicity Indicators
The model identified substance use disorders and paranoid delusions as clinical variables that have influence in the classification of violence category [23,24]. Such results solidify the notion that both behavioral instability and active psychopathology play central roles in the model’s classification. However, the present study does not establish that these clinical characteristics cause violent behaviors.
Also, indicators of psychiatric history, such as prior hospitalizations and duration under CETM supervision, were also examined. Their associations with the outcome should be interpreted with caution, as these variables may reflect several contextual characteristics. The present study did not directly assess whether clinical management or treatment adherence mediated these associations. Further research would be necessary to investigate these potential mechanisms.
4.3. Methodological Implications
From a methodological perspective, SHAP improves the interpretability of the model by quantifying the influential contribution of each variable in the classification model. These analyses help identify the variables most influential in a given classification. Therefore, by providing greater transparency regarding the factors associated with the classification of documented violence levels, it helps the clinician, but also the population to better understand the decisions of the CETM by being aware of the process in the judgment. However, SHAP values describe how features contribute to model outputs and should not be interpreted as causal relationships or as a definitive explanation of an individual behavior.
4.4. Limitations
Several limitations must be acknowledged. First, the dataset used is a publicly data source that relies exclusively on facts documented in the judgments archived by the SOQUIJ. Any administrative or clinical information omitted during the transcription of the judicial hearing could introduce information bias. The limited availability of some information can encompass some fairness and potential differences in model performance across demographic groups. Second, the outcome variable using the MacArthur Violence Scale was dichotomized to optimize model stability. While methodologically justified, this binary split may produce some clinical nuances between moderate and severe acts of violence. Also, the model calibration was not formally assessed in the present study and should be taken into consideration for future study. Finally, the model was developed and internally evaluated in a population under Quebec jurisdiction; its generalizability to other populations, Canadian jurisdictions, and international forensic settings remains unknown and requires external validation.
The potential consequence of incorrect classification is also important to take in consideration. Particularly in a forensic psychiatric context where assessments of violence may have implications for the individual liberty, treatment conditions and legal decisions. If the model outputs were interpreted as indicators of future risk, it could contribute to an overestimation of documented violence severity or an underestimation of behavioural concerns. Although the present study was not designed to guide individual legal or clinical decisions, these potential consequences highlight the importance of cautious interpretation.
Finally, another limitation concerns the temporal relationship between the outcome and the predictor variables. The MacArthur score was assigned according to the nature of the recorded offences without considering the year in which it occurred. Consequently, it was not possible to establish whether the events underlying the aggression in the past year predictor were distinct from those contributing to the outcome score. A partial overlap between these measures therefore cannot be ruled out and may have contributed to the association between recent aggression and classification into higher violence category. Also, the anonymization of the records prevented the identification of individuals who may have appeared in multiple observations or judicial decisions. Therefore, the possibility of repeated observations involving the same individuals could not be assessed.
5. Conclusions
This study developed and internally evaluated an XGBoost machine-learning model for classifying violence level among individuals found not criminally responsible or unfit to stand trial in Quebec using clinico-administrative information extracted from CETM judicial decisions. Recent dynamic and behavioral factors, particularly aggression in the previous year, police involvement, and rule violations, contributed most strongly to model classification outputs. These findings demonstrate the feasibility of applying machine-learning methods and SHAP explainability analyses to structured forensic psychiatric data. External validation, including assessment of calibration and subgroup performance, is required before considering implementation in clinical or tribunal decision-making.
Supplementary Materials
The following supporting information can be downloaded at: https://www.mdpi.com/article/10.3390/forensicsci6040105/s1, Table S1: Dataset.
Author Contributions
Conceptualization, S.G. and A.H.; methodology, S.G. and A.H.; validation, S.G. and A.H.; investigation, S.G. and A.H.; resources, S.G. and A.H.; data curation, S.G. and A.H.; writing—original draft preparation, S.G. and A.H.; writing—review and editing, S.G. and A.H.; visualization, S.G. and A.H.; supervision, A.H.; project administration, A.H.; funding acquisition, A.H. All authors have read and agreed to the published version of the manuscript.
Funding
This study was funded indirectly by La Fondation de l’Institut universitaire en santé mentale de Montréal and the operating funds of l’Institut de valorisation des données (AH). AH is also funded by a Clinical Research Scholars J1 grant from the Fonds de recherche du Québec: https://doi.org/10.69777/380276.
Institutional Review Board Statement
Ethical review and approval were waived for this study due to this information is readily available to the public, there was no need for ethics approbation as per the Ethical Conduct for Research Involving Humans—Tri-Council Policy Statement 2.
Informed Consent Statement
Patient consent was waived due to the review of public material freely available. In accordance with confidentiality laws, all information from the SOQUIJ database has been anonymized.
Data Availability Statement
The coded dataset supporting the conclusions of this article is available as Supplementary Material. The analytical code and model parameters supporting the findings of this study will be made available by the authors upon reasonable request.
Conflicts of Interest
The authors declare no conflicts of interest.
Abbreviations
The following abbreviations are used in this manuscript:
| ML | Machine learning |
| CETM | Commission d’examen des troubles mentaux |
| NCRMD | Not criminally responsible on account of mental disorder |
| AI | Artificial intelligence |
| SHAP | Shapley Additive exPlanations |
| AUC | area under the curve |
| LASSO | Least Absolute Shrinkage and Selection Operator |
| SOQUIJ | The Société Québécoise d’information juridique |
| XGBoost | Extreme Gradient Boosting |
| HCR-20 | Historical-Clinical-Risk Management-20 |
| BVC | Brøset Violence Checklist |
References
- Varshney, M.; Mahapatra, A.; Krishnan, V.; Gupta, R.; Deb, K.S. Violence and mental illness: What is the true story? J. Epidemiol. Community Health 2016, 70, 223–225. [Google Scholar] [CrossRef] [Scilit] [PubMed]
- Myszak, P.; Leclair, L.; Khayat, O.; Levy, J.; Jaoude, J.A.; Dufour, M.; Pagé, S.B.; Hudon, A. Retrospective Review of the Criminal Code Review Board in Quebec for the Year 2023. Forensic Sci. 2025, 5, 59. [Google Scholar] [CrossRef] [Scilit]
- Fazel, S.; Grann, M. The Population Impact of Severe Mental Illness on Violent Crime. Am. J. Psychiatry 2006, 163, 1397–1403. [Google Scholar] [CrossRef] [PubMed]
- Parmigiani, G.; Barchielli, B.; Casale, S.; Mancini, T.; Ferracuti, S. The impact of machine learning in predicting risk of violence: A systematic review. Front. Psychiatry 2022, 13, 1015914. [Google Scholar] [CrossRef] [Scilit] [PubMed]
- Parsaei, M.; Arvin, A.; Taebi, M.; Seyedmirzaei, H.; Cattarinussi, G.; Sambataro, F.; Pigoni, A.; Brambilla, P.; Delvecchio, G. Machine Learning for prediction of violent behaviors in schizophrenia spectrum disorders: A systematic review. Front. Psychiatry 2024, 15, 1384828. [Google Scholar] [CrossRef] [Scilit] [PubMed]
- Witt, K.; Van Dorn, R.; Fazel, S. Risk Factors for Violence in Psychosis: Systematic Review and Meta-Regression Analysis of 110 Studies. PLoS ONE 2013, 8, e55942. [Google Scholar] [CrossRef] [Scilit] [PubMed]
- Coid, J.W.; Ullrich, S.; Kallis, C.; Freestone, M.; Gonzalez, R.; Bui, L.; Igoumenou, A.; Constantinou, A.; Fenton, N.; Marsh, W.; et al. Improving risk management for violence in mental health services: A multimethods approach. Programme Grants Appl. Res. 2016, 4, 1–408. [Google Scholar] [CrossRef] [Scilit] [PubMed]
- Haddou, A.; Sergerie-Dufresne, C.; Myszak, P.; Pagé, S.B.; Hudon, A. Understanding psychiatric-legal disagreements in not criminally responsible on account of mental disorder cases: A gradient boosting model perspective. Front. Psychol. 2026, 16, 1666828. [Google Scholar] [CrossRef] [Scilit] [PubMed]
- Walsh, C.G.; Ribeiro, J.D.; Franklin, J.C. Predicting Risk of Suicide Attempts over Time Through Machine Learning. Clin. Psychol. Sci. 2017, 5, 457–469. [Google Scholar] [CrossRef] [Scilit]
- Ogonah, M.G.T.; Seyedsalehi, A.; Whiting, D.; Fazel, S. Violence risk assessment instruments in forensic psychiatric populations: A systematic review and meta-analysis. Lancet Psychiatry 2023, 10, 780–789. [Google Scholar] [CrossRef] [Scilit] [PubMed]
- Blott, H.; Hind, E.; Brown, C.; Forrester, A. Artificial intelligence in forensic psychiatry: Potential applications and key considerations. J. Forensic Leg. Med. 2025, 116, 103016. [Google Scholar] [CrossRef] [Scilit] [PubMed]
- Chen, T.; Guestrin, C. XGBoost: A Scalable Tree Boosting System. In Proceedings of the 22nd ACM SIGKDD International Conference on Knowledge Discovery and Data Mining; ACM: New York, NY, USA, 2016; pp. 785–794. [Google Scholar] [CrossRef] [Scilit]
- Obermeyer, Z.; Emanuel, E.J. Predicting the Future—Big Data, Machine Learning, and Clinical Medicine. N. Engl. J. Med. 2016, 375, 1216–1219. [Google Scholar] [CrossRef] [Scilit] [PubMed]
- Lundberg, S.; Lee, S.I. A Unified Approach to Interpreting Model Predictions. arXiv 2017, arXiv:1705.07874. [Google Scholar] [CrossRef] [Scilit]
- Collins, G.S.; Moons, K.G.M.; Dhiman, P.; Riley, R.D.; Beam, A.L.; Van Calster, B.; Ghassemi, M.; Liu, X.; Reitsma, J.B.; van Smeden, M.; et al. TRIPOD+AI statement: Updated guidance for reporting clinical prediction models that use regression or machine learning methods. BMJ 2024, 385, e078378. [Google Scholar] [CrossRef] [Scilit] [PubMed]
- Greer, B.; Taylor, R.W.; Cella, M.; Stott, R.; Wykes, T. The contribution of dynamic risk factors in predicting aggression: A systematic review including inpatient forensic and non-forensic mental health services. Aggress. Violent Behav. 2020, 53, 101433. [Google Scholar] [CrossRef] [Scilit]
- Monahan, J.; Steadman, H.J.; Silver, E.; Appelbaum, P.S.; Robbins, P.C.; Mulvey, E.P.; Roth, L.H.; Grisso, T.; Banks, S. Rethinking Risk Assessment: The MacArthur Study of Mental Disorder and Violence; Oxford University Press: Oxford, UK, 2001. [Google Scholar] [CrossRef] [Scilit]
- Tibshirani, R. Regression Shrinkage and Selection Via the Lasso. J. R. Stat. Soc. Ser. B Stat. Methodol. 1996, 58, 267–288. [Google Scholar] [CrossRef] [Scilit]
- Douglas, K.S.; Skeem, J.L. Violence risk assessment: Getting specific about being dynamic. Psychol. Public Policy Law 2005, 11, 347–383. [Google Scholar] [CrossRef] [Scilit]
- Lagerberg, T.; Lambe, S.; Paulino, A.; Yu, R.; Fazel, S. Systematic review of risk factors for violence in psychosis: 10-year update. Br. J. Psychiatry 2025, 226, 100–107. [Google Scholar] [CrossRef] [Scilit] [PubMed]
- Youn, S.; Watson, A.E.; Guadagno, B.L.; Murrihy, S.; Byrne, L.K.; Cheng, N.; Cotton, S.M. Systematic Review and Meta-Analysis: Risk Factors of Violence During First-Episode Psychosis. Trauma Violence Abus. 2026, 27, 256–270. [Google Scholar] [CrossRef] [Scilit] [PubMed]
- Bzdok, D.; Meyer-Lindenberg, A. Machine Learning for Precision Psychiatry: Opportunities and Challenges. Biol. Psychiatry Cogn. Neurosci. Neuroimaging 2018, 3, 223–230. [Google Scholar] [CrossRef] [Scilit] [PubMed]
- Fazel, S.; Gulati, G.; Linsell, L.; Geddes, J.R.; Grann, M. Schizophrenia and violence: Systematic review and meta-analysis. PLoS Med. 2009, 6, e1000120. [Google Scholar] [CrossRef] [Scilit] [PubMed]
- Whiting, D.; Lichtenstein, P.; Fazel, S. Violence and mental disorders: A structured review of associations by individual diagnoses, risk factors, and risk assessment. Lancet Psychiatry 2021, 8, 150–161. [Google Scholar] [CrossRef] [Scilit] [PubMed]

Disclaimer/Publisher’s Note: The statements, opinions and data contained in all publications are solely those of the individual author(s) and contributor(s) and not of MDPI and/or the editor(s). MDPI and/or the editor(s) disclaim responsibility for any injury to people or property resulting from any ideas, methods, instructions or products referred to in the content. |
© 2026 by the authors. Licensee MDPI, Basel, Switzerland. This article is an open access article distributed under the terms and conditions of the Creative Commons Attribution (CC BY) license.