1. Introduction
Gunshot residues are microscopic particles generated during the explosion of a charge inside the firing chamber of a weapon [
1]. When the trigger is pulled, the firing pin strikes the cartridge primer, causing a spark that ignites gunpowder inside the firing chamber [
2]. This process generates a rapid expansion of high-pressure gas, which pushes the bullet through the barrel and out at a high velocity. During the ejection of the projectile, the residue is projected toward the target, and, if the target is close enough, deposited on it.
The analysis of GSR is crucial in forensics to reconstruct important information about the firing, and therefore about the occurrence of a crime. One of the main features of a GSR pattern is its dependence on the shooting distance. As distance increases, the spatial distribution of residue on the target changes, with a progressive dispersion of particles and a decrease in the density and intensity of deposits. It is very important to measure the range at which a weapon has been fired, for instance, to discriminate between a murder, a suicide, or an accident [
3]. In addition, factors such as the type of ammunition or weapon [
4] can influence the way residues are deposited, further complicating their analysis.
Gunshot residue could be found on different elements of a crime scene—from the floor to the furniture [
5], on human skin [
6], or on clothes; this research focuses on gunshot residue on textiles. Some common features can be identified in textiles. A “bullet wipe” area around the hole can usually be distinguished. GSR is a complex mixture resulting from the firing process. Two classes can be identified among the residues [
7]: (1) particulate GSR, consisting of micro-particles from the primer and bullet; and (2) non-particulate combustion residues, composed of combustion products, soot, and unburnt or semi-burnt powders from the propellant charge. The smoke pattern can be further divided into an inner and an outer zone. Plattner et al. [
8] stated that gunshot residues on the target surface can be differentiated into an inner and outer powder soot zone. Barrera et al. [
9] were the first to conclude that infrared photography can visualize the inner powder soot zone.
Various methodologies can be used to detect GSR on fabrics. These methods can generally be divided into destructive and non-destructive approaches. Destructive methodologies, such as analysis based on chemical reagents, destroy the sample and preclude further investigation. However, these methodologies represent the state of the art, as they produce more reliable results than more modern non-intrusive techniques that have not yet been established. Destructive methods also include instrumentation-based techniques, like Atomic Absorption Spectroscopy (AAS) or Mass Spectrometry (MS). In contrast, non-destructive techniques, including optical and imaging-based methodologies, allow for preservation of the sample, which is a paramount advantage in forensic investigations.
An overview of the most established non-chemical techniques can be found in [
10]. Over the past decade, research on imaging techniques for GSR detection has increased. For example, numerous studies have been conducted on hyperspectral ([
11,
12,
13]) or multispectral imaging [
14], which have been defined as good tools to support the visualization and collection of evidence. Among these imaging-based methodologies, infrared-based techniques have gained significant attention because of their potential to offer noncontact [
15], nondestructive analysis. Infrared imaging has always been considered for its potential to see something invisible to the naked eye ([
16,
17]), and it has been applied in crime investigation to detect latent evidence [
18], such as blood traces [
19] or biological traces in general [
20]. In the area of GSR detection on fabrics, the real potential of infrared imaging is its ability to offer visualization of residues in colored textiles [
21]. However, most of the vision-based approaches presented in the literature, such as infrared photography or hyperspectral imaging, have focused on the qualitative visualization of GSR rather than quantification. Therefore, the approach presented in this paper aims to go beyond simple visualization by proposing a methodology that uses a quantitative model to measure the shooting distance from residue patterns.
This work focuses on the smoke and powder components of a GSR complex. The change in the thermal properties of the substrate induced by deposition of smoke and powder residues is exploited by performing active thermography. This technique involves the use of an external energy source to introduce a rapid pulse of energy into the target; an infrared camera is then used to record the transient thermal response. Active thermography is performed to observe how the emissivity decreases from the hole to the outside of the canvas and, therefore, to observe the distribution of the smoke pattern in both the inner and outer zones. The potential of active thermography in observing gunpowder residue to determine firing distance was previously evaluated in [
22], but it remains underexplored. In addition, Moskovchenko et al. [
23] compared long-pulse and flash-pulse thermography for residue detection on fabrics and concluded that flash-pulse thermography excels in detecting particles with higher contrast and sharpness [
24].
Building on the findings of these two previous studies, this paper proposes and fine-tunes a novel methodology based on Flash-Pulse Thermography for quantifying the bulk residue pattern. This approach aims to establish the feasibility of a digital, non-destructive model to determine the shooting distance. While the methodology explores the potential for robustness across different fabric colors, preliminary data on the influence of ammunition and weapon type are also presented. Thermal images have been acquired from various sets of fabrics, both white and colored, and image processing allows for the definition of the model with its associated uncertainty. The proposed model provides a reliable method for the indirect measurement of the shooting distance.
The paper is structured as follows.
Section 2 reports the materials and the methodology, and
Section 3 shows the results. In
Section 4, the methodology presented is compared with the performance and constraints of the established chemical method, and its potential is compared with that of other imaging techniques discussed in the literature.
Section 5 reports the conclusions.
2. Materials and Methods
The following subsections explain the samples used for testing (
Section 2.1), the experimental setup to perform FPT (
Section 2.2), the image acquisition approach (
Section 2.3), the image processing algorithm (
Section 2.4), and the methodology to extract characteristic features (
Section 2.5).
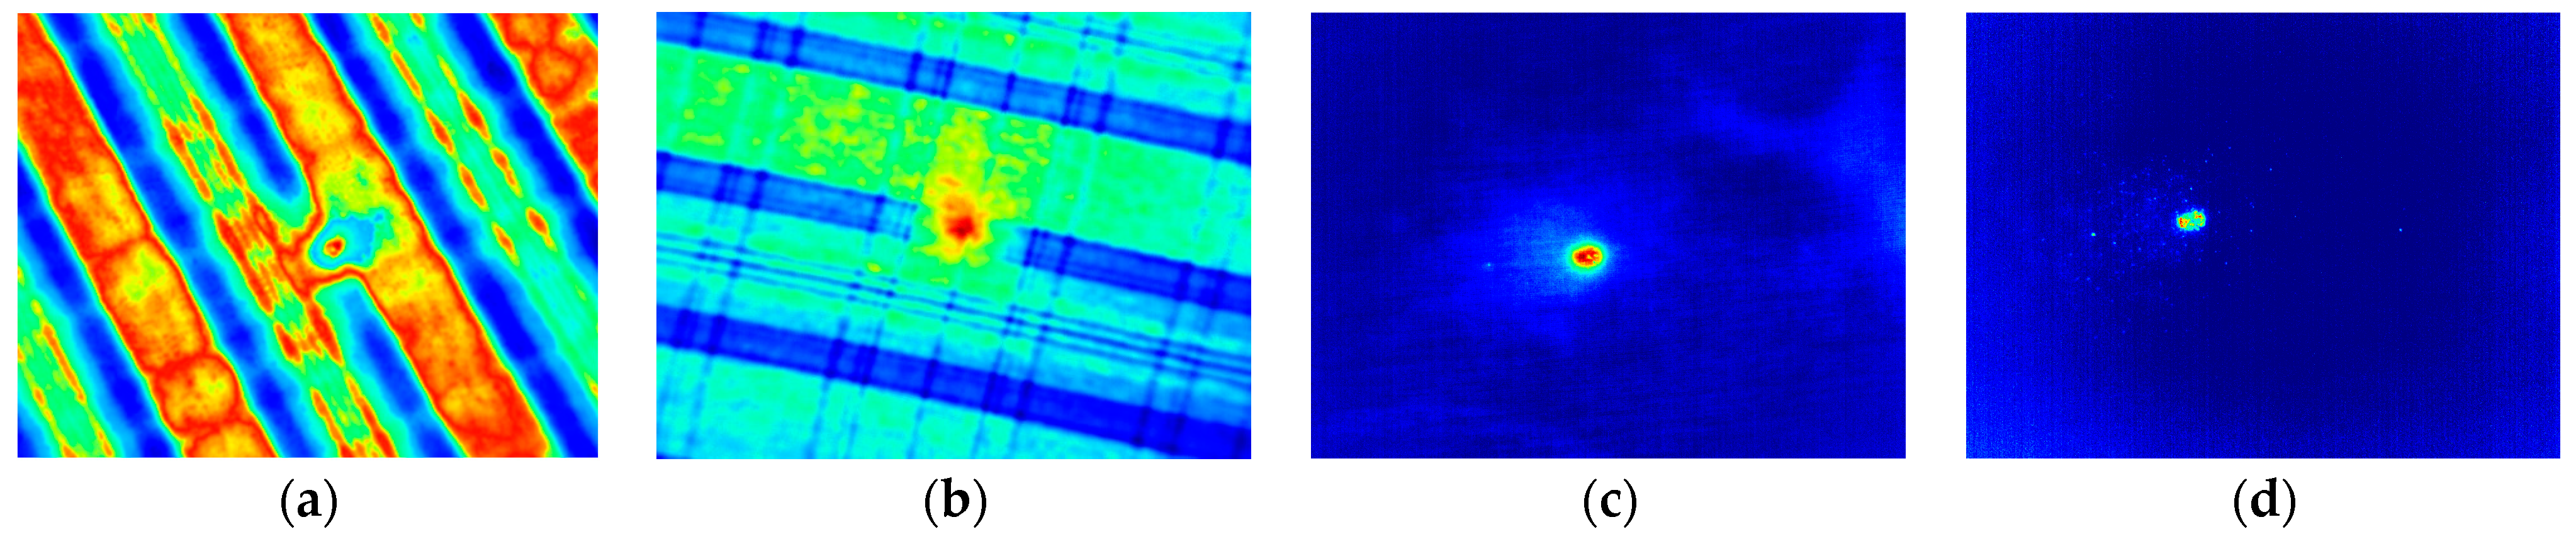
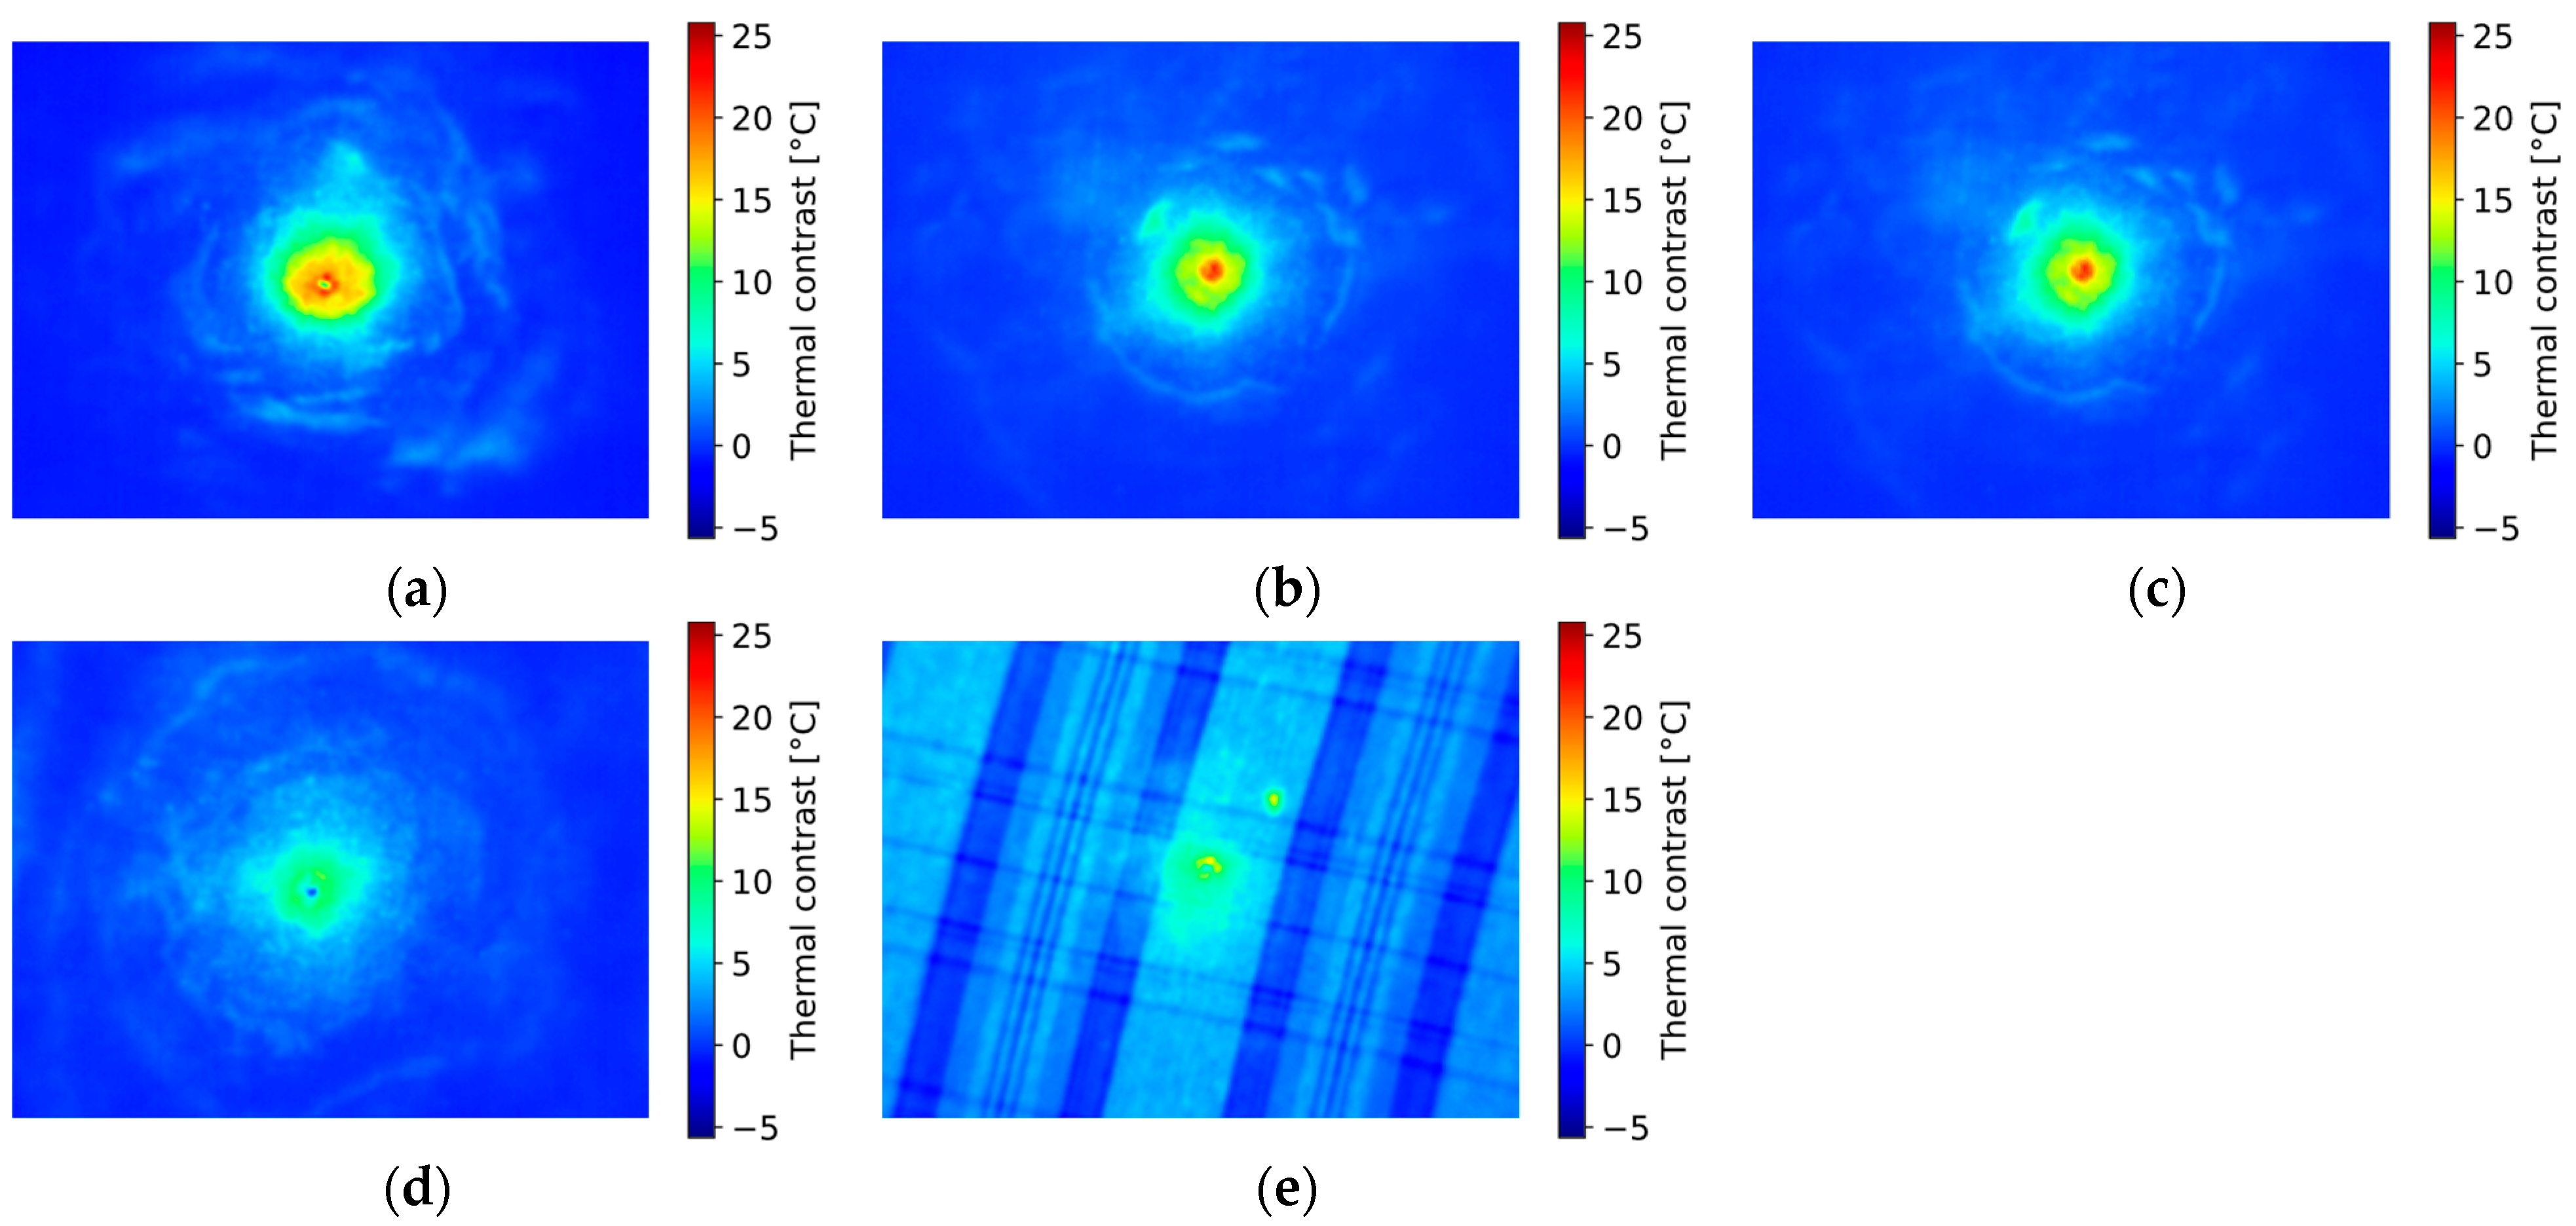
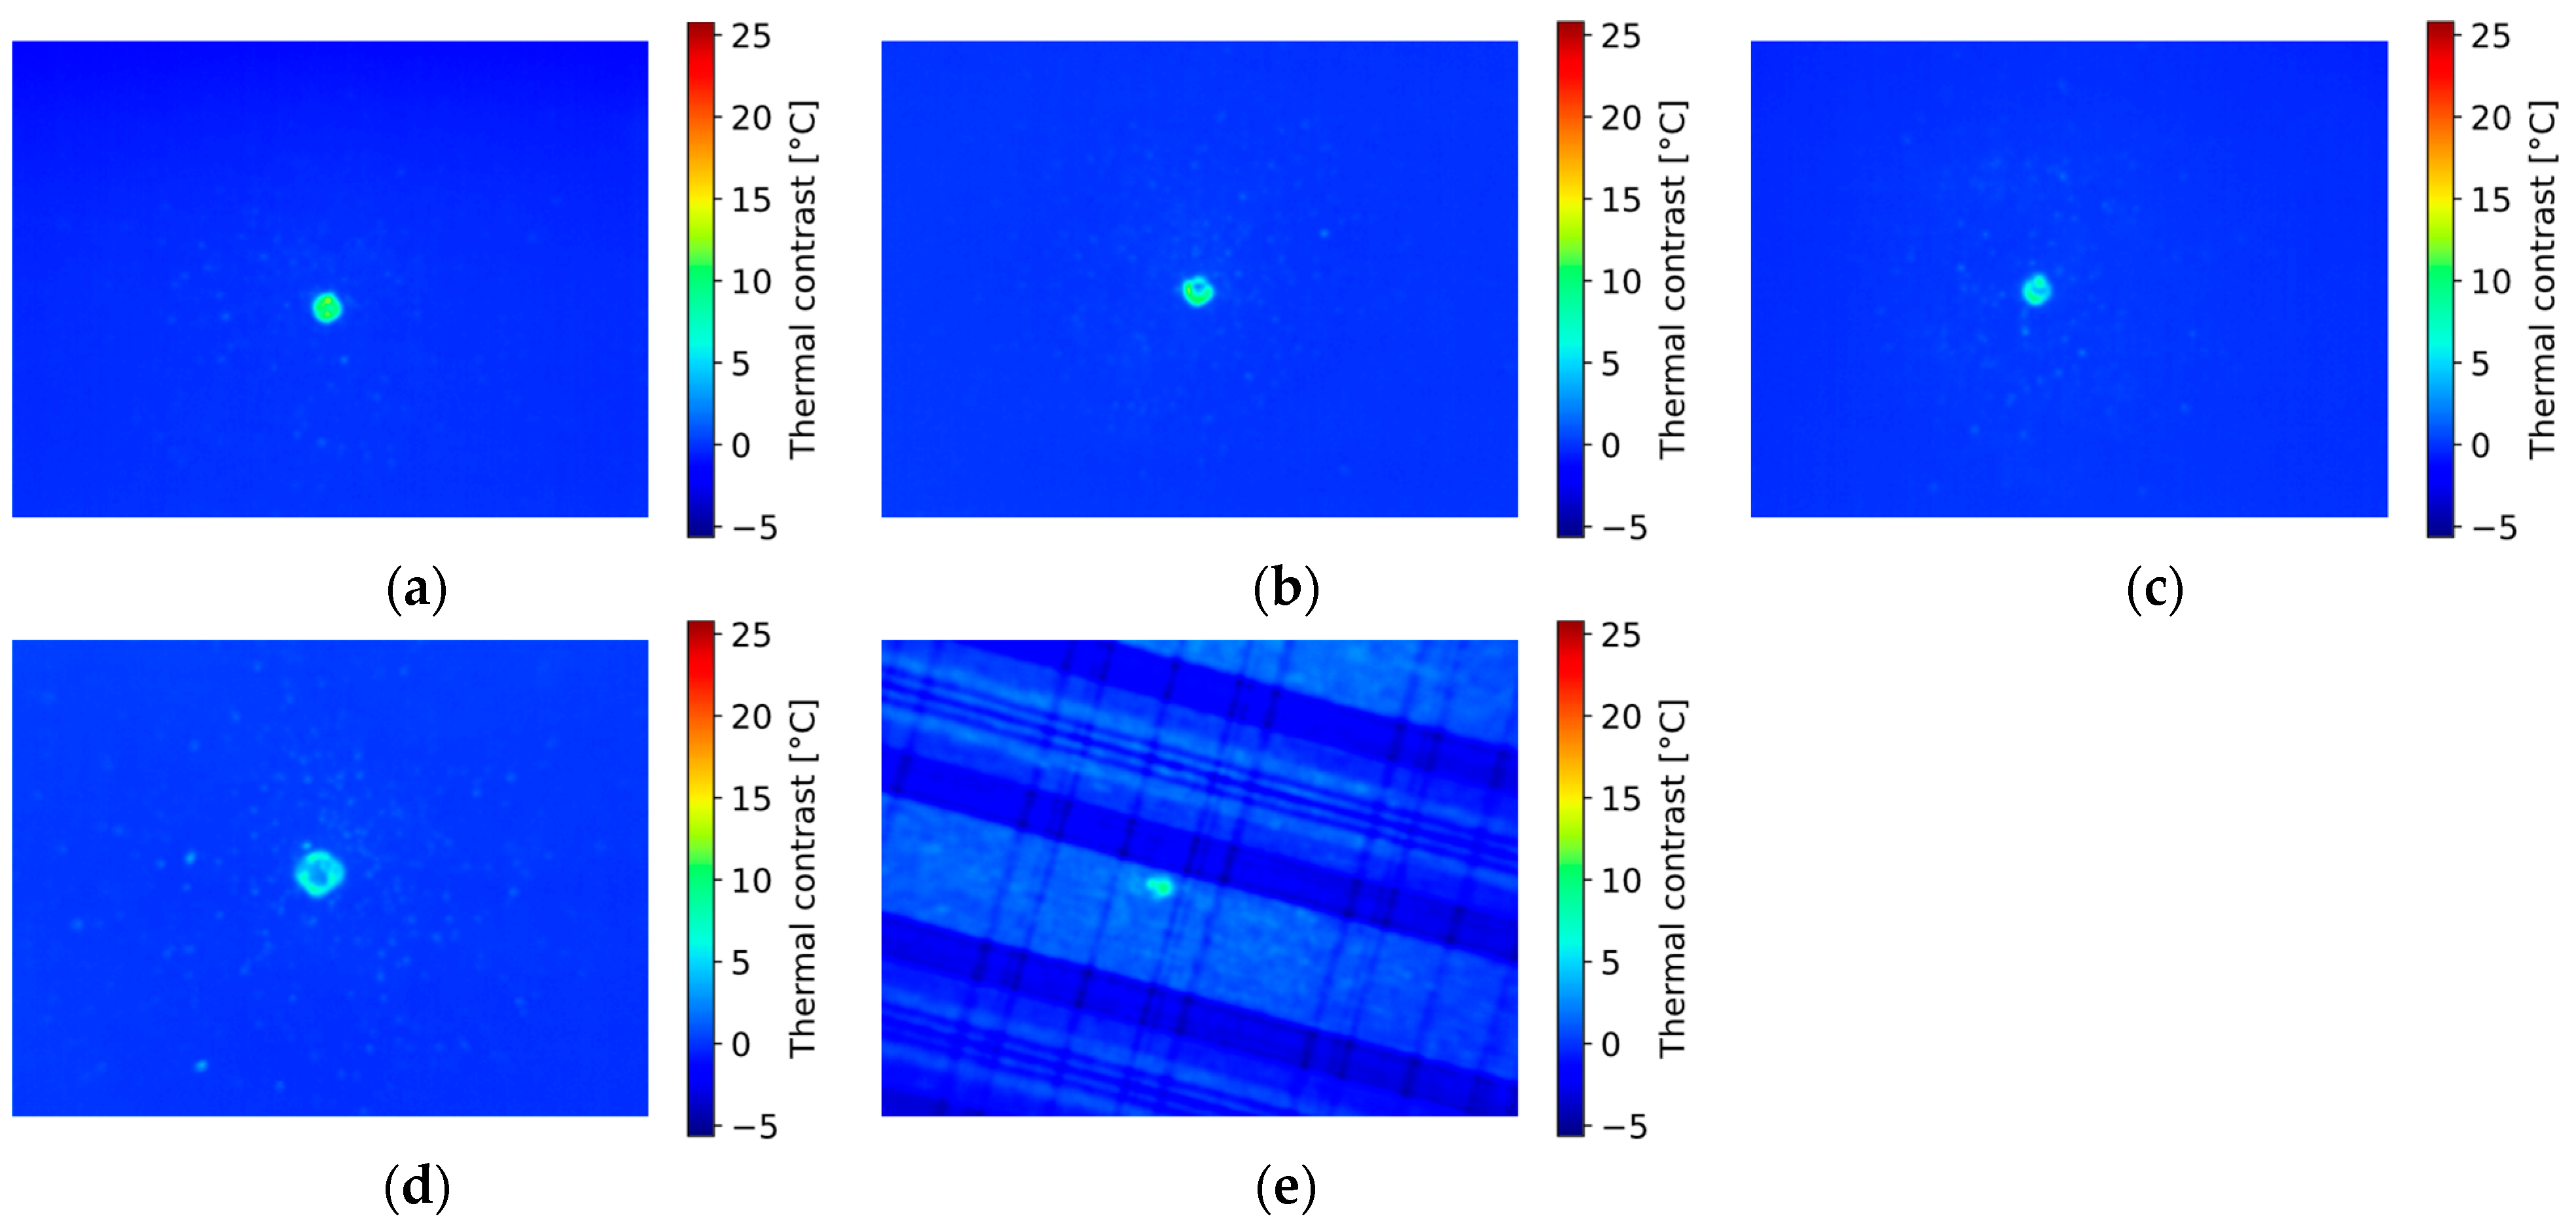
Thermal images of cotton textile samples have been acquired by performing both Long-Pulse (LPT) and Flash-Pulse (FPT) Thermography to determine the optimal method. The LPT methodology involved 10 s of heating, while FPT involved a short pulse. For both methods, the representative images shown in
Figure 1 were selected by analyzing the full sequence and extracting the frame with the maximum contrast between the GSR pattern and the background.
The comparison clearly demonstrates the advantages of FPT. When using LPT on colored, textured fabrics (
Figure 1a), the resulting thermal image is dominated by the structured background signal from the underlying fabric pattern. Different regions of the textile exhibit different thermal properties; this structured background acts as interfering noise, which almost completely obscures the central GSR pattern.
In this context, absorption refers to the efficiency of the material in absorbing the optical energy from the heat source. With long heating, the thermal properties of the textile fibers dominate, and their absorption signal is significantly larger than that of the residues. This results in a low signal-to-noise ratio, which is present even on a white background.
The success of FPT is based on the opposite physical principle. The GSR pattern has higher emissivity and, more importantly, higher absorptivity to the flash energy than the clean canvas. The short, high-energy pulse of FPT interacts primarily with the surface GSR, which rapidly absorbs the optical energy and heats up. Because these residues are also efficient emitters, they radiate a strong thermal signal. This mechanism provides a sharp, high-contrast signal on white fabric (
Figure 1d) and is highly effective on colored, textured fabrics (
Figure 1b), where the structured background is less evident. Therefore, as FPT provides a significantly better signal-to-noise ratio, only images acquired by FPT were used to fine-tune the methodology.
2.1. Samples
Six sets of cotton canvases were available. They were shot from different distances; therefore, they contain different residue patterns. Five sets (from Set I to Set IV, and Set COL) have been used to fine-tune the methodology; four sets contain white cotton canvases, and the fifth set (Set COL) contains colored textiles. These sets each include the following shooting distances: 5, 10, 15, 20, 25, 30, 35, 40, and 50 cm. The sixth set (Set V) was used to take three measurements and test the validity of the methodology; it contains three canvases shot at 15, 25, and 45 cm shooting distances. All the information about the available textiles and the tests performed is available in
Table 1, together with the information about the weapons and the ammunition employed.
Samples were stretched on a frame support with dimensions 35 × 39 cm2 during the acquisitions.
2.2. Experimental Setup
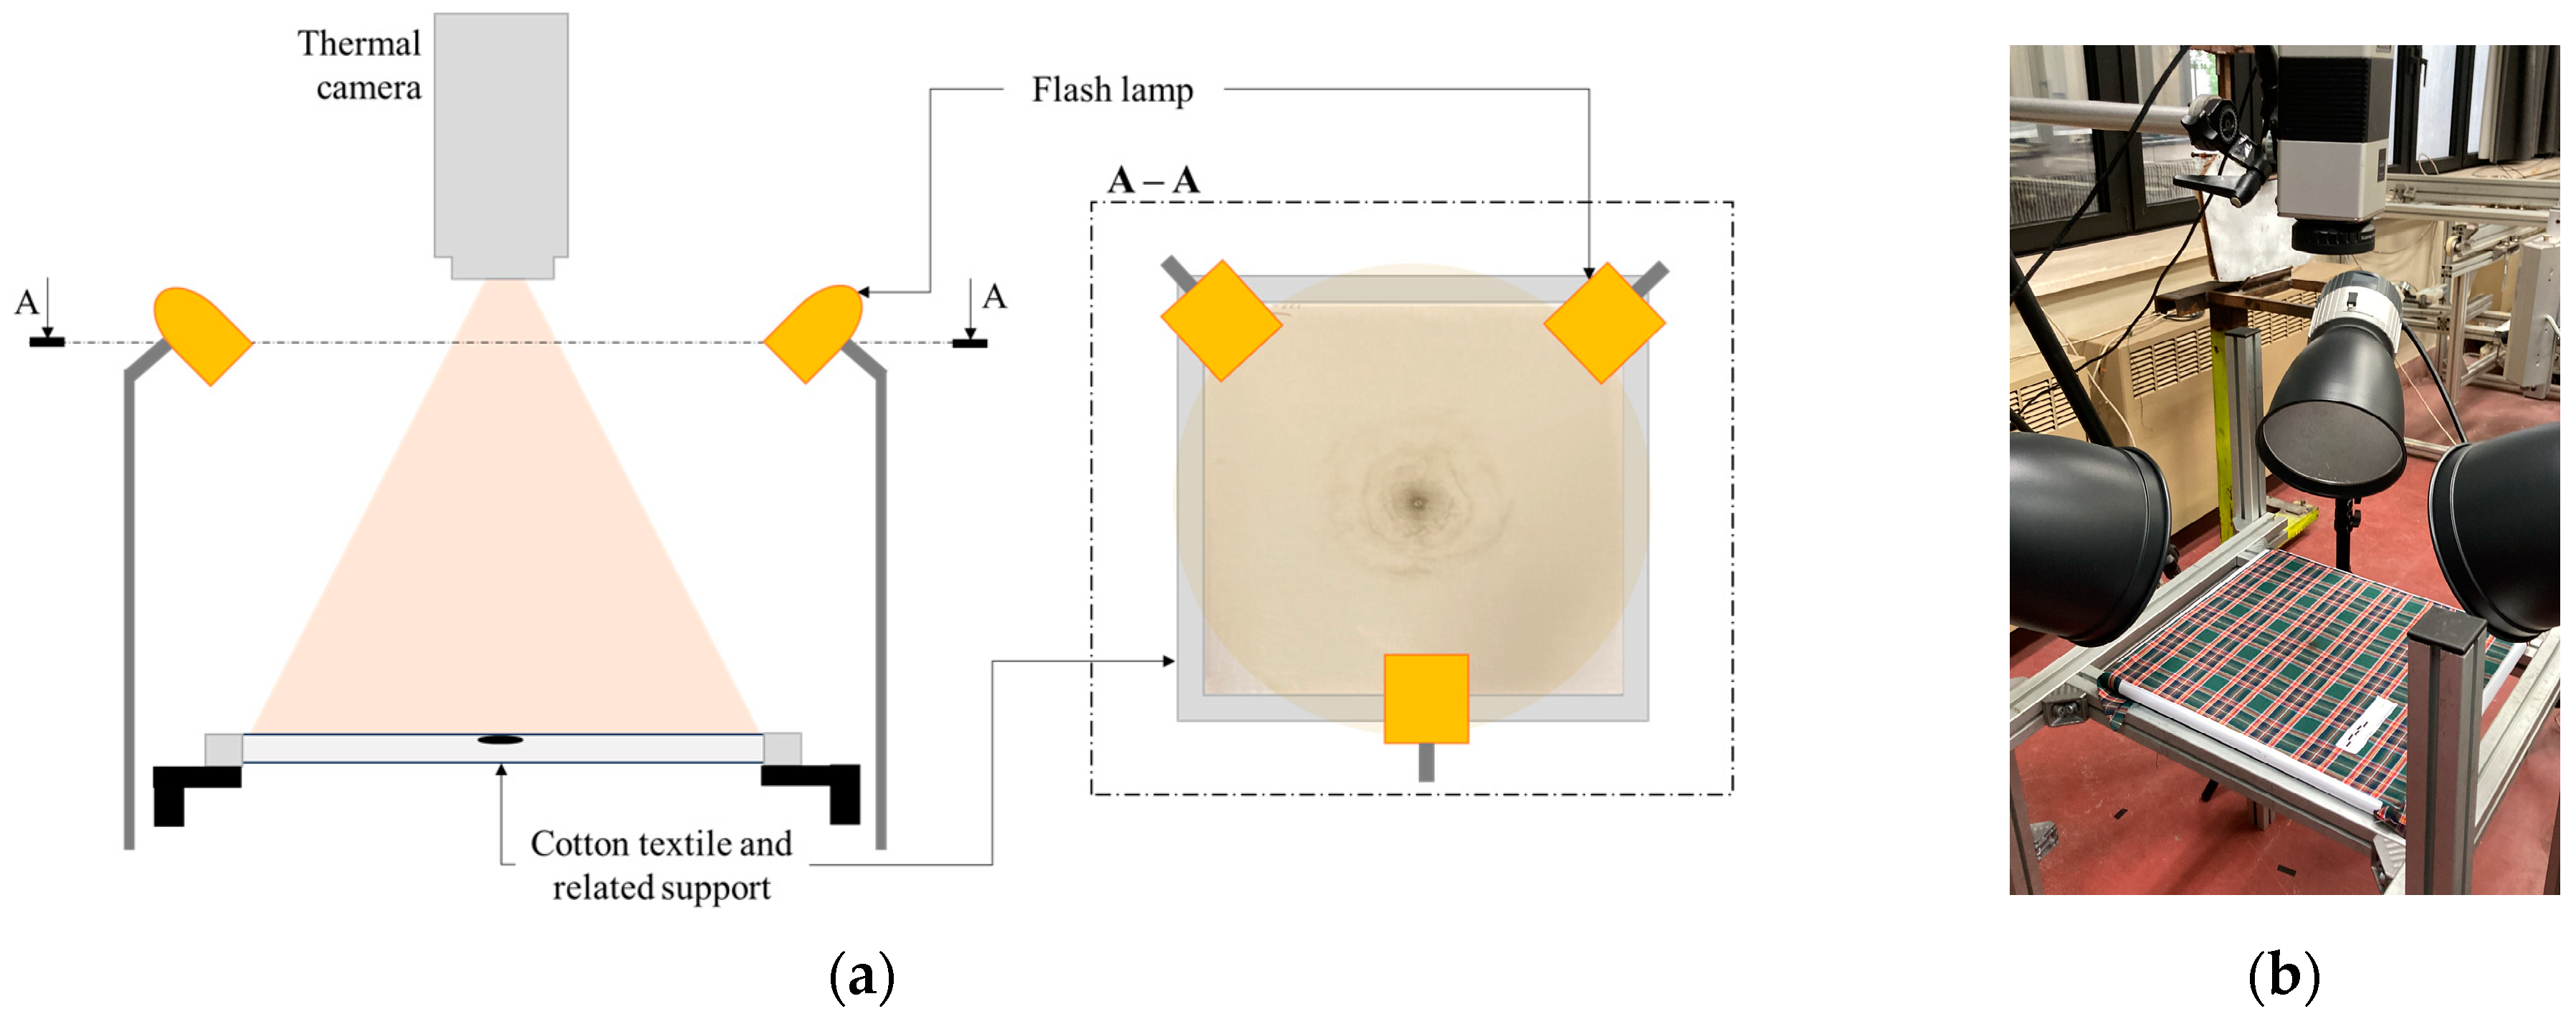
The thermal camera frames the sample at a 60 cm distance during both the heating and the cooling phase. The acquisition of a sequence of images is started, and the flashes are started shortly afterward synchronized with each other. A schematic representation of the Flash-Pulse Thermography experimental setup is available in
Figure 2.
The thermal camera employed in the experiments is the Infratec VarioCam 980 HD. It features a microbolometer uncooled FPA detector with a spectral range of 7.5–14 μm and a full resolution of 1024 × 768 pixels. The temperature resolution of the camera at ambient temperature is up to 0.02 K. The uncertainty of the sensor is about . The maximum frame rate of the thermal camera is 30 Hz.
Illumination is provided by three Hensel EH PRO 3000 flash heads [
25] powered by Tria 24 S generators. Each flash offers power up to 3000 W. Halogen illumination ensures a high infrared content, making it suitable for thermographic applications.
Acquisitions have been performed at an ambient temperature of 20 °C and humidity of 57%.
2.3. Image Acquisition
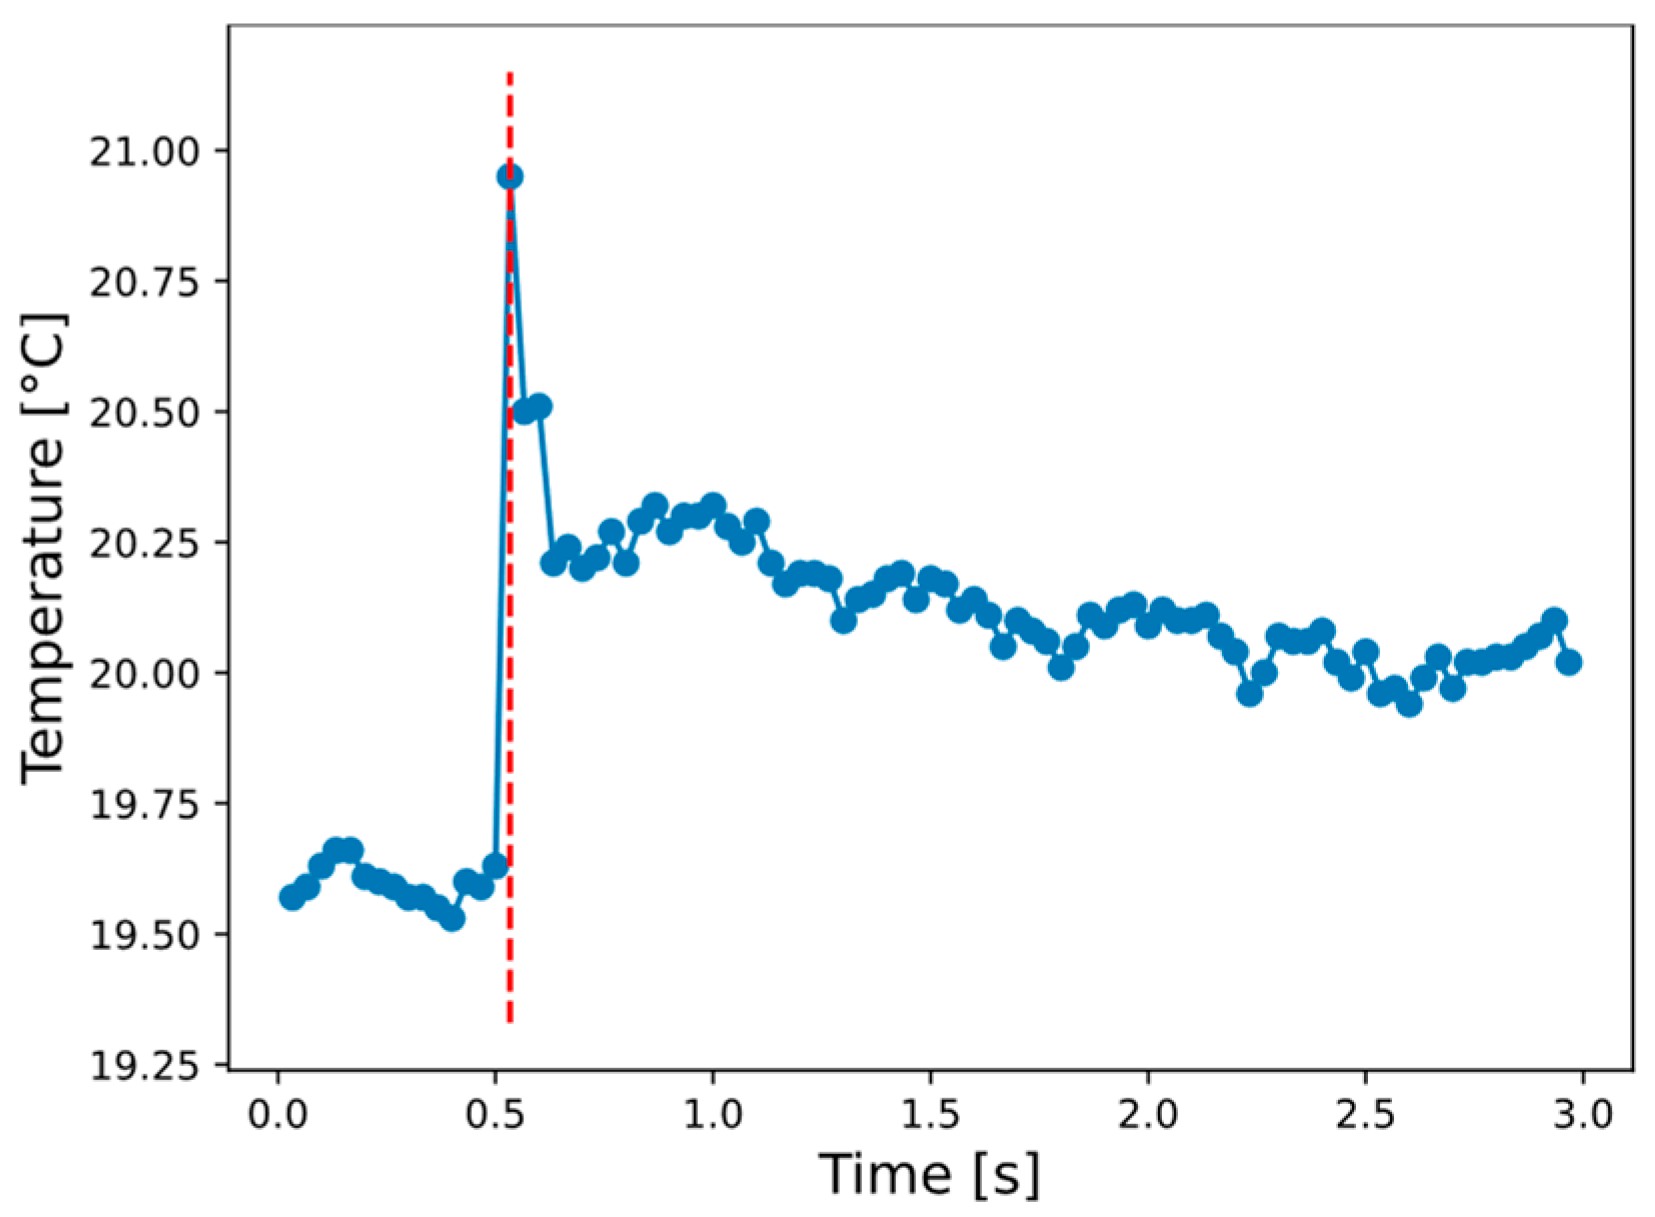
A sequence of thermal images is acquired with a frame rate of 30 fps. No electronic synchronization was used between the camera and the flash system; the acquisition was started, and the flash bank (with flashes synchronized to each other) was fired manually during the recording. The temperature of a pixel containing GSR is monitored over time, and it can be visualized in
Figure 3. The image corresponding to the heating peak is extracted in post-processing from the sequence to determine the gunshot residue information.
2.4. Image Pre-Processing
The visualization of gunshot residue in relation to the background is improved by calculating the absolute contrast of the image. The contrast is calculated by subtracting the value of a background pixel from the whole image. To obtain a baseline temperature , required to define the sound area, a small region of interest (ROI) (3 3 pixels) was selected. This ROI is located in a fixed corner of the canvas far from the central GSR pattern. This automated selection was possible due to the consistent positioning of the samples. The criterion for this ROI was that it showed no significant temperature peak during stimulation, confirming it was free of residues.
According to Maldague X. [
26], the absolute contrast
is the temperature difference between the suspected defective location (named “def”), which is a powder-covered area, and a sound area (indexed as “s”) at a given time. It is provided in Equation (1).
T is the temperature signal, and t is the time variable.
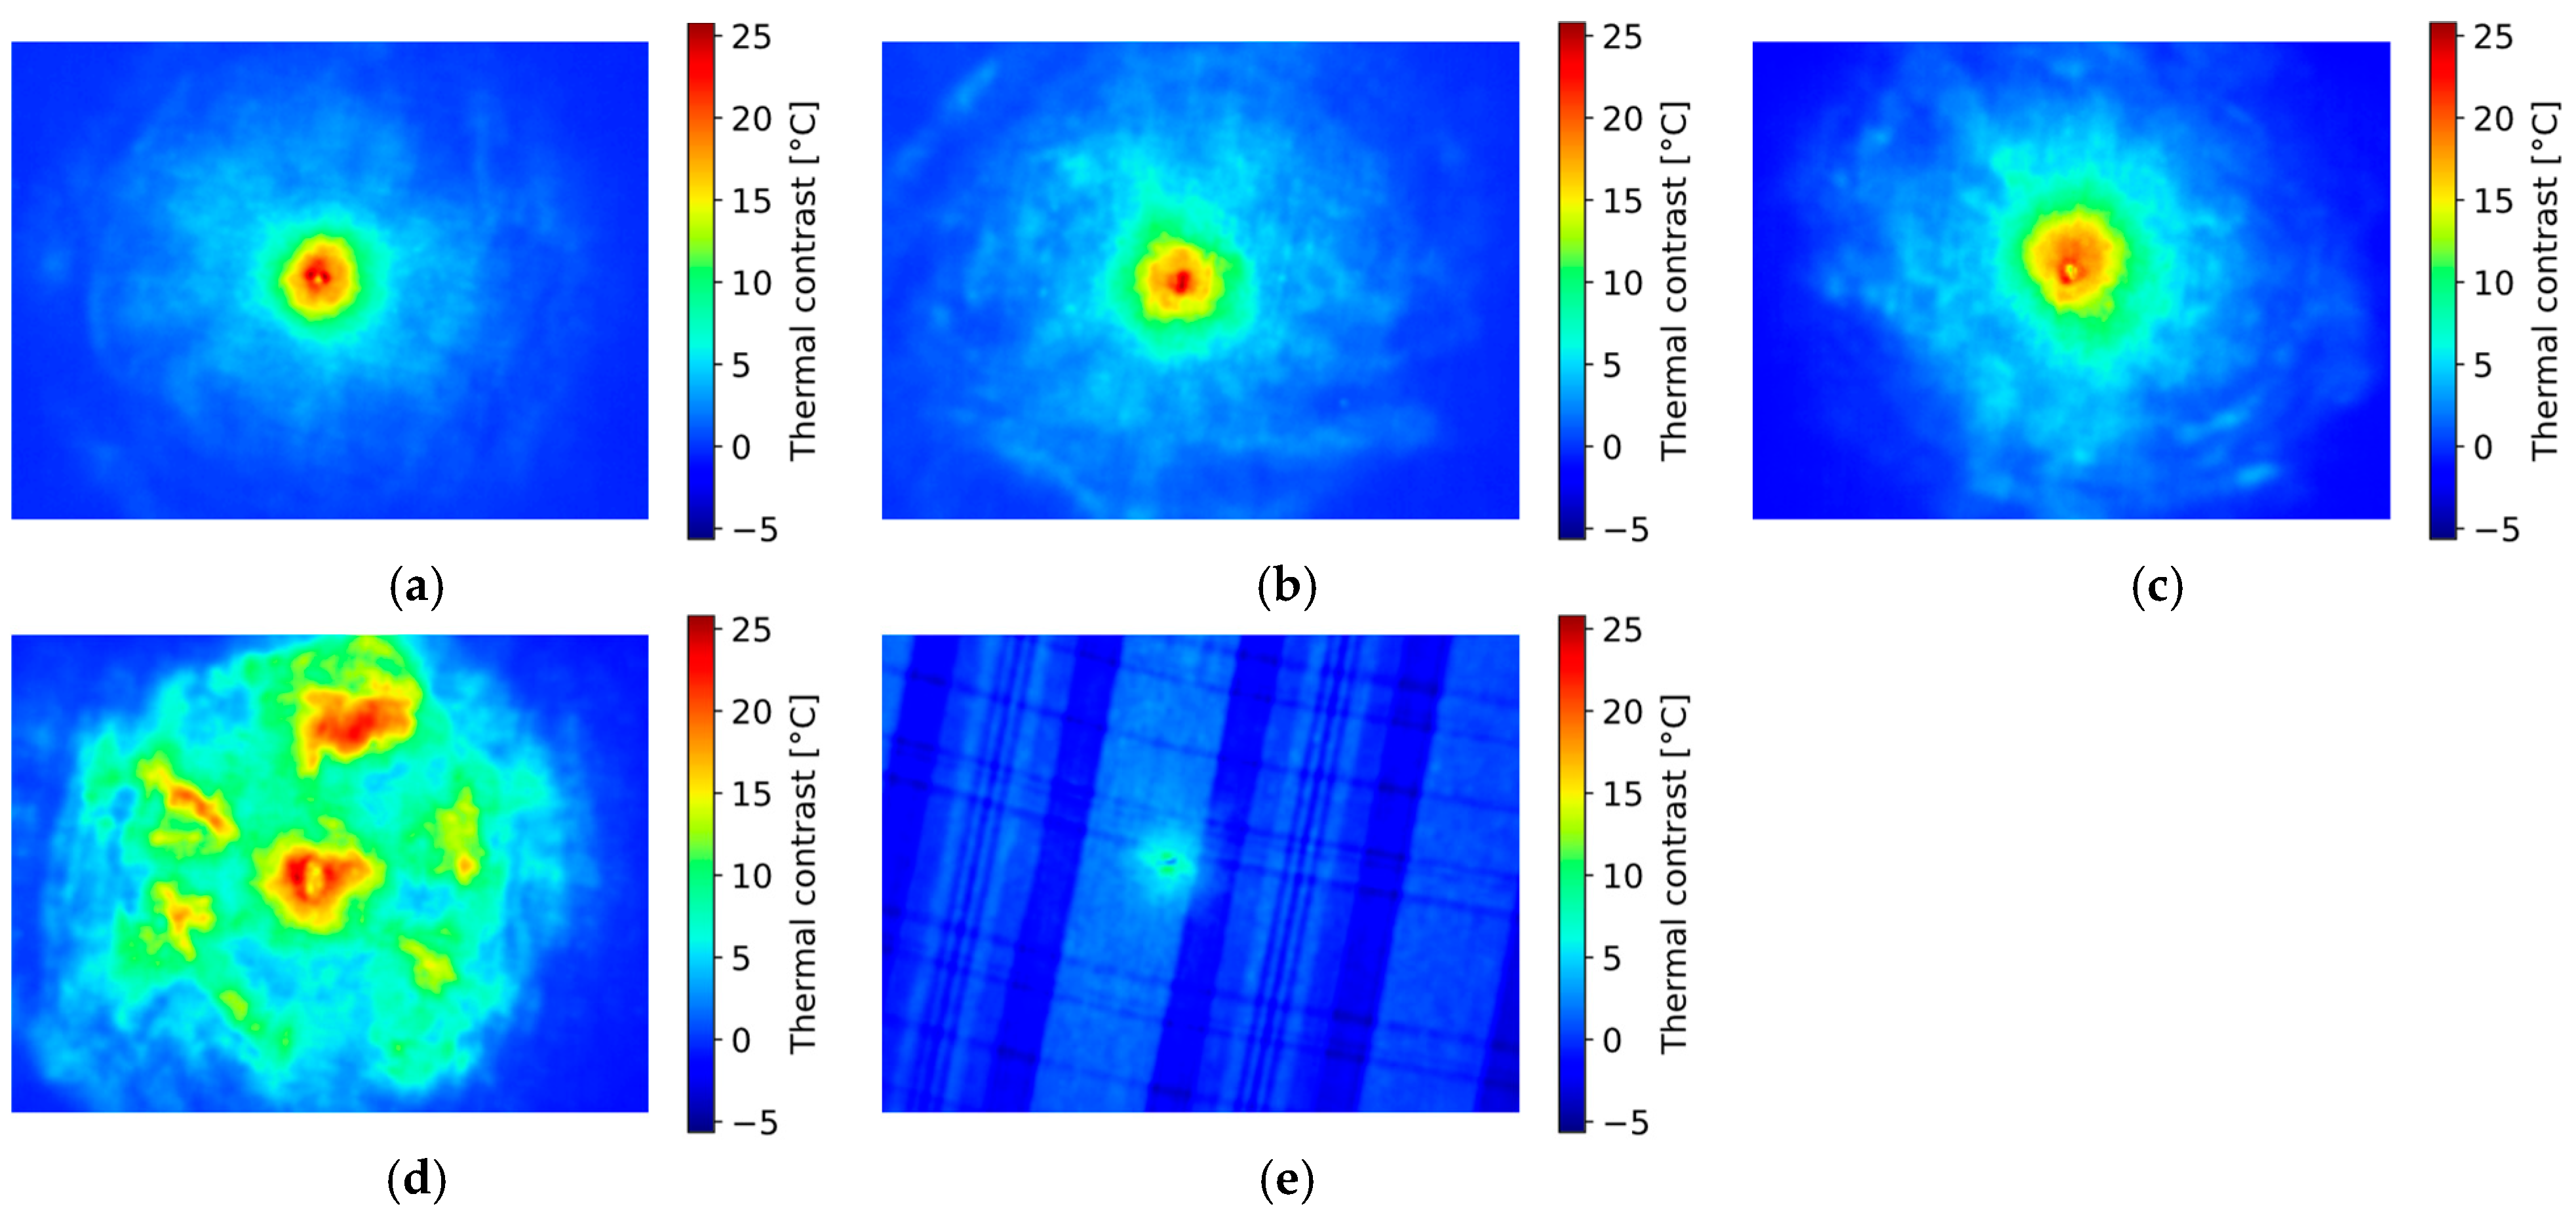
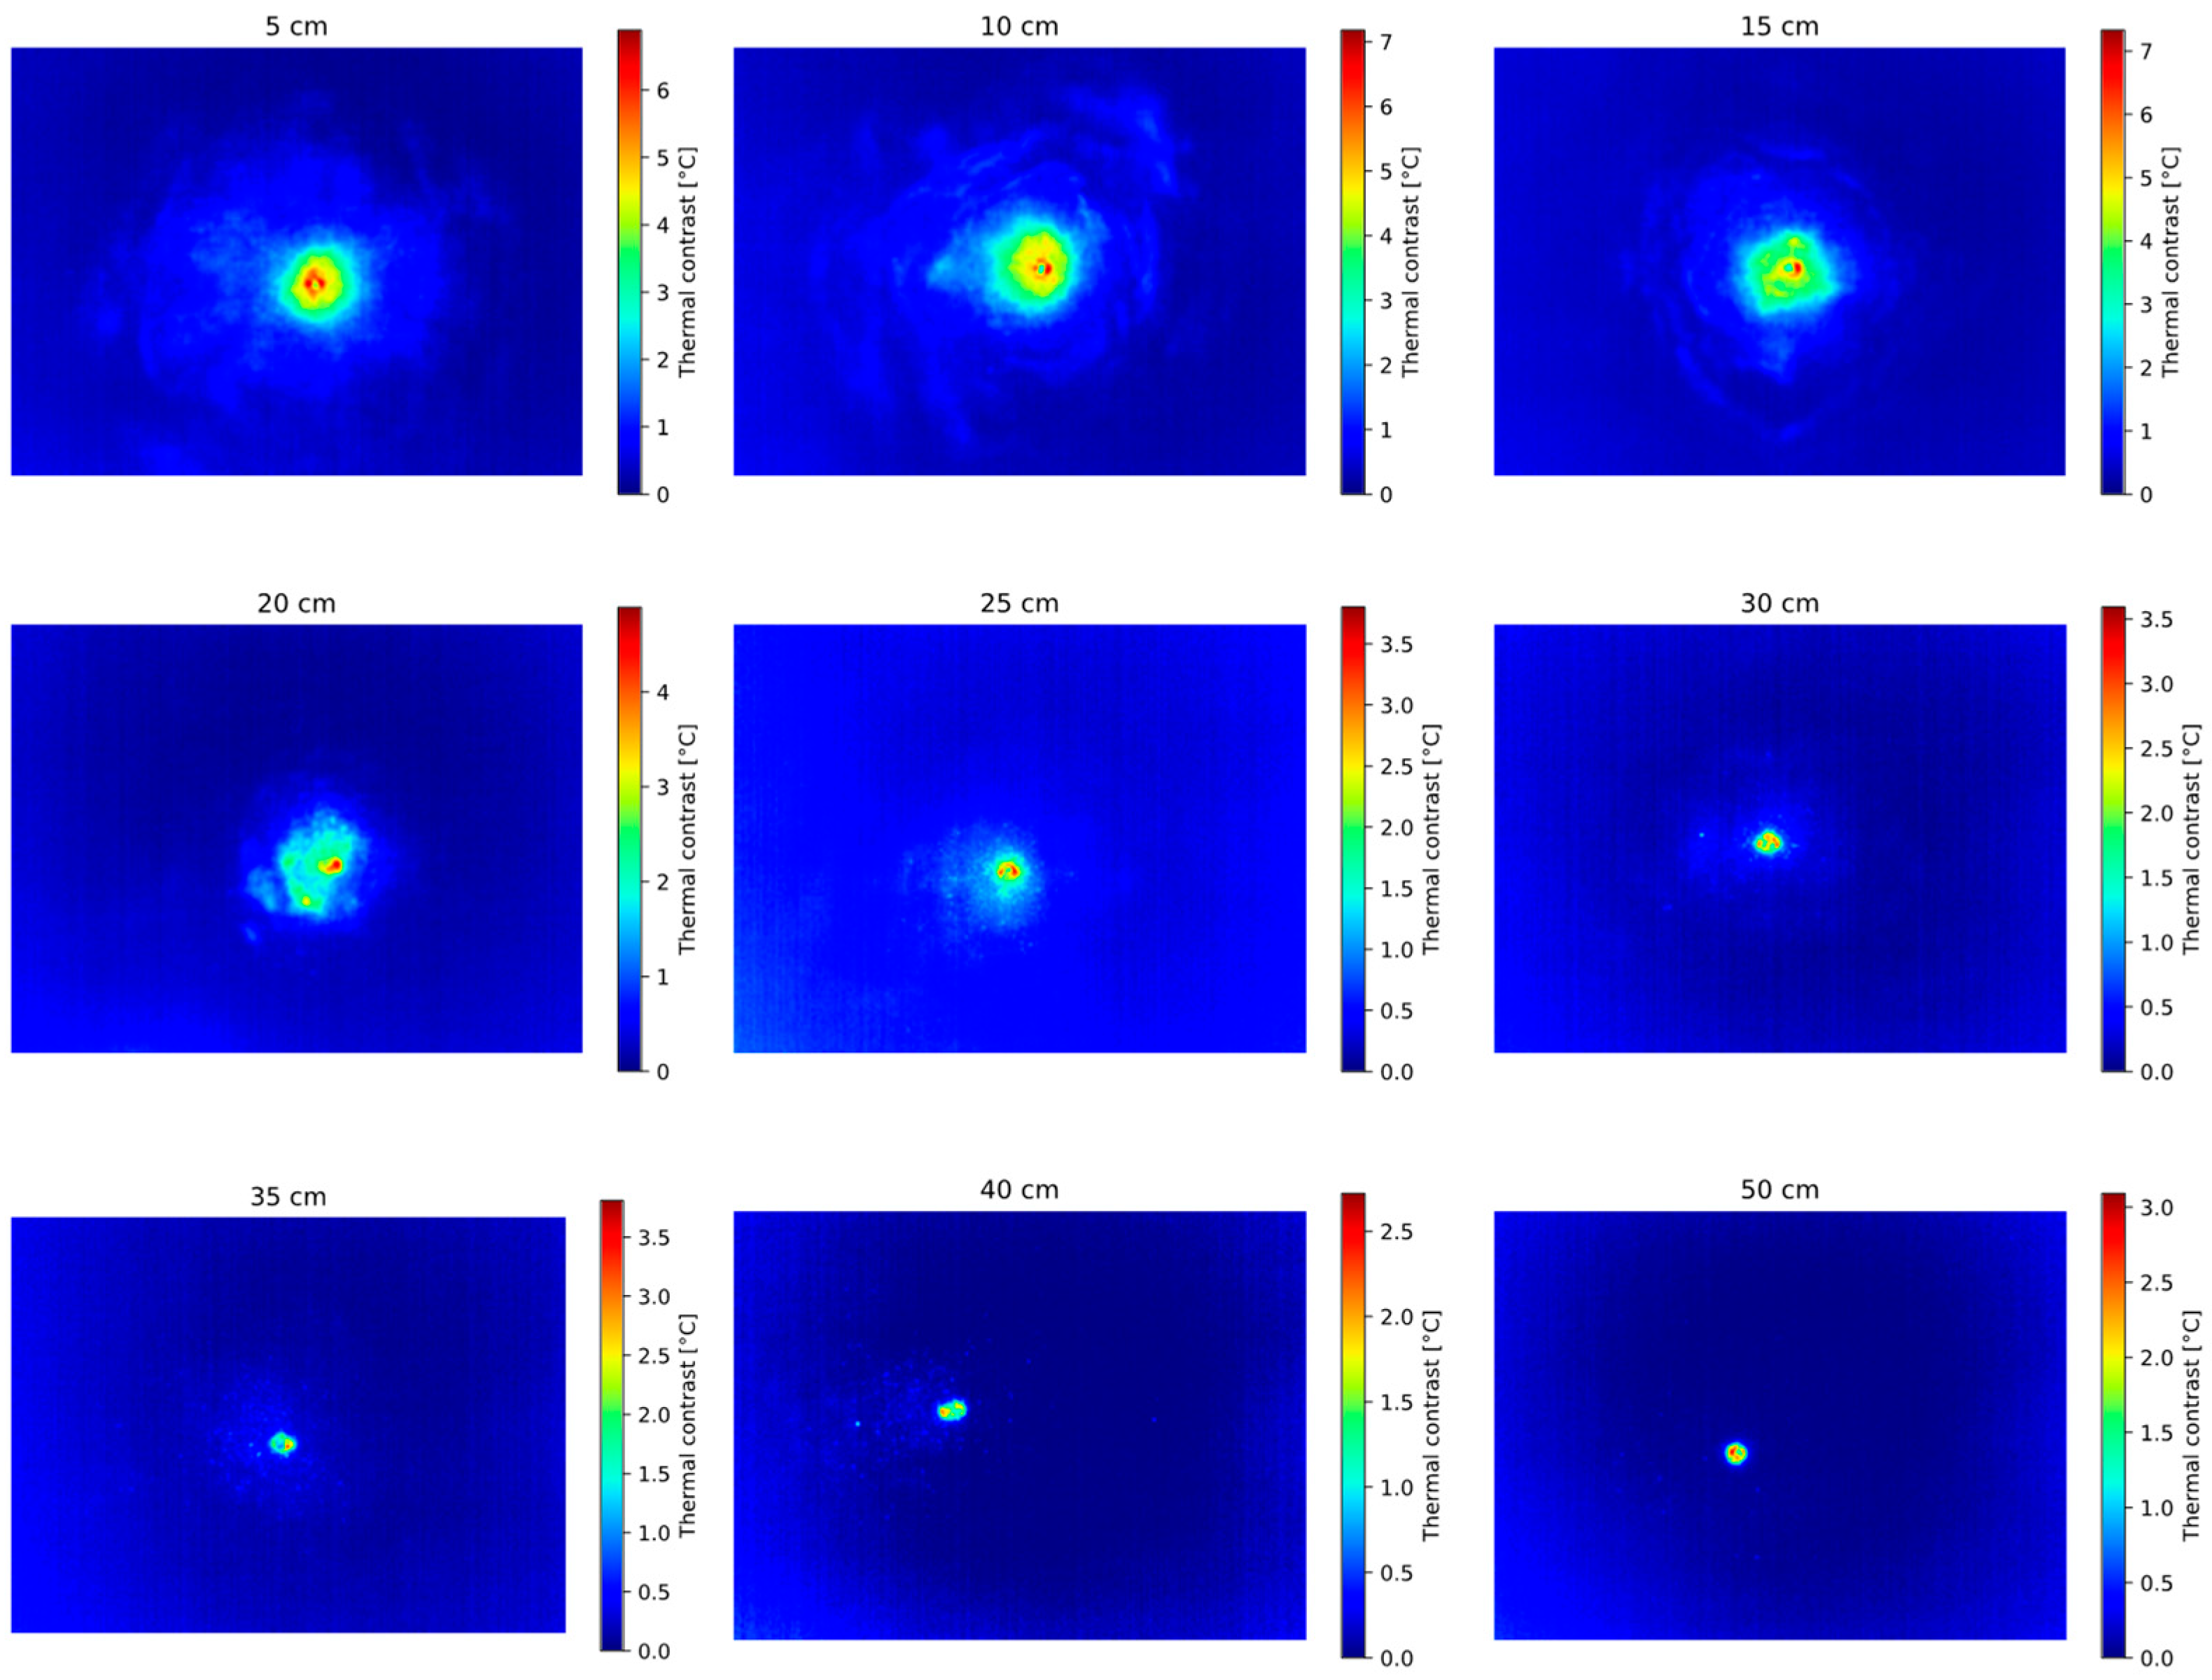
For example, the contrast images for Set II are available in
Figure 4. In addition, some canvas comparisons, at the same shooting distance for different sets, are available in
Figure 5 (5 cm),
Figure 6 (10 cm), and
Figure 7 (50 cm). By looking at these images, it is possible to see that weapon and bullet dependence is particularly visible at a very close range (5 cm). At 5 cm, the pistol produces a highly dense and fully blackening soot zone around the bullet hole [
27]. Bullet dependence is less detectable as the firing distance increases. This consideration will be further analyzed in
Section 3 regarding the generalizability of the proposed approach.
2.5. Methodology for Feature Extraction for Crime Investigation
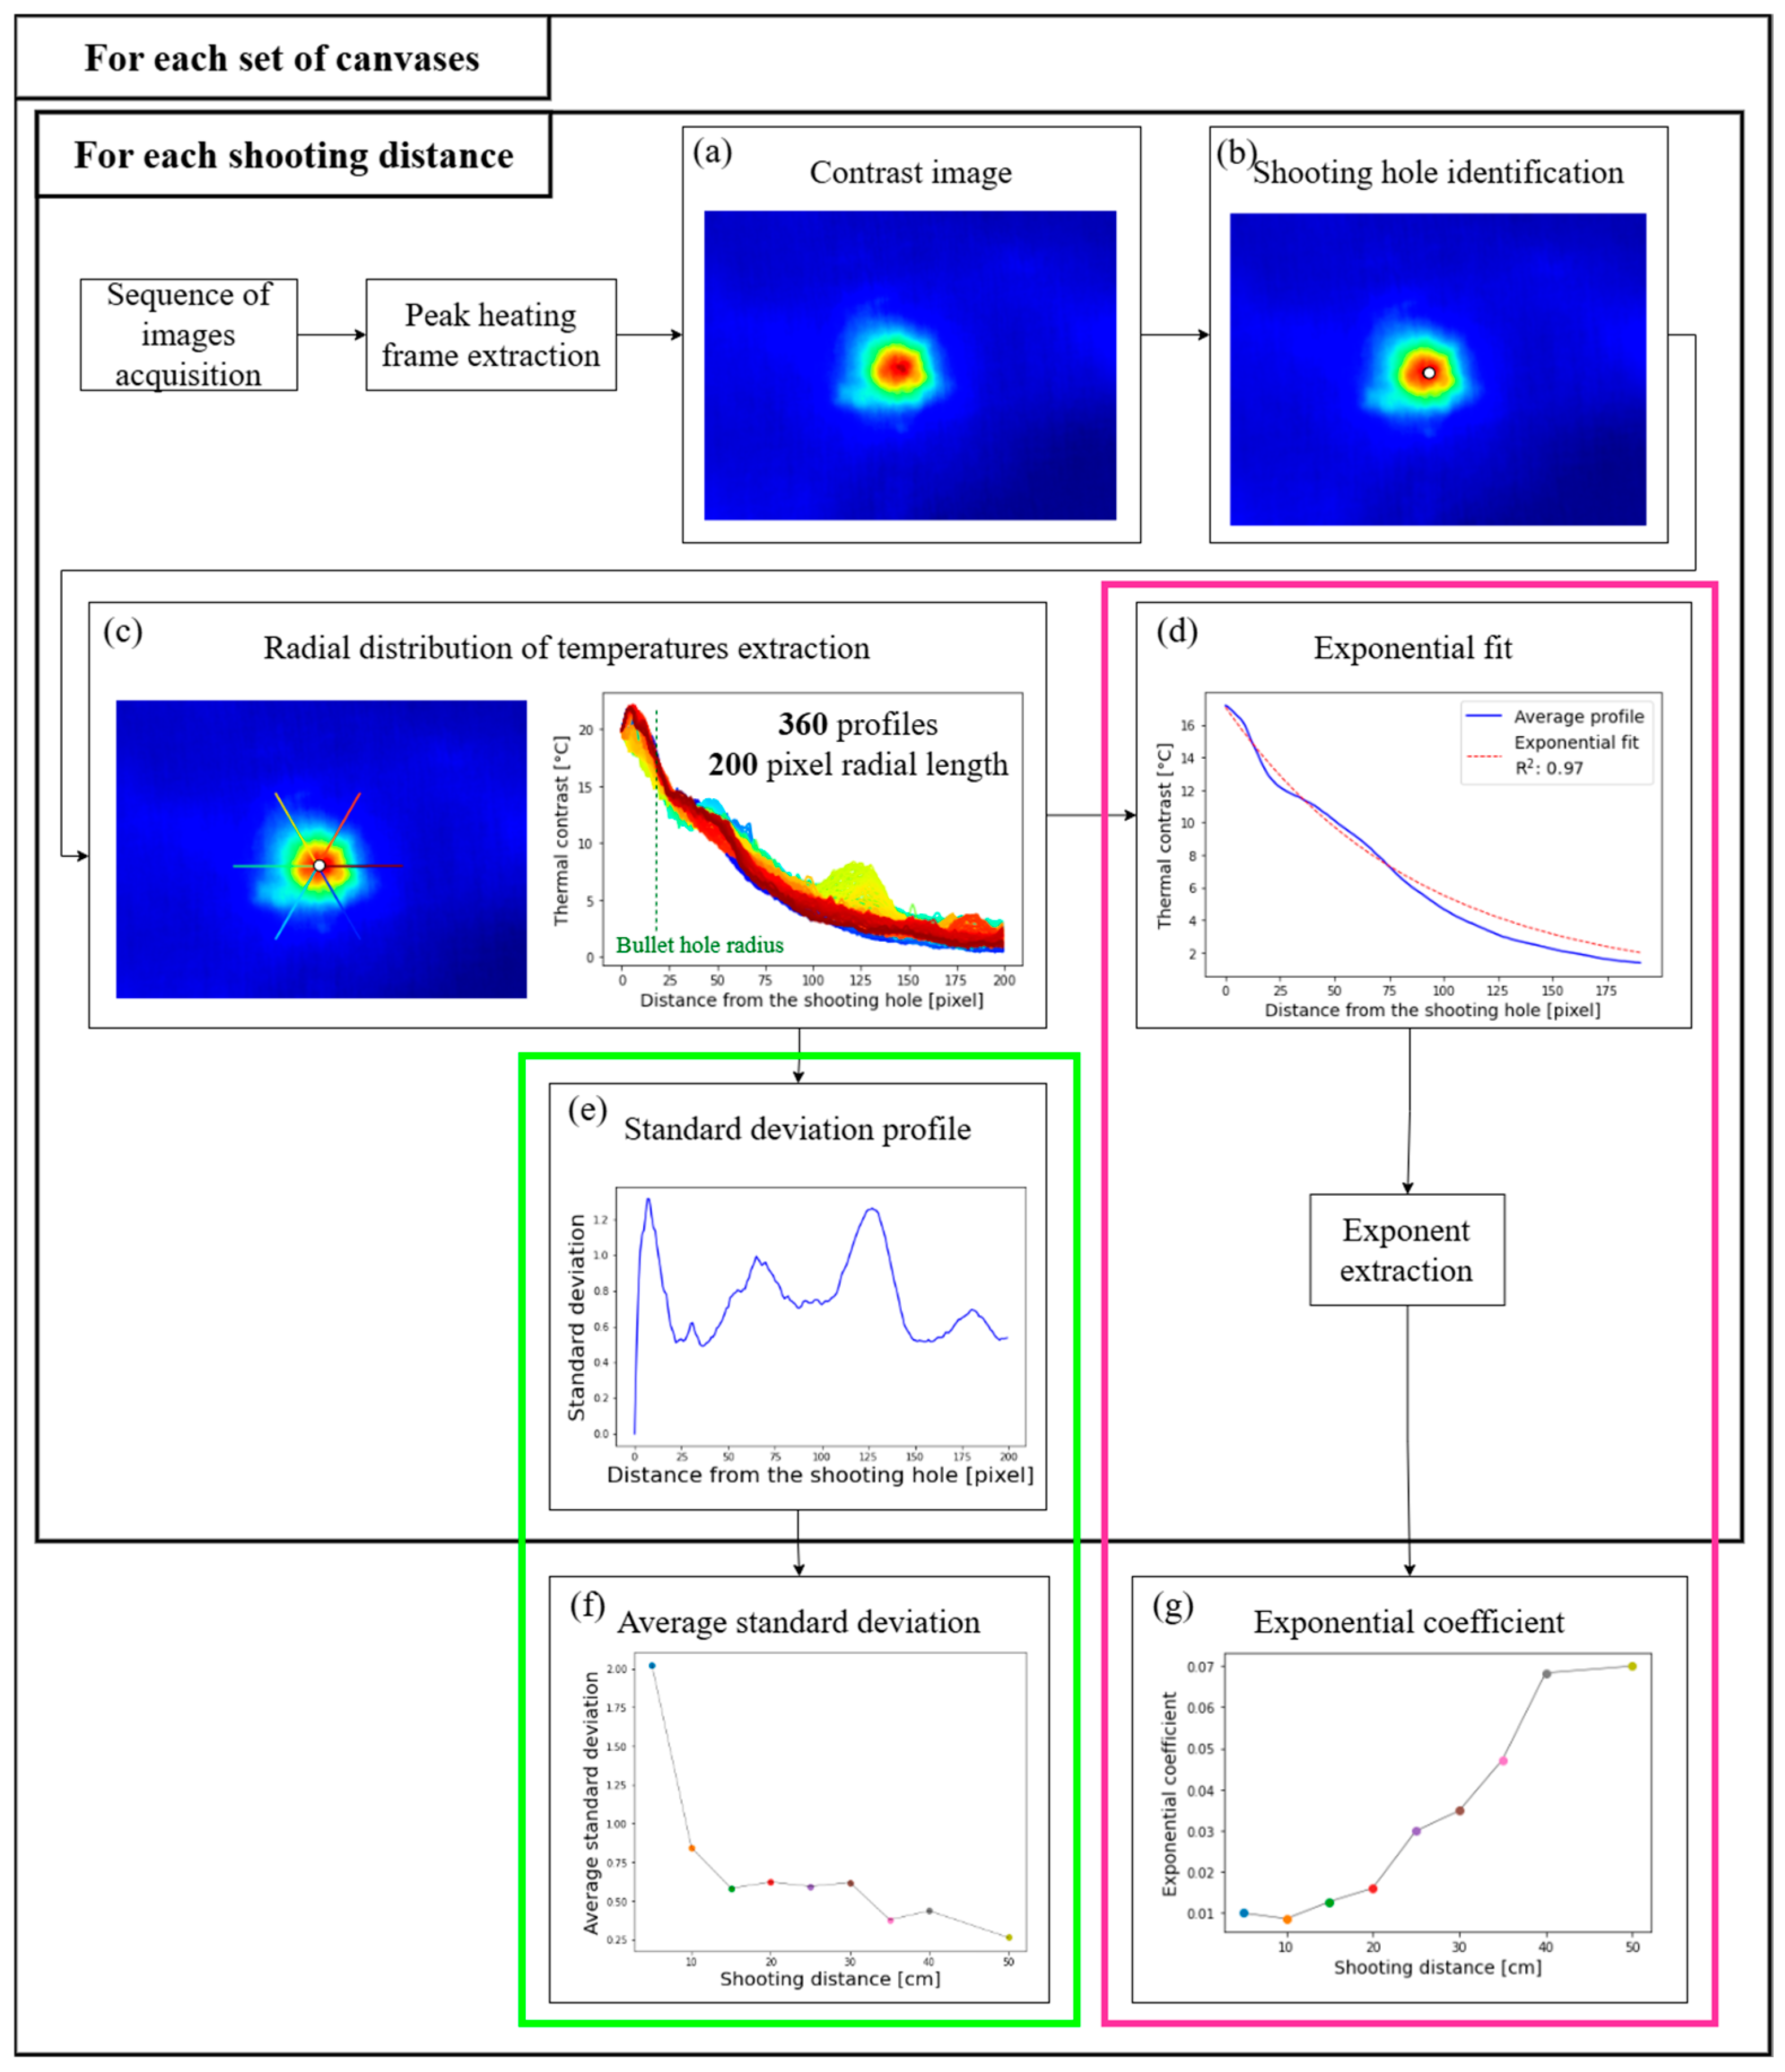
The methodology employed to extract features that can be related to crime occurrence information is described in
Figure 8. Specifically, for each set of canvases, and thus for each firing distance, the bullet hole has been automatically identified, and the average radial intensity profile has been extracted.
The central point is defined using the following algorithm. First, the pre-processed contrast image (
Figure 8a) is binarized using a high threshold, which is 90% of the maximum contrast value, to isolate the central bullet hole. Second, the contours of these high-intensity regions are identified. A weighted centroid is then calculated from these contours, where the center of each contour is weighted by its radius. The identified center is visualized as a white marker in
Figure 8b.
From this single central point, the radial distribution of temperature extraction is performed. In total, 360 radial profiles, one every 1°, each of a 200-pixel length, are extracted, as shown in
Figure 8c. Crucially, the radius of the bullet hole is also determined to identify the “cut-off” point, indicated by the vertical green dashed line in
Figure 8c.
These 360 profiles are averaged to minimize noise and any directional bias. The resulting average profile is shown in the exponential fit panel (
Figure 8d), where it is interpolated with an exponential function. As visible in the graph, the initial pixels corresponding to the hole artifact (the area to the left of the green dashed line in
Figure 8c), which acts as a blackbody, are excluded from this regression; the fit is performed on the subsequent decay profile representing the GSR on the fabric. The resulting exponential coefficient, which is dependent on the firing distance, was extracted as the primary characteristic feature for measuring the shooting distance.
The standard deviation profile (
Figure 8e) is also calculated from the 360 profiles. This feature quantifies the asymmetry and irregularity of the residue pattern. Its average value (
Figure 8f) is explored as a potential secondary feature to assess ballistic variability, as discussed in
Section 3.
2.6. Model Development and Application Framework
The average trend of the coefficients (calculated as the average of Sets I, II, III, IV, and COL) is fitted with a sigmoid. Weighted regression is applied to define the sigmoid.
The formula of the sigmoid is the one in Equation (2).
is the predicted value of the sigmoid for a given shooting distance, value. L is the maximum value that y can reach. is the value that x assumes when y is half of L. k is the slope of the curve around . is the offset parameter.
The definition of the sigmoid model is performed using weighted regression, that is, assigning a weight to each data point based on its uncertainty. Points with higher uncertainty have less weight in the error minimization process. The goal is to minimize the sum of the weighted residuals. Minimizing the sum of weighted square residuals ensures that points with large uncertainties affect the fit less.
The interpolation process returns the covariance matrix C of the model parameters, which diagonally contains uncertainties on the individual parameters and off-diagonally contains the correlations between the parameters. The uncertainty on the parameters
of the model is described in Equation (3). It represents how much each model parameter varies consistently with the data. Parameters with high correlations have larger uncertainty.
The uncertainty of the model is then determined by the propagation of uncertainties on the parameters estimated through the model. The propagation of uncertainty on the predicted
(i.e., the fitted curve) is calculated using the gradient of the model with respect to the parameters. If the regression function is
the uncertainty in the predictions is given by Equation (4).
are the optimal parameters.
is the uncertainty of the predicted value . is the partial derivative of the function with respect to and indicates how much the prediction changes if varies.
The blue region shown is realized by defining the upper and lower limit curves, obtained as provided by Equation (5); this region represents the standard uncertainty of the method.
Using the model and its uncertainty, the measurement of the shooting distance is carried out as follows. Taking a new sample, y is determined by the method described above, and the firing distance to be determined is given by the inverse formula in Equation (6).
The uncertainty of x resulting from model uncertainty can be calculated by uncertainty propagation. The formula used to calculate the uncertainty on the x measured is provided in Equation (7).
is the uncertainty on model parameters, are the partial derivatives of the inverse formula with respect to the parameters, is the partial derivative of the inverse formula with respect to , and is the uncertainty of .
Note that the sigmoid has three distinct zones.
An initial zone where the curve is almost flat. The y-values approach the vertical offset value b.
A sensitive zone in which the curve shows a marked transition, with strong sensitivity to changes in x.
A final zone in which the curve becomes flat again and tends to the L + b value, which is the maximum value of the curve.
Therefore, the model can be used to determine whether the measurement falls within one of the three zones. In the first and last part of the sigmoid curve, the exponential coefficient, i.e., the characteristic feature considered, does not significantly vary with x. This means that the method is not sensitive enough to allow for accurate measurement of the shooting distance x; however, the feature allows for classifying the measurement as either belonging to small or large distances. To make more accurate measurements with defined uncertainty, it is necessary to be in the sensitive zone; this is the intermediate zone of the graph.
3. Results
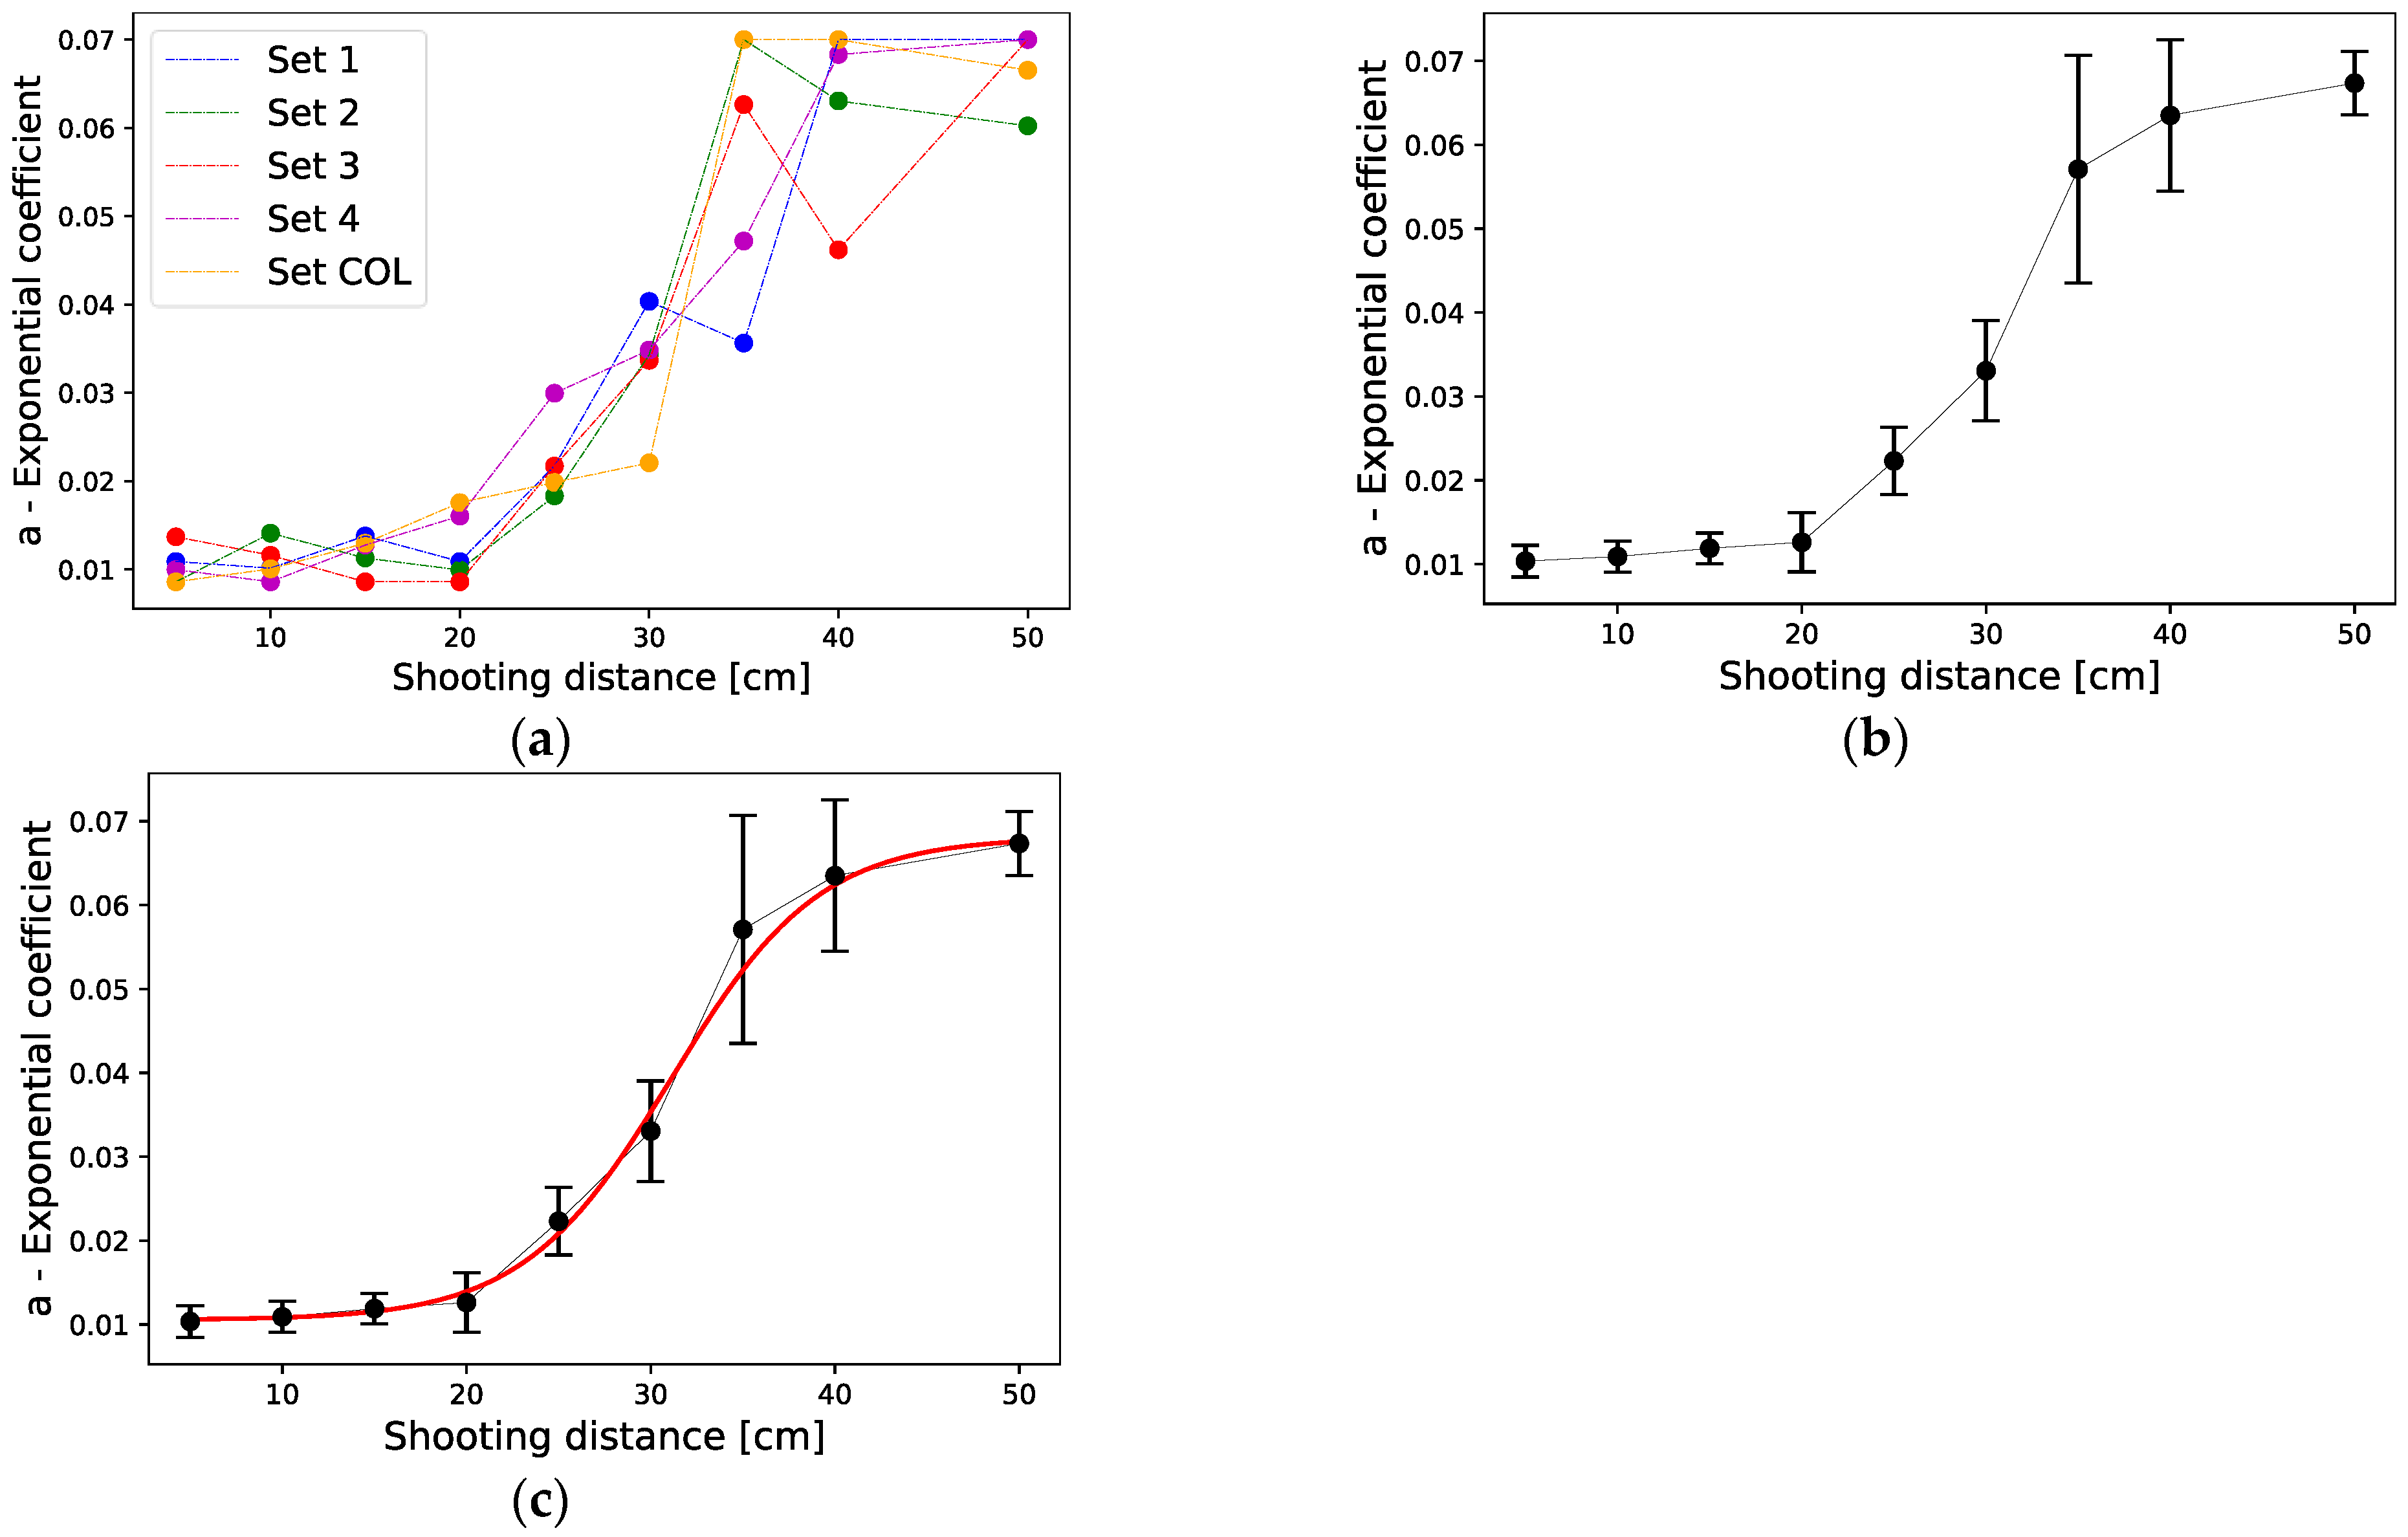
The image processing methodology has been applied to each canvas of Sets I, II, III, IV, and COL. The exponential coefficients along the shooting distances are shown in
Figure 9a. An average profile is calculated, and the standard deviation is calculated to define the uncertainty of the value obtained at each shooting distance (
Figure 9b). The average profile is fitted with very good accuracy (R
2: 0.99) with a sigmoid, shown in
Figure 9c.
The obtained optimal model parameters, and their respective uncertainties, are provided in
Table 2.
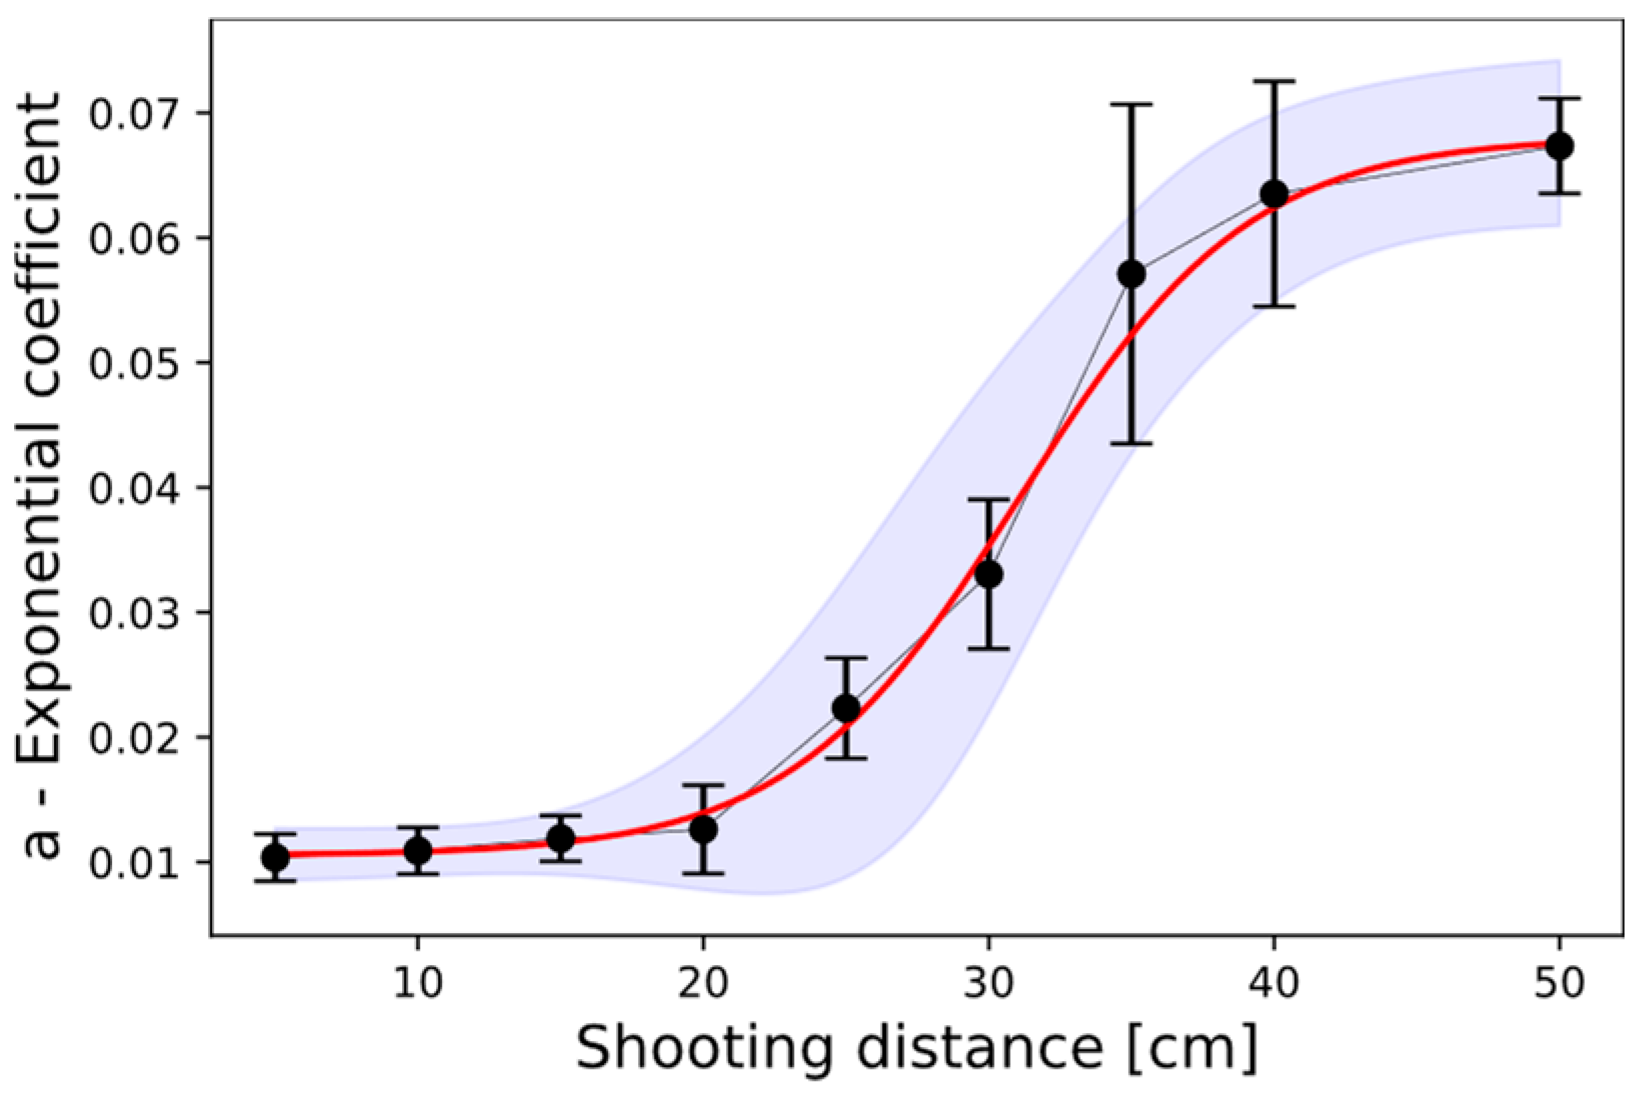
This produces an uncertainty distribution along the entire sigmoid, as shown in
Figure 10.
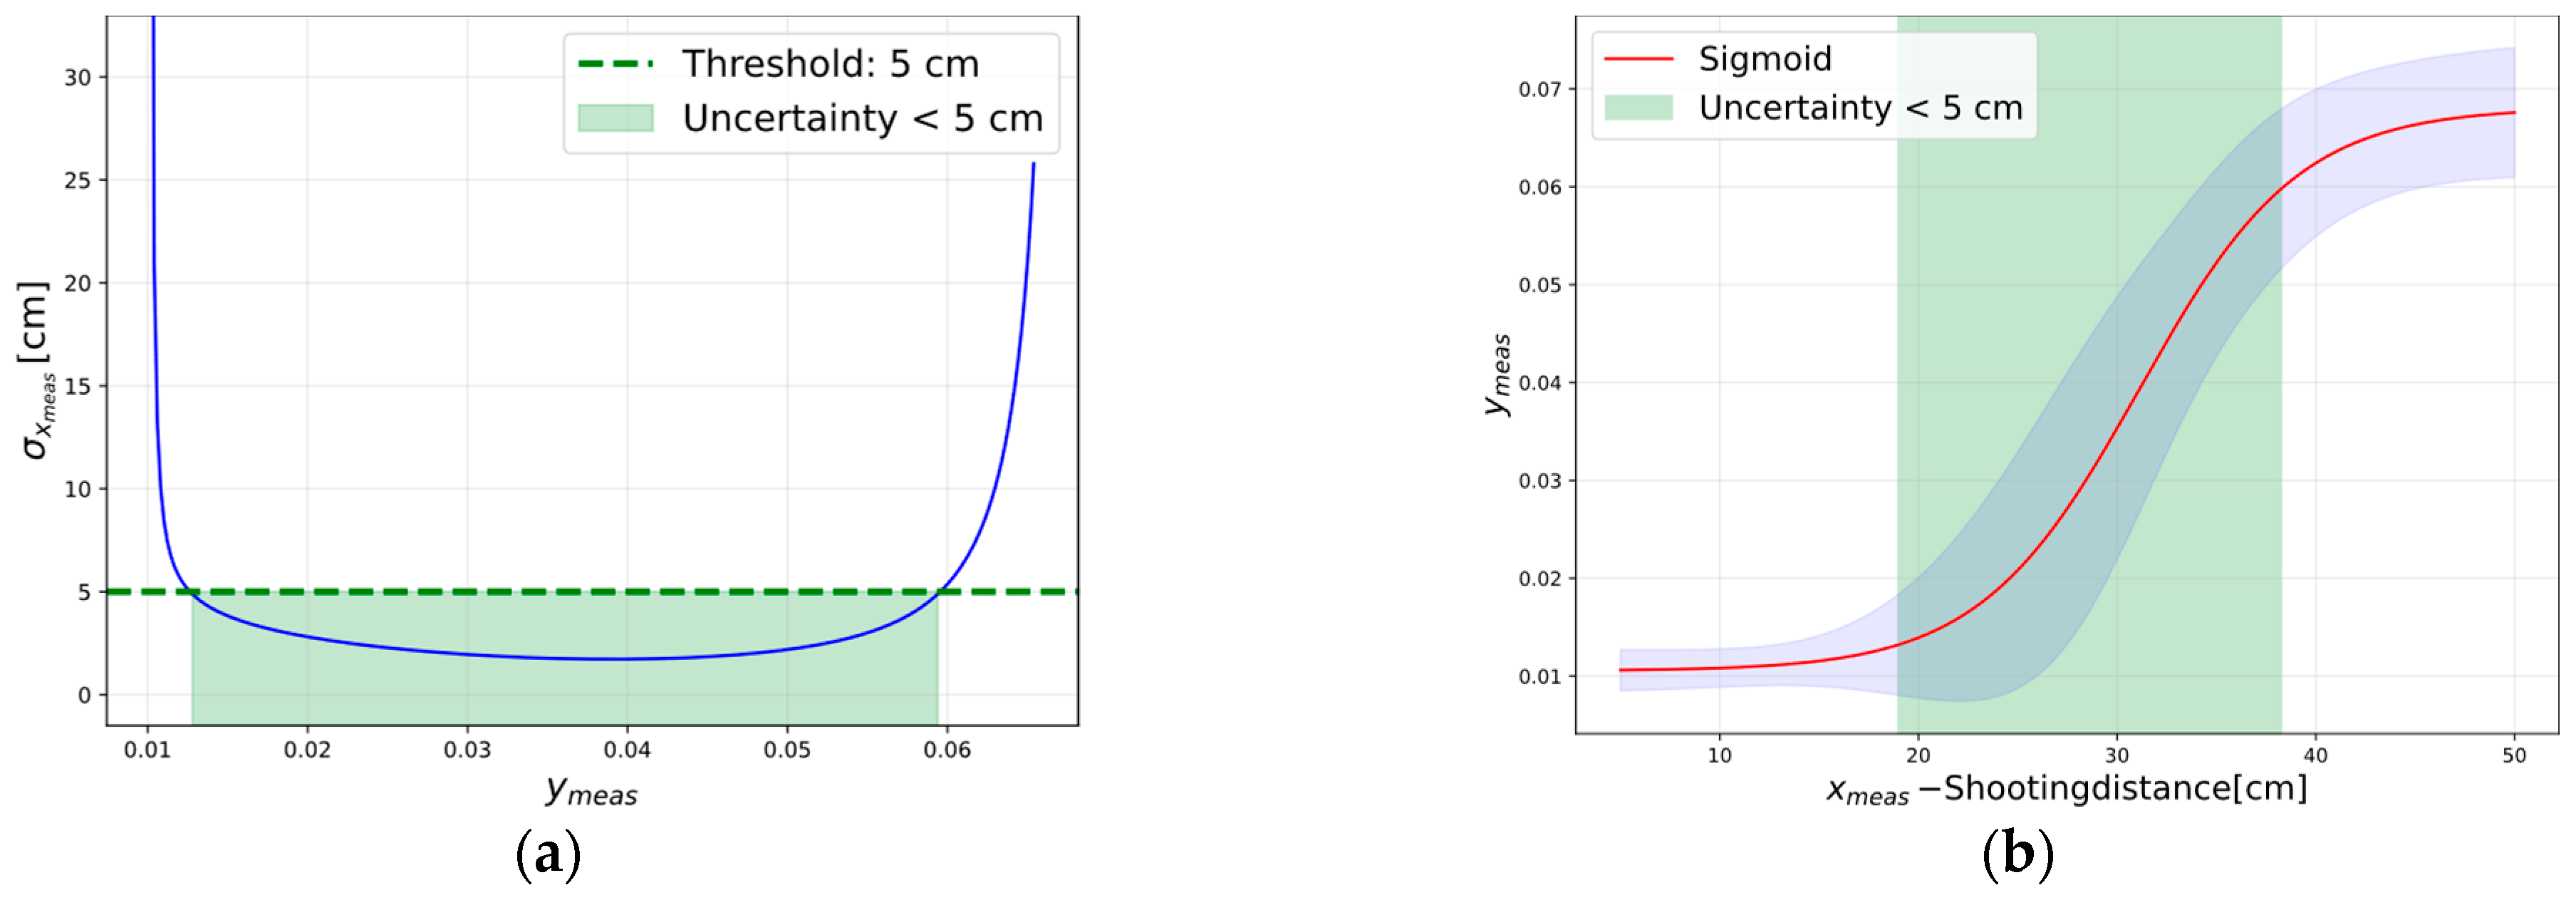
To make accurate measurements with defined uncertainty, it is necessary to be in the sensitive zone; this is the intermediate zone of the graph. To determine the limits of the zone of sensitivity, a limit is imposed on the width of the firing distance measurement to be made. For the purpose of defining the operational range of this model, it is required that the measurement should not have an uncertainty greater than 5 cm (
Figure 11a). Analyzing the trend of the uncertainty of the measurement, calculated according to Equation (7), for the values of the codomain of the sigmoid, the range of firing distances for which the uncertainty is less than 5 cm is obtained, and it is between 18 and 38 cm (
Figure 11b).
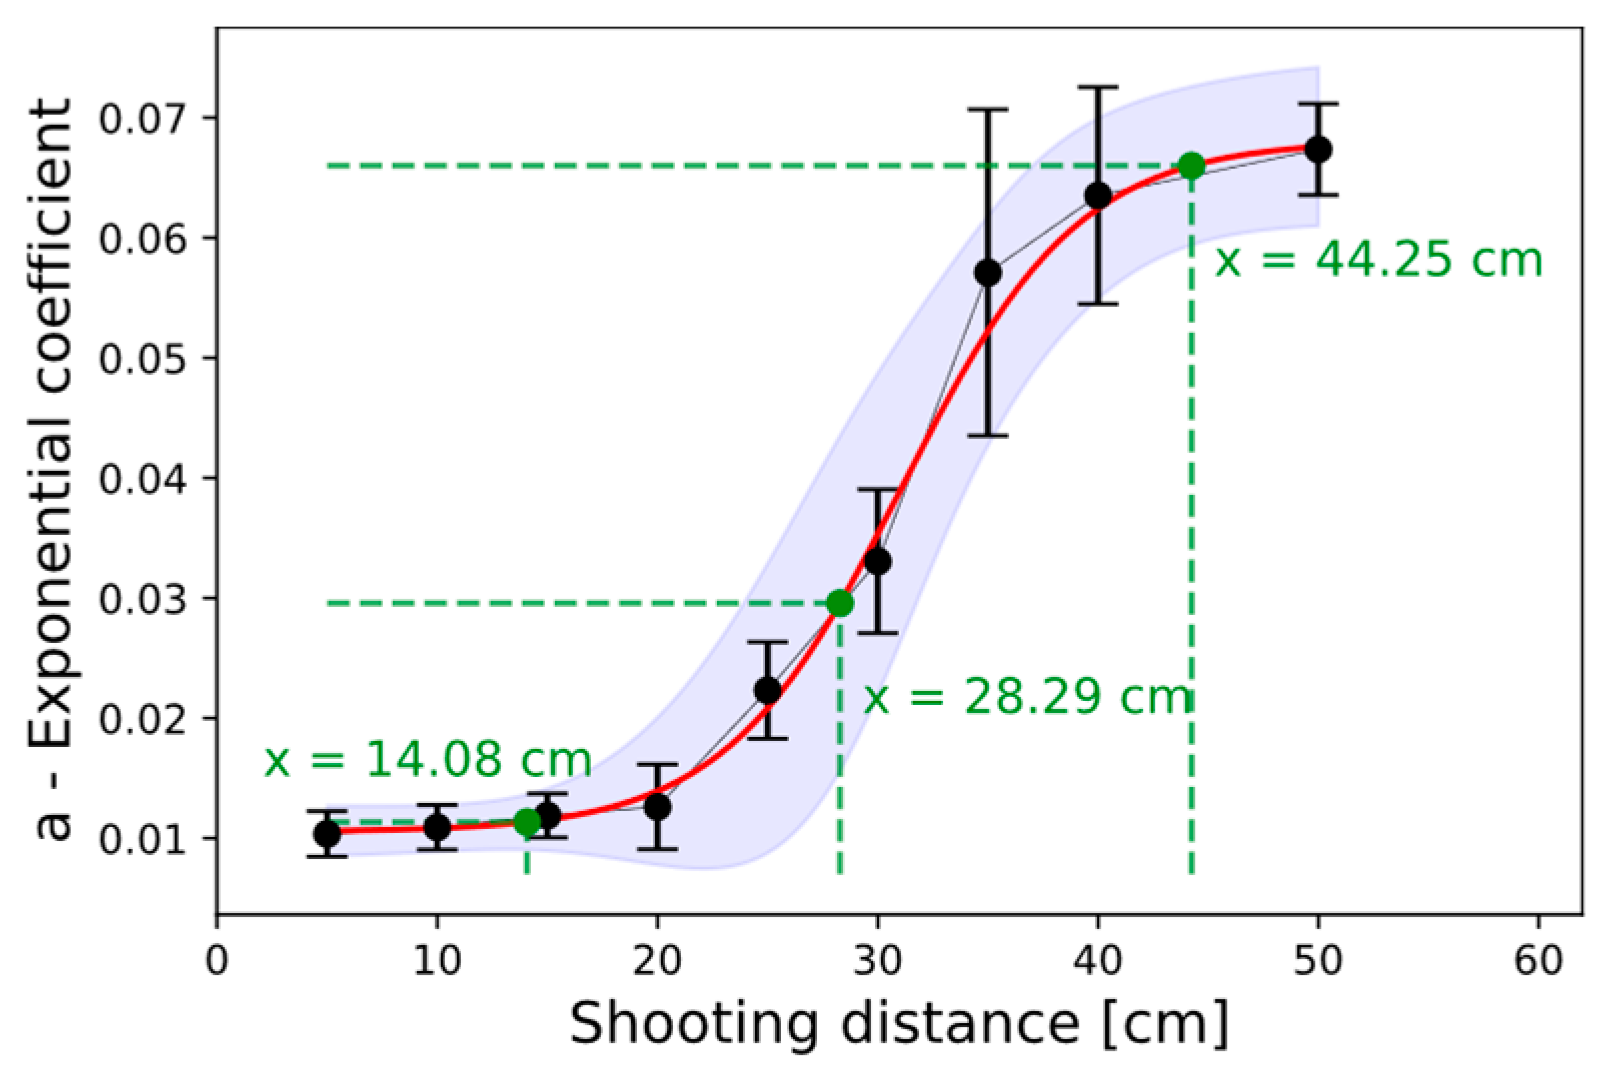
Finally, the model has been employed to measure the shooting distance of the three canvases of Set V, and the results are shown in
Figure 12 and reported in
Table 3.
Model Operational Validity and Sensitivity to Ballistic Variability
The present study is a novel proof of concept for the use of an active thermography protocol in the indirect measurement of firing distance. The methodology developed is based on the extraction of an exponential coefficient from the deposition pattern, the trend of which is related to the firing distance. A sequence of thermal images was made to explore the dependence of the methodology on the type of weapon and ammunition, fully acknowledging that GSR patterns are fundamentally system-dependent. The preliminary data obtained, although limited, showed that the main exponential coefficient followed a surprisingly consistent trend, even with different ballistic combinations. However, the radial intensity information shows that it is possible to discriminate between the two weapon–projectile combinations used. Specifically, in addition to the average intensity profile, the standard deviation of the profile was also extracted (see
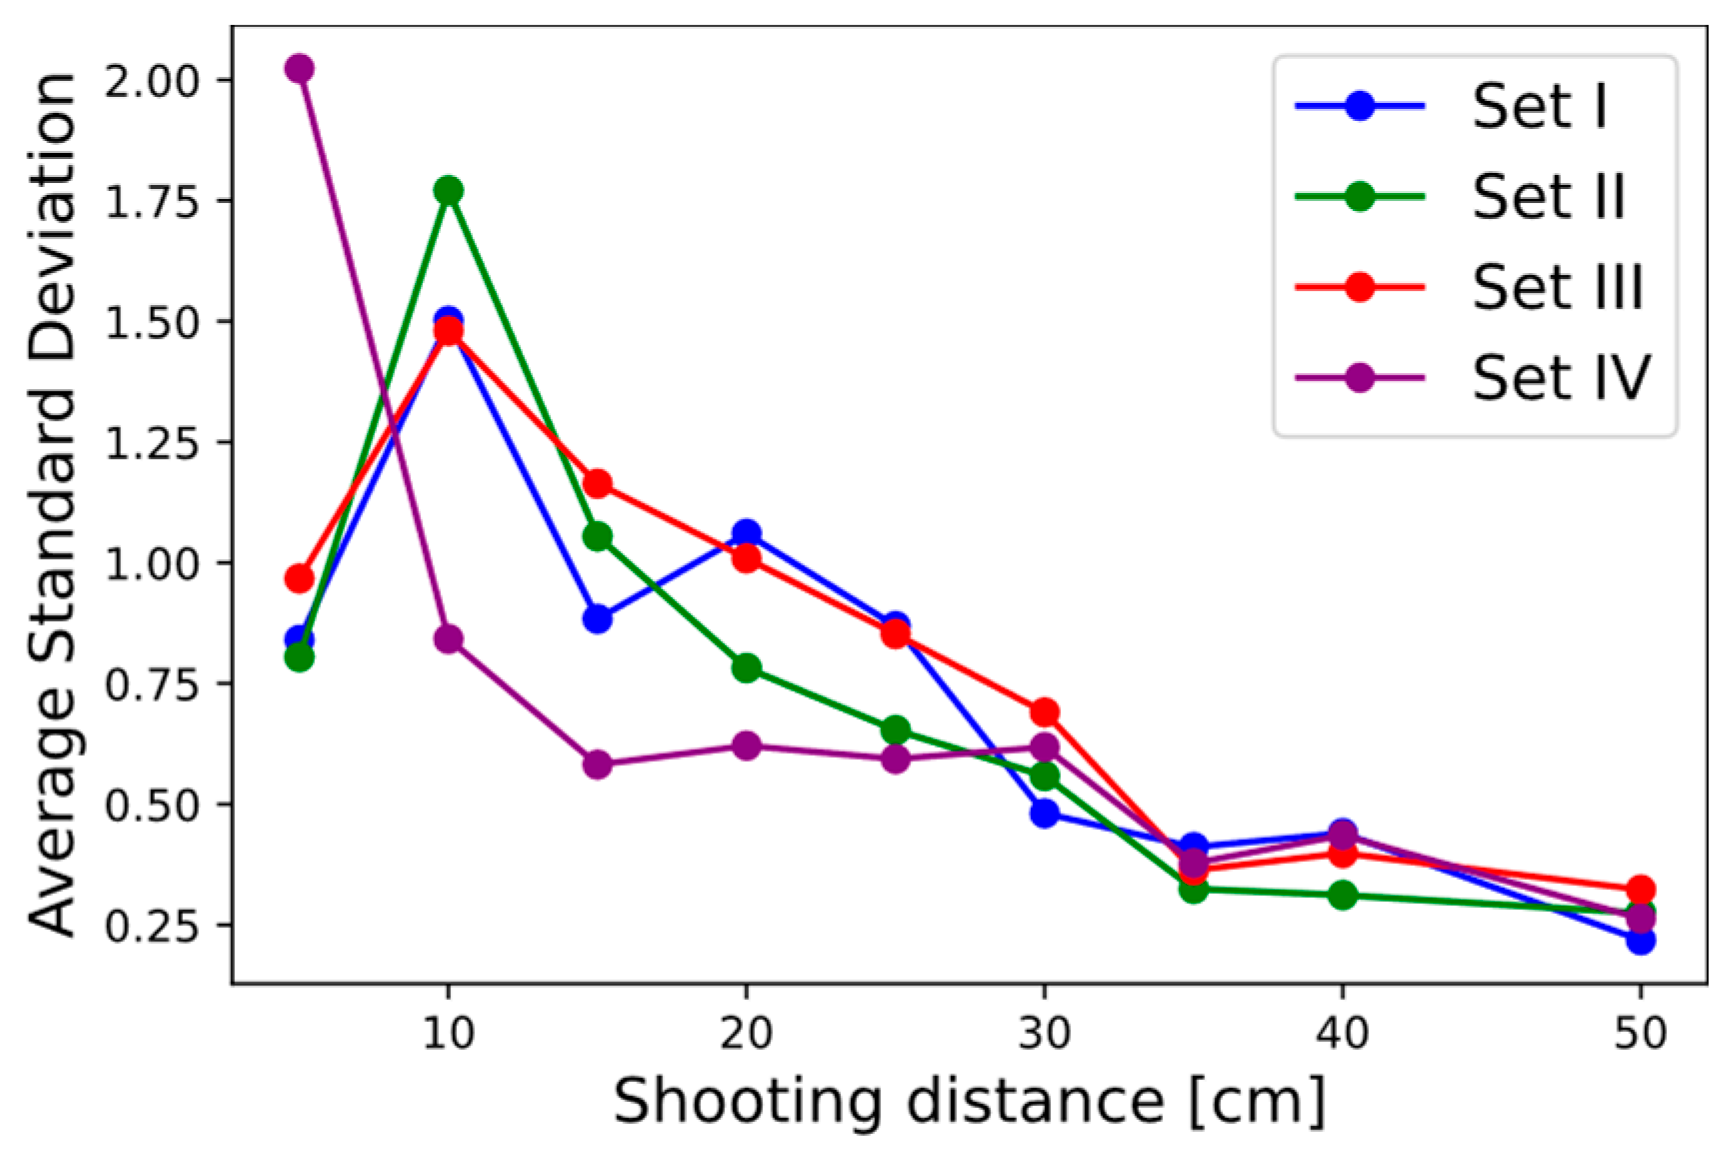
Figure 8). The profile of the average standard deviation, depicted in
Figure 13, appears to differ between the two projectile types at short distances (where the residues are denser and muzzle blast is more influential), while it tends to be uniform at long distances.
This observation confirms that, although the exponential coefficient appears to be independent of the combination of weapon and projectile, the secondary parameters of the thermal model can be influenced by this combination. Therefore, the current data are insufficient to support the absolute independence of the model for universal forensic application. Because of the experimental limitations and specificities found, it is concluded that the most robust and immediately valid application of the model, given the current scope of testing, is as a weapon-specific calibration model under consideration.
In a practical forensic context, the data presented support the use of the protocol to create a reference curve and an ad hoc uncertainty function based on the test shots of the weapon under consideration, thus supporting a case-specific distance estimation analysis. In summary, while the thermographic protocol works effectively and nondestructively, its most reliable use, given the current calibration dataset, is realized through a weapon- and ammunition-specific calibration whenever the weapon under consideration is available. Further studies will focus on expanding the dataset to assess the possibility of model generalization in the future. Furthermore, this study was limited to cotton canvases. The next step will be to conduct further investigations using different textile fibers, such as synthetic materials (e.g., polyester, nylon), which are commonly used in modern clothing and furniture. This will be essential to evaluate the reproducibility of the obtained results and the robustness of the thermal model across various substrates, which may present different thermal properties and interactions with GSR.
4. Discussion and Comparison with Established Techniques
Chemical and instrumentation methods are the established reference techniques for shooting distance measurement through GSR detection. The Griess test [
28], for example, can sensitively detect the presence of residues, but it requires the destruction or alteration of the sample. This implies that after applying the methodology, the sample cannot be used for further analysis, due to the GSR chemical reaction with the reagents. For the estimation of the shooting distance, like our method, the Griess test relies on the construction of a model based on manual measurement with rulers, or calipers, of the GSR pattern evidenced by the reagent. This allows for obtaining a mathematical model from the spatial distribution of residues to determine the shooting distance, however highly influenced by the subjectivity of observation—the number of radii considered and the position of the radii. In these terms, the proposed method, based on thermal imaging, introduces a physical, digital, and automatic form of measurement, not dependent on the subjectivity of the operator.
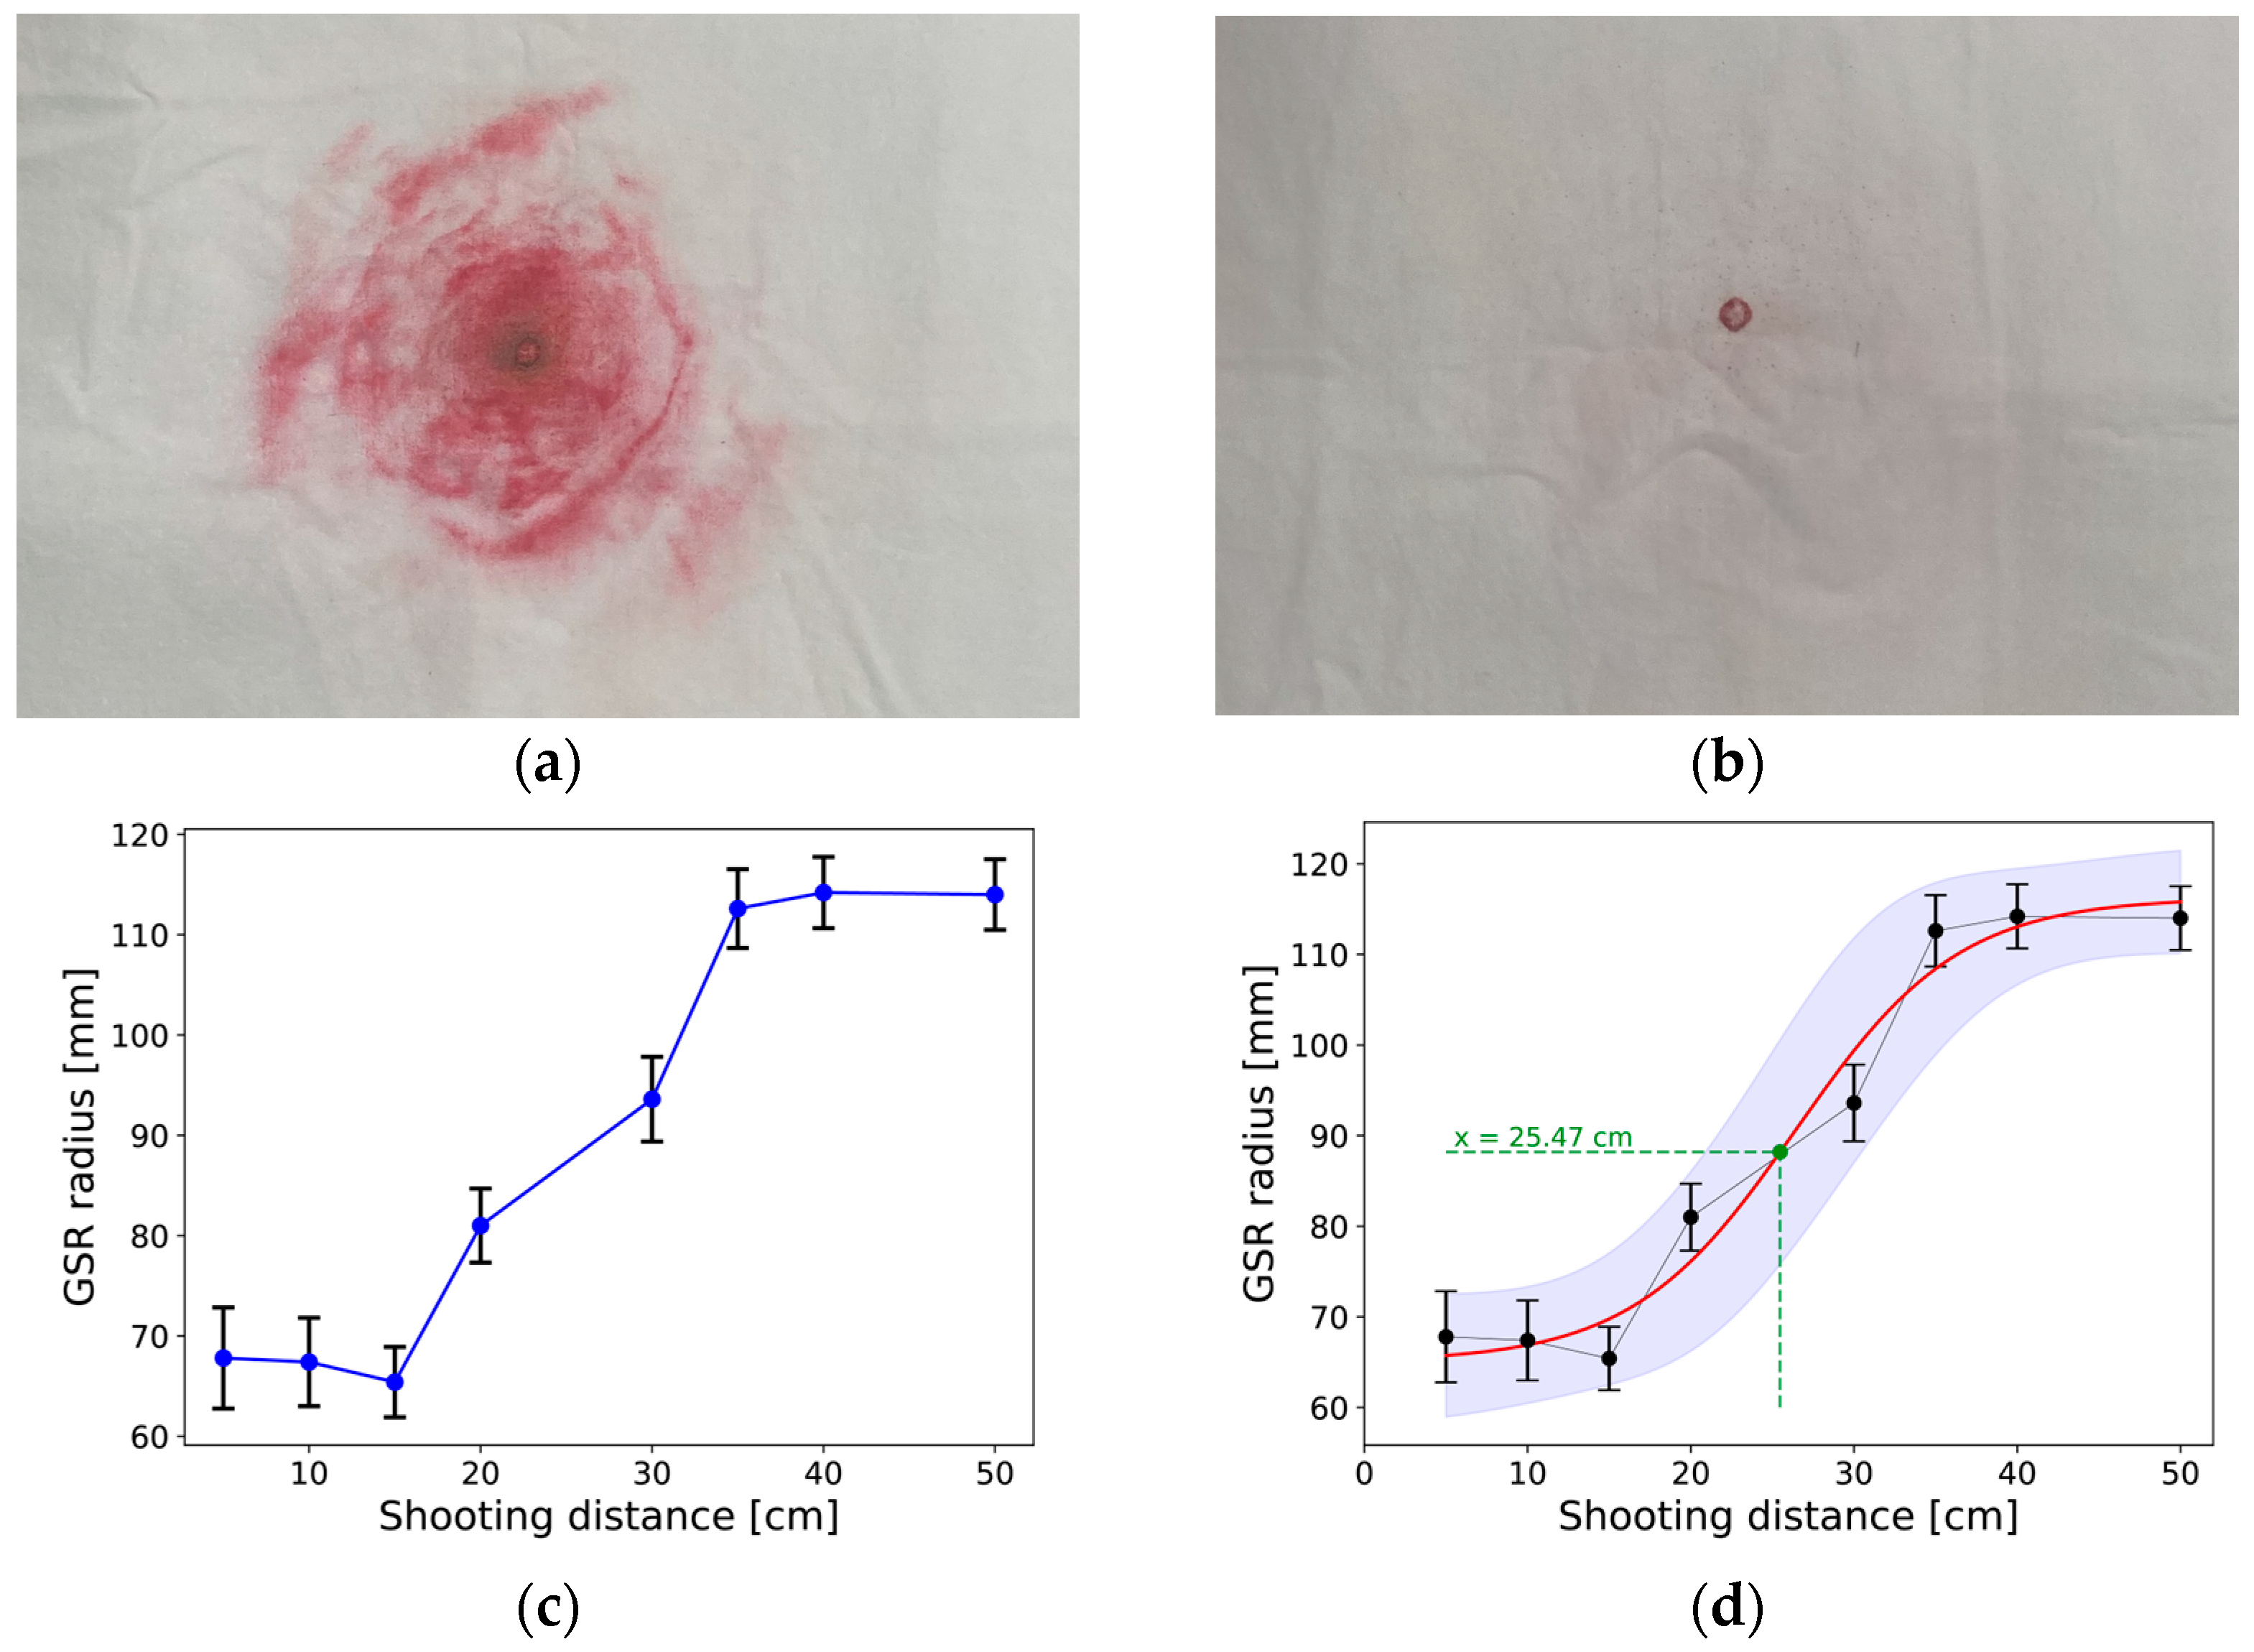
The developed thermography-based methodology has been compared to the Griess test application. Another set of cotton canvases was treated, and two examples are reported in
Figure 14a,b. The distance of identified particles from the bullet hole was calculated at five different points, defining five radii from the hole. Mean values with uncertainties are reported in
Figure 14c. The obtained results are similar to those obtained performing thermography, as shown in the model in
Figure 10.
Note that the measured quantities differ. In the case of the Griess test, the distance in millimeters of the residue from the hole is measured. In the case of thermography, a dimensionless parameter is obtained that indicates how the residue is distributed and densified around the shot hole. Although they are not comparable in terms of quantitative quantities, as the firing distance increases, the curves are compatible in terms of trends and uncertainties. A sigmoid model, and its uncertainty, was fitted in a manner equal to that defined for the proposed methodology and is shown in
Figure 14d. Sample 2 (see
Table 3), from set V, which was used for the measurements, was subjected to the Griess test, and the distance of the particles from the center was subsequently measured. Using the new model gives a firing distance of 25.47 cm with an uncertainty of 2.22 cm. Therefore, the uncertainty of the model constructed by thermography is of the same order of magnitude as that obtained by the Griess test.
Other non-destructive approaches based on hyperspectral or infrared photography have been proposed in the recent literature. These techniques mainly focus on visualizing residues deposited on the fabric surface. However, none of these studies have set out to achieve an objective measurement of the firing distance. Interest has been limited to detection or qualitative mapping of GSR, often using imaging to enhance contrast or highlight particles invisible to the naked eye. In addition to visualization and detection, we focused on the measurement of firing distance and the related uncertainty analyses.
Moreover, because these are surface particles, they are easily altered or removed over time, especially under less-than-ideal storage conditions. Active thermography allows for deeper analysis, revealing the residual thermal halo within the textile fibers, which is often more stable and less prone to accidental contamination. This feature is a key advantage in real-world forensic contexts, where the specimen may have been manipulated, stored under suboptimal conditions, or subjected to environmental degradation.
The Flash-Pulse Thermography approach also has significant advantages from an operational perspective. Thermal sequence acquisition occurs almost instantaneously, enabling rapid and efficient analysis. This contrasts with the longer timelines associated with many hyperspectral systems, which often require slow scans or complex technologies. Computationally, the proposed method is not based on Machine Learning techniques but on deterministic analysis of thermal images. This results in lower model complexity, greater transparency in data processing, and easier replicability of results. This may promote legal acceptance of the method, making it a viable candidate for integration into formal forensic practices.
5. Conclusions
The developed proof-of-concept methodology demonstrates effectiveness in determining firing distances. The use of active thermography, particularly Flash-Pulse Thermography, has enabled high-resolution detection of the distribution of non-particulate combustion residues on fabrics by exploiting the thermal contrast between residue-contaminated areas and the rest of the sample. The methodology allows for determining the shooting distance on both white and colored canvases. The coefficient of the exponential representing the radial distribution of GSR on the canvases turns out to be strongly dependent on the firing distance. Modeling the resulting coefficients using a sigmoid function allows for obtaining reliable measurements with an uncertainty of less than 5 cm for distances in a working range between 18 and 38 cm under the tested conditions. It also allows for classifying the measurement as belonging to short or large distances, below or above the working range.
The method exhibits potential for generalizability, but the current limited dataset is insufficient to support absolute independence from weapon and ammunition type. Analysis of secondary parameters, such as standard deviations of the radial intensity profiles, still allowed for the distinction between different weapon and projectile combinations at close distances, highlighting the need for tailored calibration.
Due to the experimental limitation, the most robust, valid application of this protocol is as a weapon- and ammunition-specific calibration tool. This approach supports a case-specific distance estimation analysis through the creation of a reference curve and an ad hoc uncertainty function based on test shots from the weapon under investigation.
The results have been successfully compared with the trends and uncertainties of an established chromogenic method. Compared to other proposed non-destructive techniques, this methodology represents a significant contribution to forensic science, offering a digital, accurate, and automatic analysis of cotton textiles to measure the shooting distance, not influenced by the subjectivity of the operator.




 ,
,