


Abstract
Corrosion of carbon steel components represents a major economic and safety challenge in industrial applications, motivating the development of protective thin film coatings with optimized deposition parameters. This study investigates the deposition of nickel nitride (Ni-N) thin films on AISI 1016 carbon steel and silicon (111) wafers by reactive radio-frequency (r.f.) magnetron sputtering at three power levels: 150, 175, and 200 W. Surface color, film thickness, roughness, crystal structure, mechanical properties, and electrochemical behavior were evaluated using optical microscopy, stylus profilometry, atomic force microscopy (AFM), X-ray diffraction (XRD), nanoindentation, and potentiodynamic polarization combined with electrochemical impedance spectroscopy (EIS). Increasing r.f.-power produced systematic surface color changes consistent with variations in film thickness, which ranged from approximately 25.0 to 50.7 nm. Higher deposition power promoted smoother surfaces, with average roughness (Ra) decreasing from 64.28 nm at 150 W to 20.62 nm at 200 W. XRD analysis revealed a monocrystalline Ni3N hexagonal close-packed (HCP) phase at 150 W, transitioning to a dual-phase Ni3N (HCP) and Ni4N face-centered cubic (FCC) microstructure at 175 and 200 W. The highest hardness (11.80 ± 3.34 GPa) was recorded at 150 W, accompanied by pop-in events attributed to dislocation nucleation in the HCP lattice. Electrochemical evaluation in 3.5 wt.% NaCl solution demonstrated that films deposited at 150 and 175 W exhibited corrosion current densities and rates exceeding those of bare steel, confirming that these conditions accelerate rather than inhibit corrosion. Only the film deposited at 200 W achieved superior corrosion protection, with a corrosion current density and rate approximately 50% lower than bare steel, attributed to its denser microstructure and smoother surface morphology. These findings demonstrate that r.f. power is a critical parameter governing the properties of Ni-N thin films, and that careful optimization of deposition conditions is essential before recommending such coatings for industrial corrosion-protective applications.
1. Introduction
Corrosion-related damage represents an immense economic burden, accounting for a substantial fraction of national and global economic output. In addition to direct costs such as material degradation and maintenance, indirect expenditures including production losses and safety risks can substantially amplify the financial impact, with estimates reaching up to $551.4 billion when end user impacts are considered [1]. These challenges underscore the pressing need to implement efficient and durable corrosion prevention measures across industries worldwide. Corrosion is the process by which metals undergo chemical transformation into more stable compounds, including oxides, hydroxides, or sulfides, resulting in the deterioration of metal surfaces [2]. Anions such as sulfates (SO42−), nitrates (NO3−), chlorides (Cl−), and thiosulfates (S2O32−) can accelerate the corrosion of iron alloys in industrial settings, drastically reducing their service life [3,4,5,6]. Additionally, marine environments are widely recognized as particularly aggressive, affecting structures such as bridges, buildings, and industrial facilities, with corrosion rates ranging from 10 μm/year to 0.10 mm/year [7].
The use of inhibitors and protective coatings has proven to be among the most effective strategies for corrosion prevention [3,8,9,10]. However, organic corrosion inhibitors may be hazardous to the environment and could exhibit cytotoxic or mutagenic effects on biological systems [3,11]. For metallic materials, surface coatings incorporating micro- and nanostructures can provide efficient corrosion protection, although poor long-term performance may result from the low adhesion of brittle oxide layers to the underlying substrate [3,11,12]. Consequently, appropriate surface treatments, such as mechanical pre-treatment or thermochemical procedures, are necessary to complement a well-designed coating structure and achieve effective corrosion resistance [13].
In this regard, transition metal nitrides (TMNs) are well-known for their low electrical resistivity, strong covalent bonding, and exceptional corrosion resistance [14,15,16]. Among the TMN candidates, nickel (Ni) stands out due to its remarkable combination of toughness, wear resistance, magnetic behavior, and hardness, and has been widely employed in sputtering-deposited films [17,18]. Compared to other transition metal compounds, TMNs exhibit superior mechanical properties and chemical stability due to their unique combination of covalent, ionic, and metallic bonds [19]. Their high electrical conductivity makes them particularly attractive for electrochemical applications, although their resistance to oxidizing and hydrofluoric acid environments may be limited [20]. Ni-based alloys also offer exceptional mechanical strength and oxidation resistance at elevated temperatures [21]. Taylor (2001) reported that maximum corrosion protection on metallic substrates requires Ni coating thicknesses of 120–130 μm [22]; however, increasing coating thickness is known to reduce interfacial shear strength and adhesion performance [23].
Ni exhibits two allotropic phases: a stable face-centered cubic (FCC) structure and a metastable hexagonal close-packed (HCP) structure [24]. A third phase has been reported, though it has not been observed in reactive magnetron sputtering and appears to be accessible only through chemical synthesis routes [25]. Ni-based nitrides include Ni3N, which exhibits an HCP structure; Ni2N, which adopts a body-centered cubic (BCC) structure; and Ni4N phases I and II, both of which are FCC. These phases can form sequentially from the pure Ni FCC phase during reactive sputtering in an Ar–N2 gas mixture as nitrogen partial pressure increases [26,27,28].
Transition metal nitride and Ni-alloy thin films have demonstrated promising electrochemical performance in artificial electrolyte solutions containing 3.5 wt.% NaCl [29,30,31,32,33]. Table 1 summarizes representative corrosion data for Ni, nitride, boride, and oxide films reported in the literature. Ti-N and Ni films exhibit the lowest corrosion rates (CR) at 0.02 and 1.23 × 10⁻² mm/year (mm·y−1), respectively, indicating superior corrosion protection, while Ni-B films demonstrated poor protection with a CR of 21.83 × 10⁻² mm/year, attributed to the inhibition of passive oxide film formation with increasing boron content. Recent studies have further confirmed that deposition parameters such as nitrogen stoichiometry, sputtering power, and film microstructure critically govern corrosion resistance in chloride media: ZrN films deposited by reactive magnetron sputtering on steel substrates showed that stoichiometry strongly influences both wettability and electrochemical behavior [32], while TiAlSiN coatings evaluated in 3.5 wt.% NaCl demonstrated that surface passivation reduces electrochemical reactivity and slows CR [33]. Similarly, Grayeli et al. [29] reported a clear dependence of corrosion resistance on r.f. power for CrN films deposited on stainless steel, a finding that motivates the systematic investigation of power effects in Ni-N systems.
Table 1.
Data obtained from an electrochemical analysis of materials submerged in a 3.5% NaCl solution.
Despite these advances, the electrochemical performance of Ni-N thin films deposited specifically by r.f. magnetron sputtering on carbon steel substrates remains comparatively underexplored relative to other transition metal nitrides such as TiN, CrN, and ZrN [24,30,31]. While Keraudy et al. [24] characterized the electrochemical behavior of NixN films by DC and HiPIMS sputtering, and Pandey and Gupta [34] recently reported the composition-dependent electrochemical properties of reactively sputtered Ni–N films, the systematic effect of r.f. power on phase composition, surface morphology, and corrosion performance of Ni-N coatings on carbon steel has not been addressed. Reactive sputtering remains the primary deposition route for Ni-N films [26,27,35], and the present work addresses this gap directly.
2. Materials and Methods
2.1. Substrate Selection and Preparation
The American Iron and Steel Institute (AISI) 1016 is a low carbon steel whose elemental composition, expressed in wt.%, corresponds to 0.16% C, 0.8% Mn, 0.2% Si, 0.02% P, 0.012% S, and balance Fe [36]. AISI 1016 steel is an inexpensive material used in the manufacturing of machine parts not subjected to high mechanical stress, such as shafts, chain links, pins, cemented bushes, standard screws, flanges, and gears for low-stress chain drives [36,37]. Substrate preparation began by cutting samples from a commercial metal sheet to dimensions of 25.4 × 25.4 × 3.05 mm (1 × 1 × 0.12 inches). Subsequently, the substrates were ground using silicon carbide (SiC) abrasive papers of various grit sizes: 100, 400, 600, 1000, and 1500 grains/cm2. The substrates were then polished using an aqueous aluminum oxide (Al2O3) suspension, followed by cleaning with deionized water and ultrasonication in isopropyl alcohol at 40 °C for 20 min. AISI 1016 substrates were used for surface roughness and electrochemical evaluations, while p-type silicon wafers with (111) orientation, defined by the Miller index, were used for X-ray diffraction (XRD), scanning electron microscopy (SEM), and nanoindentation assessments.
2.2. Deposition of Ni-N Thin Films
Ni-N thin films were deposited on AISI 1016 carbon steel using a radio frequency (r.f.) magnetron sputtering system (13.56 MHz, Trinus Vacuum, Madrid, Spain). The deposition was carried out using a commercial Ni target (purity 99.99%) with a diameter of 2 in and a thickness of 0.125 in. For the formation of Ni-N thin films, nitrogen (N2) gas with a purity of 99.99% was injected into the chamber. To sustain the sputtering plasma, Argon (Ar) gas with a purity of 99.90% was used. The gas flow rates were controlled using mass flow controllers (Cole-Palmer, Vernon Hills, IL, USA), and flow measurements were expressed in standard cubic centimeters per minute (SCCM). Prior to deposition, the sputtering chamber was evacuated to a residual pressure (rp) of ~8.2 × 10⁻² mbar using a primary pump, which was subsequently reduced to 1.9 × 10⁻⁵–2.3 × 10⁻⁵ mbar using a turbomolecular pump. The working pressure (wp) was monitored between 6.0 × 10⁻³ and 5.2 × 10⁻³ mbar. Various experiments were conducted by adjusting the r.f. power on the target using levels of 150 W, 175 W, and 200 W, under an Ar/N2 gas mixture ratio of 20/7 SCCM. The target-to-substrate distance was set to 70 mm. The deposition time was set at 10 min for the Ni buffer-layer, and 110 min for the Ni-N monolayer thin films, with no external substrate heating. Table 2 summarizes the deposition conditions for the Ni-N thin films.
Table 2.
Experimental conditions for the deposition of Ni-N thin films onto AISI 1016 carbon steel and Si wafers were achieved using r.f. magnetron sputtering.
2.3. Characterization
Photomicrographs of the Ni-N thin films were captured using a portable USB digital microscope (JNYZ59419, Shenzhen Anykit Technology Co., Shenzhen, China) with a frame rate of 30 fps, a resolution of 2 megapixels, and a focusing range of 15–40 mm at a maximum magnification of 50×. The surface profile and thickness of the Ni-N thin films were measured over a 500 µm span using a DEKTAK 150 stylus profilometer (Veeco Instruments, Plainview, NY, USA). The thickness was determined by measuring the step height between the deposited film and the uncoated substrate, using a stylus with a 12.5 µm radius.
For topography imaging and surface roughness measurement of the Ni-N thin films, an Atomic Force Microscope (AFM) Workshop model TT-AFM (Hilton Head Island, SC, USA) was used. A silicon tip (n-type Si) was used, and the images were acquired in contact mode at a scanning frequency of 0.7 Hz. The image dimensions selected for evaluation were 10 × 10 μm, 20 × 20 μm, and 50 × 50 μm. The images were processed using Gwyddion 2.48 (free and open-source software, Czech Metrology Institute, Brno, Czech Republic, with 3D OpenGL rendering). These measurements were used to determine the root mean square roughness (RMS) and the average roughness (Ra). The phase composition and crystal structure of the thin films were investigated by X-ray diffraction (XRD) using a D8 Advance diffractometer (Bruker AXS, Karlsruhe, Germany) with Cu Kα radiation (λ = 1.54059 Å), operating at 30 kV. Diffraction patterns were recorded over a 2θ range of 20–100° at a scan rate of 0.01°/s.
Nanoindentation tests were carried out using a TTX-NHT nanoindenter (Anton Paar (S/N: 10000), Graz, Austria). The test conditions included an acquisition rate of 10.0 Hz, with linear loading from 5 to 20 mN maximum load, and a holding period of 10.0 s at maximum load. The loading rate was established according to the applied load. A Berkovich diamond indenter (serial B-T 83 (Hysitron Inc., Minneapolis, MN, USA)) was used for all indentations.
To evaluate the corrosion behavior of the Ni-N thin films, a potentiostat-galvanostat (Bio-Logic, Seyssinet-Pariset, France) was employed. Potentiodynamic polarization curves were recorded using a three-electrode electrochemical cell, where the exposed sample area was 1 cm2 for both bare substrates and thin film samples. A platinum wire served as the counter-electrode, while an Ag/AgCl electrode was used as the reference. The electrolyte used was a 3.5 wt.% NaCl solution. The corrosion potential (Ecorr) was monitored over 10 min, and polarization curves were measured by sweeping the potential from −100 to +350 mV at a scan rate of 0.5 mV/s. Electrochemical impedance spectroscopy (EIS) studies were also carried out using the same three-electrode configuration. EIS measurements were performed with an amplitude of 10 mV at the open circuit potential (OCP), spanning a frequency range from 100,000 Hz to 0.1 Hz. The analysis included key parameters such as double-layer capacitance and charge transfer resistance, which were used to evaluate corrosion resistance efficiency and understand corrosion mechanisms. This approach provides a comprehensive assessment of the films’ protective behavior in aggressive environments.
3. Results
3.1. Review Top-Color Surface by Optical Microscope
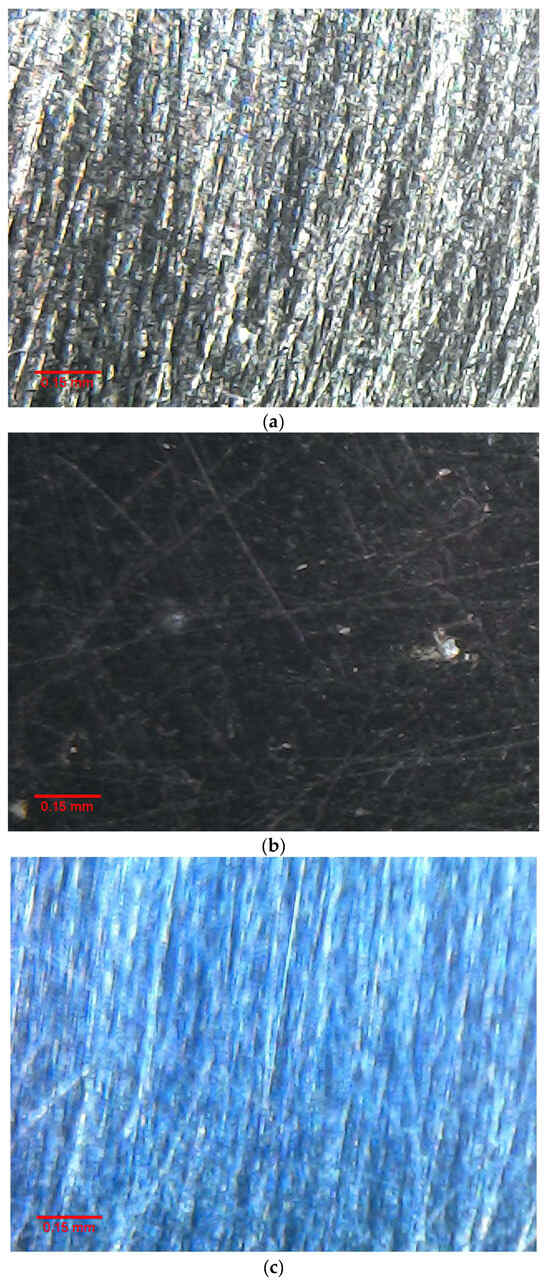
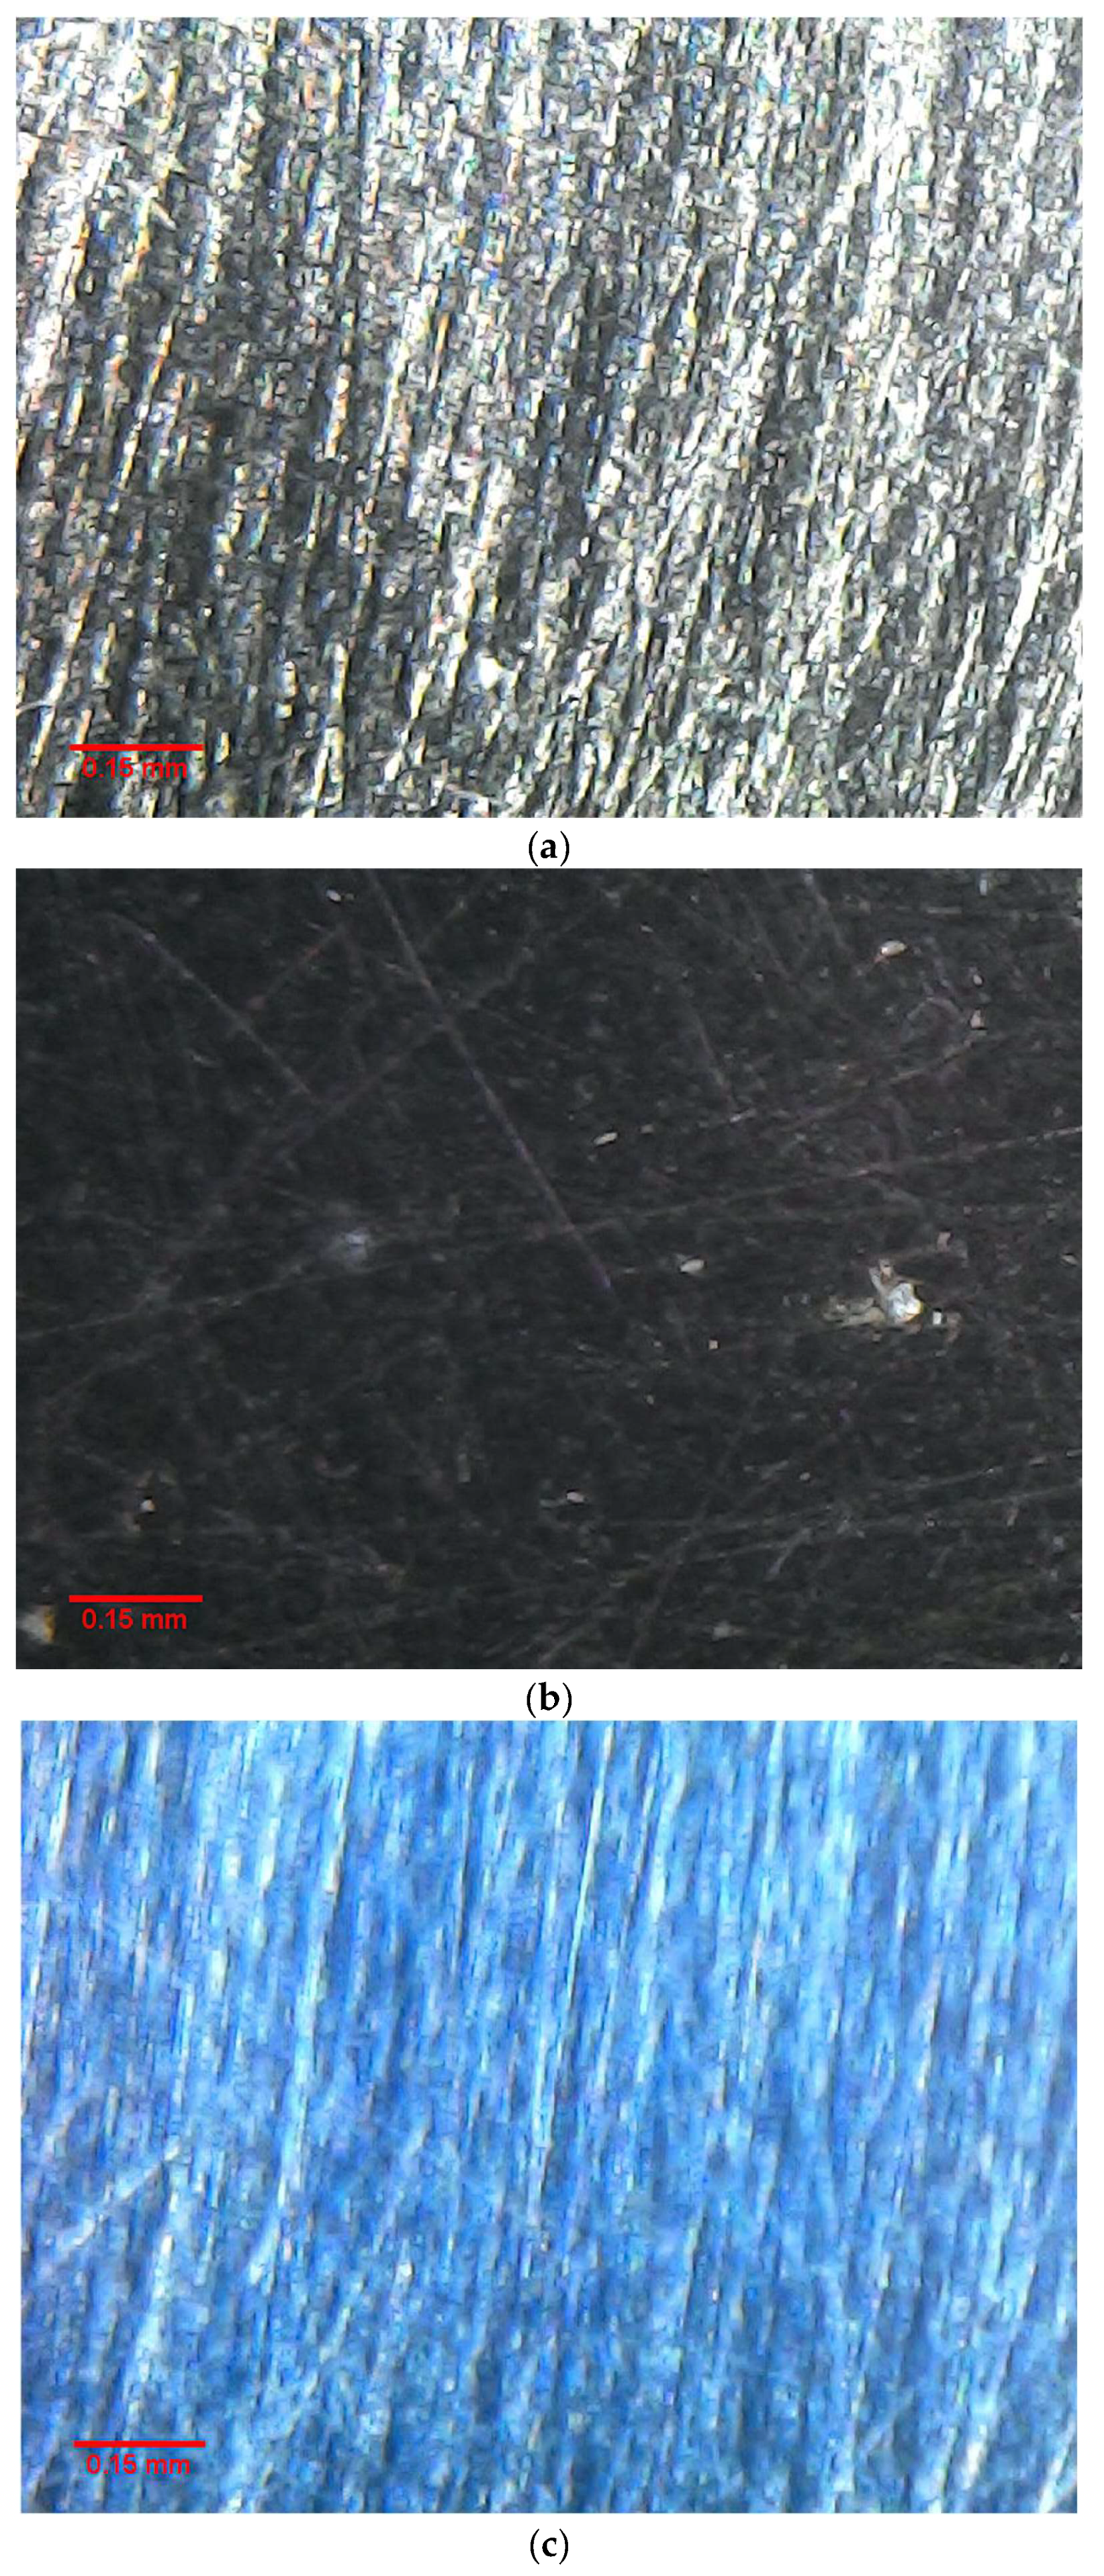
Figure 1a–c shows the surface properties of Ni-N thin films deposited on AISI 1016 carbon steel, as observed with a portable optical microscope using a 0.15 mm scale bar and 50× magnification. At r.f. 150 W, the film surface showed a mix of blue, black, and light gold hues in small growth zones. However, when the r.f. power increased to 175 W, the surface color transitioned to a brownish-gold tone. These color changes are consistent with the findings reported by [36] for TiN films deposited by magnetron sputtering. This behavior occurs because varying the N2 flow relative to the selected Ar flow allows stoichiometry control, and stoichiometry-dependent color changes are a typical and widely observed phenomenon in refractory metal nitrides due to composition-dependent shifts in the screened plasma frequency [37].
Figure 1.
Top-surface micrographs of Ni-N thin films deposited on AISI 1016 carbon steel by r.f. magnetron sputtering, captured at a 0.15 mm scale bar with 50× magnification: (a) r.f. 150 W; (b) r.f. 175 W; (c) r.f. 200 W.
Marulanda et al. [38] described that the color transition can be attributed to the interaction between N2 gas and the bombarding Ni atoms on the substrate surface. This interaction is directly influenced by the energy state of nitrogen species in the plasma: Richards et al. (2022) reported that N2 molecules and N atoms are highly vibrationally excited in r.f. plasma due to the lower reduced electric field and higher discharge power [37], which enhances their reactivity at the film surface and promotes nitrogen incorporation into the growing film, thereby modifying its stoichiometry and the resulting optical properties. When r.f. power is increased to 200 W, the surface color changes to dark blue, consistent with the higher nitrogen incorporation expected at elevated plasma energy. Klumdoung et al. [39] deposited ZrN thin films at high Ar flow rates by reactive DC magnetron sputtering and reported that at lower N2 flows (1.5 SCCM) the film color is brown, changing to dark blue when N2 flow is increased to 6.0 SCCM, supporting the role of nitrogen content in determining film color. Other authors attribute surface color changes in post-deposition thin films to variations in film thickness; for example, Selçuk [40] found a relationship between deposition time, film thickness, and color, showing that increased deposition time leads to significant color changes. Similarly, [41] attributed color changes in thin films to optical interference effects.
They explained that when a plane wave of light from a medium with a refractive index n1 strikes a thin film with a refractive index n2 and thickness d, the reflected light waves interfere with each other, resulting in a new wave pattern. The thickness values expressed in nm (see Table 3) reveal the relationship between film thickness and r.f. power on the target, consistent with the optical interference theory described above.
Table 3.
Thickness measurements of Ni-N thin films on Si wafers with (111) orientation, obtained using the stylus profilometer.
3.2. Thickness and Surface Roughness Analyses
3.2.1. Thickness of Ni-N Thin Films on Si Wafer
Table 3 presents the thickness and roughness values of Ni-N thin films deposited on Si wafers with a (111) orientation, measured by stylus profilometry. It can be observed that when the r.f. power increases from 150 to 175 W, the film thickness values are similar [42]. In contrast, when applying an r.f. power of 200 W on the Ni target, the thickness approximately doubles. It is well-known that film thickness increases with sputtering r.f. power, as the sputtering rate increases due to the greater number of atoms deposited onto the substrate [43]. It is also observed that surface roughness decreases when r.f. power increases to 200 W. Increasing the r.f. power generally reduces the average roughness of thin films, leading to improved surface morphology. However, higher deposition rates associated with increased r.f. power can also result in greater surface roughness under certain conditions [44,45]. It should be noted that the large standard deviations in thickness reported in Table 3 reflect the spatial variability inherent in step-height profilometry measurements, which include scans positioned within the mask-edge transition zone where local film thickness ramps to zero due to geometric shadowing during deposition. Measurements taken exclusively over the central plateau region of each sample yielded thickness values with coefficients of variation below 15%, confirming that the deposited films were laterally uniform across the central deposition area.
3.2.2. Surface Roughness of Ni-N Thin Films on AISI 1016
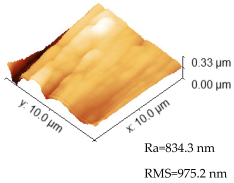
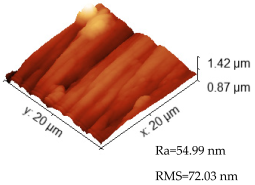
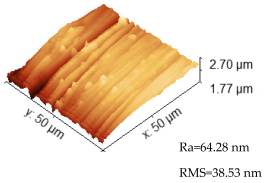
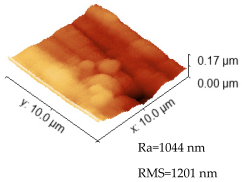
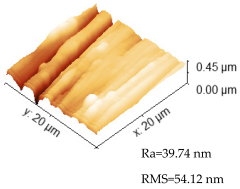
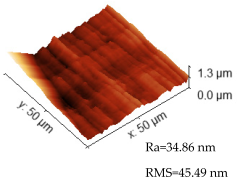
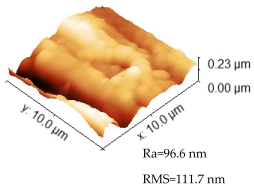
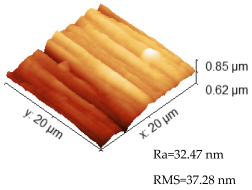
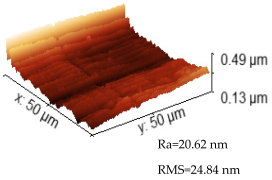
Table 4 presents the surface roughness analysis of Ni-N thin films deposited on AISI 1016 steel, obtained at different r.f. powers using AFM at scan scales of 10, 20, and 50 μm. The average roughness parameters, including root mean square (RMS) and average roughness (Ra) values, were observed to decrease with increasing r.f. power at the lower scales (10 and 20 μm). Specifically, at the 10 μm scale, the Ra values were 834.3, 1044, and 96.6 nm for r.f. powers of 150, 175, and 200 W, respectively. At the 20 μm scale, Ra values were 54.99, 39.74, and 32.47 nm, and at the 50 μm scale, values of 64.28, 34.86, and 20.62 nm were obtained for 150, 175, and 200 W, respectively. RMS values exhibited a similar trend across all scales. These results indicate that films deposited at higher r.f. powers have smoother surfaces and improved surface quality [46], where the decrease in surface roughness with increasing RF power can be attributed to enhanced adatom mobility and improved film densification during deposition, leading to smoother and more homogeneous surfaces.
Table 4.
Surface roughness measurements of Ni-N thin films on AISI 1016 steel, analyzed by AFM.
This behavior is attributed to the higher kinetic energy of sputtering particles at increased r.f. power, which promotes more uniform grain orientation and reduces grain size variability, ultimately leading to smoother film surfaces. This inverse relationship between surface roughness and r.f. power has been reported by several authors [47]. Similarly, both r.f. power and film thickness have been shown to influence the surface roughness [48].
3.2.3. Structural Analysis of Ni–N Thin Films by XRD
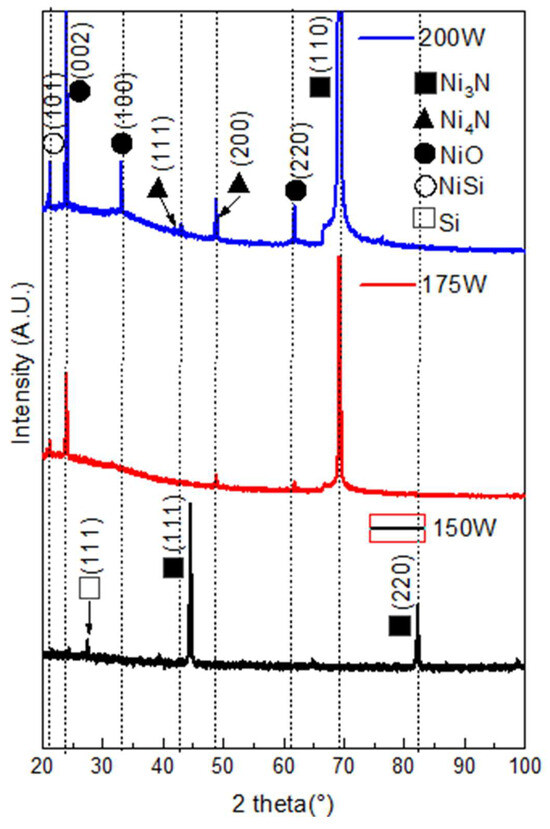
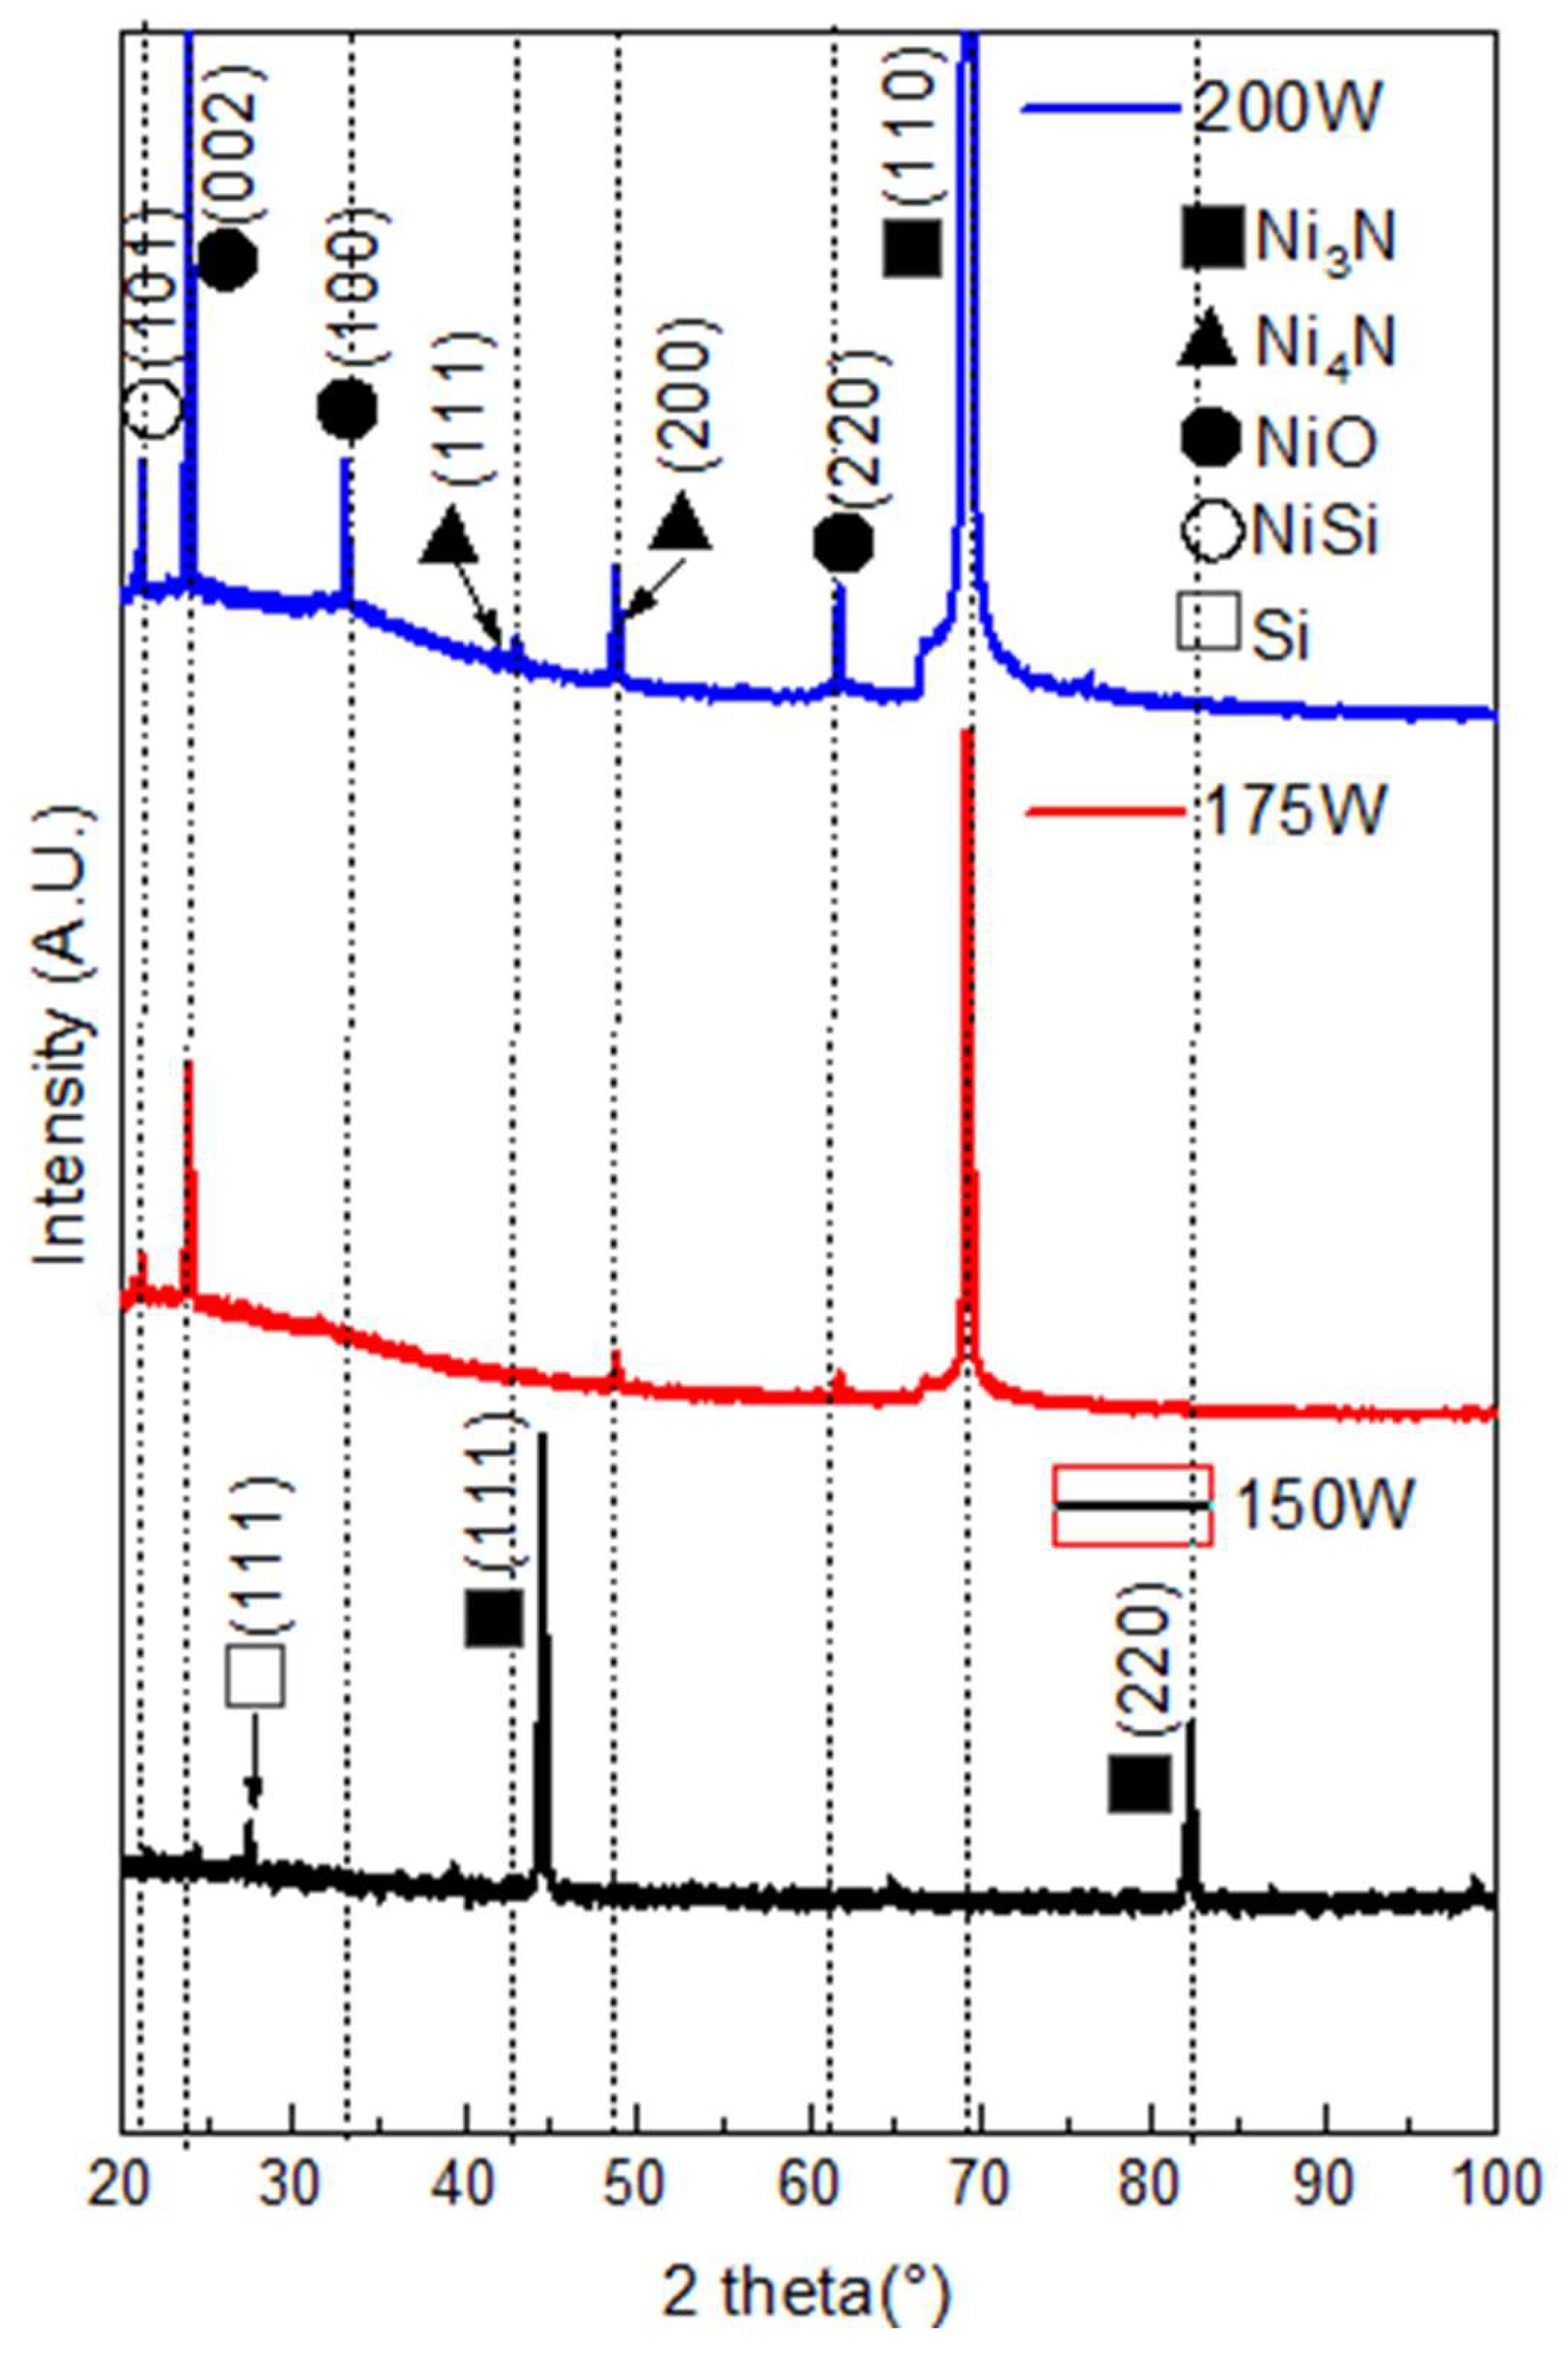
Figure 2 presents the XRD diffractograms of Ni-N thin films deposited on Si wafers at r.f. powers of 150, 175, and 200 W, collected over a 2θ range of 20–100°. Phase identification was performed by comparing the experimental peak positions with reference data from the ICDD Powder Diffraction File (PDF). Crystallite sizes were estimated using the Scherrer equation, D = Kλ/(β cosθ), where K = 0.9 is the shape factor, λ = 0.15406 nm is the Cu Kα wavelength, and β is the full width at half maximum (FWHM) in radians.
Figure 2.
XRD diffractograms of Ni-N thin films deposited on Si wafer (111) at r.f. powers of 150, 175, and 200 W. Phase identification symbols: ■ Ni3N, ▲ Ni4N, ● NiO, ○ NiSi, □ Si substrate.
For the film deposited at r.f.-150 W, the diffractogram revealed two diffraction peaks at 2θ ≈ 43.0° and 83.1°, indexed as the (111) and (220) planes of hexagonal Ni3N (PDF card No. 010-0280, space group P6322, a = 4.622 Å, c = 4.302 Å), with theoretical positions at 43.1° and 83.2°, respectively (Δ2θ < 0.1°). The Si substrate peak at 2θ ≈ 28.4° (JCPDS 27-1402) was also identified. The close agreement between the experimental and theoretical positions confirms a preferentially oriented Ni3N HCP phase. The average crystallite size estimated from the (111) and (220) reflections was approximately 20 nm and 18 nm, respectively, indicating a nanocrystalline microstructure.
At r.f.-175 W, the pattern showed a significantly more intense Si substrate peak, along with the emergence of additional phases. Alongside the Ni3N (111) reflection at 2θ ≈ 43.0° (PDF 010-0280), a peak consistent with the (111) plane of Ni4N face-centered cubic phase was detected at 2θ ≈ 41.7° (PDF card No. 036-1300, space group Pm m, a = 3.798 Å; theoretical position 41.5°, Δ2θ = +0.2°), with an estimated crystallite size of approximately 25 nm. This dual-phase coexistence of Ni3N HCP and Ni4N FCC indicates that the increase in r.f. power promotes partial nitrogen redistribution and the nucleation of the thermodynamically more stable FCC phase, consistent with published reactive sputtering phase diagrams for the Ni-N system [26,27].
At r.f.-200 W, the diffractogram exhibited the richest phase composition. The Ni3N HCP phase (PDF 010-0280) was identified through peaks at 2θ ≈ 23.6° and 69.8°, indexed as the (002) and (110) planes, in agreement with theoretical positions of 23.5° and 70.1° (Δ2θ ≤ 0.3°), yielding crystallite sizes of approximately 14 nm and 13 nm, respectively. The Ni4N FCC phase (PDF 036-1300) was identified through peaks at 2θ ≈ 41.6°, 48.5°, and 71.0°, indexed as the (111), (200), and (220) planes, matching theoretical positions of 41.5°, 48.3°, and 70.8° (Δ2θ ≤ 0.2°), with crystallite sizes ranging from approximately 20 to 26 nm. NiO peaks (PDF 047-1049, space group Fm m, a = 4.177 Å) were observed at 2θ ≈ 37.2° and 43.3°, indexed as (111) and (200), consistent with theoretical values of 37.1° and 43.4° (Δ2θ ≤ 0.1°), with crystallite sizes of approximately 10 and 9 nm. Additionally, a peak at 2θ ≈ 23.5° was attributed to the (101) plane of orthorhombic NiSi (PDF 019-0838, space group Pnma), with an estimated crystallite size of approximately 10 nm, arising from interfacial reaction between the film and the Si substrate. The increased ion bombardment energy at 200 W promotes partial transformation of the Ni3N HCP phase toward the more thermodynamically stable Ni4N FCC phase, as reflected by the relative reduction in Ni3N crystallite size compared to lower r.f. powers.
The structural evolution observed—from a predominantly Ni3N HCP phase at 150 W toward a multi-phase system including Ni4N FCC, NiO, and NiSi at higher r.f. powers—directly supports the mechanical and electrochemical behavior reported in Section 3.3 and Section 3.4. Specifically, the presence of the HCP phase at 150 W is linked to the pop-in events observed during nanoindentation, as the restricted slip systems of HCP structures promote dislocation burst nucleation under localized loading [49,50].
3.3. Nanohardness of Ni-N Thin Films
Table 5 shows the performance of Ni-N thin films evaluated by nanoindentation at varying force loads of 5, 10, and 20 mN. It was observed that hardness values are relatively consistent across loading forces. On average, the hardness of the r.f.-150 W film was 11.80 ± 3.34 GPa. When r.f.-power was increased to 175 W, the hardness exhibited a slight increase to 14.18 ± 1.20 GPa. The hardness then decreased to 12.19 ± 0.58 GPa when the r.f. power was further increased to 200 W. The reduced modulus of elasticity (Er) shows that the film deposited at r.f.-150 W (143.26 ± 26.48 GPa) exhibited the lowest reduced elastic modulus among the three conditions, followed by r.f.-200 W and r.f.-175 W, which displayed progressively higher moduli. It should be noted that the differences among the three Er values were not statistically significant given the associated standard deviations, and a clear monotonic trend as a function of r.f. power could not be conclusively established. The literature mentions that when increasing r.f. power, the content of the amorphous phase rises and crystal grains are refined, promoting a tendency for nanohardness and the elastic modulus of coatings to first increase and then decrease [35]. In the present case, the calculated elastic modulus values were similar across conditions and did not follow this trend clearly, so direct correspondence with the reported trend was not observed under the present deposition conditions. The contact depth values showed a generally positive tendency, except for r.f.-150 W under a loading force of 10 mN. This anomaly is likely related to surface film defects promoted by the sputtering process, such as pinholes arising from stress in the Ni-N film. Depending on the working gas pressure, this stress can be either compressive or tensile [51].
Table 5.
Nanohardness behavior of the Ni-N thin films tested by nano-indentation.
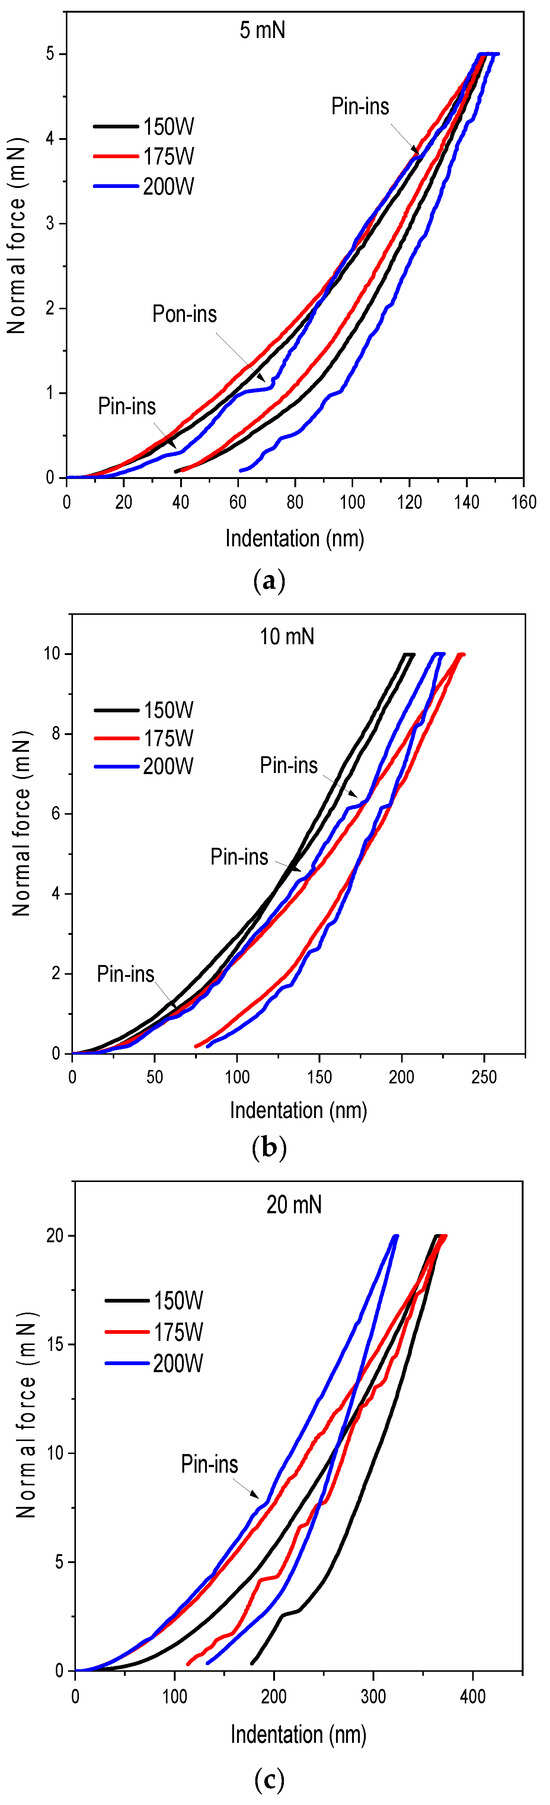
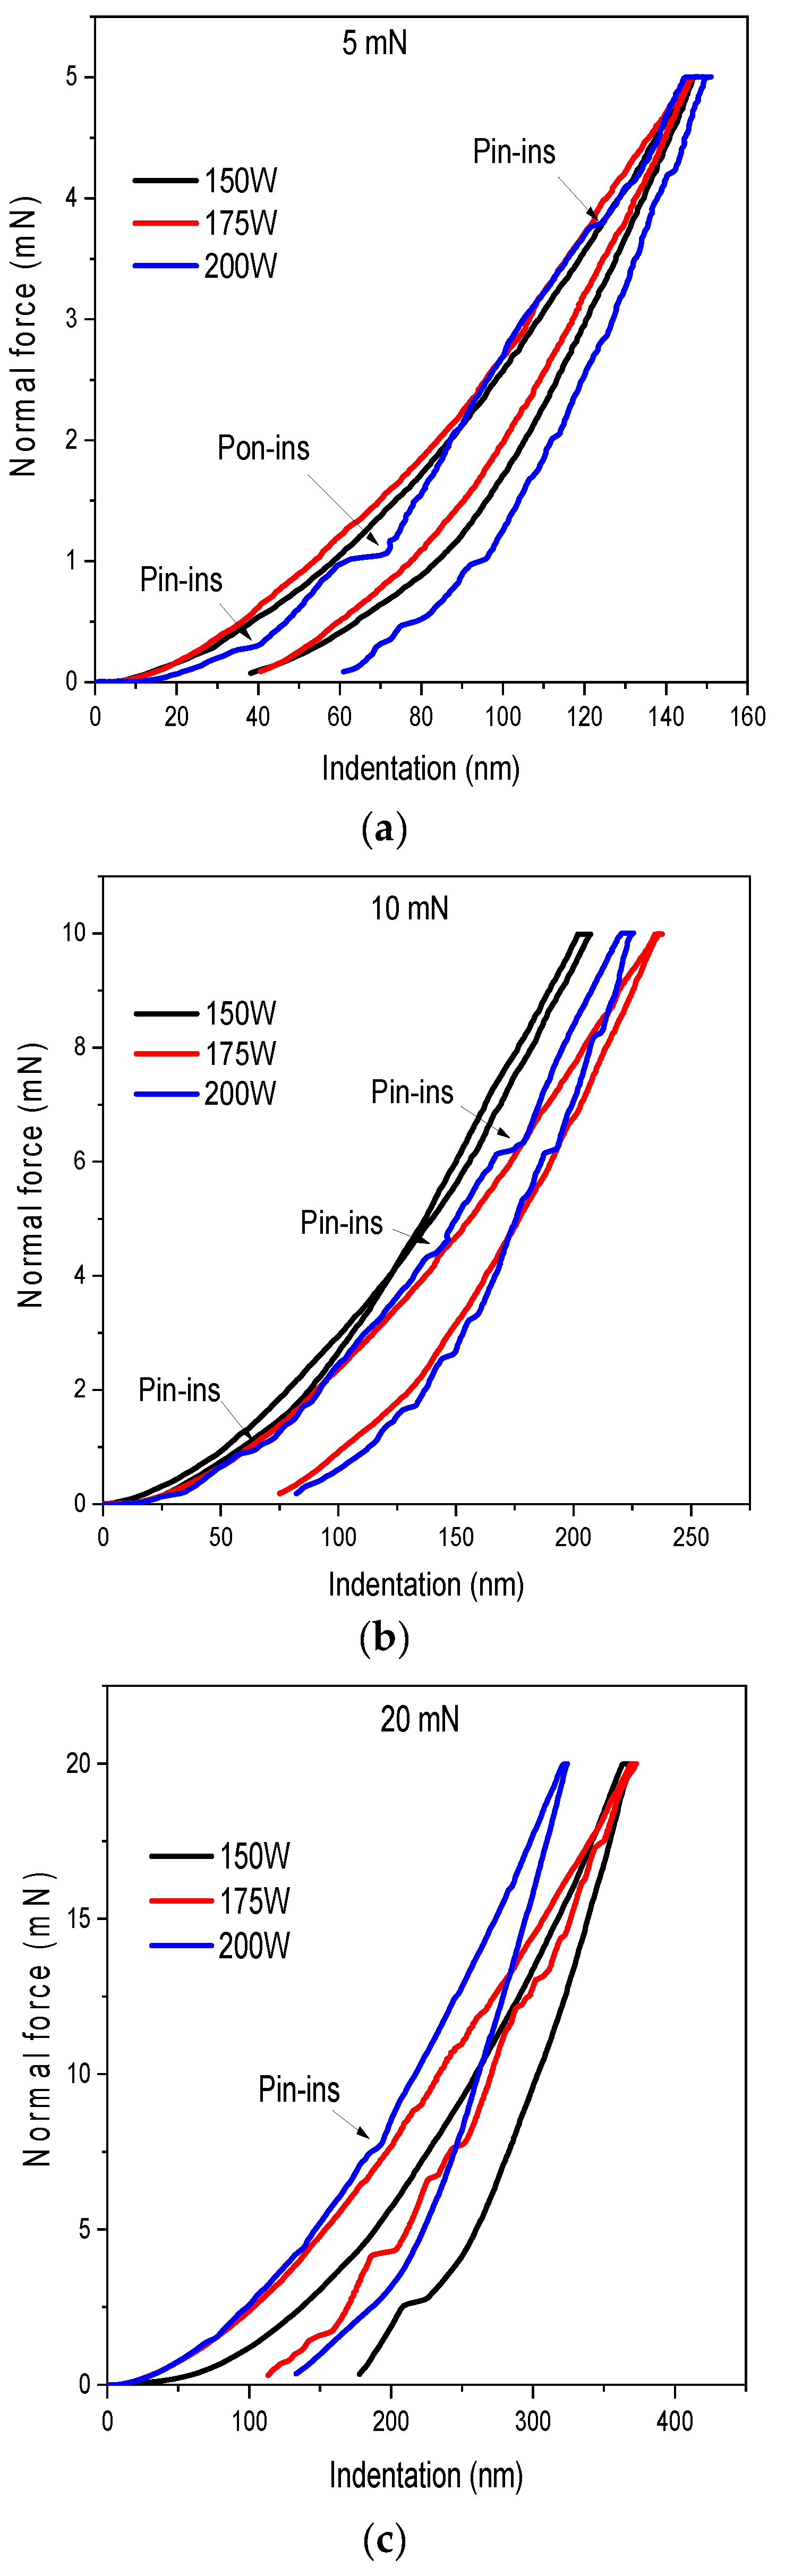
Figure 3a–c presents the typical load–displacement curves for Ni-N thin films under varying indentation loads of 5, 10, and 20 mN, obtained at loading/unloading rates of 10/10, 20/20, and 40/40 mN/min, respectively. At a load of 20 mN, irregularities in plastic deformation were observed along the load–displacement curve, characterized by multiple discontinuities at specific penetration depths (indicated by red arrows), commonly referred to as “pop-ins” [52]. Pop-ins are defined as sudden, abrupt increases in indenter displacement at nearly constant load, and are well-recognized indicators of discrete plastic deformation events in crystalline materials.
Figure 3.
Typical nanoindentation load versus penetration depth curves for Ni-N thin films on silicon wafer (111) at room temperature: (a) 5 mN (loading/unloading rate: 10/10 mN/min), (b) 10 mN (loading/unloading rate: 20/20 mN/min), and (c) 20 mN (loading/unloading rate: 40/40 mN/min). A holding period of 10 s was applied at maximum load in all cases.
In the present films, the occurrence of pop-ins was attributed to the hexagonal crystal structure (HCP) of the Ni3N phase identified by XRD at r.f.-150W. In HCP materials, dislocation glide is confined to specific slip systems along the basal and pyramidal planes, which leads to intermittent dislocation bursts when the resolved shear stress on those planes is overcome, resulting in the observed step-like displacement increments [53]. Furthermore, as the applied load increased from 10 to 20 mN, multiple pop-ins were observed, which have been associated in the literature with deformation twinning in addition to dislocation nucleation [54]. The absence of pronounced pop-ins at 5 mN (Figure 3a) is consistent with purely elastic or incipient elastic–plastic deformation at lower penetration depths. These observations are consistent with prior reports on HCP nitride thin films deposited by r.f. magnetron sputtering and support the microstructural interpretation provided by the XRD analysis detailed in Section 3.2 [55,56,57].
The relationship between applied load (P) and indentation depth (h) for Ni-N films under a maximum load of 20 mN revealed typical elastic–plastic behavior. The load–depth (P–h) curves exhibited perturbations and irregularities, including discontinuities associated with pop-in events. These irregularities suggest the presence of dislocation burst nucleation, deformation twinning, and cracking. Previous studies [56,57] have attributed these irregularities in load–displacement curves to oscillations indicative of undulatory elastic–plastic deformation of the material under localized shear stress.
3.4. Electrochemical Behavior
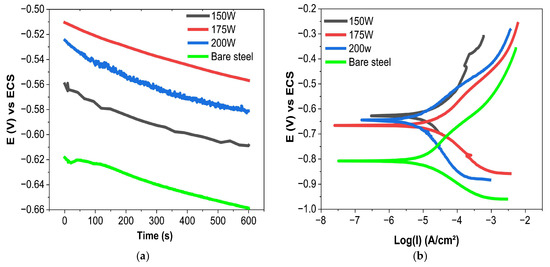
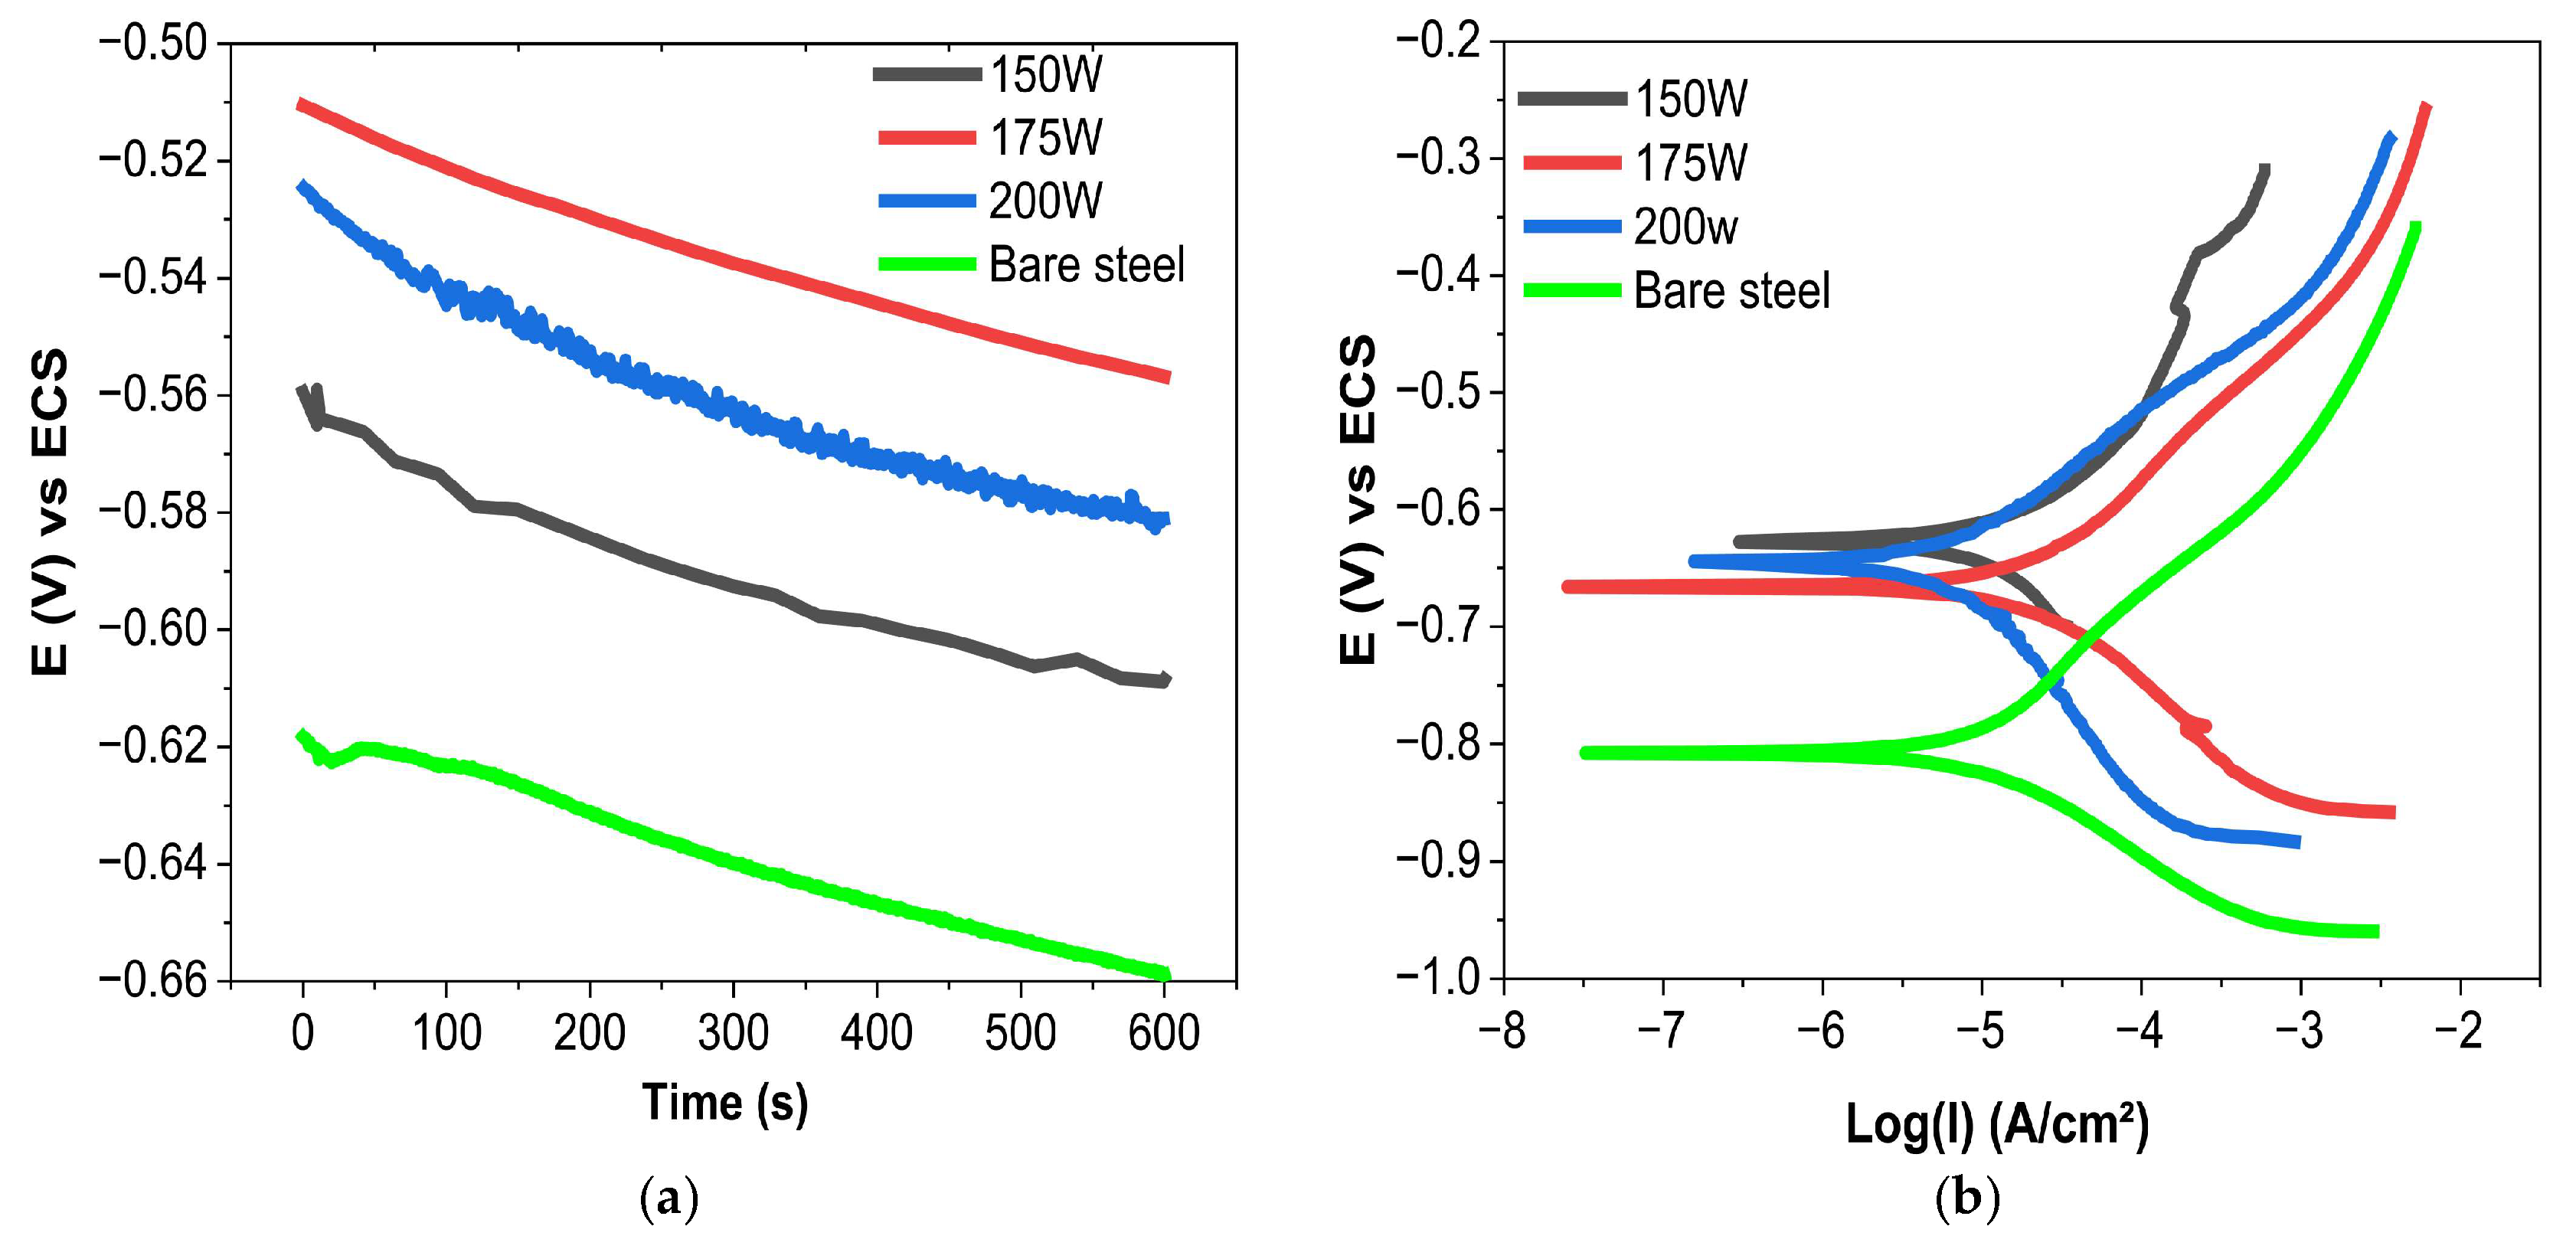
Figure 4a,b illustrates the electrochemical behavior of Ni-N thin films deposited at r.f. powers of 150, 175, and 200 W by r.f. magnetron sputtering, evaluated using open circuit potential (OCP) measurements and Tafel polarization curves. In Figure 4a, the OCP results highlight equilibrium conditions and variations in passive potential influenced by homogeneous reactions. The observed stabilization of Ecorr values for all samples in NaCl solution is consistent with the findings reported by Brotzu et al. [58], which attribute this behavior to a stabilizing layer that regulates the CR, driven primarily by the diffusion of chemical species. Increasing the r.f. power appears to induce higher polarization levels, potentially linked to chloride ion interaction at the film surface [52]. These results suggest that corrosion potential stabilization reflects the formation of a surface layer that modulates the CR, though this does not necessarily translate into net kinetic protection.
Figure 4.
Electrochemical behavior of Ni-N thin films: (a) open circuit potential (OCP) and (b) Tafel polarization curves, evaluated in a 3.5 wt.% NaCl solution.
The Tafel analysis (Figure 4b) and the corrosion parameters extracted from the polarization curves (Table 6) provide a quantitative assessment of the corrosion behavior of each sample. The corrosion current density (Icorr) values offer a direct measure of the instantaneous CR at the corrosion potential. The films deposited at 150 W and 175 W exhibited Icorr values of 2.51 × 10⁻⁵ and 2.23 × 10⁻⁵ A·cm−2, respectively, which were higher than that of bare AISI 1016 steel (1.58 × 10⁻⁵ A·cm−2). Consequently, the corresponding CR of 0.2920 and 0.2595 mm/year for 150 W and 175 W, respectively, exceeded that of bare steel (0.1838 mm/y). This indicates that films deposited at these conditions do not provide net kinetic corrosion protection compared to bare steel. The elevated Icorr at 150 W and 175 W was attributed to their higher surface roughness, which increases the electrochemically active surface area and promotes more active corrosion sites, offsetting the barrier effect of the coating. Nevertheless, these films exhibited a more noble Ecorr than bare steel (−605 mV and −668 mV vs. −780 mV for bare steel), indicating a reduction in the thermodynamic driving force for corrosion initiation.
Table 6.
Electrochemical parameters obtained from the Tafel polarization analysis.
In contrast, the film deposited at r.f.-200 W achieved an Icorr of 7.94 × 10⁻⁶ A·cm−2, approximately 50% lower than bare steel and nearly three times lower than the 150 W and 175 W samples, with a corresponding CR of 0.0924 mm/y. This significant reduction can be attributed to the denser film microstructure and smoother surface morphology at 200 W (Ra = 20.62 nm at 50 μm scale), which reduces the density of active corrosion sites and limit chloride ion penetration to the substrate. These findings align with prior studies suggesting that higher nickel content and smoother surfaces in Ni-N films enhance corrosion resistance in saline environments [53].
Overall, the results demonstrate that r.f. power is a critical parameter governing the corrosion performance of Ni-N thin films. While all coated samples exhibited a more noble Ecorr than bare steel, only the film deposited at r.f.-200 W provided superior kinetic corrosion protection, representing the optimal deposition condition for corrosion-resistant applications on carbon steel substrates. These findings highlight that deposition power must be carefully optimized: films deposited at 150 and 175 W exhibited higher CR than bare steel, whereas only the 200 W condition yielded a coating with superior corrosion protection. Optimization of deposition parameters is therefore essential before recommending Ni-N films for industrial corrosion-protective applications [34].
Table 6 presents the corrosion parameters extracted from the Tafel polarization curves for bare AISI 1016 steel and the Ni-N thin film-coated samples. Bare steel exhibited a significantly more negative corrosion potential (Ecorr = −780 mV) compared to the Ni-N coated samples, which ranged from −605 mV to −645 mV. This indicates that all Ni-N coatings shift the corrosion potential in the noble direction, reducing the thermodynamic driving force for corrosion initiation. However, as discussed in Section 3.4, a more noble Ecorr does not necessarily correlate with lower corrosion current density (Icorr) or CR. The films deposited at 150 W and 175 W exhibited higher Icorr values than bare steel, attributed to their greater surface roughness increasing the active electrochemical area. Only the film deposited at r.f.-200 W achieved both a noble Ecorr and a reduced Icorr, confirming it as the condition offering the most effective corrosion protection.
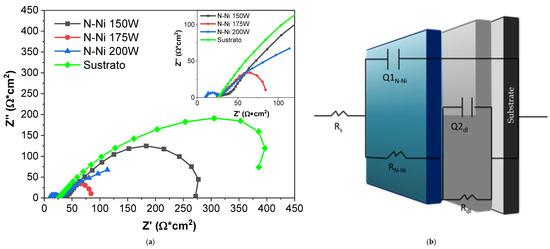
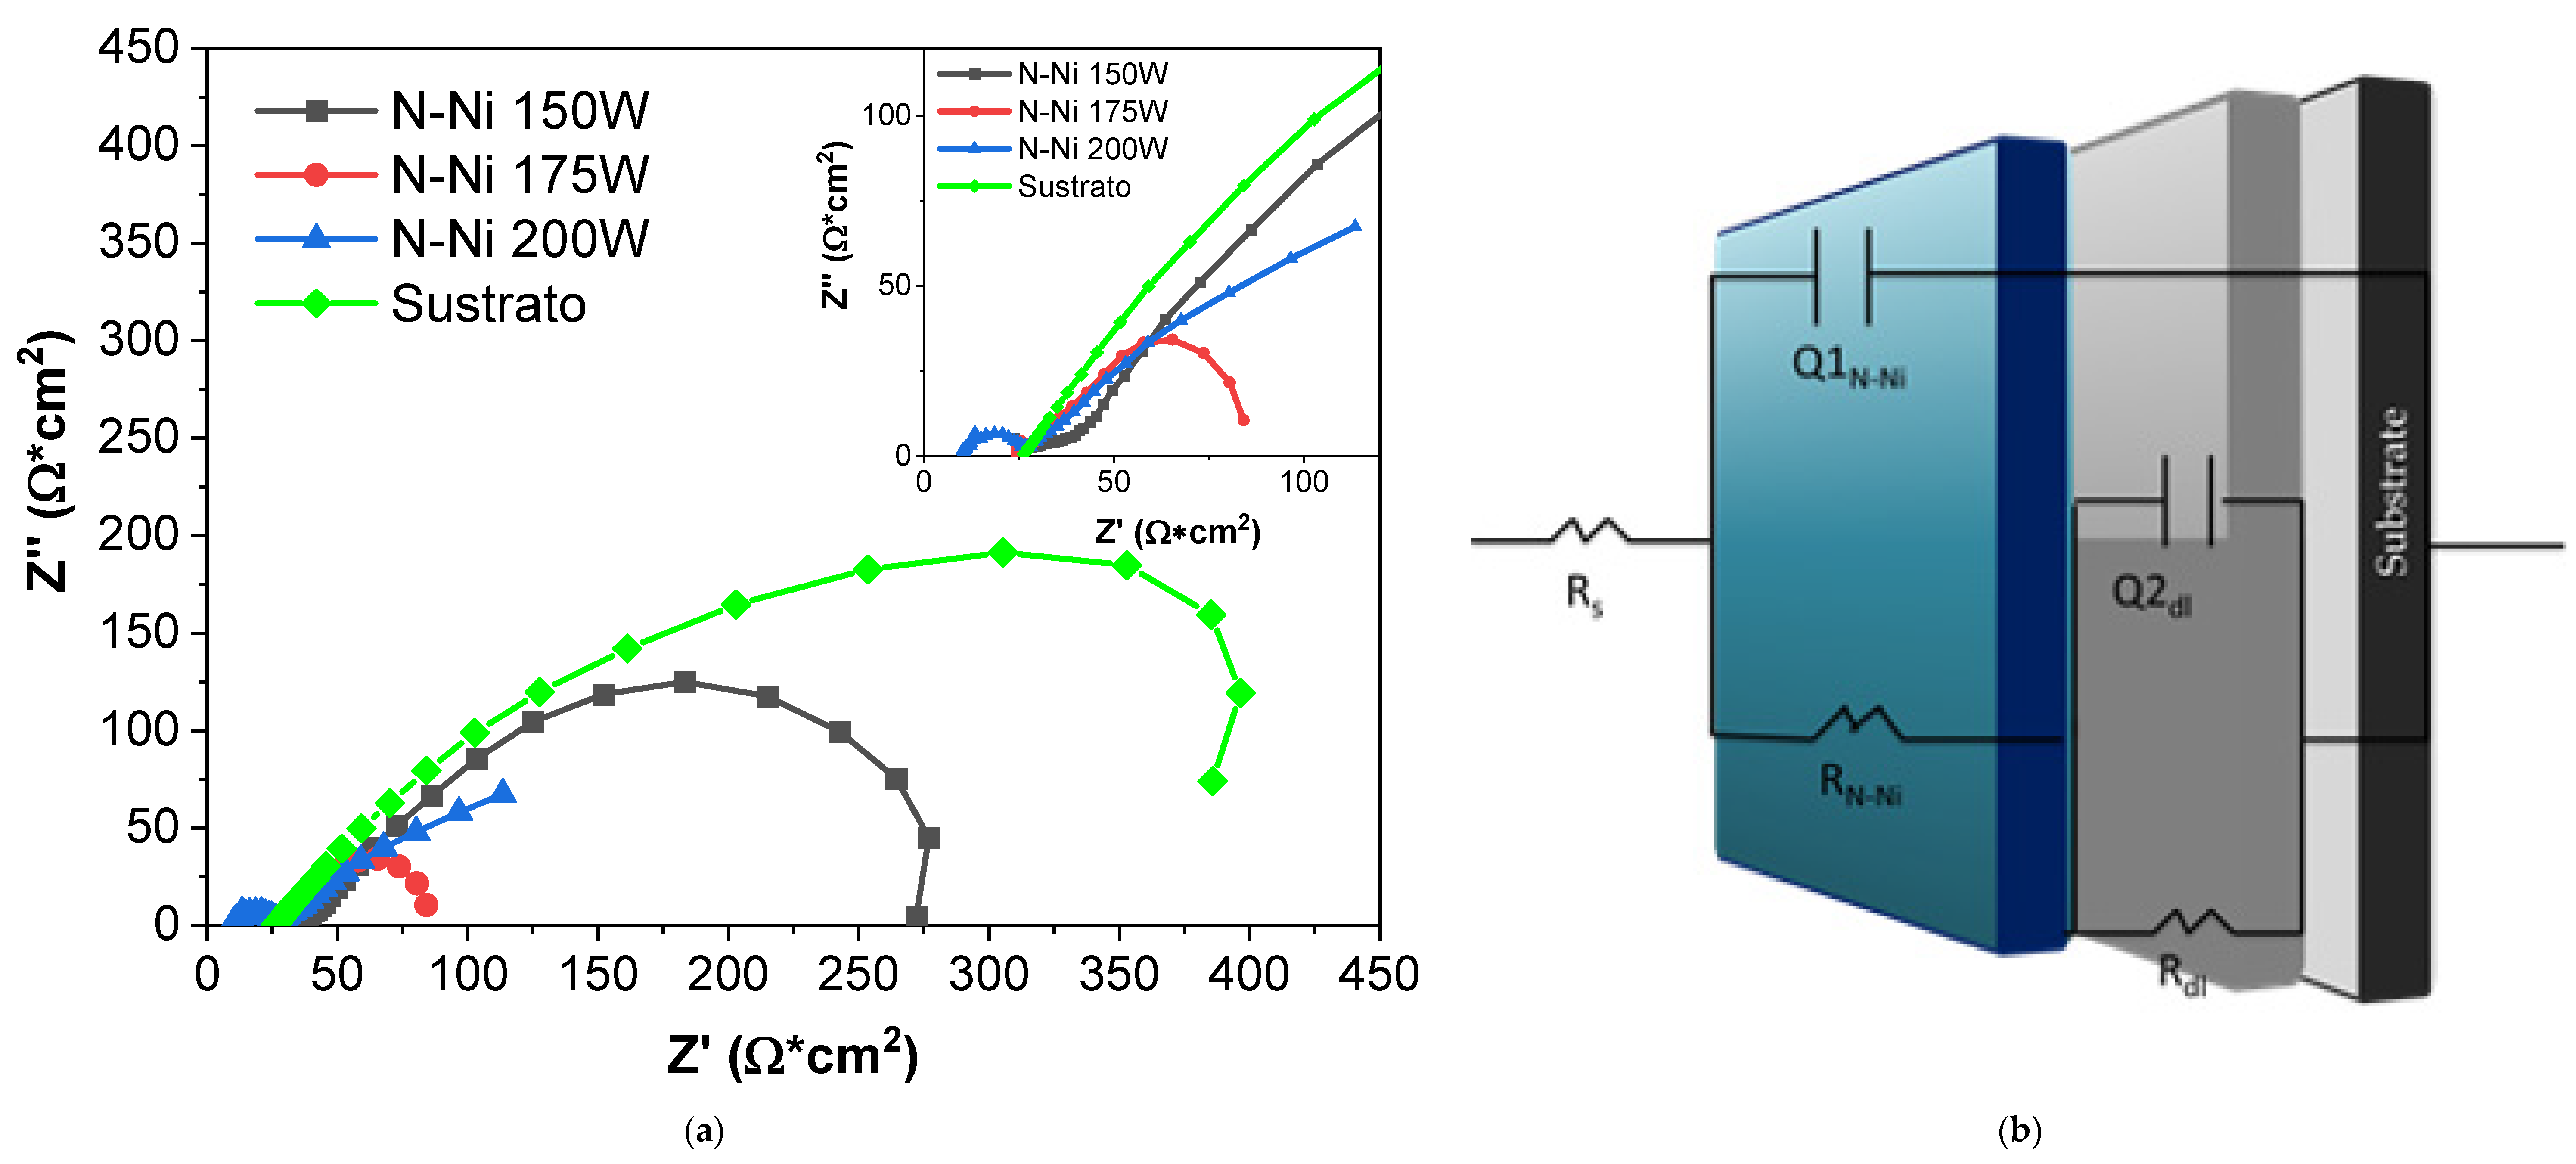
Figure 5a,b illustrates the EIS behavior of the Ni-N thin film system. The Nyquist diagram (Figure 5a) and the corresponding equivalent circuit (Figure 5b) revealed two distinct time constants, indicating the presence of two separate electrochemical processes at the electrode–electrolyte interface. The first time constant, observed at higher frequencies, is associated with the response of the Ni-N thin film, related to charge transfer resistance and double-layer capacitance at the film surface [59]. The second time constant, observed at lower frequencies, is linked to the diffusion of electroactive species through the film. This diffusional behavior is influenced by film porosity, microstructure, and interaction with the electrolyte [60].
Figure 5.
EIS results: (a) Nyquist plot and (b) equivalent circuit used, evaluated in a 3.5 wt.% NaCl solution.
It should be noted that the Nyquist plot for the bare AISI 1016 steel reference sample exhibited a low-frequency inductive loop, a well-documented feature of actively corroding carbon steel in chloride media, attributed to the relaxation of adsorbed corrosion intermediates (FeCl+ads, Fe(OH)ads) at the steel surface [59,60]. To accurately model this behavior, an inductive–resistive branch (L–RL) should be incorporated into the low-frequency region of the equivalent circuit. In the present work, the simplified circuit in Figure 5b was applied uniformly to all samples for consistent comparative analysis of the film-related impedance parameters. Accordingly, the charge transfer resistance (Rct) and solution resistance (Rs) values extracted for bare steel represent an approximation and should not be directly compared with those of the coated samples on a quantitative basis. Notably, the inductive feature was absent in all three Ni-N coated samples, confirming that the deposited films suppress the active dissolution mechanism responsible for this behavior.
Fitting the equivalent circuit (Figure 5b) yields quantitative electrochemical parameters such as Rct and Rs, which assess the performance of the Ni-N thin films in preventing corrosion [61]. Additionally, the presence of a Warburg diffusion element highlights the film’s barrier capability, which helps delay the corrosion process and is crucial for applications in aggressive environments [62]. The quality of the equivalent circuit fitting was evaluated using the chi-squared (χ2) criterion; values below 10−3 were obtained for all coated samples, confirming adequate fit quality. Each circuit element has a clear physical meaning: Rs represents the electrolyte resistance, RNi-N models the charge-transfer resistance at the film–electrolyte interface, and Rdl accounts for the resistance of the electrical double layer at the substrate surface. The constant phase elements (QNi-N and Qdl) account for the non-ideal capacitive behavior arising from surface heterogeneity and film roughness, with exponents n close to 1 indicating near-ideal capacitive behavior.
It is well-known that surface roughness directly affects the corrosion properties of Ni-N thin films. Smoother surfaces generally expose less area to corrosive agents, potentially improving corrosion resistance [63]. This is because lower surface roughness reduces nucleation sites for corrosion and minimizes corrosive penetration into the film microstructure [64]. The reduction in Ra and RMS values with increasing r.f. power, as shown by the AFM analysis, indicates that Ni-N thin films deposited at higher r.f. power levels have smoother surfaces. This observation correlates with improved corrosion resistance, as smoother surfaces present fewer imperfections and defects that could initiate corrosion.
Overall, lower surface roughness (achieved at higher r.f. powers) generally correlates with higher double-layer resistance values (Rdl), as shown in Table 7. This increased double-layer resistance suggests enhanced corrosion protection, as smoother surfaces provide fewer sites for corrosion initiation. However, it is noteworthy that the Rdl value for r.f.-200 W was lower than for r.f. 150 W, despite its lower roughness. This may indicate that other factors, such as film homogeneity or deposition quality, also influence the impedance response. As roughness decreases, Rdl also tends to decrease, suggesting that smoother surfaces are associated with a less ideal double layer. This could be attributed to the presence of fewer but more impactful defects on smoother surfaces, which may exert a greater influence on double-layer uniformity [65]. It should be noted that the Rdl values extracted for bare steel from the equivalent circuit fitting are approximate, as discussed in Section 3.4, due to the presence of the inductive loop in the bare steel Nyquist response.
Table 7.
Fitting parameters obtained from the EIS analysis.
4. Conclusions
Ni-N thin films were successfully deposited on AISI 1016 carbon steel and silicon (111) wafers by reactive r.f. magnetron sputtering at 150, 175, and 200 W. Increasing the r.f. power produced systematic changes in film thickness (~25.0–50.7 nm), phase composition, surface morphology, and mechanical properties. XRD analysis revealed a monocrystalline Ni3N HCP structure at 150 W, transitioning to a dual-phase Ni3N/Ni4N microstructure at 175 and 200 W. Surface roughness decreased systematically with power (Ra from 64.28 to 20.62 nm), while the highest hardness (11.80 ± 3.34 GPa) was recorded at 150 W, accompanied by pop-in events indicative of dislocation nucleation in the HCP lattice.
Electrochemical evaluation in 3.5 wt.% NaCl revealed a critical dependence of corrosion performance on deposition power. Films deposited at 150 W and 175 W exhibited corrosion current densities and rates exceeding those of bare AISI 1016 steel, confirming that these conditions do not provide corrosion protection but accelerate the corrosion process due to their higher surface roughness. Only the film deposited at 200 W achieved effective corrosion protection, with Icorr and Vcorr approximately 50% lower than bare steel, attributed to its denser microstructure and smoother surface. EIS confirmed two-time constants reflecting film and interface responses, with increasing charge-transfer resistance at higher powers and suppression of the inductive loop present in bare steel.
These results demonstrate that r.f. power must be carefully optimized before recommending Ni-N films for corrosion-protective applications, with 200 W representing the optimal deposition condition on carbon steel substrates.
Author Contributions
A.G.-H.: Conceptualization, Methodology, Formal Analysis, Investigation. R.B.-R.: Data Curation, Writing—Original Draft, Writing—Review & Editing, Visualization. E.R.: Writing—Review & Editing. E.O.-B.: Validation, Resources, Supervision. M.F.-M.: Project Administration, Writing—Review & Editing. W.A.: Formal Analysis, Writing—Original Draft, Writing—Review & Editing. All authors have read and agreed to the published version of the manuscript.
Funding
The APC was funded by Universidad Autonomy de Tamaulipas.
Data Availability Statement
No data were used for the research described in the article.
Acknowledgments
González-Hernández acknowledges the support from the Universidad Autónoma de Tamaulipas. W. Aperador acknowledges the support from the Universidad Militar Nueva Granada.
Conflicts of Interest
The authors declare that they have no known competing financial interests or personal relationships that could have appeared to influence the work reported in this paper.
References
- Koch, G.H.; Brongers, M.P.; Thompson, N.G.; Virmani, Y.P.; Payer, J.H. Chapter 1—Cost of corrosion in the United States. In Handbook of Environmental Degradation of Materials; Kutz, M., Ed.; William Andrew Publishing: New York, NY, USA, 2005; pp. 3–24. [Google Scholar] [CrossRef] [Scilit]
- Harsimran, S.; Santogli, K.; Rakash, K. Overview of corrosion and its control: A Critical Review. Proc. Eng. Sci. 2021, 3, 13–24. [Google Scholar] [CrossRef] [Scilit]
- Majeed, M.N.; Yousif, Q.A.; Bedair, M.A. Study of the Corrosion of Nickel–Chromium Alloy in an Acidic Solution Protected by Nickel Nanoparticles. ACS Omega 2022, 7, 29850–29857. [Google Scholar] [CrossRef] [Scilit] [PubMed]
- Fadel, Z.; Yousif, Q.A. (2S,3R)-2-((1-(4-Amionophenyl)Ethylidene)Amino)-3-HydroxybutanoicAcid as a Novel and Eco-FriendlyCorrosionInhibitorfor the CarbonSteel (X56) Used inIraq’s Oil Installations. J. Phys. Conf. Ser. 2020, 1664, 012093. [Google Scholar] [CrossRef] [Scilit]
- Tiwari, A.; Goyal, S.; Luxami, V.; Chakraborty, M.K.; Gundlapalli, P. Evaluation of Inhibition Efficiency of Generic Compounds with Additional Heteroatomin Simulated Concrete Pore Solution and Migration Potentialin Concrete. J. Build. Eng. 2021, 43, 102490. [Google Scholar] [CrossRef] [Scilit]
- Hassan, A.; Heakal, B.; Younis, A.; Bedair, M.; El-Billy, Z.; Mohamed, M. Synthesis of Some Triazole Schiff Base Derivatives and Their Metal Complexes under Microwave Irradiation and Evaluation of Their Corrosion Inhibition and Biological Activity. Egypt. J. Chem. 2019, 62, 1603–1624. [Google Scholar] [CrossRef] [Scilit]
- Nugent, M.A.; Khan, Z.A. The effects of corrosion rate and manufacturing in the prevention of stress corrosion cracking on structural members of steel bridges. J. Corros. Sci. Eng. 2014, 7, 16. [Google Scholar]
- Gangan, A.; ElSabbagh, M.; Bedair, M.; El-Sabbah, M.; Fahmy, A. Plasma Power Impact on Electrochemical Performance of Low Carbon Steel Coated by Plasma Thin TEOS films. Al-AzharBull. Sci. 2020, 31, 51–58. [Google Scholar] [CrossRef] [Scilit]
- Elaryian, H.M.; Bedair, M.A.; Bedair, A.H.; Aboushahba, R.M.; Fouda, A.E.-A.S. Synthesis, Characterization of Novel Coumarin Dyes as Corrosion Inhibitors for Mild Steel in Acidic Environment: Experimental, Theoretical, and Biological Studies. J. Mol. Liq. 2022, 346, 118310. [Google Scholar] [CrossRef] [Scilit]
- Abbas, M.A.; Arafa, E.I.; Gad, E.S.; Bedair, M.A.; El-Azabawy, O.E.; Al-Shafey, H.I. Performance Assessment by Experimental and Theoretical Approaches of Newly Synthetized Benzyl Amide Derivatives as Corrosion Inhibitors for Carbon Steel in1.0 M Hydrochloric Acid Environment. Norg. Chem. Commun. 2022, 143, 1097. [Google Scholar] [CrossRef] [Scilit]
- Fahmy, A.; Sabbagh, M.E.; Bedair, M.; Gangan, A.; El-Sabbah, M.; El-Bahy, S.M.; Friedrich, J.F. One-Step Plasma Deposited Thin SiOxCy Films for Corrosion Resistance of Low Carbon Steel. J. Adhes. Sci. Technol. 2020, 35, 1734–1751. [Google Scholar] [CrossRef] [Scilit]
- Gangan, A.; ElSabbagh, M.; Bedair, M.A.; Ahmed, H.M.; El-Sabbah, M.; El-Bahy, S.M.; Fahmy, A. Influence of PH Values on the Electrochemical Performance of Low Carbon Steel Coated by Plasma Thin SiOxCy Films. Arab. J. Chem. 2021, 14, 1033. [Google Scholar] [CrossRef] [Scilit]
- Fenker, M.; Balzer, M.; Kappl, H. Corrosion protection with hard coatings on steel: Past approaches and current research efforts. Surf. Coat. Technol. 2014, 257, 182–205. [Google Scholar] [CrossRef] [Scilit]
- Fan, H.; Huang, J.; Chen, G.; Chen, W.; Zhang, R.; Chu, S.; Wang, X.; Li, C.; Ostrikov, K.K. Hollow Ni-V-Mo Chalcogenide Nanopetals as Bifunctional Electrocatalyst for Overall Water Splitting. ACS Sustain. Chem. Eng. 2019, 7, 1622–1632. [Google Scholar]
- Chu, S.; Chen, W.; Chen, G.; Huang, J.; Zhang, R.; Song, C.; Wang, X.; Li, C.; Ostrikov, K.K. Holey Ni-Cu Phosphide Nanosheets as a Highly Efficient and Stable Electrocatalyst for Hydrogen Evolution. Appl. Catal. B Environ. 2019, 243, 537–545. [Google Scholar] [CrossRef] [Scilit]
- Li, G.; Wu, X.; Guo, H.; Guo, Y.; Chen, H.; Wu, Y.; Zheng, J.; Li, X. Plasma transforming Ni(OH)2 Nanosheets into porous nickel nitride sheets of alkaline hydrogen evolution. ACS Appl. Mater. Interfaces 2020, 12, 5951–5957. [Google Scholar] [CrossRef] [Scilit] [PubMed]
- DongEung, K.; Shun-Li, S.; Zi-Kui, L. Effects of alloying elements on elastic properties of Ni by first-principles calculations. Comput. Mater. Sci. 2009, 47, 254–260. [Google Scholar] [CrossRef] [Scilit]
- Bhatti, J.; Chandio, A.D.; Quazi, M.M.; Bashir, M.N.; Rizwan, M.; Iftikhar, A.C.; Jamali, A.R.; Katper, F.H.; Ali, I. Mechanical and Morphological Characteristics of Nickel, Chromium and Nitride-Based Coatings Formed via Electrodeposition and Magnetron Sputtering Techniques on Mild Steel. An Overview. Chem. Eng. 2023, 10, 1466–8858. [Google Scholar] [CrossRef] [Scilit]
- Yin, M.; Liang, W.; Miao, Q.; Yu, H.; Jin, H.; Blackwood, D.J. Dependence of the M choice on the properties of Hf(M)SiCN (M = Nb, Ta, Ti, Zr) ceramic coatings: Ab-initio and experimental study. Tribol. Int. 2024, 196, 109675. [Google Scholar] [CrossRef] [Scilit]
- Peri, R.; Bhagavathiachari, M.; Balasubramanian, S.A. Detailed study on the electrochemical properties of transition metal-based carbide/nitride thin films in energy conversion and storage devices. Electrochim. Acta 2022, 427, 140860. [Google Scholar] [CrossRef] [Scilit]
- Li, D.; Chen, J.; Etim, I.P.; Liu, Y.; Wu, C.; Wang, J.; Su, X. High temperature oxidation behavior of Ni-based superalloy Nimonic95 and the effect of pre oxidation treatment. Vacuum 2021, 194, 110582. [Google Scholar] [CrossRef] [Scilit]
- Taylor, S.R. Coatings for Corrosion Protection: Metallic. In Encyclopedia of Materials: Science and Technology; Buschow, J.K.H., Cahn, R.W., Flemings, M.C., Ilschner, B., Kramer, E.J., Mahajan, S., Veyssière, P., Eds.; Elsevier: Amsterdam, The Netherlands, 2001; pp. 1–5. [Google Scholar] [CrossRef] [Scilit]
- Zhou, T.; Chen, H.; Yue, Y.-N.; Fang, X.-Y.; Zhang, R.-Q.; Gao, X.; Cai, Z.-B. Effect of coating thickness on interfacial adhesion and mechanical properties of Cr-coated zircaloy. Trans. Nonferrous Met. Soc. China 2023, 33, 2672–2686. [Google Scholar] [CrossRef] [Scilit]
- Keraudy, J.; Athouël, L.; Hamon, J.; Girault, B.; Gloaguen, D.; Richard-Plouet, M.; Jouan, P.-Y. Electrochemical Characteristics of NixN thin films deposited by DC and HiPIMS reactive magnetron sputtering. Thin Solid Films 2019, 669, 659–664. [Google Scholar] [CrossRef] [Scilit]
- Gong, X.; Li, Z.; Pattamatta, A.S.L.S.; Wen, T.; Srolovitz, D.J. An accurate and transferable machine learning interatomic potential for nickel. Commun. Mater. 2024, 5, 157. [Google Scholar] [CrossRef] [Scilit]
- Nishihara, H.A.F.N.; Suzuki, K.; Umetsu, R.Y.; Kanomata, T.; Kaneko, T.; Zhou, M.Y.; Tsujikawa, M.; Shirai, M.; Sakon, T.; Wada, T.; et al. Magnetic properties of Ni2N. Phys. B 2014, 449, 85–89. [Google Scholar] [CrossRef] [Scilit]
- Dorman, G.J.W.R.; Sikkens, M. Structure of reactively sputtered nickel nitride films. Thin Solid Films 1983, 105, 251–258. [Google Scholar] [CrossRef] [Scilit]
- Sahu, B.P.; Ray, M.; Mitra, R. Structure, and properties of Ni1−xTixN thin films processed by reactive magnetron co-sputtering. Mater. Charact. 2020, 169, 110604. [Google Scholar] [CrossRef] [Scilit]
- Grayeli, A.; Rezaee, S.; Țălu, Ș. Influence of RF Power on Structural and Corrosion Properties of Sputter-Deposited CrN Films. Microsc. Res. Tech. 2025, 89, 120–133. [Google Scholar] [CrossRef] [Scilit] [PubMed]
- Sousa, V.F.C.; Silva, F.J.G.; Fecheira, J.S.; Pinto, G.; Baptista, A. Wettability and corrosion resistance of zirconium nitride films obtained via reactive high-power impulse magnetron sputtering. J. Vac. Sci. Technol. A 2023, 41, 023106. [Google Scholar] [CrossRef] [Scilit]
- Peng, C.; Wang, H.; Song, Y.; Ma, J.; Liu, Y. Exploration of the Corrosion Behavior of Electroless Plated Ni-P Amorphous Alloys via X-ray Photoelectron Spectroscopy. Coatings 2023, 13, 31. [Google Scholar] [CrossRef] [Scilit]
- Aljibori, H.; Alamiery, A.; Kadhum, A. Influence of Stoichiometry on Wettability and Electrochemical Properties of ZrN Coatings Deposited on AS4340 Steel via Reactive Magnetron Sputtering. J. Mater. Eng. Perform. 2025, 35, 13670–13685. [Google Scholar] [CrossRef] [Scilit]
- Pathak, D.; Singh, R.P.; Gaur, S.; Balu, V. Influence of groove angle on hardness and reinforcement height of shielded metal arc welded joints for low carbon AISI 1016 steel plates. Mater. Today Proc. 2021, 38, 40–43. [Google Scholar] [CrossRef] [Scilit]
- Pandey, N.; Gupta, M.; Stahn, J. Structure, Thermal Stability, and Magnetism of Ni4N Thin Films. Phys. Status Solidi RRL 2020, 14, 2000294. [Google Scholar] [CrossRef] [Scilit]
- Mao, Z.; Kim, Y.C.; Lee, H.D.; Adusumilli, P.; Seidman, D.N. NiSi crystal structure, site preference, and partitioning behavior of palladium in NiSi(Pd)/Si(100) thin films: Experiments and calculations. Appl. Phys. Lett. 2011, 99, 013106. [Google Scholar]
- Nieborek, M.; Jastrzębski, C.; Płociński, T.; Wróbel, P.; Seweryn, A.; Judek, J. Optimization of the plasmonic properties of titanium nitride films sputtered at room temperature through microstructure and thickness control. Sci. Rep. 2024, 14, 5762. [Google Scholar] [CrossRef] [Scilit] [PubMed]
- Richards, C.; Jans, E.; Gulko, I.; Orr, K.; Adamovich, I. N2 vibrational excitation in atmospheric pressure Ns pulse and RF plasma jets. Plasma Sci. Technol. 2022, 31, 034001. [Google Scholar] [CrossRef] [Scilit]
- Marulanda, D.M.; Cuellar, J.; Rojas, C.; Acosta, L.M. Microstructure and mechanical properties of cold drawn AISI 1016 steel processed by ECAP. Univ. Sci. 2014, 19, 139–146. [Google Scholar] [CrossRef] [Scilit]
- Klumdounga, P.; Buranawongb, A.; Chaiyakunb, S.; Limsuwana, P. Variation of color in Zirconium nitride thin films prepared at high Ar flow rates with reactive dc magnetron sputtering. Procedia Eng. 2013, 32, 916–921. [Google Scholar]
- Selçuk, B.; Ipek, R.; Karamiş, M.B. A study on friction and wear behaviour of carburized, carbonitrided and borided AISI 1020 and 5115 steels. J. Mater. Process. Technol. 2003, 141, 189–196. [Google Scholar] [CrossRef] [Scilit]
- Huang, M.-L.; Wu, Y.-Z.; Yi, N.-B.; Lu, S.-G. Structural colouration on textile fabrics with thin-film coating via magnetron sputtering: A review. Surf. Eng. 2022, 38, 830–845. [Google Scholar] [CrossRef] [Scilit]
- Eadi, S.B.; Song, H.-S.; Song, H.-D.; Oh, J.; Lee, H.-D. Nickel Film Deposition with Varying RF Power for the Reduction of Contact Resistance in NiSi. Coatings 2019, 9, 349. [Google Scholar] [CrossRef] [Scilit]
- Thao, C.P.; Kuo, D.-H.; Tuan, T.T.A.; Tuan, K.A.; Vu, N.H.; Via Sa Na, T.T.; Nhut, K.V.; Sau, N.V. The Effect of RF Sputtering Conditions on the Physical Characteristics of Deposited GeGaN Thin Film. Coatings 2019, 9, 645. [Google Scholar] [CrossRef] [Scilit]
- Othman, N.A.; Nayan, N.; Mustafa, M.K.; Azman, Z.; Hasnan, M.M.I.M.; Jaafar, S.N.; Bakri, A.S.; Mamat, M.H.; Yusop, M.Z.M.; Bakar, A.S.A.; et al. Effects of radio-frequency power on structural properties and morphology of AlGaN thin film prepared by co-sputtering technique. Elektr. J. Electr. Eng. 2021, 20, 14–18. [Google Scholar]
- Ullah, A.; Wang, Q.; Ahmad, I.; Usman, M. Irradiation effects on Nd and W doped Aluminum Nitride thin films. Phys. B Condens. Matter 2020, 586, 412086. [Google Scholar] [CrossRef] [Scilit]
- Mahieu, S.; Depla, D. Reactive sputter deposition of TiN layers: Modelling the growth by characterization of particle fluxes towards the substrate. J. Phys. D Appl. Phys. 2009, 42, 053002. [Google Scholar] [CrossRef] [Scilit]
- Zhong, Y.; Ni, Z.; Li, J.; Li, X.; Cao, W.; Wang, X.; Zhong, Q.; Xu, X.; Chen, J.; Liang, C. Influence mechanism of RF bias on microstructure and superconducting properties of sputtered niobium thin films. Vacuum 2023, 207, 111636. [Google Scholar] [CrossRef] [Scilit]
- Potlog, T.; Ghimpu, L.; Suman, V.; Pantazi, A.; Enachescu, M. Influence of RF sputtering power and thickness on structural and optical properties of NiO thin film. Mater. Res. Express 2019, 6, 096440. [Google Scholar] [CrossRef] [Scilit]
- Abdulrahman, A.F.; Barzinjy, A.A.; Hamad, S.M.; Almessiere, M.A. Impact of Radio Frequency Plasma Power on the Structure, Crystallinity, Dislocation Density, and the Energy Band Gap of ZnO Nanostructure. ACS Omega 2021, 6, 31605–31614. [Google Scholar] [CrossRef] [Scilit] [PubMed]
- Abenus-Acuña, J.R.; Pérez, I.; Sosa, V.; Gamboa, F.; Elizalde, J.T.; Farias, R.; Carrillo, D.; Enrique, J.L.; Burrola, A.; Ramos, M.; et al. Sputtering power effects on the electrochromic properties of NiO films. Optik 2021, 231, 166509. [Google Scholar] [CrossRef] [Scilit]
- Zhang, X.; Zeng, X.; Liu, Y.; Liu, J.; Pogrebnjak, A.; Pelenovich, V.; Wan, Q.; Liu, X.; Wang, H.; Lei, Y.; et al. Effects of RF magnetron sputtering power on the structure and nanohardness of high-entropy alloys (TiVCrNbSiTaBY)N hard coatings. Ceram. Int. 2023, 49, 33418–33424. [Google Scholar] [CrossRef] [Scilit]
- Alvarado-Ávila, M.I.; Toledo-Carillo, E.; Dutta, J. Improved chlorate production with platinum nanoparticles deposited on fluorinated actinated carbon cloth electrodes. Clean. Eng. Technol. 2020, 1, 100016. [Google Scholar] [CrossRef] [Scilit]
- Efeoglu, I.; Arnell, R.D.; Tinston, S.F.; Teer, D.G. The mechanical and tribological properties of titanium aluminum nitride coatings formed in a four-magnetron closed-field sputtering system. Surf. Coat. Technol. 1993, 57, 117–121. [Google Scholar] [CrossRef] [Scilit]
- Sharma, B. Re: Does Anybody Faced the Problem of Pin Holes in Magnetron Sputtered Mo Thin FILM on Glass After Removal of Sample from Vacuum Chamber? 2015. Available online: https://www.researchgate.net/post/Does_anybody_faced_the_problem_of_pin_holes_in_magnetron_sputtered_Mo_thin_film_on_glass_after_removal_of_sample_from_vacuum_chamber2/55e6fcd75cd9e339d68b456a/citation/download (accessed on 25 March 2025).
- Seo, E.J.; Kim, J.K.; Cho, L.; Mola, J.; Oh, C.Y.; De Cooman, B.C. Micro-plasticity of medium Mn austenitic steel: Perfect dislocation plasticity and deformation twinning. Acta Mater. 2017, 135, 112–123. [Google Scholar] [CrossRef] [Scilit]
- Yonenaga, I.; Ohkubo, Y.; Deura, M.; Kutsukake, K.; Tokumoto, Y.; Ohno, Y.; Yoshikawa, A.; Wang, X.Q. Elastic properties of indium nitrides grown on sapphire substrates determined by nano-indentation: In comparison with other nitrides. AIP Adv. 2015, 5, 077131. [Google Scholar] [CrossRef] [Scilit]
- Croitor, L.; Granco, D.Z.; Coropceanu, E.B.; Pyrtsac, C.; Fonari, M.S. Structure and mechanical features of one-dimensional coordination polymer Catena (µ2-adipato-O, O)-bus (pyridine-4-aldoxime)-copper(II). CrystEngComm 2015, 17, 2. [Google Scholar] [CrossRef] [Scilit]
- Brotzu, A.; De Filippo, B.; Natali, S.; Zortea, L. Corrosion behavior of shape memory alloy in NaCl environment and deformation recovery maintenance in Cu-Zn-Al system. Frat. Ed Integrità Strutt. 2022, 16, 64–74. [Google Scholar] [CrossRef] [Scilit]
- Savaloni, M.H. Influence of Ni deposition and subsequent N+ ion implantation at different substrate temperatures on nano-structure and corrosion behaviour of type 316 and 304 stainless steels. Appl. Surf. Sci. 2011, 258, 103–112. [Google Scholar] [CrossRef] [Scilit]
- Wang, L.; Snihirova, D.; Deng, M.; Wang, C.; Vaghefinazari, B.; Wiese, G.; Langridge, M.; Höche, D.; Lamaka, S.V.; Zheludkevich, M.L. Insight into physical interpretation of high frequency time constant in electrochemical impedance spectra of Mg. Corros. Sci. 2021, 187, 109501. [Google Scholar] [CrossRef] [Scilit]
- Lazanas, A.C.; Prodromidis, M.I. Electrochemical Impedance Spectroscopy—A Tutorial. ACS Meas. Sci. Au 2023, 3, 162–193. [Google Scholar] [CrossRef] [Scilit] [PubMed]
- Creus, J.; Mazille, H.; Idrissi, H. Porosity evaluation of protective coatings onto steel, through electrochemical techniques. Surf. Coat. Technol. 2000, 130, 224–232. [Google Scholar] [CrossRef] [Scilit]
- Alabtah, F.G.; Alkhouzaam, A.A.; Eliyan, F.F.; Ansari, N.; Alhamidi, Y.; Khraisheh, M. Advancing the industrial utilization of additive manufacturing: Understanding early-stage corrosion dynamics through advanced electrochemical and microstructural characterization. J. Mater. Res. Technol. 2025, 35, 2525–2546. [Google Scholar] [CrossRef] [Scilit]
- Hagen, C.M.H.; Hognestad, A.; Knudsen, O.Ø.; Sørby, K. The effect of surface roughness on corrosion resistance of machined and epoxy coated steel. Prog. Org. Coat. 2019, 130, 17–23. [Google Scholar] [CrossRef] [Scilit]
- Walter, R.; Kannan, M.B. Influence of surface roughness on the corrosion behaviour of magnesium alloy. Mater. Des. 2011, 32, 2350–2354. [Google Scholar] [CrossRef] [Scilit]

Disclaimer/Publisher’s Note: The statements, opinions and data contained in all publications are solely those of the individual author(s) and contributor(s) and not of MDPI and/or the editor(s). MDPI and/or the editor(s) disclaim responsibility for any injury to people or property resulting from any ideas, methods, instructions or products referred to in the content. |
© 2026 by the authors. Licensee MDPI, Basel, Switzerland. This article is an open access article distributed under the terms and conditions of the Creative Commons Attribution (CC BY) license.