


Abstract
Phosphate rock is a finite resource whose extraction in sedimentary deposits generates substantial volumes of waste rock. This study develops a panel-scale 3D geological modeling workflow for operational material accounting in a multilayer sedimentary phosphate deposit. Phosphate layers were modeled using a hanging wall–footwall approach and evaluated against independent well data. Bone Phosphate of Lime (BPL) grades were estimated from borehole-layer composite assay values using nearest neighbor, inverse distance weighting, and ordinary kriging. Domain-wise external validation showed that ordinary kriging provided the most consistent agreement with withheld observations in most mineable layers. Each mineable layer was treated as an independent estimation domain, with one composite BPL value retained per drillhole and per mineable layer. The validated block models were regularized to the mine plan and aggregated into operational strips, enabling strip-scale material accounting and mineability filtering under operation-specific technical criteria. To limit disclosure of confidential operational quantities, panel-scale resource, recoverable resource, and residual ore results are presented in relative rather than absolute terms. The results show that most modeled phosphate-bearing material satisfies the applied criteria and is classified as recoverable, whereas residual phosphate-bearing material excluded by the operational criteria remains concentrated in a limited subset of layers. The terms ‘resource,’ ‘recoverable resource,’ and ‘residual ore’ are used throughout in an operational material-accounting sense only and are not intended in the sense of any international mineral reporting code. Strip-based stripping ratio maps further reveal spatial variability in waste-to-ore and waste-to-grade relationships. The resulting workflow provides a quantitative spatial basis for future scenario-based assessment of waste management and selective dumping alternatives in sedimentary phosphate mining.
1. Introduction
Phosphate rock (PR) is the primary source of phosphorus, an essential nutrient for agricultural productivity and global food security [1]. Although phosphorus is relatively abundant in the Earth’s crust, only a small fraction occurs in concentrated, economically exploitable deposits, making PR a finite resource at the human time scale [2]. Global phosphate reserves are estimated at approximately 72 billion tons, with sedimentary deposits dominating world production [3]. Among these, Morocco hosts the largest sedimentary phosphate reserves, characterized by laterally extensive, multilayered stratigraphy and high P2O5 content.
Sedimentary phosphate deposits are commonly mined by panel-based surface operations in which phosphate-bearing layers are interbedded with sterile sedimentary units. Mining proceeds through sequential stripping of overburden and interburdens to access phosphate layers, followed by extraction, pre-concentration, and beneficiation through processes such as flotation or calcination [4]. These operations inherently generate large volumes of waste rock, including overburden, interlayers, and residual ore excluded from recoverable resources under applied thickness and cut-off grade criteria. Mining typically begins with the excavation of an initial box cut, where waste is stored outside the panel. Once the box cut is fully exploited, it is repurposed as a waste management zone for adjacent trenches. As extraction progresses, draglines and dozers systematically transfer waste material into previously mined-out trenches, where heterogeneous waste streams are combined through mixed dumping, forming a cyclic pattern of extraction and undifferentiated waste piles within the panel.
While mixed dumping is operationally efficient, it obscures internal geological and geochemical variability within the dumped material and reduces the possibility of reuse, reprocessing, or selective handling under evolving technical and economic conditions. In contrast, selective dumping seeks to preserve material identity by segregating waste streams according to grade, lithology, or potential beneficiation. However, such strategies require spatially explicit information on ore, residual ore, and waste distribution at the operational scale. In sedimentary phosphate mining, this type of panel-scale three-dimensional (3D) material accounting remains weakly developed in conventional mine-planning workflows.
3D geological modeling and resource estimation provide the basis for representing stratigraphic continuity and spatial variability in layered sedimentary deposits. Previous studies in coal and lignite deposits have demonstrated the utility of solid modeling approaches, seam-based stratigraphic frameworks, and geostatistical estimation methods for stratified mineral systems [5,6,7,8,9,10]. In the broader context of sedimentary modeling, prior studies have developed 3D solid models from borehole data, cross-sections, terrain models, and related geological inputs [11,12,13,14,15,16,17]. These studies provide important methodological foundations, and many of their concepts are transferable to sedimentary phosphate deposits. However, their main emphasis has generally remained on geological representation and deposit-scale resource estimation.
As a result, an important gap remains between geological block modeling and operational material accounting in sedimentary phosphate mining. Existing studies rarely integrate mining-code-based stratigraphy, strip-aligned regularization, and mineability filtering within a framework directly matched to panel-scale mining geometry. They also give limited attention to preserving the spatial identity of ore, residual ore, and waste in a form suitable for short-term operational analysis. Consequently, although 3D modeling is well established for stratified deposits, its translation into operationally aligned workflows for material accounting and waste-management assessment remains insufficiently developed.
Against this background, the present study develops a panel-scale, mining-code-based 3D block modeling workflow for operational material accounting in a multilayer sedimentary phosphate deposit. The objectives are to: (1) develop a hanging wall–footwall-based geological model for the phosphate panel; (2) compare nearest neighbor (NN), inverse distance weighting (IDW), and ordinary kriging (OK) for Bone Phosphate of Lime (BPL) estimation; (3) quantify resources, recoverable resources, residual ore, and waste volumes at the strip-scale; (4) generate strip-aligned stripping ratio maps to examine spatial variability in waste generation; and (5) provide a quantitative spatial basis for future assessment of selective dumping and related material-handling alternatives. The individual components deployed in this study (hanging wall–footwall wireframing, borehole-layer compositing, geostatistical grade estimation, block regularization, and mineability filtering) are established methods in geological modeling and mine planning practice. The contribution of the study lies in their integration into a unified panel-scale workflow that links mining-code-based geological modeling, block regularization, strip-based aggregation, and material classification within a framework specifically designed for operational material accounting and selective dumping assessment, rather than conventional deposit-scale resource reporting.
2. Materials and Methods
The methodological workflow adopted in this study was structured as a sequence of linked stages designed to transform archived drilling information into panel-scale material-accounting outputs. The workflow comprises: (1) database assembly and stratigraphic coding; (2) stratigraphic correlation and wireframe construction; (3) exploratory data analysis, borehole-layer compositing, and outlier treatment within mineable layers; (4) block modeling and grade estimation by stratigraphic domain; (5) validation of the estimated block model; (6) regularization of the block model to mining plan support and strip creation; and (7) mineability filtering and stripping-ratio analysis. Although the workflow is applied here to a specific phosphate panel, its structure is intended to provide a transferable framework for panel-scale material accounting in stratified sedimentary deposits. Wireframing, stratigraphic correlation, and block modeling and estimation were performed using Datamine Studio RM (version 2.2.304.0), and variography and geostatistical validation were performed using Datamine Snowden Supervisor (version 9.0).
2.1. Database
A structured geological database was compiled to support 3D solid modeling, statistical analysis, block modeling, and resource estimation. The database was organized into standard relational tables, including collar, survey, mining-code, and assay tables. In this study, 68 archived well pit logs received from the operating company in PDF format were digitized into CSV files. These records contained collar coordinates, geological intercepts, mining-code intervals, and phosphate-quality information for a total of 4461 wells-intersected samples. Digitization accuracy was ensured through systematic cross-checking of depth intervals, mining-code boundaries, and assay values against the original archived PDF logs to minimize transcription errors. The finalized database structure and drilling summary statistics are presented in Table 1 and form the basis for all subsequent modeling and analytical steps.
Table 1.
Geological database structure and drilling summary.
Of the 68 wells (Figure 1), 58 are evenly distributed across the panel with an average spacing of approximately 500 m, covering an area of about 11.07 km2 and reaching depths ranging from 43 m to 82.6 m, with an average depth of 62.89 m. These wells constitute the primary dataset used for model construction and resource estimation. The remaining 10 wells, characterized by irregular spacing, were retained as an external validation set. This data split was adopted as a pragmatic design choice to preserve an independent check on wireframe and block-model performance. It was not intended to imply that irregular spacing would invalidate structural analysis or kriging. The possible loss of information associated with this split is acknowledged as a limitation of the adopted workflow. The present study is designed as a workflow demonstration in which the withheld wells serve as a permanent validation set; for operational implementation, it is recommended that all 68 available wells be incorporated into the final model to produce the most spatially informed estimates. In the domain-wise grade validation reported later, only withheld wells intersecting a given mineable layer and containing a retained borehole-layer composite BPL value contributed to the corresponding layer-specific validation metrics.
Figure 1.
Spatial distribution of the boreholes used in the study, distinguishing the 58 wells used for model construction and estimation from the 10 wells reserved for independent validation. The red outline denotes the modeled panel (Panel 8).
2.2. Stratigraphic Correlation
This study focuses on identifying and correlating phosphate-bearing layers within the panel using the lithostratigraphic framework proposed by Boujo [17]. The objective of the correlation was to establish consistent spatial continuity among phosphate layers based on their BPL content, without detailing the lithological composition of the intercalated layers.
Lithological logs and geochemical data were interpreted in accordance with Boujo’s classification of phosphate-rich layers and interlayers. Key stratigraphic horizons were digitized and used as reference surfaces for correlation. Lithological units were standardized into mining codes using Boujo’s nomenclature to ensure consistency across the dataset and compatibility with the original stratigraphic framework. The modeling workflow was configured to treat phosphate-rich layers and their intercalated sterile layers as distinct stratigraphic entities. A hierarchical stratigraphic structure was implemented to reflect Boujo’s subdivision of stages into entities and layers, including defined sequence boundaries. Correlation results were compiled into a revised stratigraphic chart (Figure 2), integrating Boujo’s conceptual framework with spatially explicit subsurface data derived from drilling.
Figure 2.
Panel’s mining-code stratigraphic correlation.
This approach preserves the original lithostratigraphic logic of Boujo [17] while enabling precise, panel-scale stratigraphic correlation suitable for subsequent modeling and quantitative analysis. It is noted that Boujo’s mining-code classification carries an implicit lithological characterization for each coded unit: phosphate-bearing layers correspond to sandy phosphate horizons, while the intercalated sterile units correspond to broadly defined lithological categories including calcareous (limestone-rich), marly, and clay-rich interburdens, in accordance with the established stratigraphy of the Ganntour sedimentary phosphate sequence. This implicit lithological identity, encoded within the mining-code framework, provides a first-order basis for future waste stream differentiation at the strip-scale.
2.3. Solid Modeling (Wireframing) Procedure
A solid model is a 3D representation created through data triangulation. There are two primary approaches to solid modeling: the section method and the top-bottom surface method. The section method involves dividing a layer into vertical sections, which are then joined to form a 3D representation. In contrast, the top-bottom surface method involves triangulating or interpolating the hanging wall (HW) and footwall (FW) of a layer and then generating a solid volume between the two surfaces.
In this study, the hanging wall–footwall approach was used to model the phosphate field. This approach was selected to preserve stratigraphic continuity and accurately represent thickness variability across the panel. Figure 3 illustrates the methodological framework adopted for solid modeling.
Figure 3.
Layer modeling approach.
2.4. Wireframe Validation
Validation of the 3D wireframe models was conducted using an independent set of well logs reserved exclusively for quality control. For each intersected phosphate layer, observed start depth, end depth, and thickness derived from drill-hole logs were compared with the corresponding values predicted by the wireframe model.
Three geometric error components were computed for each layer intersection: (i) start-depth error, defined as the difference between predicted and observed layer top; (ii) end-depth error, defined as the difference between predicted and observed layer base; and (iii) thickness error, defined as the difference between predicted and observed layer thickness. These error components quantify the geometric consistency of the wireframe representation relative to independent drilling control.
For each phosphate layer, two statistical measures were calculated across all validation intersections. The mean error (ME) was used to evaluate systematic stratigraphic bias, indicating whether the wireframe model tends to overestimate or underestimate layer positions or thicknesses. The mean absolute error (MAE) was used to evaluate stratigraphic dispersion, representing the average magnitude of deviations regardless of direction.
Layer-specific ME and MAE values constitute the primary basis for evaluating wireframe performance. To provide a concise panel-level overview, descriptive cross-layer summaries of absolute ME and MAE were also reported for each geometric parameter. Because the modeled layers differ in depth, thickness, and local variability, these cross-layer summaries are presented as descriptive panel-scale indicators of the order of magnitude of geometric deviations across the stratigraphy.
2.5. Exploratory Data Analysis
This phase was conducted to characterize the statistical properties of BPL grades and layer thicknesses, identify data inconsistencies, and support subsequent geostatistical modeling. The analysis focused on assessing grade distributions, detecting outliers, and evaluating variability within mineable phosphate layers prior to estimation.
2.5.1. Thickness Analysis and Borehole Layer Compositing
The lithological classification process involved grouping materials into mineable and waste layers and calculating the thickness of each mineable layer in each drillhole. Box plots were used to summarize thickness variability across the mineable layers (Figure 4).
Figure 4.
Box plots of thickness distribution across mineable layers.
Archived BPL assays were reported for measured sandy phosphate intervals identified in the operating company logs. Because the archived assay intervals have variable support, the raw BPL values were not treated directly as a common-support estimation dataset. Instead, for each mineable layer, the primary grade dataset was defined as one composite BPL value per drillhole and per mineable layer. Where a single measured BPL interval spanned the sampled mineable thickness, that value was retained directly. Where multiple measured BPL intervals occurred within the same mineable layer, a thickness-weighted composite was calculated from the original measured intervals. The representative location of each retained value was taken as the midpoint of the corresponding mineable layer interval within the drillhole. This procedure defines the estimation support at the borehole-layer level and avoids the creation of pseudo-samples at finer vertical support than the original assay data.
2.5.2. BPL Outlier Treatment
Exploratory analysis of BPL focused on the borehole-layer composite dataset derived from the original measured assay support within each mineable phosphate layer. Outliers were screened within each layer using the Tukey criterion to reduce the influence of extreme values on variography and block estimation. The resulting dataset, consisting of one retained composite BPL value per drillhole and per mineable layer, was then used for the layer-wise descriptive summaries reported later, as well as for variogram modeling and estimator comparison. These summaries describe the processed borehole-layer composite dataset used in the workflow and should not be interpreted as direct descriptors of the raw archived assay interval population.
2.6. Block Modeling
Block modeling was performed by first defining a block model prototype based on the X, Y, and Z extents of the panel, thereby establishing the spatial limits of the model domain. This prototype defines the 3D discretization used for subsequent geological and grade modeling.
The parent block dimensions used for the geological model were 5 m × 5 m × 0.05 m. This geological parent support is used to preserve thin stratigraphic geometry during coding and spatial discretization and is not presented here as the mining selectivity unit. At the average drilling spacing of approximately 500 m, blocks located between drillholes are estimated from distant samples; the fine parent-block discretization therefore provides geometric fidelity for stratigraphic layer coverage and does not imply grade resolution commensurate with the block size. The 0.05 m vertical dimension was selected to preserve thin stratigraphic contacts and avoid layer loss during coding within closely spaced hanging wall and footwall surfaces; it does not represent the effective excavation selectivity of the mining equipment. In particular, the small vertical support helps reduce contact smearing and unresolved stratigraphic overlap where hanging-wall and footwall surfaces become closely spaced. Blocks were coded within separate wireframe-constrained layer models, so stratigraphic assignment was governed by spatial inclusion relative to the corresponding interpreted wireframed volume. The 0.05 m vertical dimension was retained for geological coding and preservation of thin stratigraphic geometry; however, the support of the assay dataset used for grade estimation was defined separately at the borehole-layer composite support described in Section 2.5.
The previously constructed wireframes were then used to constrain the geometry of individual layers within the block model. These wireframes define the interpreted layer boundaries used to assign blocks to their corresponding stratigraphic units according to spatial position relative to the modeled stratigraphy. Separate block models were generated for each stratigraphic layer using the common prototype.
This workflow provides a representation of the spatial distribution, geometry, and stratigraphic relationships of the phosphate-bearing and waste layers for subsequent analysis (Figure 5). Layer boundaries are modeled deterministically and do not explicitly account for uncertainty in stratigraphic interpretation. Possible misclassification near contacts is not quantified.
Figure 5.
Geological block modeling approach.
2.7. Variography and Grade Estimation
Directional experimental variograms were examined independently within each mineable layer to characterize the spatial continuity of borehole-layer composite BPL values and to define practical estimation parameters. A univariate within-layer approach was adopted because BPL was the only variable estimated and because each mineable layer constitutes a distinct wireframe-constrained estimation domain within the panel-scale workflow. The variable modeled in this study is therefore the average BPL of the mineable layer at the drillhole location, as represented by one retained composite BPL value per drillhole and per mineable layer.
Because the phosphate horizons are thin, laterally extensive, and wireframe-constrained, structural interpretation in the present study emphasized within-layer lateral continuity rather than unconstrained continuity across the full Cartesian volume. The Cartesian 3D coordinate system was retained as the practical computational framework for block modeling and estimation because the wireframes, block model, and search neighborhoods are all defined in global X, Y, and Z space. Within this framework, the third direction was retained only as a constrained practical direction needed to preserve full 3D layer geometry and to guide search orientation within the folded stratigraphic model, whereas the representative midpoint of each borehole layer composite was used as the practical point support for variography and estimation.
Variography and estimation were performed on the borehole-layer composite dataset defined in Section 2.5 rather than on interval-split assay support. Within each mineable layer, ordinary kriging was applied under an assumption of practical local stationarity after domain separation. This assumption is intended only for within-layer implementation of the adopted panel-scale workflow and should not be interpreted as stationarity across the full panel or across multiple layers. Formal trend modeling and nonstationary alternatives, such as universal kriging, were outside the scope of the present study. Each mineable phosphate layer, namely F1, F2, F3, and L01 to L6, was treated as an independent wireframe-constrained estimation domain. A single-structure spherical variogram model was adopted within each domain to characterize BPL continuity and define the practical estimation parameters used in the workflow. For each mineable layer, experimental variograms were calculated along three principal directions aligned with the geological anisotropy of the deposit: (i) the strike direction, (ii) the across-strike direction, and (iii) the dip-plane direction. These directional analyses capture lateral and vertical continuity patterns consistent with the stratified sedimentary geometry of the phosphate layers. Variogram models were defined by nugget, sill, and range parameters, representing short-scale variability, total variance, and the distance beyond which spatial correlation becomes negligible. An example of the resulting variogram analysis is shown in Figure 6 for layer L01, which illustrates the directional experimental data and the fitted spherical model. The adopted domain-wise parameters for all nine mineable layers are reported in Table 2.
Figure 6.
Example of directional variogram analysis for mineable layer L01, showing experimental variogram points and the fitted spherical model along the major, intermediate, and minor continuity directions. This example is representative of the layer-wise variographic approach applied independently to each mineable estimation domain.
Table 2.
Theoretical variogram model parameters and adopted 3D directional continuity parameters for the mineable phosphate estimation domains based on borehole-layer composite BPL data.
The fitted variogram parameters reflect the lateral sedimentary continuity characteristic of the Ganntour phosphate sequence. The relatively long major ranges observed in most layers (exceeding 1000 m in F1, F2, L01, L2, L3, L4, L5, and L6) are consistent with the laterally extensive and sub-horizontal geometry of the phosphate-bearing horizons. The higher nugget-to-sill ratios and shorter lateral ranges observed in F3 and F2 reflect greater local grade variability within these layers, attributable to their more heterogeneous depositional environments or post-depositional alteration. The short Direction 3 ranges (2–15 m) across all domains are not interpreted as downhole grade variability but rather as geometric thickness-constraining parameters within the wireframed layer volumes, consistent with the thin and sub-horizontal nature of the mineable phosphate horizons.
For ordinary kriging, estimation was performed independently within each domain using the borehole-layer composite dataset as the informing grade data and assigning estimates within the corresponding 5 m × 5 m × 0.05 m parent block model constrained by the wireframed layer geometry. The parent block geometry therefore provides the spatial discretization of the model, whereas the informing assay support is defined at the borehole-layer composite scale. A minimum of 3 and maximum of 12 informing samples were used for estimation. Search neighborhood orientation was rotated locally using the interpolated structural orientation field derived from the wireframe geometry, whereas the principal search radii were guided by the adopted domain-wise variogram model. NN and IDW comparison runs were performed within the same domain framework and on the same parent block support; IDW was implemented with power 2, whereas NN used the nearest informed sample.
The orientation of each phosphate layer was derived from the wireframe geometry. Triangulated trend surfaces were generated for each layer, and dip-direction values were computed and stored together with the coordinates of the triangle centroids to build the structural orientation dataset (Figure 7a). These values were then interpolated to produce a continuous dip-direction field across each layer (Figure 7b). The resulting structural fields were used to define a locally rotated search neighborhood during estimation. For reference, Figure 7c,d schematically illustrates fixed and locally rotated search neighborhoods used in the estimation workflow and is not drawn to actual domain-specific search radii. The actual domain-wise variogram parameters and adopted continuity directions are reported in Table 2. In this approach, the orientation of the search ellipsoid varies according to local stratigraphic geometry, whereas the principal axis lengths are guided by the variographic interpretation. The variogram model itself does not incorporate locally varying anisotropy, and the use of a locally rotated search neighborhood should therefore be understood as a practical approximation for panel-scale estimation rather than as a fully nonstationary anisotropic variogram formulation. The adopted approach provides a practical panel-scale estimation framework for wireframe-constrained thin stratigraphic layers, while local departures from stationarity near complex layer geometries remain a limitation of the present workflow.
Figure 7.
Structural orientation and search neighborhood definition used for grade estimation: (a) structural orientation dataset derived from triangulated layer surfaces; (b) interpolated dip-direction field used to define local structural orientation; (c) schematic stationary search ellipsoid with fixed orientation; and (d) schematic locally rotated search neighborhood aligned with layer geometry. Yellow ellipse denotes the search ellipsoid outline at representative locations, illustrating its orientation relative to the layer geometry.
BPL grades were estimated into the block model using three interpolation methods: nearest neighbor (NN), inverse distance weighting (IDW), and ordinary kriging (OK). NN and IDW were used as baseline interpolation methods, while OK was adopted as the primary geostatistical estimator for comparative evaluation. The comparison among NN, IDW, and OK was used to select the estimation method adopted in the panel-scale material-accounting workflow and to document the relative behavior of the candidate estimators within the case study. External validation was also summarized independently by the mineable layer so that variography, estimation, and validation remained consistent within the same domain framework.
2.8. Block Model Validation
Block model validation was conducted primarily through domain-wise external validation using the withheld wells. Because variography and estimation were implemented independently within each mineable layer, validation was also summarized independently by domain. For each withheld well intersecting a given domain, the observed borehole-layer composite BPL value was compared with the corresponding estimated value at the same representative location within that mineable layer. The validation metrics were therefore computed on the same borehole-layer composite support used in the estimation workflow. For each domain and estimator, mean error (ME), mean absolute error (MAE), root mean square error (RMSE), Pearson correlation coefficient (R), and R2 (square of Pearson’s R) were calculated. The number of contributing validation composites is also reported to indicate the number of withheld observations available in each domain. An external withheld-well design was preferred over leave-one-out cross-validation because it preserves spatially independent borehole-layer observations for evaluation and is more appropriate for the adopted layer-composite support.
Because estimation was performed independently within each mineable layer, the panel-scale validation results summarize the combined behavior of the domain-wise estimates across the modeled panel. Boundary effects between adjacent layers were not explicitly evaluated in this study, and possible contact-related grade transitions near stratigraphic boundaries were therefore not quantified. It is further noted that the withheld-well validation design used in this study has two limitations that should be acknowledged explicitly. First, withholding complete wells does not establish full statistical independence in the geostatistical sense: the distances between training and validation wells relative to the fitted variogram ranges determine the degree of spatial correlation, and some validation wells lie within the range of influence of estimated domains. Second, the same withheld set was used both to compare the three estimators and to report OK performance; the withheld wells therefore function as a model-selection set rather than an untouched independent test set. The reported validation metrics should consequently be interpreted as case-specific performance indicators within the adopted domain configuration rather than as independent estimates of generalization performance.
In addition to the domain-wise external validation, complementary graphical and spatial diagnostics were examined to provide a more complete assessment of estimator performance across the panel. Scatter plots were used to evaluate the relationship between observed and estimated BPL values, with the correlation coefficient (R) quantifying the strength of the linear relationship. It is noted that R2 values reported in this study are computed as the square of Pearson’s correlation coefficient r between observed and estimated values and are not equivalent to the predictive coefficient of determination in the general regression sense. Quantile-quantile (QQ) plots were generated to compare the distributional characteristics of estimated and sampled BPL values, with alignment along the 1:1 reference line indicating reproduction of the grade distribution. Histogram comparisons were carried out to examine differences in grade frequency between samples and block model estimates, supporting evaluation of smoothing effects and distributional consistency. Directional trend plots were constructed by slicing the dataset along the principal spatial directions and comparing mean BPL values of samples with mean block model estimates within each slice, enabling detection of spatial bias and evaluation of directional estimation performance. Following identification of the most reliable estimation method, visual spatial validation was performed by jointly displaying the block model and drill-hole data using consistent color scales, allowing direct assessment of grade continuity reproduction across the panel.
2.9. Block Model Regularization and Strip Creation
To ensure geometric consistency between the block model and the operational mine plan, 3D prototypes representing the planned panel layout were generated. These prototypes define the target block dimensions and spatial alignment required for subsequent aggregation and analysis. They serve as geometric templates to which the original block model is conformed, ensuring compatibility between geological modeling and mining geometry. The regularization step was applied after grade estimation based on borehole-layer composite assay support and does not redefine the support of the informing grade data.
For operational panel accounting, the estimated parent blocks were aggregated to a plan support of 40 m × 100 m while retaining the 0.05 m vertical discretization prior to vertical strip aggregation. This regularized support was adopted to align the geological model with the panel layout used for strip-based material accounting and should not be interpreted as an equipment-scale selective mining unit. This plan support was selected to match the mine layout in plan view while retaining the fine vertical discretization needed to maintain layer coverage throughout the full 3D panel geometry. The workflow therefore distinguishes between the geological parent support used to represent stratigraphy (5 m × 5 m × 0.05 m) and the plan support used to align the estimated model with the panel layout prior to vertical strip aggregation.
Block model regularization was performed through block aggregation, whereby smaller parent blocks were combined into larger blocks consistent with the prototype dimensions. Aggregation was carried out using fill-volume-weighted averaging to preserve grade continuity and volumetric integrity while improving computational efficiency and alignment with mining constraints. Following regularization, strip models were constructed by aggregating, within each stratigraphic layer, all regularized blocks sharing the same X-Y footprint. For each strip block, the corresponding regularized block sequence was collapsed vertically into a single representative block located at the center of the aggregated interval within that layer. Thicknesses and volumes were summed in the vertical direction, and grades were calculated using fill-volume-weighted means. This procedure preserves the operational X-Y plan support while converting the vertically discretized regularized model into a layer-wise strip accounting unit suitable for panel-scale material accounting, mineability filtering, and stripping-ratio calculations. These strip-based datasets form the basis for subsequent panel-scale material accounting, mineability filtering, stripping-ratio calculation, and material balance evaluation.
2.10. Mineability Filtering and Residual Ore Definition
Mineability filtering was applied to the strip models to identify the portion of the modeled resources that satisfies the adopted technical mining criteria under the current operational configuration.
In this study, recoverable resource delineation was governed by two operation-specific technical criteria applied by the mining operation: a minimum mineable thickness criterion and a minimum cut-off grade criterion. Strips satisfying both operation-specific criteria were classified as recoverable resources. Material failing to satisfy either the thickness or grade threshold, while remaining within the modeled phosphate layers, was classified as residual ore. This category represents phosphate-bearing material excluded from recoverable resources due to operational constraints rather than geological absence.
This approach enables explicit separation of recoverable resources, residual ore, and waste at the strip-scale, providing a basis for quantifying material losses associated with mining selectivity and supporting subsequent material balance and stripping ratio analyses. The applied procedure should therefore be understood as an operation-specific technical filtering step within the adopted panel-scale material-accounting workflow, rather than as a full reserve-optimization methodology or a substitute for integrated multi-seam mine planning.
The specific threshold values cannot be reported as absolute figures owing to confidentiality constraints governing the operational data provided by the mining company. To partially address the reproducibility concern this raises, the sensitivity of the principal material-accounting conclusions to the applied criteria can be assessed qualitatively from the layer-wise in-layer recovery values reported in Section 3.5. Layers exhibiting high in-layer recovery (L01, L3, L4, and L5 all exceeding 99%) are insensitive to small perturbations in the applied criteria: even moderate relaxation or tightening of the thresholds would not substantially alter their classification. Conversely, F2, which exhibits the lowest in-layer recovery (70.23%), and to a lesser extent L6 (91.22%) and F1 (95.32%), are the layers where the material-accounting conclusions are most sensitive to the choice of threshold values. Future work incorporating a formal sensitivity analysis or probabilistic mineability filtering, as discussed in Section 4.7, would allow this threshold sensitivity to be quantified explicitly.
It is further noted that the terms ‘resource’, ‘recoverable resource,’ and ‘residual ore’ are used throughout this study in the context of operational panel-scale material accounting only. They are not intended in the sense of Mineral Resources or Ore Reserves as defined under JORC, NI 43-101, PERC, or any other international mineral reporting code, and the results presented here are not suitable for use in public reporting, investment decisions, or regulatory compliance contexts.
2.11. Stripping Ratio Maps Creation
Stripping ratio maps were generated using strip models constructed for both ore and waste, with residual ore included within the waste classification in accordance with the mineability filtering criteria adopted in this study. Ore and waste strips were spatially matched based on their X-Y coordinates, enabling direct aggregation of thickness, volume, and tonnage at the strip scale. This spatial integration provides a consistent framework for quantifying waste-to-ore relationships across the panel.
Ore tonnage was calculated for recoverable resource strips using a density of 1.6 t/m3, representative of sandy phosphate material. Contained BPL tonnage was subsequently computed by multiplying the estimated BPL grade by the corresponding ore tonnage for each strip.
Based on these aggregated quantities, four stripping ratio metrics were calculated. It is noted that, because ore and waste strips share the same horizontal footprint in the adopted spatial matching framework, the volumetric stripping ratio (waste volume/ore volume) is mathematically equivalent to the thickness stripping ratio (cumulative waste thickness/cumulative ore thickness), as confirmed by their identical reported statistics. Furthermore, because a constant ore density of 1.6 t/m3 is applied uniformly, the ore-tonnage stripping ratio is a density-scaled transformation of the volumetric ratio rather than an independent metric. The BPL-tonnage stripping ratio is therefore the only metric that introduces additional grade-dependent information beyond the geometric relationship between waste and ore volumes. All four metrics are retained for completeness and operational interpretability, with the understanding that the volumetric, thickness, and ore-tonnage ratios capture the same geometric information and that the BPL-tonnage ratio is the metric of primary analytical interest:
- Volumetric stripping ratio, defined as the ratio of waste volume to ore volume.
- Ore tonnage stripping ratio, defined as the ratio of waste volume to ore tonnage.
- BPL tonnage stripping ratio, defined as the ratio of waste volume to contained BPL tonnage.
- Thickness stripping ratio, defined as the ratio of cumulative waste thickness to cumulative ore thickness.
These stripping ratio maps provide a spatially explicit representation of waste-to-ore relationships and constitute a key input for evaluating mining selectivity, material balance, and panel-scale waste management strategies.
3. Results and Discussion
The results are presented in the same sequence as the workflow described in Section 2 so that each subsection reports the outputs of the corresponding methodological phase.
3.1. Stratigraphic Wireframe Validation Results
Layer-specific wireframe validation results are reported in Table 3 as geometric diagnostics comparing interpreted wireframe surfaces with the independent validation wells. The results are discussed primarily at the layer level, whereas the cross-layer summary rows are presented as descriptive panel-scale indicators of the overall magnitude of geometric deviations across the modeled stratigraphy.
Table 3.
Wireframe validation results.
For start-depth, layer-level mean errors range from small positive to moderate negative values, indicating limited systematic bias at the individual layer scale. When aggregated across layers, the mean absolute stratigraphic bias for start-depth is 0.67 m, reflecting a low average offset between wireframe-predicted layer tops and observed drill-hole intersections. The corresponding stratigraphic dispersion, quantified by the layer-averaged MAE, is 0.78 m, indicating modest random variability in top-surface positioning across the modeled stratigraphy.
End-depth validation exhibits a similar pattern. Layer-level mean errors include both positive and negative deviations, suggesting localized stratigraphic variability rather than a consistent directional bias. At the panel scale, the aggregated stratigraphic bias for end-depth is 0.71 m, while stratigraphic dispersion reaches 0.97 m. The slightly higher dispersion observed for end-depths is expected, given increased uncertainty in defining basal contacts within multilayer sedimentary sequences.
Thickness validation shows that mean errors are generally centered near zero, indicating a balance between thickness overestimation and underestimation across layers. The aggregated stratigraphic bias for thickness is 0.44 m, and the corresponding stratigraphic dispersion is 0.64 m. Although thicker composite layers, particularly F3, exhibit larger absolute thickness errors, this behavior reflects scale effects associated with greater layer thickness rather than modeling bias. The absence of systematic thickness bias confirms that thickness variability is captured without directional distortion at the panel scale.
It is important to note that the stratigraphic bias and dispersion rows reported in Table 3 are descriptive cross-layer summaries derived from layer-level statistics, as defined in Section 2.4. They are used to indicate the overall order of magnitude of geometric deviations across the panel. Layer-specific variability remains the primary basis for interpretation.
Overall, the layer-specific diagnostics indicate that the wireframe model reproduces the main stratigraphic geometry of the panel with deviations that remain limited relative to the modeled depths and thicknesses for most layers. These results support the use of the wireframe model as the geometric framework adopted in the subsequent workflow.
3.2. BPL Outlier Treatment and Basic Statistics Summary
An exploratory review of the borehole-layer composite BPL dataset showed layer-dependent grade variability and a limited number of anomalous values. Outlier treatment was applied within mineable layers using the Tukey criterion before variography and block estimation. Table 4 summarizes the composite grade dataset retained for estimation, with one composite BPL value per drillhole and per mineable layer after outlier treatment. These statistics are presented as descriptive summaries of the processed borehole-layer composite dataset used in the adopted workflow and are not interpreted as exact descriptors of the original raw assay interval population.
Table 4.
Basic statistics of borehole-layer composite BPL values retained for estimation after outlier treatment.
3.3. Block Model Validation Results
Block model validation was performed primarily through domain-wise external validation using the withheld wells. This comparison provided the quantitative basis for evaluating NN, IDW, and OK within the mineable phosphate layers.
Table 5 reports the domain-wise external validation results obtained from the withheld wells. Validation was summarized independently for each mineable phosphate layer to remain consistent with the adopted layer-wise variography and estimation workflow. Metrics were computed from borehole-layer composite comparisons within each domain, while the reported number of validation composites indicates the number of contributing withheld observations for that mineable layer.
Table 5.
Domain-wise external validation results by mineable phosphate layer and estimator. ME, MAE, RMSE, R, and R2 were computed from borehole-layer composite comparisons; the reported number of validation composites indicates the number of contributing withheld observations in each domain.
The domain-wise results indicate that ordinary kriging provided the most consistent agreement with the withheld data within the adopted borehole-layer composite and layer-constrained estimation framework. OK yielded the lowest MAE in all nine mineable domains and the lowest RMSE in eight of the nine domains. The only exception in RMSE was F1, where IDW produced a slightly lower RMSE, although OK remained competitive in that domain. Stronger OK performance was observed in F2, F3, L01, L2, L3, L4, L5, and L6, whereas NN did not outperform the other estimators in any domain. These results support the use of ordinary kriging as the primary estimator within the present panel-scale workflow, while also showing that estimation performance remains domain dependent and should be interpreted in relation to the adopted borehole-layer composite support and wireframe-constrained domain definition.
To complement the domain-wise external validation, graphical and spatial diagnostics were examined across the full panel using the complete composite dataset (Figure 8). These complementary analyses provide additional evidence on estimation performance that is not captured by the small per-domain withheld samples alone.
Figure 8.
Complementary block model validation diagnostics: (a) scatter plots of observed versus estimated BPL values for NN, IDW, and OK; (b) histogram comparison of observed and estimated grade distributions; (c) directional trend plots comparing mean observed and estimated BPL values along principal spatial directions; and (d) spatial cross-sectional comparison of estimated block grades and drill-hole data. In (a), the green line indicates the linear regression fit, the gray dashed line indicates the 1:1 reference, and the red and blue dashed lines indicate the median (M) and quartiles of the BPL distribution, respectively. The red box labeled A–B denotes the cross-sectional trace shown in (d).
Scatter plot analysis (Figure 8a) indicates strong linear relationships between observed BPL values and estimates produced by all three methods. OK exhibits the highest correlation (R = 0.97), with a regression equation (y = 0.966x + 1.855) indicating close agreement with observed grade trends across the data range. NN and IDW show comparable correlations (R = 0.91 for both), with regression equations of y = 0.903x + 5.087 and y = 0.897x + 5.418, respectively, reflecting slightly greater intercept offsets. QQ plot analysis confirms that all three methods broadly reproduce the observed grade distribution; OK shows the closest alignment at grade extremes, suggesting reduced smoothing relative to NN and IDW. Histogram comparisons (Figure 8b) further indicate that the OK-estimated BPL distribution closely mirrors the observed grade histogram, while NN and IDW exhibit localized deviations in certain grade intervals. Directional trend plots (Figure 8c) reveal that OK produces mean grade estimates most consistent with observed means across the X, Y, and Z spatial directions, with observed means of 51.96%, 53.69%, and 55.49% compared with OK estimates of 51.78%, 53.53%, and 57.23%, respectively. Spatial cross-sectional validation (Figure 8d) further confirms close correspondence between estimated block grades and drill-hole data across the panel.
Collectively, the complementary diagnostics support the selection of OK as the preferred estimator within the present panel-scale workflow. It is emphasized, however, that the domain-wise withheld-well validation samples are small (four to seven composites per domain) and are therefore not sufficient to establish estimator superiority with statistical confidence. The above results should be interpreted as case-specific evidence consistent with the adopted borehole-layer composite support and domain configuration rather than as a definitive demonstration of OK superiority across all possible settings.
3.4. Block Model Regularization and Strips Creation Results
Block model regularization was performed to align the geological block model with the operational mine plan and enable analysis at an operationally meaningful scale. It is recalled that the 5 m × 5 m × 0.05 m parent block dimensions serve as the geological discretization support for stratigraphic coding and layer coverage, while grade estimation is informed at the borehole-layer composite scale; the strip-scale aggregation described in this section constitutes the operational accounting support at which material quantities are meaningfully reported. In the adopted workflow, the geological parent block model was aligned to a 40 m × 100 m plan support before vertical aggregation into layer-wise strip blocks. Following regularization, strip models were constructed by aggregating, within each stratigraphic layer, all regularized blocks sharing the same X-Y footprint. For each strip block, the corresponding regularized block sequence was collapsed vertically into a single representative block located at the center of the aggregated interval within that layer. Thicknesses and volumes were summed in the vertical direction, and grades were calculated using fill-volume-weighted means. This procedure preserves the operational X-Y plan support while converting the vertically discretized regularized model into a layer-wise strip accounting unit suitable for panel-scale material accounting, mineability filtering, and stripping-ratio calculations. The use of 3D mining prototypes allowed the original block model to conform to the planned mining geometry, resulting in block dimensions and spatial alignment consistent with the panel layout. This step aligns subsequent analyses with mining layouts and operational constraints rather than with purely geological discretization.
Regularization results in a geometrically consistent block model in which grades, thicknesses, and volumes can be aggregated without introducing artificial geometric distortion. This alignment is critical for downstream evaluations that depend on mining unit geometry, including recoverable resource delineation, stripping ratio calculation, and material balance analysis.
The resulting strip dataset provides the basis for subsequent mineability filtering, stripping ratio mapping, and assessment of mining selectivity across the panel. By linking prototype-based regularization with layer-constrained vertical aggregation, this step converts the geological block model into an operationally interpretable material-accounting dataset.
3.5. Panel-Scale Material Accounting and Mineability Filtering
To limit disclosure of confidential operational quantities, panel-scale material-accounting results are presented here in relative rather than absolute terms. As noted in Section 2.10, the terms ‘resource,’ ‘recoverable resource,’ and ‘residual ore’ are used here exclusively in an operational material-accounting sense and carry no implications under international mineral reporting codes. After estimation, regularization, and strip creation, the modeled phosphate-bearing material was partitioned at the strip scale into resources, recoverable resources, and residual ore using the operation-specific mineability criteria described in Section 2.10. Figure 9 shows the strip-scale spatial distribution of these three material categories, expressed relative to total panel resources, whereas Table 6 summarizes their layer-wise percentage distribution within each material category. All reported material quantities are aggregated at the strip-scale (40 m × 100 m plan footprint per layer), which constitutes the operational accounting support of the workflow; they should not be interpreted as reflecting grade or volume precision at the finer geological parent-block discretization.
Figure 9.
Strip-scale spatial distribution of panel material categories: (a) resources, (b) residual ore, and (c) recoverable resources. Percentages shown in the panels are expressed relative to total panel resources.
Table 6.
Layer-wise distribution of total resources, recoverable resources, and residual ore, expressed as percentage shares within each material category, together with in-layer recovery values.
Figure 9 shows that the three material categories are not distributed uniformly across the panel. The resource model preserves the full spatial continuity of the phosphate-bearing layers, whereas the recoverable resource model remains concentrated in the main productive zones that satisfy the applied operational criteria. In contrast, residual ore appears in more localized and discontinuous zones, reflecting the selective exclusion of material that fails the adopted thickness or grade thresholds. This spatial contrast indicates that mineability filtering affects only specific parts of the panel rather than the modeled inventory uniformly.
The layer-wise percentage summaries in Table 6 clarify the stratigraphic contribution of each material category. F3 remains the dominant contributor to both total resources and recoverable resources, followed by L01 and L2, confirming the importance of the thick and laterally continuous layers in the panel inventory. By contrast, the residual ore fraction is concentrated mainly in F3, F2, and L2, which together account for the predominant share of residual material. This reflects the combined effect of their large resource volumes (particularly F3) and their partial failure of the applied mineability criteria, indicating that these units are most strongly affected by the operational thickness and grade thresholds. The in-layer recovery values further show that most layers are recovered almost entirely under the current criteria, whereas F2 exhibits the lowest recovery efficiency.
3.6. Stripping Ratio Maps
Strip-based stripping ratio maps were generated to evaluate spatial variability in waste-to-ore relationships across the panel at an operationally relevant scale. The maps quantify volumetric, tonnage-based, BPL-tonnage-based, and thickness-based stripping ratios derived from the strip models, providing a direct measure of mining selectivity and waste generation intensity.
Summary statistics for the computed stripping ratios are presented in Table 7. Volumetric stripping ratios range from 0.88 to 7.75, with a panel-wide mean of 1.69. Tonnage stripping ratios vary between 0.55 and 4.84, with a mean value of 1.06, while BPL tonnage stripping ratios range from 1.08 to 10.21, averaging 1.95. Thickness-based stripping ratios are identical to volumetric stripping ratios in both range and mean, which reflects the mathematical equivalence of the two metrics under the adopted strip-matched spatial framework where ore and waste share the same horizontal footprint. Similarly, the ore-tonnage stripping ratio is a density-scaled transformation of the volumetric ratio given the uniform ore density of 1.6 t/m3 applied across all strips. The BPL-tonnage stripping ratio is the metric that introduces grade-dependent information and therefore exhibits a distinct range and mean.
Table 7.
Stripping ratio summary.
Spatial analysis of the stripping ratio maps reveals pronounced heterogeneity across the panel (Figure 10). Lower stripping ratios are predominantly concentrated in the northern portion of the panel, indicating favorable mining conditions characterized by thinner overburden, reduced interburden development, and higher proportions of recoverable ore. In contrast, the southeastern sector exhibits systematically higher stripping ratios. This increase is primarily driven by thicker overburden and more developed interburden sequences, resulting in elevated waste removal requirements per unit of extracted ore.
Figure 10.
Strip-based stripping ratio maps showing spatial variability across the panel: (a) ore tonnage stripping ratio; and (b) BPL tonnage stripping ratio.
Several strips display no classified recoverable resources and are represented as gray cells on the stripping ratio maps. These strips correspond to locations where the entire vertical column is classified as waste or residual material, reflecting either sub-economic grades, insufficient mining thickness, or unfavorable geometric conditions. Their spatial distribution highlights zones where extraction would be dominated by waste handling and is therefore operationally unattractive under current criteria.
Overall, the stripping ratio maps provide a spatially explicit framework for identifying zones of favorable and unfavorable mining conditions at the strip-scale. Beyond their conventional application in cost estimation and scheduling, these maps offer critical insight into how overburden thickness, ore continuity, and residual material distribution interact spatially across the panel. This information directly supports subsequent analyses related to selective mining, waste handling strategies, and the evaluation of material flow configurations discussed in Section 4.
4. Implications of the Results
Sedimentary phosphate mining generates large volumes of mining waste rock, including overburden, interburdens, and residual ore, which are commonly managed through mixed dumping practices. While operationally efficient, mixed dumping irreversibly homogenizes heterogeneous material streams, resulting in extensive surface disposal footprints and long-term environmental burdens. Recent syntheses of the sedimentary phosphate industry emphasize that both mining and downstream processing produce substantial quantities of solid wastes and identify emerging circularity opportunities, including recovery of residual phosphorus and reuse of mining waste rock in civil engineering and building materials. At the same time, these studies highlight persistent barriers to implementation, notably technical and economic constraints, regulatory limitations, and knowledge gaps [4].
Within this context, the results of this study provide a panel-scale, 3D quantification of ore, residual ore, and waste rock based on operational mining codes. It is emphasized that the present study does not explicitly model waste rock lithology, mineralogy, or physical and chemical properties. The implications discussed in this section are therefore conceptual and conditional, derived from mining-code-based panel-scale material accounting and supported by evidence reported in the literature. The objective is not to demonstrate technical or economic feasibility of specific waste valorization pathways, but to show how panel-scale 3D material accounting provides a preliminary geological and spatial framework that can support future scenario-based evaluation of selective dumping strategies and potential material reuse options. The following subsections discuss relevant material categories reported in the literature and indicate how the present workflow could support future assessment once mining codes are integrated with lithological interpretation and material characterization.
4.1. Residual Ore
Residual ore constitutes a distinct fraction of mining waste rock that retains measurable phosphate content but is excluded from recoverable resources due to thickness constraints, operational selectivity, or cut-off grade criteria. The literature highlights that residual phosphate contained in mining waste rock may become technically and economically relevant under alternative beneficiation routes, revised cut-off grades, or future market conditions. However, these studies also stress that such opportunities are critically dependent on upstream material handling. Once residual ore is co-disposed with barren waste through mixed dumping, subsequent recovery becomes impractical regardless of technological advances [4].
Implication for this study: the quantified residual ore volumes should be interpreted as a potentially recoverable inventory subject to future technical and economic evaluation rather than as material that must necessarily be treated as terminal waste. The panel-scale accounting established here provides a basis for future scenario analyses in which residual ore could be preserved through selective stockpiling rather than irreversibly diluted at the dumping stage.
4.2. Limestone-Rich Waste Rock
Limestone-dominated waste rock is one of the most abundant by-products of sedimentary phosphate mining. Multiple studies demonstrate that carbonate-rich phosphate waste rock exhibits geotechnical and environmental properties suitable for use as construction aggregates, road base materials, and embankment fill, if grading and contamination are controlled [18]. Additional studies indicate that carbonate-rich waste rock may also serve as a raw material in cement and binder systems, either as a limestone substitute or as an alkaline component, contributing to reduced environmental footprint in construction materials [19].
Implication for this study: the panel-scale material-accounting framework developed here provides the spatial basis on which future lithology-linked classification of limestone-rich waste rock could be evaluated for selective handling and potential construction-related valorization pathways.
4.3. Marly Waste Rock
Marl-rich waste rock occupies an intermediate compositional domain between limestone and clay and has been extensively studied for construction and binder applications. Research demonstrates that marls derived from phosphate mining waste rock can be used in embankments and road layers and, following calcination, as components of alternative binder systems with acceptable mechanical performance [20].
These studies emphasize that the suitability of marly waste rock for such applications is highly sensitive to mineralogical consistency and particle size distribution. Mixed dumping practices degrade this consistency by blending marly units with clay-rich fines or coarse carbonate blocks, reducing the technical feasibility of reuse.
Implication for this study: marly waste rock represents a potentially relevant future material class within sedimentary phosphate waste streams. The panel-scale material-accounting framework developed here could support future selective handling assessments once mining-code information is integrated with lithological and material-characterization data sufficient to distinguish marl-dominated units.
4.4. Clay-Rich Waste Rock
Clay-rich waste rock layers are frequently encountered within interburden sequences of sedimentary phosphate deposits. Numerous studies document the transformation of clay-rich phosphate mining waste rock into fired bricks and alkali-activated construction materials exhibiting adequate strength, durability, and thermal performance when processed under controlled conditions [21,22].
The literature consistently reports that clay-based valorization pathways require strict control of mineralogy, fines content, and contamination. Mixing clay-rich waste rock with carbonate- or flint-rich materials through conventional dumping practices compromises these requirements and significantly limits reuse potential.
Implication for this study: clay-rich waste rock represents a technically documented secondary resource stream, but its evaluation within the present case study remains conditional on future integration of lithological classification and material characterization capable of distinguishing clay-rich units within the panel-scale framework.
4.5. Flint- and Siliceous-Rich Waste Rock
Siliceous and flint-rich waste rock units have been investigated as alternative aggregates for concrete production. Experimental studies demonstrate that flint extracted from phosphate mine waste rock exhibits suitable hardness, abrasion resistance, and mechanical properties for concrete aggregates [19].
However, these studies also note that flint aggregate quality is highly sensitive to fines contamination and grading degradation. Mixed dumping increases the presence of clayey fines and carbonate fragments, which adversely affects concrete performance.
Implication for this study: the present workflow does not by itself identify flint-rich waste rock streams. Rather, it provides the spatial framework within which future lithology-linked classification could be used to assess whether flint-rich units can be preserved through selective handling for potential aggregate-based valorization.
4.6. Conceptual Implications for Selective Dumping Strategies
The reviewed literature converges on a common conclusion: although the technical feasibility of mining waste rock valorization has been demonstrated for multiple material categories, practical implementation is fundamentally constrained by upstream material handling decisions at the mining stage. Under conventional mixed dumping practices, heterogeneous waste rock streams are irreversibly combined, which eliminates material separability, increases contamination, and effectively forecloses future recovery or reuse options.
An important observation in this context is that the mining-code classification adopted in this study, derived from Boujo’s lithostratigraphic framework, already carries an implicit lithological characterization for each interburden unit. Calcareous, marly, and clay-rich interburdens correspond to distinct mining codes within the panel stratigraphy. Because the layer-wise strip accounting developed here preserves the spatial identity of each coded unit at the 40 m × 100 m strip-scale, the resulting dataset already constitutes a first-order spatial basis for waste stream separation by lithological class—without requiring additional drilling or material characterization beyond what has been compiled. This connection between the mining-code framework and the lithological identity of interburdens substantially strengthens the foundation for selective dumping assessment, as the spatial distribution of each waste class is already implicitly encoded in the strip model.
By distinguishing ore, residual phosphate-bearing material, and waste at the strip-scale, the panel-scale model enables a schematic comparison between two contrasting material-flow configurations derived from the same geological framework (Figure 11). In the mixed dumping configuration (Figure 11B), waste and residual ore materials are deposited into a single dump, resulting in dilution of residual phosphate and loss of material identity. In contrast, the selective dumping configuration (Figure 11C) illustrates how material streams could be segregated into separate deposition zones once mining-code information is integrated with future lithological and material-characterization data. The selective categories shown in Figure 11C should therefore be interpreted as conceptual future handling classes rather than as fully resolved lithological outputs of the present study.
Figure 11.
Schematic conceptual comparison of mixed dumping and selective dumping strategies.
It is emphasized that the schematic comparison illustrated in Figure 11 does not imply immediate operational feasibility or economic advantage. Rather, it shows how the panel-scale 3D modeling framework developed in this study provides the geological and spatial information required to support future scenario-based assessment. Such assessment may integrate lithological classification, material characterization, mining space constraints, equipment logistics, and cost- or value-based indicators to compare mixed dumping and selective dumping strategies under realistic operational conditions.
4.7. Foundation for Future Scenario-Based Assessment
The implications of this study should be viewed as foundational rather than prescriptive. The present work does not include economic evaluation, equipment scheduling, or operational scenario testing. Instead, it establishes the geological and spatial framework required to support future scenario-based assessment in sedimentary phosphate mining. By quantifying ore, residual ore, and waste rock at strip-scale using a mining-code-based 3D model, the study provides the material accounting structure needed for subsequent evaluation of alternative material handling scenarios.
Regarding the degree of automation of the proposed workflow, it is useful to distinguish between steps that necessarily require geological judgement and those that are fully or largely scriptable. Wireframe construction and stratigraphic correlation require interpretation of borehole logs and manual digitization of stratigraphic horizons, and these steps necessarily involve geological expertise. Variographic modelling similarly requires expert judgement in selecting directional search parameters, interpreting experimental variogram behaviour, and fitting theoretical models. Outlier review also benefits from geological context beyond what automated screening can provide. In contrast, the downstream computational steps—block coding within wireframe-constrained domains, grade estimation, block model regularization, strip aggregation, mineability filtering, and stripping-ratio calculation—are fully scriptable and were implemented through a structured sequence of parametric operations within the modelling environment. Once the geological framework is established for a given panel, these scripted components can be applied to adjacent panels with limited additional manual intervention, which supports the transferability of the workflow to other panels within the same deposit.
Future work will extend this framework by incorporating detailed lithological classification derived from drilling logs and pit mapping, together with physical and chemical characterization of interburdens. These additions would allow comparison of mixed and selective dumping scenarios under realistic operational constraints such as haulage distances, rehandling requirements, dump sequencing, equipment productivity, and market demand for secondary material streams.
Within this context, the contribution of the present study lies in structuring a panel-scale workflow that links mining-code-based geological modeling, block regularization, strip aggregation, and material classification within panel mining geometry. Its significance is therefore integrative and operational: it combines established geological modeling, geostatistical estimation, and material accounting methods within a panel-scale framework aligned with mining geometry, rather than introducing algorithmically novel individual components. The workflow provides a basis for future scenario-based assessment of selective dumping and related waste-management alternatives, but does not by itself establish their technical or economic feasibility.
A further limitation of the present workflow is its deterministic nature: wireframe geometry, grade estimation, mineability filtering, and material classification are all treated as fixed outputs without propagation of uncertainty. This is consequential particularly for strips located near the minimum thickness or minimum cut-off grade threshold, where small perturbations in the estimated grade or modelled layer thickness could shift material between the recoverable and residual categories. In such threshold-proximal strips, the deterministic classification should be treated with caution, as the true material category may be sensitive to estimation error and local geological variability. Future extensions of the workflow could address this limitation through conditional simulation of BPL grades within each layer domain, which would generate an ensemble of equally probable grade realisations and enable probabilistic mineability classification. Alternatively, a sensitivity analysis varying the applied thickness and grade thresholds within a plausible range would provide a practical indication of how robustly the central material-accounting conclusions hold without requiring full geostatistical simulation. Incorporating either approach would substantially strengthen the basis for operational decision support, particularly for material handling decisions in strips where classification confidence is low.
5. Conclusions
This study developed a mining-code-based 3D block-modeling workflow for panel-scale material accounting in a stratified sedimentary phosphate deposit. The wireframe validation results showed limited panel-scale stratigraphic bias and dispersion, providing the geometric basis for subsequent block modeling and strip-based analysis. Grade estimation was performed from borehole-layer composite assay data, whereas thickness and layer geometry were derived from the interpreted hanging wall and footwall surfaces. Each of these individual components (wireframe-based geological modeling, borehole-layer compositing, geostatistical estimation, block regularization, and mineability filtering) represents established practice in geological modeling and mine planning. The contribution of the study lies in their integration into a coherent panel-scale material-accounting workflow aligned with operational mining geometry and designed to support future selective dumping assessment.
The comparative evaluation of the estimation methods indicated that OK showed the closest overall agreement with the validation diagnostics considered in this study. It is noted that domain-level withheld-well samples of four to seven composites per domain do not permit statistically robust estimator comparison; the OK selection should therefore be understood as case-specific and consistent with the adopted domain framework rather than as a generalized demonstration of kriging superiority. After regularization of the mine plan and aggregation into strips, the resulting block models supported panel-scale material accounting and mineability filtering under operation-specific mineability criteria. This process also highlighted the occurrence of residual ore, which represents a phosphate-bearing inventory excluded by the applied operational criteria rather than by geological absence.
The strip-scale outputs further revealed spatial variability in waste-to-ore relationships across the panel and provided a quantitative basis for evaluating material distribution within a workflow aligned with mining geometry. Although the study does not address economic optimization, processing performance, or uncertainty propagation, it establishes a panel-scale workflow for material accounting that can support future scenario-based assessment of selective dumping and related material-handling alternatives. The deterministic nature of the workflow means that classification confidence is lowest in strips near the applied thickness and grade thresholds; future work incorporating conditional simulation or probabilistic mineability filtering would allow this uncertainty to be quantified and communicated to decision-makers.
Author Contributions
Conceptualization, N.B. and A.E.; methodology, N.B. and A.E.; software, N.B.; validation, A.E., Y.T. and M.B.; formal analysis, N.B.; investigation, N.B.; resources, M.B.; data curation, N.B.; writing—original draft preparation, N.B.; writing—review and editing, A.E., Y.T. and M.B.; visualization, N.B. and A.E.; supervision, A.E., Y.T. and M.B.; project administration, M.B.; funding acquisition, M.B. All authors have read and agreed to the published version of the manuscript.
Funding
This research was funded by OCP group through the UM6P SPGP CHAIR project (AS 189) in the framework of a Ph.D. thesis.
Data Availability Statement
Data will be made available on request.
Acknowledgments
The authors gratefully acknowledge the OCP Group for providing access to the data and for their support of this research.
Conflicts of Interest
The authors declare no conflicts of interest.
Abbreviations
The following abbreviations are used in this manuscript:
| BPL | Bone Phosphate of Lime |
| PR | Phosphate rock |
| NN | Nearest neighbor |
| IDW | Inverse distance weighting |
| OK | Ordinary kriging |
| HW | Hanging wall |
| FW | Footwall |
References
- Cordell, D.; White, S. Life’s bottleneck: Sustaining the world’s phosphorus for a food secure future. Annu. Rev. Environ. Resour. 2014, 39, 161–188. [Google Scholar] [CrossRef] [Scilit]
- Senthilkumar, K.; Mollier, A.; Delmas, M.; Pellerin, S.; Nesme, T. Phosphorus recovery and recycling from waste: An appraisal based on a French case study. Resour. Conserv. Recycl. 2014, 87, 97–108. [Google Scholar] [CrossRef] [Scilit]
- U.S. Geological Survey. Mineral Commodity Summaries 2024; U.S. Geological Survey: Reston, VA, USA, 2024.
- Taha, Y.; Elghali, A.; Hakkou, R.; Benzaazoua, M. Towards zero solid waste in the sedimentary phosphate industry: Challenges and opportunities. Minerals 2021, 11, 1250. [Google Scholar] [CrossRef] [Scilit]
- Siddiqui, F.I.; Pathan, A.G.; Ünver, B.; Tercan, A.E.; Hindistan, M.A.; Ertunç, G.; Atalay, F.; Ünal, S.; Kıllıoğlu, Y. Lignite resource estimations and seam modeling of Thar Field, Pakistan. Int. J. Coal Geol. 2015, 140, 84–96. [Google Scholar] [CrossRef] [Scilit]
- Jiskani, I.M.; Siddiqui, F.I.; Pathan, A.G. Integrated 3D geological modeling of Sonda-Jherruck coal field, Pakistan. J. Sustain. Min. 2018, 17, 111–119. [Google Scholar] [CrossRef] [Scilit]
- Tercan, A.E.; Ünver, B.; Hindistan, M.A.; Ertunç, G.; Atalay, F.; Ünal, S.; Kıllıoğlu, Y. Seam modeling and resource estimation in the coalfields of western Anatolia. Int. J. Coal Geol. 2013, 112, 94–106. [Google Scholar] [CrossRef] [Scilit]
- Hatton, W.; Fardell, A. New discoveries of coal in Mozambique—Development of the coal resource estimation methodology for International Resource Reporting Standards. Int. J. Coal Geol. 2012, 89, 2–12. [Google Scholar] [CrossRef] [Scilit]
- Kapageridis, I.K.; Kolovos, C.J. Modelling and Resource Estimation of a Thin-Layered Lignite Deposit Introduction and Deposit Description. 2009. Available online: https://www.researchgate.net/publication/242543987 (accessed on 5 January 2026).
- Deutsch, C.V.; Wilde, B.J. Modeling multiple coal seams using signed distance functions and global kriging. Int. J. Coal Geol. 2013, 112, 87–93. [Google Scholar] [CrossRef] [Scilit]
- Veress, E.; Andersson, J.B.H.; Popova, I.; Annesley, I.R.; Bauer, T.E. Three-Dimensional Geologic Modeling of the Kiruna Mining District, Sweden: Insights into the Crustal Architecture and Structural Controls on Iron Oxide-Apatite Mineralization. Econ. Geol. 2024, 19, 1089–1113. [Google Scholar] [CrossRef] [Scilit]
- Zhu, L.; Zhang, C.; Li, M.; Pan, X.; Sun, J. Building 3D solid models of sedimentary stratigraphic systems from borehole data: An automatic method and case studies. Eng. Geol. 2012, 127, 1–13. [Google Scholar] [CrossRef] [Scilit]
- Kaufmann, O.; Martin, T. Reprint of ‘3D geological modelling from boreholes, cross-sections and geological maps, application over former natural gas storages in coal mines’ [Comput. Geosci. 34 (2008) 278–290]. Comput. Geosci. 2009, 35, 70–82. [Google Scholar] [CrossRef] [Scilit]
- Lemon, A.M.; Jones, N.L. Building solid models from boreholes and user-defined cross-sections. Comput. Geosci. 2003, 29, 547–555. [Google Scholar] [CrossRef] [Scilit]
- Wycisk, P.; Hubert, T.; Gossel, W.; Neumann, C. High-resolution 3D spatial modelling of complex geological structures for an environmental risk assessment of abundant mining and industrial megasites. Comput. Geosci. 2009, 35, 165–182. [Google Scholar] [CrossRef] [Scilit]
- Soares, A. Geostatistical Estimation of Orebody Geometry: Morphological Kriging. Math. Geol. 1990, 22, 787–802. [Google Scholar] [CrossRef] [Scilit]
- Armand, B. Contribution à L’étude Géologique du Gisement de Phosphate Crétacé-Éocène des Ganntour (Maroc Occidental). Sci. Géologiques, Bull. Mémoires, 43, 227. Strasbourg, 1976. Available online: https://www.persee.fr/doc/sgeol_0302-2684_1976_mon_43_1 (accessed on 12 January 2026).
- Chlahbi, S.; Elghali, A.; Inabi, O.; Belem, T.; Zerouali, E.; Benzaazoua, M. Integrated approach to sustainable utilization of phosphate waste rock in road embankments: Experimental insights, stability analysis, and preliminary economic evaluation. Case Stud. Constr. Mater. 2024, 20, e03222. [Google Scholar] [CrossRef] [Scilit]
- El Berdai, Y.; Trauchessec, R.; Taha, Y.; Safhi, A.e.M.; Hakkou, R.; Benzaazoua, M. Assessing the Suitability of Phosphate Waste Rock as a Construction Aggregate. Buildings 2024, 14, 2375. [Google Scholar] [CrossRef] [Scilit]
- Safhi, A.e.M.; El Khesssaimi, Y.; Taha, Y.; Hakkou, R.; Benzaazoua, M. Calcined marls as compound of binary binder system: Preliminary study. Mater. Today Proc. 2022, 58, 1049–1053. [Google Scholar] [CrossRef] [Scilit]
- Mabroum, S.; Aboulayt, A.; Taha, Y.; Benzaazoua, M.; Semlal, N.; Hakkou, R. Elaboration of geopolymers based on clays by-products from phosphate mines for construction applications. J. Clean. Prod. 2020, 261, 121317. [Google Scholar] [CrossRef] [Scilit]
- Bayoussef, A.; Loutou, M.; Taha, Y.; Mansori, M.; Benzaazoua, M.; Manoun, B.; Hakkou, R. Use of clays by-products from phosphate mines for the manufacture of sustainable lightweight aggregates. J. Clean. Prod. 2021, 280, 124361. [Google Scholar] [CrossRef] [Scilit]
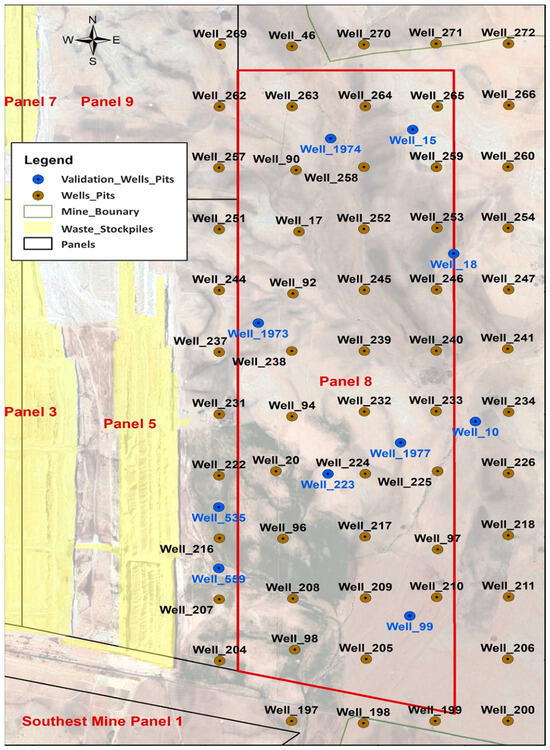
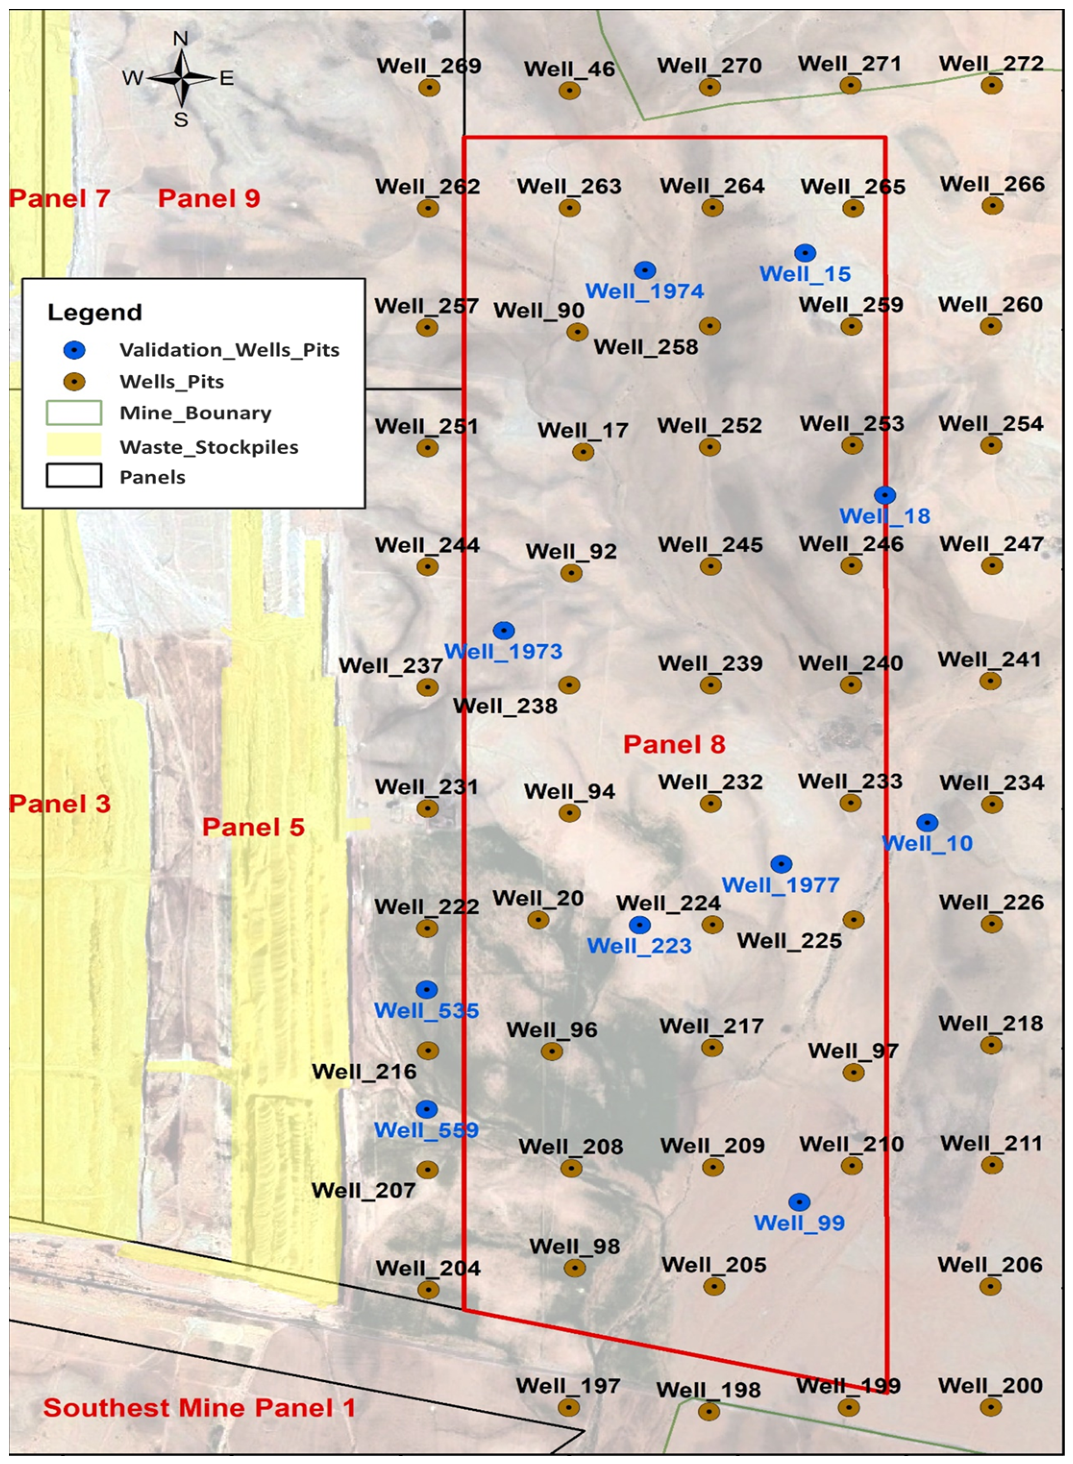
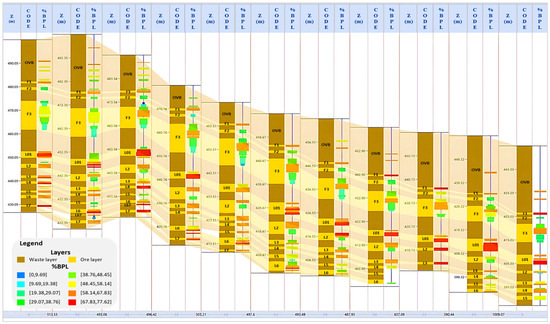
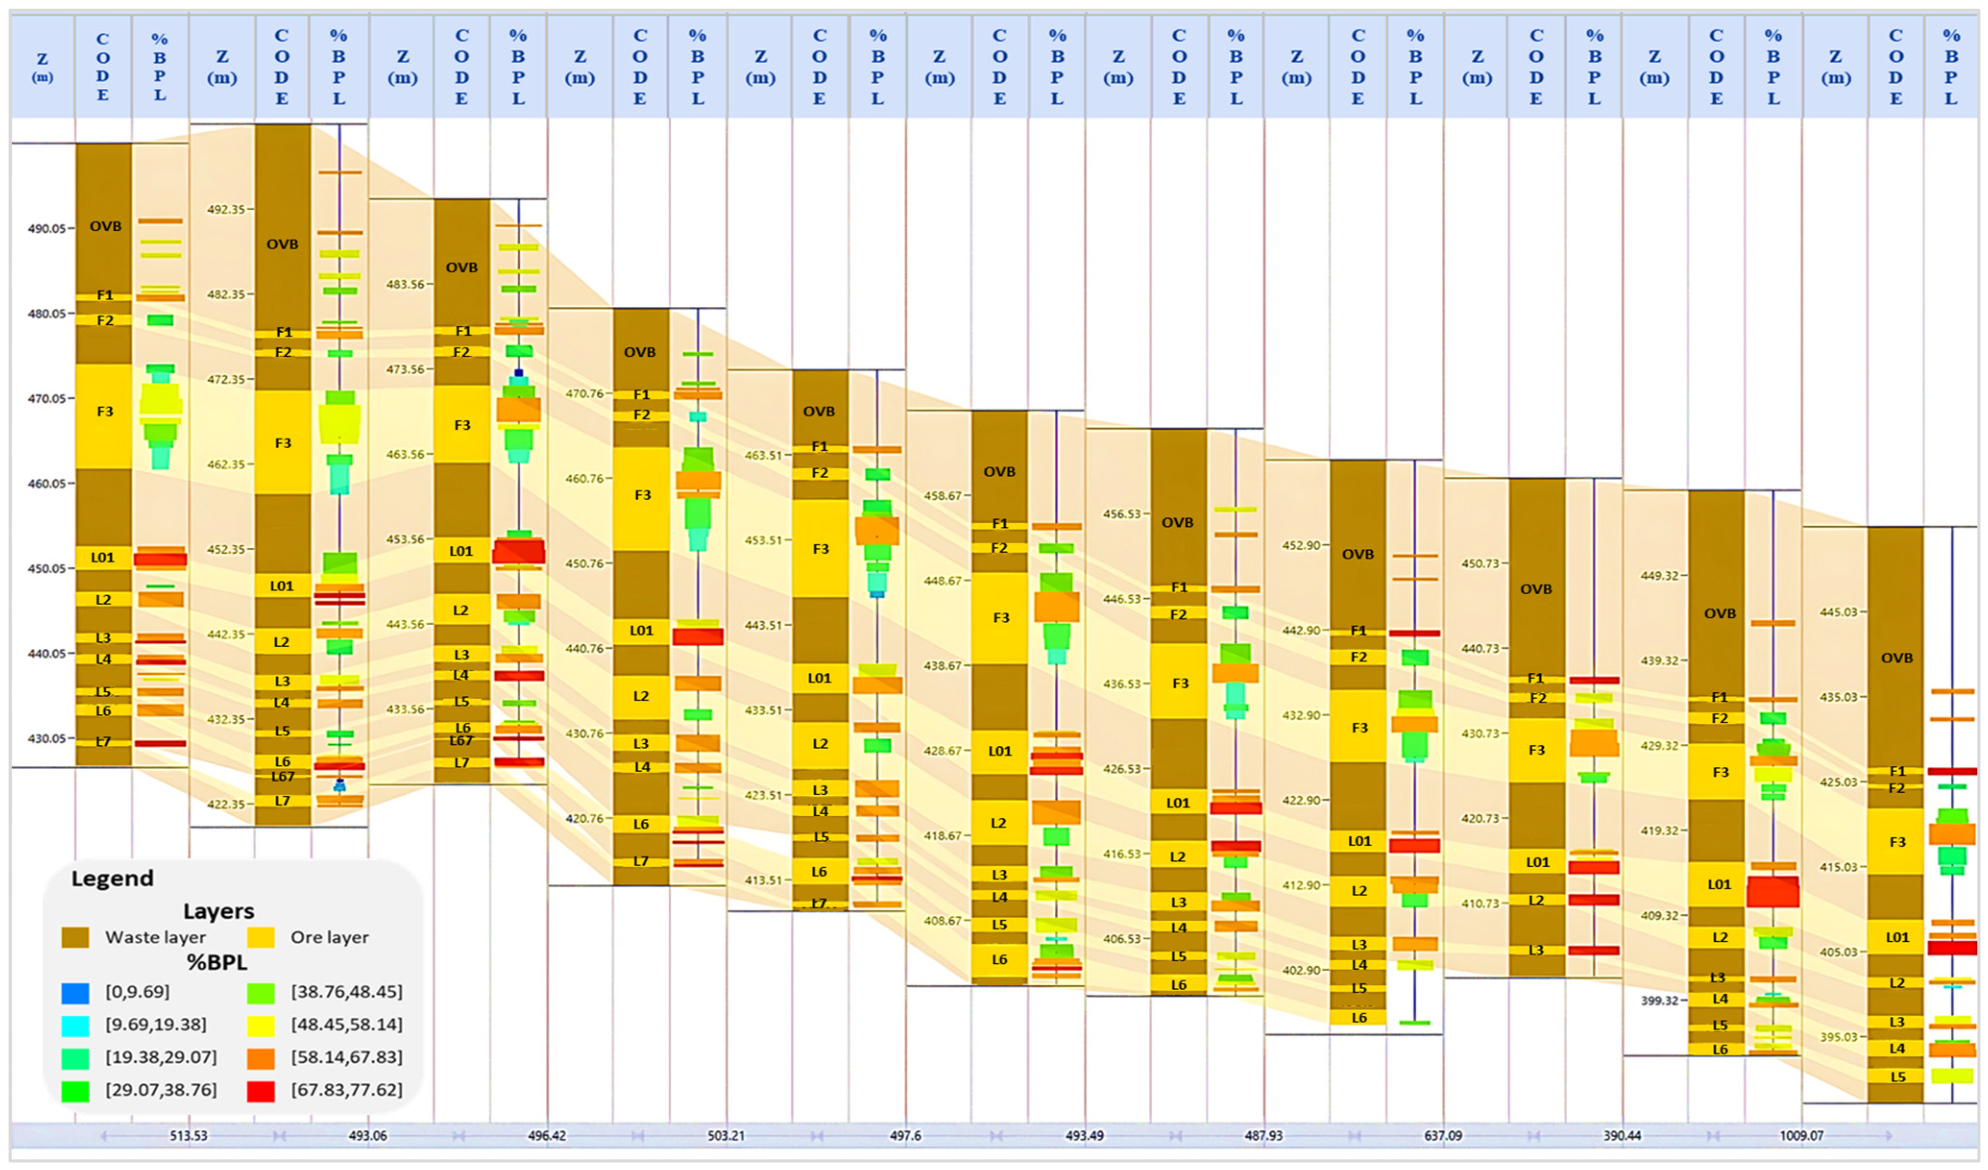
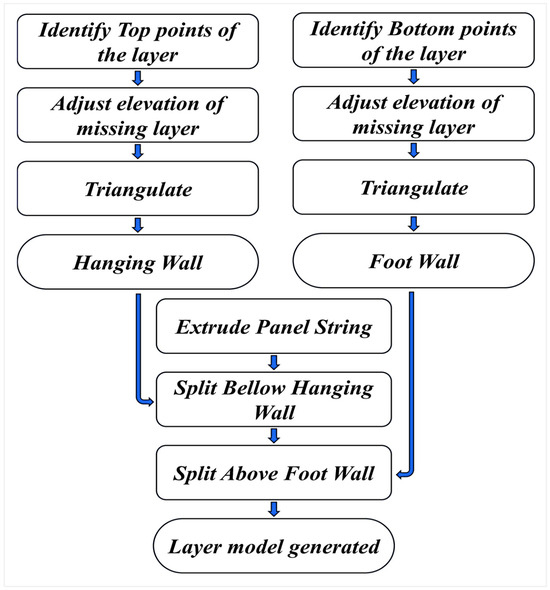
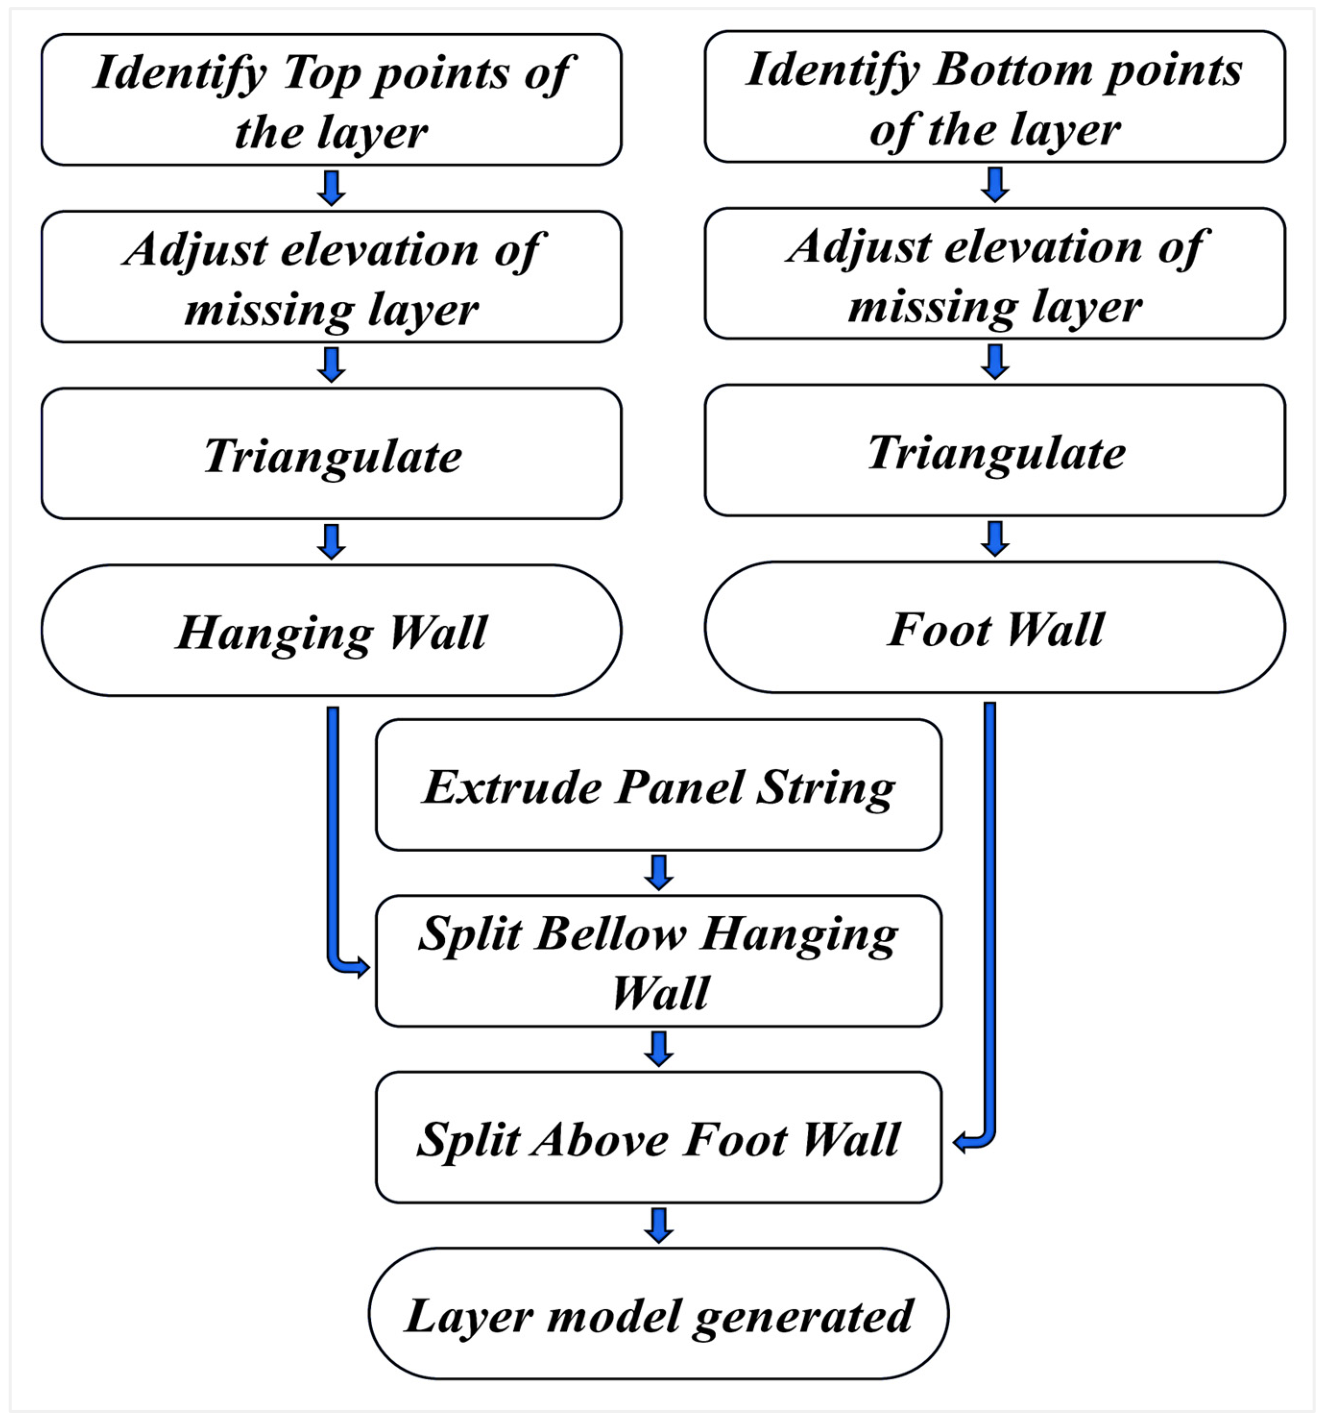
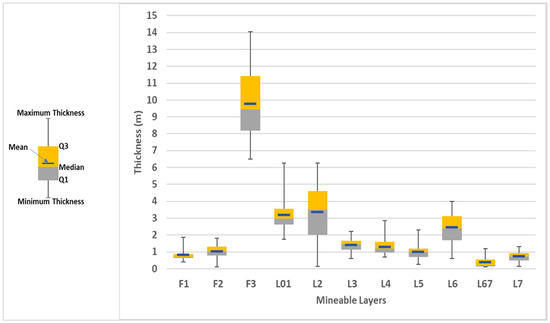
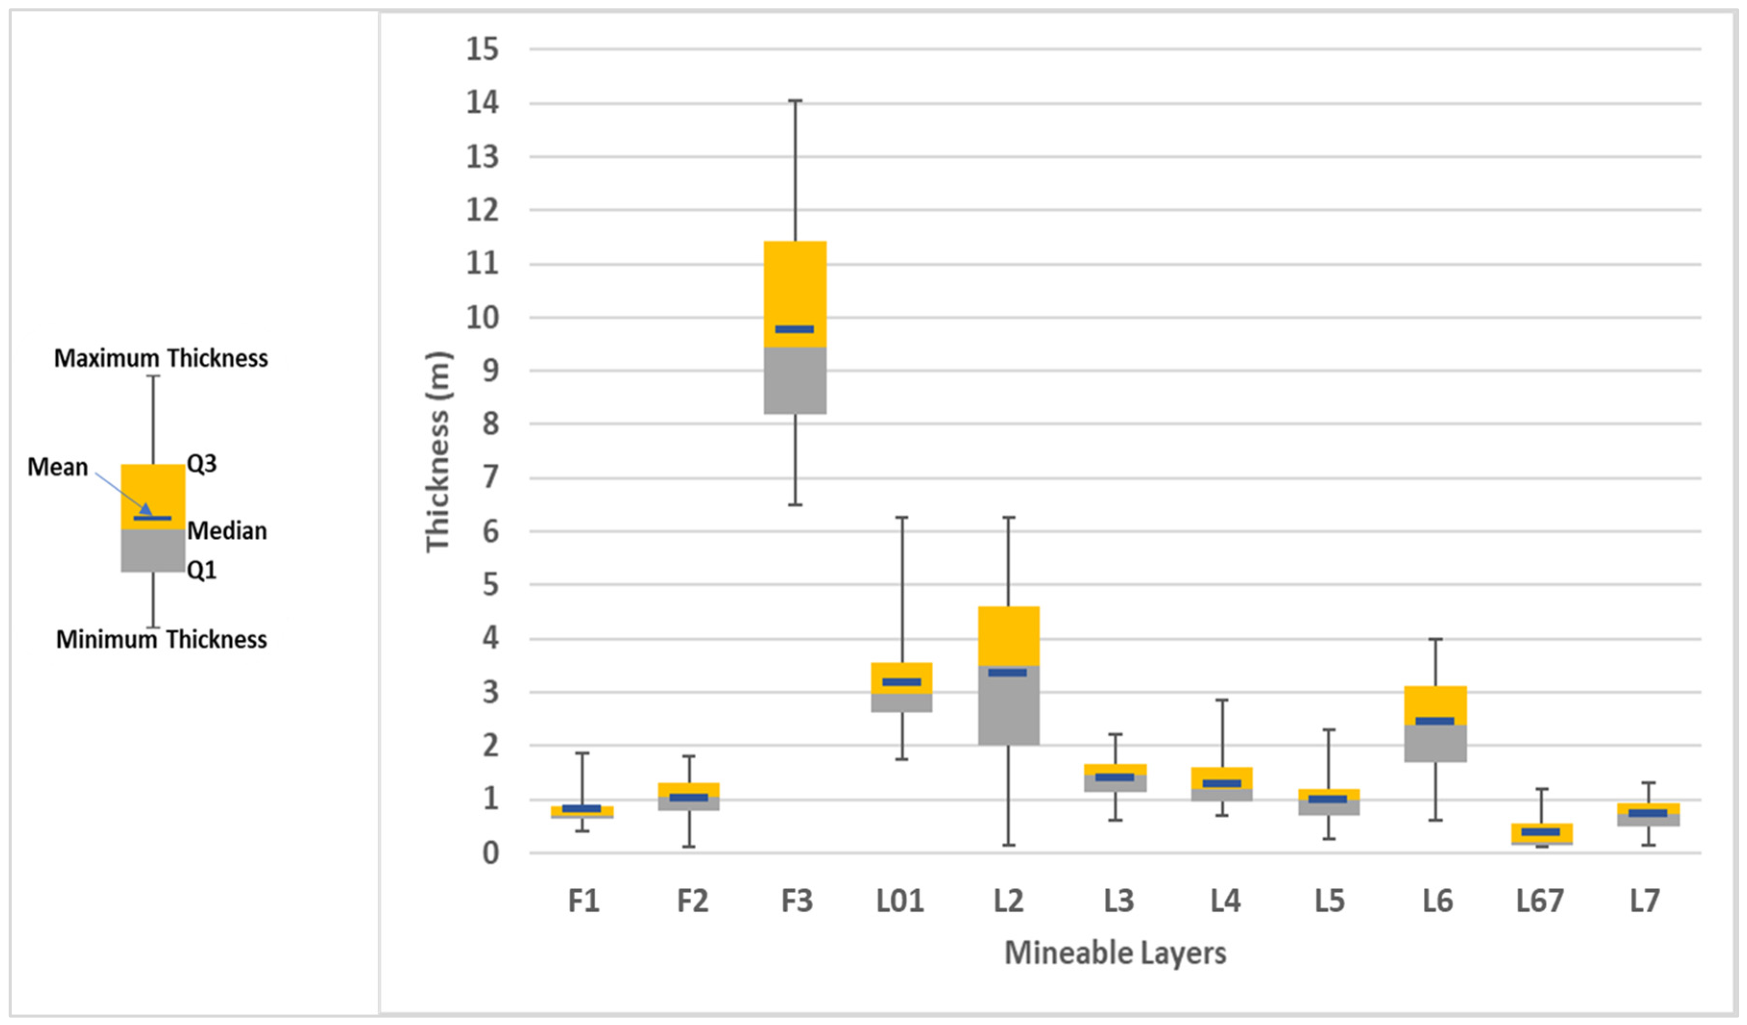
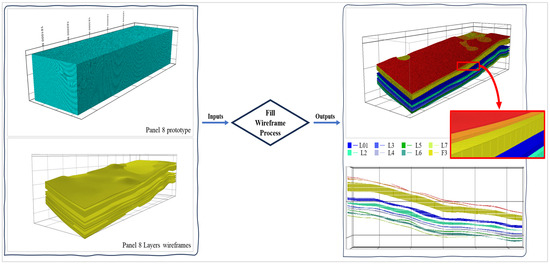
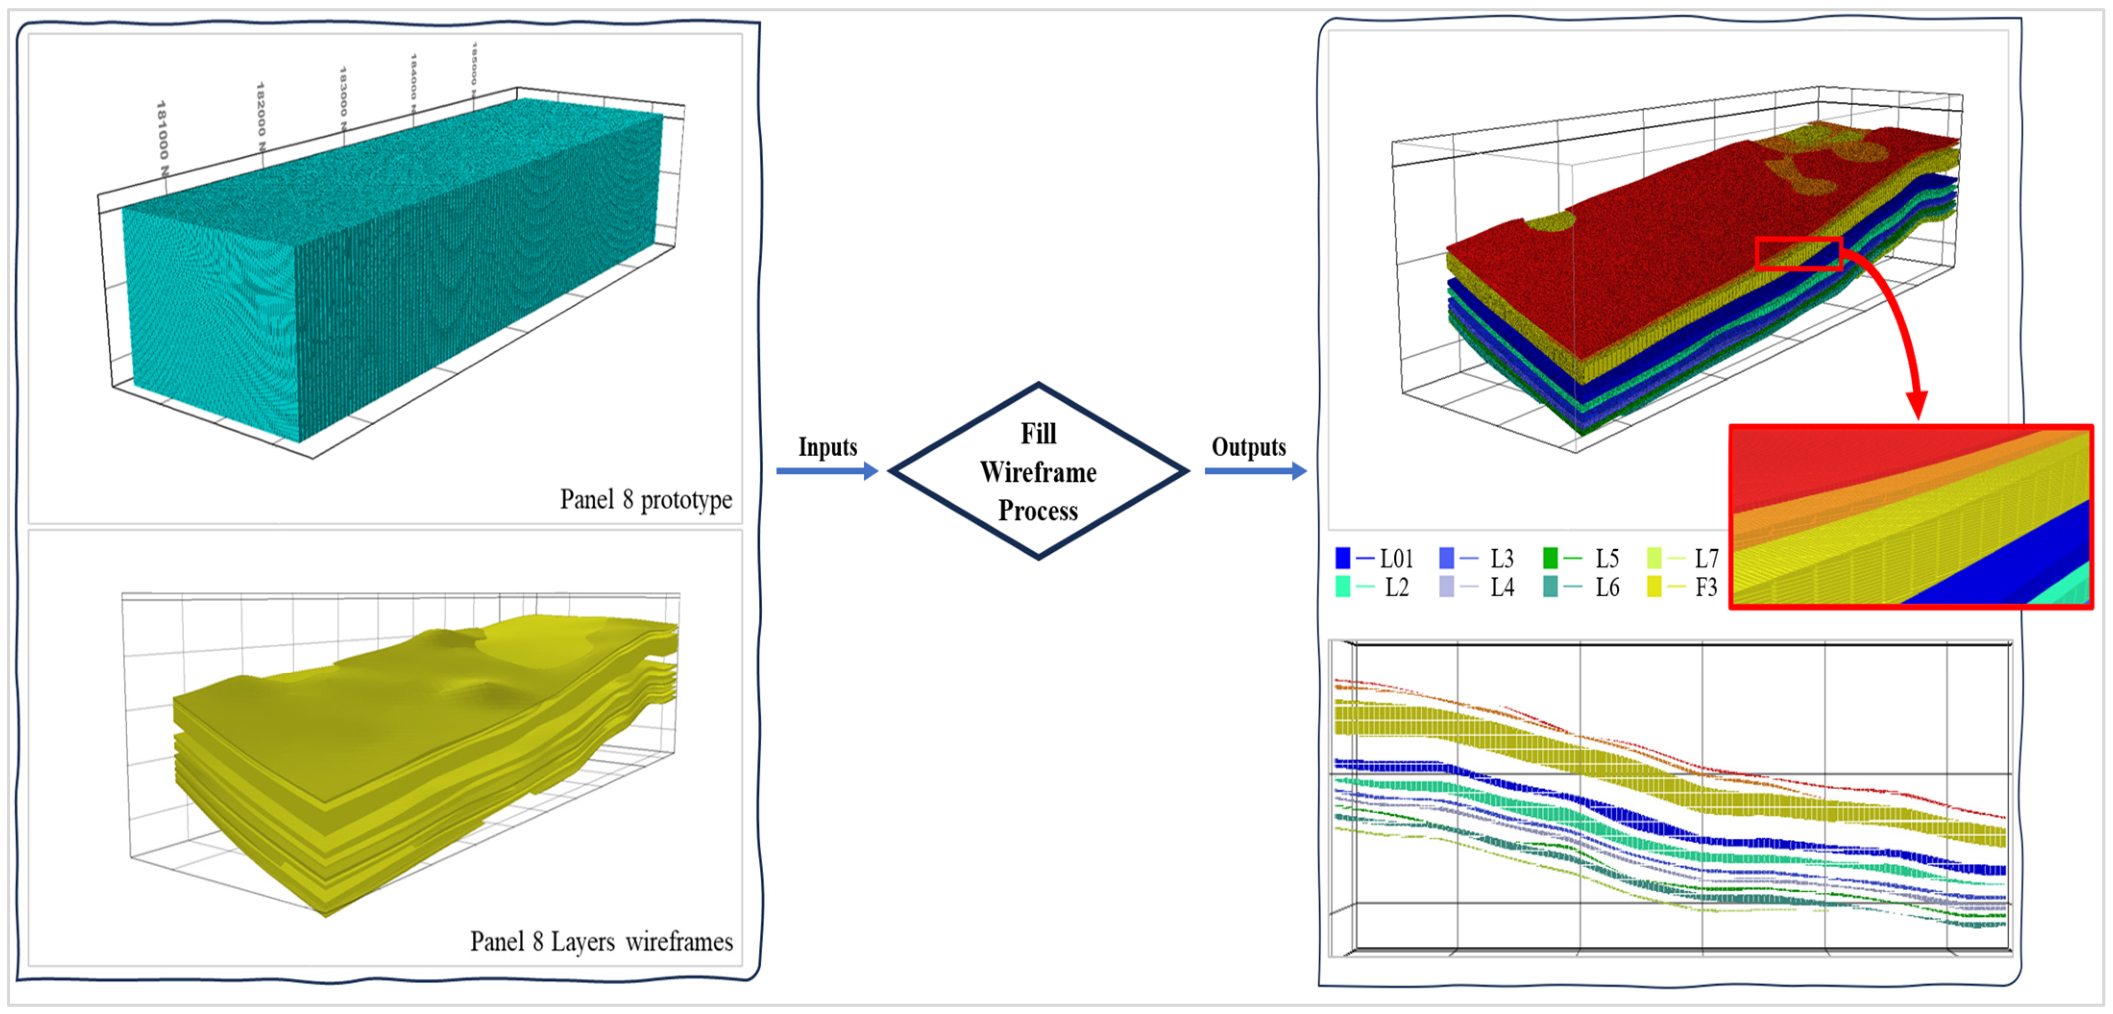
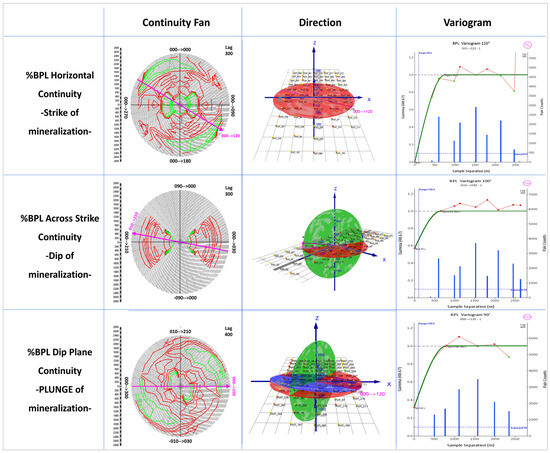
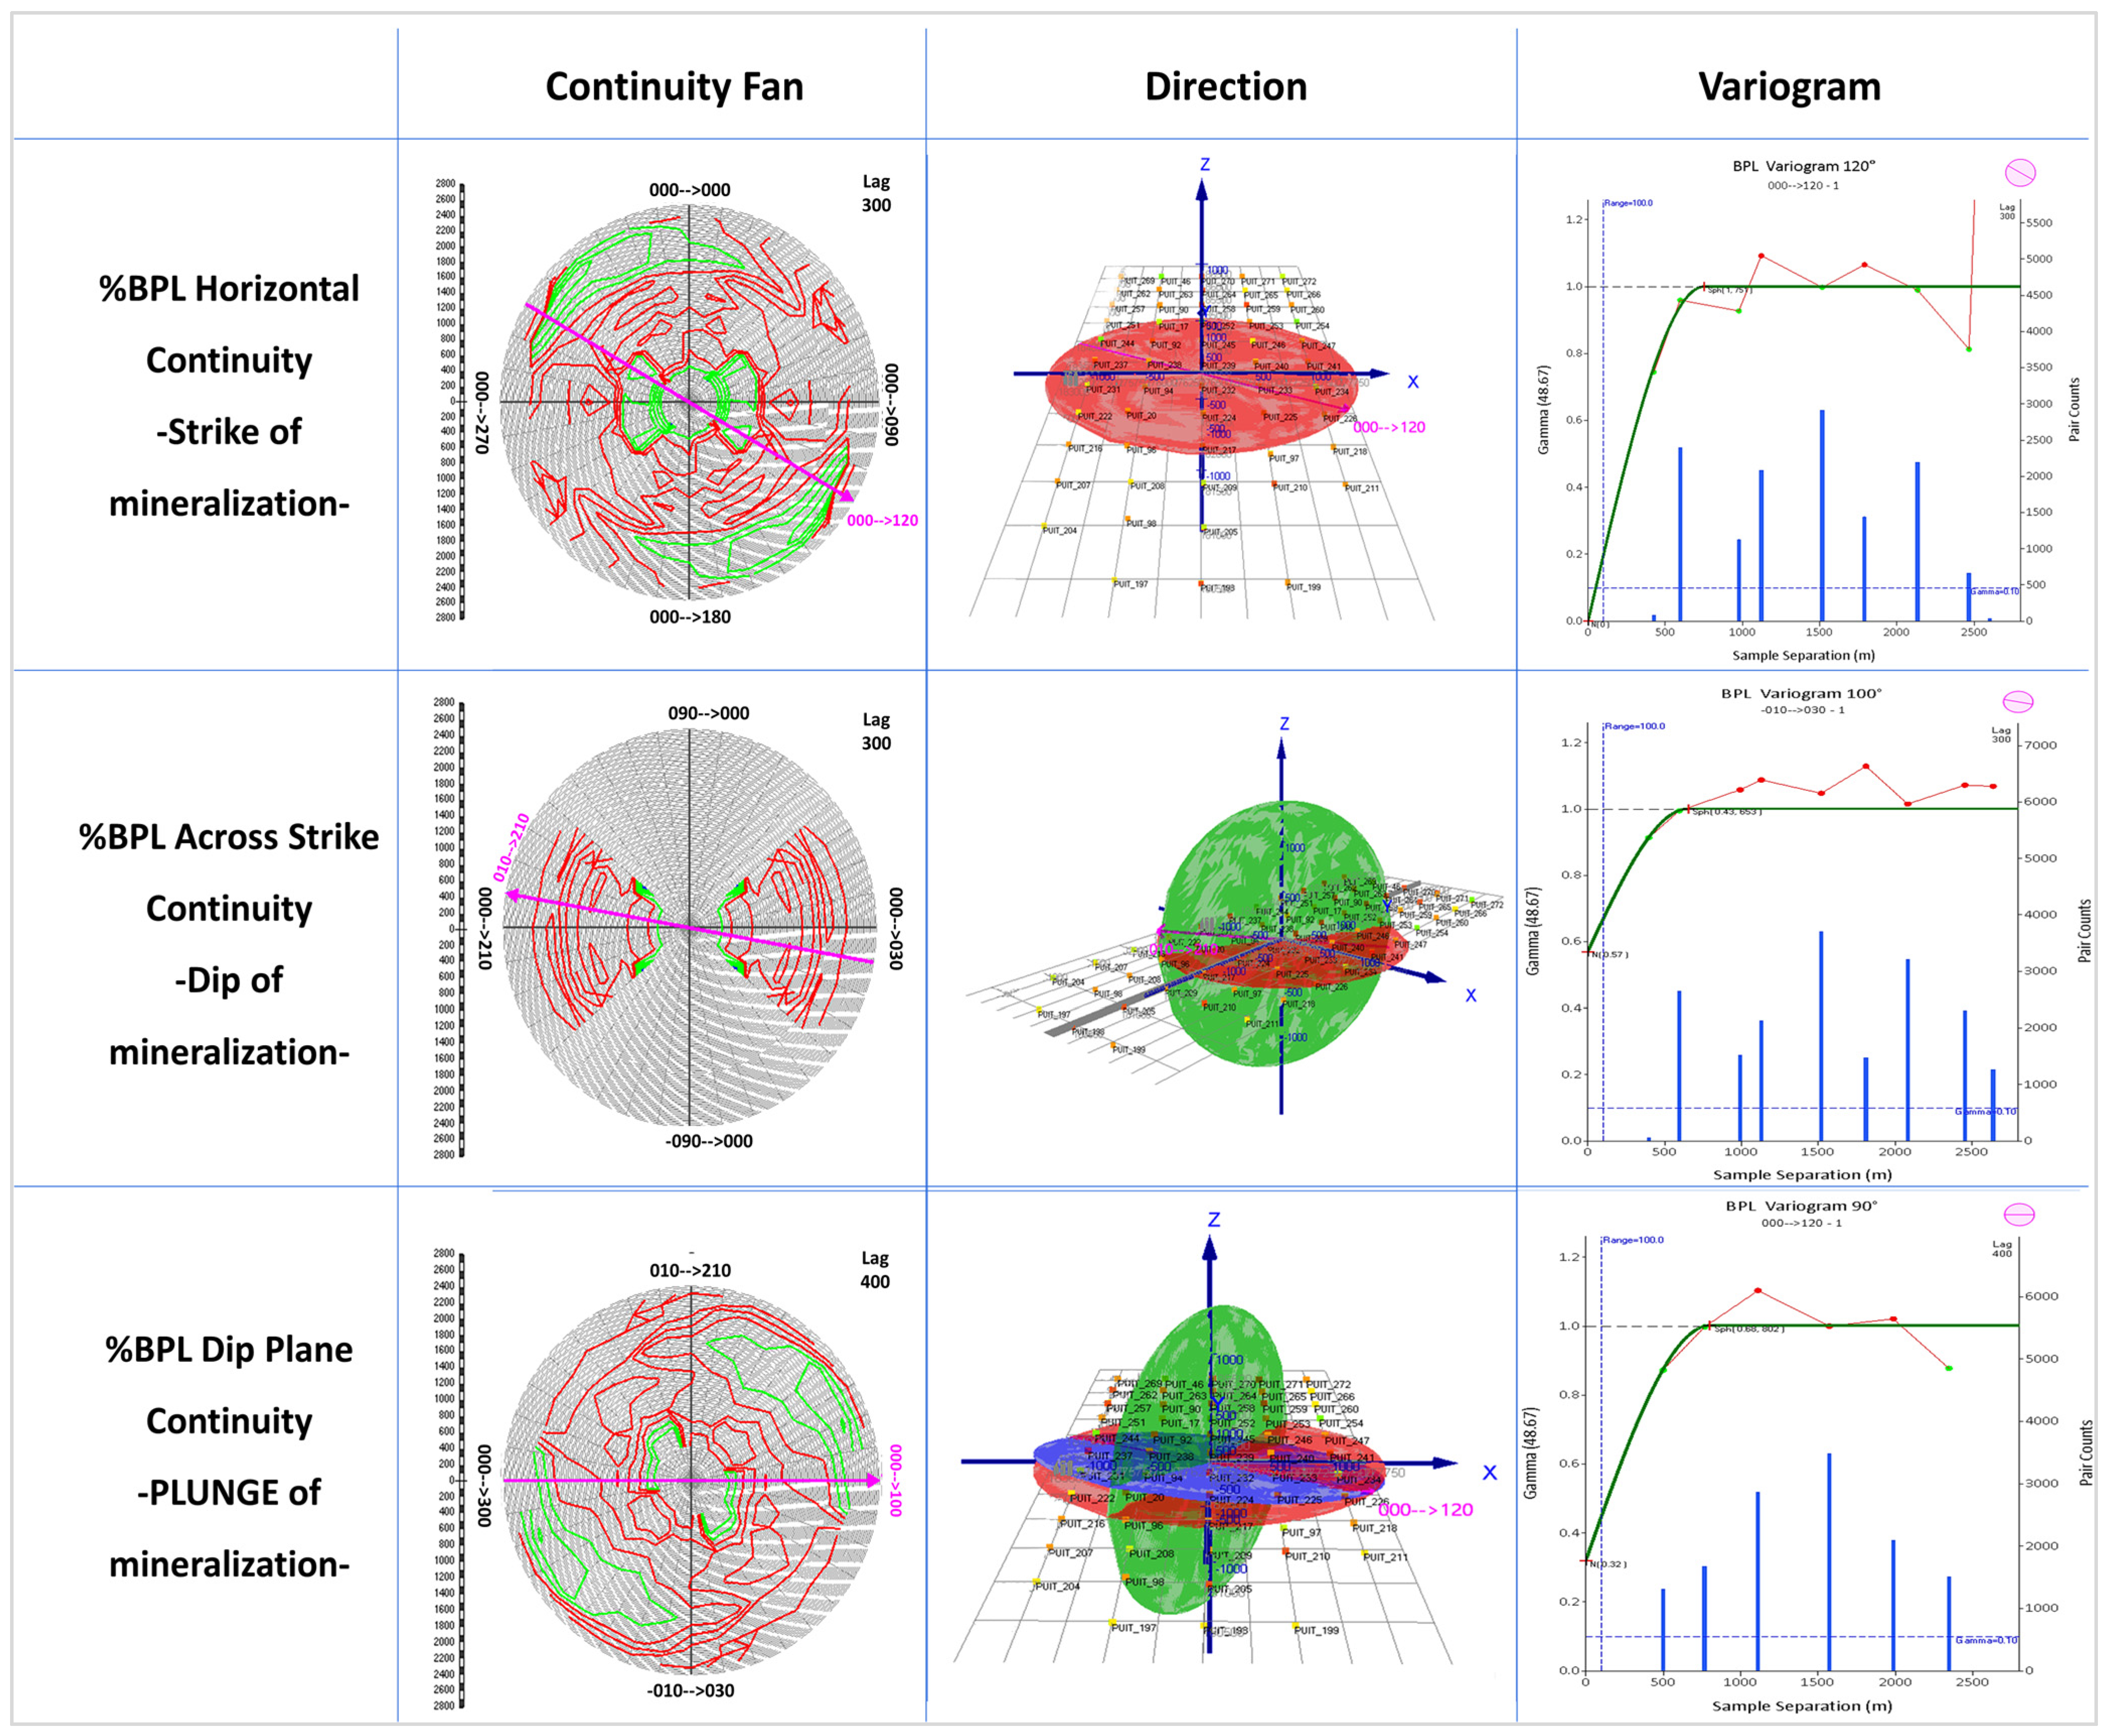
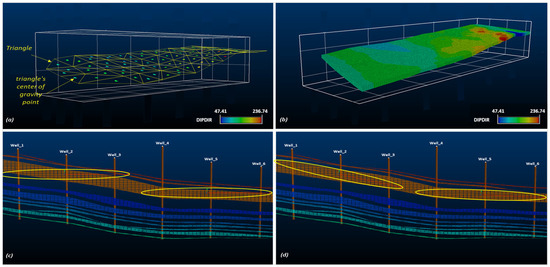
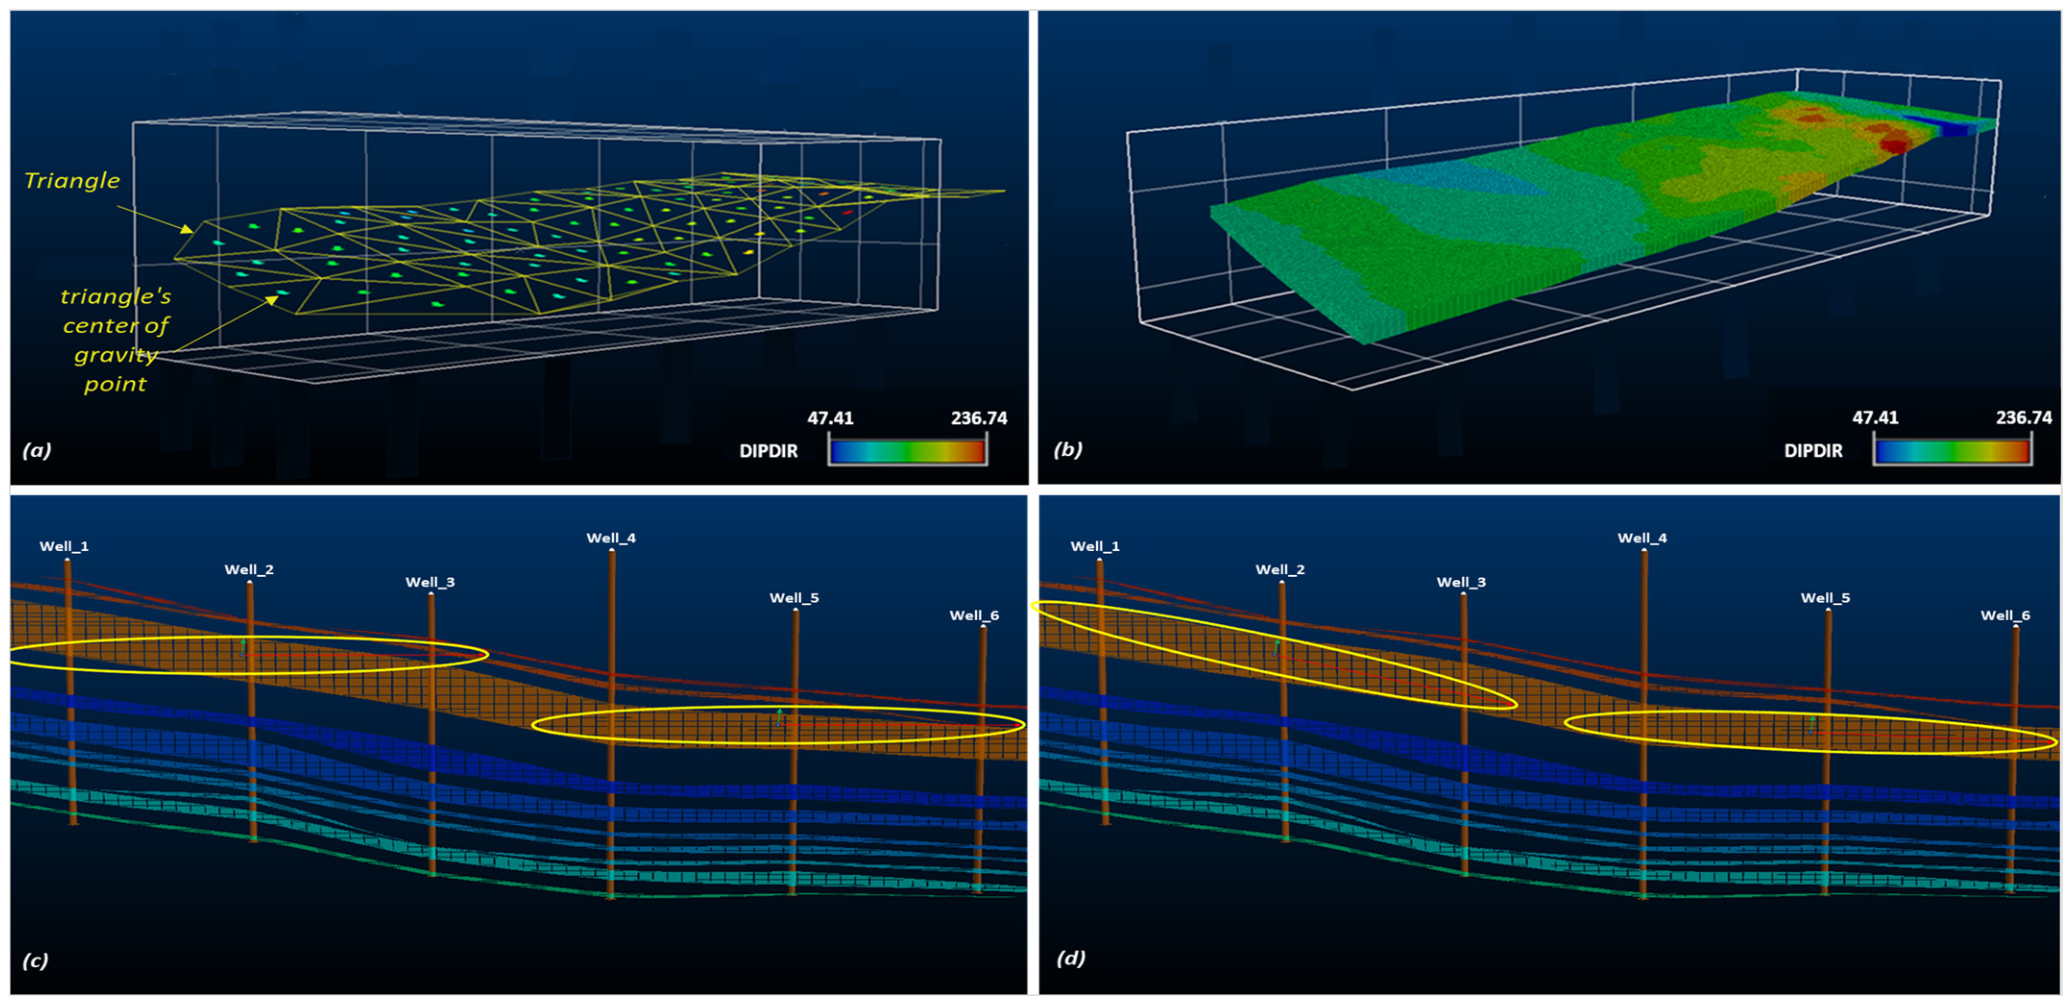
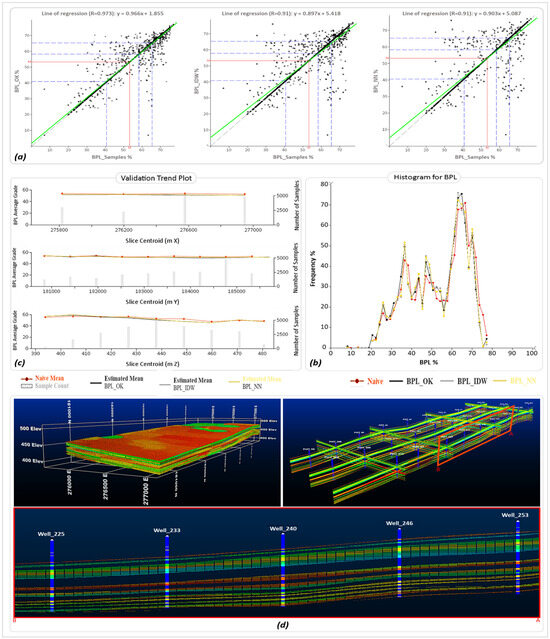
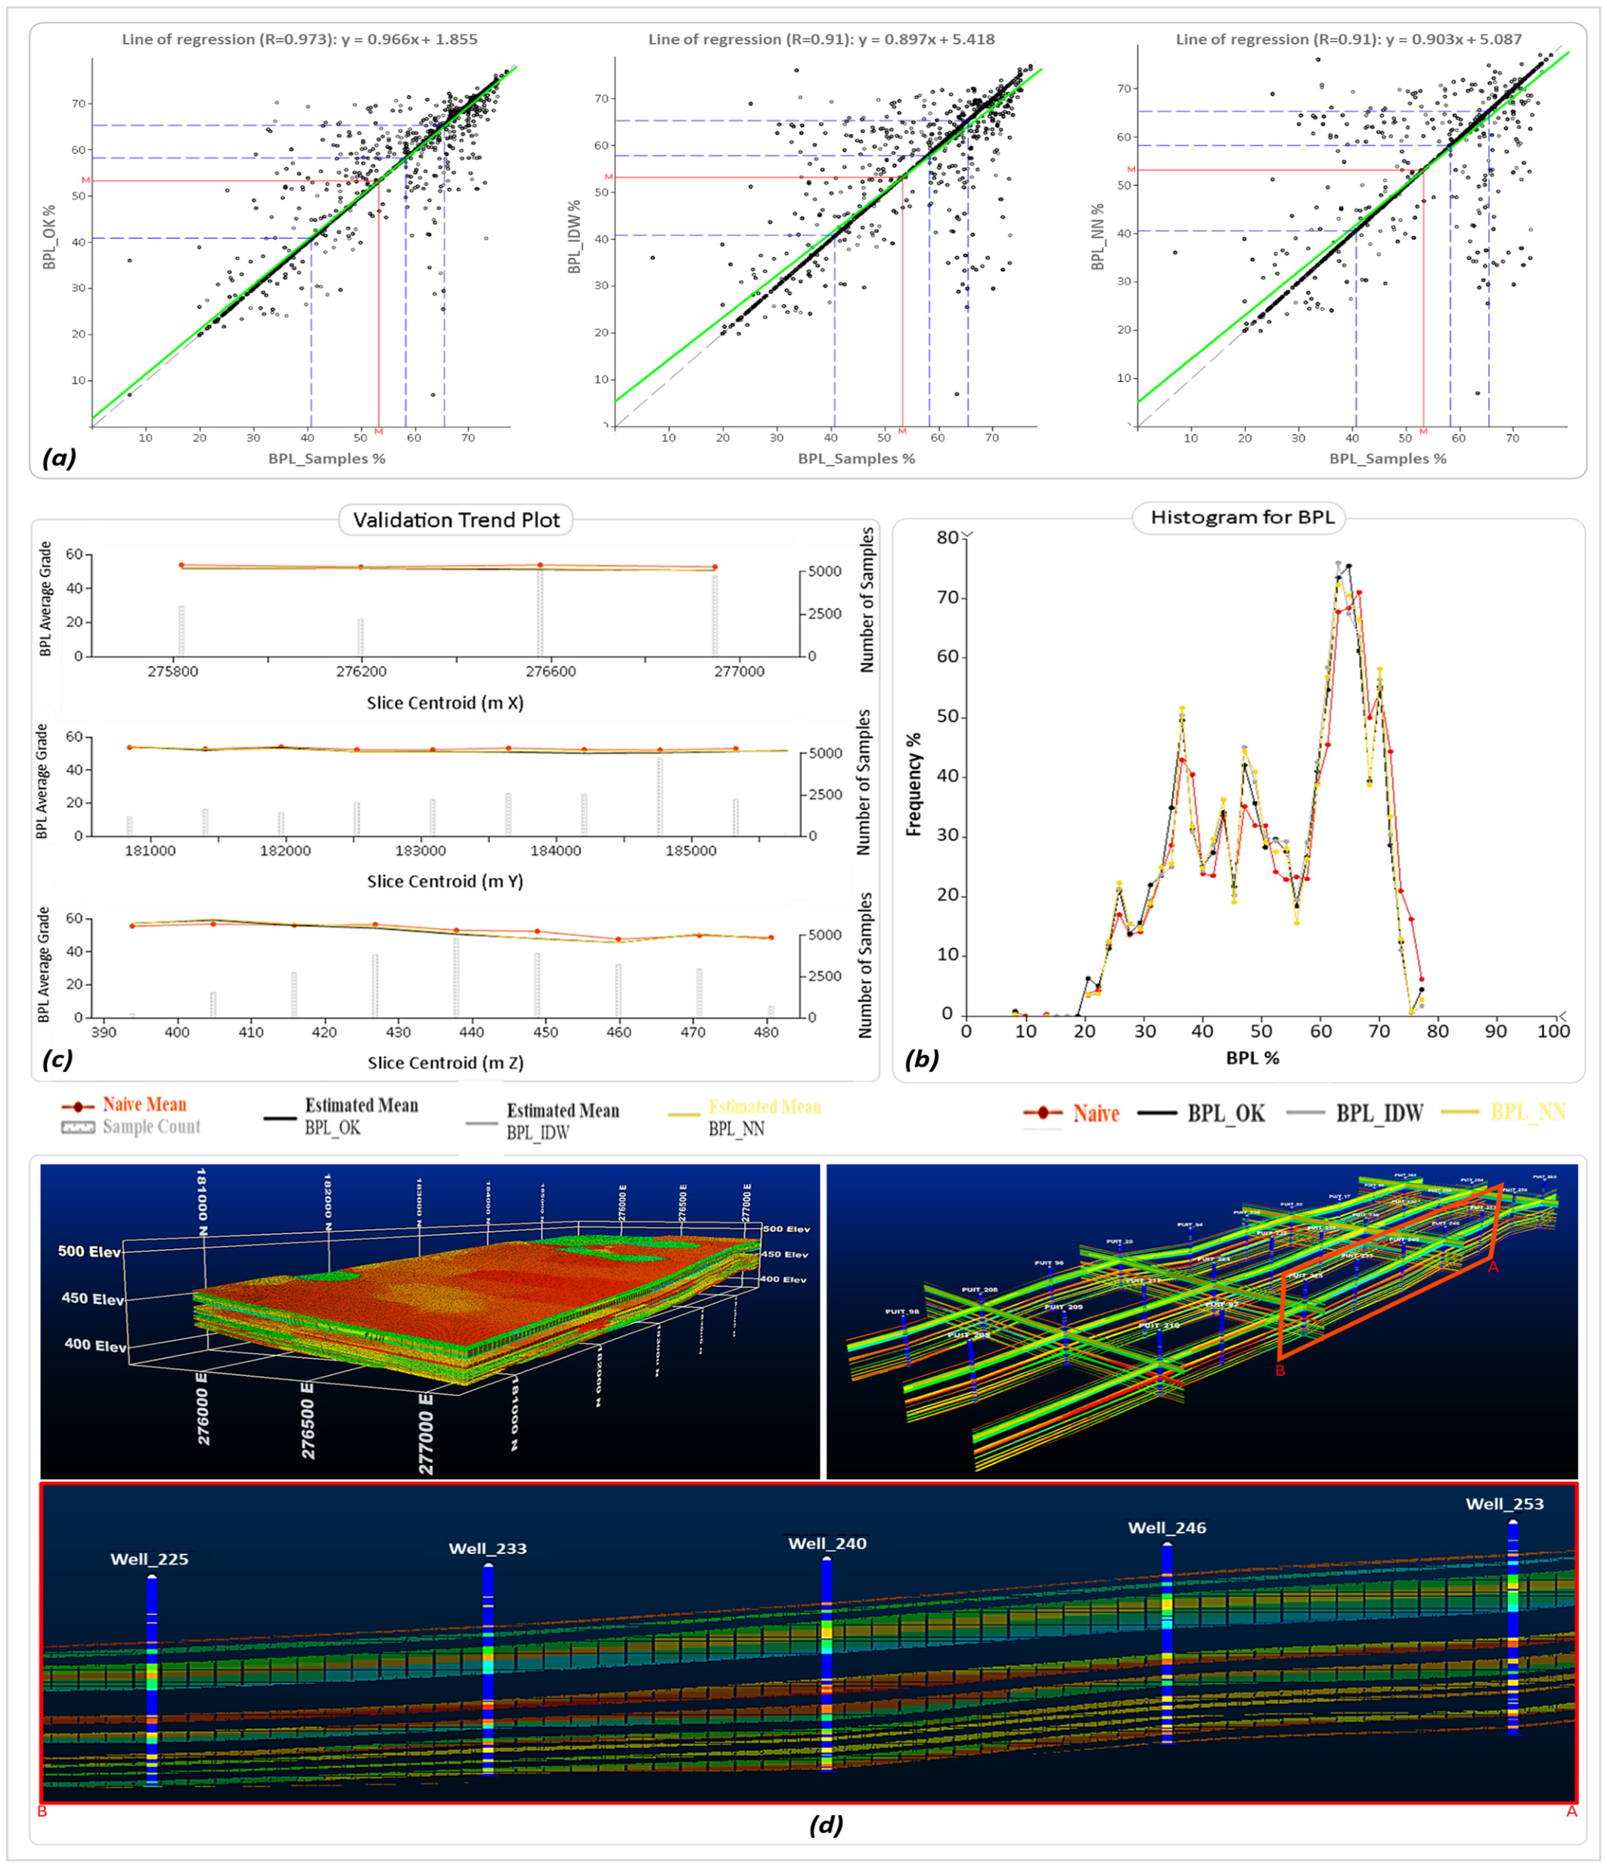
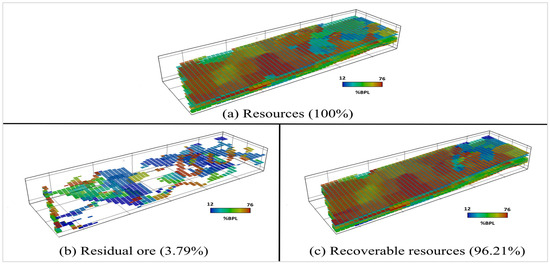
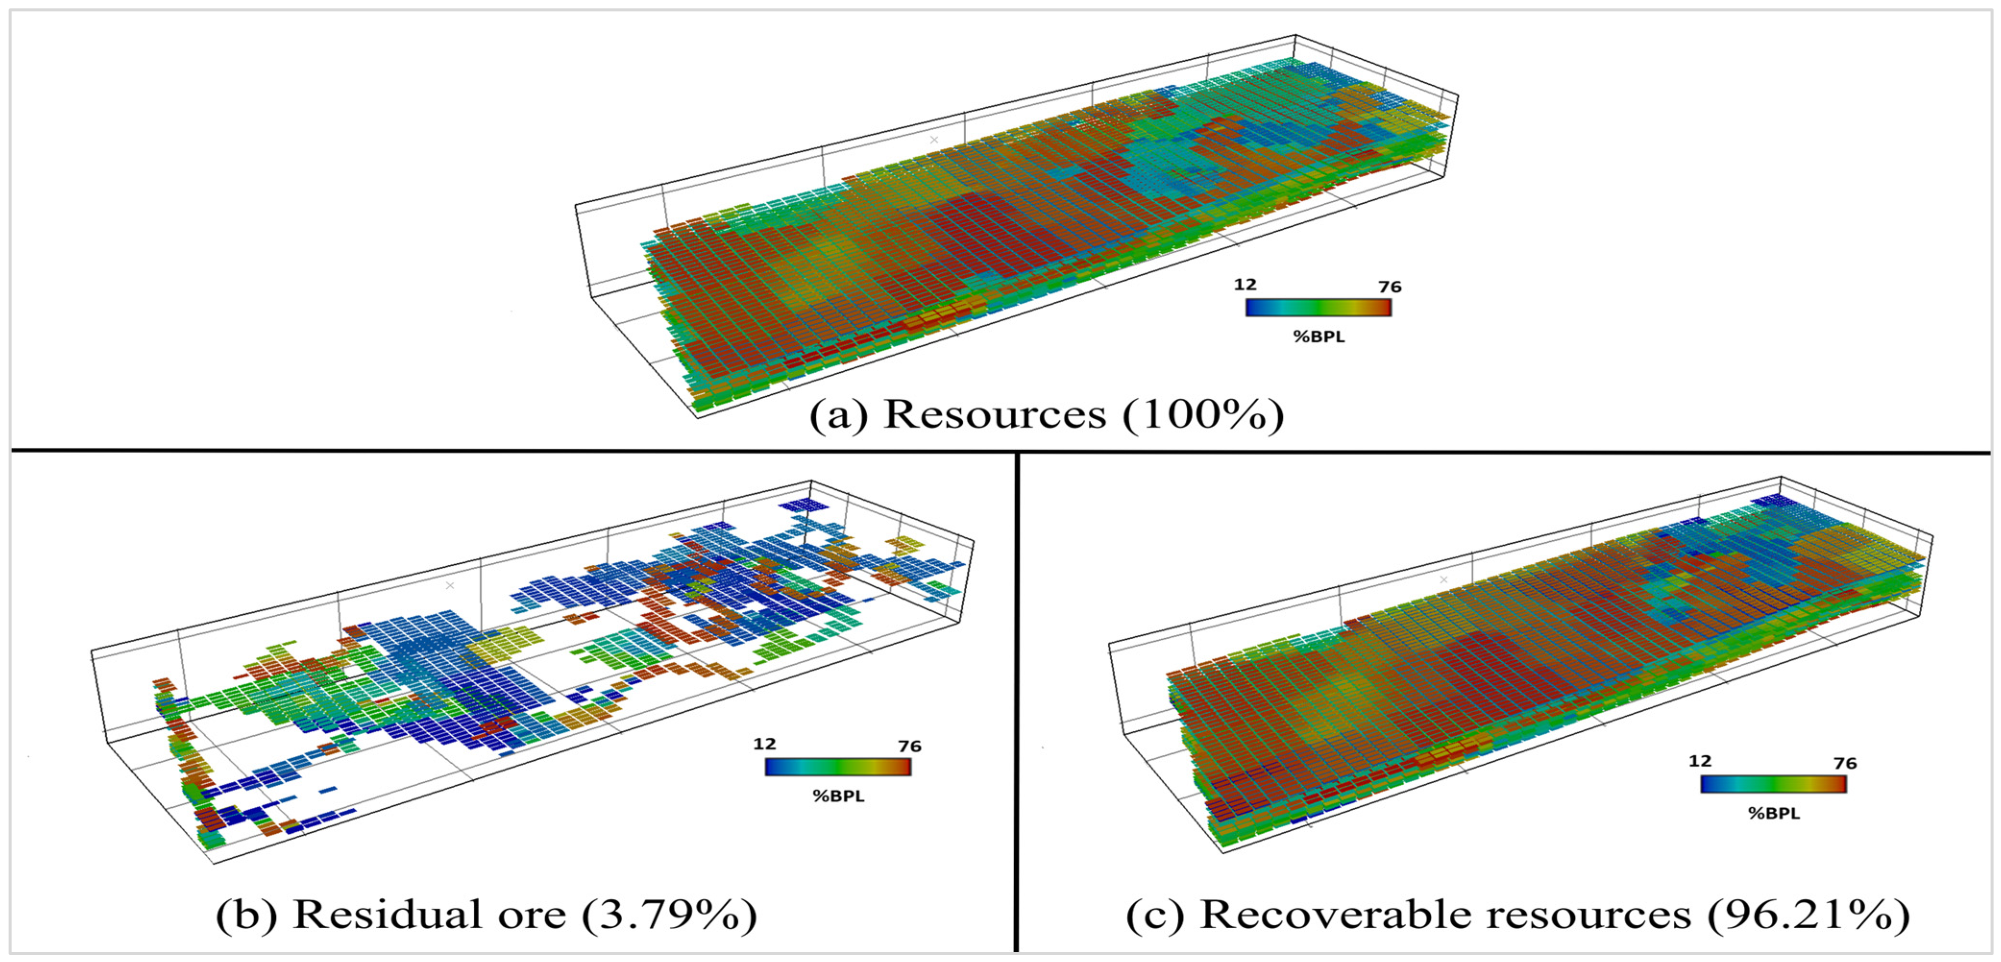
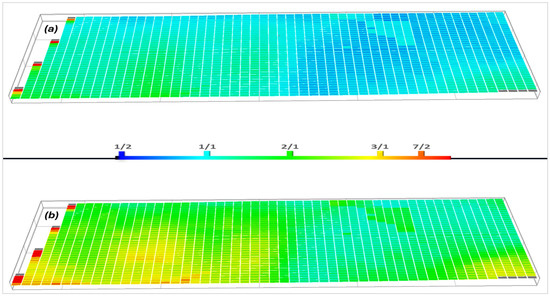
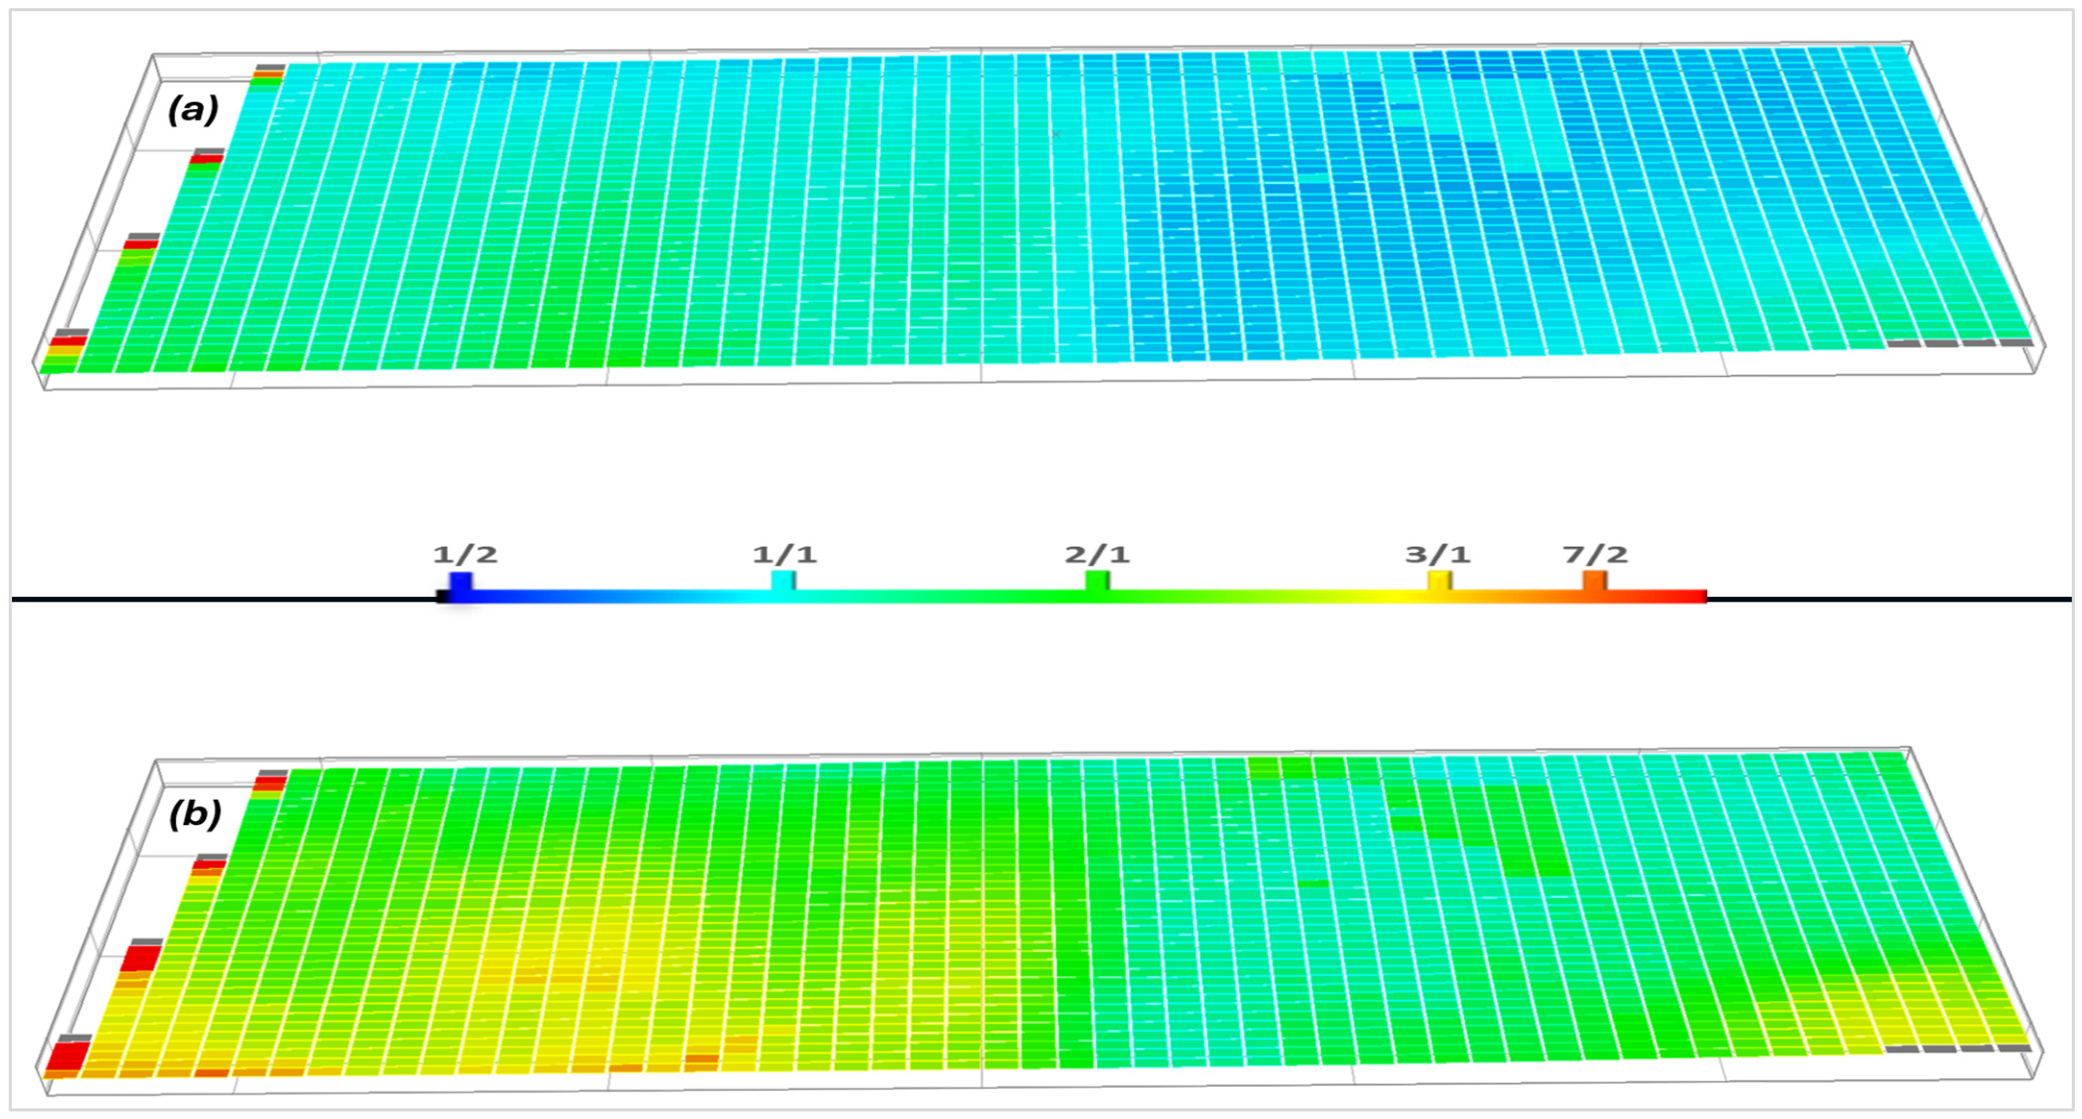
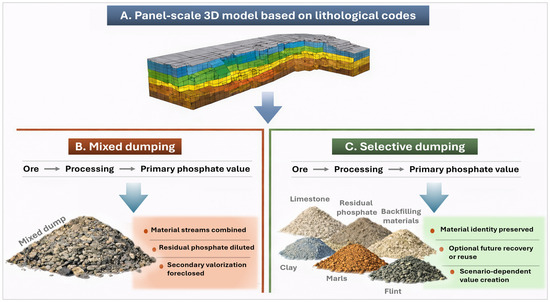
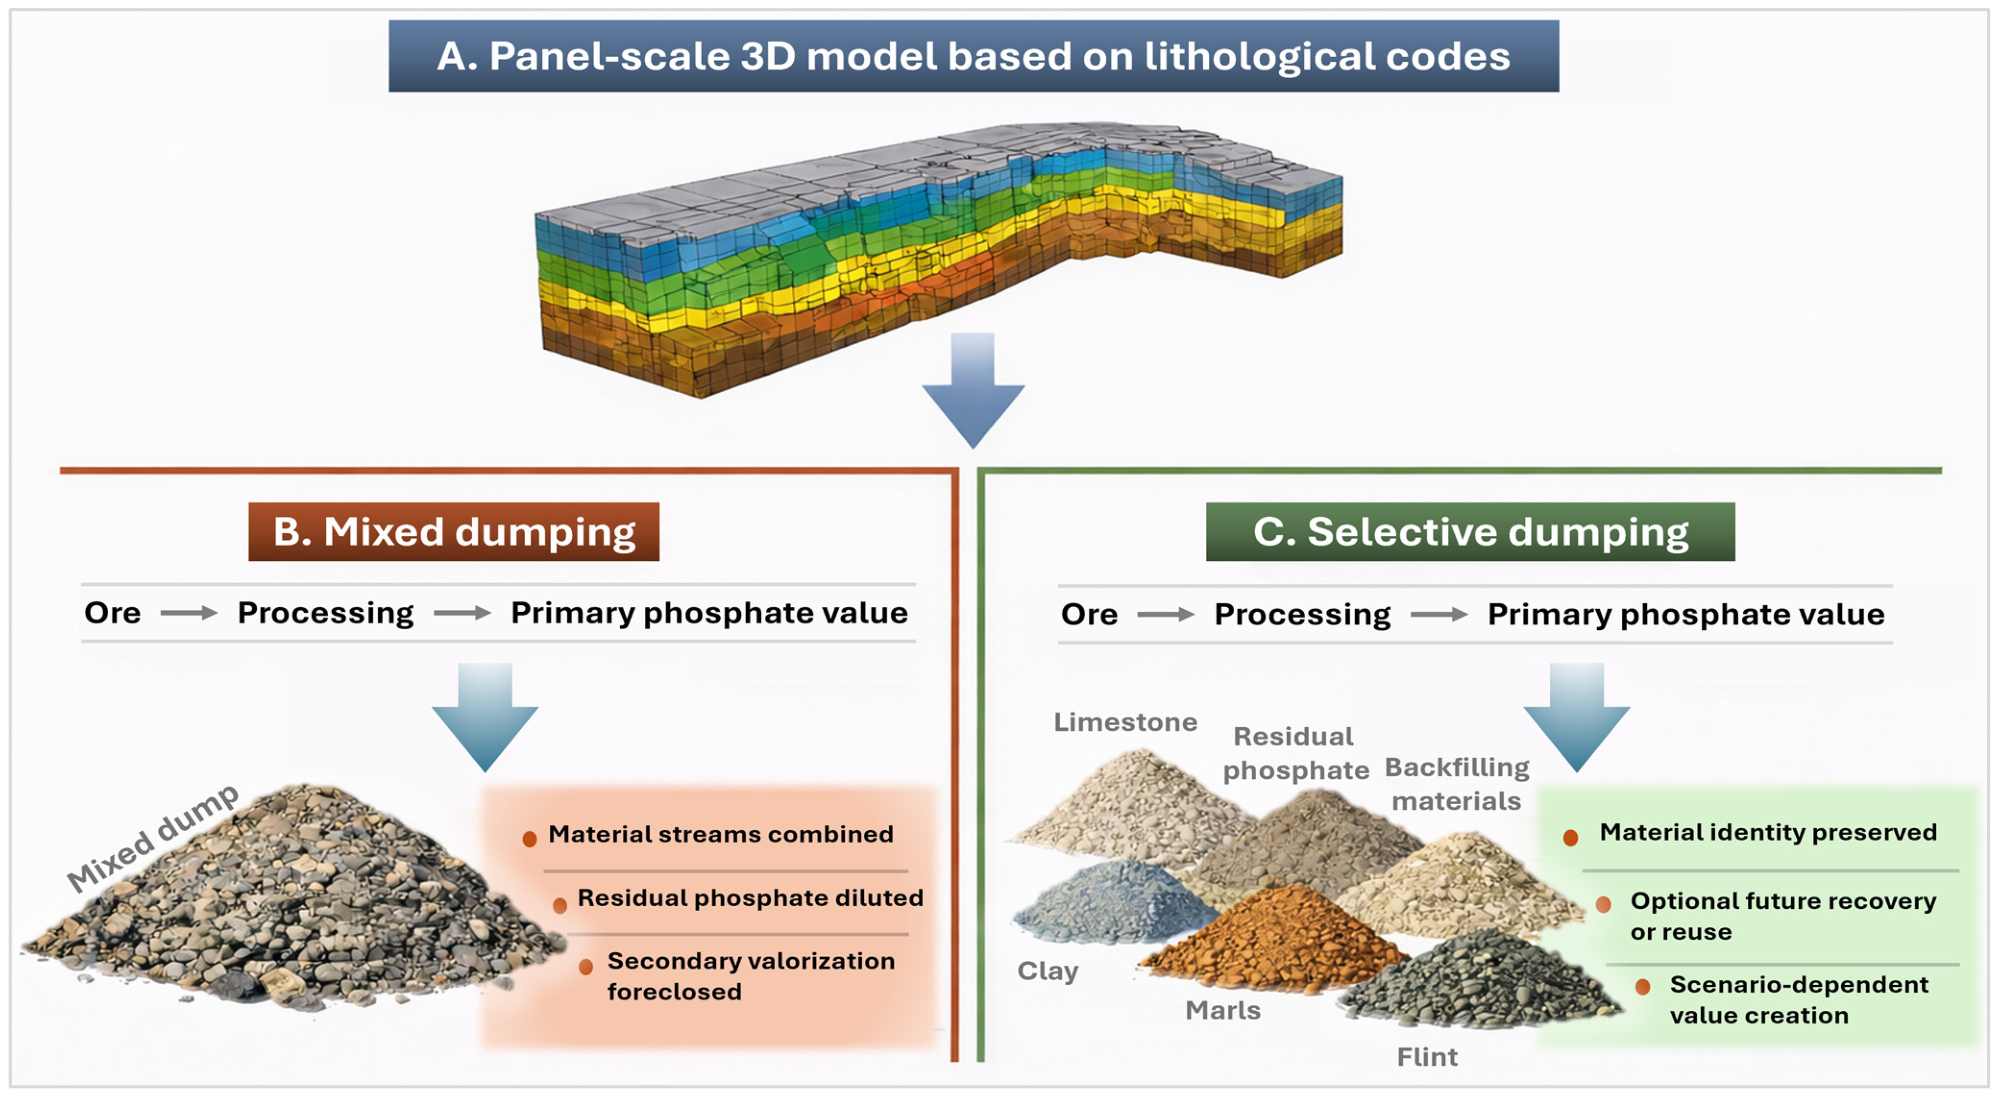

Disclaimer/Publisher’s Note: The statements, opinions and data contained in all publications are solely those of the individual author(s) and contributor(s) and not of MDPI and/or the editor(s). MDPI and/or the editor(s) disclaim responsibility for any injury to people or property resulting from any ideas, methods, instructions or products referred to in the content. |
© 2026 by the authors. Licensee MDPI, Basel, Switzerland. This article is an open access article distributed under the terms and conditions of the Creative Commons Attribution (CC BY) license.