


Abstract
Quantifying time-dependent rock mass degradation is critical for assessing long-term slope stability during open-pit mine closure. This study evaluates the geotechnical evolution of Paleoproterozoic arenites and argillites in the semi-arid Essakane Main Zone (Burkina Faso) over a 0–9-year atmospheric exposure period. Field characterization across 32 sampling stations included density measurements, point load testing (Is(50)), determination of the Geological Strength Index (GSI), and petrographic analysis. The results demonstrate a time-dependent reduction in physico-mechanical properties, modeled with a high correlation (R2 = 0.80–0.99). While density exhibited minor reductions, structural degradation was pronounced; the GSI decreased by 10 points for both lithologies, and Is(50) dropped significantly, particularly in argillites (4.1 to 2.3 MPa) relative to arenites (4.0 to 3.6 MPa). Petrographic evidence indicates negligible chemical weathering and mineral neoformation. Consequently, the degradation was attributed primarily to physical processes, specifically microcracking and discontinuity deterioration driven by thermal cycling and phyllosilicate sensitivity in argillites. These empirical relationships provide essential quantitative input for numerical slope stability modeling in semi-arid mine closure scenarios.
1. Introduction
The progressive degradation in rock mass properties following excavation is a fundamental geotechnical concern in open-pit mining, with critical implications for slope stability during both operational and post-closure phases [1,2]. Upon exposure to atmospheric conditions, rock masses previously confined at depth undergo physical, chemical, and biological weathering processes that systematically reduce their strength, stiffness, and structural integrity [3,4]. This degradation is particularly relevant for long-term slope design, where the factor of safety (FS) must remain above acceptable thresholds for decades to centuries after mine closure [5,6].
The rate and magnitude of rock mass degradation are strongly influenced by climatic conditions [7]. In semi-arid regions, such as the Sahel zone of West Africa, the combination of intense solar radiation, large diurnal temperature variations (up to 20–30 °C), concentrated seasonal rainfall (350–550 mm/year during a 3–4-month wet season), and high evapotranspiration rates (>2000 mm/year) creates a unique and aggressive weathering environment [8]. Thermal cycling induces differential expansion and contraction of mineral grains, generating micro-cracks that propagate over time [9]. Intermittent wetting and drying cycles promote the swelling and shrinkage of clay minerals, further degrading the rock fabric [10]. Chemical dissolution of carbonate cements and feldspar minerals by slightly acidic rainwater reduces intergranular cohesion [11].
Despite the recognized importance of weathering-induced degradation, quantitative field data documenting the evolution of geomechanical properties as a function of exposure time remain scarce in the literature, particularly for mining environments in tropical and semi-arid climates [12,13]. Most existing studies have focused on temperate or cold climates where freeze–thaw cycling is the dominant weathering mechanism [14,15]. Hack et al. [3] proposed the Slope Stability Probability Classification (SSPC) system, which incorporates a weathering parameter to account for rock mass deterioration, but the calibration data were primarily derived from European contexts. Huisman [4] developed a comprehensive framework for assessing rock mass decay in artificial slopes, introducing the concept of time-dependent weathering functions. Still, the empirical basis was limited to specific lithologies in the Netherlands and Mediterranean regions.
The Essakane gold mine, operated by IAMGOLD Corporation in northern Burkina Faso, serves as a unique natural laboratory for studying time-dependent rock mass degradation in a semi-arid Sahelian environment. The open-pit excavation, which began in 2010, exposes Paleoproterozoic (Birimian) metasedimentary formations composed predominantly of arenitic (silicified sandstones) and argillitic (fine-grained claystones) rocks. The progressive expansion of the pit over nearly a decade has created slope faces of varying ages (0 to 9 years of atmospheric exposure), enabling a chronosequence-based approach to quantifying degradation rates [16].
Previous studies at Essakane documented structural instabilities, including wedge failures, block toppling, and surface raveling, attributed to weathering effects. However, a systematic quantification of the temporal evolution of physical and mechanical properties, density, point load strength, and the Geological Strength Index (GSI), coupled with petrographic evidence of microstructural degradation, was lacking.
This study addresses this gap through a comprehensive field investigation combining (1) geotechnical mapping and cartography of slope faces of different exposure ages; (2) systematic density measurements on block samples; (3) point load testing (PLT) performed to determine strength degradation kinetics; (4) GSI assessment to track rock mass quality evolution; and (5) petrographic thin-section analysis under polarized light microscopy to identify microstructural degradation mechanisms. The objectives are to establish quantitative time–property relationships for both lithologies and provide input parameters for time-dependent slope stability models applicable to mine closure planning.
2. Materials and Methods
2.1. Study Site and Geological Context
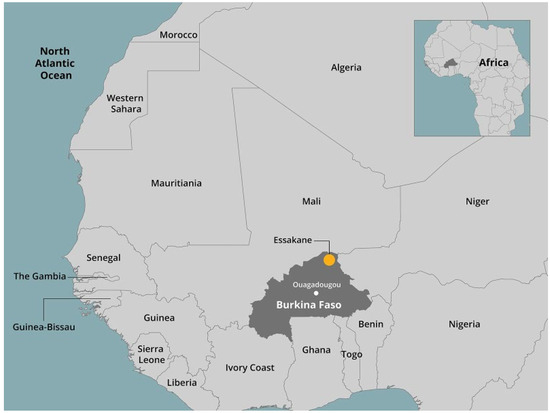
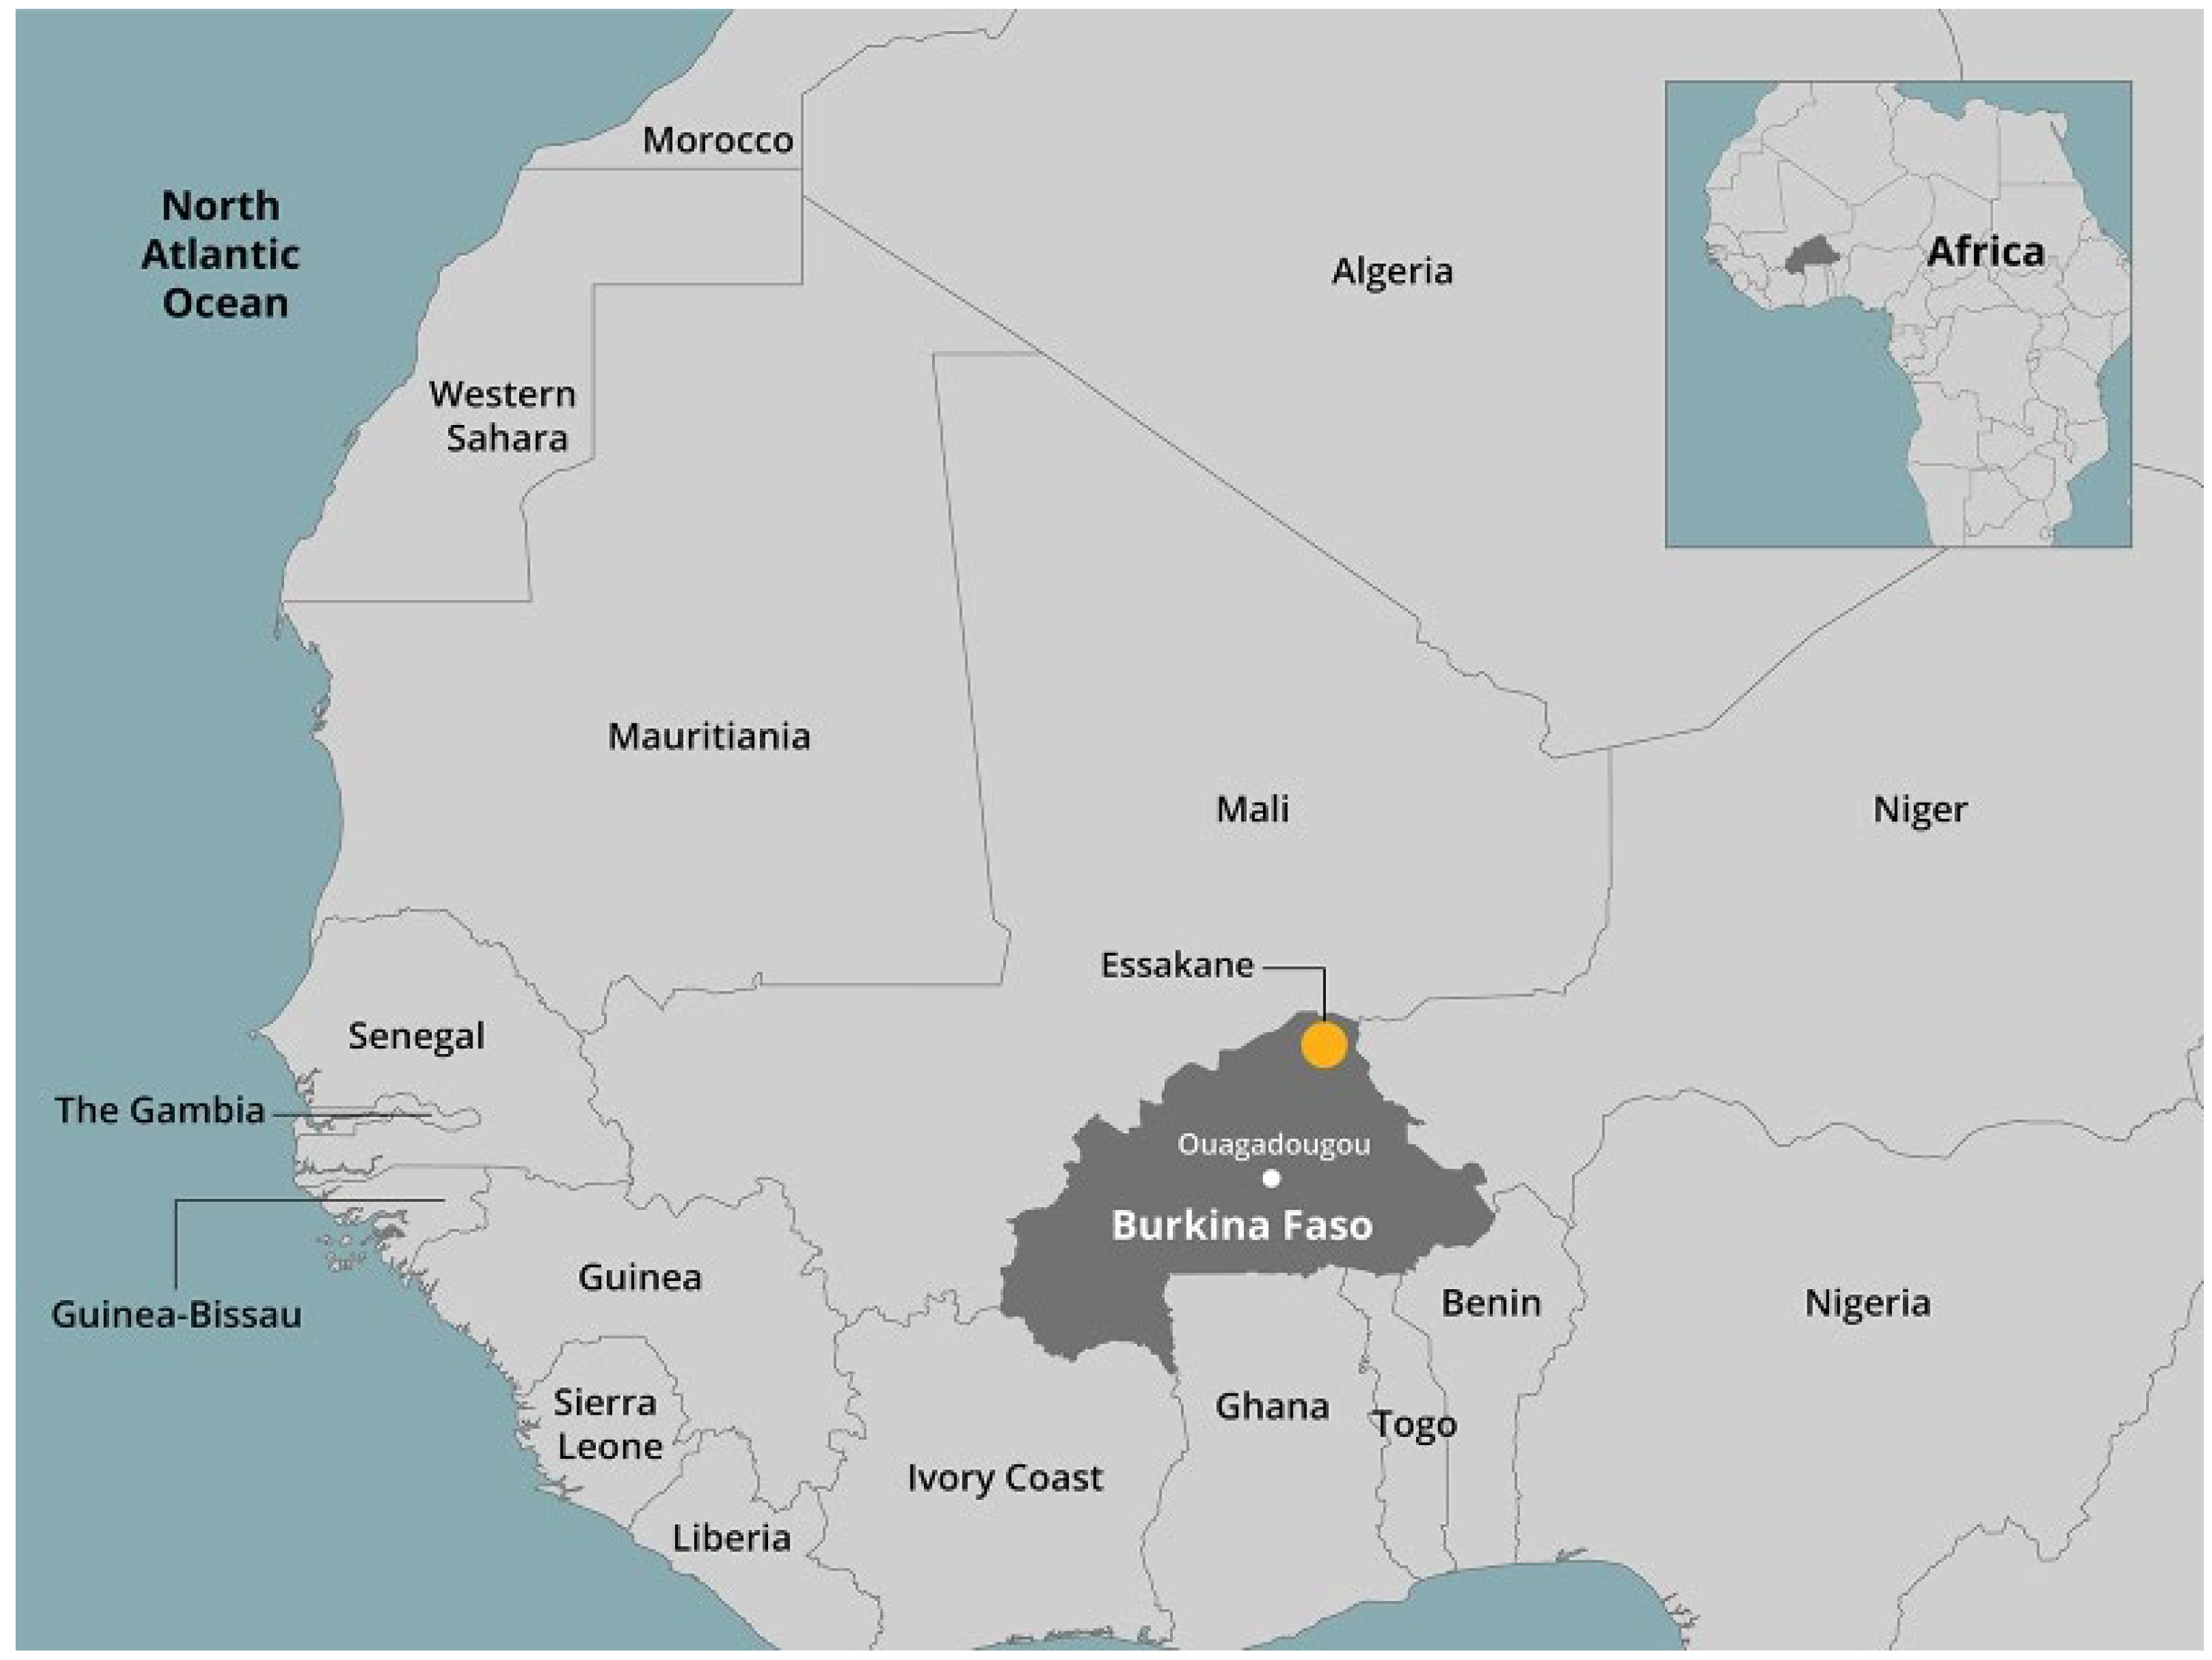
The Essakane gold mine is situated in the Sahel region of northern Burkina Faso (approximately 14°23′ N, 0°17′ W), which is within the Paleoproterozoic Gorouol greenstone belt of the Birimian terrane (Figure 1). The regional geology comprises a volcano–sedimentary sequence composed of alternating metasedimentary units intruded by mafic sills and crosscut by quartz–tourmaline veins hosting the gold mineralization.
Figure 1.
Location map of the Essakane SA mine in Burkina Faso, West Africa.
The Essakane Main Zone (EMZ) open pit measures approximately 3 km in length and 1 km in width, with an ultimate pit design reaching a maximum depth of 390 m in the north sector and slope angles varying from 50° to 85° depending on the geotechnical domain. The geometric design parameters are differentiated by lithological domain, as follows (Table 1):
Table 1.
Geometric design parameters of the ultimate pit stratified by geotechnical domain.
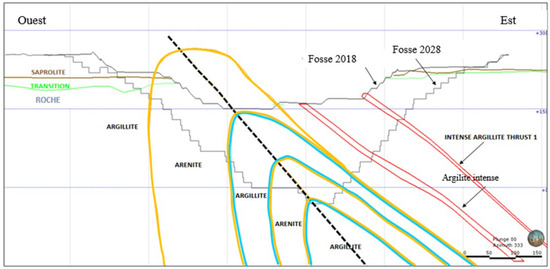
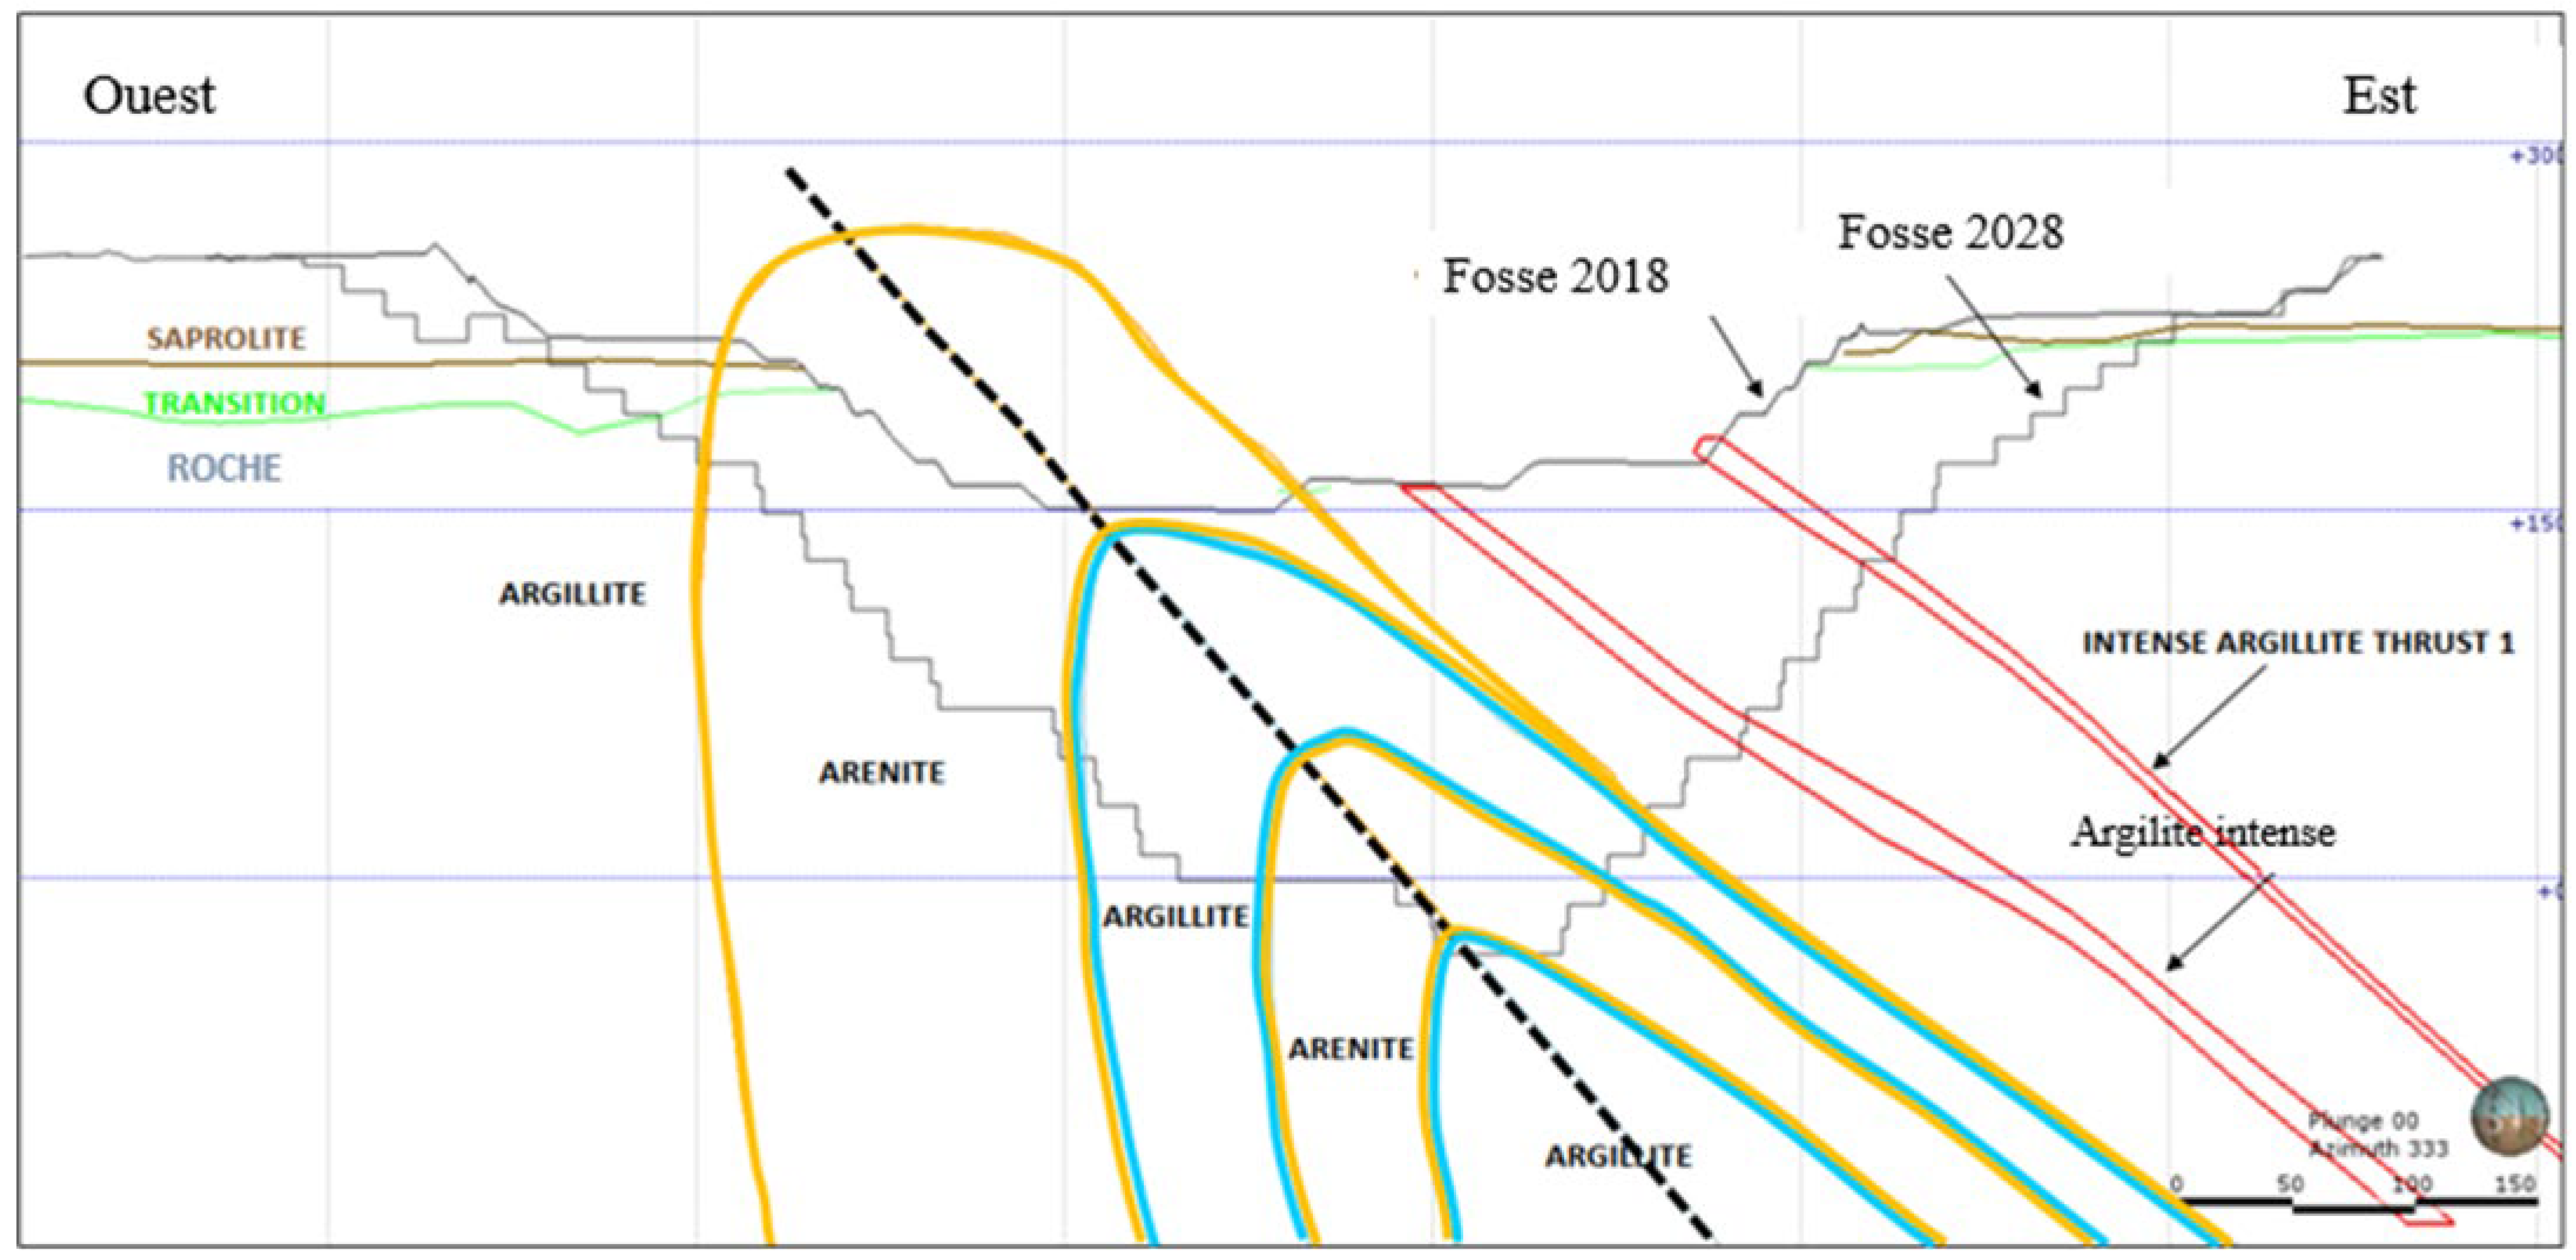
The two dominant lithological units exposed in the pit walls are given below (Figure 2):
Figure 2.
Simplified geological cross-section of the EMZ pit showing the distribution of the main lithologies.
Arenites: These units are medium- to fine-grained silicified quartzitic metasedimentary sandstones composed predominantly of quartz (Qz), with subordinate plagioclase (Pl), carbonate cements (Cb: calcite and dolomite), and muscovite/white mica (Mb). They generally range from being massively to weakly foliated, with strong fractures in places. These rocks are globally competent and ensure good wall stability when fresh but can rapidly lose strength under physico-chemical weathering. They are classified as R3–R4 (medium to strong) on the ISRM strength scale when fresh [17].
Argillites: these are fine-grained, graphitic, silicified argillaceous metasedimentary rocks rich in phyllosilicates (chlorite, sericite, and muscovite), containing quartz, carbonates, minor feldspar, and opaque minerals. These levels present a more foliated structure, lower cohesion, and marked sensitivity to surface degradation (disaggregation and cracking) as well as swelling phenomena in the presence of water. Fresh specimens are classified as R2–R3 (weak to medium strong) [17].
Additional lithologies include turbidites, as well as mafic and felsic intrusions (dykes, veins, and sub-massive bodies) associated with auriferous shear zones, which locally generate competence contrasts and structural discontinuities (fault planes and crushed zones) influencing the geomechanical behavior of slopes.
2.2. Sampling Strategy and Chronosequence Approach
A chronosequence-based sampling strategy was adopted to capture the temporal evolution of rock mass properties. Slope faces with known excavation dates, corresponding to exposure ages of 0 to 9 years, were identified using mine-planning records and field observations.
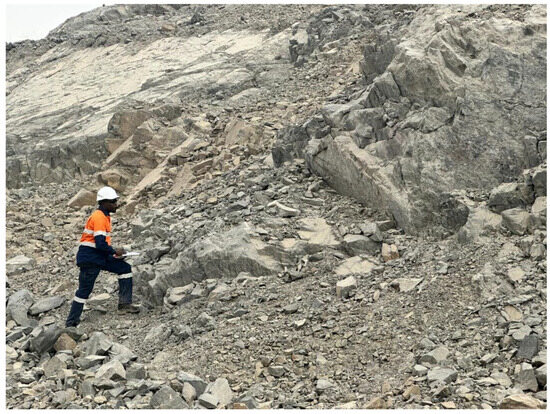
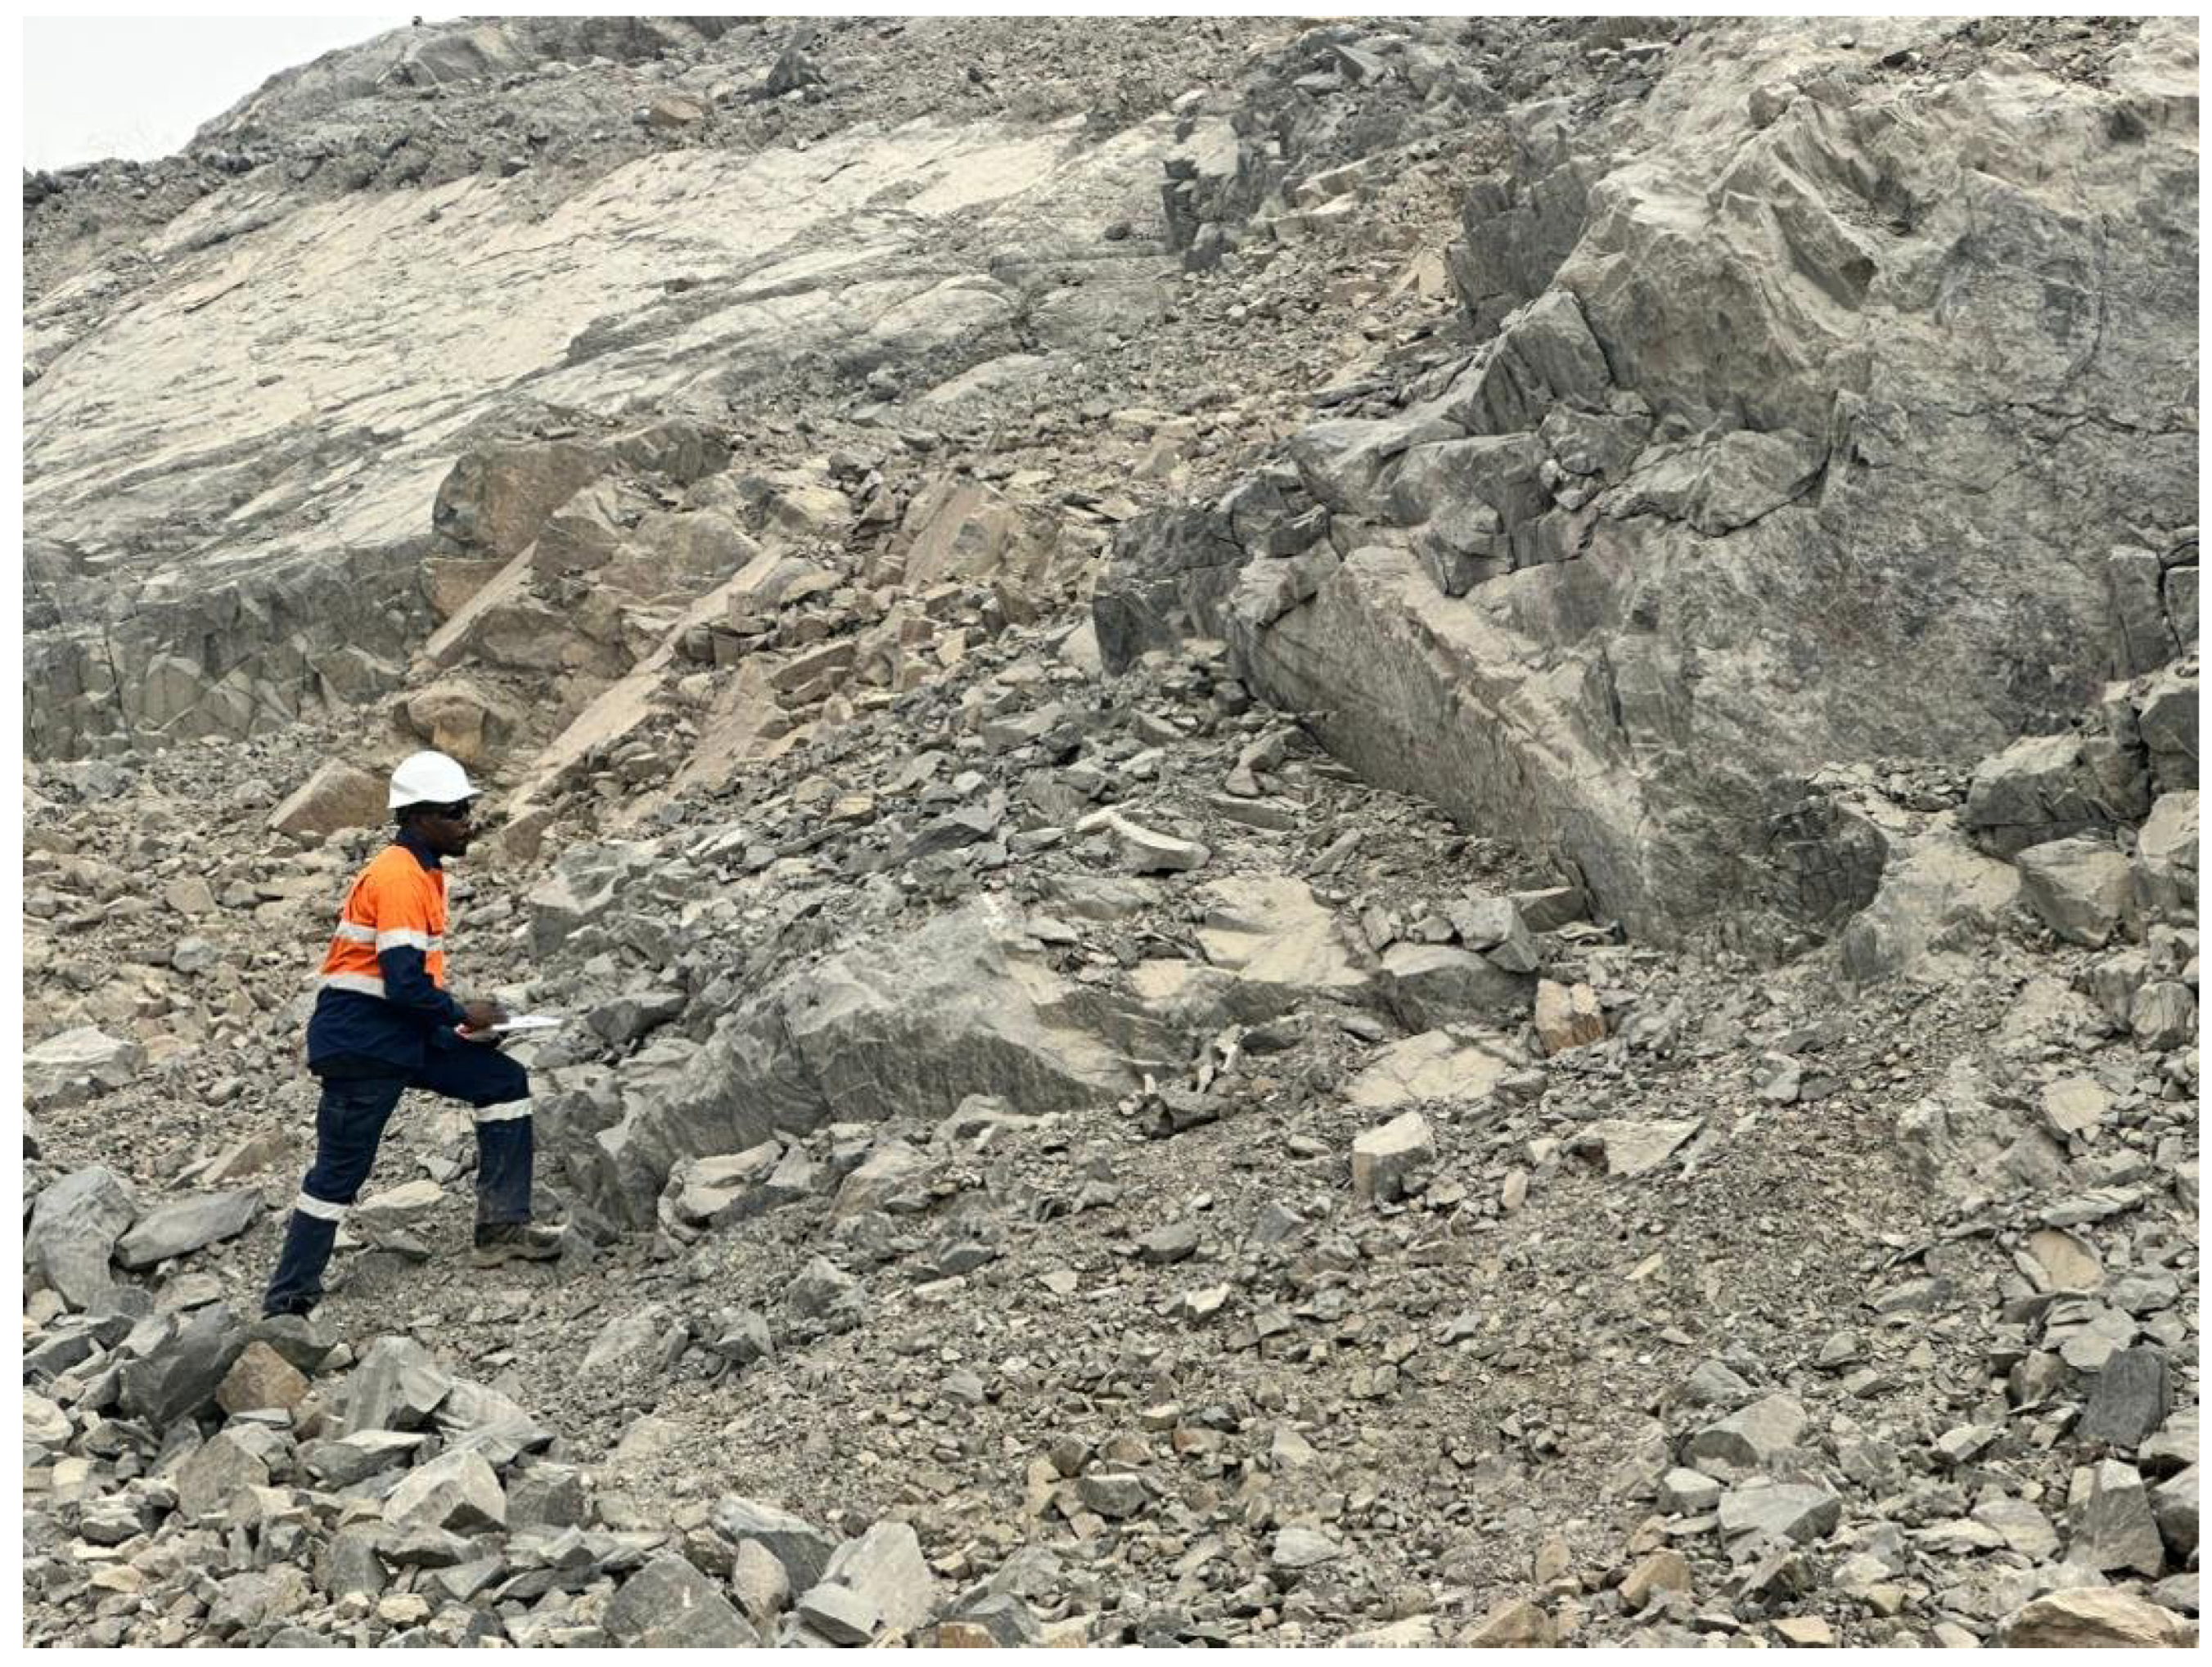
A total of 32 sampling stations were established across the EMZ pit: 14 stations in arenite and 18 stations in argillite. At each station, the following data were systematically recorded: GPS coordinates (x, y, z), exposure time (years since excavation), lithological descriptions, macroscopic descriptions of the rock mass (structure, jointing, foliation, presence of sulfides, and water seepage), and the degree of weathering according to the ISRM-based classification system (Table 2). Field observations consistently indicated weathering grades of 0 to 1 across all sampling stations over the 0–9-year exposure window, corresponding to fresh rock (with no visible signs of weathering) to slightly weathered rock (with discoloration indicating weathering along major discontinuities) (Figure 3).
Table 2.
Description of in situ rock mass weathering grades [17].
Figure 3.
Image showing the structural mapping campaign carried out at a rocky slope at the Essakane SA mine.
2.3. Geotechnical Field Mapping and GSI Assessment
Systematic geotechnical mapping was performed at each of the 32 sampling stations according to the methodology developed by Read and Stacey [1] and the ISRM-suggested methods [17], which were inspired by the SSPC approach developed by Hack et al. [3]. The following parameters were recorded:
- Rock mass structure: We assessed overall fabric (massive, jointed, heavily fractured), foliation characteristics, and bedding, and conducted discontinuity surveys (orientation, spacing, persistence, aperture, roughness, infilling, and water conditions).
- Discontinuity surface conditions: Roughness, aperture, infilling material, and degree of surface weathering along discontinuity planes were assessed.
- Intact Rock Strength (IRS): This was measured in situ using the geological hammer rebound method, classified according to the ISRM scale from R0 (extremely weak, 0.25–1.0 MPa) to R6 (extremely strong, >250 MPa) (Table 3).
Table 3.
ISRM intact rock strength classification [17].
GSI assessments were performed using the quantified GSI chart developed by Hoek and Marinos [18], integrating the assessment of rock mass structure (from intact/massive to laminated/sheared) and discontinuity surface conditions (from very good to very poor), and the updated version developed by Hoek and Brown [19]. The GSI was evaluated at the bench scale (10–20 m face height depending on the geotechnical domain) to ensure representativeness for slope-scale analyses.
2.4. Density Measurements
Bulk density (ρ) was determined for all block samples using the paraffin-immersion method in accordance with the ISRM standards [17]. The following parameters were measured for each specimen:
- i.
- Wet sample mass as received (Mh);
- ii.
- Dry sample mass without paraffin (Mdry−0), after oven-drying;
- iii.
- Dry sample mass with paraffin coating (Mdry−P);
- iv.
- Immersed sample mass without paraffin (Mimm−0);
- v.
- Immersed sample mass with paraffin (Mimm−P).
The apparent (bulk) density was calculated using the following formula:
where Mdry−0 is the dry mass without paraffin (g), and Mimm−0 is the immersed mass without paraffin (g). This method accounts for the irregular shapes of field-collected block samples and provides a consistent basis for comparison across exposure ages.
2.5. Point Load Testing (PLT)
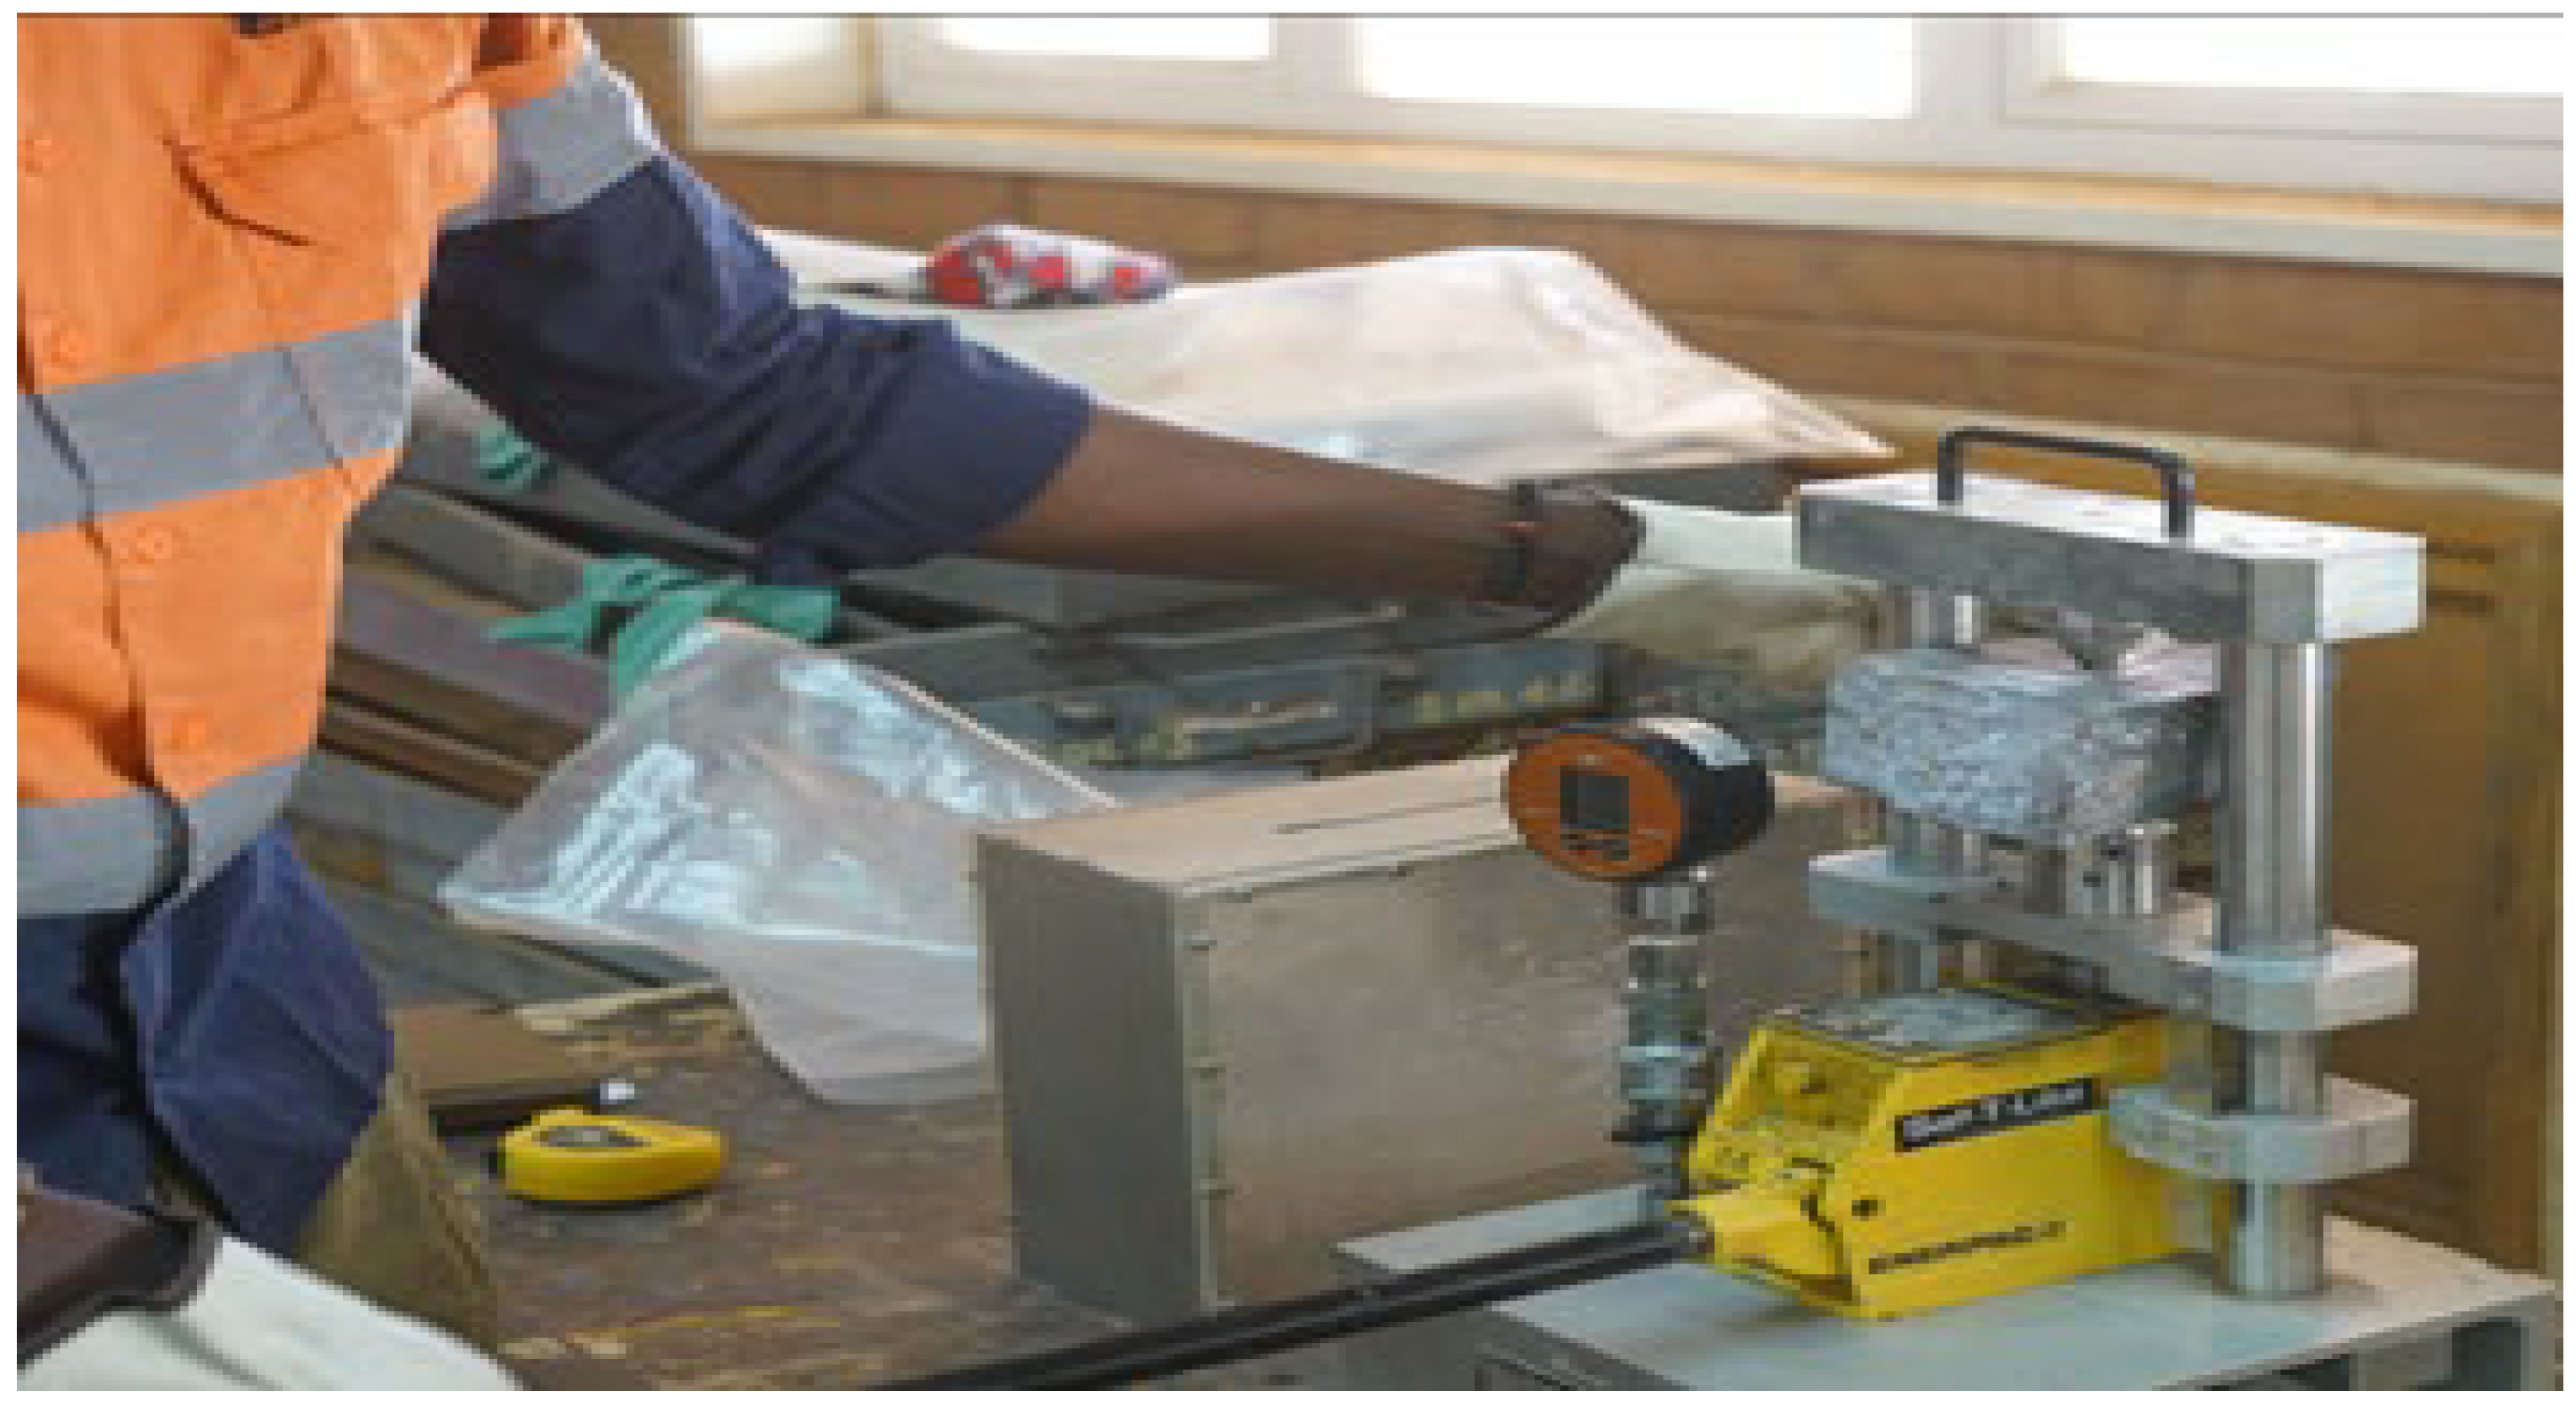
Point load strength tests were performed on all specimens using a calibrated Point Load Tester (PLT) equipped with a hydraulic jack operated by a lever mechanism (Figure 3 and Figure 4). Given the irregular shapes of field-collected samples, the irregular lump test configuration was adopted, with sample dimensions respecting the proportional requirements specified by ISRM [20]. Non-standard loading platen configurations can significantly bias the measured point load index, which further justifies strict adherence to the ISRM procedure adopted in this study [21].
Figure 4.
Performance of the PLT test.
The testing procedure was as follows:
- i.
- Each specimen was placed between two conical platens. A progressively increasing force was applied via the hydraulic jack using a back-and-forth lever action.
- ii.
- The failure load (P) was calculated from the maximum gauge reading (L, in MPa):where S = 0.000948 m2 is the effective piston area of the PLT model used.
- iii.
- The uncorrected point load strength index (Is) was calculated [20]:where De is the equivalent core diameter (mm), obtained from the expression De2 = 4A/π, with A = W × D (mm2) being the minimum cross-sectional area at the point of cone contact; D is the distance between the two loading platens at the time of failure; and W is the width of the minimum section passing through the two loading points.
- iv.
- The size-corrected point load strength index (Is(50)), where F is the correction coefficient, was obtained as follows [20]:
- v.
- The uniaxial compressive strength (UCS) was estimated using empirical conversion relationships established for sedimentary rocks [22]:
This range of the conversion factor K accounts for the variability within the same sedimentary series (lithologies). Published correlations for sedimentary and hydrothermally altered rocks suggest using K values typically ranging from about 13 to 24 [22]. In this study, K = 18 for argillites and K = 22 for arenites were adopted as reasonable lithology-specific values within this documented range that are consistent with the relatively high UCS values determined at Essakane Mine site.
- vi.
- The indirect tensile strength (σt) was estimated from the correlation [23]:
2.6. Petrographic Thin-Section Analysis
Representative specimens from each lithology (Figure 4 and Figure 5) at two exposure ages (0 and 9 years) were prepared as standard petrographic thin sections at the laboratory of Université Joseph Ki-Zerbo. Thin sections were examined under a polarizing microscope equipped with both plane-polarized light (PPL) and cross-polarized light (XPL) objectives [24]. The objective was to compare the fresh state (0 years) and the 9-year exposure state and detect any possible supergene alteration minerals that might have developed over this period.
Figure 5.
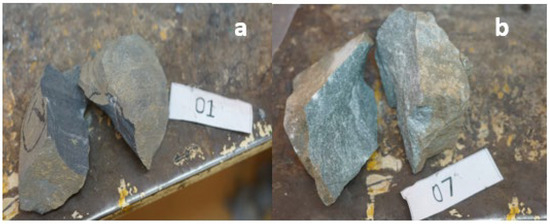
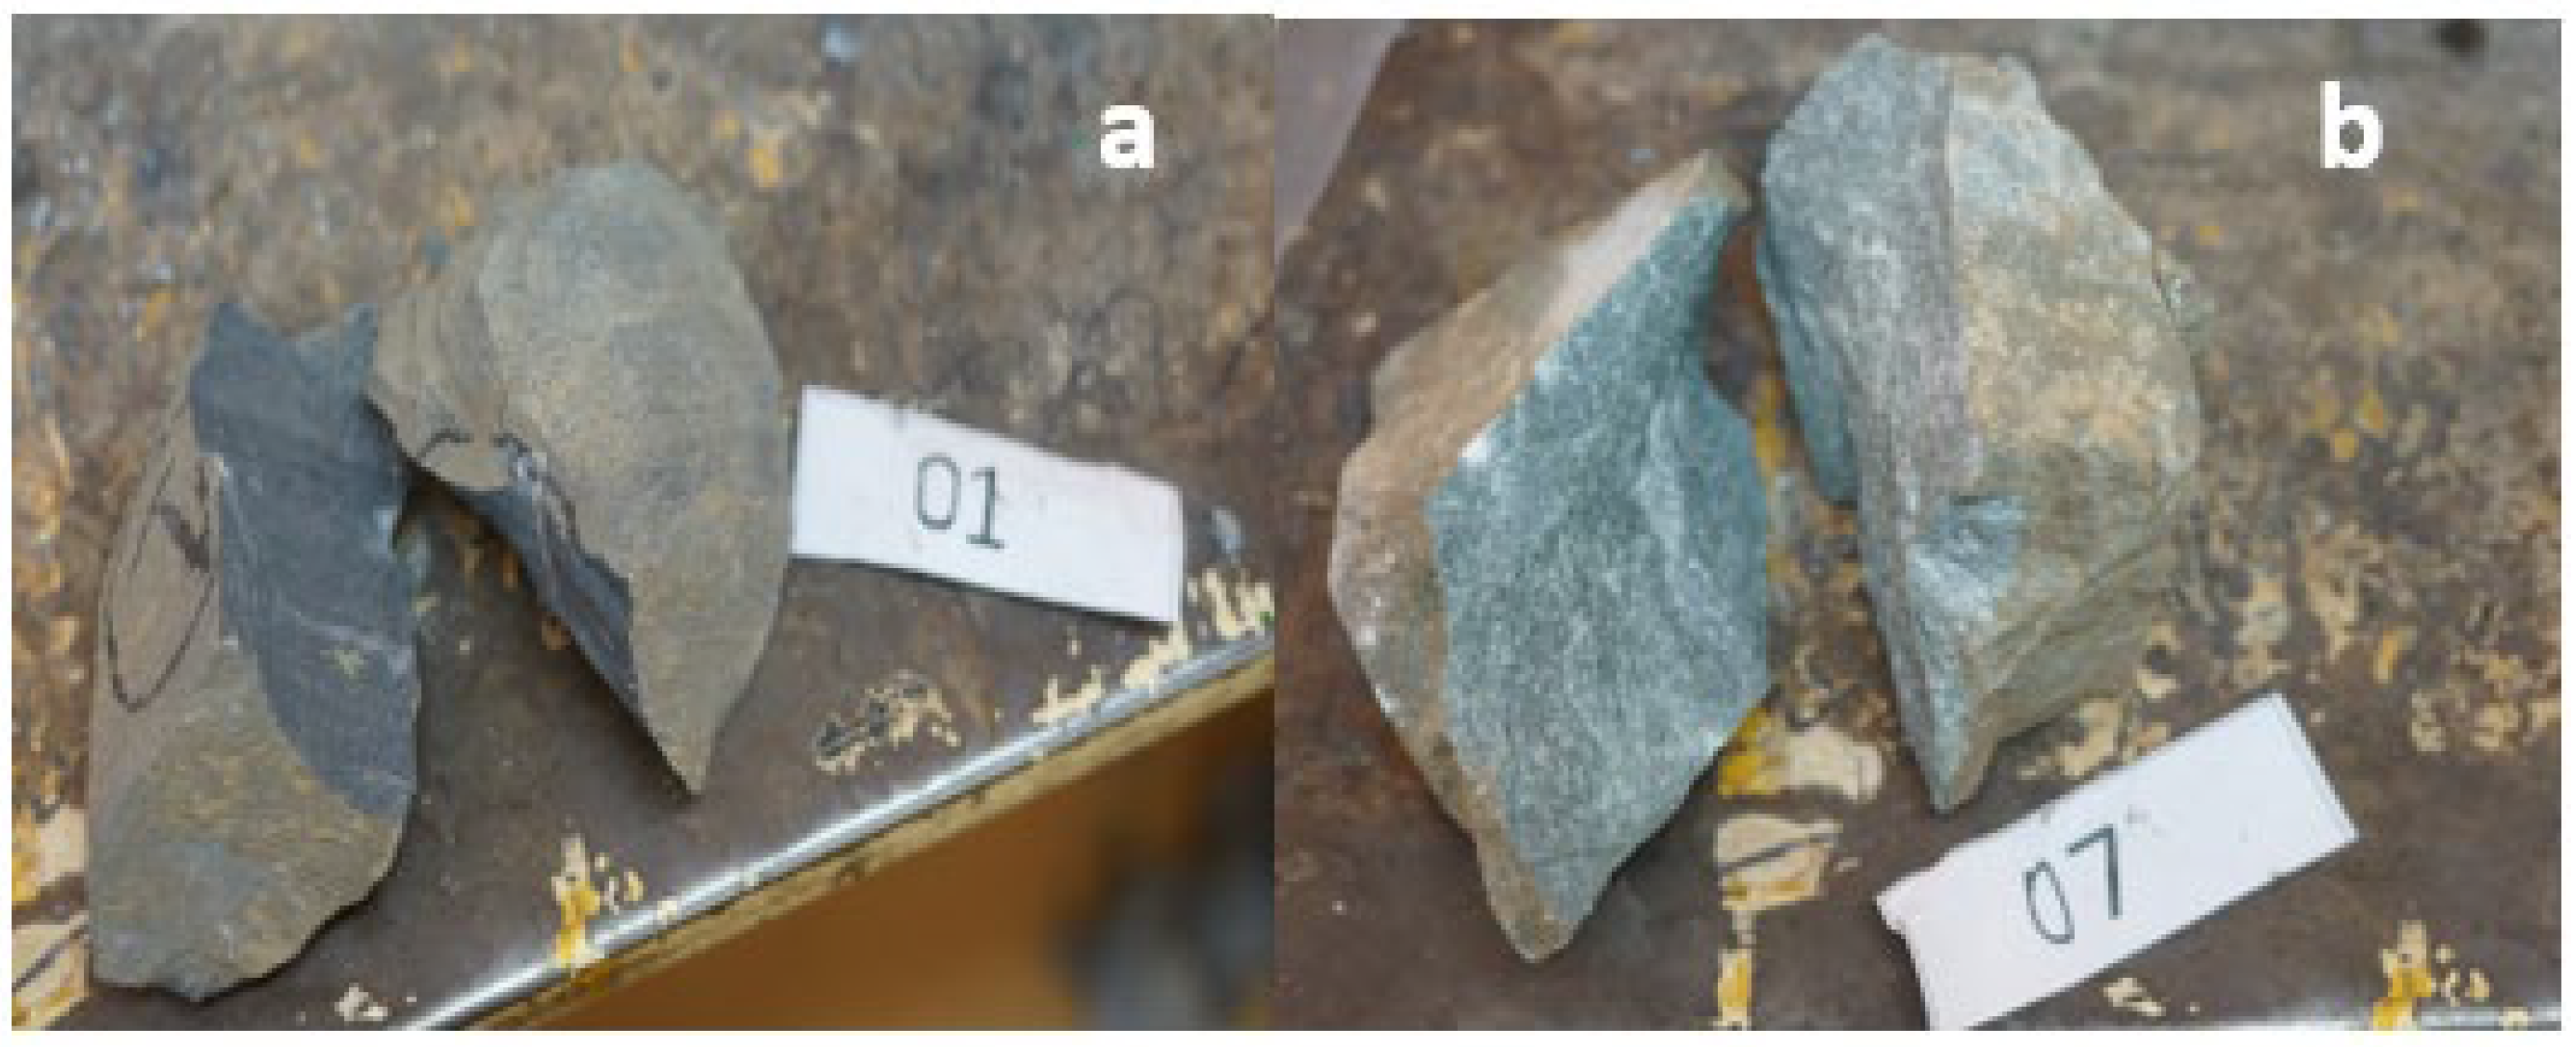
PLT test results (a) claystone/argillite and (b) sandstone/arenite.
3. Results
3.1. Geotechnical Mapping and Visual Weathering Assessment
Field mapping across the 32 sampling stations revealed that weathering remained at low to moderate grades (0–1) over the 0–9-year observation period for both lithologies (Table 4). Argillites consistently showed slightly more discoloration than arenites at equivalent exposure ages, but no station exceeded grade 1 within the observation window.
Table 4.
Summary of field-observed weathering features as a function of exposure age.
3.2. GSI Evolution with Exposure Time
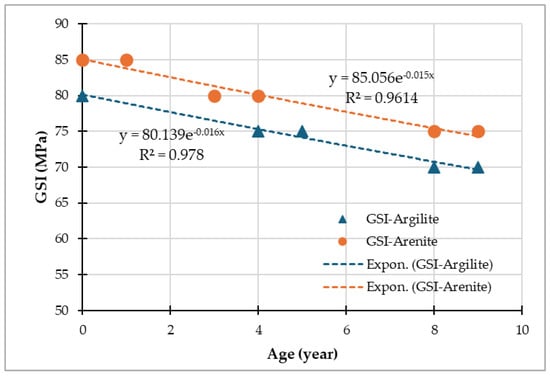
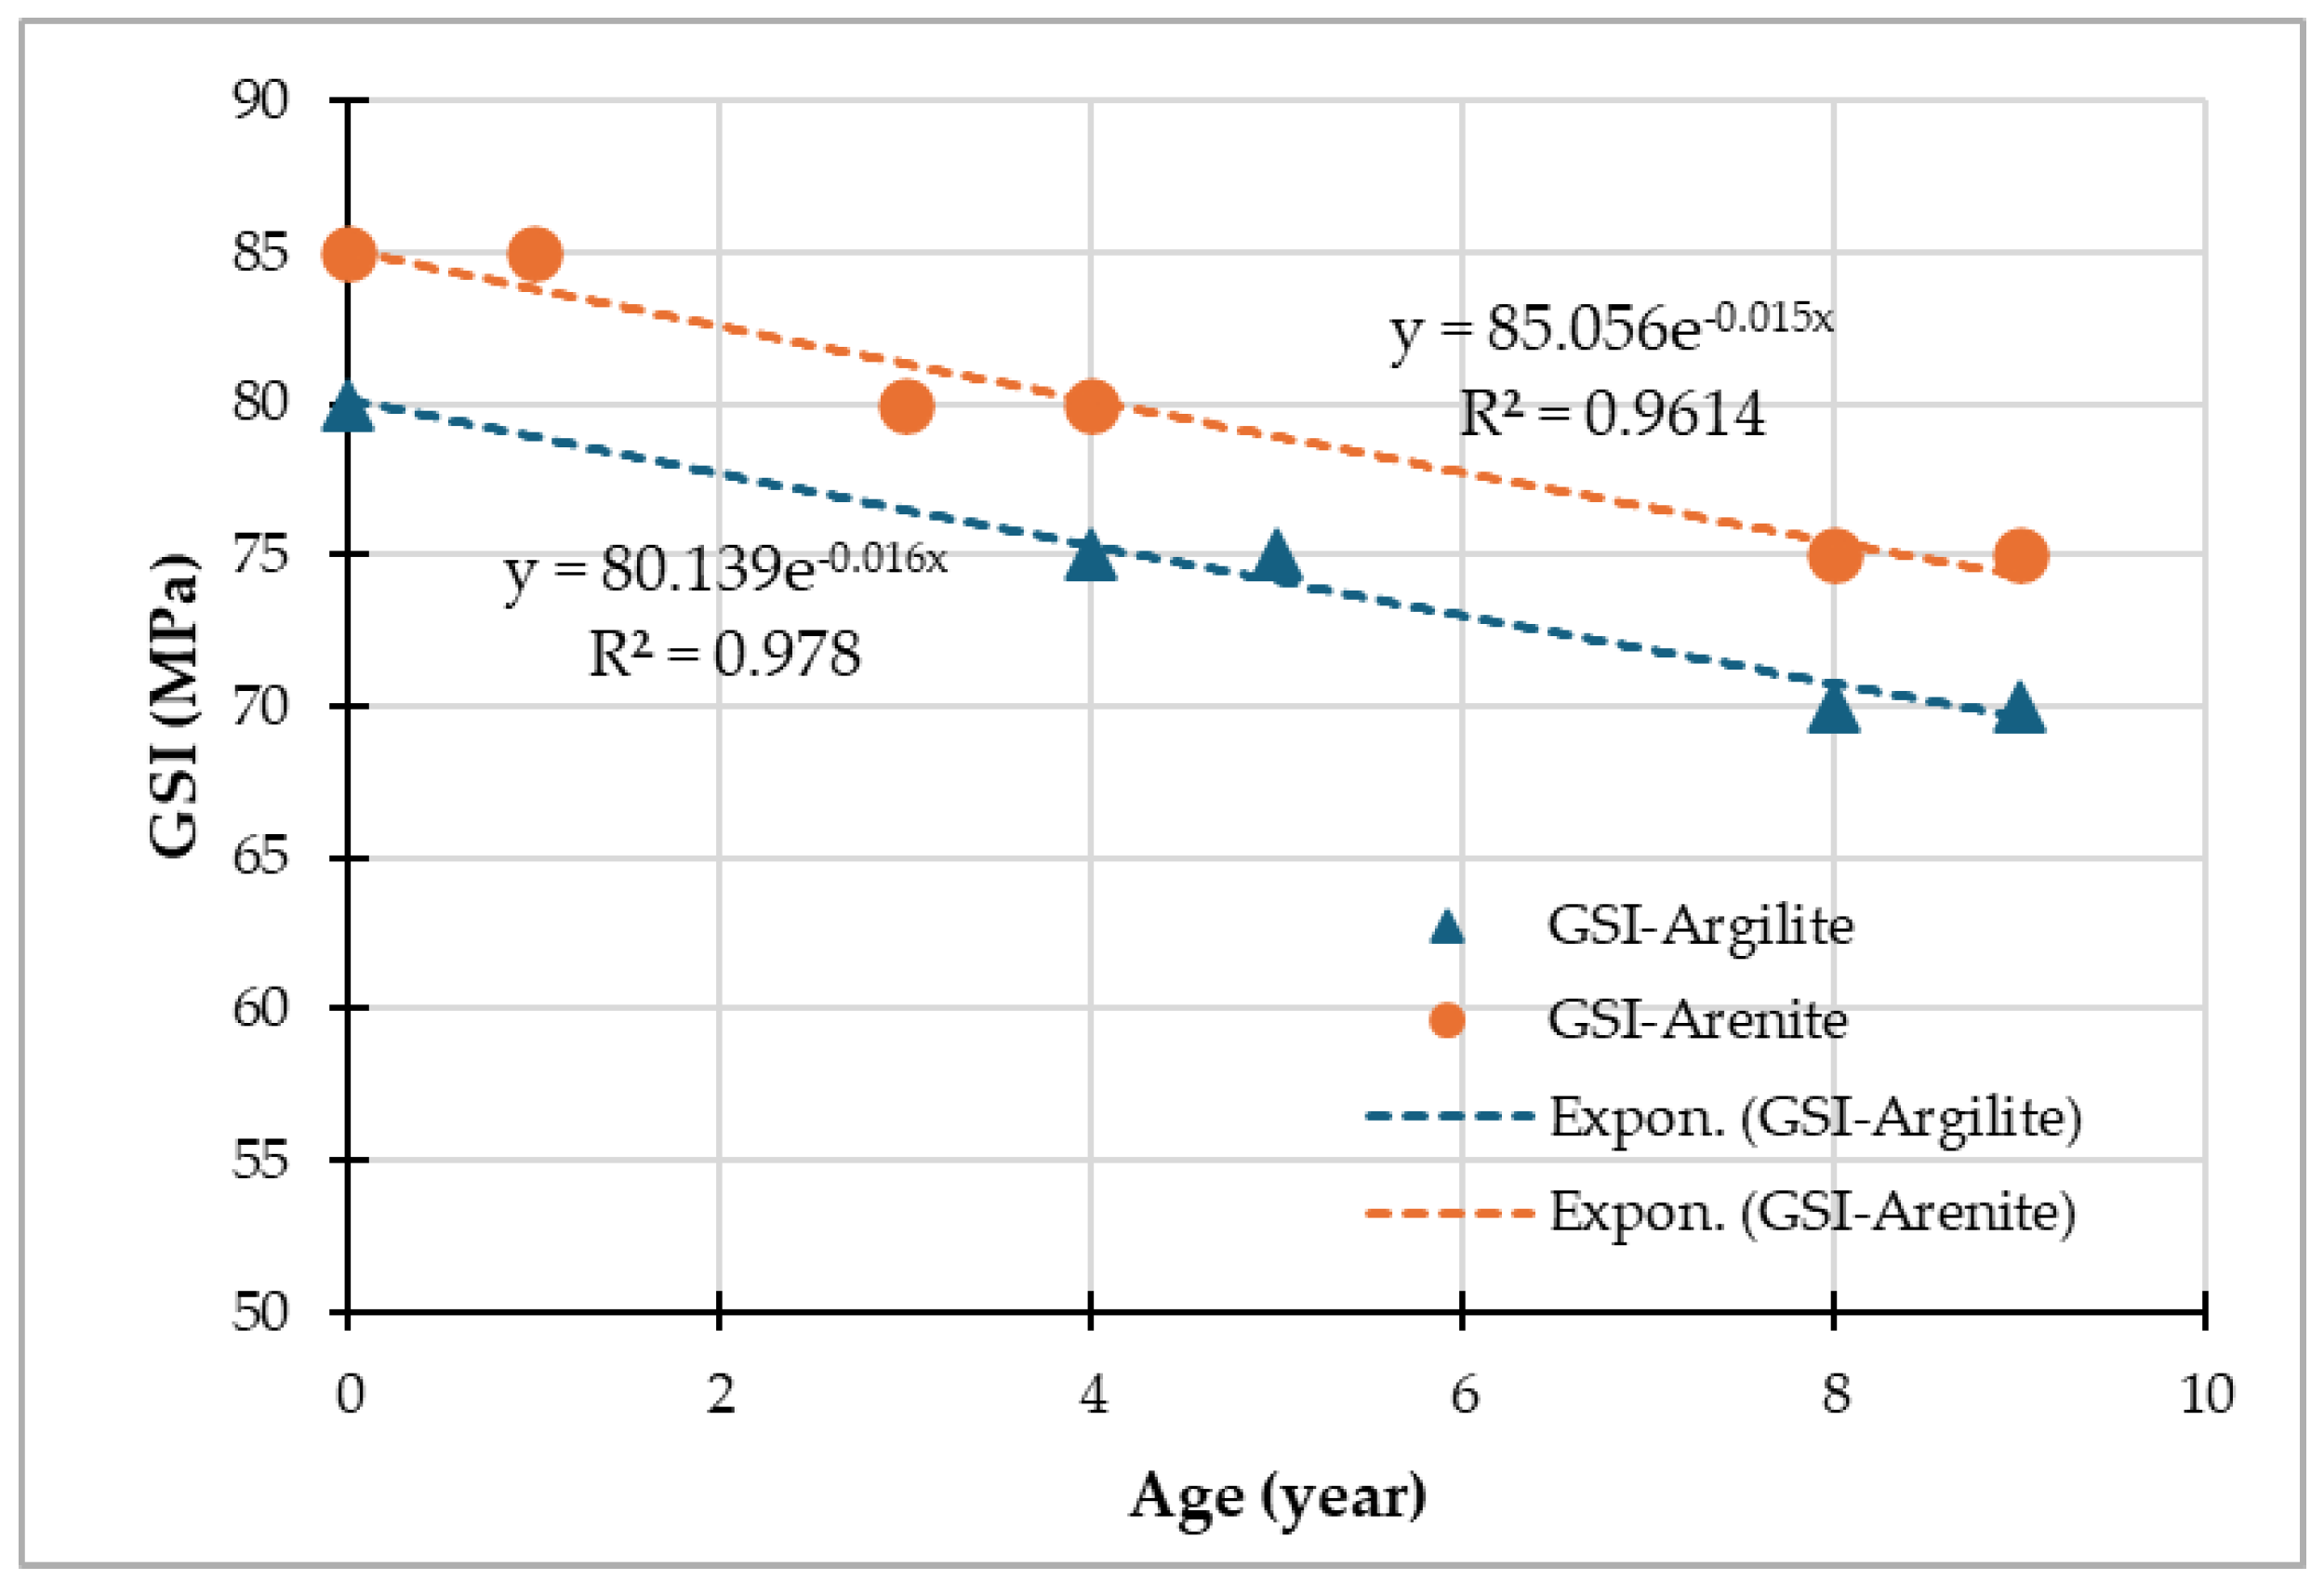
GSI values decreased systematically with an increase in exposure time for both lithologies (Table 5). Fresh arenites presented initial GSI values of 85, decreasing to 75 after 9 years. Intact argillites started at GSI = 80, decreasing to 70 after 9 years.
Table 5.
Mean GSI values as a function of exposure time.
Figure 6.
Correlation between GSI and the ages of the rock samples.
3.3. Density Evolution with Exposure Time
Bulk density decreased progressively with exposure time for both lithologies (Table 6). Arenites showed a modest density decrease of approximately 1.8% over 9 years (2.76 → 2.71 g/cm3), while argillites exhibited a smaller but measurable reduction of approximately 0.7% (2.79 → 2.77 g/cm3).
Table 6.
Mean dry density (g/cm3) as a function of exposure time.
The relatively modest density changes, especially for argillites, are consistent with the low weathering grades (0–1) observed in the field and indicate that degradation at this stage is dominated by microcracking rather than bulk mineralogical transformation.
3.4. Point Load Strength Evolution with Exposure Time
The point load strength index, Is(50), decreased significantly with exposure time, with argillites showing the most pronounced degradation (Table 7). The total Is(50) reduction over 9 years was approximately 5% for arenites (4.01 → 3.58 MPa) and 44.0% for argillites (4.09 → 2.29 MPa).
Table 7.
Mean Is(50), UCS, σt, IRS, and GSI as a function of exposure time.
The degradation follows polynomial trends:
3.5. Correlation Between Parameters
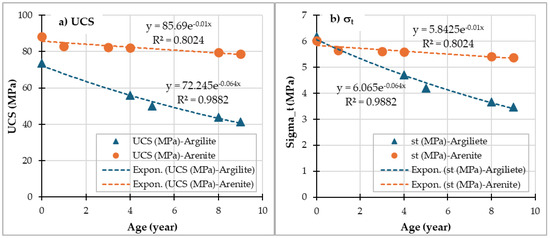
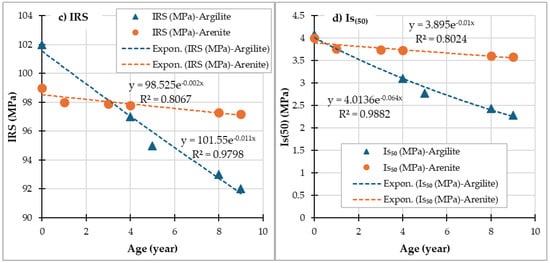
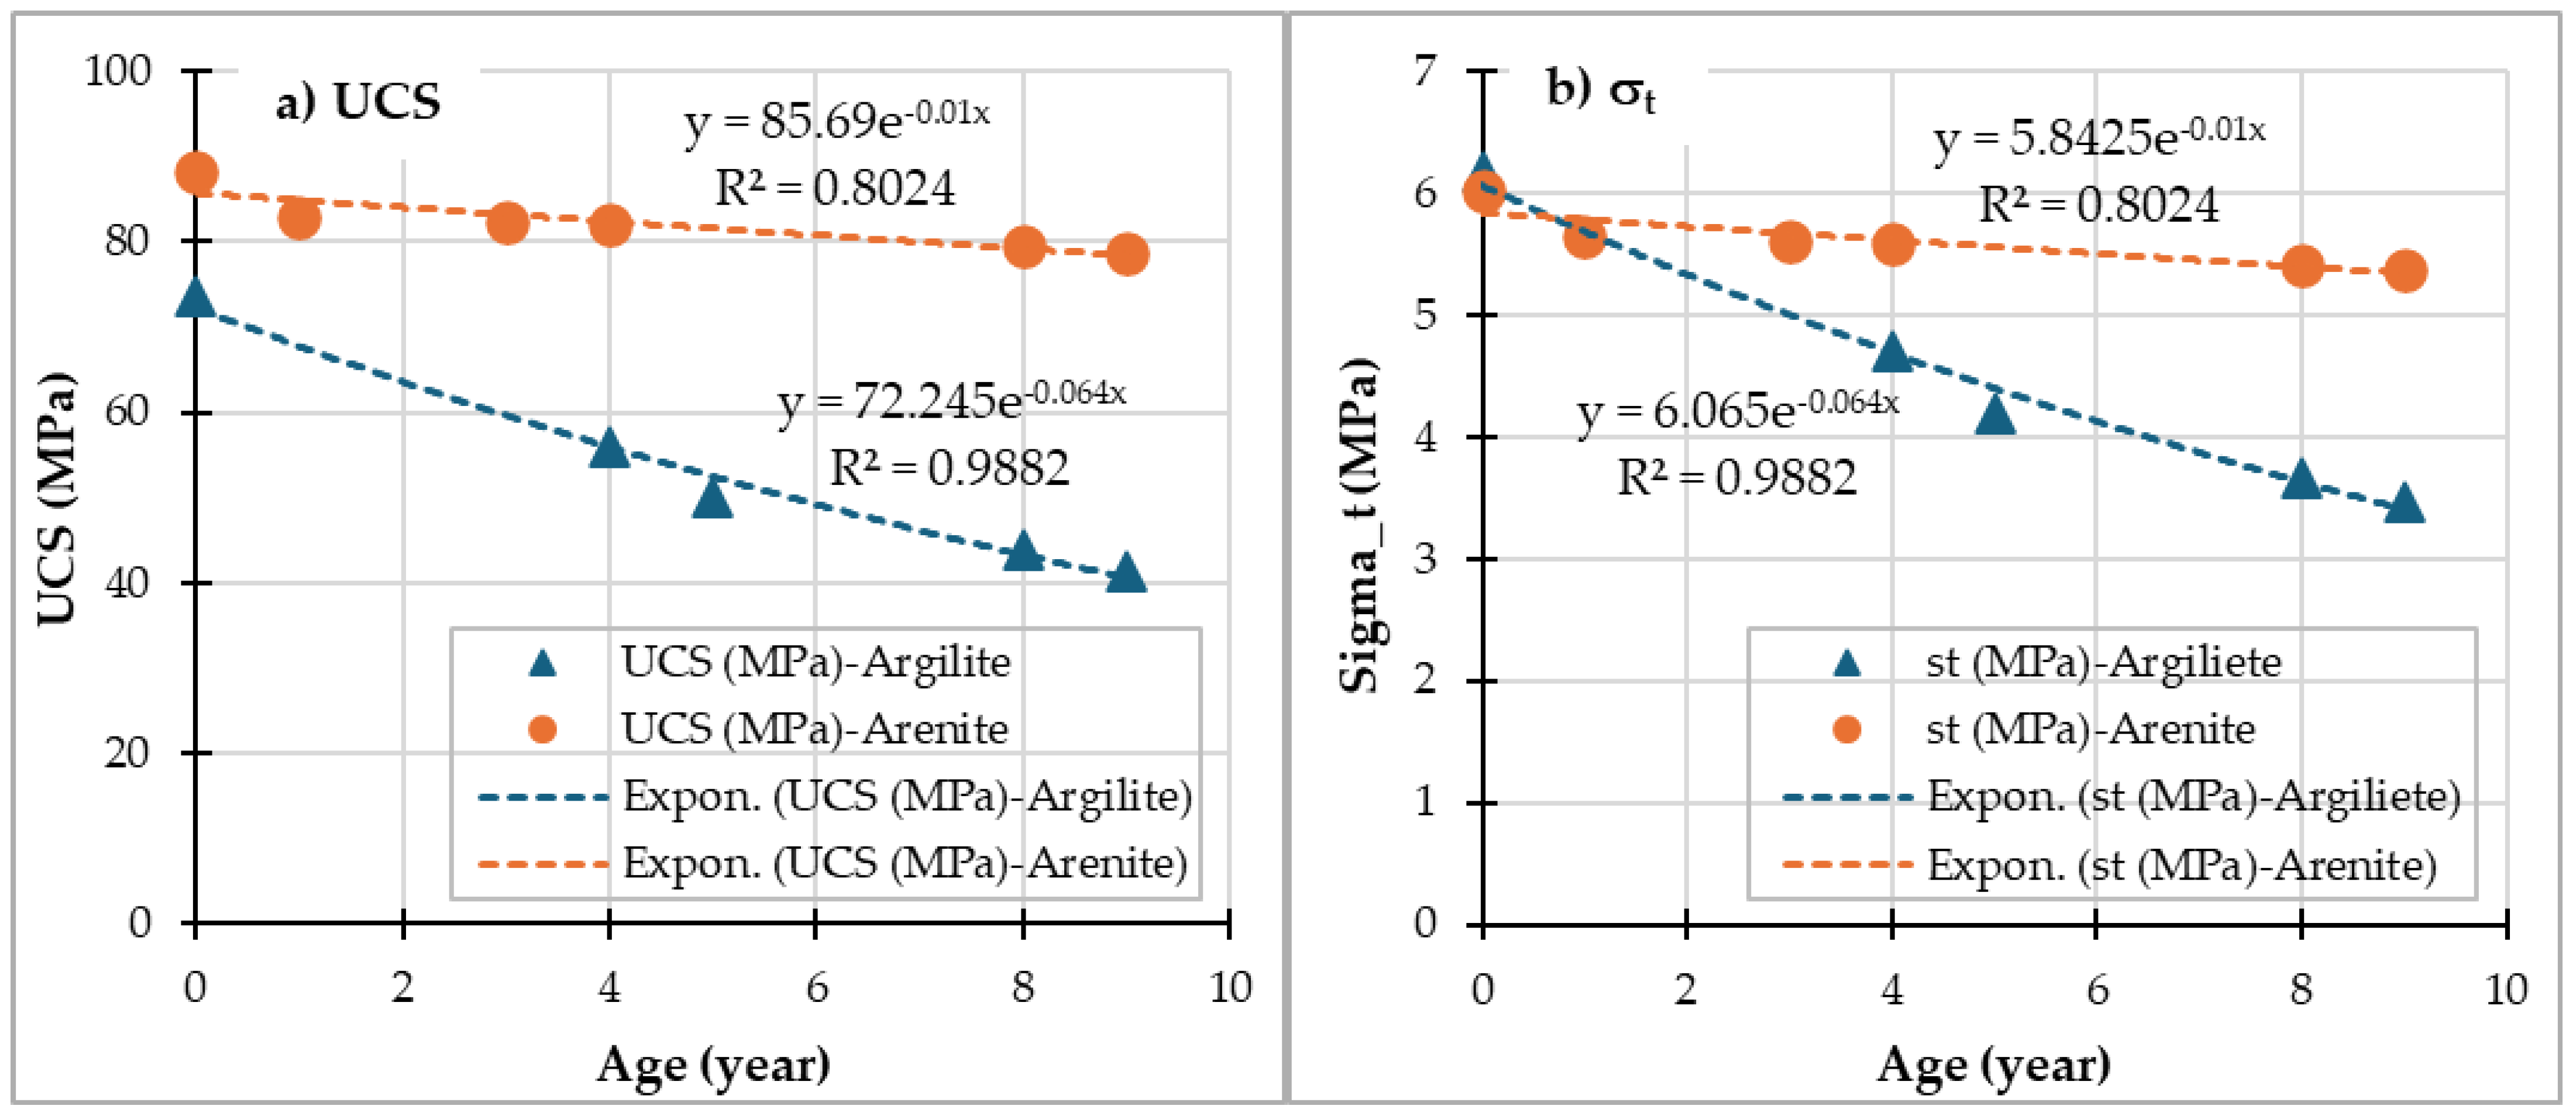
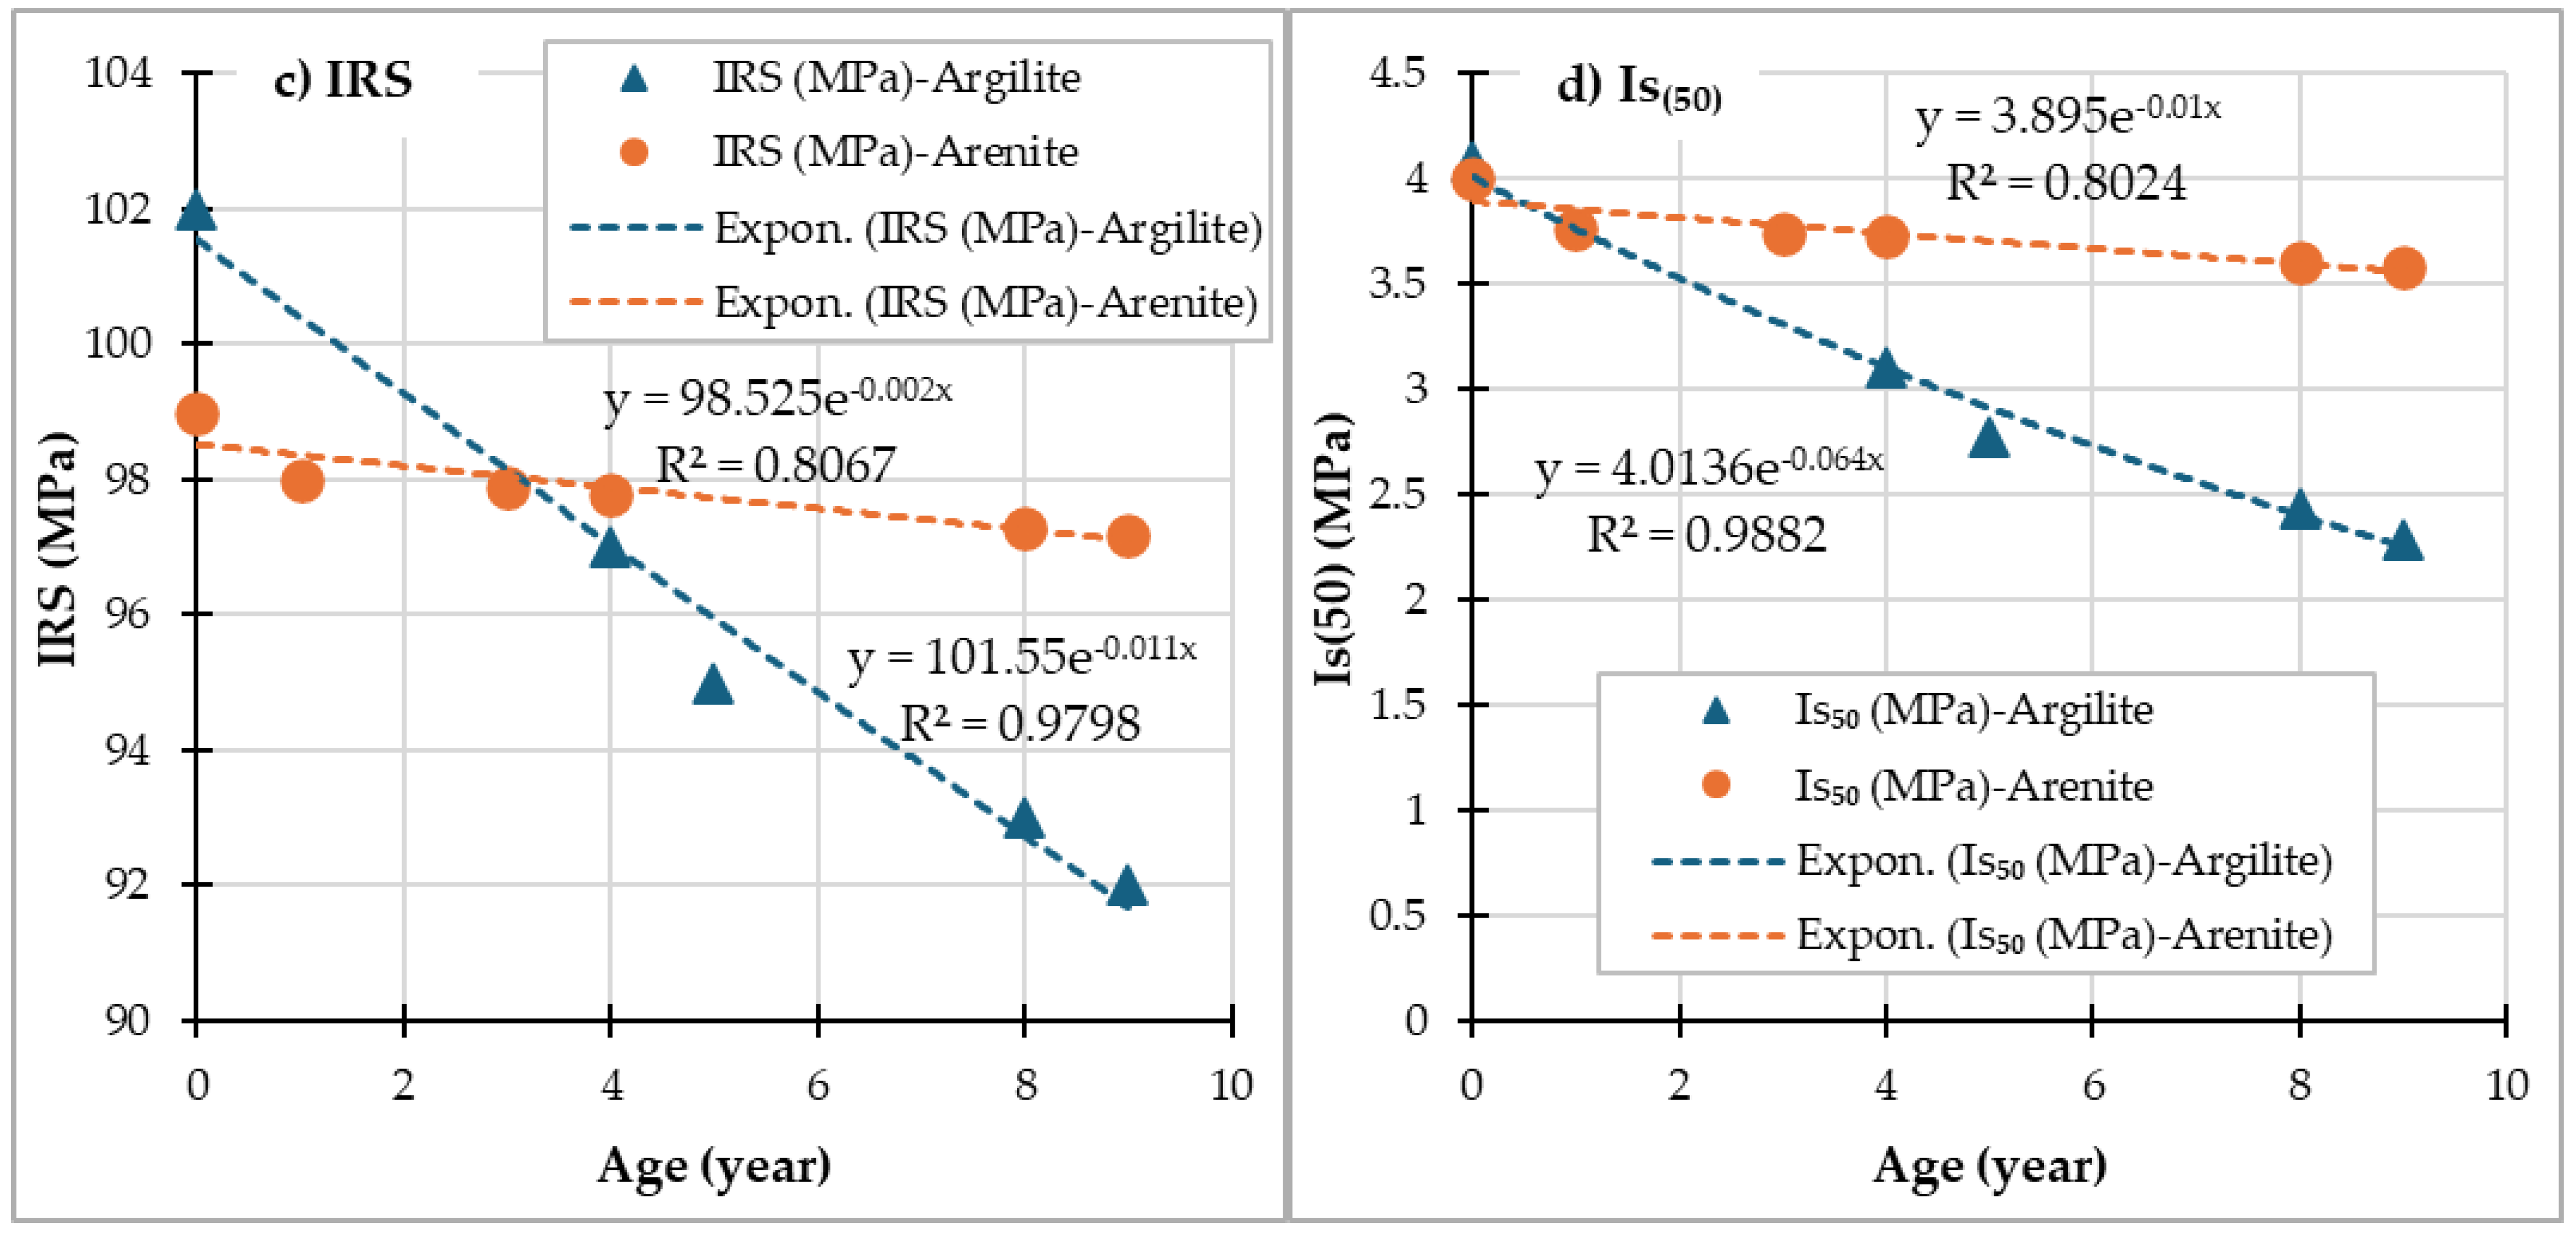
Figure 7 shows the correlations between the four geomechanical parameters (UCS, σt, IRS, and Is(50)) and the ages of the claystones (argillite) and sandstones (arenite) based on the data presented in Table 7. The time-dependent empirical models for all geomechanical parameters are presented in Table 8. High values of the coefficient of determination (R2) were obtained, and they are all ≥0.80.
Figure 7.
Correlations between various parameters as a function of rock age: (a) UCS, (b) Sigma-t, (c) IRS, and (d) Is(50).
Table 8.
Different correlation models and coefficients of determination (R2).
3.6. Petrographic Thin-Section Observations
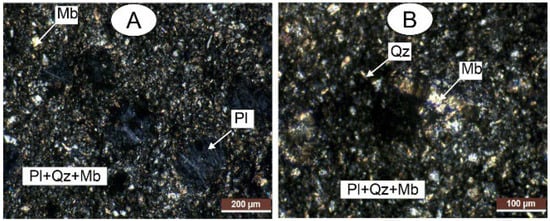
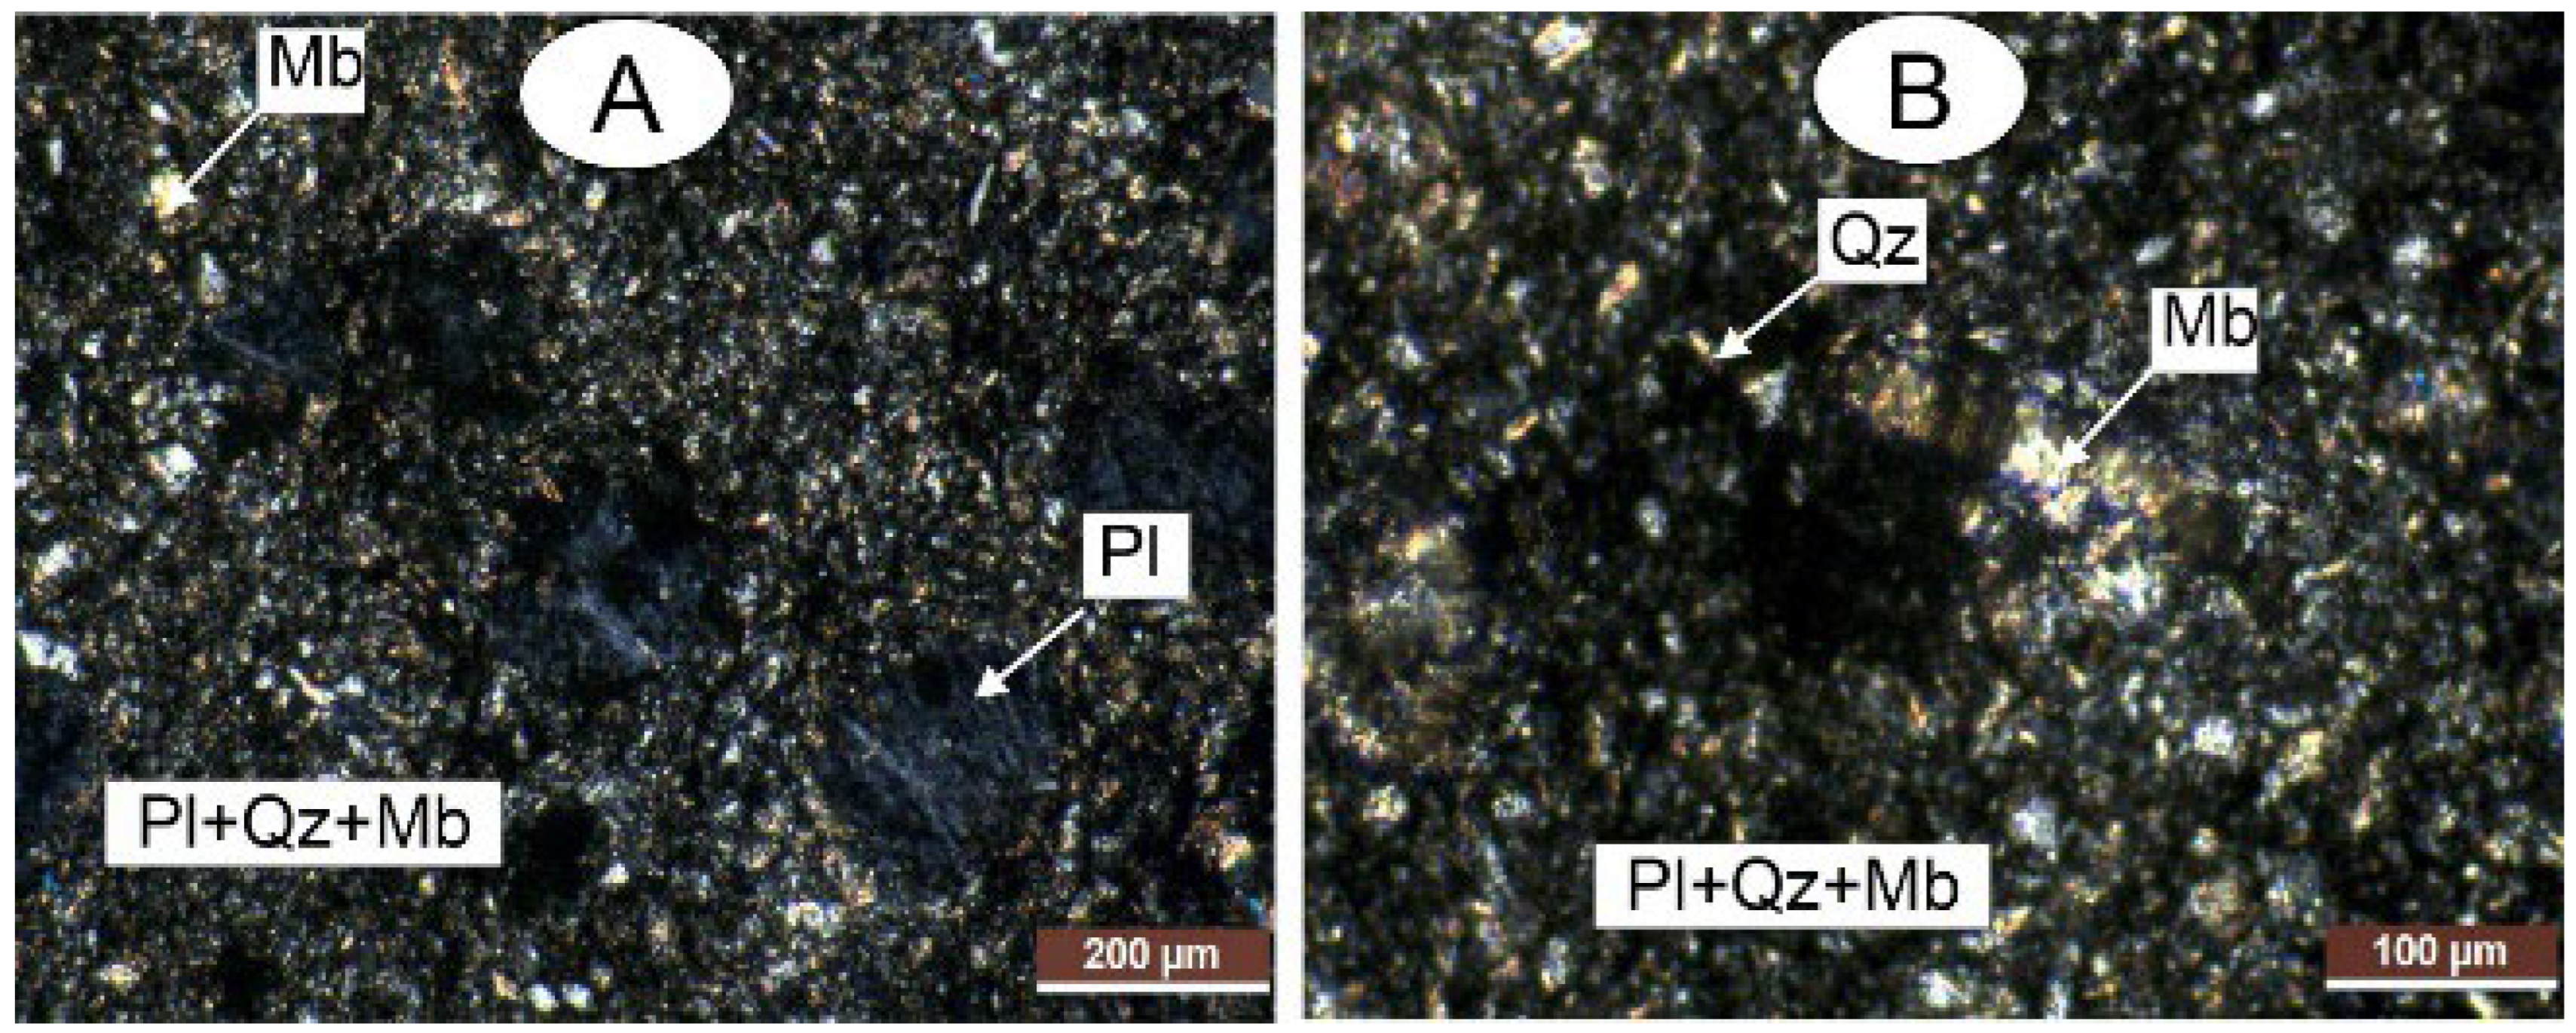
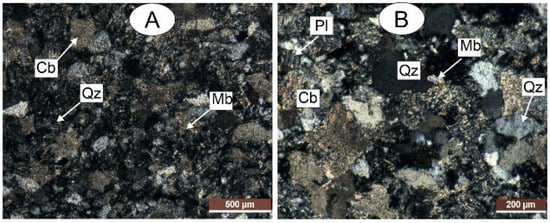
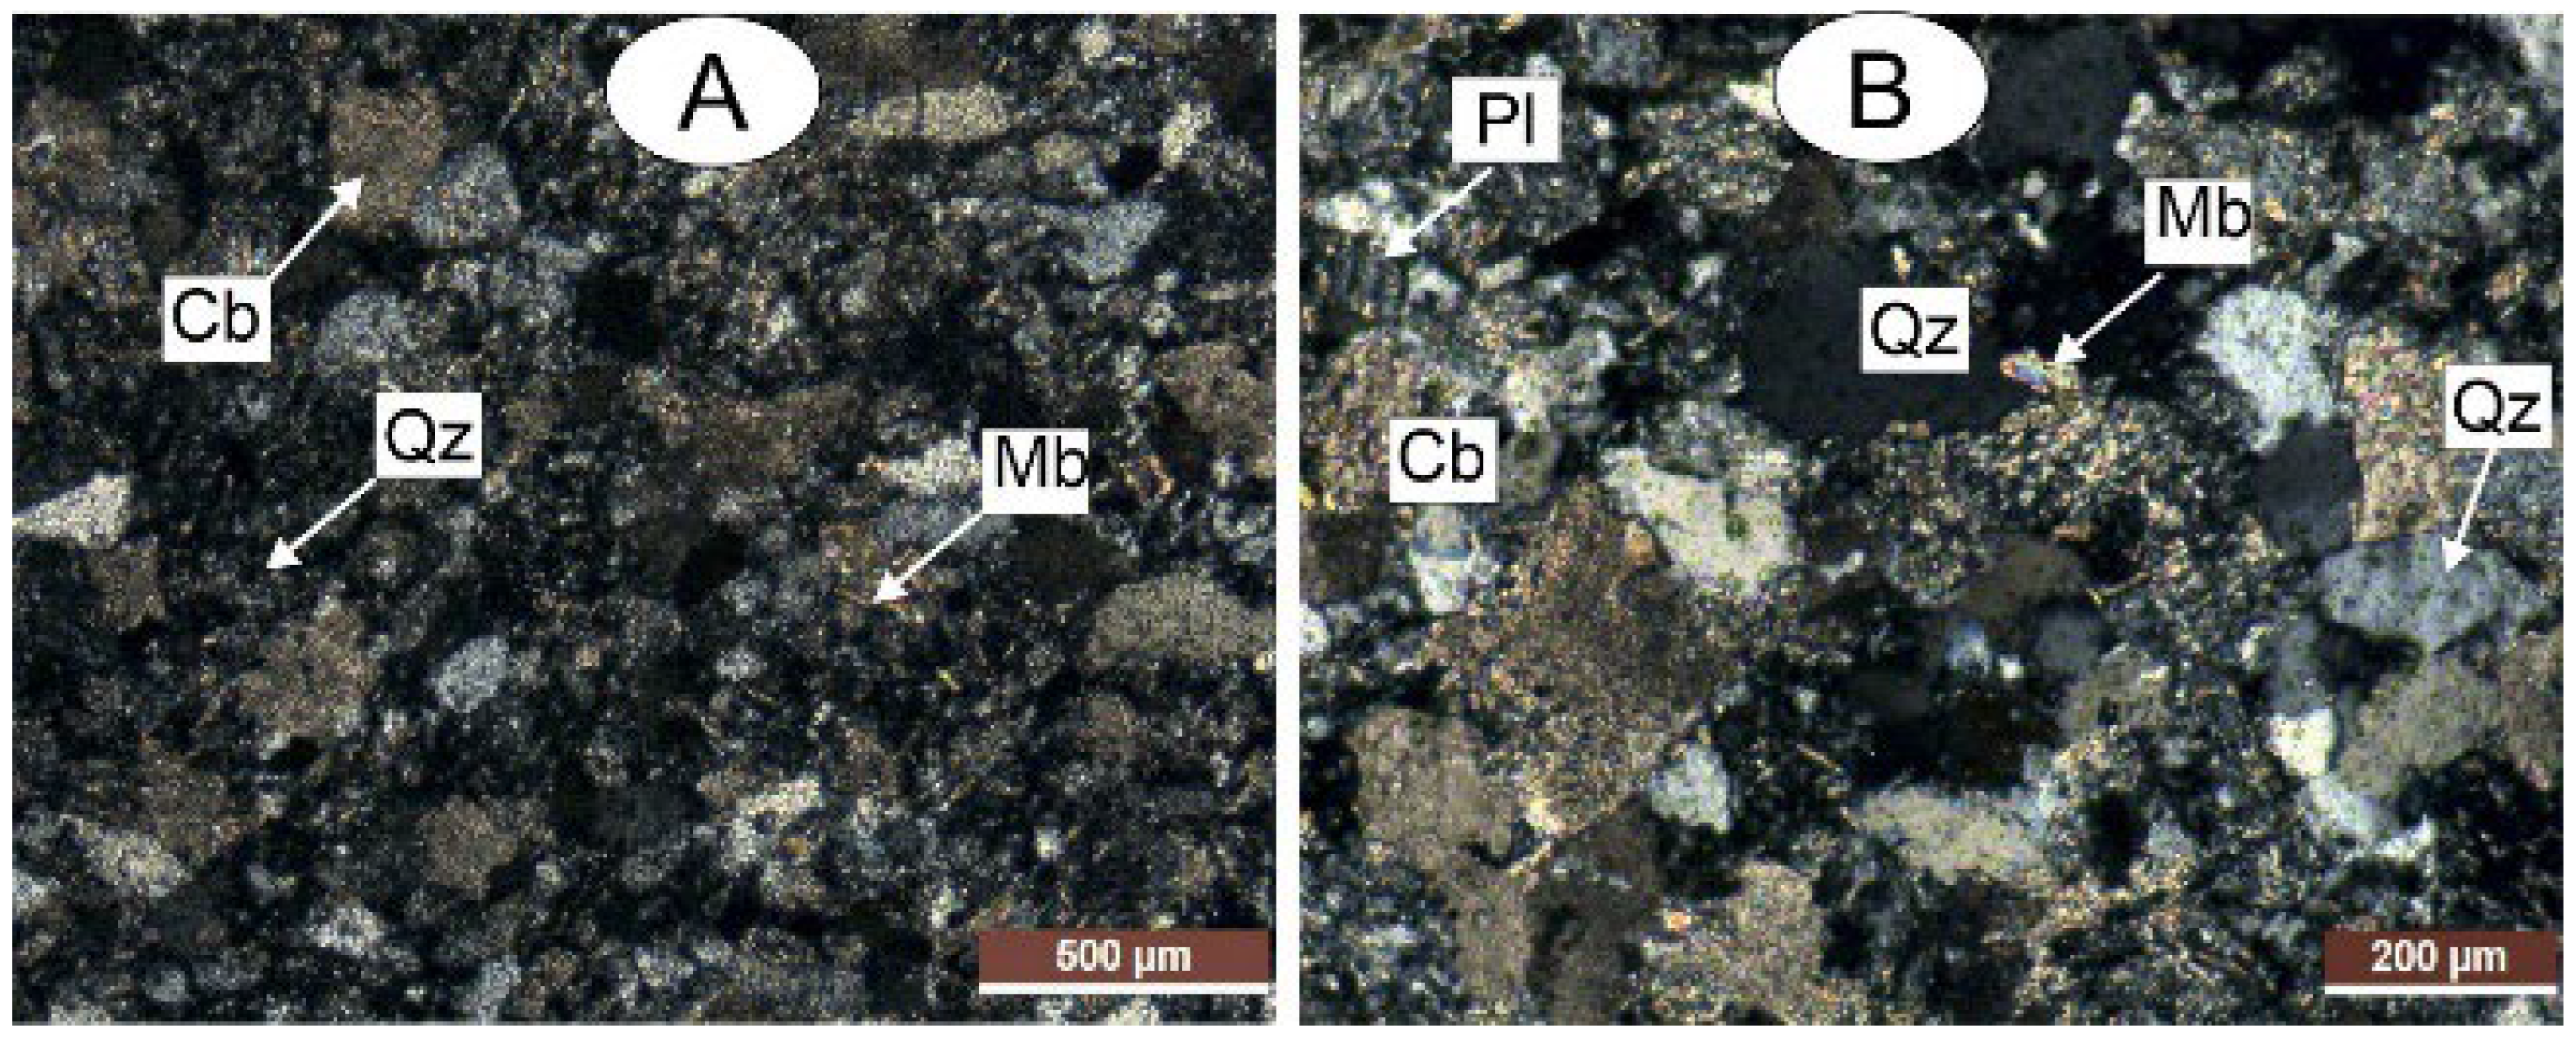
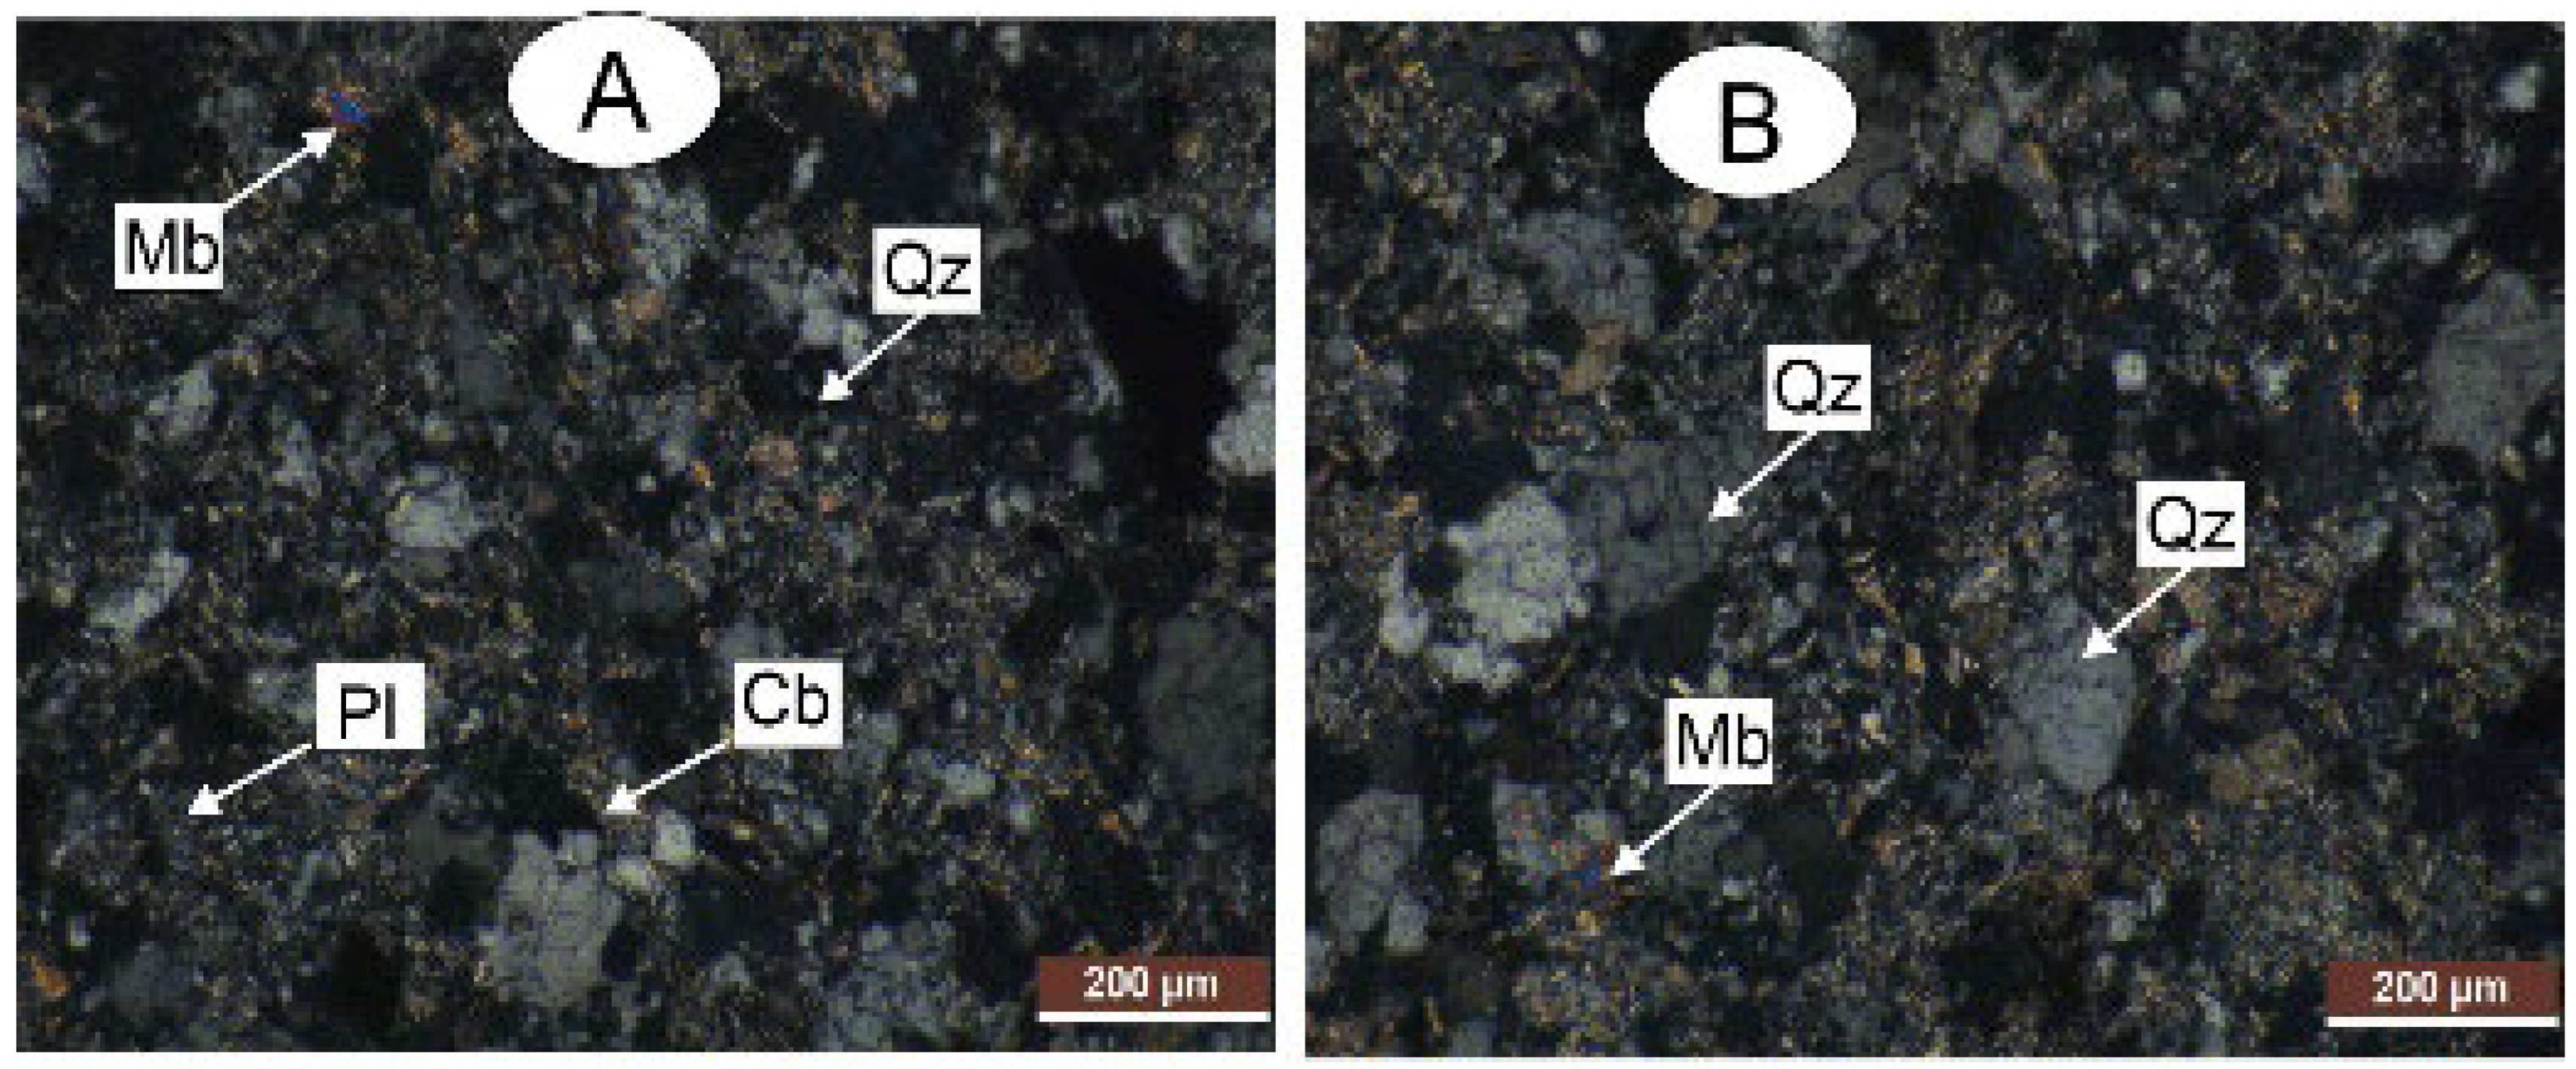
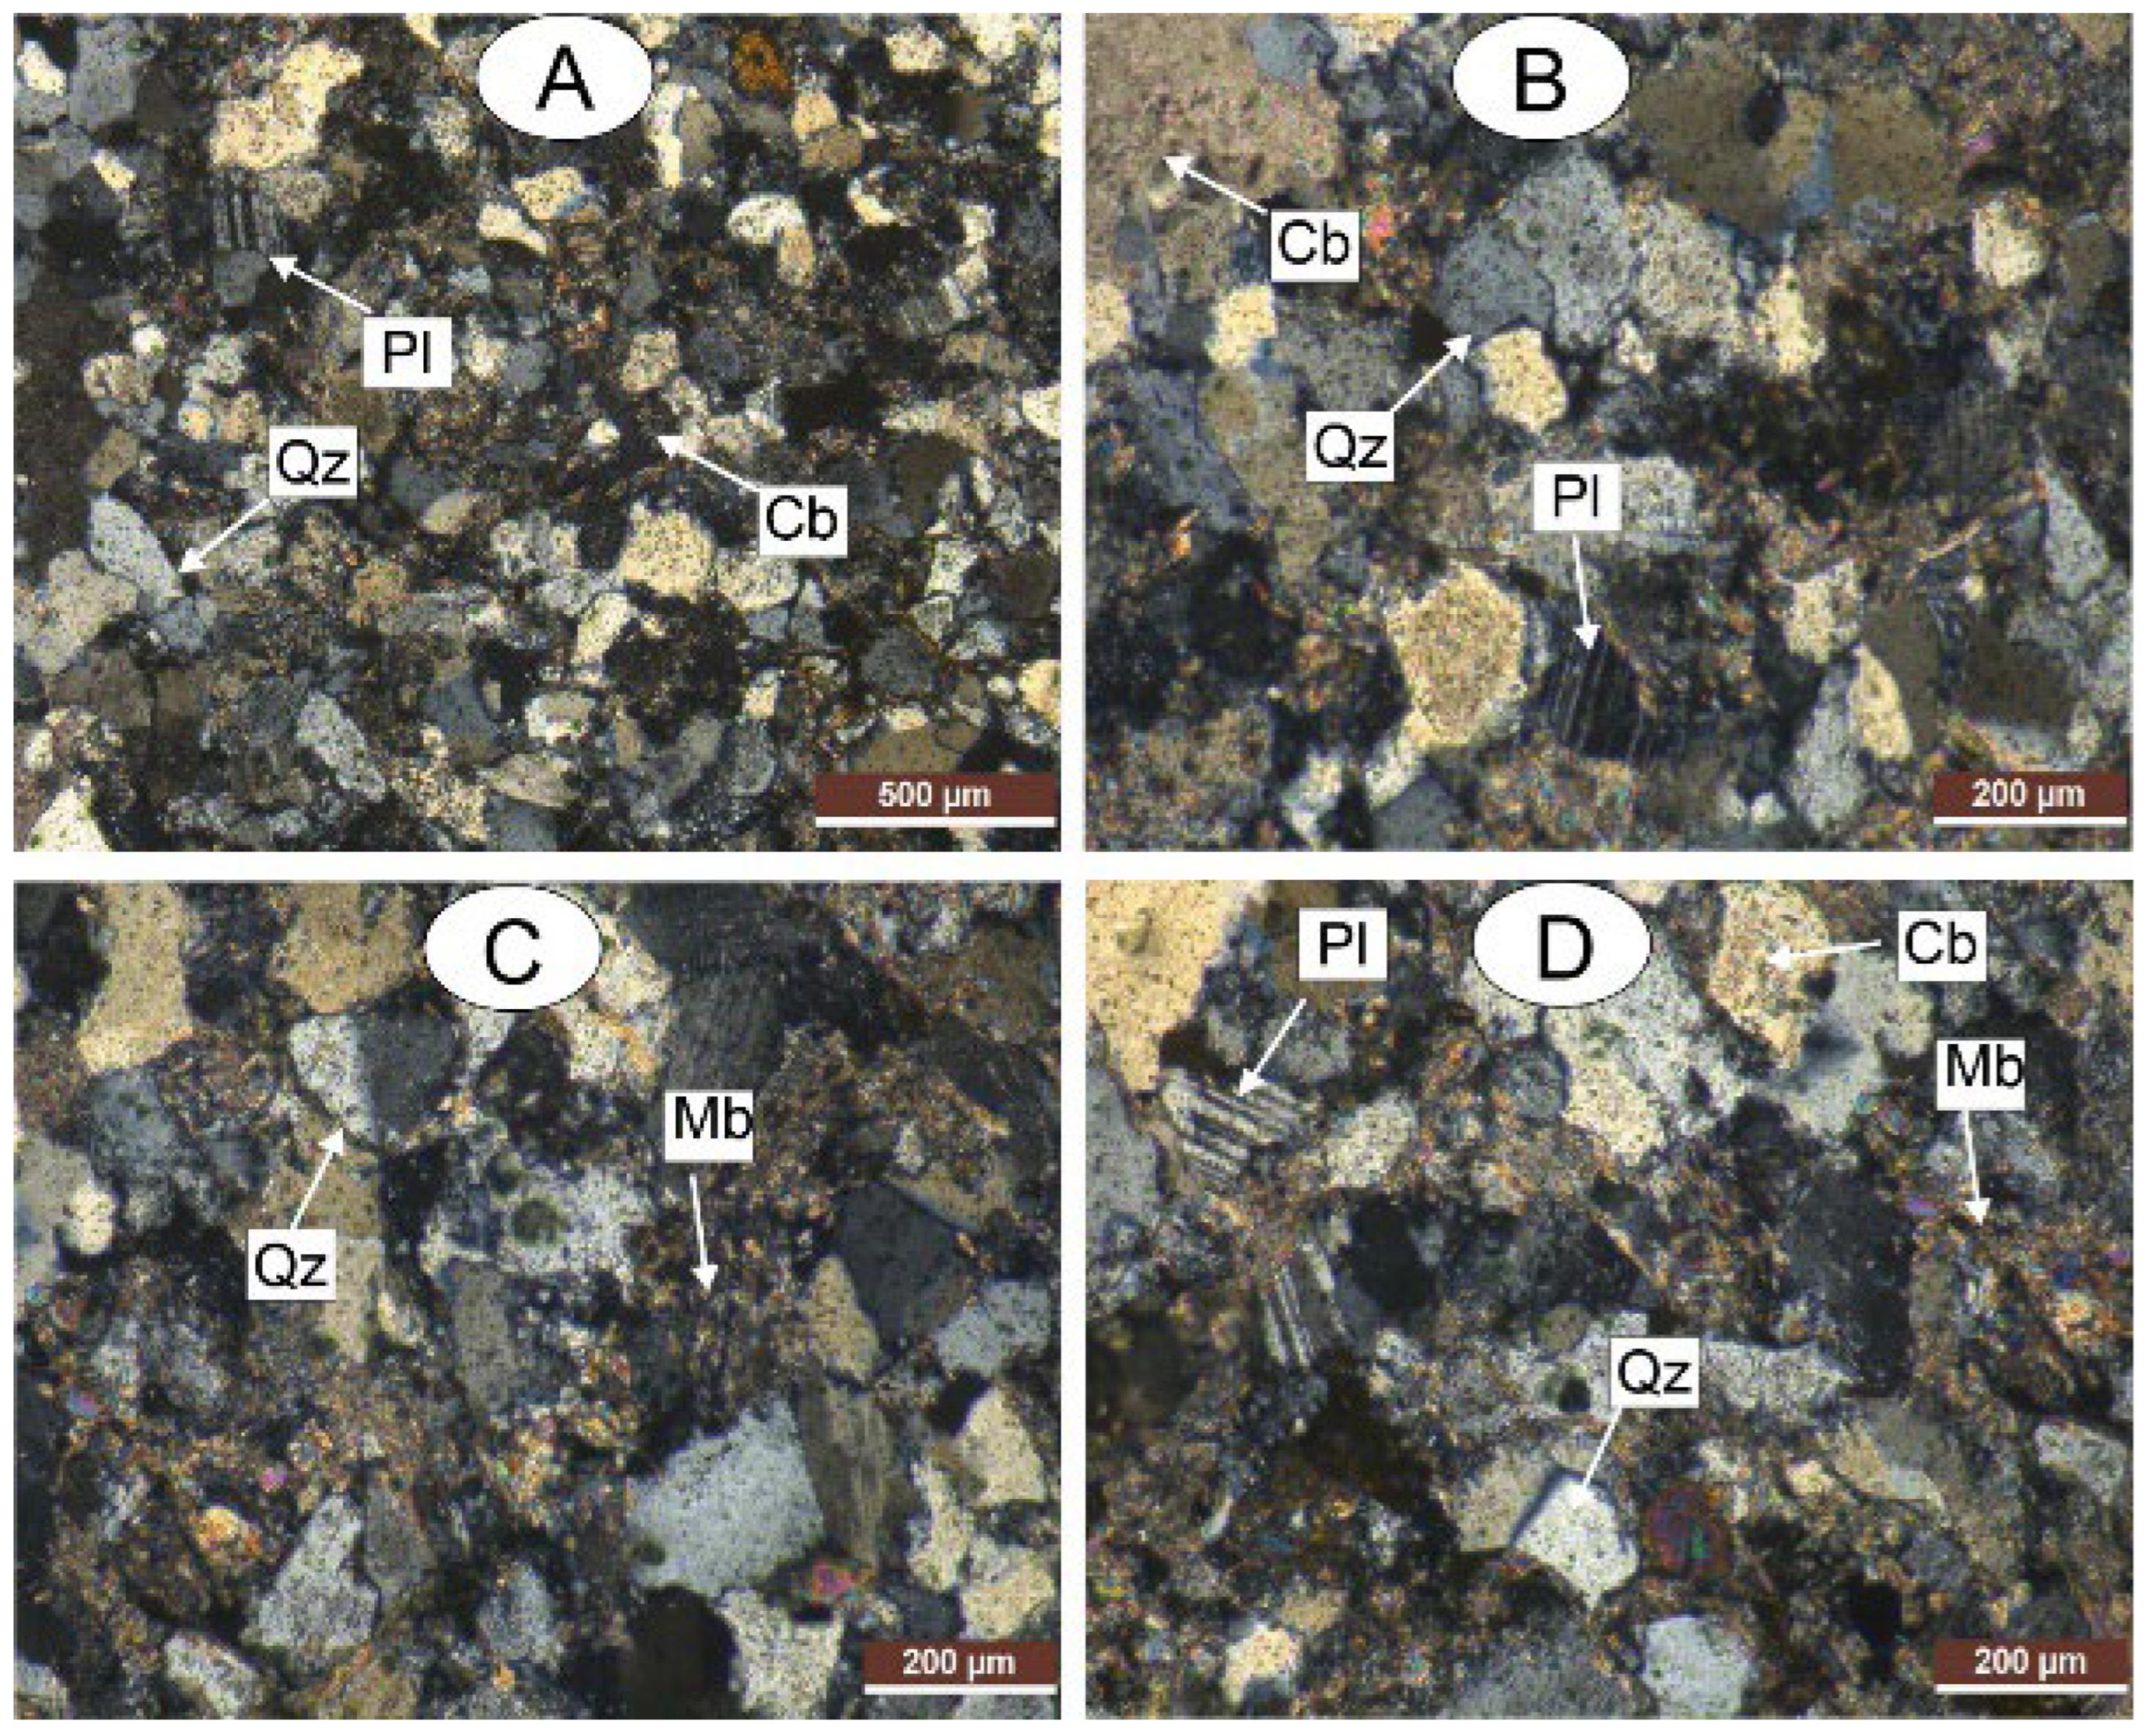
Thin-section analysis revealed a surprising degree of mineralogical stability over the 0–9-year interval for both arenites and argillites. No major transformation of mineral assembly was observed, and the microstructures remained globally preserved (Figure 8, Figure 9, Figure 10 and Figure 11).
Figure 8.
Claystone photo (after 0 years of exposure): (A) claystone with Mb, white mica and Pl, plagioclase; (B) claystone with Mb, white mica, and Qz, quartz.
Figure 9.
Claystone photo (after 9 years of exposure): (A) claystone with Qz, quartz; Cb, carbonates; Mb, white mica; (B) claystone with Pl, plagioclase; Cb, carbonates; Qz, quartz; Mb, white mica.
Figure 10.
Arenite photo (after 0 years of exposure): (A) Arenite with Qz, quartz; Cb, carbonates; Pl, plagioclase; Mb, white mica; (B) Arenite with Qz, quartz; Cb, carbonates; Mb, white mica.
Figure 11.
Arenite photo (after 9 years of exposure): (A,B) Arenite with Qz, quartz; Cb, carbonates; Pl, plagioclase; (C) Arenite with Mb, white mica and Qz, quartz; (D) Arenite with Mb, white mica; Pl, plagioclase; Qz, quartz; Cb, carbonates.
Arenites (0 years or intact): A well-cemented granular texture dominated by quartz (Qz) with subordinate carbonate cements (Cb), plagioclase (Pl), and white mica (Mb) was observed. There were tight grain contact and intact cementation.
Arenites (9 years): The mineral assemblage remained essentially unchanged. Quartz grains were intact. Carbonate cement shows no visible dissolution at the optical microscopy scale. No major neoformations were detected.
Argillites (0 years or intact): Compact, well-oriented phyllosilicate fabric with quartz, carbonates, plagioclase, and white mica was observed. There was tight foliation with low porosity.
Argillites (9 years): The mineralogical composition remained similar. The phyllosilicate fabric was globally preserved. No significant kaolinite development, sericitization, or secondary porosity was visible at the optical microscopy scale.
This mineralogical stability contrasts with the measurable mechanical and physical degradation documented by PLT and density measurements, suggesting that the dominant degradation mechanism over this short timeframe is microcracking and deterioration of discontinuity surfaces rather than volumetric chemical transformations of the mineral phases.
4. Discussion
4.1. Degradation Kinetics and Lithological Dependence
The field results demonstrate that rock mass properties at Essakane degrade measurably with atmospheric exposure time within a framework of low-to-moderate weathering intensity (grade 0–1) over 9 years. Argillites degrade approximately 3–4 times faster than arenites in terms of strength loss (Is(50): 44% vs. 5% over 9 years), while density changes remain relatively modest for both lithologies (1.8% for arenites, 0.7% for argillites).
This asymmetry between pronounced mechanical degradation and modest density change supports the interpretation that degradation is primarily controlled by microcracking and weakening of grain contact and discontinuity surfaces as opposed to significant mass removal through dissolution, an interpretation confirmed by the mineralogical stability observed in thin sections.
This lithological dependence can be explained by mineralogical composition. Argillites contain phyllosilicates (chlorite, sericite, and muscovite) that are intrinsically sensitive to thermal cycling and moisture fluctuations [25,26]. The platelet morphology of these minerals facilitates delamination under repeated thermal expansion–contraction cycles, while their capacity for water absorption and swelling generates internal stresses during wetting–drying cycles [10]. In contrast, arenites are dominated by mechanically and chemically stable quartz grains, and the modest degradation observed over 0–9 years is better interpreted as early-stage physical and micromechanical damage (microcracking, degradation along discontinuities, and stress relaxation) as opposed to demonstrable bulk dissolution of carbonate cement [11].
These findings are consistent with the observations made by Rahimi and Ghasemi [14], who documented systematic decreases in the dry density and compressive strength of schist rocks with an increase in weathering intensity in the Angouran open-pit mine (Iran). Similarly, Gupta and Rao [27] reported that the UCS of crystalline rocks decreased by 40–90% from the fresh state to the completely weathered state, with the degradation rate depending on mineralogical composition and fabric.
4.2. GSI as a Time-Dependent Parameter
A key finding of this study is that the GSI can be treated as a time-dependent parameter, decreasing systematically with exposure duration. The decrease from GSI 85 to 75 (arenites) and 80 to 70 (argillites) over 9 years represents a migration within the “blocky/good” to “blocky/fair” domains of the Hoek–Marinos chart [19,20]. This has important implications for the application of the Hoek–Brown failure criterion [20] to long-term slope stability analyses, since both rock mass strength (σcm) and deformation modulus (Erm) are functions of the GSI [19,20].
Using the Hoek–Brown criterion in combination with the measured GSI values and typical intact strength parameters for arenites and argillites, one can deduce that a decrease of 10–15 points in the GSI leads to a substantial reduction in calculated rock mass strength and thus in the expected factor of safety.
The concept of GSI degradation over time was first discussed qualitatively by Huisman [4]. Our study provides the first quantitative empirical evidence of this migration in a semi-arid mining context, with the GSI decreasing from 80–85 (intact) to 70–75 (after 9 years of exposure).
4.3. Comparison with Global Weathering Rates
The degradation rates observed at Essakane can be contextualized within the broader literature on rock mass weathering in engineered slopes (Table 9). The degradation rates at Essakane, particularly for argillites, are among the highest reported in the literature, likely reflecting the combined effects of intense thermal cycling and seasonal moisture fluctuations characteristic of the Sahelian climate.
Table 9.
Comparison of rock mass degradation rates across different climatic contexts.
4.4. Petrographic Evidence and Degradation Mechanisms
The petrographic thin-section analysis provides a critical insight: the mineralogical stability observed in both lithologies over 9 years contrasts with the measurable mechanical degradation documented by PLT, GSI, and IRS measurements. No major neoformations (kaolinite, smectite, or iron oxyhydroxides) were detected under optical microscopy, and the primary mineral assemblages (Qz, Cb, Pl, and Mb) remained globally intact.
This suggests that the degradation mechanisms acting over this relatively short timeframe (9 years) are predominantly physical and micromechanical: thermomechanical microcracking from diurnal temperature cycling, stress relaxation following excavation (unloading), and minor moisture-induced swelling/shrinkage of phyllosilicates. These processes degrade the rock mass at the discontinuity and grain-boundary scale without requiring bulk mineralogical transformation.
This finding implies that complementary analytical techniques with higher resolution than optical microscopy—such as SEM-EDS, X-ray diffraction (XRD), or X-ray microtomography—would be required to characterize the early-stage microstructural changes that drive the property degradation measured in this study. Such analyses have been conducted in parallel on the same lithologies using accelerated weathering protocols (Soxhlet, acid attack, and microwave treatment) and are the subject of a companion paper.
4.5. Implications for Slope Stability and Mine Closure
Slope design parameters: The GSI, density, and strength values for fresh rock used in current designs will not be representative of conditions 10, 20, or 50 years after closure. The regression equations (R2 = 0.80–0.99) allow designers to project property values to any future time horizon. It is important to stress that the present chronosequence sampling focuses on bench surfaces rather than on deep slope-scale rock mass conditions. The observed physico-mechanical changes mainly characterize the exposed bench surface zone and should therefore be interpreted as indicators of surficial weathering and degradation rather than of the intact inner rock mass. Consequently, the main engineering implication of the present study concerns the long-term condition of exposed slope faces, especially in the post-closure period, while the depth of weathering and its propagation into the rock mass remain to be quantified in future work.
Factor-of-safety projections: By inputting time-degraded GSI values into the Hoek–Brown failure criterion and limit-equilibrium software (e.g., Slide2 from Rocscience with the ultimate pit design of a depth of 390 m, angles of 50–85°), time-dependent FS trajectories can be computed. This type of time-dependent rock mass degradation should also be considered together with excavation-induced damage, which can significantly reduce the effective strength of slope-scale rock masses in large open pits [30]. Time-dependent degradation functions such as those obtained in this study can be integrated with modern open-pit slope monitoring frameworks to support proactive risk management [31].
Differential management strategies: The markedly different degradation rates justify lithology-specific slope management. Argillite-dominated slopes (particularly on the west wall, with its steeper geometry: an 80° face angle and a 53° inter-ramp) require more conservative designs. In practice, the observed time-dependent degradation trends could be incorporated into mining-oriented rock mass classification frameworks such as the IRMR/MRMR system for jointed rock masses, providing a more realistic basis for long-term slope design in weathered and weak rock domains [32].
Monitoring priorities: The measurable degradation within the first 5–9 years suggests that early post-closure monitoring is critical, focusing on argillite-dominated sectors.
4.6. Limitations
- The 9-year observation window represents a small fraction of the post-closure design life (50–500 years). Extrapolation beyond the calibration range carries the risk of increasing uncertainty.
- Weathering grades remained at 0–1 throughout the study period. The degradation kinetics at more advanced weathering stages (grades 2–4) may follow different patterns.
- Natural variability within each lithological unit may introduce scatter in measured properties.
- The chronosequence approach assumes there are similar initial conditions across all slope faces; variations in blast damage, groundwater seepage, and local microclimate may introduce confounding effects.
- The thin-section analysis was limited to optical microscopy and revealed mineralogical stability. Complementary SEM-EDS and XRD analyses would strengthen the microstructural characterization of early-stage degradation processes.
- A key limitation of this study is that the degradation trends documented here pertain to exposed bench surfaces; the depth and spatial extent of weathering in the slope rock mass remain to be quantified in future work.
5. Conclusions
Both arenites and argillites from the Essakane EMZ pit exhibit measurable, monotonic decreases in density, point load strength (Is(50)), derived parameters (UCS, σt, IRS), and GSI values with an increase in atmospheric exposure time (0–9 years), despite remaining at a low weathering grade (0–1).
The argillites mechanically degrade 3–4 times faster than arenites, with a 44% Is(50) reduction vs. 5% for the latter, while density changes remain modest (0.7% vs. 1.8% over 9 years). This differential behavior can be attributed to the phyllosilicate-rich fabric and sensitivity to thermal cycling.
Regression models yielded R2 values of 0.80 to 0.99 for all parameters and both lithologies, providing reliable predictive equations for slope stability modeling.
The GSI decreased from 85 to 75 (arenites) and 80 to 70 (argillites) over 9 years, confirming that the GSI should be treated as a time-dependent parameter in long-term slope design.
Petrographic analysis revealed surprising mineralogical stability with no major neoformations detectable, suggesting that degradation over this short timeframe is dominated by microcracking and discontinuity deterioration rather than volumetric chemical transformations.
The time–property relationships provide quantitative input parameters for numerical slope stability models (e.g., Slide2 from Rocscience with the Hoek–Brown criterion), enabling time-dependent FS projections for mine closure planning in semi-arid environments.
Author Contributions
Conceptualization, P.S. and S.N.; methodology, P.S.; validation, S.N. and T.B.; formal analysis, P.S.; investigation, P.S.; resources, S.N.; data curation, P.S.; writing—original draft preparation, P.S.; writing—review and editing, S.N. and T.B.; visualization, P.S.; supervision, S.N. and T.B.; project administration, S.N.; funding acquisition, S.N. All authors have read and agreed to the published version of the manuscript.
Funding
This research received no external funding.
Data Availability Statement
The data presented in this study are available on request from the corresponding author. The data are not publicly available due to confidentiality agreements with the mining company.
Acknowledgments
The authors gratefully acknowledge IAMGOLD Corporation and the Essakane mine management for providing access to the mine site, geological data, and mine-planning records. The authors thank the geotechnical department of Essakane SA for the field support during sampling campaigns. The authors acknowledge the laboratory of Université Joseph Ki-Zerbo for their assistance with thin-section preparation. The authors also acknowledge the financial support provided by IAMGOLD.
Conflicts of Interest
The coauthor, Pierre Sawadogo, was employed by the company Essakane SA Mine, IAMGOLD Corporation. The remaining coauthors declare that the research was conducted in the absence of any commercial or financial relationships that could be construed as a potential conflict of interest.
Abbreviations
The following abbreviations are used in this manuscript:
| AI | Alteration Index |
| BSh | Hot Semi-Arid Climate (Köppen) |
| Cb | Carbonates |
| EMZ | Essakane Main Zone |
| F-T | Freeze–Thaw |
| FS | Factor of Safety |
| GSI | Geological Strength Index |
| IRS | Intact Rock Strength |
| ISRM | International Society for Rock Mechanics |
| Mb | White Mica (Muscovite) |
| Pl | Plagioclase |
| PLT | Point Load Test |
| PPL | Plane-Polarized Light |
| Qz | Quartz |
| UCS | Uniaxial Compressive Strength |
| ρ | Density |
| σt | Indirect Tensile Strength |
| SSPC | Slope Stability Probability Classification |
| XPL | Cross-Polarized Light |
References
- Read, J.; Stacey, P. Guidelines for Open Pit Slope Design; CSIRO Publishing: Melbourne, Australia, 2009. [Google Scholar]
- Cho, Y.-C.; Song, Y.-S. Deformation measurements and a stability analysis of the slope at a coal mine waste dump. Ecol. Eng. 2014, 68, 189–199. [Google Scholar] [CrossRef] [Scilit]
- Hack, R.; Price, D.; Rengers, N. A new approach to rock slope stability—A probability classification (SSPC). Bull. Eng. Geol. Environ. 2003, 62, 167–184. [Google Scholar] [CrossRef] [Scilit]
- Huisman, M. Assessment of Rock Mass Decay in Artificial Slopes. Ph.D. Thesis, ITC, Delft, The Netherlands, 2006. [Google Scholar]
- Stacey, P. General slope design criteria. In Guidelines for Open Pit Slope Design; Read, J., Stacey, P., Eds.; CSIRO Publishing: Melbourne, Australia, 2009; pp. 79–100. [Google Scholar]
- ANCOLD. Guidelines on Tailings Dams; Australian National Committee on Large Dams: Melbourne, Australia, 2012. [Google Scholar]
- Fookes, P.G.; Dearman, W.R.; Franklin, J.A. Some engineering aspects of rock weathering. Q. J. Eng. Geol. Hydrogeol. 1971, 4, 139–185. [Google Scholar] [CrossRef] [Scilit]
- Lucchesi, A.; D’Ercole, R.; Durand, A.; Lhomme, J.P. Risques Naturels au Sahel; IRD Éditions: Montpellier, France, 2005. [Google Scholar]
- Hale, P.A.; Shakoor, A. A laboratory investigation of the effects of cyclic heating and cooling on sandstones. Environ. Eng. Geosci. 2003, 9, 117–130. [Google Scholar] [CrossRef] [Scilit]
- Erguler, Z.A.; Ulusay, R. Water-induced variations in mechanical properties of clay-bearing rocks. Int. J. Rock Mech. Min. Sci. 2009, 46, 355–370. [Google Scholar] [CrossRef] [Scilit]
- Calcaterra, D.; Parise, M. Weathering as a Predisposing Factor to Slope Movements; Geological Society Special Publication; Geological Society of London: London, UK, 2010; Volume 23, pp. 1–4. [Google Scholar]
- Tran-Manh, H.; Sulem, J.; Subrin, D. Progressive degradation of rock properties and time-dependent behavior of deep tunnels. Acta Geotech. 2016, 11, 693–711. [Google Scholar] [CrossRef] [Scilit]
- Saunders, J. Weak rock open pit slope stability considerations to inform closure planning. In Proceedings of the 14th International Conference on Mine Closure; QMC Group: Ulaanbaatar, Mongolia, 2021; Paper 119; pp. 135–148. [Google Scholar]
- Rahimi, R.; Ghasemi, E. Slope stability analysis of an open pit mine considering the weathering agent. Eng. Geol. 2024, 333, 107503. [Google Scholar] [CrossRef] [Scilit]
- Liu, W.; Sheng, G.; Kang, X.; Yang, M.; Li, D.; Wu, S. Slope stability analysis of open pit mine considering weathering effects. Appl. Sci. 2024, 14, 8449. [Google Scholar] [CrossRef] [Scilit]
- Birkeland, P.W. Soils and Geomorphology, 3rd ed.; Oxford University Press: New York, NY, USA, 1999. [Google Scholar]
- ISRM. The complete ISRM suggested methods for rock characterization. In Suggested Methods; Ulusay, R., Hudson, J.A., Eds.; ISRM: Ankara, Turkey, 2007. [Google Scholar]
- Chatelin, Y. Les Sols Ferrallitiques; ORSTOM: Paris, France, 1970. [Google Scholar]
- Essakane, S.A. Mine Planning Records 2010–2023; Internal Report; IAMGOLD Essakane SA: Ouagadougou, Burkina Faso, 2023. [Google Scholar]
- Hoek, E.; Brown, E.T. The Hoek–Brown failure criterion and GSI—2018 edition. J. Rock Mech. Geotech. Eng. 2019, 11, 445–463. [Google Scholar] [CrossRef] [Scilit]
- Franklin, J.A. Suggested method for determining point load strength (ISRM). Int. J. Rock Mech. Min. Sci. 1985, 22, 51–60. [Google Scholar]
- Wang, M.; Xu, W.; Chen, D.; Li, J.; Mu, H.; Mi, J.; Wu, Y. Summary of the Transformational Relationship between Point Load Strength Index and Uniaxial Compressive Strength of Rocks. Sustainability 2022, 14, 12456. [Google Scholar] [CrossRef] [Scilit]
- Kong, F.; Xue, Y.; Qiu, D.; Li, Z.; Chen, Q.; Song, Q. Impact of grain size or anisotropy on correlations between rock tensile strength and some rock index properties. Geomech. Eng. 2021, 27, 131–150. [Google Scholar]
- MacKenzie, W.S.; Adams, A.E. A Colour Atlas of Rocks and Minerals in Thin Section; Manson Publishing: London, UK, 1994. [Google Scholar]
- Velde, B. Introduction to Clay Minerals; Chapman & Hall: London, UK, 1992. [Google Scholar]
- Martin, R.P. Weathering of igneous rocks in Hong Kong. Proc. Inst. Civ. Eng. 1986, 80, 689–713. [Google Scholar]
- Gupta, A.S.; Rao, K.S. Weathering effects on the strength of crystalline rocks. Eng. Geol. 2000, 56, 257–274. [Google Scholar] [CrossRef] [Scilit]
- Poudel, S.; Tamrakar, N.K. Relationship between Point Load Strength Index and Slake Durability Index of sandstones from the Amile Formation, Tansen Group, West-Central Nepal. Soils Rocks 2025, 48, E2025006924. [Google Scholar] [CrossRef] [Scilit]
- Martin, C.D.; Stacey, P. Pit slopes in weathered and weak rocks. In Proceedings of the Slope Stability 2018, Sevilla, Spain, 10–13 April 2018; Australian Centre for Geomechanics: Perth, Australia, 2018. [Google Scholar]
- Lorig, L. Quantifying excavation-induced rock mass damage in large open pits. In Proceedings of the 2020 International Symposium on Slope Stability in Open Pit Mining and Civil Engineering; Australian Centre for Geomechanics: Perth, Australia, 2020; pp. 969–982. [Google Scholar]
- Le Roux, R.; Sepehri, M.; Khaksar, S.; Murray, I. Slope Stability Monitoring Methods and Technologies for Open-Pit Mining: A Systematic Review. Mining 2025, 5, 32. [Google Scholar] [CrossRef] [Scilit]
- Laubscher, D.H.; Jakubec, J. The IRMR/MRMR rock mass classification system for jointed rock masses. In Underground Mining Methods; Hustrulid, W.A., Bullock, R.L., Eds.; SME: Littleton, CO, USA, 2001; pp. 475–481. [Google Scholar]

Disclaimer/Publisher’s Note: The statements, opinions and data contained in all publications are solely those of the individual author(s) and contributor(s) and not of MDPI and/or the editor(s). MDPI and/or the editor(s) disclaim responsibility for any injury to people or property resulting from any ideas, methods, instructions or products referred to in the content. |
© 2026 by the authors. Licensee MDPI, Basel, Switzerland. This article is an open access article distributed under the terms and conditions of the Creative Commons Attribution (CC BY) license.