


Abstract
Mining operations conducted beneath water-bearing strata pose significant risks associated with the development of water-conducting fracture zones in the overburden. The height criterion for this parameter is critical to ensuring the stability of underground mine workings and preventing the risk of water inrush incidents. The research is based on physical and numerical simulations and aims to forecast the development of the water-conducting fracture zone. The methodology is based on in situ hydrogeology data, geotechnical boreholes, physical 2D modeling of rock strata, discrete element modeling using UDEC, and finite–discrete element modeling using Prorock software. A physical model of layered rock mass is constructed to simulate unfilled excavation areas induced deformation under real polymetallic ore field conditions. Based on the results, relationships between vertical subsidence, layer curvature, inclination, and the height of the water-conducting fracture zone were obtained. Particular attention is given to the effects of tectonic discontinuities, chamber geometry, and backfilling on fracture development. A stepwise excavation sequence is simulated to reproduce field conditions and assess the evolution of stress and deformation fields in the overburden. The study reveals that the propagation of the fracture zone around a mine excavation adheres to a polynomial law, characterized by an increase in height concurrent with the expansion of the excavation. This approach enables the design of safe extraction strategies beneath aquifers or surface water bodies. The proposed framework is expected to enhance prediction accuracy and reduce uncertainties.
1. Introduction
The water-conducting fracture zone is one of the most critical factors affecting the safety of mining operations, as it provides pathways for water inflow from overlying aquifers into underground mine workings. In deep mining of polymetallic deposits, stress redistribution and rock failure above the mined panels can result in extensive fracture networks potentially linking the mine workings to confined aquifers [1,2]. Water inflow incidents often occur when such fractures reach aquifers or surface karst systems, emphasizing the need for accurate prediction of the height and connectivity of the water-conducting fracture zone. Conventional monitoring techniques, including borehole drilling, water pressure testing, geophysical logging, and surface deformation surveys, provide data on existing fractures, however, their applicability is limited to accessible areas [3,4]. Recent works focus on empirical and data-driven prediction models [5], where a multiple nonlinear regression model is used for predicting the fracture water-conducting zone height based on mining thickness, depth, and rock properties. In [6], principal component analysis is used to refine height predictions in closely spaced formations. Geophysical methods, such as elastic-wave prospecting, have also been applied to detect fractured zones [7]. However, complex geologic structures, including tectonic faults, discontinuities, and karst, as well as technological mining conditions, including backfilling of the excavation space with hardening mixtures and alternating mining sequences (multiple panels, repeated workings), create difficulties for purely empirical approaches.
Integrated physical and numerical modeling is increasingly utilized in rock mechanics to tackle these problems. Physical modeling based on similarity theory allows for reproducing overburden collapse and recreating fracture propagation under controlled technology, loading, and boundary conditions [8]. Similarly, numerical modeling (UDEC, Prorock) based on the discrete-element and finite–discrete element methods allows for a systematic analysis of stress redistribution and fracture propagation under different technological mining schemes [4,8]. At Saint Petersburg Mining University, researchers have shown that monitoring surface subsidence, inclination, and curvature can infer the development of the fracture water-conducting zone [9]. An exponential relationship was identified between the height of the water-conducting fracture zone and the cumulative extracted thickness, enabling identification of hazardous areas for water-bearing fractures [9]. Litvinenko et al. (2023) emphasized combining field deformation data with geomechanical analysis for mine planning [10]. Despite these advances, there is a need to validate predictive models through controlled experiments.
In this study, to ensure the geomechanical safety of the mine, a combined physical and numerical modeling is proposed to predict the height and extension of water-conducting fracture zones above the mine workings. Geomechanical modeling of real complex geological and hydrogeological conditions of the ore body with changing tectonic setting, integrated with a physical model to reproduce the development of natural fracturing in near-real conditions, as well as with a calibrated numerical model, will allow for an analysis of the resulting shifts and deformations of the rock massif. The integration of both approaches is aimed at improving the reliability of predictions of the height of water-conducting fracture zone development in complex conditions in accordance with the rigorous methods of geomechanics research [4,8].
2. Materials and Methods
2.1. Research Line Methodology
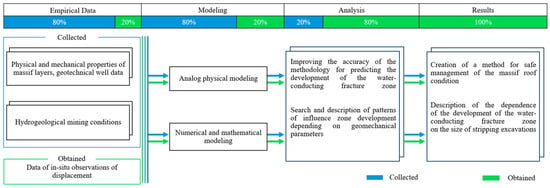
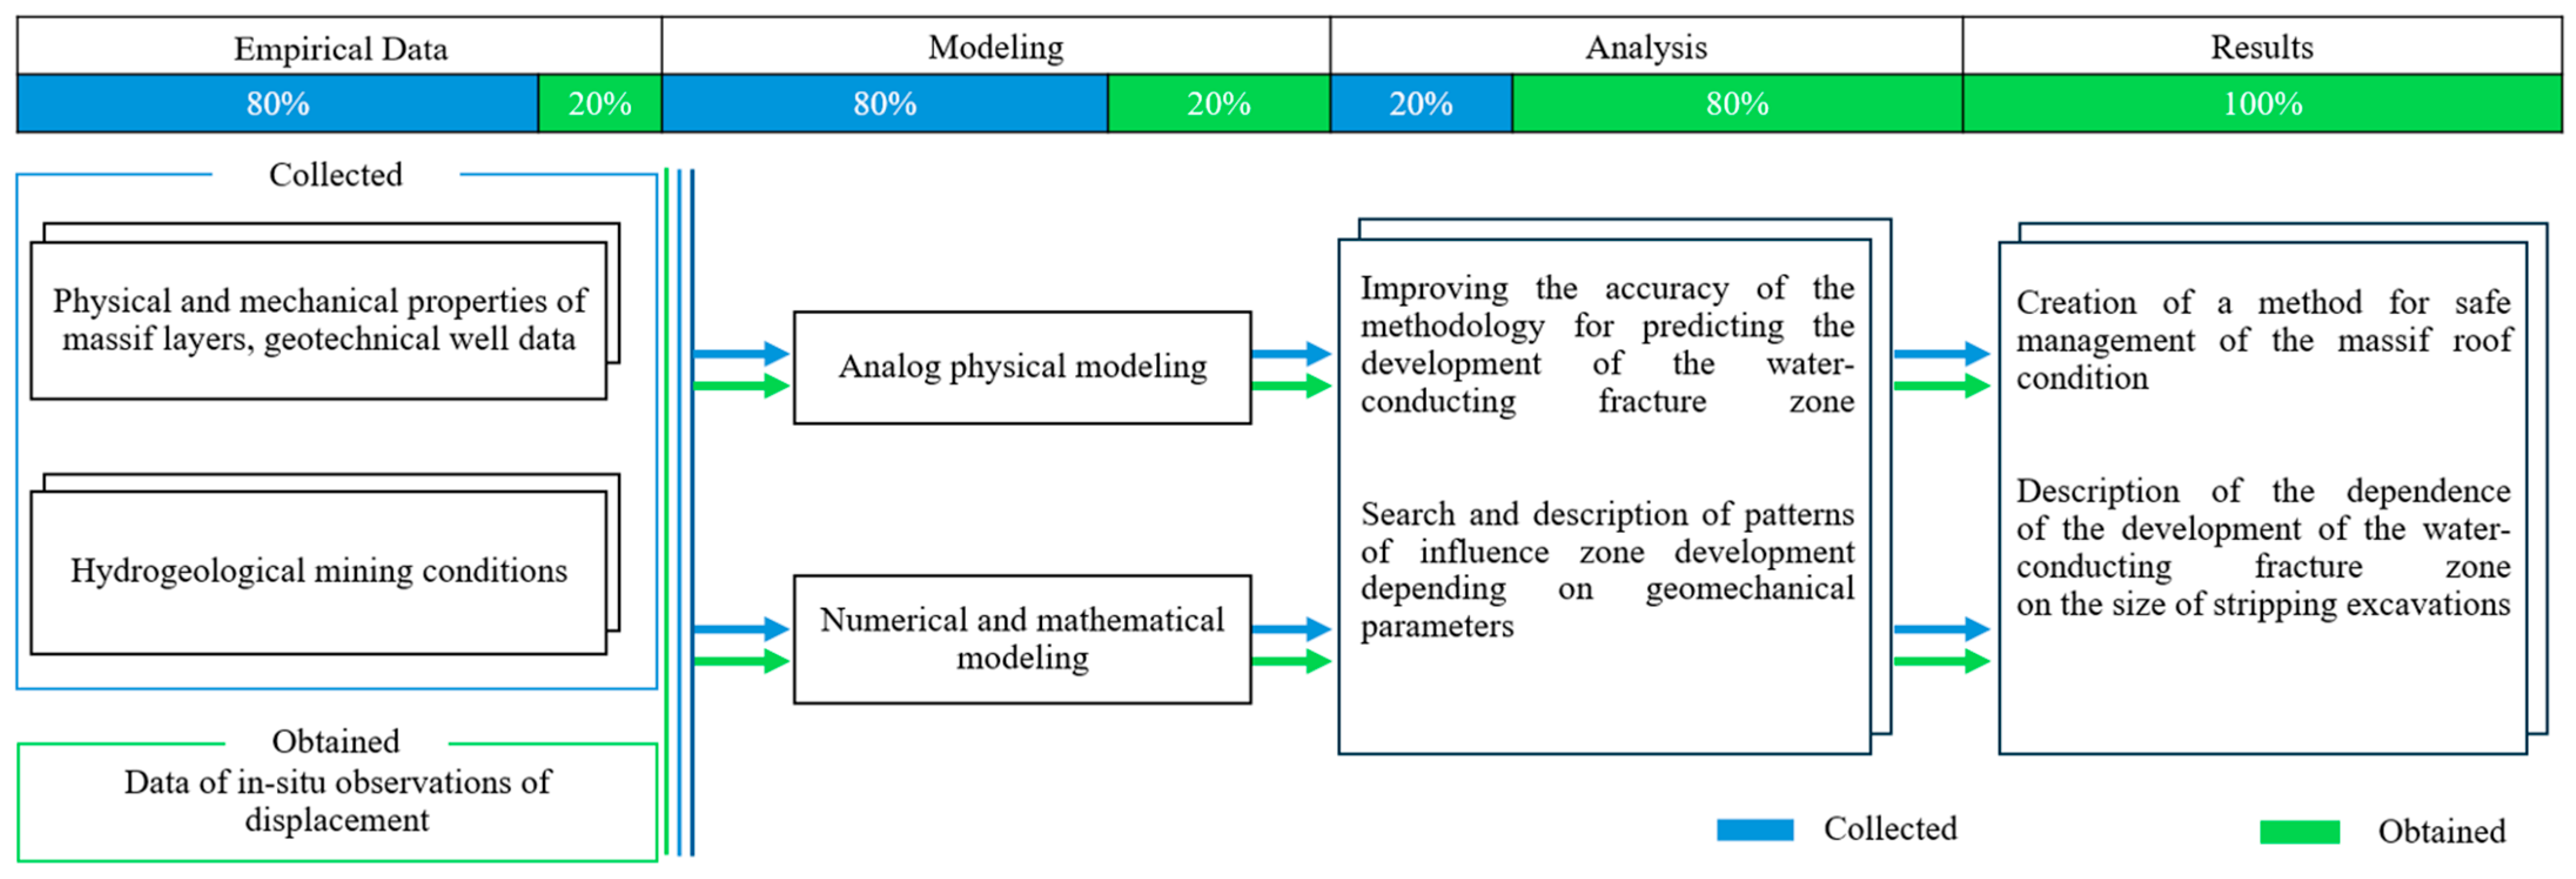
The research methodology is designed as an iterative process that integrates empirical data, physical modeling, numerical simulation, and analytical interpretation to improve prediction of fracture zone development. The workflow, shown in Figure 1, begins with the collection of geological, hydrogeological, and geotechnical data characterizing the physical and mechanical properties of rock mass layers.
Figure 1.
Workflow of the research.
The empirical data serve as the basis for both analog physical modeling and numerical finite–discrete simulation [11], which allows for refining the required parameters to simulate the excavation process. Physical modeling simulates fracture development under real-world conditions, while numerical simulations reflect the mechanical behavior of the array with greater parametric flexibility. In situ observations of vertical shear and deformation serve as key results of both modeling directions. The combined approach allows for a comprehensive analysis of the geomechanical patterns affecting the height of WCFZ development. This complex process is completed by the development of a method for safe control of the rock massif state and the establishment of empirical dependencies describing the peculiarities of the development of dangerous fracture formations above the cleanup mining operations. This multi-stage strategy enables both theoretical development and practical application during underground mining under complex hydrogeological conditions.
2.2. Factors Affecting the Formation of Water-Conducting Fracture Zone
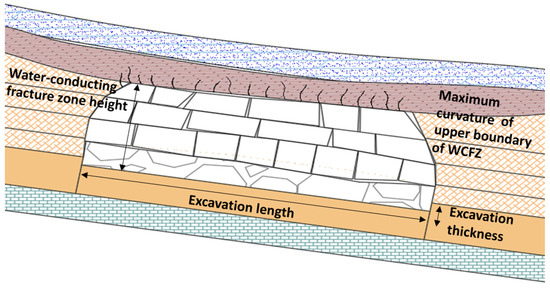
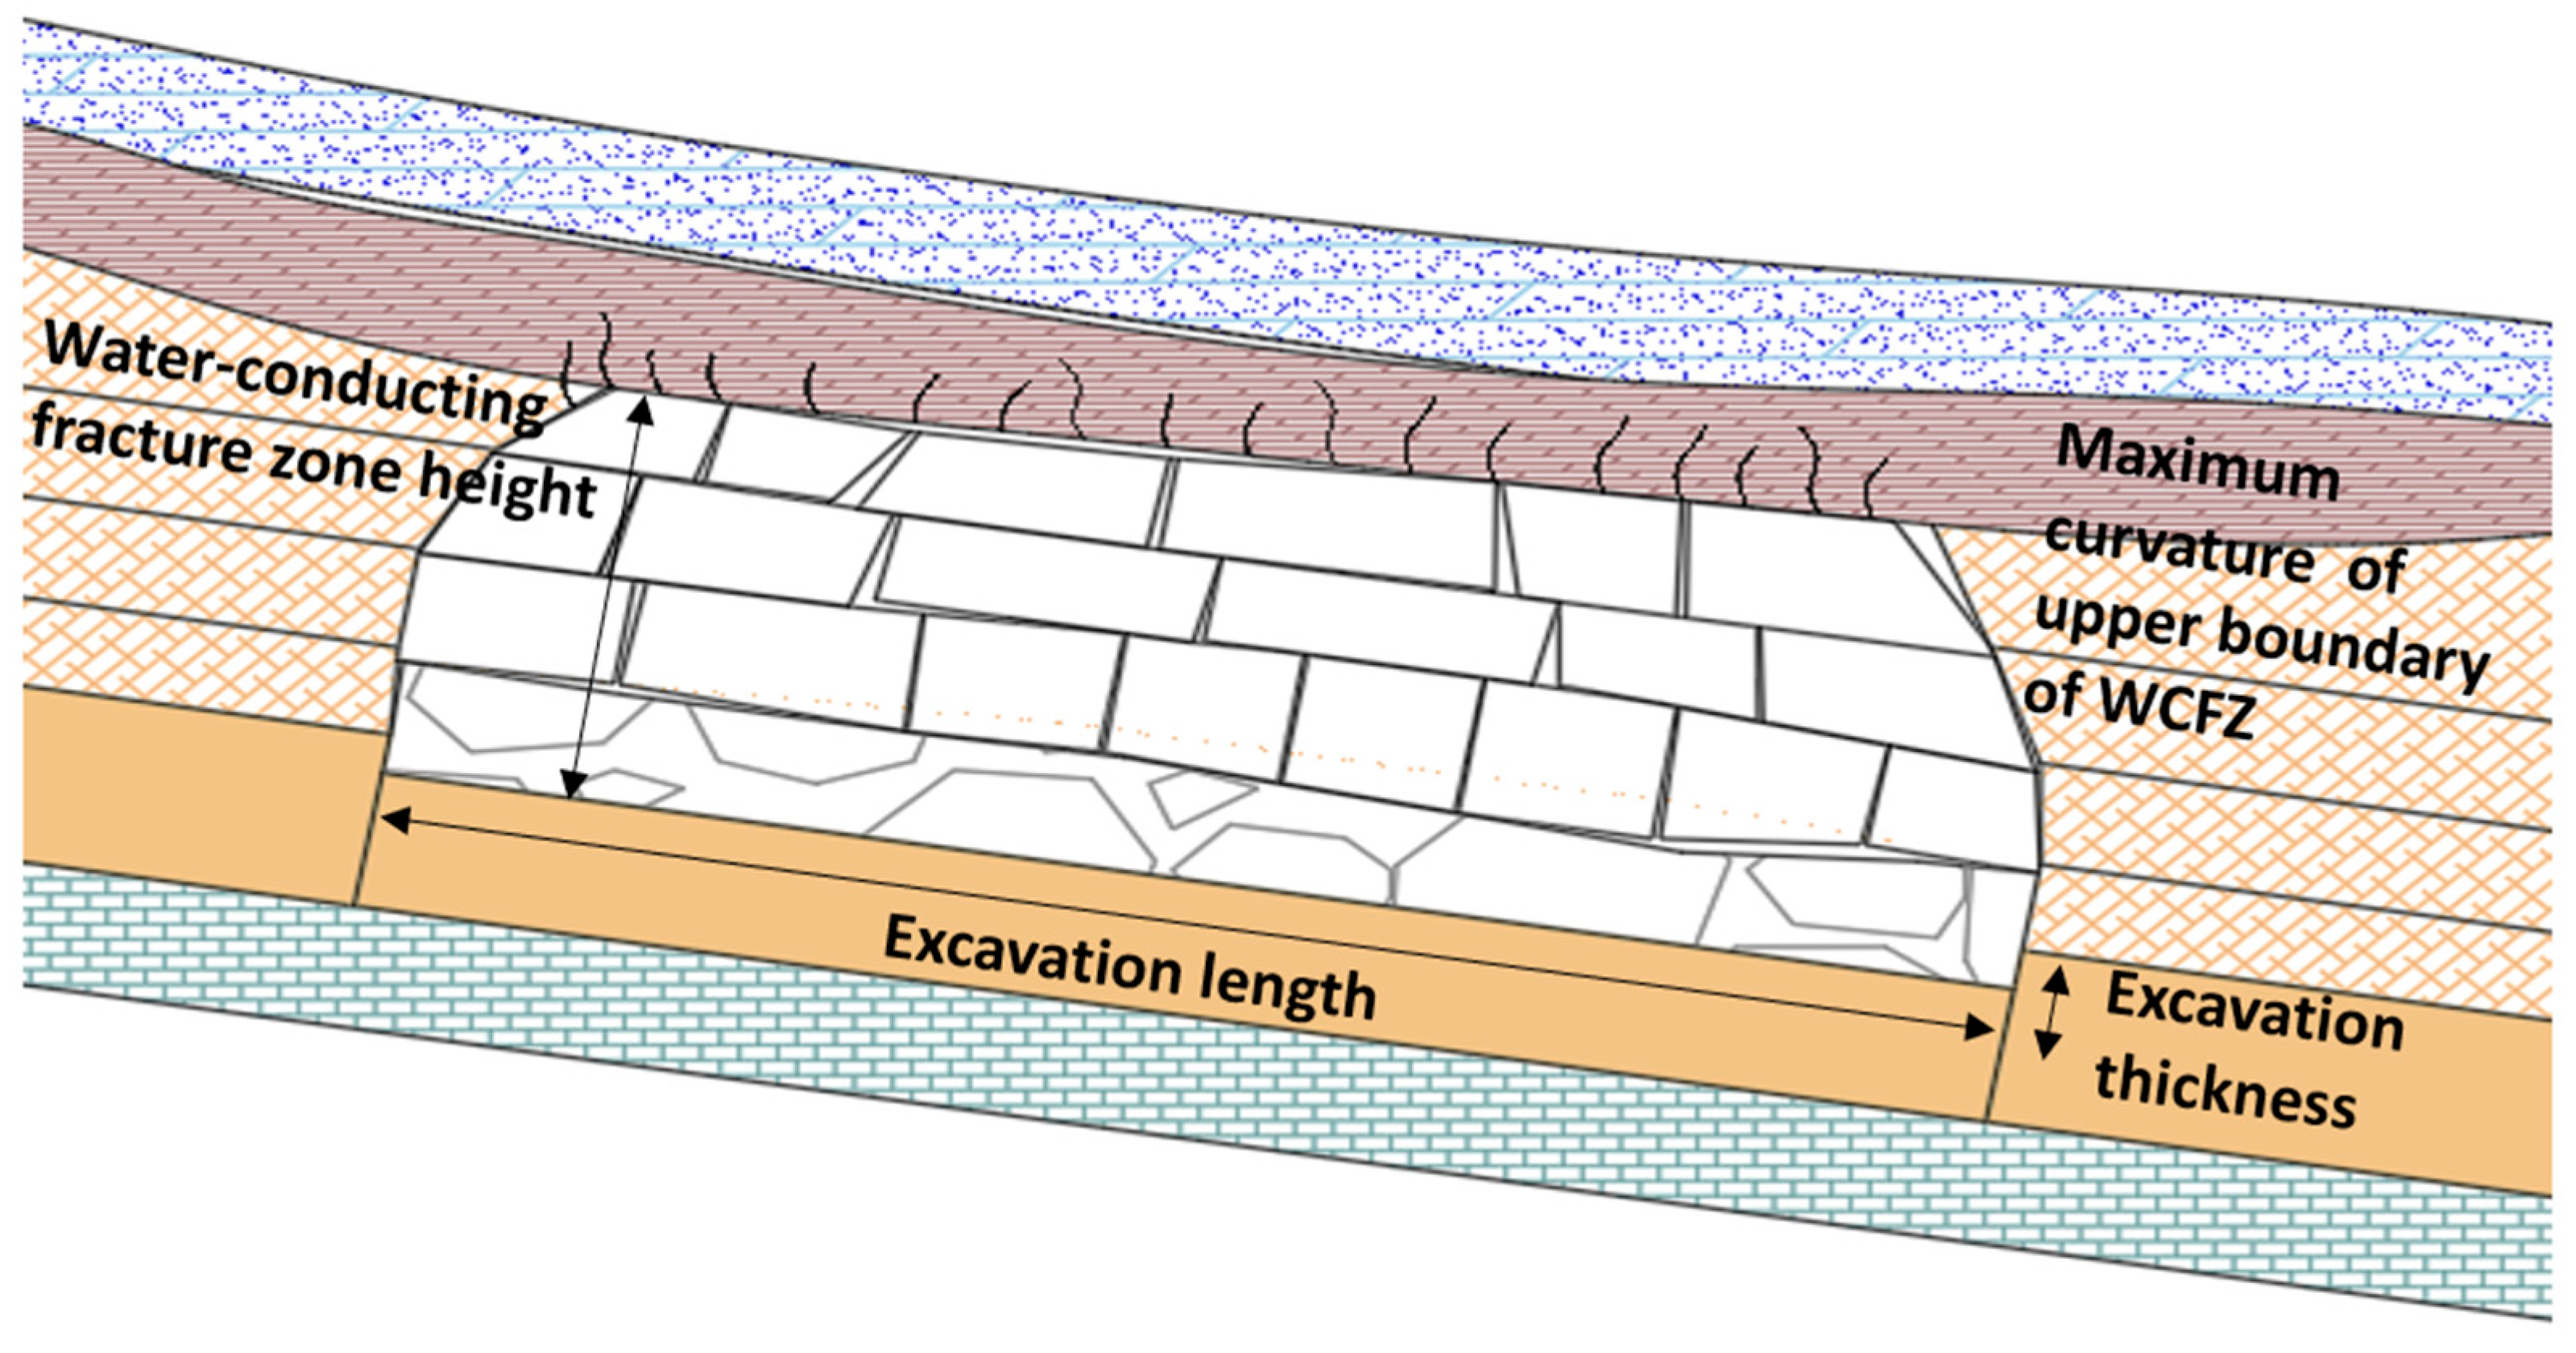
During the development of mine workings, the natural stress equilibrium of the rock mass is disturbed, resulting in deformation and displacement of the overburden. A collapse zone forms directly above the excavated workings, as illustrated in Figure 2.
Figure 2.
Factors affecting the formation of the water-conducting fracture zone.
Above the collapse zone, the rock strata undergo bending, lose structural continuity, and develop fractures. Together with the collapse zone, this fractured region constitutes the water-conducting fracture zone. When this zone intersects an aquifer or surface water body, interconnected fractures provide pathways for water to flow into the mine workings, potentially increasing inflow to catastrophic levels.
Above the fracture zone, the rock mass undergoes stratification, and individual layers deform predominantly by flexure without the formation of through-going fractures. As a result of hanging and cantilever-type bending of the overlying strata, a zone of increased rock pressure develops around the mine workings, where the rock mass is subjected primarily to compression. Consequently, the area of the Earth’s surface affected by shear deformation always exceeds the actual mining area. Within this region, zones of elevated rock pressure are distinguished, which are particularly hazardous with respect to dynamic rock pressure manifestations and rockburst potential.
The key parameters affecting the development of the water-conducting fracture zone and their influence are discussed below. Parameters (1)–(4) are derived from the authors’ previous investigations [9,12] and long-term observations of rock mass behavior at various hard-rock mineral deposits.
- (1)
- Length of excavation zone
The panel length is the primary determinant of the final height of the mining-induced fractured zone. An increasing span induces greater bending of the overlying rock beam, resulting in more extensive fracture propagation. The fracture height reaches its maximum and stabilizes once the goaf area attains the condition of full extraction, causing complete subsidence of the overburden:
where —the height of the water-conducting fracture zone, D—length of the mine working, k, b, c—are empirical coefficients determined by the specific mining and geological conditions (properties of the rock strata).
- (2)
- Thickness of excavation
The extraction thickness of the layer directly influences the development of the fractured water-conducting zone. A greater mining thickness modifies the mechanical structure of the roof strata, resulting in instability and fracturing. This, in turn, promotes larger-scale collapse and the formation of the final fracture network:
the height of the water-conducting fracture zone is highly variable, however, empirical observations indicate that it typically reaches 20 to 30 times the extraction thickness, depending on the prevailing mining and geological conditions.
- (3)
- Maximum curvature of the layer
In the immediate vicinity of the caving zone, where curvature deformations are significant, normal cross-cutting fractures propagate towards each other, splitting the rock layer across its entire thickness. As the distance from the excavated zone towards the surface increases, the curvature of the layers consequently decreases, the penetration and aperture of these fractures diminish proportionally. As a result, at a certain vertical distance from the seam, there exists a layer where these fractures have not fully penetrated its entire thickness. This specific layer retains its water-resistant properties relative to the underlying strata and defines the upper boundary of the water-conducting fracture zone (WCFZ). The maximum curvature value of the layer that coincides with this upper boundary is termed the boundary curvature, while the vertical distance from the seam to this boundary is defined as the height of the WCFZ:
where the height of the water-conducting fracture zone, m—mining thickness —the boundary curvature coefficient.
- (4)
- Coefficient of overburdening of the rock mass
Formulas (1)–(3) were derived without accounting for the degree of rock mass subsidence, which is characterized by the undermining coefficient of the rock mass (N). An undermining coefficient of less than one (N < 1) indicates incomplete subsidence of the overlying strata, whereas a value greater than one (N > 1) signifies full subsidence. For a comprehensive assessment, it is essential to determine the undermining coefficient separately for both the cross-section perpendicular to the seam strike and the longitudinal section along the seam strike. To enhance the accuracy and reliability of the prediction, a detailed evaluation of these undermining coefficients is therefore recommended.
- (5)
- In situ stress state
The absolute magnitudes of the principal stresses and their anisotropy influence the failure mode and propagation of fractures. High confinement tends to suppress tensile opening but can promote shear localization and fault reactivation, altering fracture orientation and continuity; lower confinement favors tensile fracture opening that may propagate vertically through lithologic layers [13]. The in situ stress state therefore controls both the mode of fracture growth and the effective vertical extent of the WCFZ. Because its influence is intrinsically coupled with rock strength, stiffness contrasts between stratigraphic layers, and the pre-existing structural fabric, the in situ stress state exerts a control on the initiation, propagation, and vertical extent of the water-conducting fracture zone [14].
2.3. Geological Setting of the Case Study
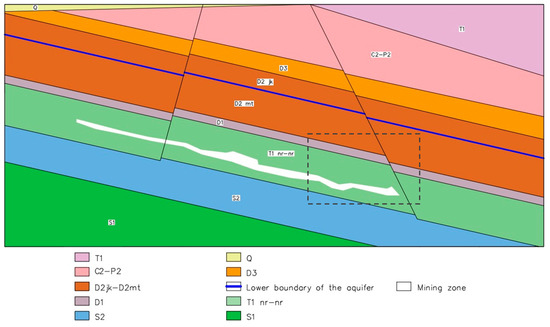
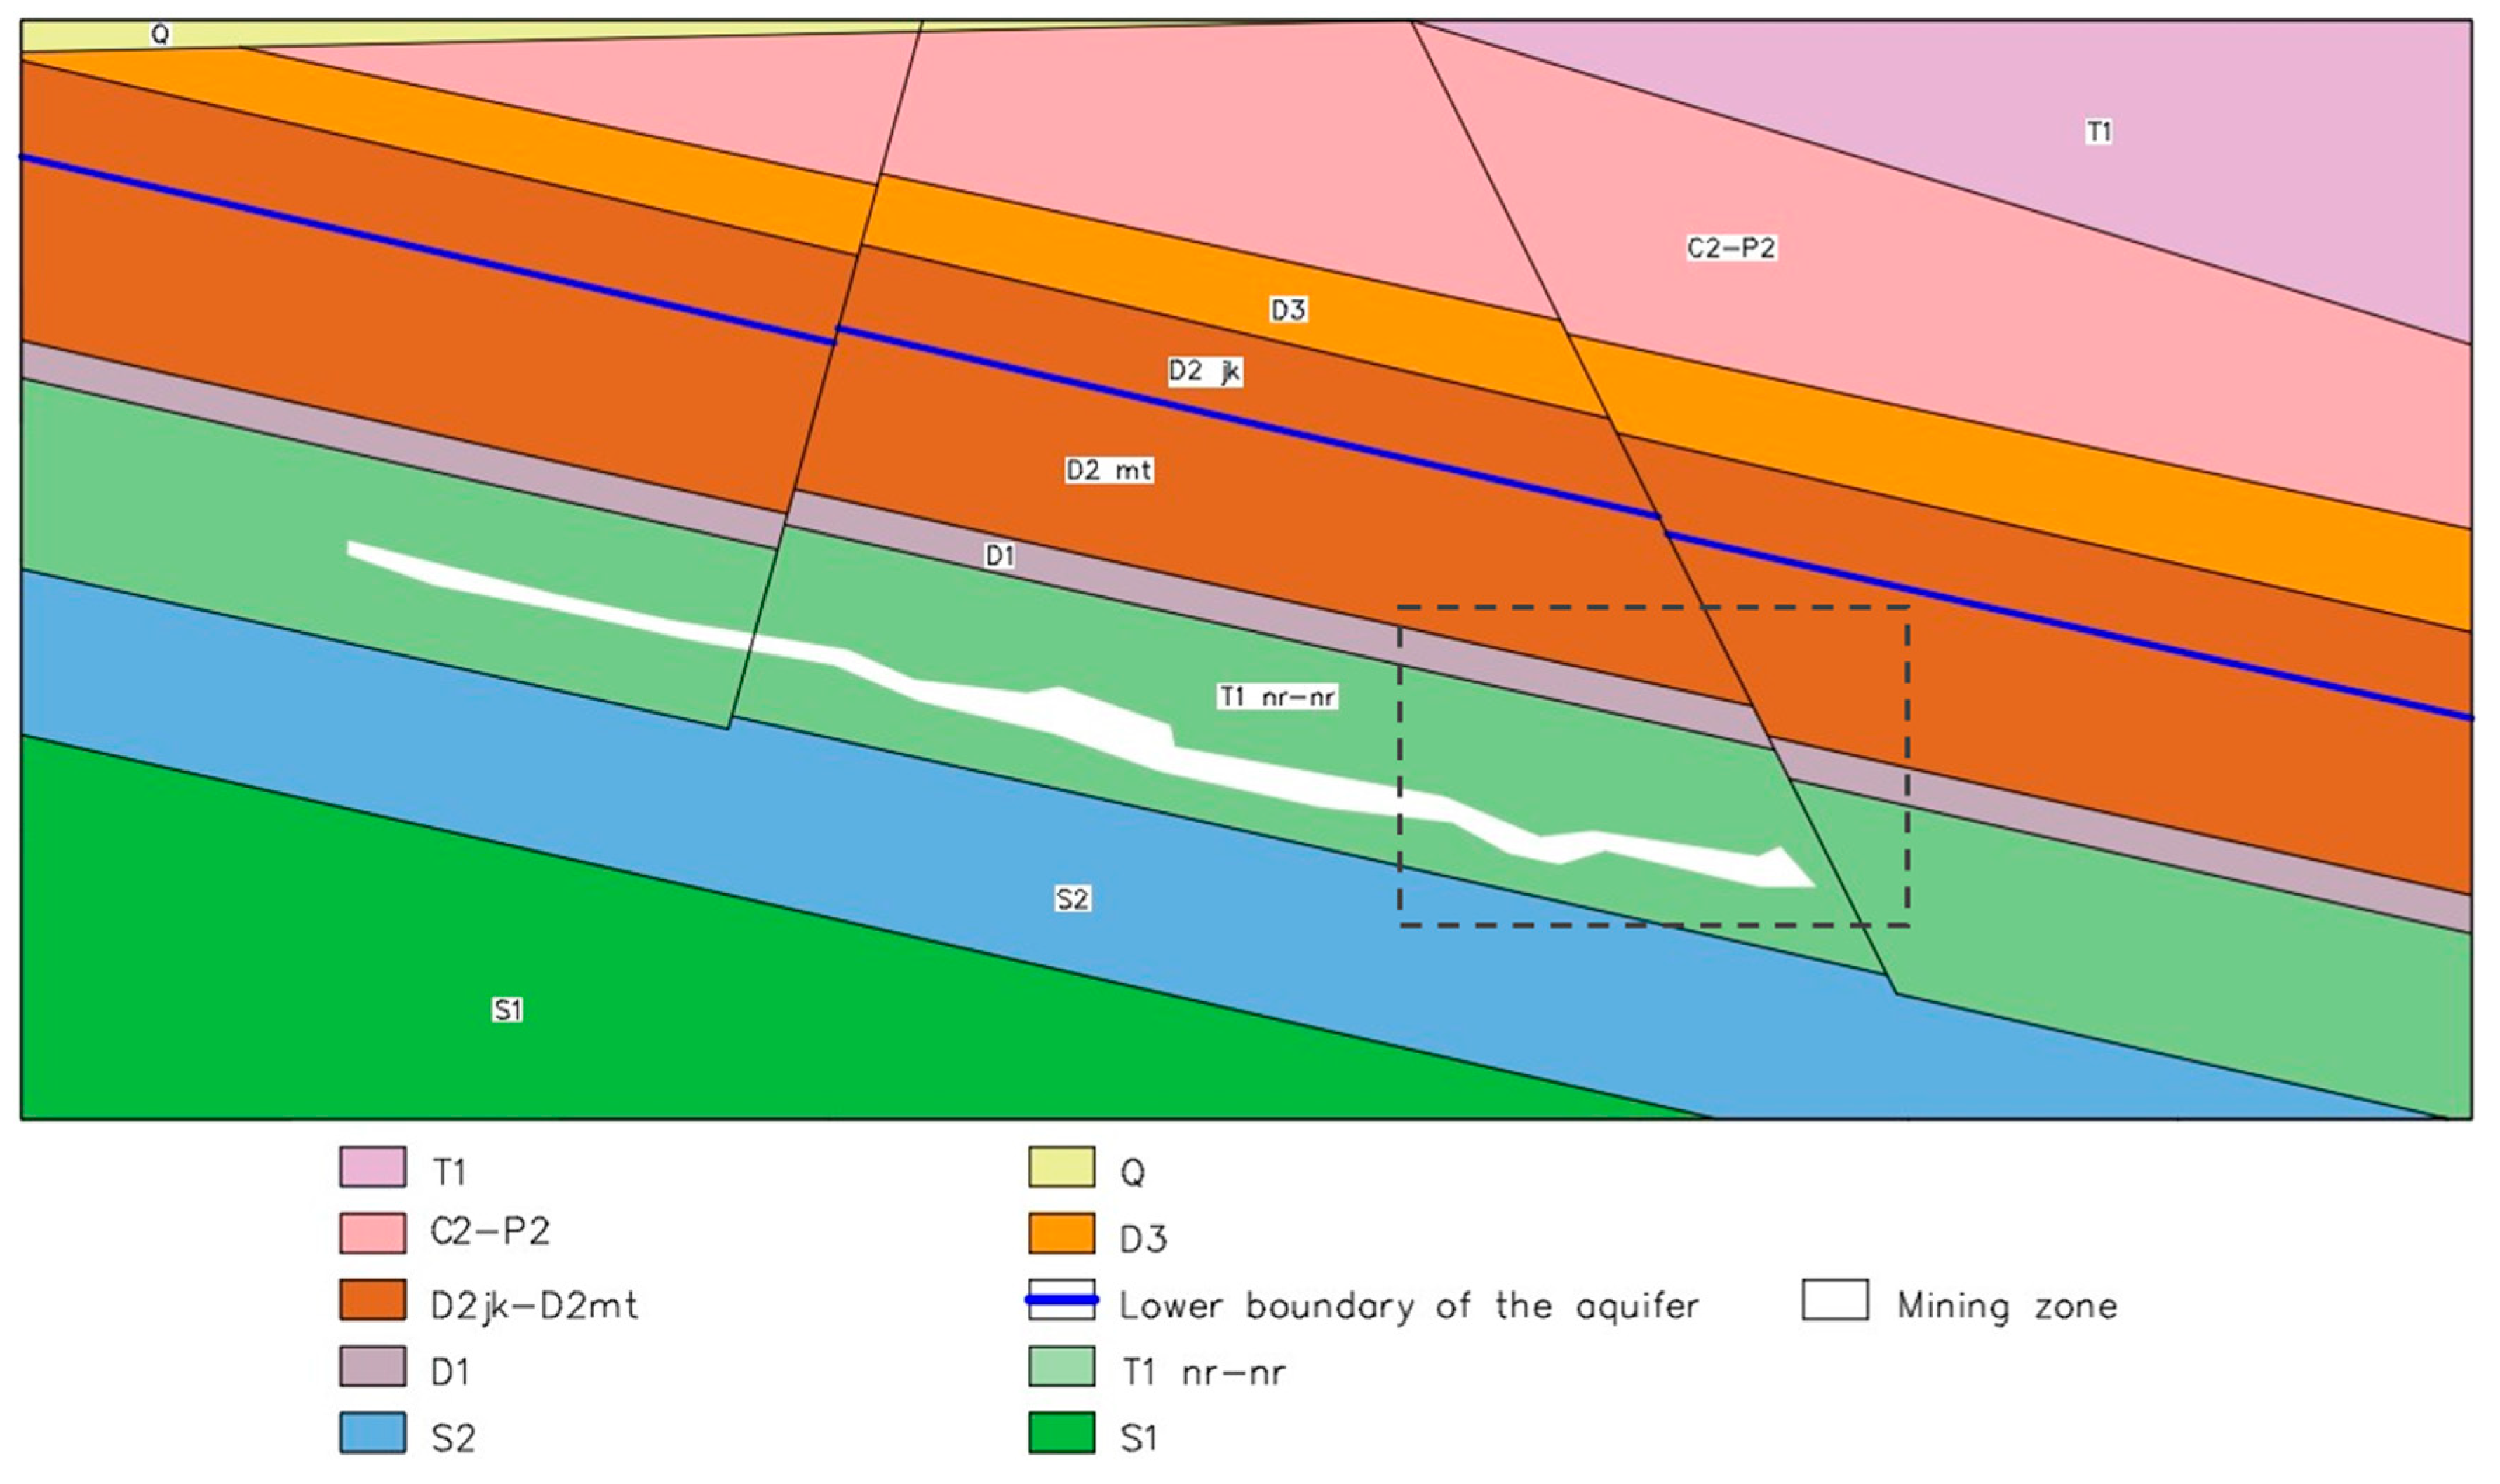
The mining of the ore body modeled in this study is conducted in the polymetallic mining area, as indicated by the region highlighted with a dotted line in Figure 3. The worked-out rock mass has been selected as the object of investigation.
Figure 3.
Summarized geological section.
The initial data for developing the research scheme consider that extraction occurs under conditions of intense disruptive tectonics, characterized by a tuff-lava sequence with a displacement amplitude ranging from 10 to 80 m and a dip angle between 70 and 88 degrees. Furthermore, the development of the deposit is complicated by the presence of multiple aquifers in the cross-section, the most hazardous of which, due to its proximity to the mining workings, is the D2jk formation, composed primarily of dolomites and carbonate rocks. The aquiclude separating the worked-out space from this water-bearing layer is the D2mt formation, consisting of clay-bearing rocks, including marl and anhydrite. Geological exploration data indicate that the thickness of the D2mt formation reaches up to 350 m. The deposit is extracted using various chamber system options, with a combined layered extraction scheme and backfilling of the mined-out space with hardening mixtures.
Within the framework of modeling the deformation process, and considering both the experimental complexity of the procedure and the limited geological study of the host rock mass, it is assumed that the mass entirely lacks complex ore-body morphology with numerous barren windows, bulges, or constrictions. The contour of the extraction is therefore represented as a simple cavity, disregarding the process of backfilling with hardening mixtures.
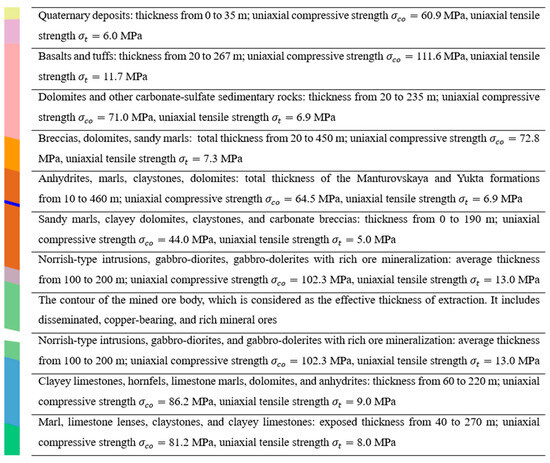
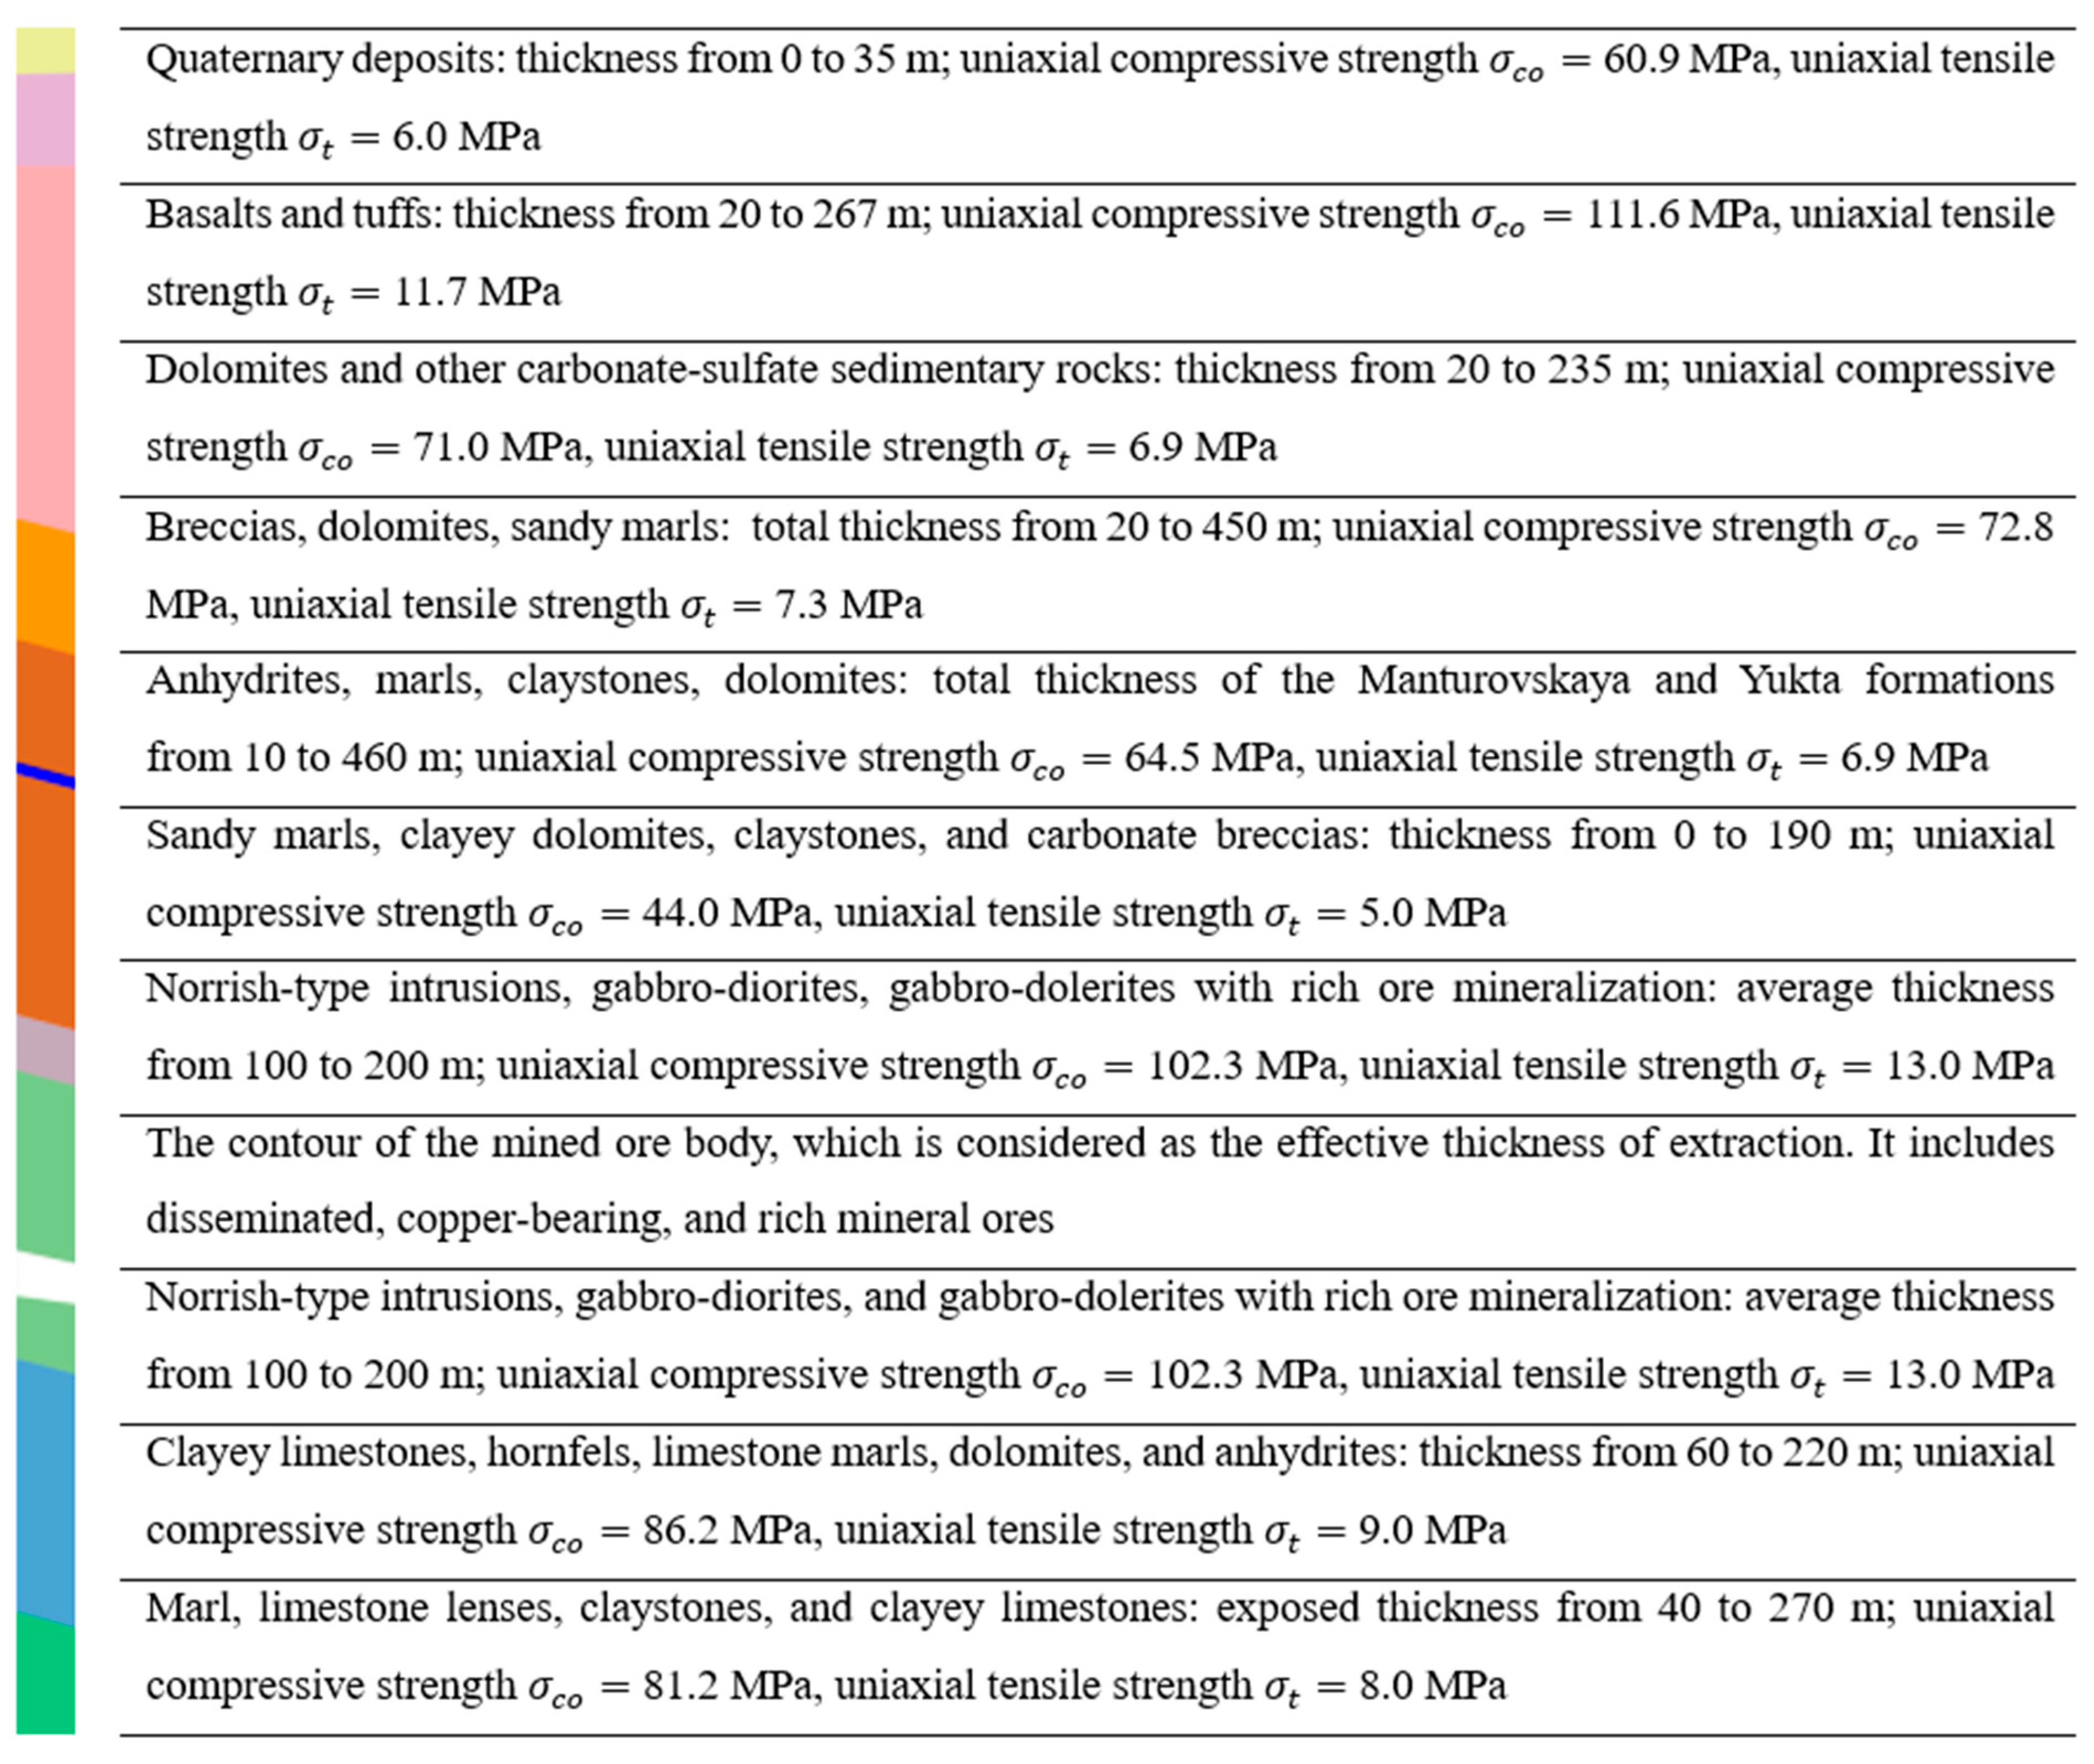
Figure 4 presents selected physico-mechanical properties of the rock mass layers: sample density, uniaxial compressive strength, tensile strength, cohesion, and internal friction angle.
Figure 4.
Stratigraphic column and physico-mechanical properties of rocks in the research area.
Due to underfilling, the progressive upward development of the mining contour, and the replenishment of reserves, this model represents a relevant prototype of one possible scenario for the development of displacements and deformations in the worked-out mass. This prototype is intended to illustrate the principles of vertical normal water-conducting fracture development under complex hydrogeological conditions, considering disruptive tectonic disturbances and recurring mining: extraction is performed in a single layer.
2.4. Physical and Numerical Modeling Methods
To investigate the development and propagation of the water-conducting fracture zones (WCFZ) in stratified rock masses above mined-out spaces, both physical and numerical modeling approaches were employed. These methods were developed to complement each other and ensure comprehensive analysis and verification of results.
The physical similarity experiment was conducted in the Laboratory of Coal Mining Problems at Taiyuan University of Technology, Shanxi, China to reproduce the progressive development of fracture networks above the excavation and was used as a reference case for numerical calibration. Numerical modeling was performed using two complementary approaches. The UDEC 7.00 software package was applied to evaluate rock mass deformation and surface subsidence, while the Prorock 2.0 software, based on a finite–discrete element framework, was used to simulate fracture initiation, propagation, and the development of the water-conducting fracture zone. In the Prorock model, intact rock blocks are represented by deformable finite elements, whereas fracture evolution and block interaction are governed by discrete contact laws, allowing for a simulation of both continuum deformation and discontinuum behavior during progressive failure.
In order to reproduce the technological process of ore mining with backfilling of the excavation space and stage-by-stage excavation, a two-dimensional model of physical similarity was built [8]. The geometric similarity coefficient was chosen as 1:200, in accordance with the principles of similarity theory in the mechanics of deformable solids [8,9,10]. Table 1 summarizes the prototype rock properties and the equivalent material parameters used in the physical model.
Table 1.
Physical model layer properties.
The physical experiment was conducted on a physical modeling stand. The stand includes a load management system. A high-rigidity power frame and a monitoring and analysis system. The geometric dimensions of the physical model are 3000 mm in length, 1500 mm in height, and 200 mm in width. The layers of the model are arranged in accordance with structural, geological, and technical similarity. In the layers of the mined massif, conditions have been created for the natural course of displacement and deformation processes, similar to those observed in the workings of the polymetallic mine. According to the theory of similarity, the force parameters for each layer of the massif are calculated based on the physical and mechanical characteristics of rocks and the geometry of their occurrence.
The boundary conditions of the physical similarity model were defined based on the geological structure of the deposit and the average depth of ore occurrence 750 m. To reproduce deep underground conditions without a free surface, the lateral and bottom boundaries of the model were rigidly fixed, while a uniform vertical surcharge corresponding to the average mining depth was applied at the upper boundary. To minimize boundary effects and prevent premature failure during excavation, setback zones of 0.30 m were introduced between the excavation area and the lateral boundaries. The relevance of the physical model was confirmed by laboratory tests demonstrating similarity between the physical and mechanical properties of equivalent materials and those of the prototype rock mass.
The excavation was carried out gradually in ten stages to simulate the layer-by-layer mining technique with backfilling of the excavation space with curing mixtures. The excavation zone represents the space left underfilled due to subsidence of the rock mass. Throughout the test, precise vertical displacements are measured at model surface reference points, and horizontal deformations are recorded by tracking the displacement of the marks with a high-speed video camera [4,15,16,17]. Stress in the overlaying area and in the discontinuities is recorded using precision dial gauges. Crack initiation and propagation are observed visually and documented after each excavation step.
The aquifer, whose lower boundary is located at the boundary of D2mt and D2jk, is not included in the modeling area to maintain the scale of the model, but this does not prevent the recording of fracture development. The surface of the physical model is painted with white paint in two thin layers for better observation of the opening cracks. The ore body is highlighted in yellow. The upper part of the ore body contains excavation zones.
Numerical modeling was performed using two complementary approaches. The UDEC software package was applied to evaluate rock mass deformation and surface subsidence under deep mining conditions. Boundary conditions in the UDEC model were defined consistently with the physical similarity experiment: lateral and bottom boundaries were fixed to restrict displacements, while the in situ stress state corresponding to the mining depth was introduced through a combination of initial stress components and gravitational loading. A uniform vertical stress component was applied at the upper boundary to represent overburden pressure, and the model was brought to equilibrium prior to excavation.
Fracture initiation, propagation, and the development of the water-conducting fracture zone were simulated using the Prorock software package, which is based on a finite–discrete element framework. A triangulated finite–discrete element mesh was generated, subdividing the modeled domain into deformable elements with mechanical properties assigned according to the physical and mechanical characteristics of the rock layers. Boundary constraints and loading conditions were defined in accordance with the physical similarity model, with fixed lateral and bottom boundaries and a uniform surcharge applied at the upper boundary, enabling realistic simulation of progressive failure processes.
The input data for numerical modeling are presented in Table 2. The parameters listed in Table 2 (including lithology, density, Young’s modulus, shear modulus G, cohesion C, friction angle, tensile strength Rt, Poisson’s ratio, normal stiffness Kn, shear stiffness Ks) were obtained using a combination of laboratory test data for materials and subsequent analytical processing in accordance with widely accepted approaches for the preparation of input parameters in numerical geomechanical models.
Table 2.
Mechanical parameters used in the UDEC and Prorock numerical models.
Following calibration against the physical similarity experiment, more than 30 numerical simulations were performed under boundary conditions derived from the geological structure and depth range of the deposit. These simulations were used to assess the robustness of fracture development patterns and to identify consistent trends in the thickness and spatial evolution of the water-conducting fracture zone.
3. Results
3.1. Analysis of Fracture Development and Block Structure Formation
This section presents the results of the physical similarity modeling, focusing on fracture initiation and deformation development in the overburden induced by the extraction of a single mining layer. The analysis addresses the evolution of displacement, bending, and loss of continuity in the overlying rock mass, which control roof collapse behavior and the formation of the water-conducting fracture zone under the imposed mining conditions.
The analysis is based on two primary structural indicators:
- (i)
- the degree of block segmentation of the overburden;
- (ii)
- the characteristic angles associated with roof caving and shear deformation.
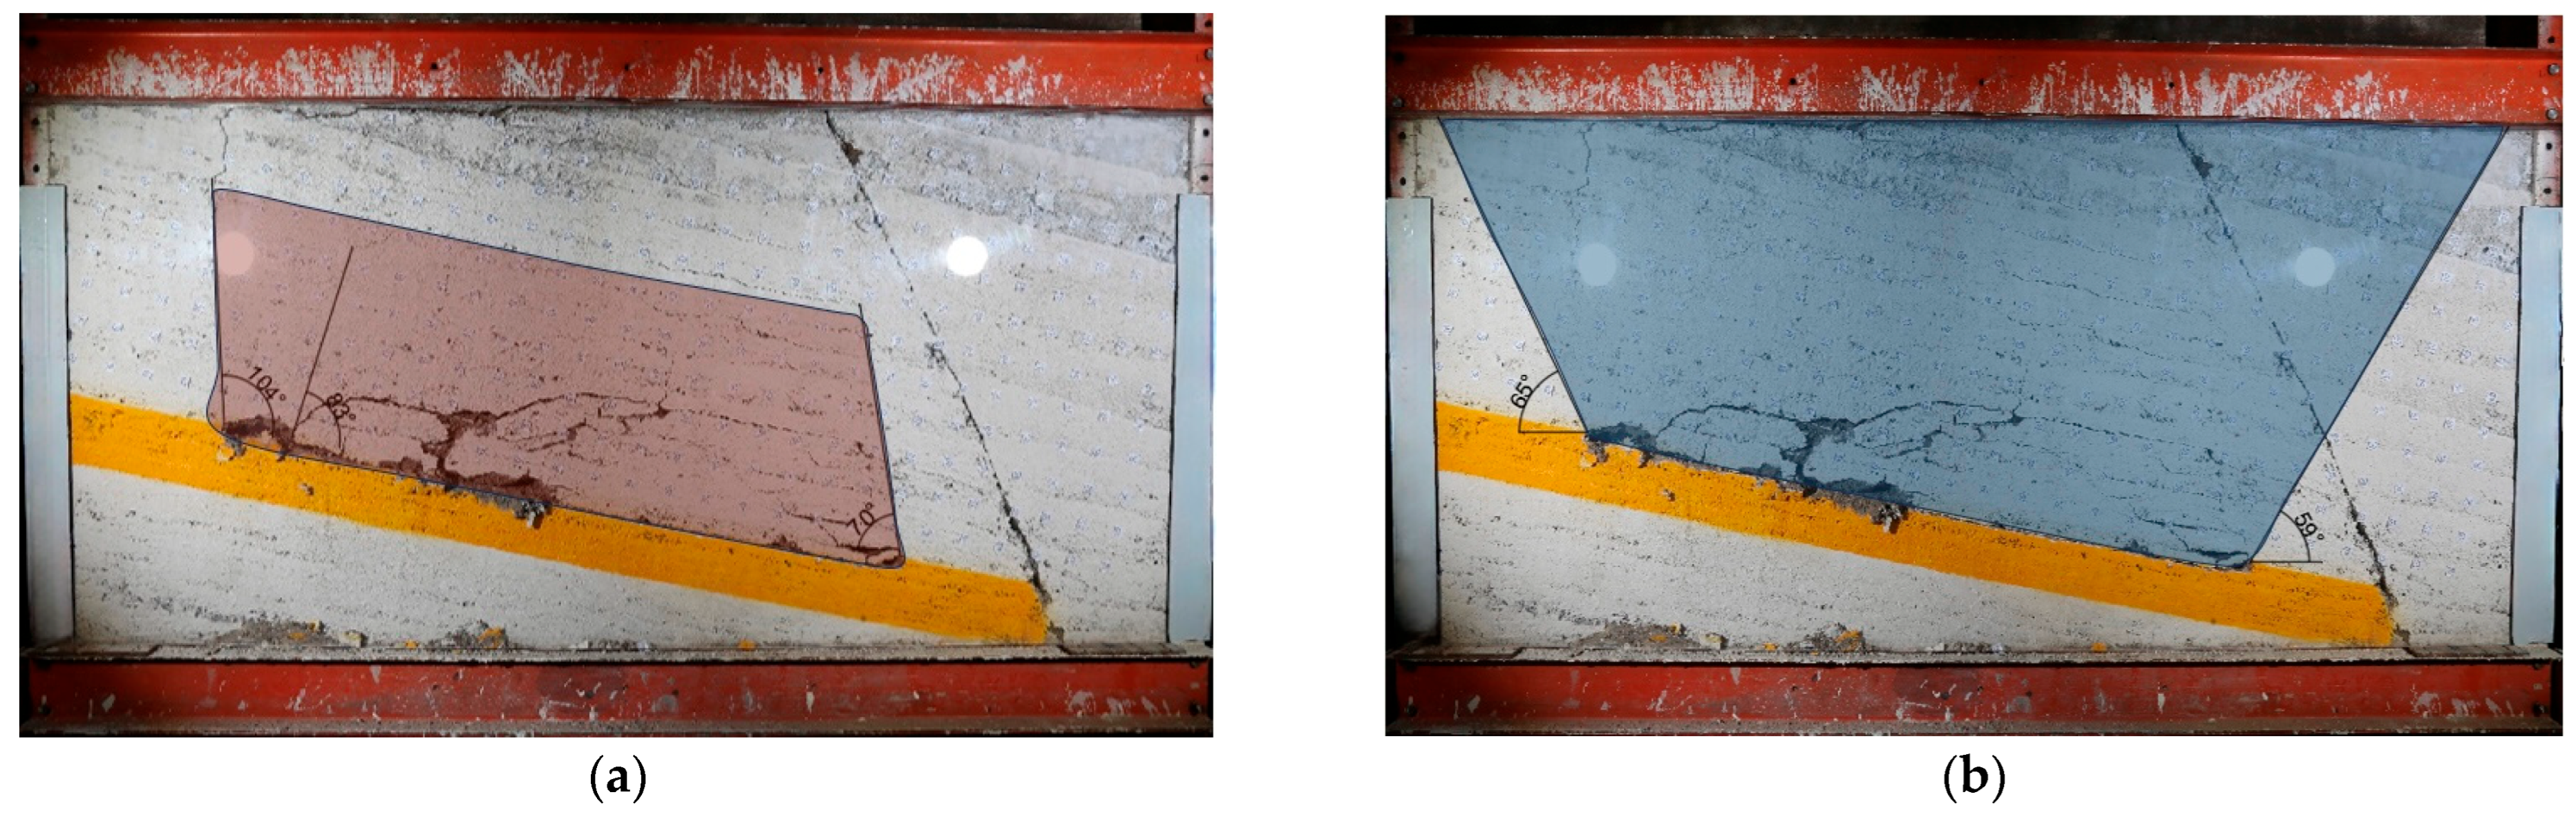
The roof caving angle is defined as the angle between the intact roof layer and the principal rupture surface formed during mining-induced failure. This parameter reflects the rupture mechanism of the roof and the associated structural reorganization of the overlying strata. To identify the position and evolution of rupture surfaces, the variation in roof caving angles was systematically analyzed throughout the mining process. The observed distributions of caving and shear angles are shown in Figure 5.
Figure 5.
Graphical representation of the collapse zone and the displacement zone; (a) angles of caving; (b) shear zone angles.
The measured caving angles range from approximately 70° to 104°. Under the conditions of the studied mine, the average mining depth is about 750 m, and the dip angle of the polymetallic ore body is approximately 12°. Considering repeated mining of adjacent layers, representative shear angles were identified as β = 59° and γ = 65°, which are consistent with the observed geometry of deformation in the physical model.
Within the framework of classical subsidence theory, the geometrical parameters of the collapse and shear zones, including the caving and shear angles, can be used to delineate the extent of the plastic deformation zone in the overburden. The boundaries defined by these angles represent the transition from elastic bending to irreversible plastic failure, which is associated with fracture initiation, block separation, and loss of load-bearing capacity. Therefore, the experimentally determined caving and shear angles provide an indirect but physically meaningful basis for identifying the zone of plastic deformation above the mined-out space.
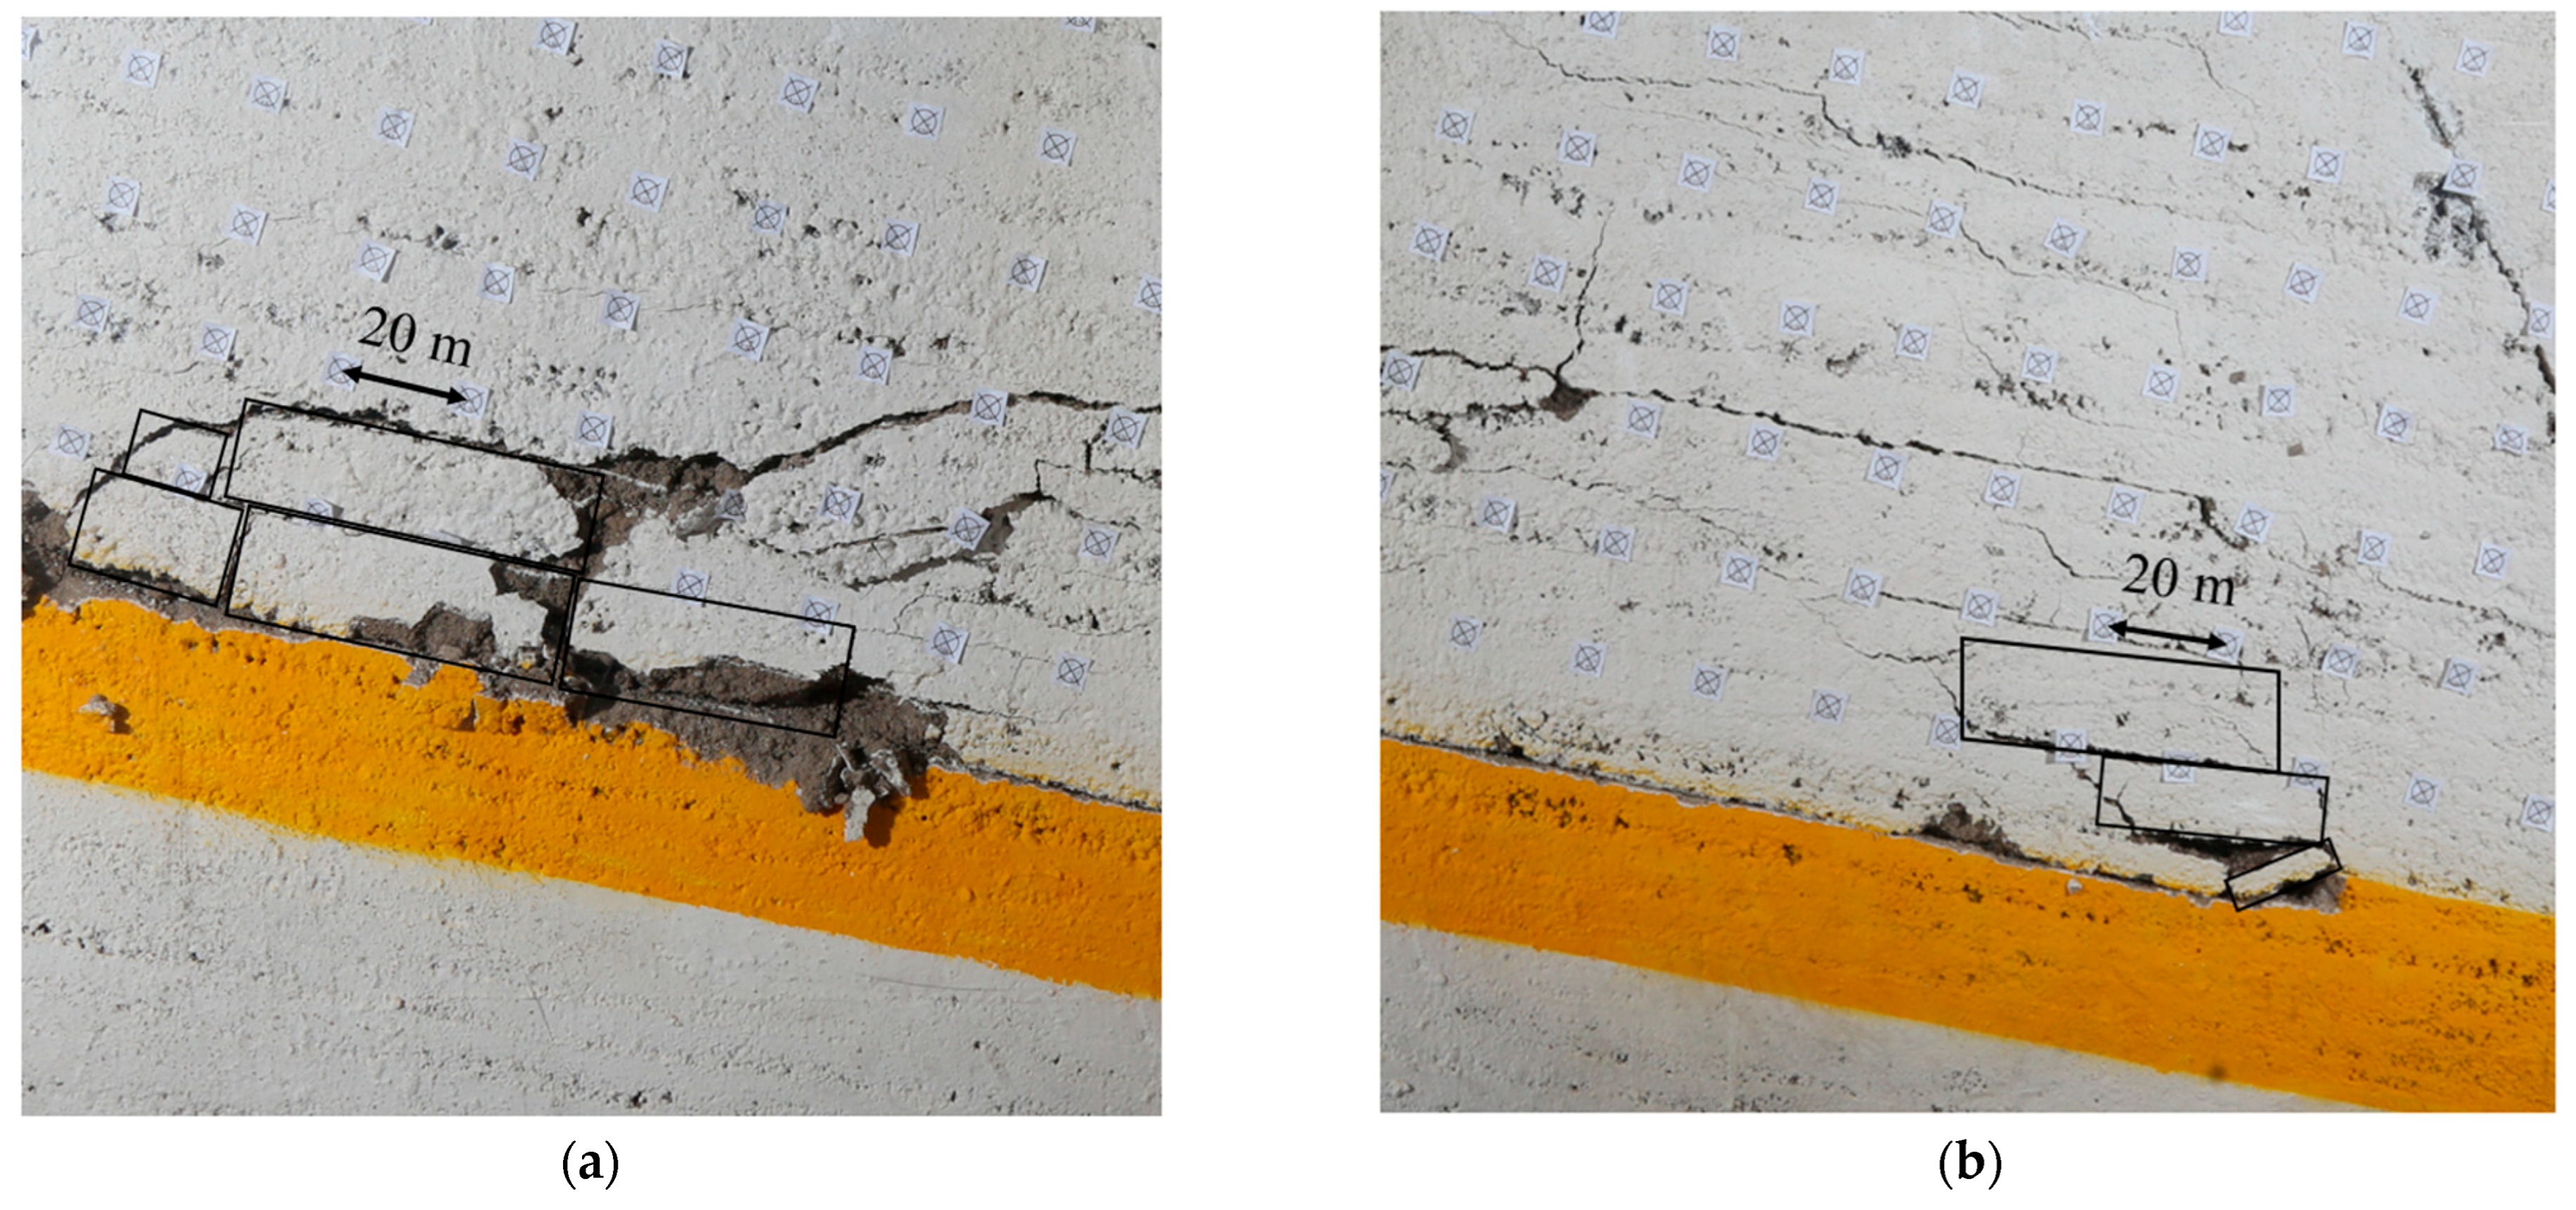
For the specific geological conditions of the deposit, the lower part of the water-protective stratum located between the mined-out space and the aquifer is composed predominantly of intrusive rocks. These rocks are massive and lack distinct stratification; therefore, their deformation behavior under undermining differs fundamentally from that of layered sedimentary rocks. As a result, subsidence develops mainly through a block-wise deformation mechanism, as illustrated in Figure 6.
Figure 6.
Buckling structural characteristics of the blocks in the overburdening area; (a) block structure at the end of mining operations; (b) block structure at the beginning of mining operations.
The intrusive rocks exhibit structural heterogeneity controlled primarily by tectonic fractures and faults of various scales. Consequently, deformation of the undermined rock mass occurs through the movement of discrete blocks of varying sizes and shapes, governed by the orientation and mechanical properties of bounding fracture planes and by the prevailing caving and shear angles. Block movement is realized through shear sliding along rupture surfaces, separation along fractures filled with weakening minerals, and the opening of previously closed discontinuities. A key observation of the physical model is that fracture apertures increase predominantly along block boundaries, whereas the internal structure of individual blocks remains largely intact, with no significant change in their intrinsic permeability.
3.2. Displacement and Maximum Curvature Change Law of Overburden Strata
Vertical displacements were monitored using reference markers placed on the frontal surface of the physical similarity model, which allowed for continuous tracking of subsidence development during excavation. Subsidence was independently evaluated using three approaches: marker displacement tracking on the physical model using Tema Motion 2D v.3.8-004 software, full-field displacement analysis based on digital image correlation implemented in GOM Correlate 2019, and numerical simulation of vertical displacements using the UDEC software package under boundary conditions consistent with the physical experiment. The displacement profiles obtained by these three approaches showed good agreement, confirming the reliability and consistency of the subsidence results. The measured displacements were subsequently converted to prototype-scale values in accordance with similarity theory, enabling direct comparison with field observations and numerical predictions [12].
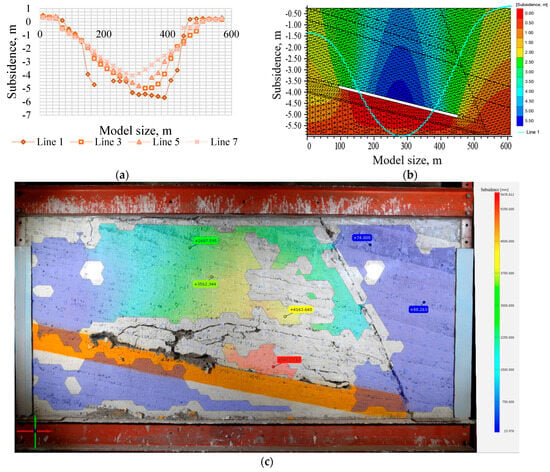
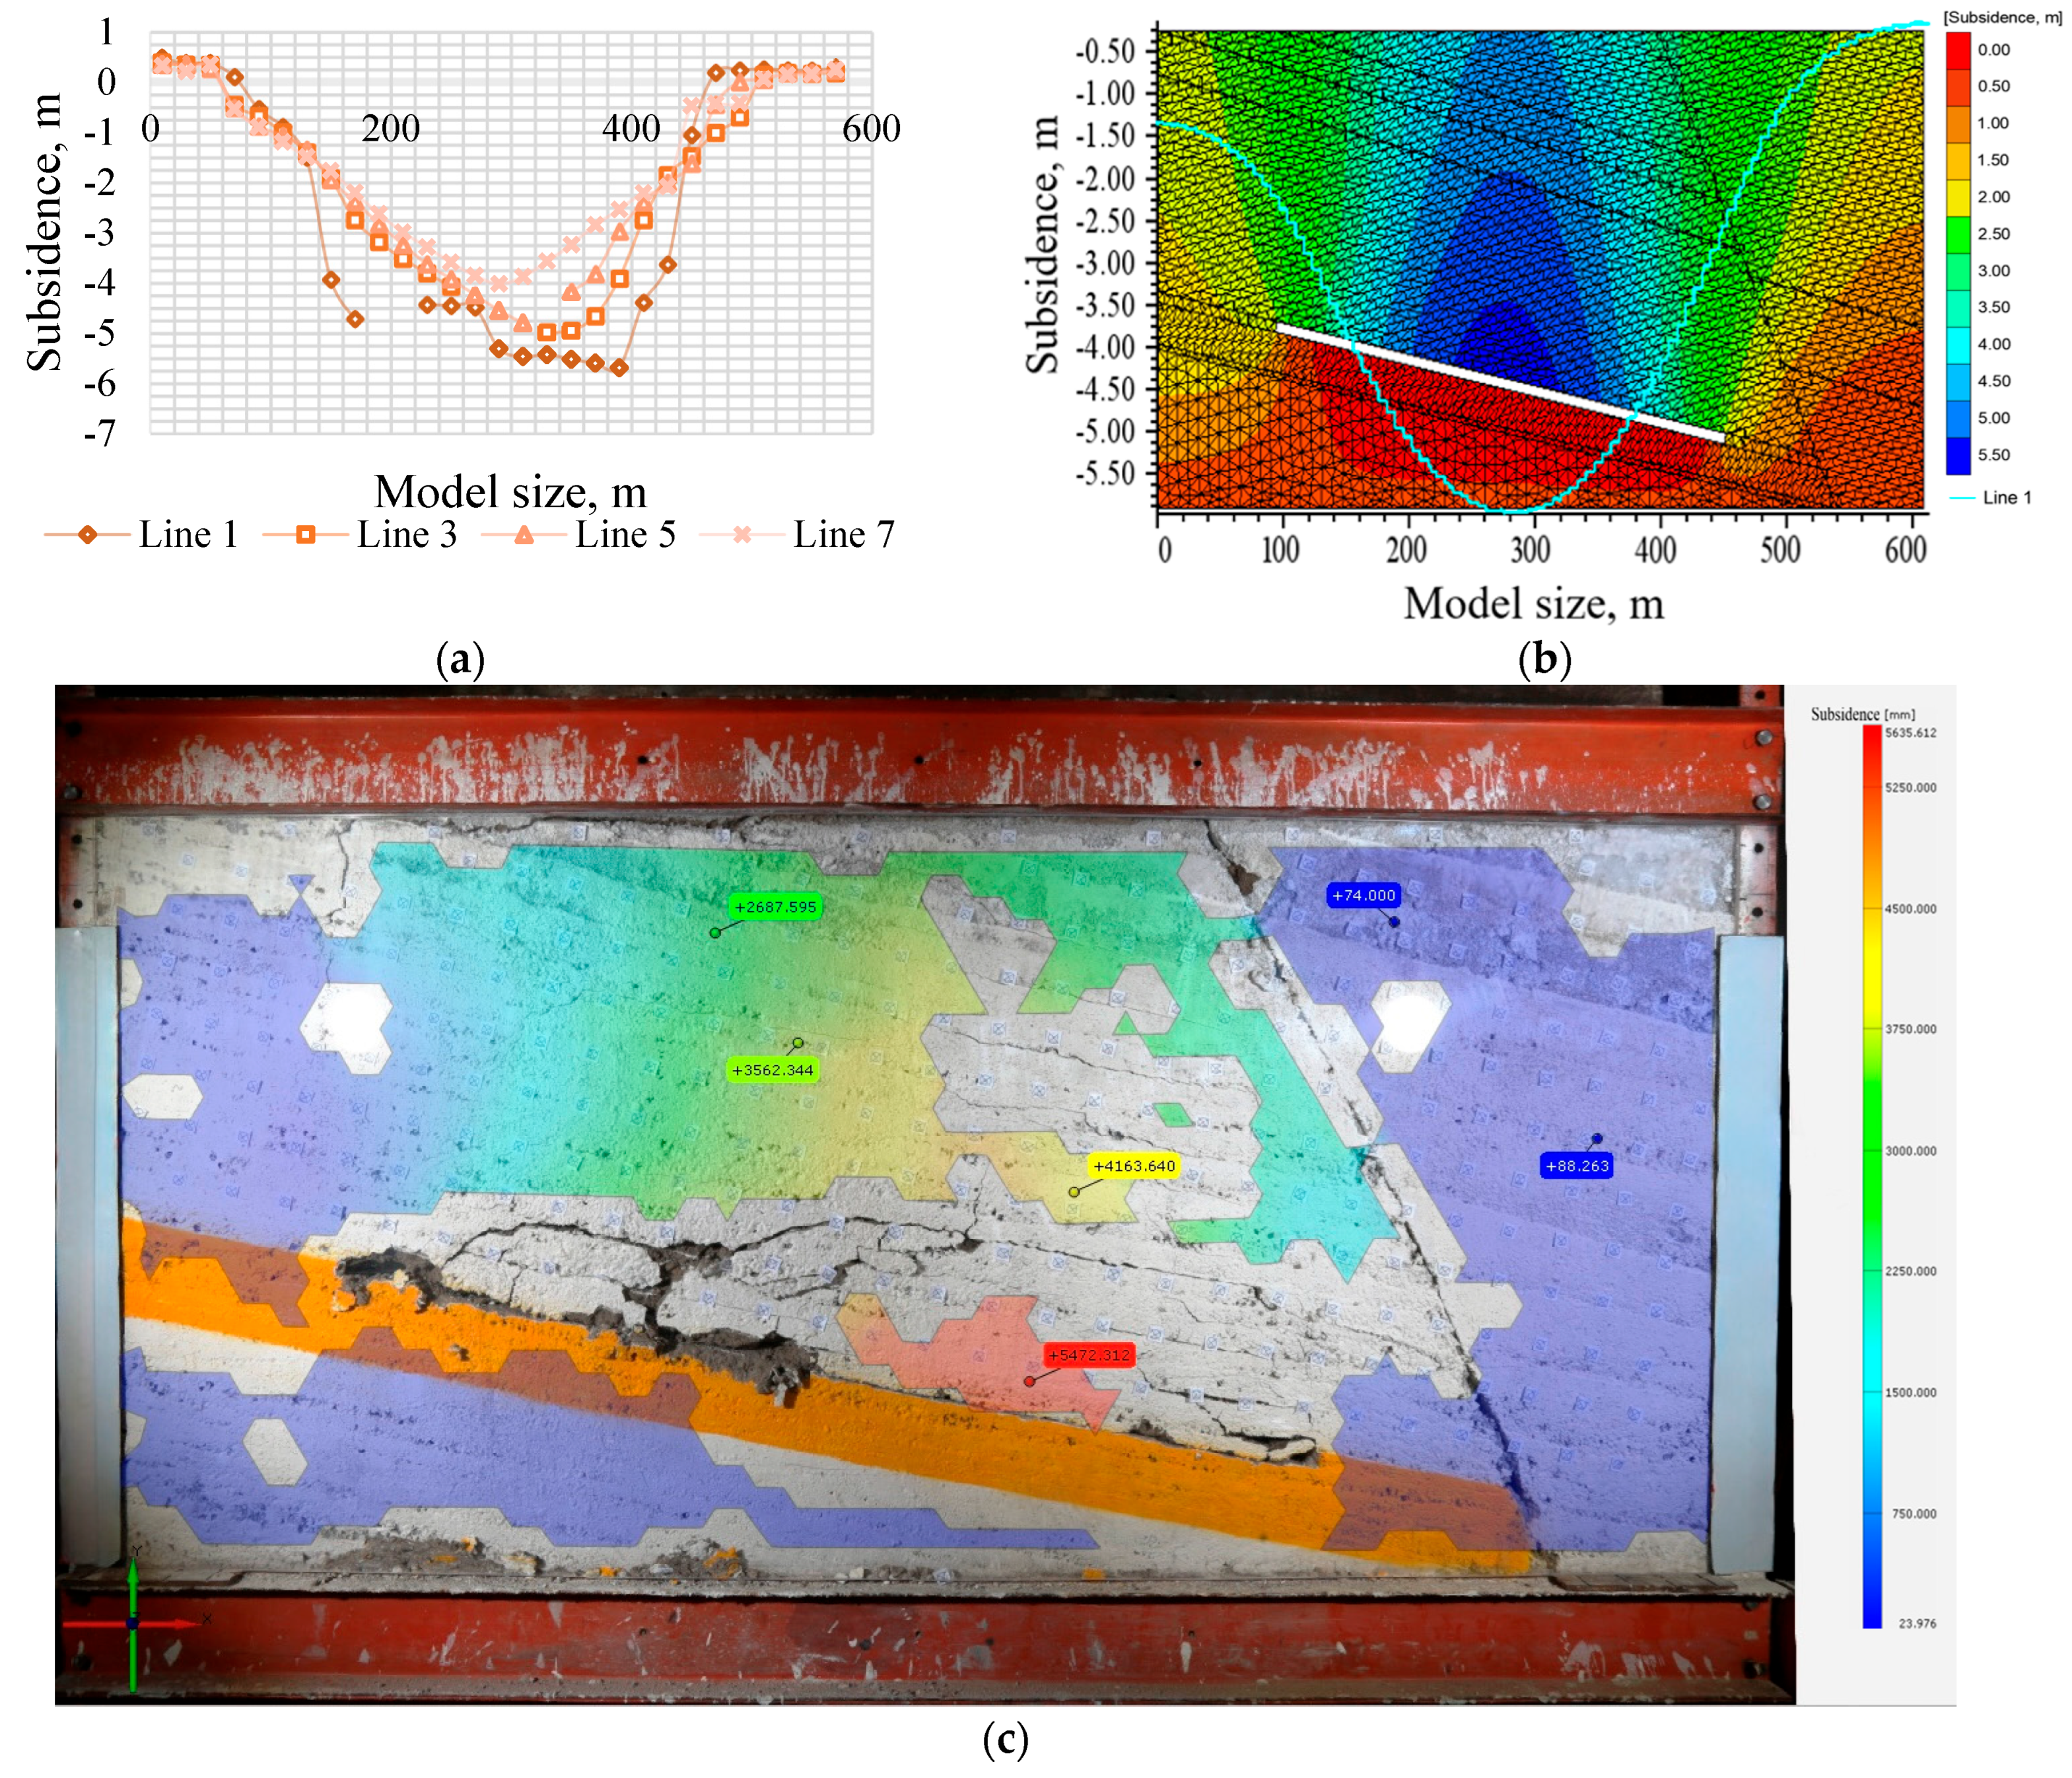
Figure 7 presents the vertical displacement distributions at different elevations above the excavation. In Figure 7a, subsidence curves along reference lines located at 20, 60, 100, and 140 m above the excavation roof (prototype scale) are shown; the maximum subsidence value of approximately 6 m corresponds to the prototype scale. Figure 7b illustrates the displacement field obtained from numerical simulation, where contour lines denote equal vertical displacement values, the color scale represents displacement magnitude in meters, and the cyan line indicates the maximum subsidence profile along the central section. Figure 7c shows the displacement field derived from digital image correlation, with spatial axes expressed in prototype-scale meters and the color bar indicating vertical displacement magnitude.
Figure 7.
Graphs of subsidence after the model is stable; (a) displacement analysis using Tema Motion 2D software for reference points lines (Line 1 is located 20 m above excavated layer roof, Line 3 is 60 m, Line 5 is 100 m and Line 7 is 140 m above, respectively); (b) displacement analysis using UDEC software (Line 1 is located 20 m above excavated layer roof); (c) displacement analysis using digital image correlation method by GOM Correlate software.
The results demonstrate that both the magnitude and spatial extent of subsidence decrease rapidly with increasing distance from the excavation. Measuring points along Line 7, located 140 m above the collapse zone, indicate that a flat-bottomed subsidence trough does not develop beyond this elevation, marking the upper boundary of the deformation influence zone.
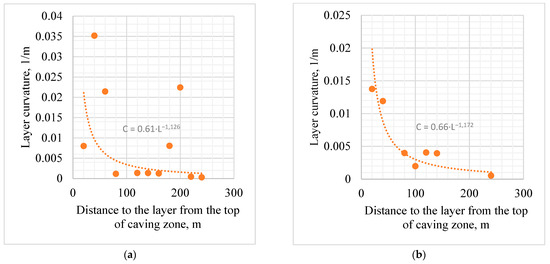
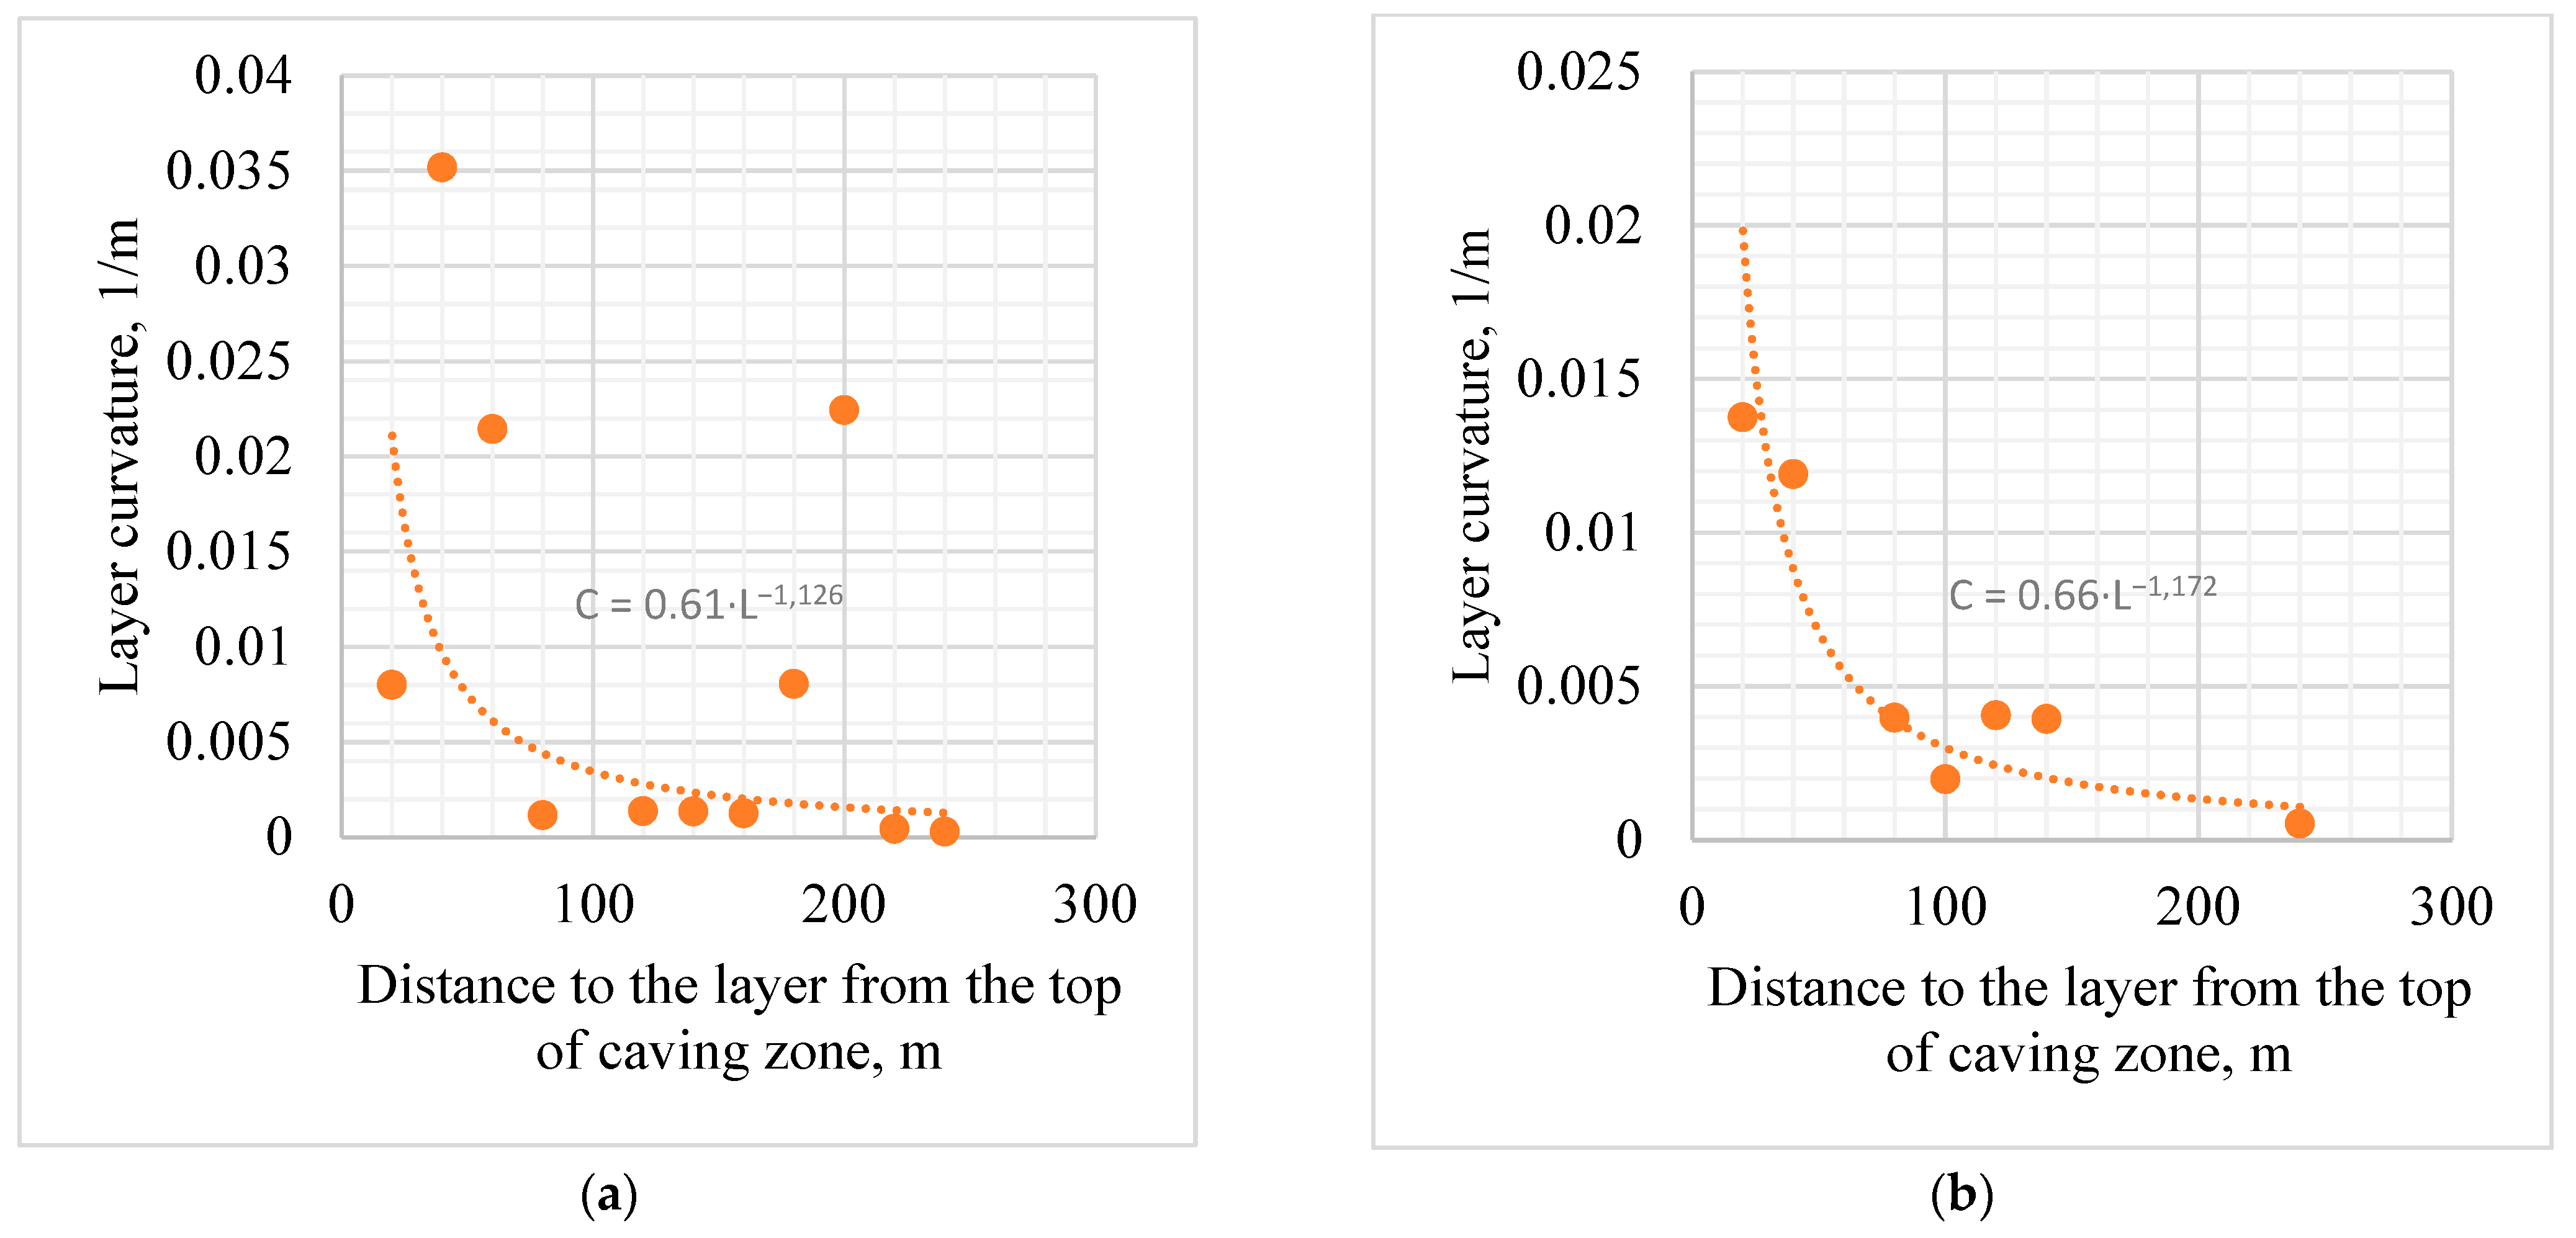
Figure 8 illustrates the evolution of curvature during two representative stages of panel extraction. Despite the different spatial positions of these stages relative to the excavation, the maximum curvature values obtained at both stages are identical, indicating that curvature has reached a limiting value.
Figure 8.
Graph of maximum curvature, where in the formulas C denotes the curvature of the rock layer, L is the vertical distance from the top of the caving zone to the considered layer, m; (a) after six stages of excavation; (b) after the model reaches a stable state.
This coincidence of maximum curvature values confirms the stabilization of the subsidence process. It indicates that the overburden has entered a fully developed subsidence state and that no further upward propagation of significant deformation occurs beyond the identified deformation influence zone.
3.3. Analysis of the Law of Stress Change in Overburden Strata
The evolution of stress within the overburden was analyzed using electrical resistance strain gauges embedded in the physical similarity model. These sensors were connected to a multi-channel data acquisition system, which continuously recorded strain variations during progressive excavation.
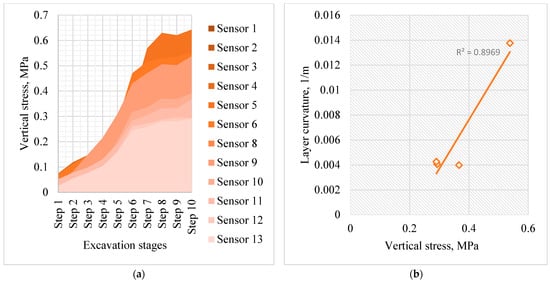
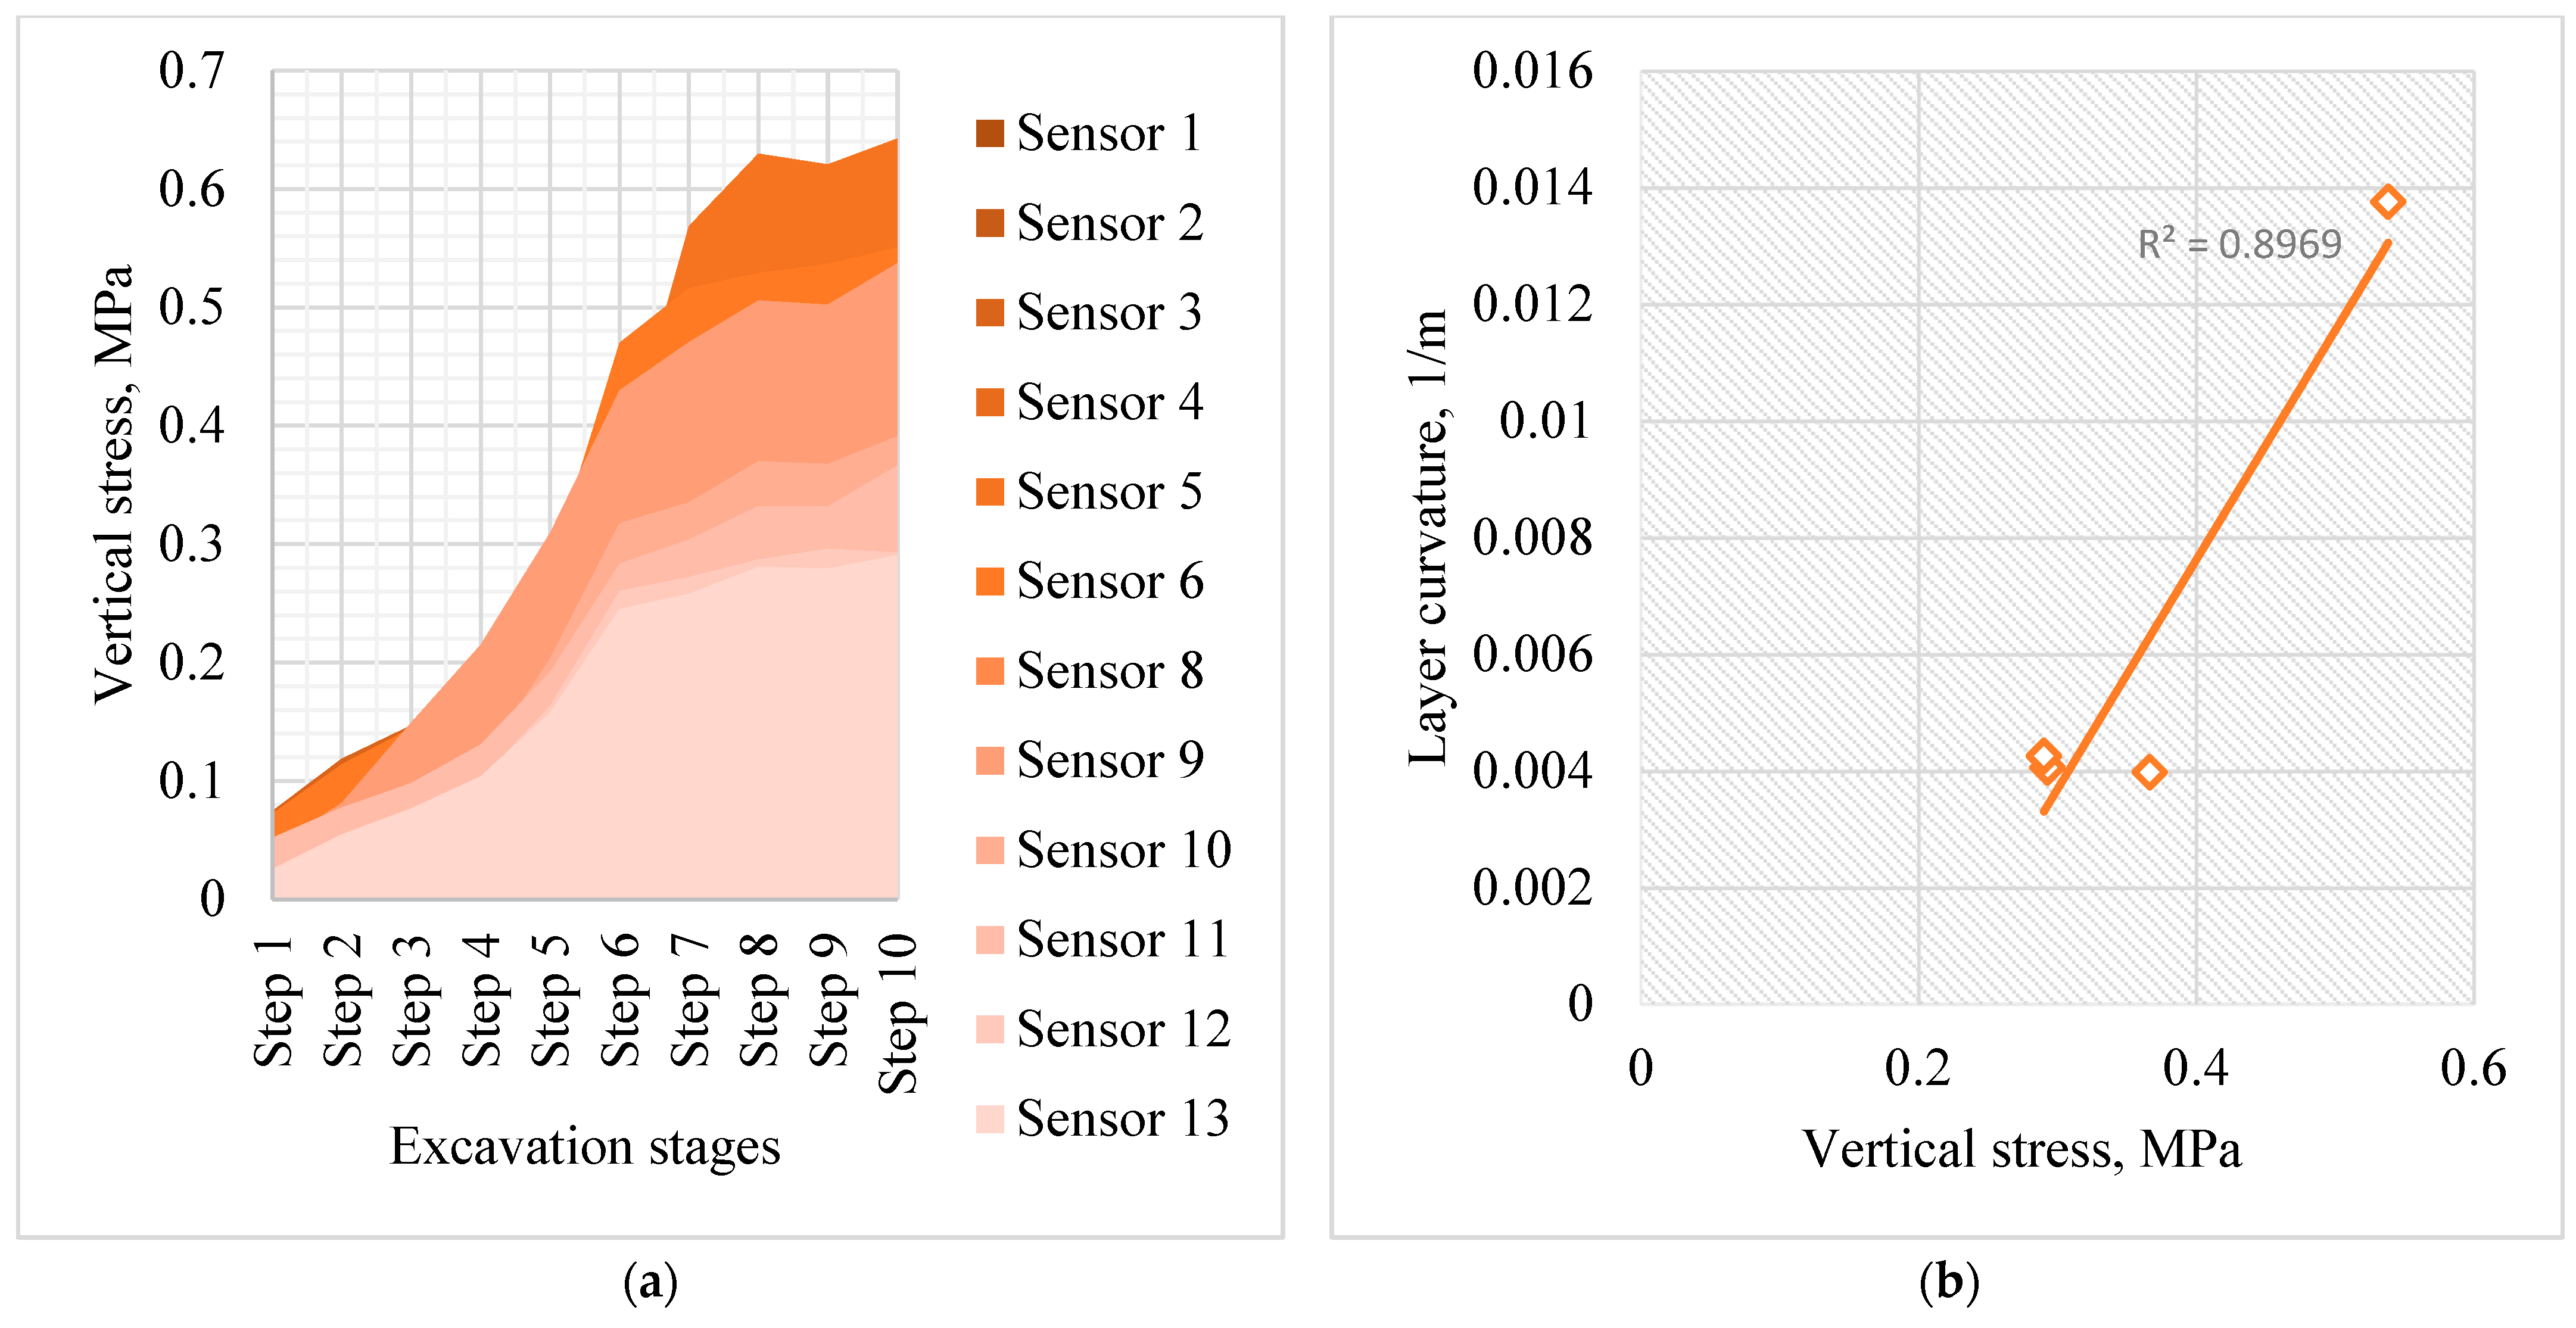
Figure 9a illustrates the evolution of vertical stress in the overburden strata during single-layer excavation conducted in ten sequential stages. The primary measurement line (sensors 1–10) was positioned 20 m (prototype) above the center of each excavation step, enabling tracking of stress redistribution directly above the mined-out area. Additional sensors (No. 11–13) were installed along a major discontinuity at distances of 80, 120, and 160 m (prototype) to capture stress concentration and transfer along structural weaknesses.
Figure 9.
Analysis of the relationship between vertical stress and layer curvature; (a) plot of maximum rock mass stress as a function of excavation stage; (b) graph of the dependence of the curvature of the layer on vertical stress.
As shown in Figure 9a, the slope of the stress–excavation curve increases markedly after the sixth excavation stage, corresponding to the onset of roof rupture and block detachment in the physical model. This behavior indicates a transition from predominantly elastic stress redistribution to progressive structural failure within the overburden.
Figure 9b presents the relationship between vertical stress magnitude and the maximum curvature of the overlying layers, where curvature is used as an indicator of bending intensity and deformation localization. The plot demonstrates a strong positive correlation, indicating that increasing vertical stress is accompanied by enhanced layer bending and curvature development. This confirms that stress concentration is a governing factor controlling deformation geometry and fracture initiation within the overburden strata.
3.4. Analysis of the Law of WCFZ Development in Overburden Strata
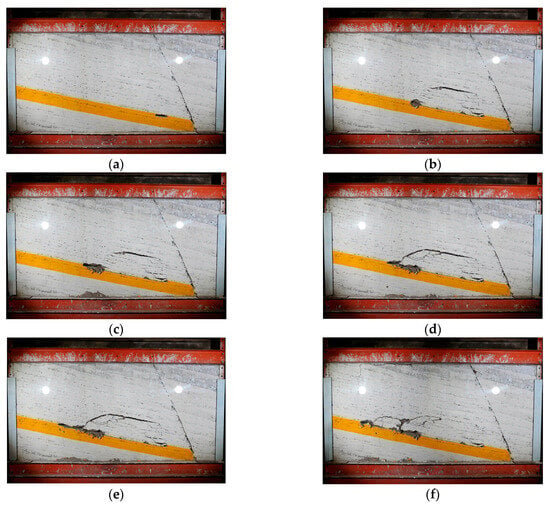
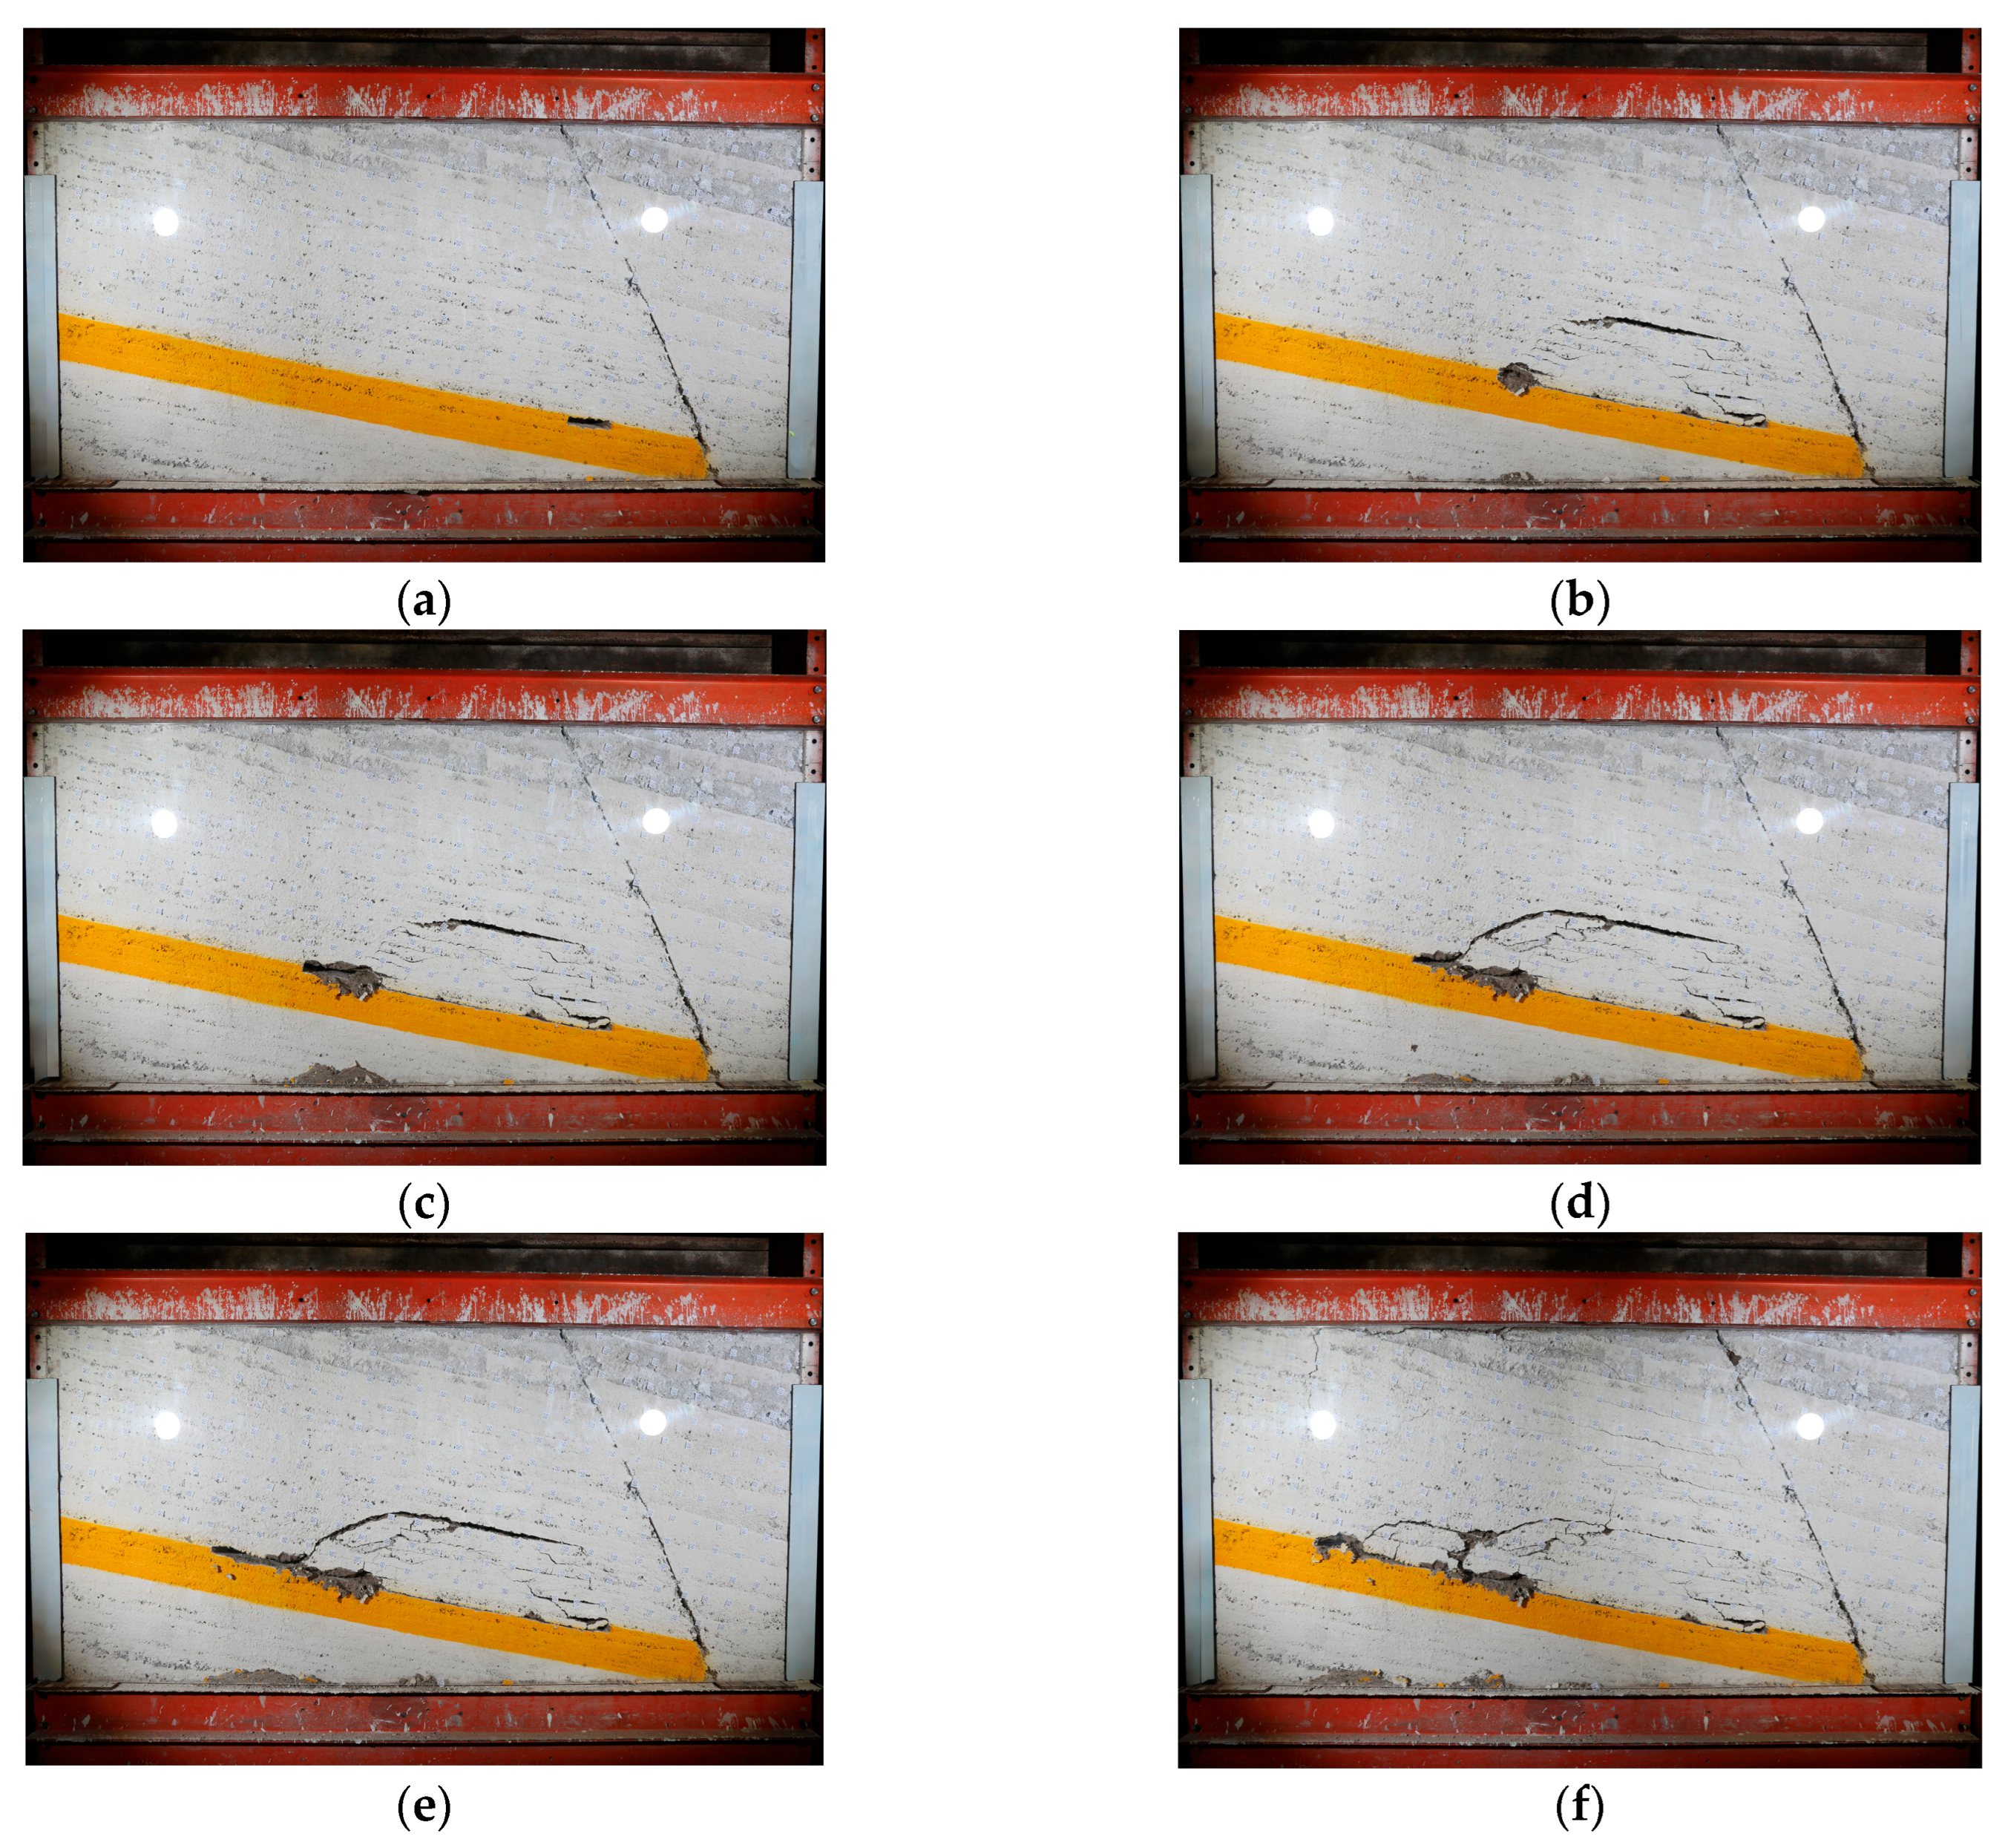
The development of the water-conducting fracture zone (WCFZ) during layered mining was investigated using results of physical similarity modeling, as illustrated in Figure 10. Progressive excavation leads to distinct changes in the fracture patterns of the overburden, with marked differences observed between the initial and final stages of mining. At early excavation stages, deformation is limited to localized roof collapse and the opening of isolated fractures, whereas advanced stages are characterized by the upward propagation and coalescence of fractures forming a continuous fracture zone.
Figure 10.
WCFZ propagation of the overburden strata during physical modeling; (a) excavation of the first element; (b) immediate roof falling in 6th stage of excavation; (c) excavation of 7th stage; (d) excavation of 8th stage; (e) excavation of 9th stage; (f) excavation of the layer after the model is stable.
In the present study, the height of the WCFZ is defined based on the appearance of open fractures that fully penetrate the thickness of individual layers and connect adjacent stratigraphic units. Such fractures are considered water-conducting, as they provide continuous pathways for fluid migration across the overburden. Fractures confined within individual blocks or not extending through the full layer thickness were not classified as part of the WCFZ. This criterion is consistent with established physical modeling practices for evaluating water-conducting fracture zones under mining-induced deformation.
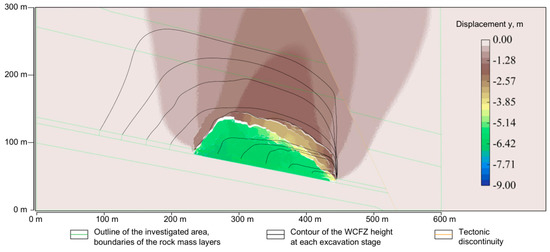
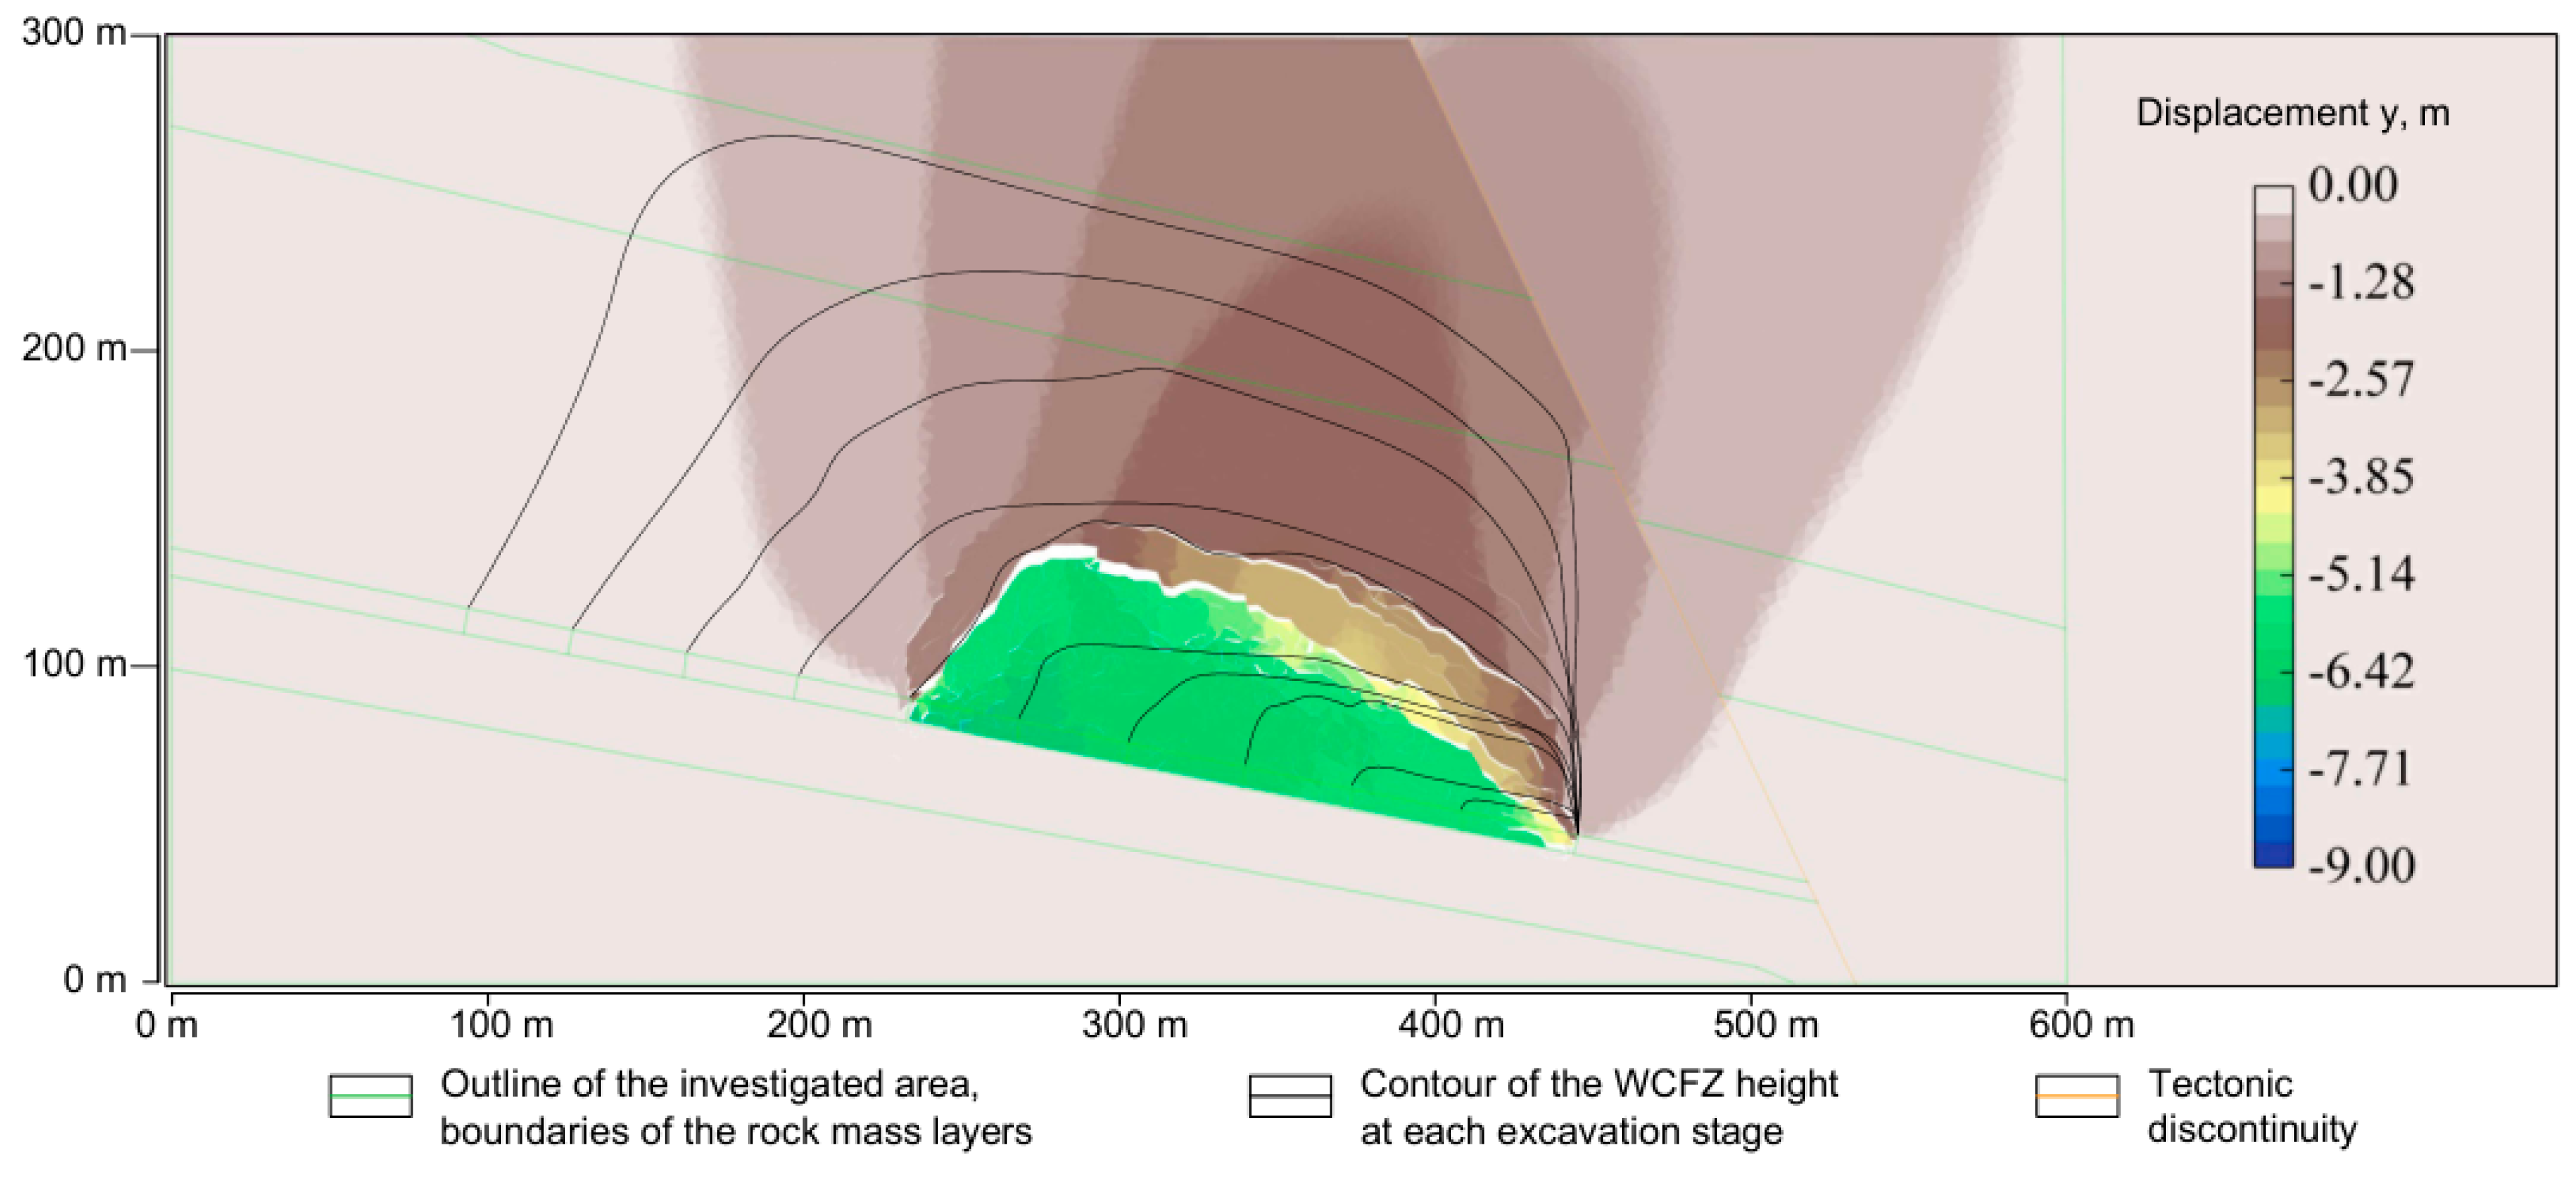
Using the physico-mechanical parameters listed in Table 2, the numerical model, performed with the Prorock finite–discrete element code [11], was calibrated against physical simulations. Calibration was conducted with respect to the collapse zone height at the sixth excavation stage, ensuring consistency between observed fracture patterns in the physical model and simulated failure mechanisms. The calibrated numerical model was subsequently used to evaluate the evolution of WCFZ height as a function of excavation length, as shown in Figure 11.
Figure 11.
WCFZ propagation of the overburden strata during Prorock software numerical simulation.
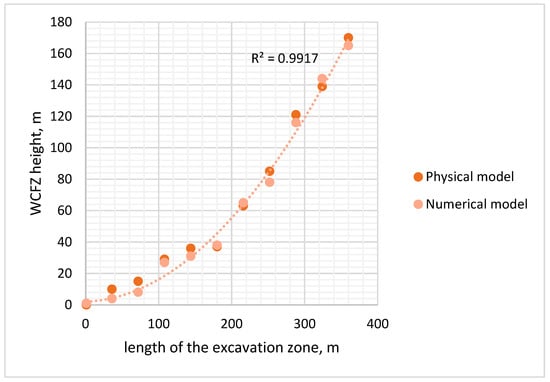
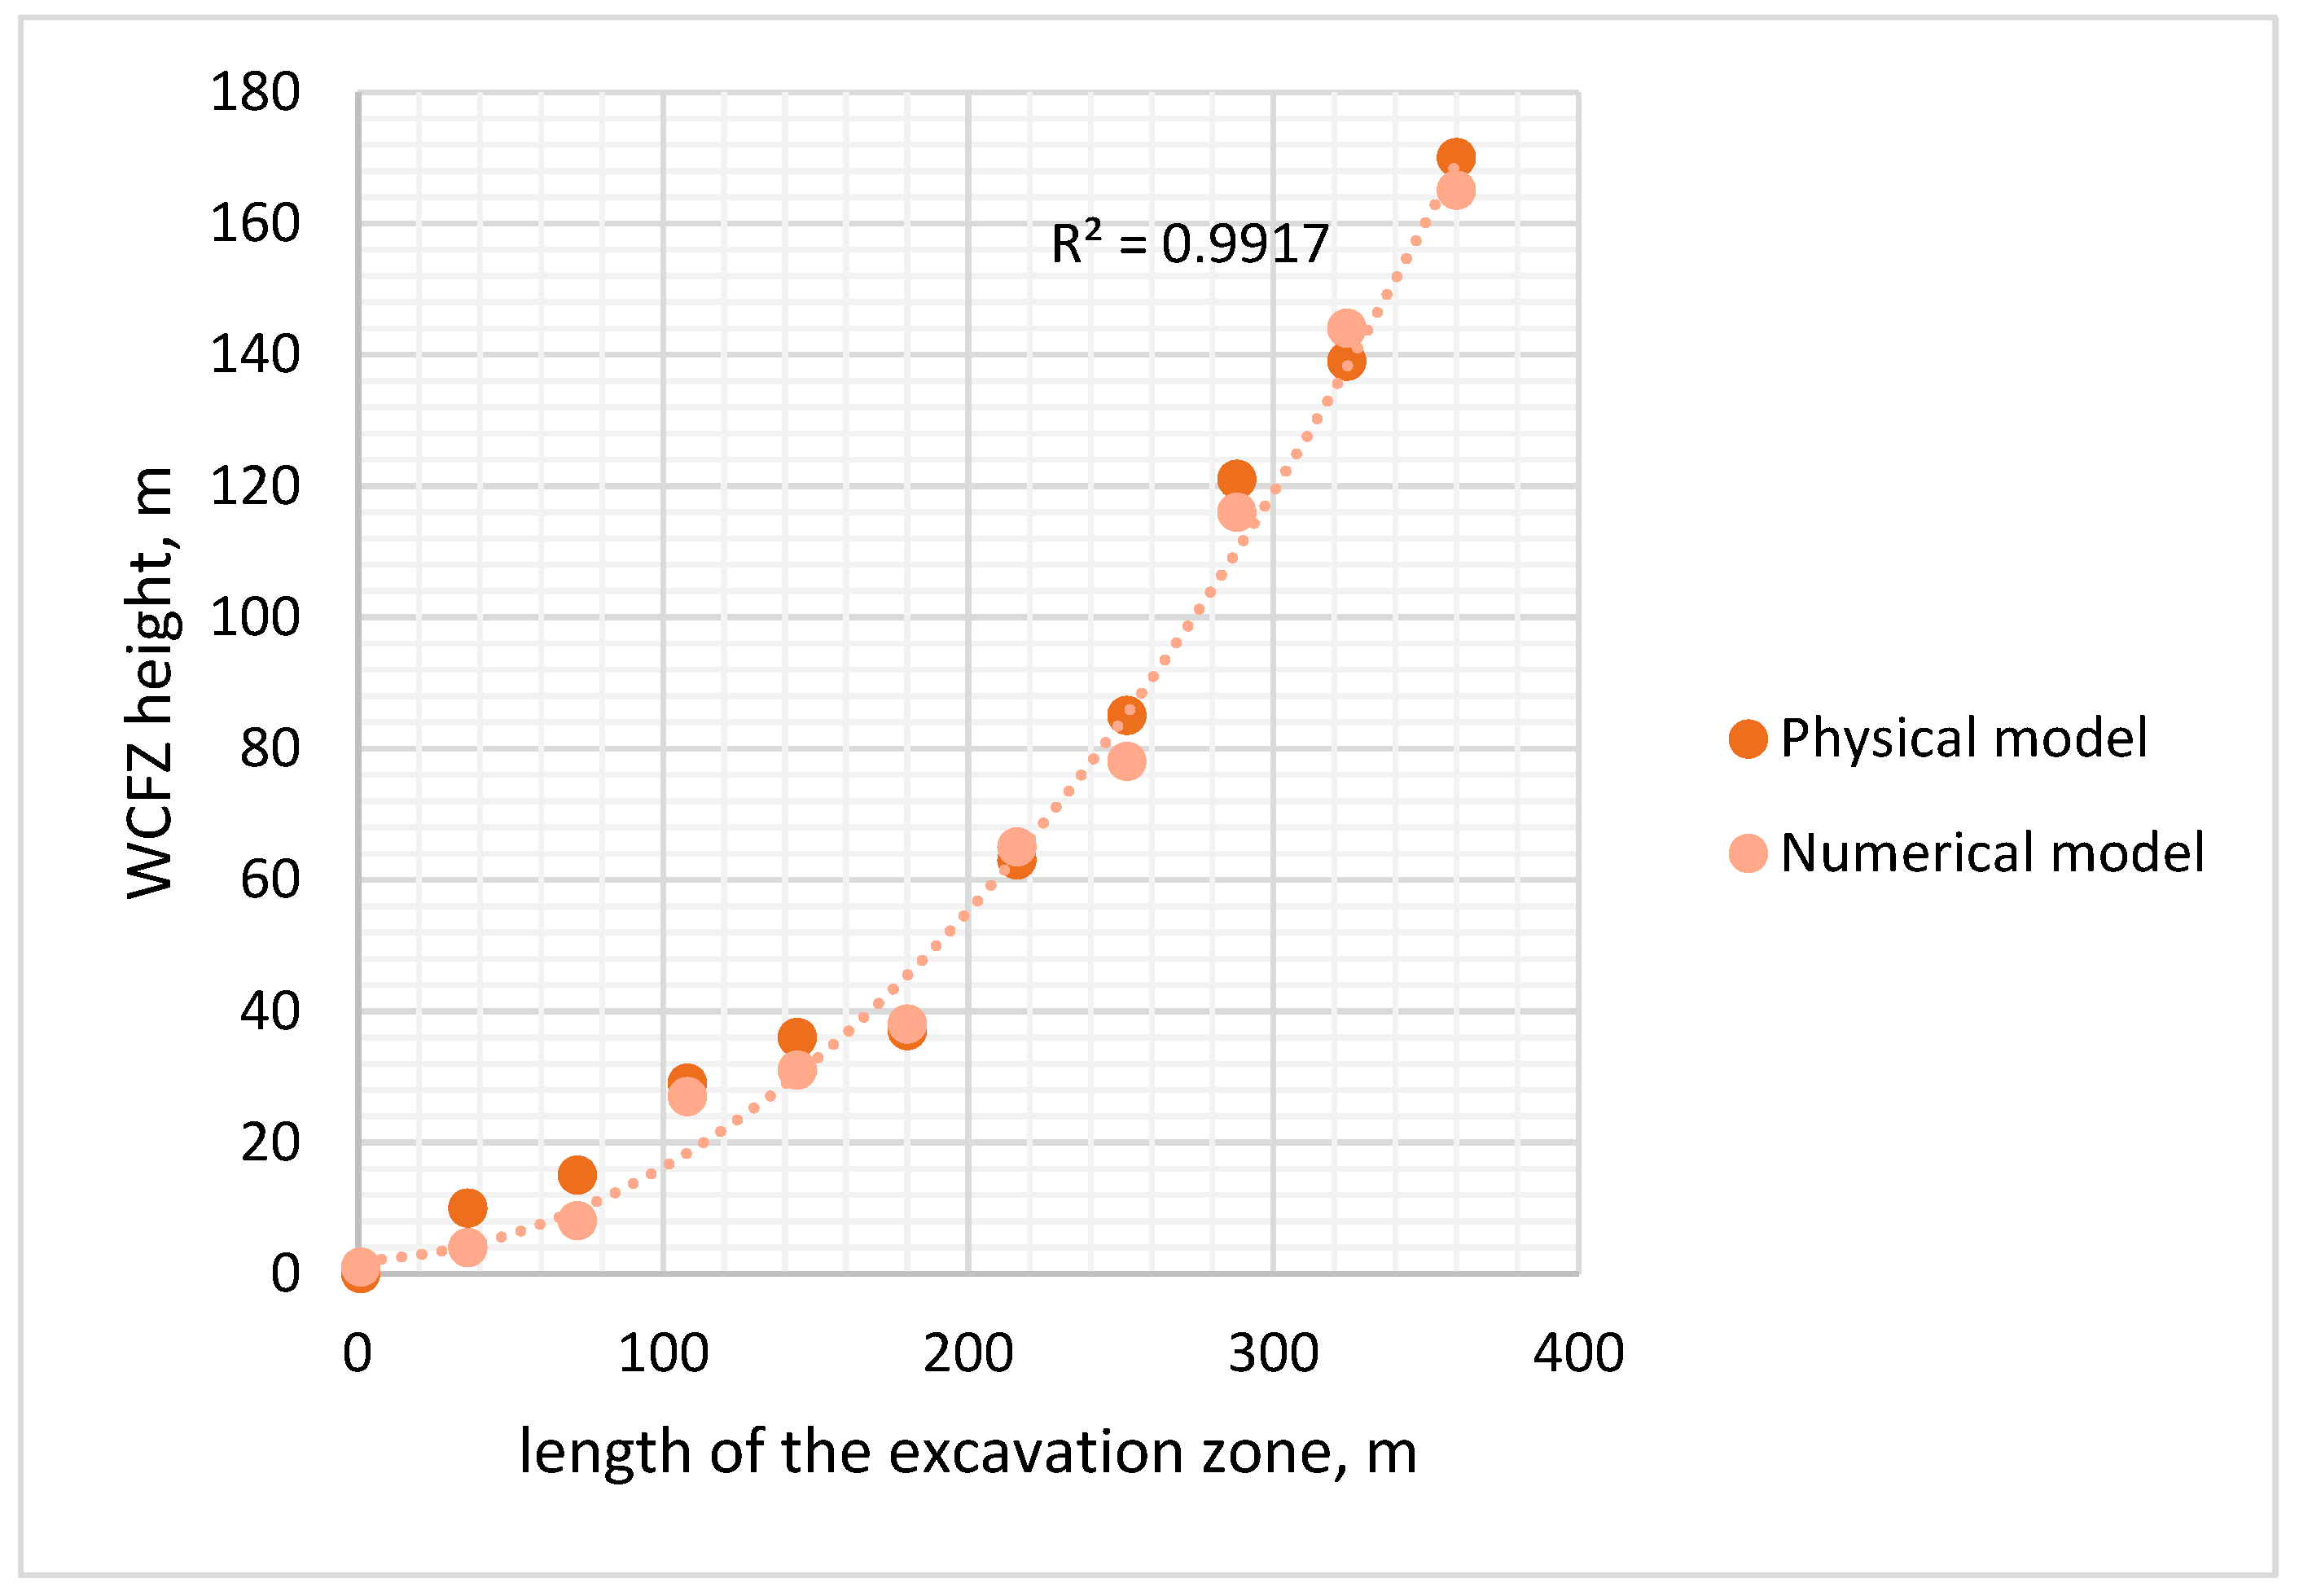
The relationship between WCFZ height and excavation length is summarized in Figure 12 and can be approximated by a second-order polynomial function:
where —the height of the water-conducting fracture zone, D—length of the mine working. This relationship reflects the progressive weakening of the overburden during mining, with rapid growth of the fracture zone at intermediate stages followed by attenuation as deformation stabilizes.
Figure 12.
The relationship between the height of WCFZ and the length of the excavation zone.
The physical similarity experiment was conducted within a two-dimensional modeling framework with laterally constrained boundaries. Although setback zones were introduced to reduce potential boundary effects, some influence of lateral confinement on the extent of the fractured zone cannot be entirely excluded. Nevertheless, the strong consistency between physical observations, calibrated numerical simulations, and field-scale geomechanical behavior demonstrates that the proposed modeling framework provides a reliable basis for assessing the development of water-conducting fracture zones under the specific geological and mining conditions considered in this case study.
4. Discussion
Combined physical and numerical modeling of deep mining under complex geological conditions revealed clear patterns in fracture development and deformation. In particular, the height of the water-conducting fracture zone grew in discrete increments as the excavation advanced. Each mining step induced additional bending of the overlying strata, and once a panel was fully extracted, the fracture height stabilized. This behavior matches trends reported in other studies of fractured zones [18,19,20]. For example, Feng et al. derived a regression model linking mining depth and thickness to fracture height and observed similar stepwise growth of the fracture zone with repeated mining stages [1]. Quantitatively, an empirical relation between WCFZ height and the cumulative span of the working was found, consistent with these earlier findings.
A notable result of the model is that deformation was strongly localized on one side of the fault. The pre-existing discontinuity effectively screened the deformation: collapse and extensive fracturing occurred only on the footwall side, while the hanging-wall side remained largely intact. In other words, the structural fault acted as a natural barrier to stress redistribution. This asymmetry indicates that fault zones can decouple subsidence on opposite sides [21], a phenomenon observed in some mining and geotechnical case studies (faults often compartmentalize stress) [22,23,24]. In the model, the fault plane deflected the stress field, preventing deformation propagation across the divide.
It was also established that the surface curvature of the strata correlates with stress in the rock mass. Measurements showed that areas of high curvature (strong bending) corresponded to zones of elevated vertical stress around the excavation. This finding suggests that curvature can serve as a proxy for stress distribution: higher curvature implies greater stress concentration in the underlying layers. In practice, monitoring of subsidence profiles and curvature in the field could provide indirect estimation of stress changes [25,26,27]. Such curvature–stress relationships are in line with geodetic monitoring practices in mining (studies have used surface deformation to infer fracture zones) [20]. In the case of study, curvature proved to be a reliable indicator of the upper boundary of the WCFZ under different levels.
The empirical law of fracture growth with excavation span was also confirmed. As the length or width of the mine panel increased, the final WCFZ height increased nonlinearly. In tests, the fracture height rose almost exponentially with span until the panel was fully caved, then plateaued. This behavior agrees with the concept of an expanding bending zone under larger openings. It means that longer or wider excavations will generate disproportionately larger fracture networks. This insight allowed to parameterize the fracture height as a function of panel geometry and mining depth for the given geomechanical conditions.
The research integrated modeling framework builds on the idea of multi-scale monitoring [28] advocated in the literature [29,30,31]. For instance, a two-stage geodetic monitoring approach—zonal surveillance followed by local deformation networks—for identifying hazardous zones [32,33,34]. In a similar spirit, there is a need to assess regional hydrogeological risk, then conduct local physical and numerical simulations of rock deformation. The agreement between the physical model and numerical simulation serves as cross-validation and increases confidence in the predictions.
External factors outside the mechanics of rock failure can influence outcomes. For example, blasting operations introduce seismic waves that can weaken the rock mass at a distance. The amplitude–frequency characteristics of blast-induced waves were found to have resonance frequencies that significantly reduce marginal rock strength [35]. In a mine setting, such vibrations could exacerbate fracturing in the overburden. Similarly, hydrological effects are important: Ustiugov et al. showed that rainfall infiltration exhibits strong seasonal cycles that strongly recharge groundwater [36]. These hydrogeological processes affect pore pressures in fractures and, therefore, water inrush hazards. Environmental health is another consideration [22], but these factors lie beyond the structural focus of study.
At the same time, many previous investigations of water-conducting fracture zones have been conducted under simplified geological assumptions, often neglecting the role of structural discontinuities or relying primarily on empirical correlations or isolated numerical simulations. Such simplifications restrict the applicability of existing results to deep mining environments characterized by complex faulted structures.
In summary, by contextualizing mechanical results with such studies of monitoring and hydro-geomorphic processes [37,38,39], it is reinforced the robustness of the integrated approach and its relevance for practical mine safety.
The study has limitations related to scale and model simplifications. Laboratory-scale physical models cannot capture all heterogeneities of real rock, and the numerical simulation assumes idealized material laws. These issues may lead to some discrepancy in fracture height (for example, heterogeneities in the physical model can trigger earlier collapse than a homogeneous simulation). Nevertheless, the combined use of both methods follows best practices in rock mechanics and yields a comprehensive picture. Once calibrated, the approach could be adjusted for site-specific conditions (e.g., different stratigraphy or fault orientations). Future extensions could incorporate microseismic monitoring in the physical model or use in situ geophysical data to refine fracture detection. Overall, the results furnish new experimental and numerical insights into WCFZ formation, which can help calibrate predictive models and support safer mining under water-bearing strata.
5. Conclusions
- Fault barrier effect. The pre-existing fault served as an effective natural screen: collapse and fracture development were confined to the hanging-wall side, with essentially no deformation crossing the fault plane.
- Curvature–stress dependence. It is established that the curvature of the overlying strata is controlled by the stress in the rock mass. In the model, points of highest curvature coincided with zones of elevated stress, indicating that surface curvature can reliably signal stress redistribution at depth.
- Fracture zone growth law. The height of the water-conducting fracture zone increases predictably with the size of the excavation. Larger panel spans produced higher fracture zones according to an empirical (near-exponential) relation, consistent with an expanding bending beam model.
- Integrated predictive method. Taken together, these findings form a basis for forecasting vertical displacements and fracture development in deep polymetallic ore mines with complex fault structures. By combining physical experiment with calibrated numerical simulation, the methodology enables accurate prediction of subsidence and WCFZ limits under the studied geomechanical conditions.
- Safety implications. The coupled modeling framework, validated by experiments, provides robust criteria for safe mining under aquifers. It allows engineers to infer the upper boundary of dangerous fracture zones from surface deformation data, thereby supporting proactive design of pillars, backfill, and water-control measures.
In summary, the integrated approach advances the understanding of how tectonic faults and excavation geometry govern rock mass behavior, and offers a practical tool for predicting vertical movements and preventing water inrush hazards in deep mineral deposits.
Author Contributions
Conceptualization, E.O. and V.G.; methodology, E.O., Z.Z. and W.W.; software, Z.Z. and E.O.; validation, E.O., K.W. and W.W.; formal analysis, E.O. and V.G.; investigation, E.O. and W.W.; resources, Z.Z., K.W. and W.W.; data curation, E.O.; writing—original draft preparation, E.O.; writing—review and editing, E.O.; visualization, E.O.; supervision, V.G. and Z.Z.; project administration, K.W. and Z.Z. All authors have read and agreed to the published version of the manuscript.
Funding
This research received no external funding.
Data Availability Statement
The raw data supporting the conclusions of this article will be made available by the authors on request.
Conflicts of Interest
The authors declare no conflicts of interest.
Abbreviations
The following abbreviations are used in this manuscript:
| WCFZ | Water-Conducting Fracture Zone |
| UDEC | Universal Distinct Element Code |
References
- Feng, J.; Shi, X.; Chen, J.; Wang, K. Prediction of the water-conducting fracture zone height across the entire mining area based on the multiple nonlinear coordinated regression model. Water 2025, 17, 1303. [Google Scholar] [CrossRef] [Scilit]
- Zhao, B.; He, S.; Bai, K.; Lu, X.; Wang, W. Elastic wave prospecting of water-conducting fractured zones in coal mining. Sci. Rep. 2024, 14, 7036. [Google Scholar] [CrossRef] [Scilit]
- Hu, T.; Han, K.; Song, C.; Che, J. Development Law of Water-Conducting Fracture Zones in Overburden above Fully Mechanized Top-Coal Caving Face: A Comprehensive Study. Processes 2024, 12, 2076. [Google Scholar] [CrossRef] [Scilit]
- Zhang, Y.; Liu, Y.; Lai, X.; Gao, J. Physical modeling of the controlled water-flowing fracture development during short-wall block backfill mining. Lithosphere 2021, 2021, 2860087. [Google Scholar] [CrossRef] [Scilit]
- Zhao, G.; Liu, Y.; Wang, Z.; Xu, Q.; Shen, B. Machine Learning Model for Predicting the Height of the Water-Conducting Fracture Zone Considering the Influence of Key Stratum and Dip Mining Intensity. Water 2025, 17, 234. [Google Scholar] [CrossRef] [Scilit]
- Kang, Z.; Yang, D.; Shen, P. Prediction correction modeling of water-conducting fracture zones height due to repeated mining in close distance coal seams. Sci. Rep. 2024, 14, 31611. [Google Scholar] [CrossRef] [Scilit]
- Li, J.; He, Z.; Piao, C.; Chi, W.; Lu, Y. Research on subsidence prediction method of water-conducting fracture zone of overlying strata in coal mine based on grey theory model. Water 2023, 15, 4177. [Google Scholar] [CrossRef] [Scilit]
- Lian, H.; Zhang, Q.; Yin, S.; Yan, T.; Yao, H.; Yang, S.; Kang, J.; Xia, X.; Li, Q.; Huang, Y.; et al. Integrating microseismic monitoring for predicting water inrush hazards in coal mines. Water 2024, 16, 1168. [Google Scholar] [CrossRef] [Scilit]
- Zherlygina, E.S.; Kuranova, M.E.; Gusev, V.N.; Odintsov, E.E. Identification of hazardous sites based on studying the development of man-made fractures within the rock mass. Gorn. Promyshlennost (Min. Ind.) 2025, 1, 162–169. [Google Scholar] [CrossRef] [Scilit]
- Litvinenko, V.S.; Petrov, E.I.; Vasilevskaya, D.V.; Yakovenko, A.V.; Naumov, I.A.; Ratnikov, M.A. Assessment of the role of the state in the management of mineral resources. J. Min. Inst. 2023, 259, 95–111. [Google Scholar] [CrossRef] [Scilit]
- Ilyasov, B.T.; Ozhiganov, I.A.; Trofimov, A.V. Influence of the spatial variability of rock strength on the rock burst hazard in rock masses. Gorn. Promyshlennost (Min. Ind.) 2024, 6, 74–82. [Google Scholar] [CrossRef] [Scilit]
- Odintsov, E.E.; Gusev, V.N. Rock Mass Condition Control by the Method of Predicting of Water-conducting Fracture Zone Parameters for the Deposits of Polymetallic Ores. Int. J. Eng. 2026, 39, 1326–1333. [Google Scholar] [CrossRef] [Scilit]
- Yi, C.; Johansson, D.; Greberg, J. Effects of in-situ stresses on the fracturing of rock by blasting. Comput. Geotech. 2018, 104, 321–330. [Google Scholar] [CrossRef] [Scilit]
- Nasehi, M.J.; Mortazavi, A. Effects of in-situ stress regime and intact rock strength parameters on hydraulic fracturing. J. Pet. Sci. Eng. 2013, 108, 211–221. [Google Scholar] [CrossRef] [Scilit]
- Yan, T.; Zhu, C.; Li, Q.; Wu, H.; Peng, Y. Investigating fracture evolution mechanisms in thick coal seam mining under upper hard and lower soft overburden: A case study. Sci. Rep. 2025, 15, 11358. [Google Scholar] [CrossRef] [Scilit]
- Zuev, B.Y.; Istomin, R.S.; Obozhina, E.P. Physical simulation of nonlinear geomechanical processes in potash ore mining. Gorn. Zhurnal (Min. J.) 2023, 5, 11. [Google Scholar] [CrossRef] [Scilit]
- Karasev, M.A.; Petrushin, V.V.; Rysin, A.I. The hybrid finite/discrete element method in description of macrostructural behavior of salt rocks. MIAB. Mining Inf. Anal. Bull. 2023, 4, 48–66. [Google Scholar] [CrossRef] [Scilit]
- Wang, P.; Jiang, Y.; Ren, Q. Roof hydraulic fracturing for preventing floor water inrush under multi aquifers and mining disturbance: A case study. Energies 2022, 15, 1187. [Google Scholar] [CrossRef] [Scilit]
- Baryakh, A.A.; Devyatkov, S.Y.; Denkevich, E.T. Mathematical modelling of displacement during the potash ore mining by longwall faces. J. Min. Inst. 2023, 259, 13–20. [Google Scholar] [CrossRef] [Scilit]
- Mustafin, M.G.; Slobodkin, S.M. Methodology of Geodetic Observations for Forecasting of Potentially Hazardous Zones of Operating Main Pipelines. Int. J. Eng. 2026, 39, 1753–1761. [Google Scholar] [CrossRef] [Scilit]
- Trushko, V.L.; Trushko, O.V. Integrated development of iron ore deposits based on competitive underground geotechnologies. J. Min. Inst. 2021, 250, 569–577. [Google Scholar] [CrossRef] [Scilit]
- Protosenya, A.G.; Alekseev, A.V.; Verbilo, P.E. Prediction of the stress-strain state and stability of the front of tunnel face at the intersection of disturbed zones of the soil mass. J. Min. Inst. 2022, 254, 252–260. [Google Scholar] [CrossRef] [Scilit]
- Shojaee Barjoee, S.; Rodionov Alekseevich, V. Respirable Dust in Ceramic Industries (Iran) and its Health Risk Assessment using Deterministic and Probabilistic Approaches. Pollution 2024, 10, 1206–1226. [Google Scholar] [CrossRef] [Scilit]
- Xu, J.; Pan, F.; Li, J. Investigation of water-flowing fracture zone height in fully mechanized cave mining beneath thick alluvium. Geotech. Geol. Eng. 2017, 35, 1745–1753. [Google Scholar] [CrossRef] [Scilit]
- Zhang, W.; Wu, X.; Wu, X.; Lei, Y.; Shao, J.; Wang, Z. Risk Assessment of Water and Sand Inrush in Mining under Thick Loose Layer Based on Comprehensive Weight-Cloud Model. Geofluids 2023, 11, 1–12. [Google Scholar] [CrossRef] [Scilit]
- Zhao, D.; Li, Z.; Feng, G.; Wang, F.; Hao, C.; He, Y.; Dong, S. Using Swarm Intelligence Optimization Algorithms to Predict the Height of Fractured Water-Conducting Zone. Energy Explor. Exploit. 2023, 41, 1603–1627. [Google Scholar] [CrossRef] [Scilit]
- Saadat, M.; Khishvand, M.; Seccombe, A. FLAC3D Simulation of Caving Mechanism and Strata Fracture Response in Underground Mining. Mining 2024, 4, 818–840. [Google Scholar] [CrossRef] [Scilit]
- Iraji, S.; Soltanmohammadi, R.; Matheus, G.F.; Basso, M.; Vidal, A.C. Application of Unsupervised Learning and Deep Learning for Rock Type Prediction and Petrophysical Characterization Using Multi-Scale Data. Geoenergy Sci. Eng. 2023, 230, 221241. [Google Scholar] [CrossRef] [Scilit]
- Ajayi, K.M.; Shahbazi, K.; Tukkaraja, P.; Katzenstein, K. Estimation of Radon Diffusivity Tensor for Fractured Rocks in Cave Mines Using a Discrete Fracture Network Model. J. Environ. Radioact. 2019, 196, 104–112. [Google Scholar] [CrossRef] [Scilit]
- Gao, W.; Li, Y.; He, Q. Determination of Fractured Water-Conducting Zone Height Based on Microseismic Monitoring: A Case Study in Weiqiang Coalmine, Shaanxi, China. Sustainability 2022, 14, 8385. [Google Scholar] [CrossRef] [Scilit]
- Sun, D.D.; Hou, X.A.; Yang, T.H.; Zhao, Y.; Zhang, P.H.; Yang, B.; Liu, Y.L.; Ma, K. Calibration of Water Inrush Channel and Numerical Simulation of Water Inrush Process in Coal Mine Roof. Front. Earth Sci. 2022, 10, 931508. [Google Scholar] [CrossRef] [Scilit]
- Fernández, A.; Sanchidrián, J.A.; Segarra, P.; Gómez, S.; Li, E.M.; Navarro, R. Rock Mass Structural Recognition from Drill Monitoring Technology in Underground Mining Using Discontinuity Index and Machine Learning Techniques. Int. J. Min. Sci. Technol. 2023, 33, 555–571. [Google Scholar] [CrossRef] [Scilit]
- Ma, K.; Zhang, Y.; Ruan, M.; Guo, J.; Chai, T. Land subsidence in a coal mining area reduced soil fertility and led to soil degradation in arid and semi-arid regions. Int. J. Environ. Res. Public Health 2019, 16, 3929. [Google Scholar] [CrossRef] [Scilit] [PubMed]
- Zheng, Q.; Wang, C.; Liu, W.; Pang, L. Evaluation on Development Height of Water-Conducted Fractures on Overburden Roof Based on Nonlinear Algorithm. Water 2022, 14, 3853. [Google Scholar] [CrossRef] [Scilit]
- Afanasev, P.I.; Belov, A.A. Assessment of the seismic-blast effects on the marginal rock mass due to the amplitude-frequency characteristics of the blast. Gorn. Promyshlennost (Min. Ind.) 2025, 3, 138–145. [Google Scholar] [CrossRef] [Scilit]
- Ustyugov, D.L.; Noa Segura, E.L.; Ryakhovsky, M.S. Influence of rainfall infiltration on groundwater recharge in hydrogeological region La Yana, Cuba. Gorn. Zhurnal 2024, 97–102. [Google Scholar] [CrossRef] [Scilit]
- Liu, Y.; Yuan, S.; Yang, B.; Liu, J.; Ye, Z. Predicting the Height of the Water-Conducting Fractured Zone Using Multiple Regression Analysis and GIS. Environ. Earth Sci. 2019, 78, 422. [Google Scholar] [CrossRef] [Scilit]
- Yu, L.; Su, H.; Jing, H.; Zhang, Q.; Yang, E. Experimental study of the mechanical behavior of sandstone affected by blasting. Int. J. Rock Mech. Min. Sci. 2017, 93, 234–241. [Google Scholar] [CrossRef] [Scilit]
- Yin, H.; Dong, F.; Zhang, Y.; Cheng, W.; Zhai, P.; Ren, X.; Liu, Z.; Zhai, Y.; Li, X. Height Prediction and 3D Visualization of Mining-Induced Water-Conducting Fracture Zone in Western Ordos Basin Based on a Multi-Factor Regression Analysis. Energies 2022, 15, 3850. [Google Scholar] [CrossRef] [Scilit]

Disclaimer/Publisher’s Note: The statements, opinions and data contained in all publications are solely those of the individual author(s) and contributor(s) and not of MDPI and/or the editor(s). MDPI and/or the editor(s) disclaim responsibility for any injury to people or property resulting from any ideas, methods, instructions or products referred to in the content. |
© 2026 by the authors. Licensee MDPI, Basel, Switzerland. This article is an open access article distributed under the terms and conditions of the Creative Commons Attribution (CC BY) license.