


Abstract
This study describes the second iteration of VLEPIC, a gamified and personalised virtual learning environment (VLE) for secondary English students in Ecuador. Adopting a design-based research approach, it focuses on student interaction and system improvement. A mixed-methods design combined survey results, digital logs, and student comments. Results indicated acceptable usability; however, log data showed that platform use was episodic and task-oriented, with no evidence of daily use. Instead, students logged in repeatedly for specific tasks, and participation declined towards the end. Feedback pointed to mobile reading issues, slow loading times, and confusion around task submission. These findings refine design principles (DPs) for schools with limited resources. The resulting priorities are to design for frequent re-entry, simplify task submission, and present progress more clearly. Together, these DPs offer practical guidance for VLEs in such settings. They illustrate how design can support continuity, reduce uncertainty, and sustain learning routines when access is interrupted.
1. Introduction
Digital technologies are widely present in education, although their availability does not guarantee effective use [1]. Effective implementation depends on interaction quality, that is, how users interact with the system in context. Human–computer interaction (HCI) research states that user interface (UI) design is not merely aesthetic; it drives user behaviour by regulating navigation flows and feedback [2,3]. In a classroom, usability is a decisive factor. If a tool causes friction, students are less likely to adopt it consistently or to persist; this suggests that educational technologies should be treated as designed interactive systems [4]. To sustain engagement, this study considers gamification and personalisation. Earlier approaches to gamification often focused mainly on points or badges. Recent research conceptualises gamification more broadly, viewing it as an experiential design aiming to support motivation and meaningful interaction [5,6]. The conceptualisation of personalisation has also evolved. It is not limited to adaptive algorithms alone; it involves offering flexible scaffolding and pathways personalised to individual users [7]. Despite expectations, many systems remain limited because they accumulate features without a clear design rationale. This results in platforms that are technically gamified yet fail to provide long-term engagement [6,8].
Such design limitations become structural failures in restricted contexts. In low-resource public schools with shared devices, an overly complex interface acts as an exclusionary barrier [1,9]. System reliability may be affected by intermittent connectivity or hardware limitations [9]. While this environment favours mobile-assisted language learning (MALL), the MALL literature also cautions that mobile learning is shaped by device conditions, connectivity, and usability constraints [10]. These contextual factors are design drivers that require attention to simplicity and cross-platform compatibility. We conceptualise interaction architecture (IA) as the link between pedagogical intentions and the ecological reality of the school.
This research follows a design-based research (DBR) approach, using cycles of analysis, design, and evaluation [11]. This study reports the evaluation of the second design iteration of VLEPIC (Virtual Learning Environment for Personalised and Interactive Communication), which is a virtual learning environment (VLE) designed to be responsive and web-based. An important feature is that materials are accessible across locations and devices without installation. This makes the VLE particularly suitable for secondary English as a Foreign Language (EFL) learners in resource-limited public schools.
Within this Ecuadorian public school EFL setting, English learning takes place in a constrained ecology shaped by limited institutional infrastructure, uneven access to devices, and variable connectivity. These conditions are not peripheral to the design; they shape whether learners can re-enter the platform, read content on narrow screens, understand task status, and submit work reliably [1,9,10]. Although gamified and personalised VLEs have been widely discussed, less is known about how their IA supports continuity and learner orientation in under-resourced Latin American EFL settings.
Based on this gap, the overall aim of this study is to evaluate the second design iteration of VLEPIC from an interaction design (IxD) perspective, focusing on perceived usability, UX, observed usage patterns, and the refinement of preliminary design principles (DPs) derived from the first iteration [12]. VLEPIC is examined as a learner–mentor system designed to enhance the legibility of learning pathways under real-use conditions, such as narrow devices, sporadic connectivity, and brief engagement windows. In doing so, the study contributes by showing how IA can support predictable, low-friction learning journeys across use contexts.
This study emphasises IxD and IA, while linguistic outcomes remain outside the main analytical focus. We aim to advance understanding beyond identifying usability issues, turning analysis into transferable knowledge. Specifically, this study focuses on the following research questions (RQs):
RQ1. What level of usability do learners report when using the VLE?
RQ2. How do learners characterise their user experience (UX), including the perceived value of gamification and personalisation?
RQ3. What usage patterns are observed, and how do they align with self-reported experience?
RQ4. How do the findings from this iteration inform the refinement of the preliminary DPs from the first iteration for future developments in constrained contexts?
2. Literature Review
2.1. Interaction Design for Language Learning
IxD determines how learners navigate, comprehend, and interact with digital language learning (LL) spaces. Research in HCI demonstrates that interface architecture influences user behaviour, attentional focus, and task performance [2,13]. Interfaces function as mediators of interaction, and in educational contexts, usability and interaction are intrinsically linked to interface clarity [14] and learner engagement [15].
This relationship is critical in LL, where learners must simultaneously manage system interaction and process linguistic input. According to the Cognitive Load Theory (CLT), poorly organised interfaces impose extraneous cognitive load [16]. Similarly, Multimedia Learning Theory posits that concise structures, clear signalling, and consistent information presentation facilitate cognitive processing and mitigate overload [17]. IxD is a determinant of how learners experience and process LL tasks.
2.2. Gamification as an Experiential Quality
Gamification is the addition of game design elements to non-game contexts and to the design of affordances intended to evoke gameful experiences within a particular context of use [5,18]. Evidence syntheses suggest that while reward-like mechanisms are pervasively implemented, findings are mixed and contingent on how game elements are embedded within the interaction and surroundings [6,8]. In the educational context, a positive but small average effect of gamification on cognitive, motivational and behavioural learning outcomes is reported by meta-analytic findings [19]. A recent EFL study using a gamified formative-assessment tool reported motivational benefits related to autonomy [20]. This experiential perspective is also consistent with Self-Determination Theory (SDT), which states that perceived engagement depends on whether an environment supports autonomy, competence, and relatedness [21].
In secondary education settings, satisfying these basic psychological needs has been linked to learner persistence and long-term engagement with the language [22]. Interaction structures support meaningful feedback, progression and choice, beyond the inclusion of mechanics for their own sake [8,21]. Theory on gamified learning also suggests that game features impact outcomes mainly through their influence on learners’ activity-related perceptions and attitudes [23], with engagement acting as a key mediator [24].
Such a perspective is consistent with HCI-inspired descriptions of gamification as a UX phenomenon and a matter of coherent IxD [8,18,25]. Recent syntheses on customised gamification indicate that the design needs to respect learner level and context, but inconsistent results continue when personalisation is applied at a surface level [26].
2.3. Personalisation as Adaptive Support
Personalisation as adaptive support helps learners identify subsequent steps [27]. This shifts the focus from features to points of support: what the system observes, when it acts, what it suggests, and how the learner can respond [28]. Recent research indicates that most personalisation techniques focus on modelling the knowledge level and traces of learners, while other richer sources remain underutilised in practice [27]. A useful frame is scaffolding: timely guidance, feedback, and options that enable learners to plan, monitor or regulate learning [28]. Studies on prompting in digital learning confirm that effectiveness is dependent on how prompts are operationalised (timing, specificity, cognitive load), making personalisation an issue of design [29].
Personalised trace-driven scaffolding can alter students’ self-regulatory activity patterns, but its benefits depend on whether learners engage with the support and on how well it is integrated into task flow [30]. Scaffolds should be clear, fast to respond, and safe to ignore or revisit, especially given how connectivity, device quality and screen size already increase friction [31]. This echoes the findings of a large-scale meta-analysis of personalised/adaptive technology tools which reported general positive but small effects on K–12 reading achievement with contextual implementation as an important moderator, in line with DBR’s focus on iterative refinement [32]. In LL, meta-analyses of artificial intelligence–assisted automatic written feedback report mixed effects and identify student uptake and perceived credibility as central mediators [33].
2.4. Usability/UX Evaluation in Educational Technology
Evaluation in educational technology has become multi-dimensional, and systematic reviews show that studies frequently blend learning outcomes with judgements about usability, satisfaction, and UX, but with heterogeneous constructs and reporting practices [34,35]. Recent literature indicates that usability evidence is treated as secondary or reduced to narrow indicators, which can obscure how IxD decisions shape learners’ task performance and persistence during real use [34,36].
Moving beyond whether learners can operate a system, UX-oriented work frames sustained use as an engagement process that spans behavioural, cognitive, and affective components, instead of being inferred from duration or frequency [15,37]. Learning analytics research on engagement tends to operationalise engagement via observable behavioural traces, while other dimensions remain under-represented, complicating interpretation and comparison across studies [15,38].
Ecological validity is a parallel concern; systematic reviews stress that findings from controlled user studies may not generalise when devices, environments, and constraints diverge from real settings, and they propose design-oriented guidelines to increase realism and transparency in evaluation [39]. For under-resourced public school contexts, the literature suggests that usability and UX cannot be separated from context-of-use factors such as connectivity, device limitations, and classroom ecology [1,9,39].
3. Interaction Architecture of VLEPIC
3.1. Interaction Design Intent and Context of Use
The IxD of VLEPIC was designed to support a clear and low-friction learning experience. Students should be able to identify their location within the platform, recognise available actions and recovery options, and understand how their work contributes to progress and task completion. In practice, VLEPIC may be used in many different situations; consequently, the IA focuses on three main interaction features. Screenshots of the implemented VLEPIC interface are provided in the Supplementary File (Figures S1–S18), covering the home and log-in pages, Explorer-side navigation, missions, progress and reward views, and Mentor-side management tools.
First, progress legibility: the system indicates the learner’s current position and next step. Second, low-friction repeatability: students encounter a consistent interaction routine. This reduces the cognitive effort required to navigate and complete tasks and supports routine formation. Third, recoverability: the design supports learners when errors or interruptions occur. It anticipates issues such as incorrect responses, incomplete tasks, or connectivity loss, and supports continued progression through quick feedback and clear re-entry options. This enables more independent learner progression and is consistent with human-centred design principles [40]. Figure 1 outlines the intended context of use for VLEPIC and how these contextual constraints shape the interaction priorities of the DPs.
Figure 1.
Context-of-use map for VLEPIC.
3.2. Role-Based Dashboards and Navigation Structure
VLEPIC was created from scratch in WordPress and did not use learning management system plugins. It organises how users interact with the system by providing two distinct entry points: the Explorer Dashboard for learners and the Mentor Dashboard for teachers. For learners, the Explorer Dashboard works as a navigation centre that always shows three main interaction cues: (i) where the learner is (their rank and expedition status), (ii) what to do next (the next step in their learning path), and (iii) what they have accomplished, shown by elements such as progress, grades, achievements, and credentials. Dashboards that prioritise goals and progress can help learners monitor their own work and understand their learning history by clarifying the immediate action required [41,42].
The Mentor Dashboard is designed as a management hub and provides a direct path to the Explorer Dashboard for fast role-switching. This aligns with learning analytics research suggesting that dashboards are useful to the extent they facilitate role-appropriate interpretation and action [43,44]. Figure 2 illustrates how navigation works in VLEPIC for both students and teachers.
Figure 2.
Role-based dashboards and shared system state of VLEPIC.
3.3. Core User Journey and Mission Loop
VLEPIC is structured around a repeatable learner loop that begins and ends at the Explorer Dashboard. From the dashboard, learners navigate to a specific Expedition/Quest/Mission. After each Mission is completed, the system updates learners’ progress and achievements, supporting progression to the next step. Each Mission functions as a short, self-contained learning task in which learners review the instructions, resources, and submission requirements before submitting their assignment. Once the assignment is submitted, the interface displays a confirmation before updating rewards and progress. The loop ends when learners return to the Explorer Dashboard before advancing to the next mission. Figure 3 depicts this main journey and the Mission loop.
Figure 3.
Core user journey and mission loop (learner-facing) in VLEPIC.
3.4. Gamified Progression Model
VLEPIC uses a gamified progression system, which is organised in a fixed order: Expeditions → Quests → Missions. Missions constitute the smallest task units, and Quests are groups of Missions that must be completed as a sequence. VLEPIC follows a linear progression structure: the learner can only open the current content. Future Missions, Quests, and Expeditions stay locked until the learner finishes the previous steps.
Content volume is determined at the Expedition level, with VLEPIC organised into four Expeditions: Starter Base (SB), Novice Trail (NT), Explorer’s Path (EP), and Mastery Quest (MQ). Ranks indicate progression across these Expeditions and determine eligibility for each stage: SB (Rookie), NT (Starter), EP (Novice), and MQ (Explorer through Master). Overall, the system comprises 22 Quests and 110 Missions. Each completed Mission awards a badge, while each completed Quest awards a shield; after completing an entire Expedition, learners unlock a new rank and gain access to the next Expedition. In this way, learner progress remains visible within the system state. XP serves as the primary mechanism for tracking progress and can be redeemed for classroom rewards in the Reward Shop. VLEPIC also includes an anonymous Expedition Leaderboard, where learner names remain hidden unless they choose to display them. Figure 4 summarises the structural design.
Figure 4.
Gamified progression model in VLEPIC.
3.5. Lightweight Personalisation Triggers
VLEPIC uses a simple and learner-controlled approach to personalisation. From their first login, learners can choose a screen name; if they do not, the system retains the default screen name. At the same stage, they also set their learning preferences by selecting visual, auditory, kinaesthetic, read/write, or self-paced support. This choice does not change the task itself, but it activates short tips that suggest ways of approaching activities or reinforce the learner’s preferred way of working. Learners also choose between English only and English + Spanish support. This second option does not translate the entire environment; instead, it provides brief Spanish guidance for each Mission and the main sections of VLEPIC. This guidance was intended to balance English immersion with strategic first-language (L1) support, consistent with work on L1–target language balance in foreign-language classrooms [45].
Personalisation also includes level placement. Learners can choose to take a Diagnostic Test to identify the most suitable Expedition for their level, or they can start directly from Starter Base. In addition, mastery-based gating supports progression at the learner’s own pace within a fixed sequence. Finally, VLEPIC separates system feedback from teacher feedback in real time. System feedback appears immediately after an action, for example, by confirming a submission, updating progress, or indicating whether an automatic answer is correct. Written teacher feedback is reserved for open tasks and becomes available after review in the Grades section. Figure 5 summarises these lightweight personalisation triggers in VLEPIC.
Figure 5.
Lightweight personalisation triggers in VLEPIC.
3.6. Teacher Orchestration Journey and Feedback Loop
The Mentor Dashboard serves as an interface for teachers. It supports a cycle of monitoring, action, and verification. Figure 6 shows the teacher journey and the feedback loop within VLEPIC.
Figure 6.
Teacher orchestration journey and feedback loop in VLEPIC.
4. Materials and Methods
4.1. Research Design
We followed a convergent mixed-methods design [11] for the second design iteration of the DBR evaluation of VLEPIC [46]. In DBR, iterations are useful for building knowledge that can refine and extend the original DPs, providing applicable advice for comparable constrained school ecologies [11,46]. A convergent mixed-methods design was selected because this DBR iteration aimed to refine IxD principles through the comparison of complementary forms of evidence collected during the same implementation [11,46,47]. Learners’ self-reported perceptions, qualitative explanations of their experience, and observed platform activity were analysed as concurrent strands to support design-relevant interpretation. This design was more appropriate than a purely quantitative, purely qualitative, or sequential approach because the study required simultaneous comparison between perceived usability/UX, observed use patterns, and design refinement within one authentic implementation cycle. This alignment was reflected in the RQs: RQ1 and RQ2 drew on self-reported and qualitative evidence on usability, UX, gamification, and personalisation; RQ3 drew on behavioural log evidence; and RQ4 required the integration of these sources to refine the DPs. Similarly, previous mixed-methods work on personalised learning pathways has shown the potential of combined methodological approaches to investigate and support individualised learning trajectories, especially when the aim is educational improvement [48].
In a convergent design, quantitative and qualitative threads are undertaken concurrently during a single phase; they are initially analysed side by side and then intentionally combined to generate integrated findings [47]. To demonstrate integration explicitly and provide evidence of the process, in this study, we synthesise the strands by using joint displays where key findings are supported by different evidence types [49]. This aligns with the “1 + 1 = 3” rationale of mixed methods, where added value accrues through integration-based insights rather than maintaining two parallel flows of outcomes [50]. We did not include a control group, as the purpose of the evaluation is design-based refinement in authentic settings; the findings are treated as design-relevant evidence that supports continuing refinements [11]. Due to the limited deployment environment, this approach also aligns with proposals to improve the ecological realism and transparency of evaluation methods for interaction experience in situ [39].
4.2. Participants
The study was conducted at Escuela de Educación Básica “San Felipe Neri”, located in Riobamba, Ecuador. The participants were 131 EFL students aged 12–15 from six intact classes: two eighth-grade, two ninth-grade, and two tenth-grade groups. The study used non-random intact-class sampling, as these were the six classes involved in the VLEPIC implementation at the school. Students were included if they were enrolled in one of these eighth-, ninth-, or tenth-grade groups and took part in the study. The sample was not intended to be statistically representative of Ecuadorian secondary EFL learners. Instead, it represents the authentic school context in which the DBR iteration was carried out.
The student population at this institution predominantly comes from indigenous and low-income families. Additionally, a teacher supported the implementation and organised classroom-level logistics among the participating groups. The setting is a resource-limited public school environment with restricted technological infrastructure and variable connectivity conditions. This makes it an appropriate context to assess VLEPIC under realistic constraints.
4.3. Ethical Considerations
This investigation was conducted in accordance with the principles of the Declaration of Helsinki and was approved by the Research Ethics Committee of the University of the Balearic Islands (protocol code 051CER25 and date of approval 18 September 2025). Parents provided written informed consent for their children, and students provided their assent. Participation was voluntary and students could withdraw at any time without academic penalty. To ensure privacy, all datasets were de-identified prior to analysis and reporting, and findings are presented in aggregated form to prevent re-identification. Data processing practices prioritised confidentiality, fairness, non-discriminatory participation, and respect for participants’ rights, in accordance with international guidelines on educational research involving human participants [51].
4.4. Implementation Procedure
Participants engaged with VLEPIC over one school term (one trimester) as a home-based asynchronous tool that complemented regular classroom instruction. During the term, learners progressed within the Expedition assigned through a diagnostic test (or by starting from SB). Students were distributed across different Expeditions. Most eighth-grade students remained in SB, ninth-grade students were divided between SB and NT, and most tenth-grade students worked in NT, with smaller numbers in SB and EP. No students reached MQ during this implementation. This study does not compare students by Expedition, as it focuses on the platform’s IxD, UX, and use patterns.
Students were expected to complete two quests (five missions per quest) within their assigned pathway. The VLE was not organised as daily classroom units; instead, it was aligned with the Ecuadorian national curriculum goals [52]. It provided different practice tasks through expedition assignments based on learners’ previous knowledge. To maintain design consistency across the deployment, the IxD and IA were constant over the entire term, with only instructional content added or modified as required. The teacher guided the implementation, while the research team developed the VLE content and organised the assessment under real school conditions. This approach is consistent with recommendations to increase ecological validity when studying interactive experiences as they occur [39]. Ecological validity was therefore supported by evaluating VLEPIC during regular school use, with intact classes, existing connectivity constraints, curriculum-aligned tasks, and the teacher’s normal implementation role.
4.5. Data Collection Instruments
Data were collected using validated questionnaires and complementary traces. Perceived usability was assessed with the System Usability Scale (SUS) [53], applied in its validated Spanish version for electronic tools [54]. Gameful experience was assessed using the Gameful Experience Scale (GAMEX) [55], also applied in its validated Spanish version [56].
Perceived personalisation was based on the Differentiation scale of the Technology-Rich Outcomes-focused Learning Environment Inventory (TROFLEI); this subscale comprises eight Likert-type items (1–5) capturing students’ perceived autonomy and choice [57]. TROFLEI conceptualises classroom-level differentiation as a dimension of learning environments and has been tested in secondary education contexts [57], including cross-cultural validation among high school students [58].
These questionnaires were based on established instruments and were not newly designed by the authors. Contextual adjustments were limited to references to VLEPIC and its activities, so that students could answer in relation to the platform used during the implementation. The original scale structure, item logic, and response formats were preserved.
Two open-ended questions were embedded within the SUS and GAMEX surveys to collect qualitative responses on learners’ perceived usability and experience. Platform usage logs from Google Analytics 4 (GA4), GamiPress (GP), and Active Logs (AL) were compiled to derive behavioural indicators of cohort-level platform activity, including access, submissions, and participation across missions. A short teacher implementation log captured one teacher’s reflections on curriculum alignment and the Mentor Dashboard workflow for reviewing submissions and providing feedback. These sources were interpreted according to their scope before integration. The questionnaires captured learners’ perceived usability, gameful experience, and personalisation; the open-ended responses provided brief explanations of learners’ experience; GA4, GP, and AL described cohort-level platform activity and did not allow full reconstruction of individual learning trajectories; and the teacher log provided contextual implementation evidence, without constituting a full evaluation of the Mentor Dashboard. These sources supported the convergent design by linking perceived experience, qualitative explanations, observed activity, and implementation context.
4.6. Data Analysis
Data analysis followed a descriptive and exploratory approach aligned with each RQ. Quantitative analyses were conducted in R (version 4.4.3), and qualitative and log-based evidence were later integrated following a convergent mixed-methods logic. Table 1 summarises the alignment between the RQs, data sources, analytical procedures, and analytical purpose.
Table 1.
Alignment between RQs, data sources, and analytical procedures.
For RQ1 (perceived usability), SUS ratings were computed according to the standard total scale range of 0–100 and summarised through mean (M), standard deviation (SD), observed range, 95% confidence intervals (95% CIs), and interquartile range (IQR) where appropriate. Item-level summary statistics for the original 1–5 scale were also generated to pinpoint localised friction points. Negatively worded SUS items were reverse-scored for SUS total scoring and reliability estimation. Reliability evidence was examined using Cronbach’s alpha (α) and McDonald’s omega (ω) [59], with ω computed using polychoric correlations to reflect the ordinal response format.
For RQ2 (UX), we followed an analytical strategy aligned with SUS, while respecting the multidimensional nature of GAMEX. We computed descriptive statistics for each of the five validated dimensions and reverse-scored negatively worded items where required. To examine alignment with the intended factor structure, we ran a five-factor Confirmatory Factor Analysis (CFA) treating GAMEX items as ordinal and estimating the model with WLSMV, reporting standardised loadings (λ) alongside model fit indices (CFI, TLI, RMSEA, SRMR). Internal consistency was examined using Cronbach’s alpha (α) and McDonald’s omega (ω), as described above [59]. Perceived personalisation was operationalised via the TROFLEI (Differentiation) subscale and scored as a subscale, following the same quantitative strategy. Overall, study-specific reliability evidence was examined through internal consistency estimates, while construct validity evidence was addressed through the use of established instruments, preservation of their original scale structures, and the confirmatory factor analysis conducted for GAMEX.
For RQ1 and RQ2, qualitative responses from the SUS and GAMEX surveys were analysed separately through thematic analysis [60] and managed in QualCoder (v3.8). The coding process was iterative. Initial labels were created for usability and IA-related content, and these labels were refined when excerpts required more precise definitions or when overlapping categories needed to be merged. Student comments were coded anonymously using SS1–SSx for SUS and SG1–SGx for GAMEX. An audit trail, codebook, and analytic memos were kept to link each comment to its original source and assigned codes. The coding process and thematic structure were reviewed by the second author, focusing on the coherence of the codebook, the fit between coded excerpts and thematic categories, and the consistency of the emerging interpretations. Ambiguous excerpts and overlapping categories were discussed until agreement was reached. This procedure was used as a qualitative validation strategy; no formal statistical inter-rater coefficient was calculated. These procedures supported qualitative trustworthiness by strengthening credibility through second-author review and consensus discussion, dependability through codebook refinement and analytic memos, and confirmability through the audit trail and source-linked excerpts. Quotes are reported in English, although students originally wrote their responses in Spanish. The excerpts were translated by the authors.
For RQ3 (usage patterns), platform logs were extracted to examine cohort-level activity within VLEPIC. These data were used to describe login activity, submission patterns, and changes in participation across the mission sequence. This analysis identified points where cohort-level participation declined or changed across missions.
For RQ4 (design integration), a joint display was used to triangulate quantitative trends, qualitative themes, behavioural logs, and teacher implementation notes [47,49]. Evidence across sources was examined as convergent, complementary, or divergent. Convergent evidence strengthened the design interpretation, while divergent evidence was interpreted by distinguishing observed cohort-level activity from learners’ reported experiences [61]. Teacher notes were used as contextual evidence for curriculum alignment and dashboard-mediated implementation.
5. Results
5.1. Participant Profile
This iteration included students from three secondary grade levels and one teacher who supported the implementation. Table 2 presents the participant distribution.
Table 2.
Participant demographics.
5.2. The Usability Landscape (RQ1)
Most students perceived VLEPIC as usable and easy to navigate. On average, the SUS score was 75.59 (SD = 14.82), with a median of 75. Interpreted against established SUS benchmarks, the mean score of 75.59 is above the commonly reported average benchmark and falls within an acceptable-to-good usability range [62]. Internal consistency was also examined, with results indicating adequate reliability (α = 0.839; ω = 0.884). Table 3 shows the results for each SUS item. Figure 7 illustrates that most of the scores are in the mid-to-high range. Only a small number of students reported low scores, indicating that the overall usability experience was generally positive.
Table 3.
SUS item-level descriptive statistics (1–5 scale).
Figure 7.
Distribution of the SUS total scores (0–100). The orange dashed line indicates the sample mean, and the black dotted line indicates the SUS benchmark.
Item-level results provide further insight into students’ perceptions. Most students responded positively to the integration of system functions (M = 4.22) and the system’s learnability (M = 4.05). They also reported confidence in using the system (M = 4.02) and considered that the interface was simple (M = 3.98).
On the other hand, negatively worded items received low scores, which is positive for the general usability of the VLE. Students did not perceive the system as too complex (M = 2.02) or inconsistent (M = 1.92). They also reported limited need for technical assistance (M = 2.02), and the overall experience was not perceived as cumbersome (M = 1.85), as shown in Table 3.
The results suggest that usability issues did not affect the system globally. Instead, they were mainly concentrated in the early stages of interaction. For the qualitative analysis, open-ended responses were coded using the SUS items as an analytical guide. In total, 108 students provided comments, which yielded 256 coded segments. As shown in Table 4, most of these comments were general opinions or reflections on how students progressed. However, there was also a smaller group of comments specifically about the difficulties or friction points encountered while using the platform.
Table 4.
Distribution of thematic categories in open-ended responses (SUS).
At the category level, General appraisal indicated favourable perceptions of VLEPIC. For example, one student said, “For me, the whole application was easy to use, and I would not improve anything because it is fine” (SS36) and another wrote, “I would not change anything; everything is very nice and easy” (SS29). Regarding Discoverability and IA, students said the dashboard and menus were easy to follow: “The main menu had several options, and they were very easy to understand” (SS116).
The Onboarding and learnability category showed that some students had problems at the start but found it easier after exploring the platform. One student mentioned, “Everything seemed somewhat complicated at the beginning, but once I explored it, it became easy” (SS104) and another said, “Logging in was difficult because I did not know how to access it” (SS9). The comments also indicated that having help in Spanish was essential: “I really liked the help in Spanish” (SS115).
In terms of Interaction comprehensibility, most students understood the activities, but a few reported difficulties with specific tools: “The videos were difficult because I did not understand them” (SS126). Task workflow also had some minor difficulties, especially with submitting work: “Submitting tasks was a bit confusing at the beginning” (SS70) and “It was hard for me to see the grades” (SS2).
Finally, the Engagement and progression category showed that students responded positively to the missions and rewards: “I really like the missions because I go at my own pace” (SS33). Students also suggested future improvements, including: “I would improve it so that when we move to the next mission, the page does not reload” (SS69) and “I would like there to be less text and more integrated graphics” (SS62). Overall, these comments suggest that the difficulties were mainly concentrated in the initial stages and did not indicate confusion with the system as a whole.
5.3. Characterising the UX (RQ2)
UX was analysed through the five GAMEX dimensions, as shown in Table 5. Most of the scores were in the mid-to-high range, particularly for enjoyment and activation. The highest score was for Activation (M = 3.33), while the lowest was for Absence of negative affect (M = 2.94). Internal consistency estimates indicated acceptable reliability across the dimensions (α = 0.81; ω = 0.81).
Table 5.
Descriptive statistics and internal consistency for GAMEX dimensions.
A CFA was performed using the GAMEX items according to the five-factor structure. The standardised loadings (λ) indicated how well each item represented its corresponding factor. The five-factor model showed an acceptable overall fit (scaled χ2 (265) = 311.54, p = 0.026; CFI = 0.958; TLI = 0.952; RMSEA = 0.037; SRMR = 0.076). The significant chi-square value indicates that the model did not reach a perfect fit; however, the remaining indices support an acceptable interpretation of the model, so the results were interpreted cautiously. Activation showed strong and consistent loadings (λ = 0.78–0.84), although the “Nervous” item had the lowest loading within this dimension.
Absorption showed more varied loadings (λ = 0.32–0.64). “Escapism” (λ = 0.64) and “Unaware” (λ = 0.62) had the highest loadings in this dimension, while “Re-entry” had the lowest loading (λ = 0.32). The item was retained because re-entry is theoretically relevant to the IxD of VLEPIC, where students often return to the platform after interruptions to resume tasks and continue the mission sequence. However, its lower loading suggests that re-entry may function more as a task-continuity and recovery feature in this context than as a strong indicator of Absorption. Creative thinking and dominance also showed varied loadings (λ = 0.54–0.78), with “Autonomy” (λ = 0.78) and “Exploration” (λ = 0.70) showing the highest values. “Confidence” (λ = 0.60) and “Adventurous” (λ = 0.54) were lower, although still adequate for retention in the model. Figure 8 shows all standardised loadings (λ).
Figure 8.
Standardised GAMEX item loadings (λ) by dimension.
At the same time, perceived personalisation scores were above the scale midpoint (M = 3.79, SD = 0.57), as seen in Table 6. Item-level results in Figure 9 indicate that this high score was mainly driven by perceptions of autonomy and self-management. For items 1 to 6, the averages were high (M = 4.00–4.27). Specifically, between 73% and 84% of students gave the highest ratings, with limited disagreement across these items. However, task selection was the weakest aspect (item 7; M = 2.24). Most students disagreed with this item, indicating that perceived choice remained limited. Resource selection showed a more balanced pattern (item 8; M = 3.36); many students were neutral, while others agreed. Overall, these results suggest that for these students, personalisation meant having control over their pace and how they approached the activities, instead of being able to choose the actual tasks.
Table 6.
Personalisation descriptive statistics and internal consistency.
Figure 9.
Personalisation: response proportions by item.
To complement the quantitative results, 94 students provided feedback in the open-ended question of GAMEX. These responses were divided into 140 segments for analysis. By using a deductive approach, we applied five specific codes to these comments, which are summarised in Table 7.
Table 7.
Distribution of thematic categories in open-ended responses (GAMEX).
Playful engagement mainly concerned with how much students enjoyed the different game-like activities. For instance, one student commented: “I liked that it has many options to speak, write, listen, and answer questions through games” (SG43), while another said: “Doing the sentences was fun, and I did not get bored while using VLEPIC” (SG12). Regarding the Progression loop, the comments emphasised how seeing rewards and progress kept them motivated: “When I learnt and got achievements, it motivated me to keep completing each mission” (SG113).
The Learning value category linked the students’ experience to their perceived progress in the language. Comments included: “Through its missions I learnt new words and how to pronounce them well” (SG102). Although Social collaboration and competition appeared less often, it reflected the effort to improve rankings: “It motivates me to beat my record and improve my position on the leaderboard” (SG115).
5.4. Behavioural Patterns (RQ3)
Data from GA4 (October–December 2025) suggested episodic clusters around specific tasks, instead of showing daily use. Since GA4 was configured for the entire site and not for specific class groups, the metrics show general traffic based on devices and cookies. Once students logged in, they were redirected to the Explorer Dashboard. However, in the reports, most of this activity is grouped under the main site address (/), which is also the public home page. Accordingly, GA4 was treated as site-level contextual evidence. It was used to describe general access and navigation patterns, not to reconstruct individual learning trajectories, class-level participation, or Expedition-specific behaviour.
Across 2807 sessions, most traffic came from Organic Search (75.06%) and Direct sources (24.72%). While the engagement rate was high (86.89%), the time spent per session was brief, averaging 46 s. Although sessions were short, they were highly active, with about 12 events per session. This suggests that students visited the site to perform specific, quick actions, although these data do not allow users’ exact intentions to be inferred.
At the page level, activity was highly concentrated: the login page and the site root dominated the reports, accounting for 8948 views across the two top routes. Table 8 illustrates this density: the login page accounted for 52.2% of views, while the site root accounted for 47.1%. The GA4 user counts should be interpreted as route-level traffic indicators, not as the number of participating students, because authenticated participation was verified through the internal platform logs. Overall, these patterns suggest that most activity occurred within the main interface and did not involve movement across many different pages in GA4.
Table 8.
GA4 page-level activity by top-routes.
To complement the web analytics trends, platform logs were examined to describe students’ mission-related activity. Two log sources were used: AL to identify logins and uploads, and GP to examine XP and game events. We did not link the logs to specific names across the different files; therefore, the analysis was conducted at the cohort level.
Table 9 shows that 131 users logged in 856 times. The logs also recorded 1317 submitted tasks by 125 different students. This indicates that nearly all registered students submitted at least one task. The number of uploaded files matched the number of submitted tasks, which suggests active production and submission beyond passive on-screen reading.
Table 9.
Cohort-level activity summary from GP and AL.
Participation was maintained through the middle of the sequence. As shown in Figure 10, the number of unique users who submitted at least one task across Quest 1 (Q1) and Quest 2 (Q2) increased from Mission 1 (M1, n = 79) to Mission 3 (M3, n = 100), and then declined in Mission 4 (M4, n = 95) and Mission 5 (M5, n = 85). This suggests that participation remained stable during the central part of the sequence, with a clearer decline only towards the end. This pattern indicates that initial access to the mission sequence was not the main barrier, because the number of unique submitters increased from M1 to M3. The later decline from M3 to M5 points instead to a continuity issue near the end of the sequence, where learners may require clearer completion cues and stronger support to sustain participation until the final mission.
Figure 10.
Unique users with ≥1 submission by mission (Q1–Q2 combined).
Figure 11 shows how submission volume fluctuated from M1 to M4, but then it declined markedly in M5. In each mission, students submitted more assignments for Q1 than for Q2. This difference was smaller in M4, but in M5, the number of submissions for both quests dropped, and Q2 had the largest decrease.
Figure 11.
Cumulative submission volume by mission and quest.
Regarding the types of files students uploaded, Figure 12 shows that most were .webm and .txt. This pattern reflects the task design and file-saving mechanism. For example, speaking tasks were recorded directly in the VLE and saved as small .webm files. By contrast, writing tasks automatically created text files (.txt).
Figure 12.
Upload volume by file extension.
Gamification data also showed how XP accumulated during the study period. A total of 54,584 XP points was accrued, as shown in Table 9. Figure 13 shows that XP accrual peaked at specific points during the study period. There was a peak around Week 40 and Week 41 of 2025. After that, the activity decreased sharply, with only a further modest increase around Week 45 and Week 46. For the rest of the time, from Week 47 to Week 50, activity remained low.
Figure 13.
Weekly net XP accrued in GP across the study period.
Although teacher evidence was limited, the implementation notes provided useful contextual evidence about the Mentor Dashboard. The teacher described it as “very visual and clear” and explained that “most of the information I need is in one place”, which made it practical to use during class. It was also helpful for tracking student progress, as the teacher noted: “I can see the student’s name, grade, class group, rank, expedition, quest, and mission. This helps me know exactly where each student is.” At the same time, some aspects were less clearly traceable. As one note explained, “I cannot clearly monitor the completion of automatic tasks. I mainly control the open tasks that students submit for review.” Other entries also mentioned the usefulness of the gradebook and announcements in everyday classroom work. Overall, these notes suggest that the dashboard was useful for monitoring and classroom management, although some tasks were easier to track than others.
5.5. Refinement of Design Principles (RQ4)
Based on the initial DPs from the first iteration [12], RQ4 uses the evidence from this phase to refine the DPs for future work in schools with limited resources. This analysis draws primarily on learner-facing evidence: (i) student survey data from SUS, GAMEX, and TROFLEI, including qualitative comments; and (ii) behavioural traces from GA4, GP, and AL. Brief teacher implementation notes were used only to contextualise curricular fit and dashboard-mediated implementation. Table 10 presents a joint display in which each row is supported mainly by learner-facing data.
Table 10.
Compact joint display of interaction nuances and actionable design insights.
The mission-level participation pattern therefore requires a design-oriented interpretation: learners may need stronger end-of-sequence scaffolding, clearer distance-to-finish cues, and more visible wrap-up feedback to sustain participation until the final mission. The combined UX and behavioural evidence supports the refinement and validation of the DPs generated in the first iteration of VLEPIC [12]. Teacher notes were considered only as a secondary context. Table 11 summarises the refined DPs for this constrained setting.
Table 11.
Refined DPs for constrained contexts (Iteration 2).
6. Discussion
6.1. Beyond Usability: The Role of Experience
This iteration distinguishes between learners’ capacity to use VLEPIC and their willingness to continue using it over time. SUS results showed a positive usability baseline; students reported being able to navigate and complete tasks without substantial difficulty. However, behavioural data showed that participation was mostly episodic and task-related, not continuous [63]. The rise in unique submitters up to M3, followed by a decline at M5, suggests that participation was sustained across the middle of the sequence but became more difficult to sustain at the final stage. This indicates that usability alone does not explain why a student decides to return.
This divergence between positive self-reported usability and episodic behavioural engagement provides a more critical interpretation of the findings. It is consistent with engagement research in HCI and learning analytics, where engagement is understood as a multidimensional process and cannot be inferred only from satisfaction, duration, or frequency of use [15,37,38]. This suggests that perceived usability lowered the entry barrier, while sustained engagement depended on the platform’s capacity to support re-entry, visible progress, and continuation after interruptions.
The findings also align with empirical and synthesis-based work showing that the effects of gamification depend on design quality, learner experience, and context [6,8,19,24,64]. In LL specifically, recent meta-analytic evidence on mobile games has examined their effectiveness and the influence of moderating factors [65]. In VLEPIC, mission framing, progression cues, rewards, and feedback were meaningful because they were embedded in the task flow. They functioned as orientation and recovery mechanisms during interrupted use, not as isolated game-like additions. This interpretation is also coherent with gamified learning theory, where game elements influence outcomes through learners’ activity-related perceptions and attitudes [23], and with SDT, since progress visibility and feedback can support perceived competence, while optional scaffolds can support bounded autonomy [21,28,29].
Finally, the episodic pattern observed in the logs is consistent with MALL, where learners often engage through brief and repeated moments of use [10,63]. In this sense, the contribution of this iteration is to show how IA can convert short access windows into usable learning opportunities through clear re-entry points, progress visibility, and immediate feedback [10,13,14,63].
6.2. Friction Points in Context
The friction points identified during this iteration are better understood as constraint-driven design criteria instead of a list of isolated technical issues. The first challenge involves access and re-entry. Behavioural traces reveal that a significant portion of activity clusters around access and early navigation, with the login page dominating views and events. This makes orientation and “next-step” prompts important for short, task-bound sessions. This is consistent with MALL research, which indicates that LL often involves episodic engagement, where cycles of disengagement and re-engagement may occur across use trajectories [10,63]. Consequently, the design must treat re-entry as a primary use case, supported by stable landing states, predictable routing, and explicit next-step prompts [13,14].
A second point of friction is mobile readability and the volume of content. Learners’ preference for less text and more integrated visuals is not merely a stylistic preference; it is a direct response to the cost of interacting with a small screen. According to the CLT, excessive reading and scrolling can increase the cognitive demands associated with learning activities [16,17]. Recent UX research in mobile learning links specific UI properties directly to a learner’s perceived cognitive load [66]. In practice, this highlights the need for scannable, chunked guidance at decision points, using visuals to reduce the reading load instead of increasing it.
The third issue is transition-related friction, such as slow reloads and interrupted interaction flow. Given the short-session nature of the behaviour recorded by the AL plugin, even minor interaction costs become noticeable and can undermine students’ confidence. From the perspective of ISO 9241-11, this concerns efficiency under known conditions [67]; in the classic usability sense, it refers to predictable system responses and minimal overhead [13,14]. To achieve flow resilience, design requirements must ensure that mission states remain visible and that the system avoids heavy data transport during transitions. This helps keep the experience lightweight and responsive even in resource-constrained deployments [68].
Moreover, submission and media capture are critical workflows. Early problems with submitting work or the frustration of recording audio or video were especially consequential because, even when the system returned a response, some learners did not always perceive the confirmation clearly or were not confident that their effort had been successfully registered. This issue did not indicate that VLEPIC lacked a submission confirmation mechanism. Instead, it suggested that confirmation and progress cues were not always sufficiently visible to some learners during early use. In this context, stronger confirmation cues and improved recoverability become essential to close what Don Norman calls the “gulf of evaluation” [3,14,67]. The goal is to transform the submission experience from a technical procedure into a transparent process by providing explicit instructions, instant confirmation states, and strong recovery paths.
6.3. Transferable Design Principles
Through these constrained deployments, the findings highlight four transferable lessons that may extend beyond the VLEPIC platform. In episodic sessions, where the typical interaction involves a “return, re-orient, then act” cycle, IA should prioritise resumability. A stable landing state, with the dashboard as the default, together with clear cues, minimises the cognitive effort required to resume previous activity [10,13,14,63]. Similarly, preview features and progress legibility act as both navigational aids and incentives. The use of checkpoints, levels, or completion states helps reduce uncertainty about a learner’s current position and subsequent path, while reinforcing a sense of competence, a key aspect of gameful experiences that prioritise meaningful feedback loops [5,18,21,23,41,42].
A second set of implications focuses on building workflow resilience during critical interaction points. This same logic applies to submissions, especially those involving audio or video, which should be treated as a structured interaction flow with immediate feedback, visible progress, and a clear recovery path. This contributes to bridging the “gulf of evaluation” by making outcomes unambiguous and providing a more transparent and less frustrating experience in constrained settings [3,14,67,68]. In addition, autonomy is better supported through constrained, scaffolded options, such as optional supports, pace control, or straightforward pathways, without relying on complex branching pathways. This aligns with the SDT framing of autonomy and competence, where guided self-regulation may support learners more effectively than overwhelming them with too many choices [21,28,29].
7. Conclusions
Throughout this second iteration, the focus was on VLEPIC as an interaction framework for a constrained environment. With regard to RQ1, the results suggest that learners reported a strong usability baseline. In relation to RQ2, learner experience was generally positive, especially in terms of orientation, progress visibility, and motivational support. However, in response to RQ3, behavioural data showed that actual use was largely episodic and task-based. These patterns highlighted continuity, readability, transition efficiency, and submission certainty as key interaction issues in the implementation.
Finally, regarding RQ4, these findings refined the preliminary DPs by emphasising re-entry, workflow reliability, progress legibility, and scaffolded autonomy as core interaction priorities for constrained environments. In summary, while usability makes participation possible, consistent experience design, especially through status visibility, timely feedback, and reliable workflows, supports learners’ willingness to revisit the system.
Theoretically, these findings position IA as a mediating layer between pedagogical intentions, learner experience, and the ecological constraints of low-resource EFL settings. In this sense, VLEPIC contributes to the discussion on gamified and personalised VLEs by showing how these interaction conditions support continuity in constrained learning environments.
7.1. Research Implications
This study highlights the value of assessing UX in authentic school settings through an integrated approach. By connecting self-reported usability, experience, behavioural logs, and design implications, the joint display strengthened the inferences and produced actionable insights. Methodologically, this supports the value of convergent mixed-methods DBR for educational technology evaluation, where refinement depends on comparing what learners report, how they describe their experience, and how they use the platform.
At a practical level, school-based UX assessment can be strengthened by combining short standardised measures, focused open responses, and unobtrusive behavioural traces in ways that explicitly guide design action. In restricted environments, this integrated approach supports methodological rigour and generates actionable outputs for designers working under real-world constraints.
7.2. Limitations
This study has several limitations. A separate formal pilot test of the data collection instruments was not conducted before the second iteration because the study involved intact classes in a single school context, and creating a separate pilot group would have reduced the available participant pool for the main DBR implementation. This limits the evidence available on instrument feasibility and procedural refinement prior to full deployment. Additionally, most of the evidence is based on self-reports and short open-ended comments, so response biases are possible and experience was not captured continuously. The study was conducted in a single school context with one cohort, so the findings should be understood in relation to this case and similar constrained settings. Therefore, the findings are analytically transferable to comparable contexts, but they are not statistically generalisable to all secondary EFL settings. The evaluation period was short, which limits what can be inferred about longer-term adoption, novelty effects, or sustained engagement. Qualitative comments were translated for reporting and therefore an additional level of interpretation is involved; while interpretations sought to reflect meaning, some subtlety may have been lost.
Furthermore, behavioural traces were examined at an aggregate level instead of an individual level because the log records did not include participant-level identifiers linking each record to a specific participant; therefore, it was not feasible to connect an individual participant’s self-reported experience with their personal behaviour pattern. The target of this version was interaction and experience, not causal effects on language learning, so any findings should not be taken as evidence of efficacy in terms of language gains. Finally, the teacher-facing dashboard was not evaluated with the same depth as the learner-facing experience. Teacher evidence was limited to a brief implementation log from one teacher responsible for the implementation across the participating grades, with no standardised measures or dedicated dashboard protocol. As a result, these observations serve only as contextual implementation feedback and are not intended as a full evaluation of the Mentor Dashboard.
7.3. Future Research
Future research could extend this work in several directions. Replication studies in additional schools would help determine which interaction patterns are context-specific and which are consistent across settings. Another methodological and technical line of inquiry could consider the inclusion of a privacy-preserving participant identifier to link questionnaire responses with individual usage paths. Focused studies could also examine specific refinements derived from this iteration, such as onboarding and re-entry supports, to determine whether they reduce transition-related friction and late-stage decline in participation. In parallel, the teacher-facing dashboard could be explored as a separate line of inquiry, concentrating on its feasibility in relation to teachers’ workload and on how teacher workflows may influence learner engagement and implementation fidelity. Finally, long-term follow-up over a school year would enable the examination of persistence after initial exposure and whether use becomes embedded over time.
Supplementary Materials
The following supporting information can be downloaded at: https://www.mdpi.com/article/10.3390/digital6030056/s1, Figure S1: Home page; Figure S2: Log-in page; Figure S3: Explorer dashboard; Figure S4: Expeditions; Figure S5: Quests; Figure S6: Missions; Figure S7: Activities; Figure S8: Submission form; Figure S9: Student’s grades; Figure S10: Student’s progress; Figure S11: Student’s achievements; Figure S12: Rewards shop; Figure S13: Mentor dashboard; Figure S14: Explorer registration; Figure S15: Students’ progress; Figure S16: Assignments submitted; Figure S17: Gradebook; Figure S18: Class reports.
Author Contributions
Conceptualisation, M.T.V.O. and B.L.d.B.C.; methodology, M.T.V.O. and B.L.d.B.C.; software, M.T.V.O.; validation, M.T.V.O. and B.L.d.B.C.; formal analysis, M.T.V.O.; investigation, M.T.V.O.; data curation, M.T.V.O.; writing—original draft preparation, M.T.V.O.; writing—review and editing, B.L.d.B.C.; visualisation, M.T.V.O.; supervision, B.L.d.B.C.; project administration, M.T.V.O. All authors have read and agreed to the published version of the manuscript.
Funding
This research received no external funding.
Institutional Review Board Statement
The study was conducted in accordance with the Declaration of Helsinki and approved by the Research Ethics Committee of the University of the Balearic Islands (protocol code 051CER25; date of approval: 18 September 2025).
Informed Consent Statement
Written informed consent was obtained from the parents/legal guardians of all participating students, and student assent was obtained before participation.
Data Availability Statement
The data presented in this study are available on request from the corresponding author due to participant privacy and ethical restrictions associated with school-based research. Shared data will be anonymised/de-identified.
Acknowledgments
During the preparation of this manuscript, the authors used Gemini 3 (Google) to improve the wording and readability. The authors reviewed and edited all suggested changes and take full responsibility for the final version of the manuscript.
Conflicts of Interest
The authors declare no conflicts of interest.
Abbreviations
The following abbreviations are used in this manuscript:
| HCI | Human–computer interaction |
| UI | User interface |
| MALL | Mobile–assisted language learning |
| IA | Interaction architecture |
| DBR | Design-based research |
| VLEPIC | Virtual Learning Environment for Personalised and Interactive Communication |
| VLE | Virtual learning environment |
| EFL | English as a Foreign Language |
| UX | User experience |
| DP | Design principle |
| RQ | Research question |
| LL | Language learning |
| CLT | Cognitive Load Theory |
| SDT | Self-Determination Theory |
| SB | Starter Base |
| NT | Novice Trail |
| EP | Explorer’s Path |
| MQ | Mastery Quest |
| L1 | First language |
| SUS | System Usability Scale |
| GAMEX | Gameful Experience Scale |
| TROFLEI | Technology-Rich Outcomes-focused Learning Environment Inventory |
| GA4 | Google Analytics 4 |
| GP | GamiPress |
| AL | Active Logs |
| M | Mean |
| SD | Standard deviation |
| 95% CI | 95% Confidence interval |
| IQR | Interquartile range |
| CFA | Confirmatory Factor Analysis |
References
- UNESCO. Global Education Monitoring Report 2023: Technology in Education: A Tool on Whose Terms? GEM Report UNESCO; UNESCO: Paris, France, 2023. [Google Scholar] [CrossRef] [Scilit]
- Rogers, Y.; Sharp, H.; Preece, J. Interaction Design: Beyond Human-Computer Interaction, 6th ed.; John Wiley & Sons: Hoboken, NJ, USA, 2023. [Google Scholar]
- Norman, D.A. The Design of Everyday Things; Basic Books: New York, NY, USA, 2013. [Google Scholar]
- Davis, F.D. Perceived Usefulness, Perceived Ease of Use, and User Acceptance of Information Technology. MIS Q. 1989, 13, 319–340. [Google Scholar] [CrossRef] [Scilit] [PubMed]
- Deterding, S.; Dixon, D.; Khaled, R.; Nacke, L. From Game Design Elements to Gamefulness: Defining “Gamification”. In Proceedings of the 15th International Academic MindTrek Conference: Envisioning Future Media Environments, Tampere, Finland, 28–30 September 2011; ACM: New York, NY, USA, 2011; pp. 9–15. [Google Scholar] [CrossRef] [Scilit]
- Koivisto, J.; Hamari, J. The Rise of Motivational Information Systems: A Review of Gamification Research. Int. J. Inf. Manag. 2019, 45, 191–210. [Google Scholar] [CrossRef] [Scilit]
- McLoughlin, C.; Lee, M.J.W. Personalised and Self-Regulated Learning in the Web 2.0 Era: International Exemplars of Innovative Pedagogy Using Social Software. Australas. J. Educ. Technol. 2010, 26, 28–43. [Google Scholar] [CrossRef] [Scilit]
- Seaborn, K.; Fels, D.I. Gamification in Theory and Action: A Survey. Int. J. Hum. Comput. Stud. 2015, 74, 14–31. [Google Scholar] [CrossRef] [Scilit]
- Turnbull, D.; Chugh, R.; Luck, J. Transitioning to E-Learning during the COVID-19 Pandemic: How Have Higher Education Institutions Responded to the Challenge? Educ. Inf. Technol. 2021, 26, 6401–6419. [Google Scholar] [CrossRef] [Scilit] [PubMed]
- Stockwell, G. Mobile Assisted Language Learning: Concepts, Contexts and Challenges; Cambridge University Press: Cambridge, UK, 2022. [Google Scholar] [CrossRef] [Scilit]
- McKenney, S.; Reeves, T.C. Conducting Educational Design Research, 2nd ed.; Routledge: New York, NY, USA, 2018. [Google Scholar] [CrossRef] [Scilit]
- Velarde Orozco, M.T.; de Benito Crosetti, B.L. Evaluating a Virtual Learning Environment for Secondary English in a Public School: Usability, Motivation, and Engagement. Educ. Sci. 2026, 16, 169. [Google Scholar] [CrossRef] [Scilit]
- Shneiderman, B.; Plaisant, C.; Cohen, M.; Jacobs, S.M.; Elmqvist, N.; Diakopoulos, N. Designing the User Interface: Strategies for Effective Human-Computer Interaction, 6th ed.; Pearson: Boston, MA, USA, 2016. [Google Scholar]
- Nielsen, J. Usability Engineering; Morgan Kaufmann: San Francisco, CA, USA, 1993. [Google Scholar]
- O’Brien, H.L.; Toms, E.G. What is User Engagement? A Conceptual Framework for Defining User Engagement with Technology. J. Am. Soc. Inf. Sci. Technol. 2008, 59, 938–955. [Google Scholar] [CrossRef] [Scilit]
- Sweller, J. Element Interactivity and Intrinsic, Extraneous, and Germane Cognitive Load. Educ. Psychol. Rev. 2010, 22, 123–138. [Google Scholar] [CrossRef] [Scilit]
- Mayer, R.E. (Ed.) The Cambridge Handbook of Multimedia Learning, 2nd ed.; Cambridge University Press: Cambridge, UK, 2014. [Google Scholar] [CrossRef] [Scilit]
- Huotari, K.; Hamari, J. A Definition for Gamification: Anchoring Gamification in the Service Marketing Literature. Electron. Mark. 2017, 27, 21–31. [Google Scholar] [CrossRef] [Scilit]
- Sailer, M.; Homner, L. The Gamification of Learning: A Meta-Analysis. Educ. Psychol. Rev. 2020, 32, 77–112. [Google Scholar] [CrossRef] [Scilit]
- Zhang, Z.; Crawford, J. EFL Learners’ Motivation in a Gamified Formative Assessment: The Case of Quizizz. Educ. Inf. Technol. 2024, 29, 6217–6239. [Google Scholar] [CrossRef] [Scilit]
- Ryan, R.M.; Deci, E.L. Self-Determination Theory and the Facilitation of Intrinsic Motivation, Social Development, and Well-Being. Am. Psychol. 2000, 55, 68–78. [Google Scholar] [CrossRef] [PubMed]
- Zhou, S.; Zhu, H.; Zhou, Y. Impact of Teenage EFL Learners’ Psychological Needs on Learning Engagement and Behavioral Intention in Synchronous Online English Courses. Sustainability 2022, 14, 10468. [Google Scholar] [CrossRef] [Scilit]
- Landers, R.N. Developing a Theory of Gamified Learning. Simul. Gaming 2014, 45, 752–768. [Google Scholar] [CrossRef] [Scilit]
- Li, L.; Hew, K.F.; Du, J. Gamification Enhances Student Intrinsic Motivation, Perceptions of Autonomy and Relatedness, but Minimal Impact on Competency: A Meta-Analysis and Systematic Review. Educ. Technol. Res. Dev. 2024, 72, 765–796. [Google Scholar] [CrossRef] [Scilit]
- Hsu, C.-L.; Chen, M.-C. How Does Gamification Improve User Experience? An Empirical Investigation on the Antecedences and Consequences of User Experience and Its Mediating Role. Technol. Forecast. Soc. Change 2018, 132, 118–129. [Google Scholar] [CrossRef] [Scilit]
- Oliveira, W.; Hamari, J.; Shi, L.; Toda, A.M.; Rodrigues, L.; Palomino, P.T.; Isotani, S. Tailored Gamification in Education: A Literature Review and Future Agenda. Educ. Inf. Technol. 2023, 28, 373–406. [Google Scholar] [CrossRef] [Scilit]
- Maier, U.; Klotz, C. Personalized Feedback in Digital Learning Environments: Classification Framework and Literature Review. Comput. Educ. Artif. Intell. 2022, 3, 100080. [Google Scholar] [CrossRef] [Scilit]
- van der Graaf, J.; Raković, M.; Fan, Y.; Lim, L.; Singh, S.; Bannert, M.; Gašević, D.; Molenaar, I. How to Design and Evaluate Personalized Scaffolds for Self-Regulated Learning. Metacogn. Learn. 2023, 18, 783–810. [Google Scholar] [CrossRef] [Scilit]
- Thomann, H.; Deutscher, V. Scaffolding through Prompts in Digital Learning: A Systematic Review and Meta-Analysis of Effectiveness on Learning Achievement. Educ. Res. Rev. 2025, 47, 100686. [Google Scholar] [CrossRef] [Scilit]
- Lim, L.; Bannert, M.; van der Graaf, J.; Singh, S.; Fan, Y.; Surendrannair, S.; Rakovic, M.; Molenaar, I.; Moore, J.; Gašević, D. Effects of Real-Time Analytics-Based Personalized Scaffolds on Students’ Self-Regulated Learning. Comput. Hum. Behav. 2023, 139, 107547. [Google Scholar] [CrossRef] [Scilit]
- Lim, L.; Bannert, M.; van der Graaf, J.; Fan, Y.; Rakovic, M.; Singh, S.; Molenaar, I.; Gašević, D. How Do Students Learn with Real-Time Personalized Scaffolds? Br. J. Educ. Technol. 2024, 55, 1309–1327. [Google Scholar] [CrossRef] [Scilit]
- Alrawashdeh, G.S.; Fyffe, S.; Azevedo, R.F.L.; Castillo, N.M. Exploring the Impact of Personalized and Adaptive Learning Technologies on Reading Literacy: A Global Meta-Analysis. Educ. Res. Rev. 2024, 42, 100587. [Google Scholar] [CrossRef] [Scilit]
- Shi, H.; Aryadoust, V. A Systematic Review of AI-Based Automated Written Feedback Research. ReCALL 2024, 36, 187–209. [Google Scholar] [CrossRef] [Scilit]
- Lu, J.; Schmidt, M.; Lee, M.; Huang, R. Usability Research in Educational Technology: A State-of-the-Art Systematic Review. Educ. Technol. Res. Dev. 2022, 70, 1951–1992. [Google Scholar] [CrossRef] [Scilit]
- Lai, J.W.M.; Bower, M. How Is the Use of Technology in Education Evaluated? A Systematic Review. Comput. Educ. 2019, 133, 27–42. [Google Scholar] [CrossRef] [Scilit]
- Ardito, C.; Costabile, M.F.; De Marsico, M.; Lanzilotti, R.; Levialdi, S.; Roselli, T.; Rossano, V. An Approach to Usability Evaluation of E-Learning Applications. Univers. Access Inf. Soc. 2006, 4, 270–283. [Google Scholar] [CrossRef] [Scilit]
- Jansen, B.J.; Guan, K.W.; Salminen, J.; Aldous, K.K.; Jung, S.-G. What Is User Engagement?: A Systematic Review of 241 Research Articles in Human-Computer Interaction and Beyond. In Proceedings of the 2025 CHI Conference on Human Factors in Computing Systems; Association for Computing Machinery: New York, NY, USA, 2025; Article 457, pp. 1–19. [Google Scholar] [CrossRef] [Scilit]
- Bergdahl, N.; Bond, M.; Sjöberg, J.; Dougherty, M.; Oxley, E. Unpacking Student Engagement in Higher Education Learning Analytics: A Systematic Review. Int. J. Educ. Technol. High. Educ. 2024, 21, 63. [Google Scholar] [CrossRef] [Scilit]
- Subramanian, S.; De Moor, K.; Fiedler, M.; Koniuch, K.; Janowski, L. Towards Enhancing Ecological Validity in User Studies: A Systematic Review of Guidelines and Implications for QoE Research. Qual. User Exp. 2023, 8, 6. [Google Scholar] [CrossRef] [Scilit]
- ISO 9241-210:2019; Ergonomics of Human-System Interaction—Part 210: Human-Centred Design for Interactive Systems. International Organization for Standardization: Geneva, Switzerland, 2019. Available online: https://www.iso.org/standard/77520.html (accessed on 15 February 2026).
- De Vreugd, L.; van Leeuwen, A.; Jansen, R.; van der Schaaf, M. Learning Analytics Dashboard Design and Evaluation to Support Student Self-Regulation of Study Behaviour. J. Learn. Anal. 2024, 11, 249–262. [Google Scholar] [CrossRef] [Scilit]
- Bodily, R.; Verbert, K. Review of Research on Student-Facing Learning Analytics Dashboards and Educational Recommender Systems. IEEE Trans. Learn. Technol. 2017, 10, 405–418. [Google Scholar] [CrossRef] [Scilit]
- Kaliisa, R.; Jivet, I.; Prinsloo, P. A Checklist to Guide the Planning, Designing, Implementation, and Evaluation of Learning Analytics Dashboards. Int. J. Educ. Technol. High. Educ. 2023, 20, 28. [Google Scholar] [CrossRef] [Scilit]
- Masiello, I.; Mohseni, Z.; Palma, F.; Nordmark, S.; Augustsson, H.; Rundquist, R. A Current Overview of the Use of Learning Analytics Dashboards. Educ. Sci. 2024, 14, 82. [Google Scholar] [CrossRef] [Scilit]
- Littlewood, W.; Yu, B. First Language and Target Language in the Foreign Language Classroom. Lang. Teach. 2011, 44, 64–77. [Google Scholar] [CrossRef] [Scilit]
- The Design-Based Research Collective. Design-Based Research: An Emerging Paradigm for Educational Inquiry. Educ. Res. 2003, 32, 5–8. [Google Scholar] [CrossRef] [Scilit]
- Fetters, M.D.; Curry, L.A.; Creswell, J.W. Achieving Integration in Mixed Methods Designs—Principles and Practices. Health Serv. Res. 2013, 48, 2134–2156. [Google Scholar] [CrossRef] [Scilit] [PubMed]
- Salinas-Ibáñez, J.; De-Benito, B. Construction of Personalized Learning Pathways through Mixed Methods. Comunicar 2020, 28, 31–42. [Google Scholar] [CrossRef] [Scilit]
- Guetterman, T.C.; Fetters, M.D.; Creswell, J.W. Integrating Quantitative and Qualitative Results in Health Science Mixed Methods Research Through Joint Displays. Ann. Fam. Med. 2015, 13, 554–561. [Google Scholar] [CrossRef] [Scilit] [PubMed]
- Fetters, M.D.; Freshwater, D. The 1 + 1 = 3 Integration Challenge. J. Mix. Methods Res. 2015, 9, 115–117. [Google Scholar] [CrossRef] [Scilit]
- British Educational Research Association. Ethical Guidelines for Educational Research, 5th ed.; British Educational Research Association: London, UK, 2024; Available online: https://www.bera.ac.uk/publication/ethical-guidelines-for-educational-research-fifth-edition-2024 (accessed on 5 February 2026).
- Ministerio de Educación del Ecuador. Currículo de los Niveles de Educación Obligatoria-Subnivel Superior (English as a Foreign Language). 2016. Available online: https://educacion.gob.ec/wp-content/uploads/downloads/2019/09/EGB-Superior.pdf/ (accessed on 24 January 2026).
- Brooke, J. SUS: A “Quick and Dirty” Usability Scale. In Usability Evaluation in Industry; Jordan, P.W., Thomas, B., McClelland, I.L., Weerdmeester, B., Eds.; Taylor & Francis: London, UK, 1996; pp. 189–194. [Google Scholar]
- Sevilla-Gonzalez, M.D.R.; Moreno Loaeza, L.; Lazaro-Carrera, L.S.; Bourguet Ramirez, B.; Vázquez Rodríguez, A.; Peralta-Pedrero, M.L.; Almeda-Valdes, P. Spanish Version of the System Usability Scale for the Assessment of Electronic Tools: Development and Validation. JMIR Hum. Factors 2020, 7, e21161. [Google Scholar] [CrossRef] [Scilit] [PubMed]
- Eppmann, R.; Bekk, M.; Klein, K. Gameful Experience in Gamification: Construction and Validation of a Gameful Experience Scale [GAMEX]. J. Interact. Mark. 2018, 43, 98–115. [Google Scholar] [CrossRef] [Scilit]
- Parra-González, M.E.; Segura-Robles, A. Traducción y validación de la escala de evaluación de experiencias gamificadas (GAMEX). Bordón Rev. Pedagog. 2019, 71, 87–99. [Google Scholar] [CrossRef] [Scilit]
- Aldridge, J.M.; Dorman, J.P.; Fraser, B.J. Use of Multitrait-Multimethod Modelling to Validate Actual and Preferred Forms of the Technology-Rich Outcomes-Focused Learning Environment Inventory (TROFLEI). Aust. J. Educ. Dev. Psychol. 2004, 4, 110–125. [Google Scholar]
- Welch, A.G.; Cakir, M.; Peterson, C.M.; Ray, C.M. A Cross-Cultural Validation of the Technology-Rich Outcomes-Focused Learning Environment Inventory (TROFLEI) in Turkey and the USA. Res. Sci. Technol. Educ. 2012, 30, 49–63. [Google Scholar] [CrossRef] [Scilit]
- Hayes, A.F.; Coutts, J.J. Use Omega Rather than Cronbach’s Alpha for Estimating Reliability. But…. Commun. Methods Meas. 2020, 14, 1–24. [Google Scholar] [CrossRef] [Scilit]
- Braun, V.; Clarke, V. Using Thematic Analysis in Psychology. Qual. Res. Psychol. 2006, 3, 77–101. [Google Scholar] [CrossRef] [Scilit]
- Ferguson, R. Learning Analytics: Drivers, Developments and Challenges. Int. J. Technol. Enhanc. Learn. 2012, 4, 304–317. [Google Scholar] [CrossRef] [Scilit]
- Bangor, A.; Kortum, P.; Miller, J. Determining What Individual SUS Scores Mean: Adding an Adjective Rating Scale. J. Usability Stud. 2009, 4, 114–123. [Google Scholar]
- Hwang, H.-B.; Coss, M.D.; Loewen, S.; Tagarelli, K.M. Acceptance and Engagement Patterns of Mobile-Assisted Language Learning among Non-Conventional Adult L2 Learners: A Survival Analysis. Stud. Second Lang. Acquis. 2024, 46, 969–995. [Google Scholar] [CrossRef] [Scilit]
- Ruiz, J.J.R.; Sanchez, A.D.V.; Figueredo, O.R.B. Impact of Gamification on School Engagement: A Systematic Review. Front. Educ. 2024, 9, 1466926. [Google Scholar] [CrossRef] [Scilit]
- Liu, S.; Zhang, S.; Dai, Y. Do Mobile Games Improve Language Learning? A Meta-Analysis. Comput. Assist. Lang. Learn. 2025, 1–29. [Google Scholar] [CrossRef] [Scilit]
- Faudzi, M.A.; Cob, Z.C.; Ghazali, M.; Omar, R.; Sharudin, S.A. User Interface Design in Mobile Learning Applications: Developing and Evaluating a Questionnaire for Measuring Learners’ Extraneous Cognitive Load. Heliyon 2024, 10, e37494. [Google Scholar] [CrossRef] [Scilit] [PubMed]
- ISO 9241-11:2018; Ergonomics of Human-System Interaction—Part 11: Usability: Definitions and Concepts. International Organization for Standardization: Geneva, Switzerland, 2018. Available online: https://www.iso.org/standard/63500.html (accessed on 15 February 2026).
- Ugwu, U.U.; Rappa, N.A.; Wong, K. Key Considerations for Implementing Mobile Learning in Resource-Constrained Nations: A Scoping Review. Interact. Learn. Environ. 2025, 33, 1911–1928. [Google Scholar] [CrossRef] [Scilit]
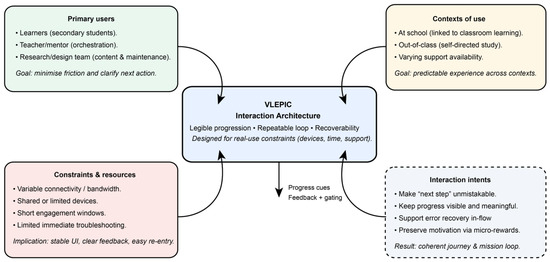
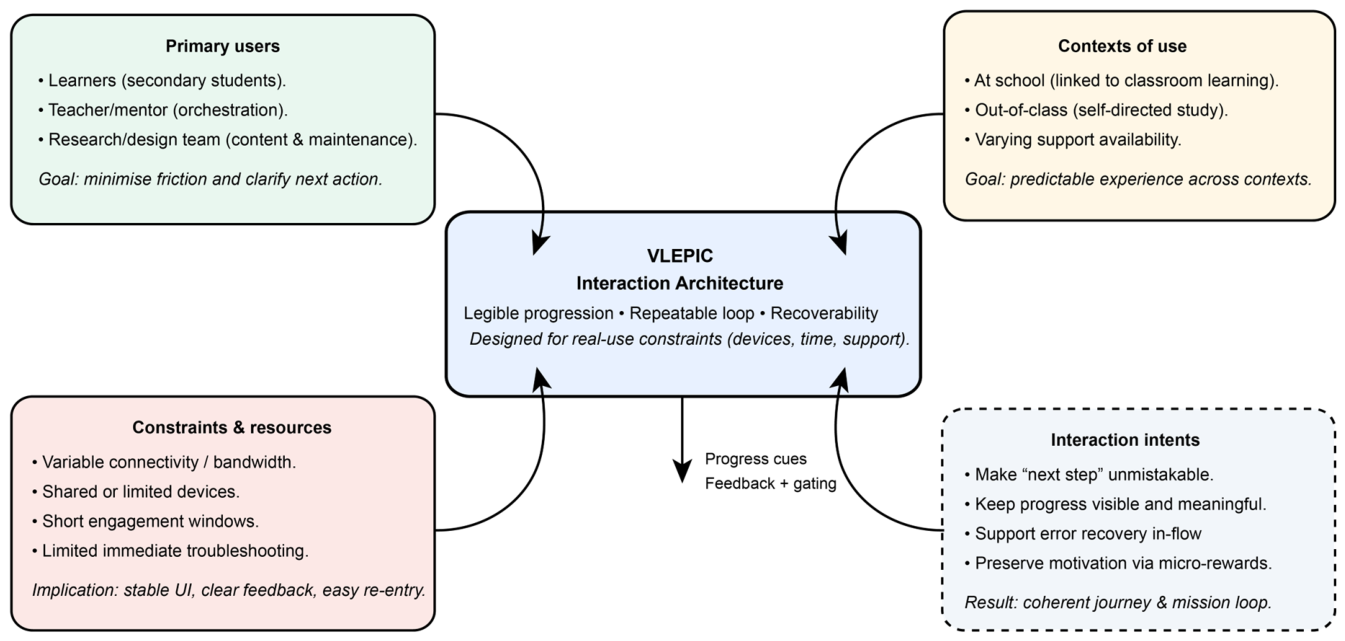
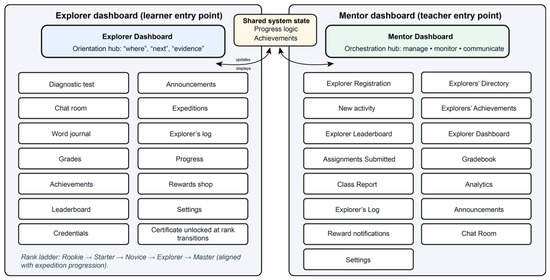
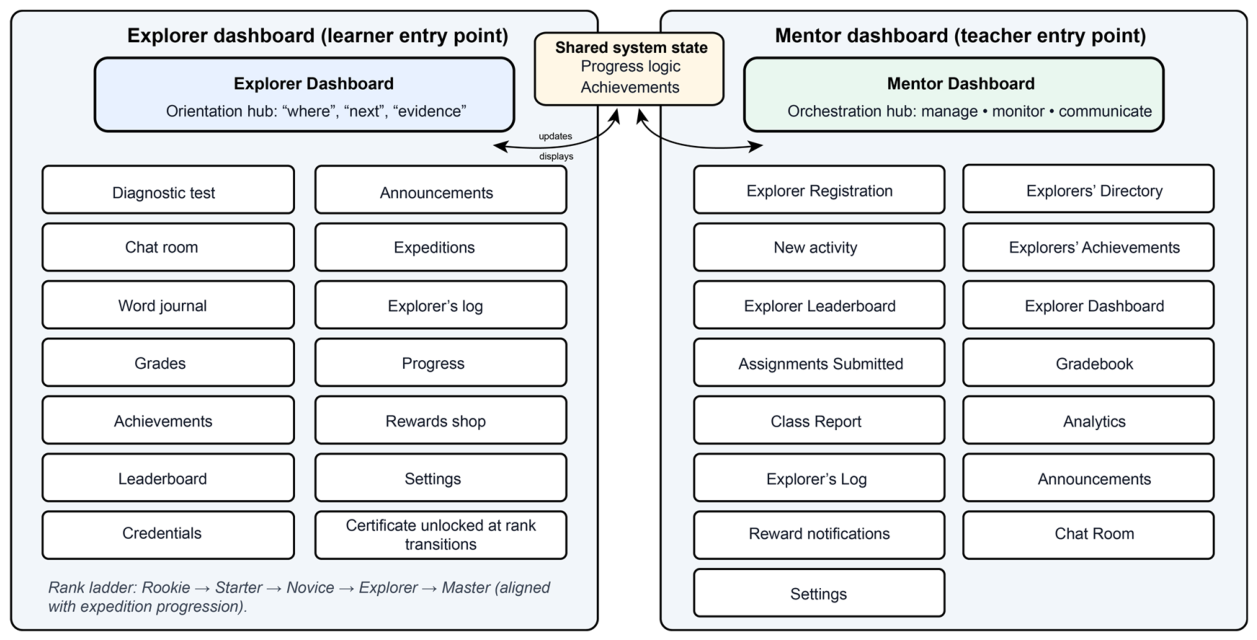
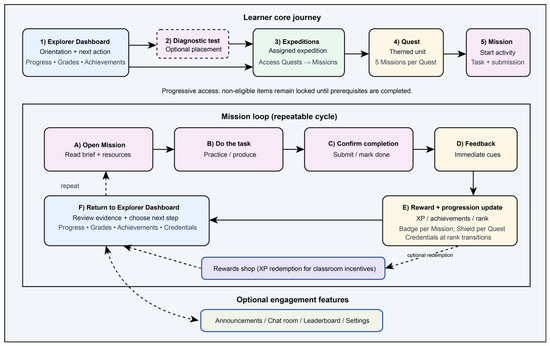
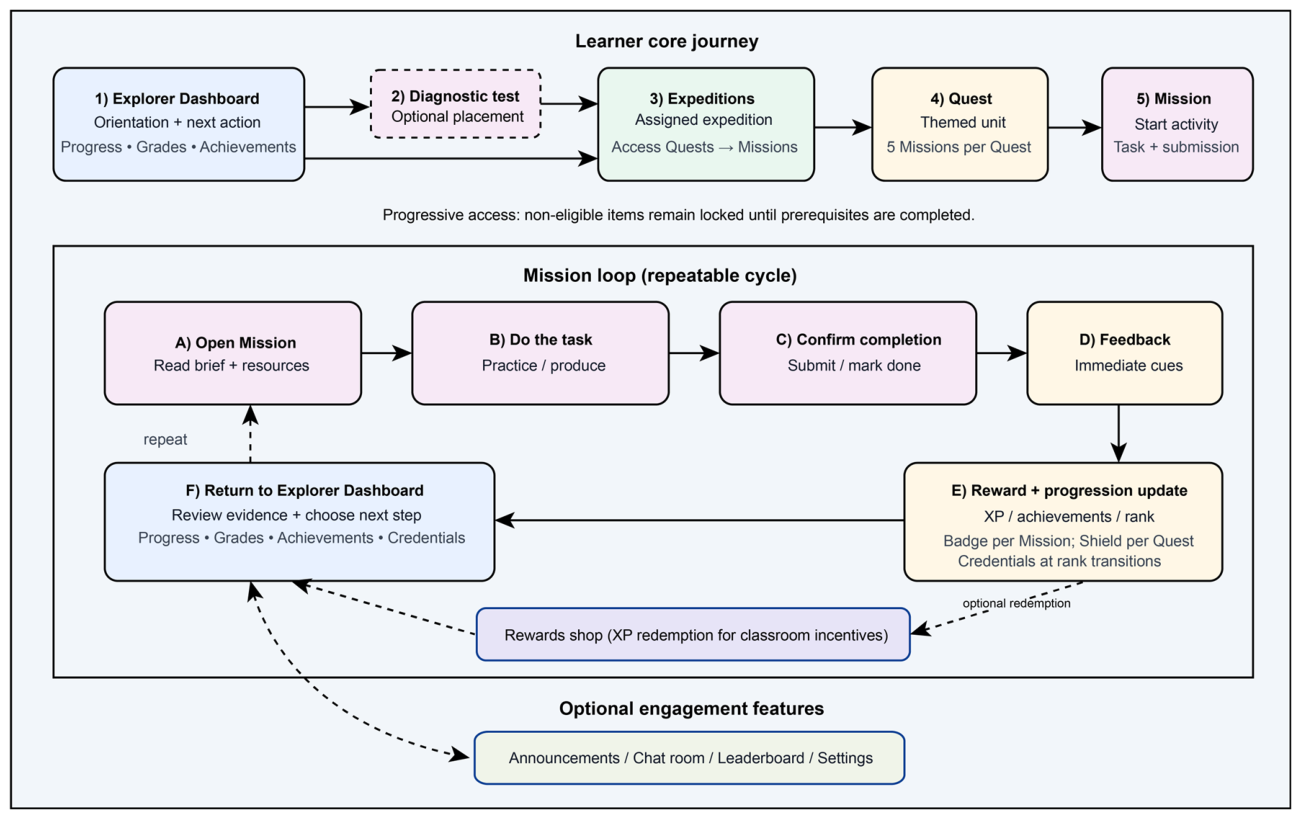
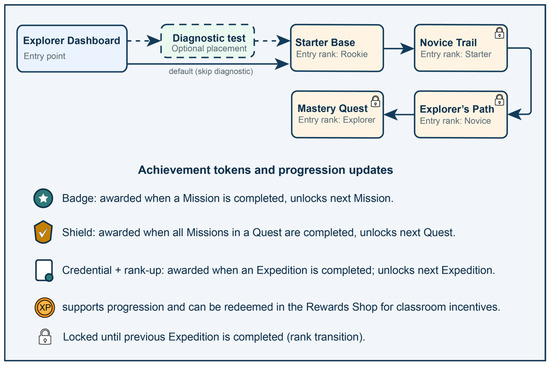
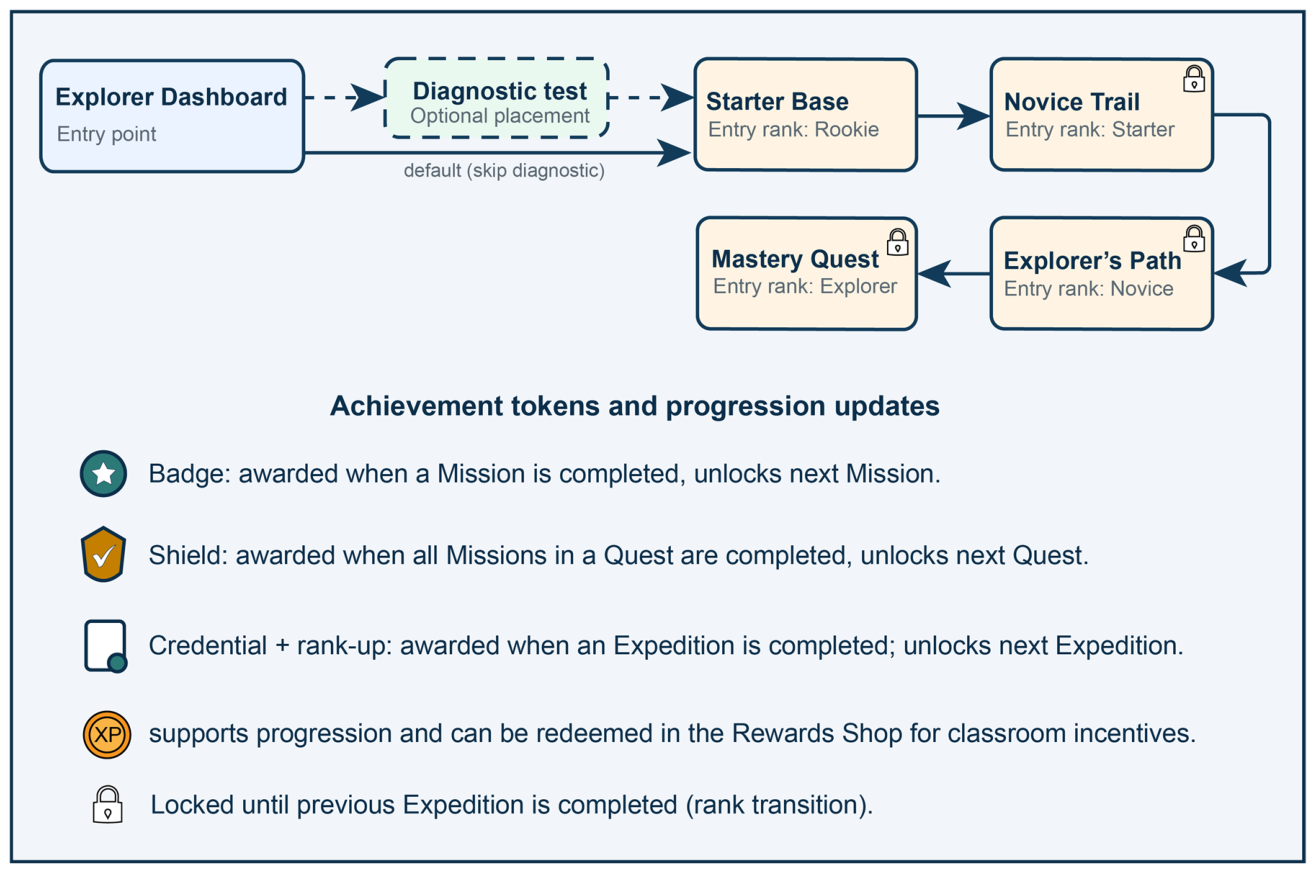
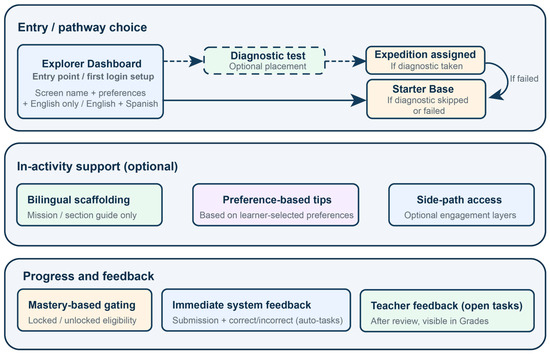
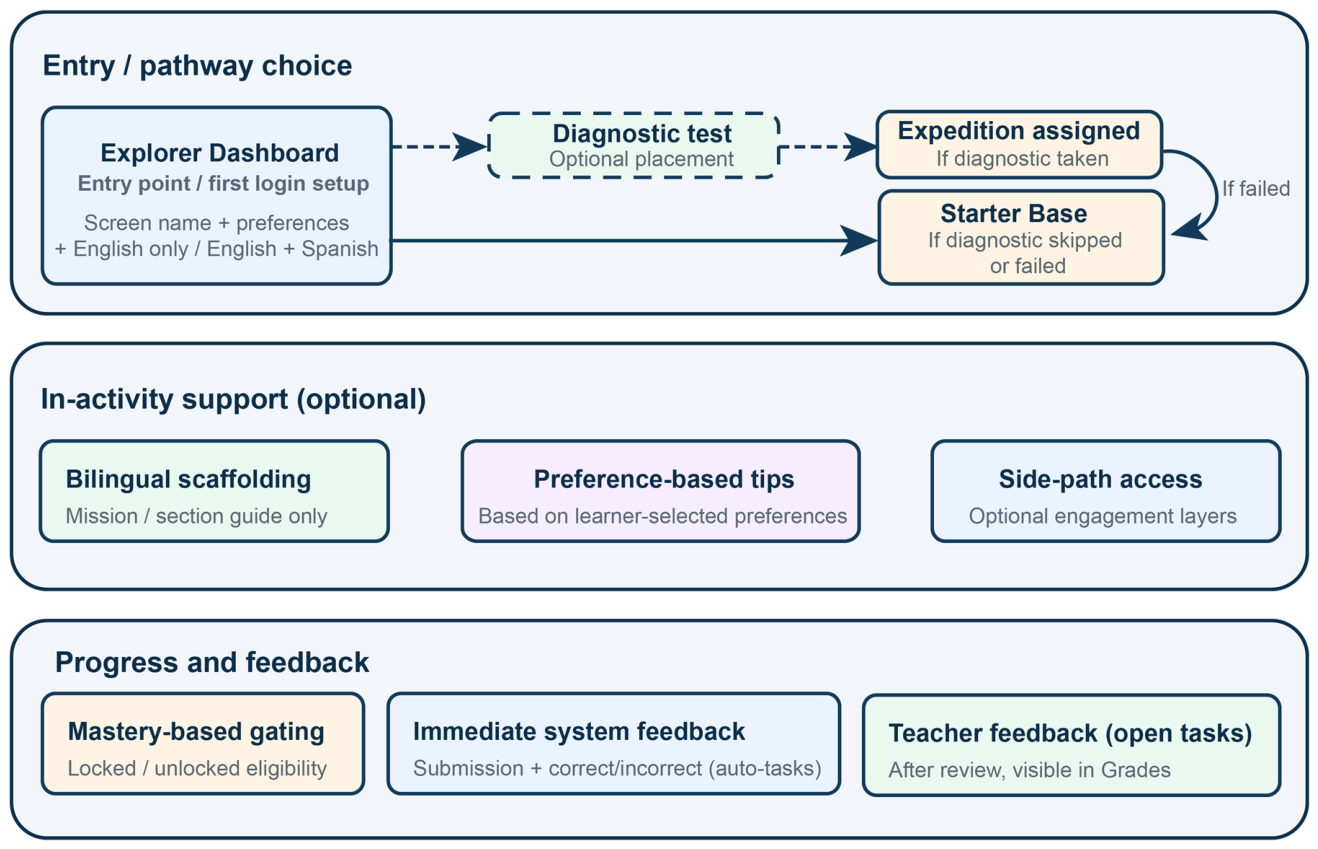
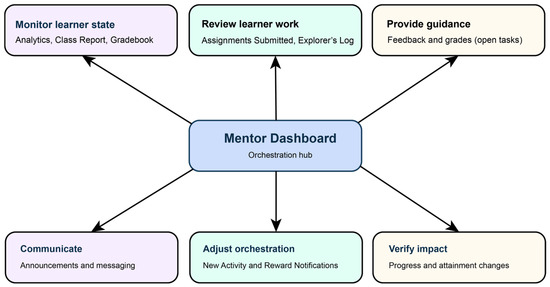
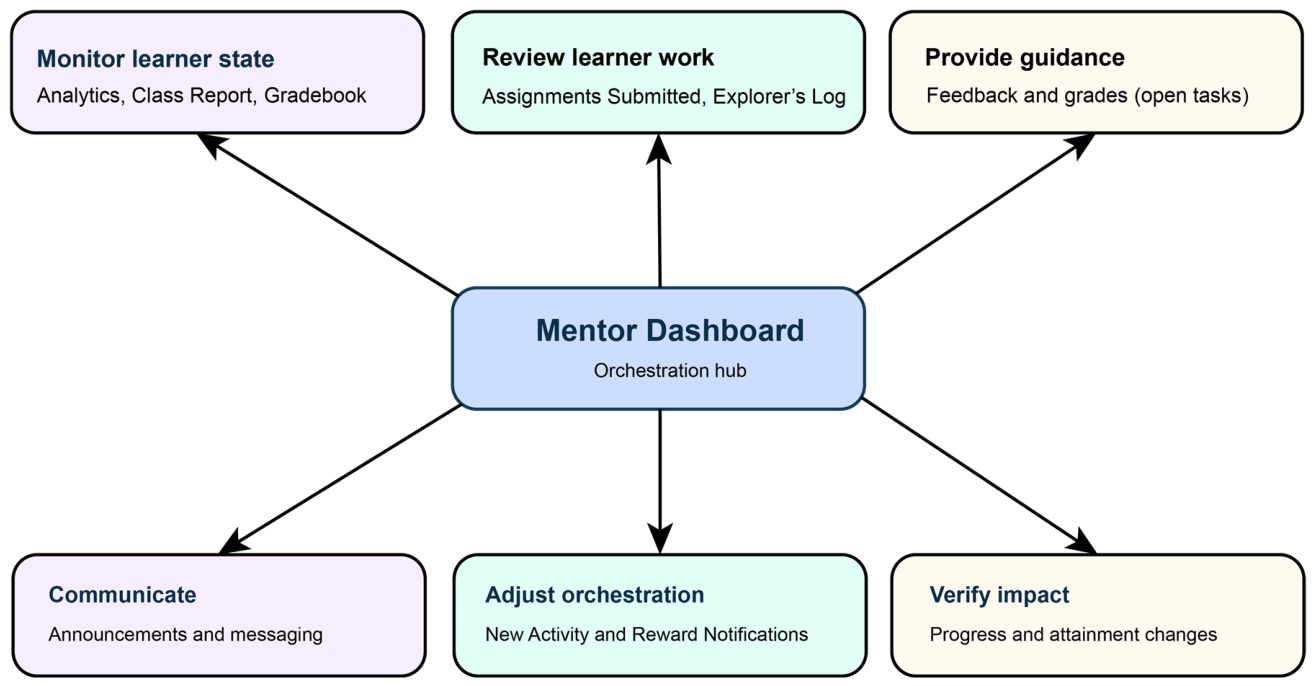
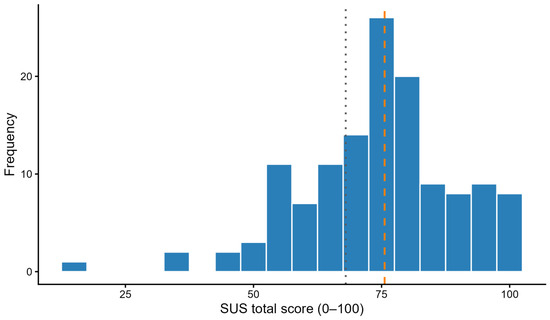
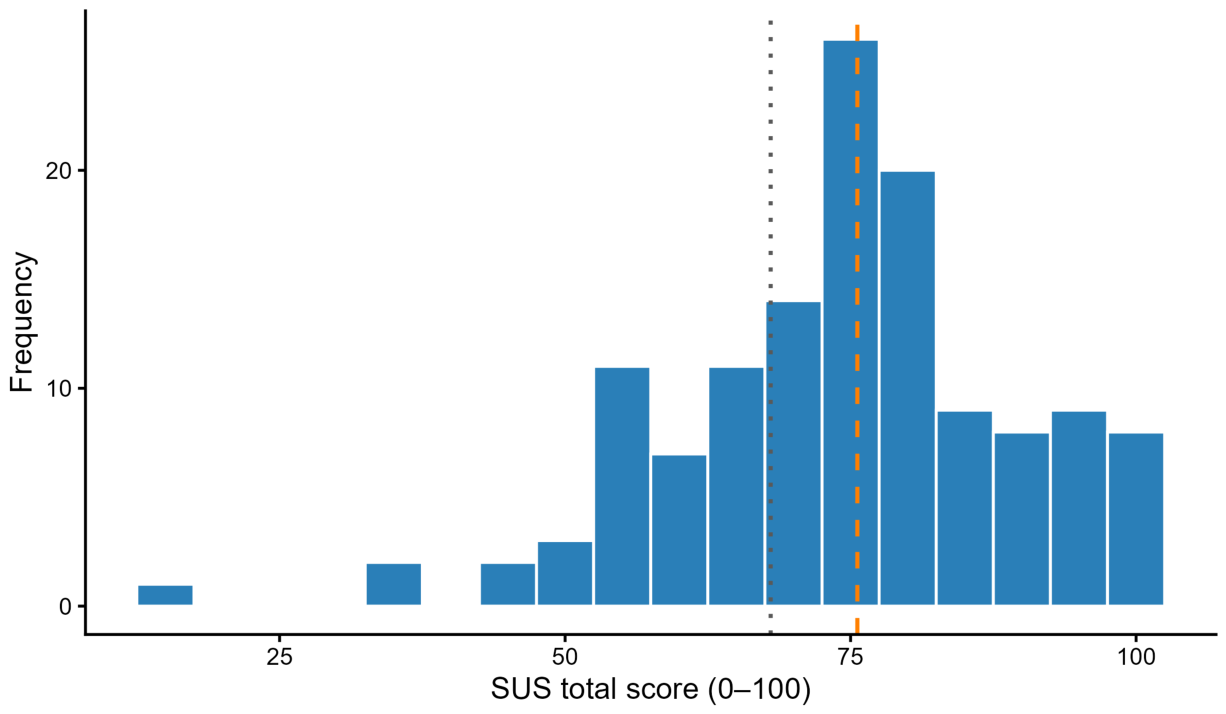
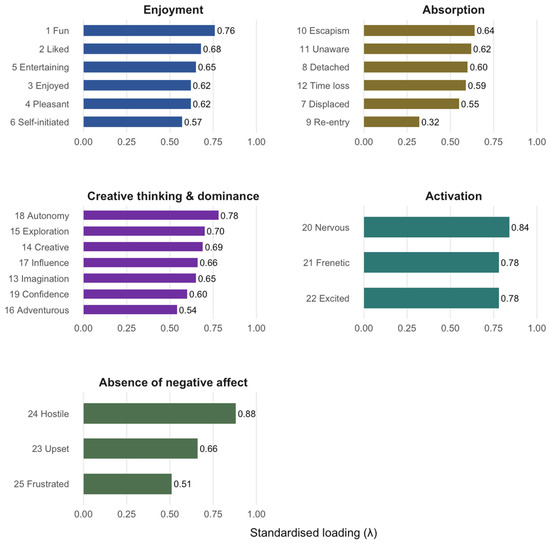
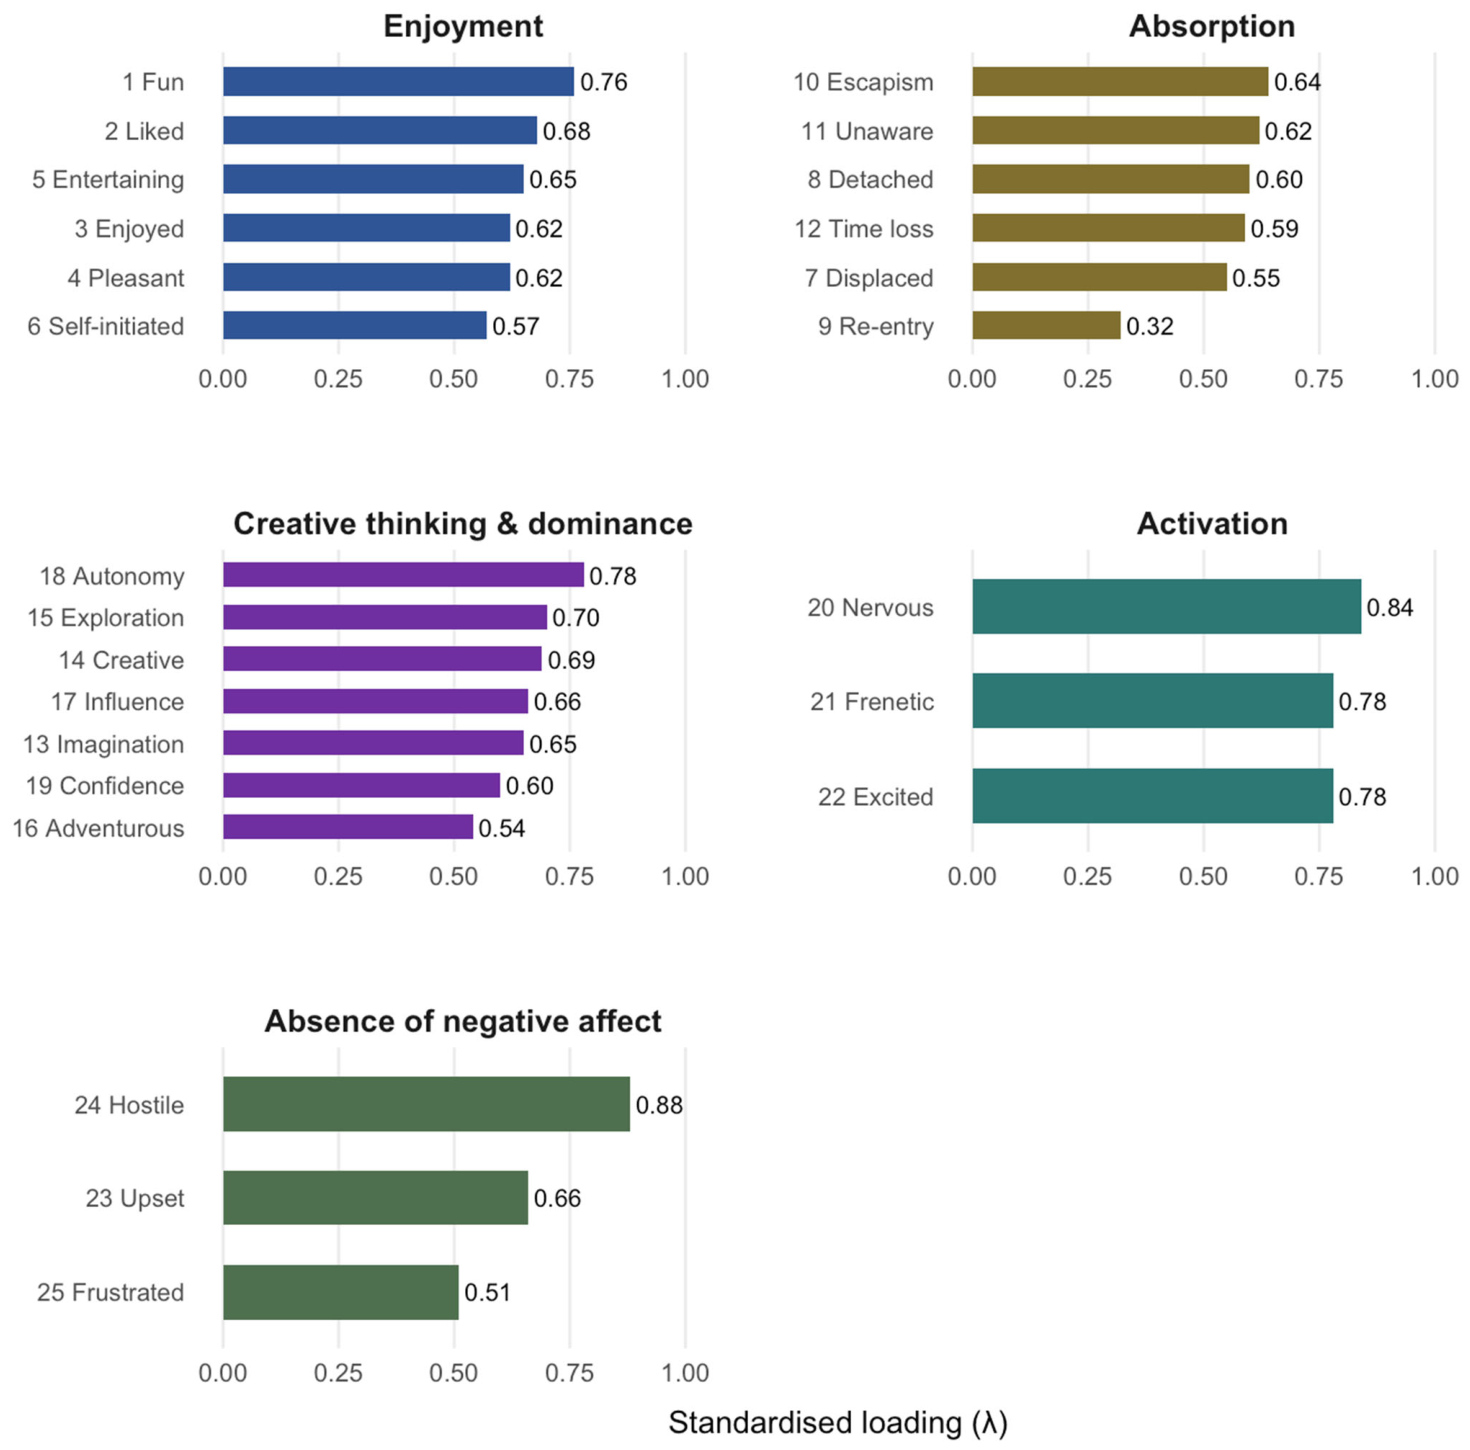
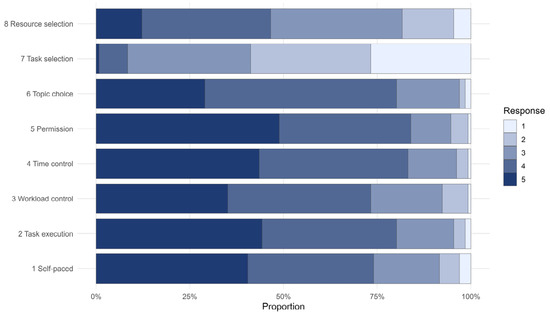
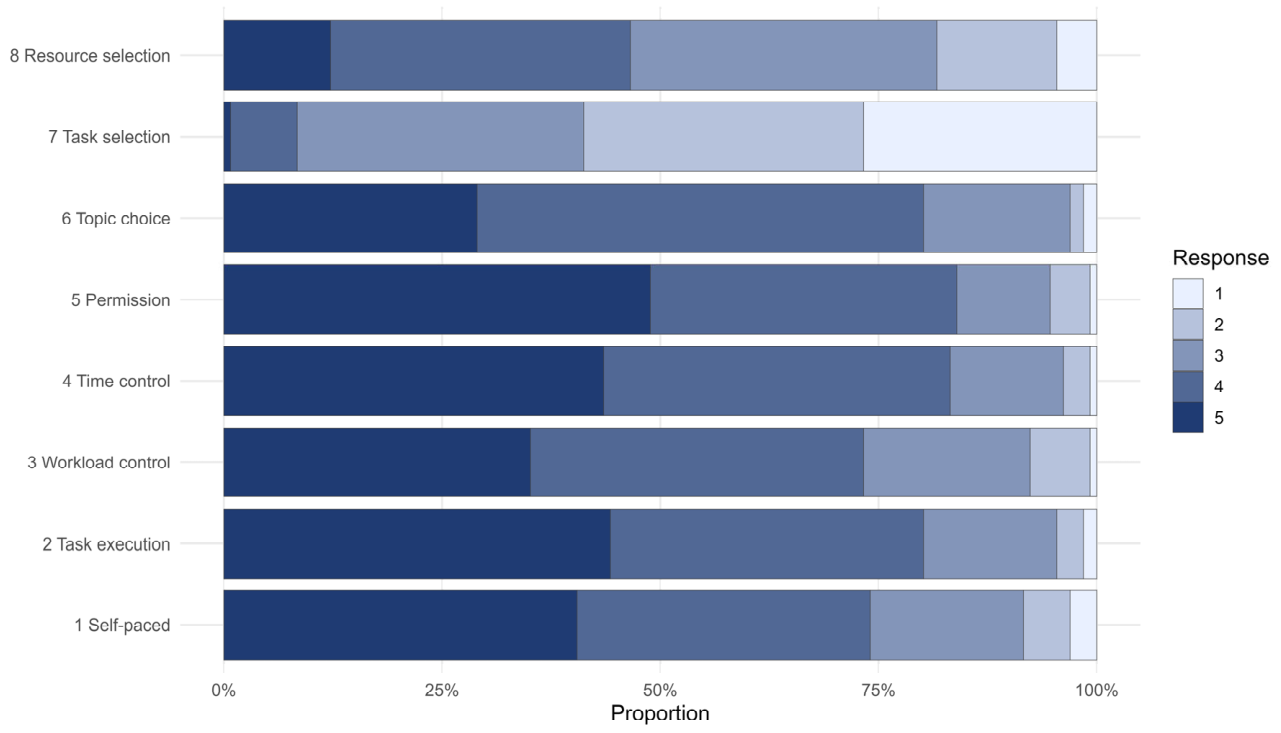
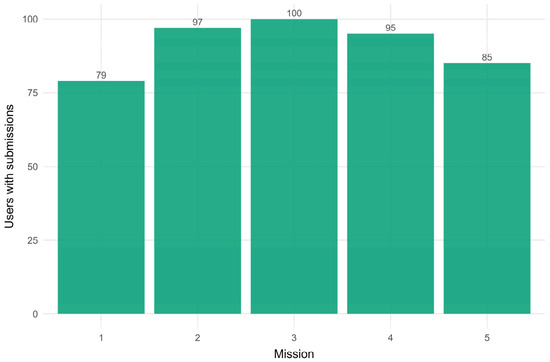
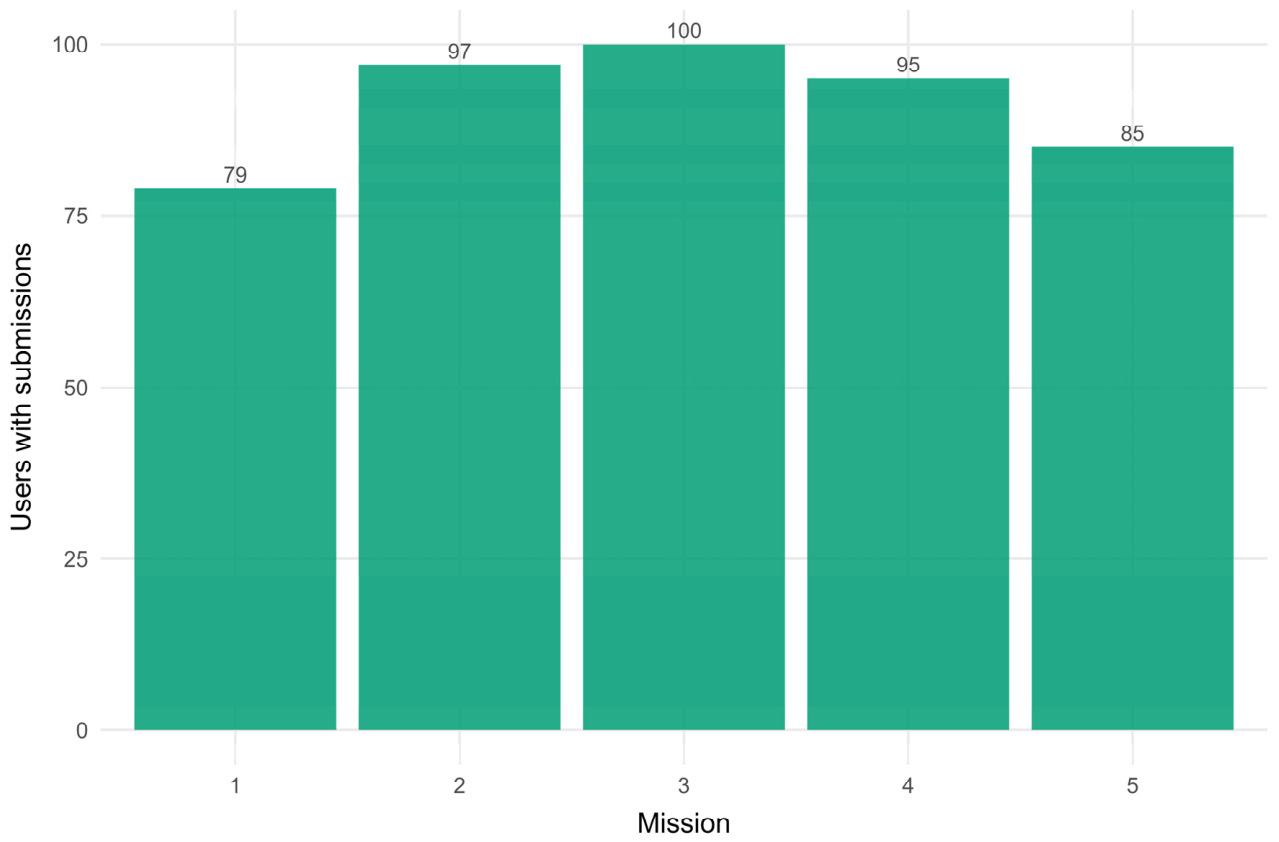
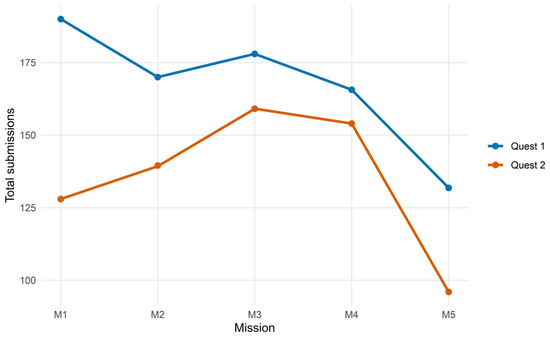
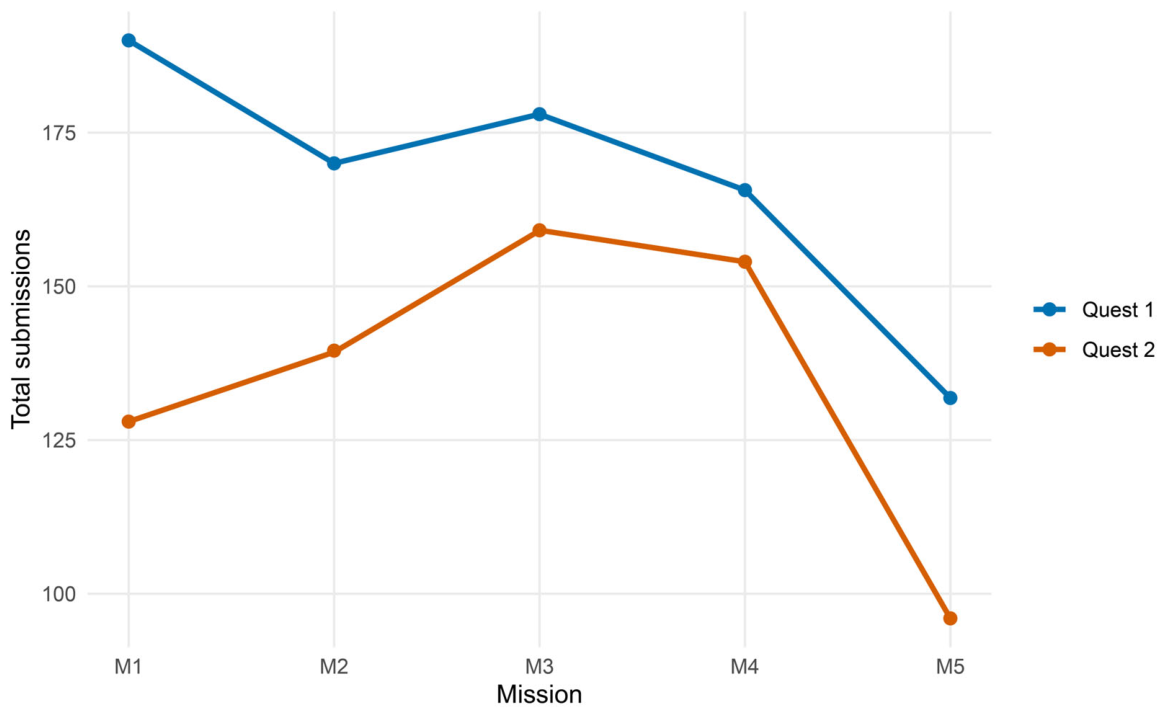
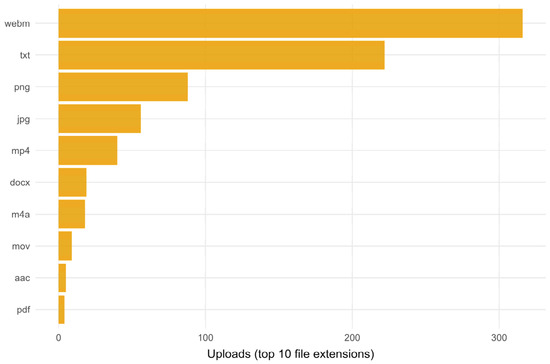
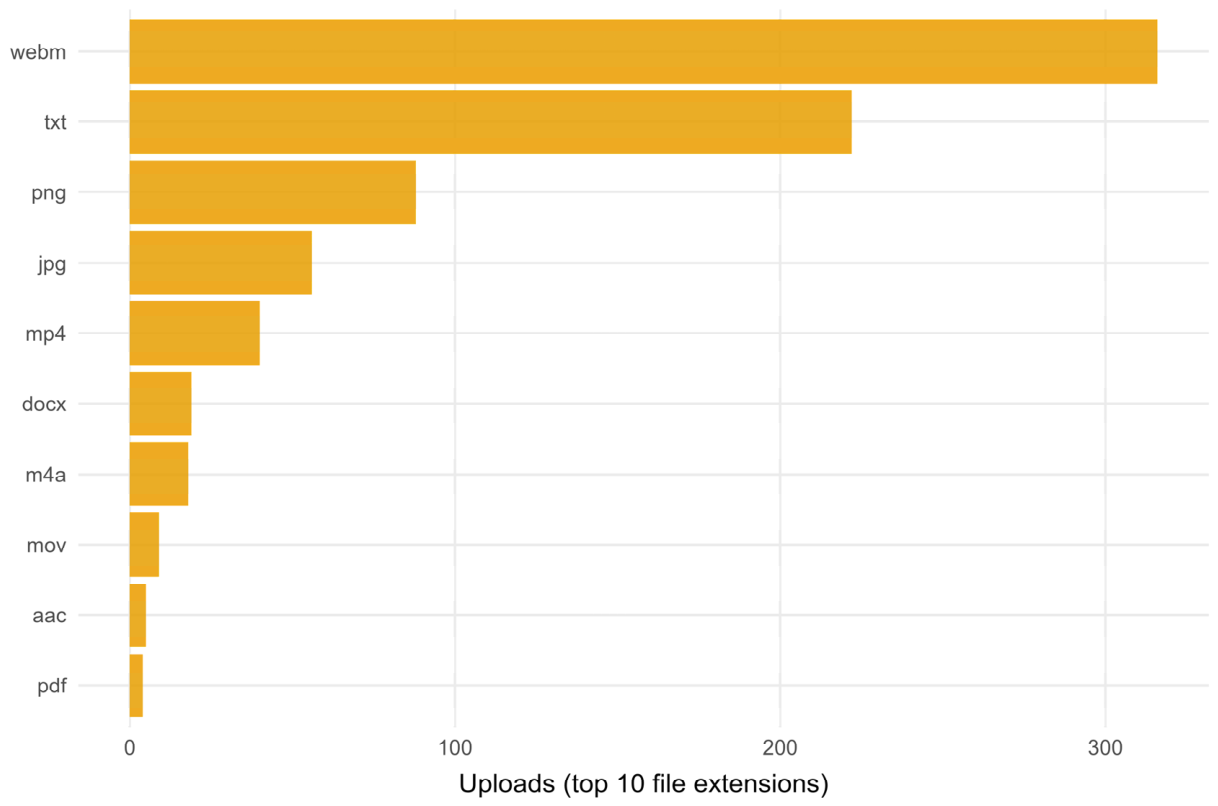
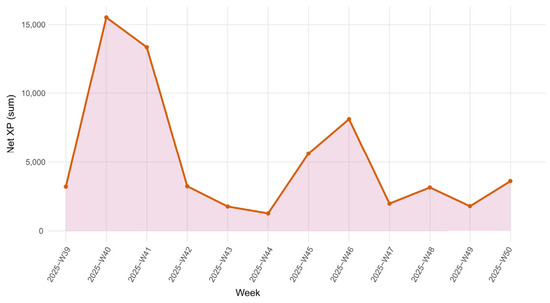
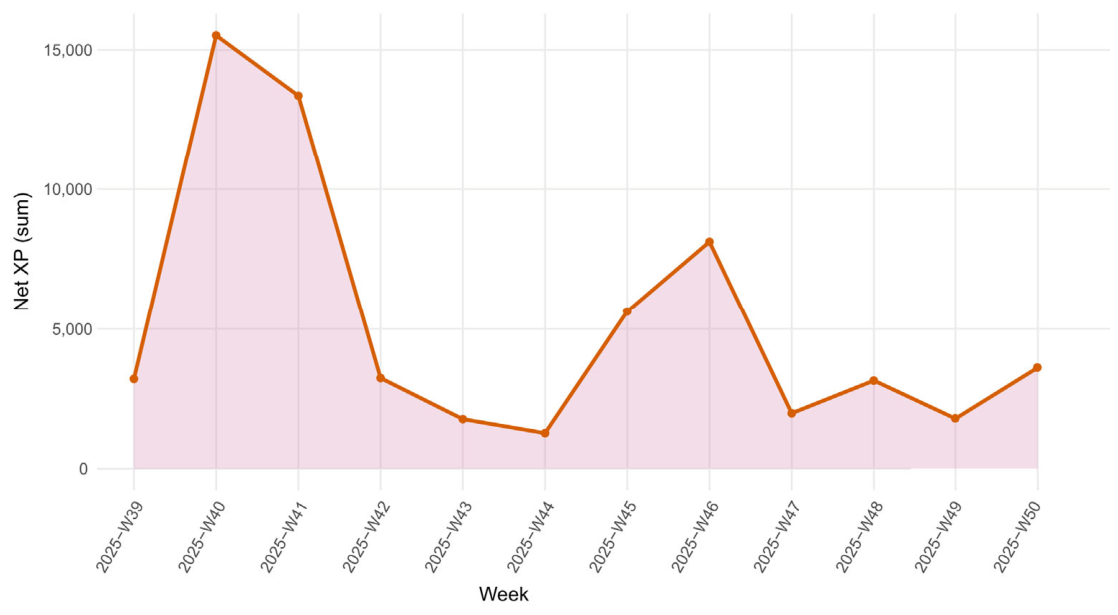

Disclaimer/Publisher’s Note: The statements, opinions and data contained in all publications are solely those of the individual author(s) and contributor(s) and not of MDPI and/or the editor(s). MDPI and/or the editor(s) disclaim responsibility for any injury to people or property resulting from any ideas, methods, instructions or products referred to in the content. |
© 2026 by the authors. Licensee MDPI, Basel, Switzerland. This article is an open access article distributed under the terms and conditions of the Creative Commons Attribution (CC BY) license.