


Abstract
Objectives: This study aimed to investigate the potential ameliorative effects of two fractions of Ipomoea aquatica extract on liver function in streptozotocin (STZ)-induced diabetic rats. Methods: Twenty-four adult male albino rats were divided into four groups: GI: control, GII: single dose of 50 mg/kg STZ, GIII: STZ + 200 mg/kg IA6-1 (dichloromethane/ethyl acetate fraction, 75/25 (v/v)), and GIV: STZ + 200 mg/kg IA9-2 (ethyl acetate/methanol fraction, 50/50 (v/v)). Liver function parameters, total antioxidant capacity, plasma protein profiles, and antiproliferative activity against HepG2 liver cancer cell lines were evaluated. Results: Compared with the control group, the diabetic group showed a significant increase in aspartate aminotransaminase (AST) and alanine aminotransaminase (ALT) levels, while albumin, total protein, and in vivo total antioxidant capacity (TAC) were significantly decreased. Administration of IA6-1 and IA9-2 fractions improved all measured biochemical parameters to levels comparable to the control, indicating that I. aquatica may enhance the antioxidant defense system of the liver and protect against oxidative-stress-induced damage. The IA9-2 fraction exhibited a stronger antiproliferative effect than the IA6-1 fraction, suggesting that the plant may offer protective benefits against liver damage associated with cancer. Additionally, SDS-PAGE analysis of plasma protein profiles revealed that C-reactive protein (C-RP, 28.3 kDa) and apelin (16 kDa) showed higher intensity in STZ-induced diabetic rats compared to the control group and IA-treated groups. These proteins may play roles in regulating inflammation and oxidative stress in the liver, which are key mechanisms in the pathogenesis of liver diseases. Conclusions: Overall, these findings highlight the potential therapeutic applications of I. aquatica for managing liver disorders, particularly those linked to diabetes, oxidative stress, and inflammation.
1. Introduction
Diabetes mellitus (DM) is a prevalent metabolic disorder characterized by hyperglycemia and altered metabolism of lipids, carbohydrates, and proteins [1]. DM is a chronic disease that affects a substantial portion of the global population, with its prevalence steadily increasing each year. Data from the International Diabetes Federation indicate that approximately 537 million adults currently live with diabetes. This number is projected to rise to 643 million by 2030 and further escalate to 783 million by 2045 [2]. Oxidative stress is one of the key pathogenetic mechanisms in diabetes mellitus. The gathering of reactive species such as peroxides, alkyl and alkoxyl radicals, superoxide anions, singlet oxygen, and cytotoxic peroxynitrites, along with their interactions with membrane phospholipids, leads to structural alterations and, ultimately, cell death [3,4]. The liver plays a vital role in detoxifying and eliminating xenobiotics, thereby protecting the body from harmful substances [5]. However, DM is linked to multiple hepatic abnormalities, including abnormal glycogen deposition, non-alcoholic fatty liver disease, fibrosis, cirrhosis, hepatocellular carcinoma, and viral hepatitis [6,7]. One of the primary mechanisms of liver injury in DM is hyperglycemia-induced oxidative stress, which disrupts protein, carbohydrate, and lipid metabolism and promotes oxidative damage and inflammation [8,9].
Although conventional antidiabetic medications are widely available, managing diabetes remains challenging due to adverse drug effects, high treatment costs, and limited accessibility in low-income countries. Furthermore, many synthetic agents primarily target symptomatic relief rather than correcting the underlying metabolic dysfunctions associated with the disease. Consequently, there is increasing scientific interest in exploring natural alternatives, particularly functional foods enriched with bioactive compounds, as potential sustainable strategies for diabetes prevention and long-term management. Plant-derived extracts and natural therapeutic agents have long been employed in the management of various pathological conditions, including diabetes mellitus. Ethnopharmacological evidence indicates that over 1000 medicinal plants have traditionally been utilized for diabetic control, although only approximately 350 species have been scientifically documented as possessing antidiabetic activity [10]. Natural products used in traditional medicine have a significant impact on diabetes treatment, particularly those exhibiting antioxidant properties. These phytochemicals are rich in bioactive constituents such as flavonoids, tannins, phenolic acids, and alkaloids, which enhance pancreatic β-cell function and promote insulin secretion while reducing intestinal glucose absorption [11]. Ipomoea aquatica Forssk (Water Spinach) (I. aquatica) is an aquatic or semi-aquatic edible herb used traditionally for the treatment of hepatic disorders, diabetes, constipation, and arsenic and heavy metal poisoning [12,13]. Phytochemical investigations have identified the presence of flavonoids, phenolic compounds, β-carotene, and ascorbic acid in I. aquatica [14].
In this study, we evaluated the ameliorative and therapeutic effects of the IA6-1 and IA9-2 fractions of I. aquatica on liver function. Biomarkers, including AST, ALT, total protein, albumin, and plasma protein profiles, were analyzed. Additionally, we assessed the in vivo total antioxidant capacity and the in vitro anticancer activity of both fractions. These findings provide valuable insights into the potential health benefits of I. aquatica, its possible mechanisms of action, and its prospective application as a nutraceutical.
2. Materials and Methods
2.1. Chemicals and Reagents
Dimethyl sulfoxide (DMSO) and streptozotocin (STZ) were purchased from Sigma-Aldrich (St. Louis, MO, USA), 3-(4,5-Dimethylthiazol-2-yl)-2,5-diphenyltetrazolium bromide (MTT) was obtained from Bio Basic Inc. (Markham, ON, Canada), and RPMI-1640 medium was purchased from Lonza Bioscience (Basel, Switzerland). Acrylamide, Bis-acrylamide, SDS, beta-mercaptoethanol, glycine, bromophenol blue, and Coomassie blue stains were purchased from Bio-Rad (Hercules, CA, USA). The protein marker was obtained from Abcam (Cambridge, UK). C-RP antibody was purchased from Abcam, Cambridge, UK. Apelin and horseradish peroxidase (HRP) were purchased from Santa Cruz Biotechnology, Santa Cruz, CA, USA. Actin was purchased from Sigma-Aldrich, St. Louis, MO, USA. HepG2 cells were obtained from the American Type Culture Collection (ATCC, Rockville, MD, USA).
2.2. Plant Material and Sample Preparation
The aerial parts of I. aquatica were collected from Darfur, Sudan, dried at room temperature, and ground into a fine powder. Extraction was carried out using maceration with 100% methanol for 24 h. The extract was then filtered, and the solvent was removed using a rotary evaporator at 40 °C to obtain a crude extract in gummy form. The crude extract was fractionated through vacuum liquid column chromatography on silica gel. The column was eluted with different solvent compositions, including n-hexane, dichloromethane (DCM), ethyl acetate (EtOAc), methanol (MeOH), and, finally, distilled water, gradually increasing the polarity to obtain 15 fractions [15]. All fractions were evaporated to dryness using a rotary evaporator and stored at −20 °C until further analysis. IA6-1 (DCM:EtOAc, 75:25, v/v) and IA9-2 (EtOAc:MeOH, 50:50, v/v) fractions were selected for this in vivo study due to their yield of more bioactive molecules.
2.3. Induction of Diabetes in Animals and Experimental Design
Twenty-four adult male albino rats, weighing 210 ± 10 g, were bred at the animal house facility of the Faculty of Science, Sohag University, Sohag, Egypt, and selected for this study. The animal experiments were executed following approval from the institutional ethics committee, adhering to the guidelines set by Sohag University, Faculty of Science Institutional Animal Care and Use Committee (SU-FS-IACUC), under IACUC Protocol Number SU-FS-33-26. The rats were housed in polypropylene cages at a temperature of 24 ± 2 °C, with a regular 12 h light/dark cycle. They were fed a standard pellet diet and given water. To induce diabetes, the rats received a single intraperitoneal injection of STZ (50 mg/kg in 100 mM ice-cold citrate buffer, pH 4.5) after an overnight fast [16]. After 72 h, blood glucose levels were measured, and rats with levels exceeding 250 mg/dL were selected, classified as diabetic. The animals were then randomly divided into four groups (n = 6) as follows:
- Group 1: Normal control animals (NC) treated with 2% DMSO (v/v).
- Group 2: Diabetic Control (DC) treated with a single dose of 50 mg/kg STZ, induced diabetic rats.
- Group 3: Diabetic animals were treated orally with 200 mg/kg body weight (BW) from IA6-1 once daily for 14 consecutive days (DC+ IA6-1).
- Group 4: Diabetic animals were treated orally with 200 mg/kg BW from IA9-2 once daily for 14 consecutive days (DC+ IA9-2).
2.4. Estimation of Biochemical Parameters
After 15 days, all rats were sacrificed, and blood samples for biochemical analyses were collected from the heart into plain tubes. Serum was separated through centrifugation at 3000 rpm for 10 min, aliquoted, and stored at −20 °C. All biochemical parameters were measured using commercial kits obtained from Biodiagnostic company (Giza, Egypt) according to the manufacturer’s instructions. Total antioxidant capacity (TAC) was measured using the ferric-reducing antioxidant power assay [17]. Total protein was measured using a Biuret colorimetric method with a serum protein kit following the methodology described by Gornall et al. [18]. Albumin concentration was estimated using a bromocresol green colorimetric method with a serum albumin kit. Serum alanine aminotransferase (ALT) and aspartate aminotransferase (AST) were determined using standard kits following the manufacturer’s instructions.
2.5. Plasma Protein Profiling
SDS–polyacrylamide gel electrophoresis (SDS-PAGE) was performed following the method outlined in Laemmli [19]. After sacrificing the animals, blood samples were collected into sodium EDTA added tubes, and plasma was separated through centrifugation (1000 rpm, 10 min). The plasma was then mixed with a sample buffer (62.5 mM Tris-HCl (pH 6.8), 25% glycerol, 2% SDS, 0.01% bromophenol blue, and 5% β-mercaptoethanol). To denature the plasma proteins, 5 µL of each plasma sample was mixed with 5 µL of sample buffer and heated at 95 °C for 5 min. Discontinuous SDS-PAGE was performed on a Tris-HCl 4–20% gel with a constant power of 200 V-h for 55 min. The gels were stained with Coomassie Brilliant Blue (CBB), and the bands were quantified using Total Lab Quant 2.2 for quantitative image analysis.
2.6. Western Blot Assay
After SDS-PAGE, the separated proteins were transferred onto a nitrocellulose membrane using a Mini Trans-Blot® system (Bio-Rad, Hercules, CA, USA) following the manufacturer’s protocol. The membrane was then blocked with 5% non-fat milk in Tris-buffered saline containing 0.05% Tween-20 (TBST) for 1 h at room temperature. The membrane was incubated overnight at 4 °C with primary antibodies against C-RP protein (1:500 dilution), apelin (1:1000 dilution), and actin (1:2000 dilution) separately. After washing with TBST, the membrane was incubated for 1 h at room temperature with secondary antibodies conjugated to HRP (1:5000 dilution). Protein bands were detected using a chemiluminescent substrate (SuperSignal™ West Pico PLUS, Thermo Fisher Scientific, Waltham, MA, USA) and imaged using a ChemiDoc™ Imaging System (Bio-Rad, Hercules, CA, USA). The intensity of the bands was quantified using ImageJ software 1.53q (National Institutes of Health, Bethesda, MD, USA) and normalized to the actin band’s intensity. Expression levels of related proteins were calculated.
2.7. Evaluation of Anticancer Activity (In Vitro) Using MTT Assay
HepG2 cells were cultured in RPMI 1640 medium supplemented with 10% inactivated fetal calf serum and 50 µg/mL of gentamycin. The cells were maintained at 37 °C in a humidified incubator with 5% CO2 and sub-cultured two to three times a week. The influence of I. aquatica fractions on the viability of liver cancer (HepG2) cells was studied using MTT assay. For this, cells were seeded onto 96-well plates at a density of 5 × 10³ cells/well and incubated for 24 h. The cells were then treated with different concentrations of I. aquatica fractions for 24 h. Following treatment, MTT solution was added to each well and incubated for 4 h. The formed formazan crystals were dissolved in DMSO, and absorbance was measured at 570 nm using a microplate reader. The IC50 value was determined by plotting the dose–response curve for each logarithmic concentration. The percentage of cell viability was calculated using the following formula:
2.8. Statistical Analysis
Statistical analyses were performed using Origin (OriginLab, Northampton, MA, USA). Data were analyzed using one-way analysis of variance (ANOVA) with post hoc Tukey’s HSD. A p-value of less than 0.05 (p < 0.05) was considered statistically significant.
3. Results
3.1. Ipomoea Aquatica Extracts (IAEs) Enhanced In Vivo Total Antioxidant Capacity in Streptozotocin-Induced Rat Model
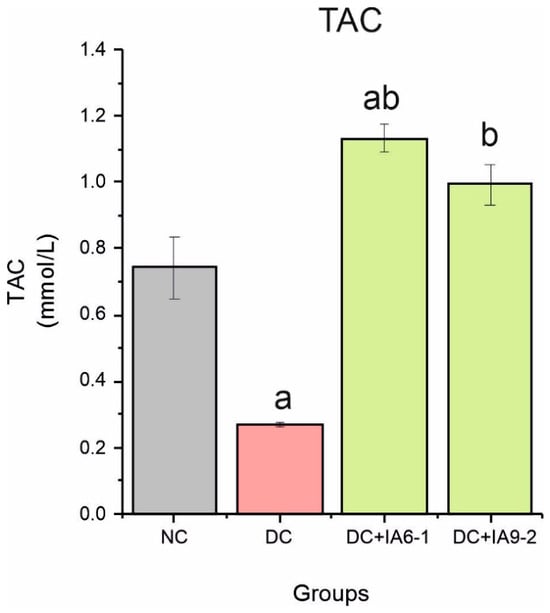
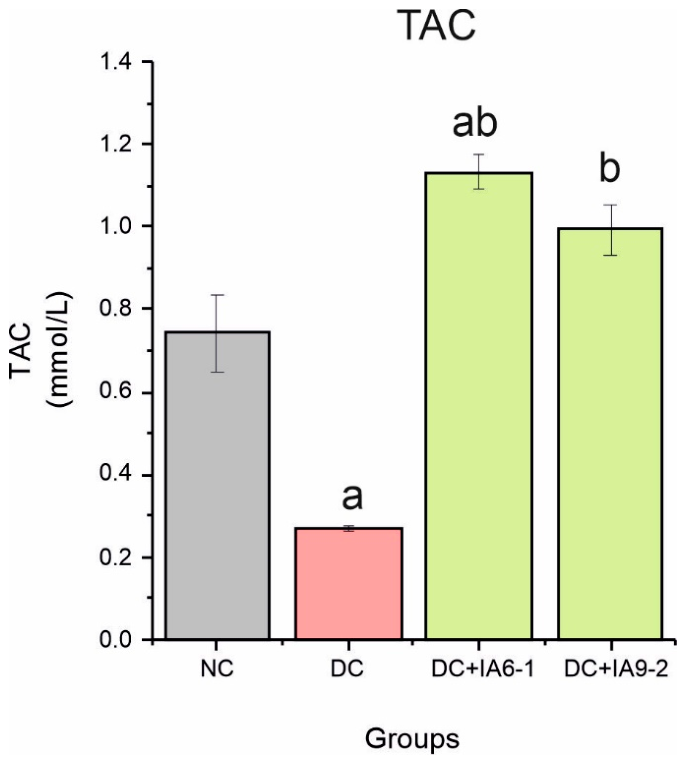
To investigate the effects of IA6-1 and IA9-2 fractions on total antioxidant capacity, we performed in vivo experiments in which IAEs were administered (at concentrations of 200 mg/kg BW for 15 days) after STZ administration. The effects of the IAEs on total antioxidant capacity of normal control, diabetic, and treated rats are shown in Figure 1. TAC value in the diabetic group decreased by 63.5% compared to the normal control group (p < 0.05). Groups treated with IAEs showed a significant increase by 48.65% and 33.8% for IA6-1 and IA9-2 fractions, respectively, compared to the normal control group.
Figure 1.
The improved total antioxidant activity (in vivo) exhibited in STZ-induced diabetic rats by IAE treatment for two weeks in various groups. Data are expressed as the mean ± SE. a represents groups differing significantly from the normal control group (p < 0.05). b represents groups differing significantly from the diabetic control group (p < 0.05). TAC, total antioxidant capacity; NC, normal control group; DC, diabetic control group; DC+IA6-1, diabetic control group treated with 200 mg/kg BW of IA6-1; DC+ IA9-2, diabetic control group treated with 200 mg/kg BW of IA9-2. Different colors represent different experimental groups.
3.2. Alteration in Serum Albumin and Total Protein Levels
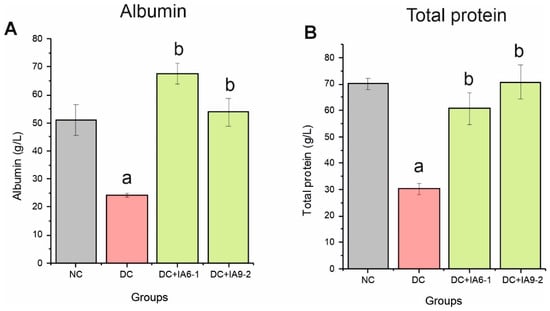
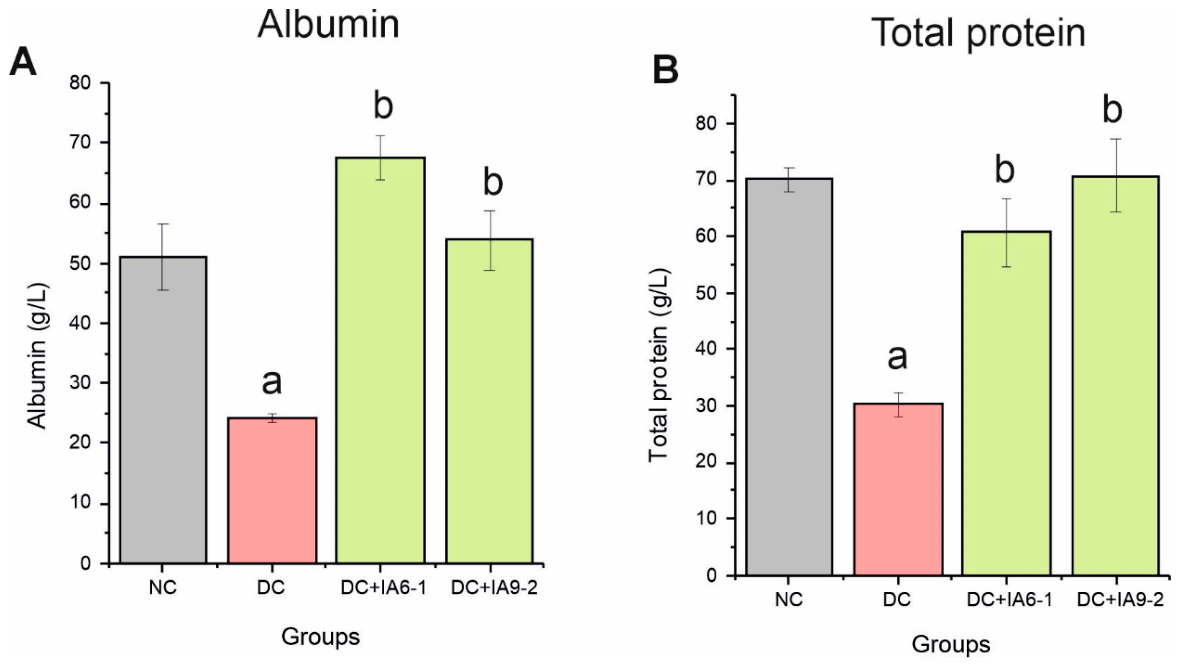
The changes in albumin and total protein levels in the serum of all treated animals are illustrated in Figure 2. There was a significant reduction (p < 0.05) in the albumin and total protein levels in the diabetic group compared to the normal control group. On the other hand, when both fractions IA6-1 and IA9-2 were applied, serum albumin and total protein levels significantly increased (p < 0.05) compared to the diabetic group.
Figure 2.
IAE enhanced (A) serum albumin and (B) total protein concentrations. Data are expressed as the mean ± SE. a represents groups differing significantly from the normal control group (p < 0.05). b represents groups differing significantly from the diabetic control group (p < 0.05). NC, normal control group; DC, diabetic control group; DC+IA6-1, diabetic control group treated with 200 mg/kg BW of IA6-1; DC+ IA9-2, diabetic control group treated with 200 mg/kg BW of IA9-2. Different colors represent different experimental groups.
3.3. Ipomoea Aquatica Extracts Improved Hepatotoxicity Marker Levels
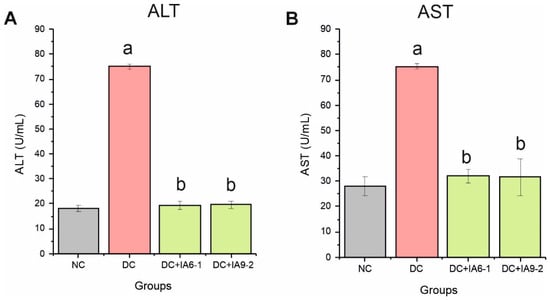
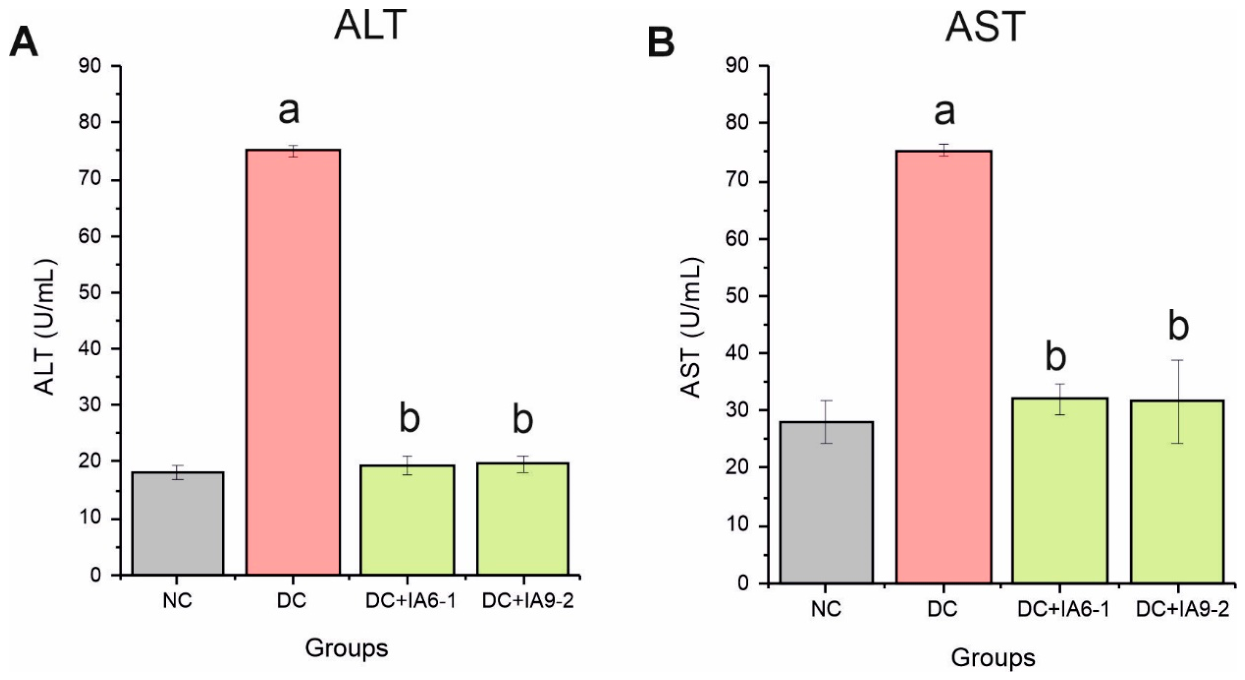
The decreased antioxidative potential led to a significant increase in liver markers (ALT and AST: NC vs. STZ, p < 0.05), indicating the development of oxidative stress and hepatocellular damage in the diabetic rats (Figure 3A,B). In the DC group, the levels of marker enzymes for liver toxicity (ALT and AST) were significantly higher compared to the normal NC group. Specifically, ALT and AST levels in diabetic rats were increased by 4.14- and 2.7- fold, respectively, relative to normal rats. However, rats supplemented with IA6-1 and IA9-2 extracts showed a significant reduction in these enzyme levels (p < 0.05), bringing them closer to the normal range (Figure 3).
Figure 3.
IAEs improved hepatic function by normalizing (A) ALT and (B) AST levels when administering 200 mg/kg BW of IA6-1 or IA9-2 for 15 days. Data are expressed as the mean ± SE. a represents groups differing significantly from the normal control group (p < 0.05). b represents groups differing significantly from the diabetic control group (p < 0.05). ALT, alanine aminotransaminase; AST, aspartate aminotransaminase; NC, normal control group; DC, diabetic control group; DC+IA6-1, diabetic control group treated with 200 mg/kg BW of IA6-1; DC+ IA9-2, diabetic control group treated with 200 mg/kg BW of IA9-2. Different colors represent different experimental groups.
3.4. Analysis of Protein Profile and Comparison of IAE-Treated Groups with the Normal Control Group
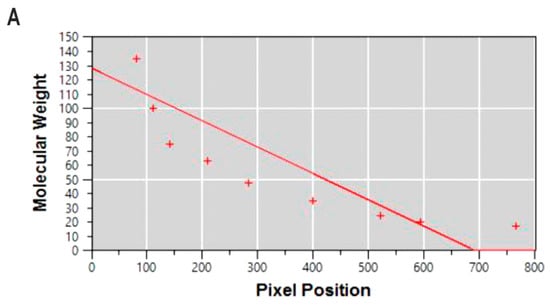
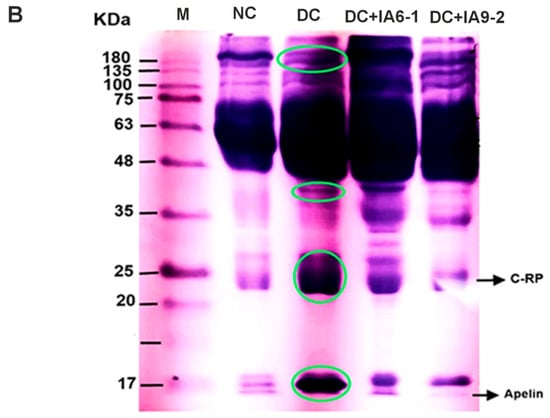
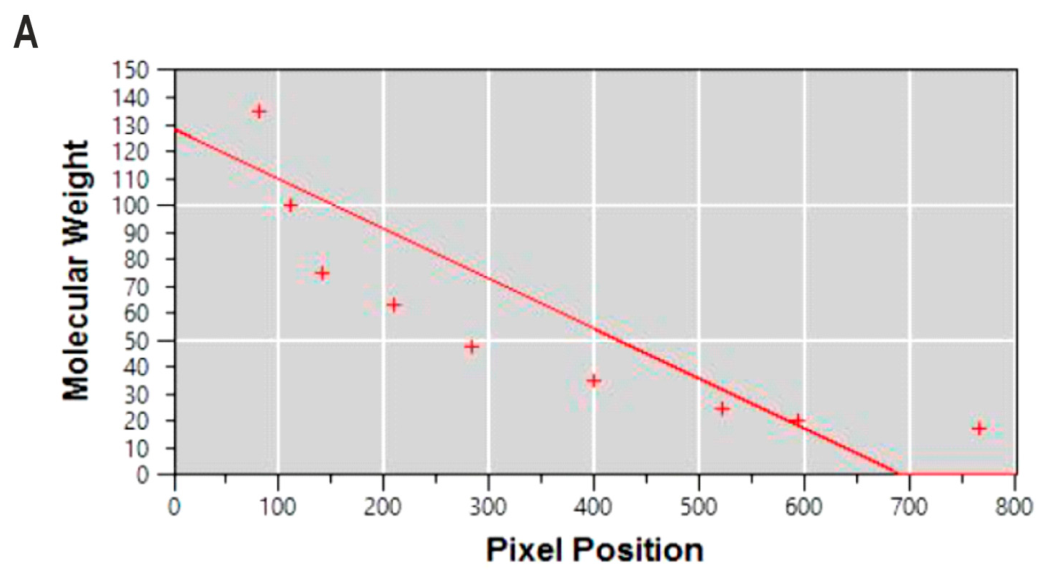
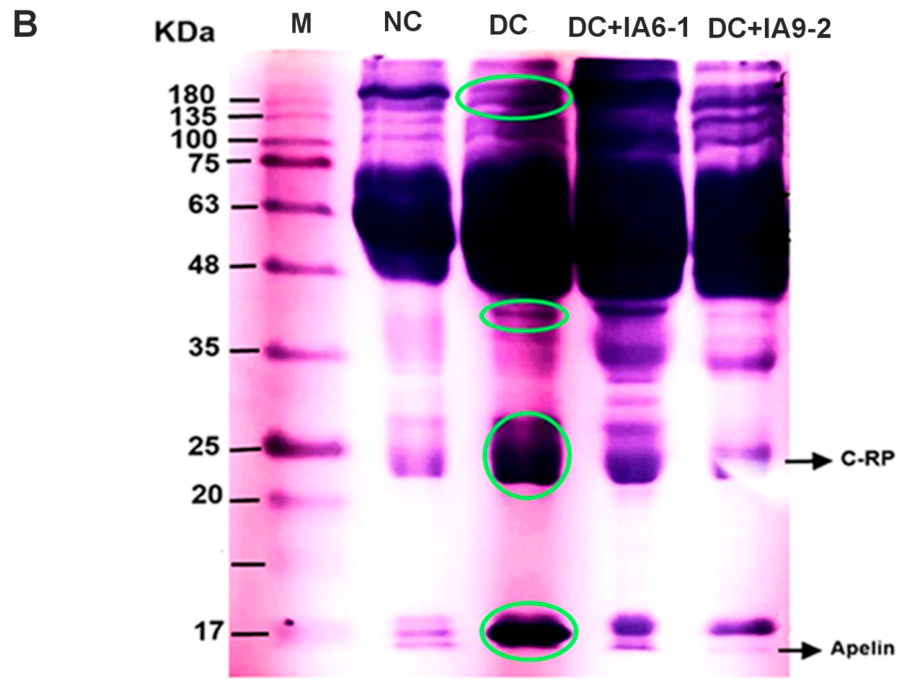
The analysis of protein profiles for markers and rat blood plasma using SDS-PAGE demonstrated the migration pattern of protein bands, as illustrated in Figure 4A,B. The standard curve of the migration distance (Rf) and molecular weight protein markers showed a regression line with the equation y = −0.185X +128.4 (R2 = 0.6956) (Figure 4A) [20]. The limited fit warrants caution when estimating molecular masses within the reported 17–180 kDa marker range.
Figure 4.
(A) Standard curve of the protein marker, with the y-axis representing the molecular weight (MW) of the protein and the x-axis representing the migration distance (Rf). Crosses indicate the marker bands, and the solid line represents the fitted linear regression (y = −0.185x + 128.4; R2 = 0.6956) (B) A photomicrograph displaying the migration pattern bands of rat protein blood plasma after undergoing SDS gel electrophoresis. Green circles highlight four regions in the STZ-treated group, described here for visual reference. The bands are labeled as follows: M: the protein marker; NC: the normal control; DC: diabetic control group; DC+IA6-1, diabetic control group treated with 200 mg/kg BW of IA6-1; DC+ IA9-2, diabetic control group treated with 200 mg/kg BW of IA9-2.
SDS-PAGE revealed broadly similar plasma protein banding patterns across the NC, diabetic group, DC+IA6-1, and DC+IA9-2 groups, with visible differences in staining intensity and resolution (Figure 4B). Subsequent antibody-based Western blotting supported the identification of CRP and apelin, while the remaining bands were considered unidentified.
3.5. Ipomoea Aquatica Extracts Modulate the Expression of Apelin and C-RP
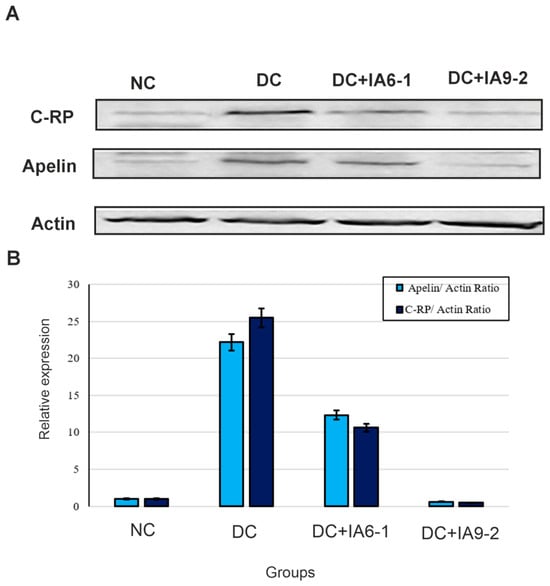
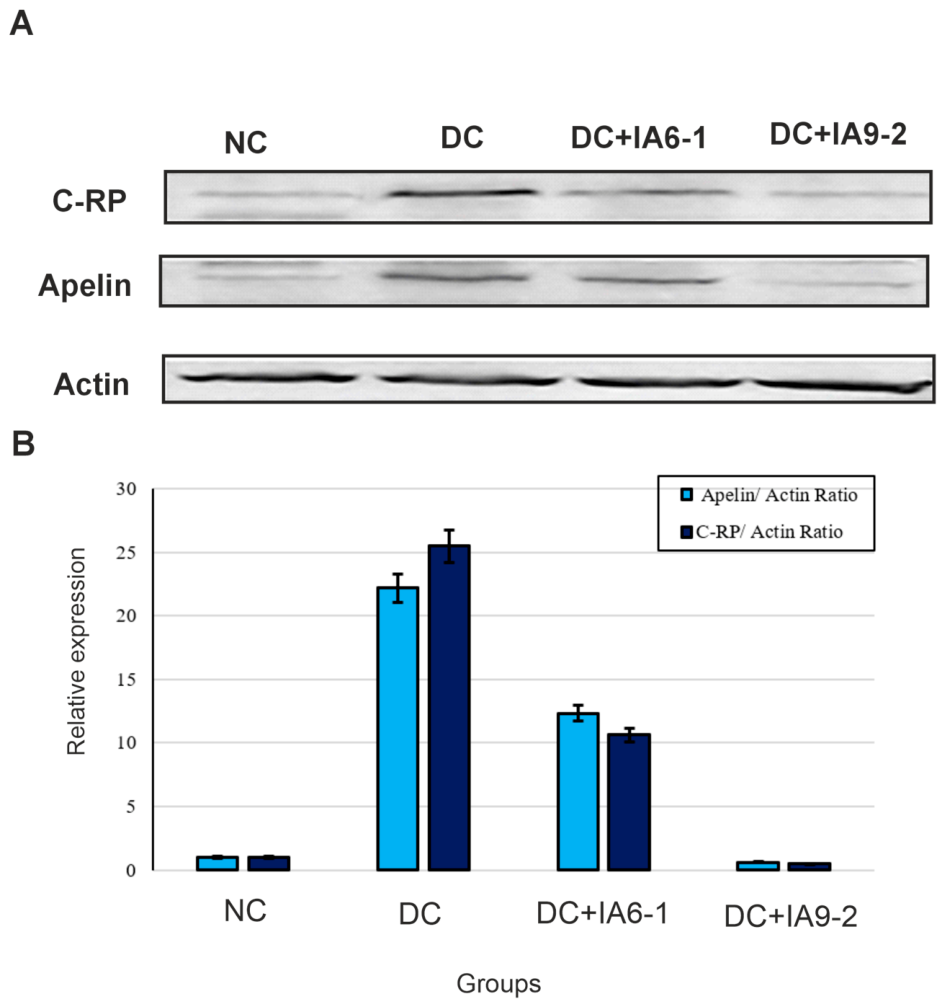
We used the Western blot method to assess the effects of IAEs on the protein expression levels of key factors in inflammation, including C-reactive protein (C-RP) and cardiovascular regulation, including apelin in the STZ-treated rats. As shown in Figure 5A, there is a remarkable increase in the expression of both apelin and C-RP in the STZ-induced rats compared to the control group. After treatment with IAEs, their expressions were down-regulated. Each sample was analyzed three times as technical replicates, with band intensities normalized to actin. The repeated measurements describe technical variability within each sample rather than differences between independent animals. The apelin/actin ratio (Figure 5B) is higher in the STZ-induced rats and the DC+IA6-1 group compared to the control group and the DC+IA9-2 group. Similarly, the C-RP/actin ratio is higher in the STZ-induced rats and the DC+IA6-1 group compared to the control group and the DC+IA9-2 group.
Figure 5.
Effect of IAE on the expression of C-RP and apelin. (A) Representative Western blot data revealed higher intensities of C-RP and apelin protein bands in STZ-induced rats compared to the control and IAE-treated groups. (B) The relative expression levels of the C-RP and apelin proteins were quantified by normalizing with the control group and compared with actin. Actin was used as the protein loading control. Bars show the mean of three technical replicates per sample, and error bars indicate the standard deviation (SD). NC, normal control group; DC, diabetic control group; DC+IA6-1, diabetic control group treated with 200 mg/kg BW of IA6-1; DC+ IA9-2, diabetic control group treated with 200 mg/kg BW of IA9-2.
3.6. Potential Effects of IAEs on Cell Viability and Proliferation
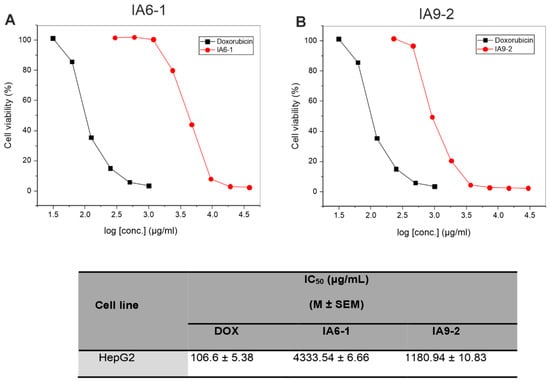
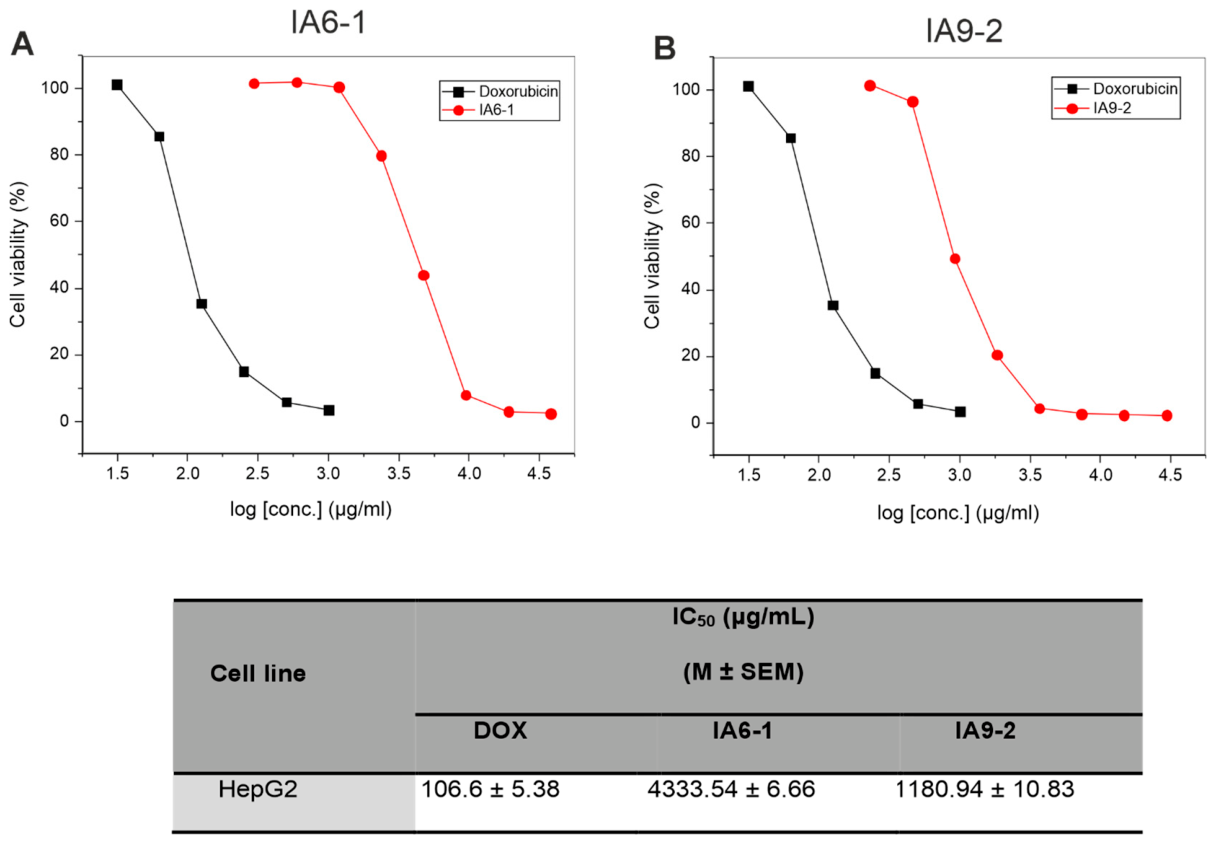
In this study, the cytotoxic effects of I. aquatica extracts (IA6-1 and IA9-2) were evaluated using an MTT assay against HepG2 cancer cell lines. The results showed that the viability of the cancer cells treated with I. aquatica extracts significantly decreased in a dose-dependent manner with the increase in the I. aquatica extracts’ concentration (Figure 6A,B). The IC50 values for IA6-1 and IA9-2 extracts against HepG2 cells were found to be 4333.5 µg/mL and 1180.9 µg/mL, respectively. Doxorubicin had the lowest IC50 value of 106.6 µg/mL. Among the tested extracts, IA9-2 exhibited a stronger inhibitory effect on HepG2 cells than IA6-1, with the IC50 value only 11-fold weaker than the doxorubicin drug, indicating its promising activity on the HepG2 cancer cells.
Figure 6.
Effect of IAEs on cell viability and proliferation of human hepatic cell line (HepG2). (A) Dose-dependent cytotoxic activity of IA6-1 extract on HepG2 cell lines. Cells were exposed to varying concentrations of the extract (from 295.3 to 37,800 μg/mL). (B) Dose-dependent cytotoxic activity of IA9-2 extract on HepG2 cell lines. Cells were exposed to varying concentrations of the extract (from 228.9 to 29,300 μg/mL). HepG2 cells were incubated with the extract for 24 h at 37 °C, and cell viability was assessed using an MTT assay. Doxorubicin was used as a reference anticancer drug.
4. Discussion
The Ipomoea aquatica plant belongs to the Ipomoea genus and is widely used in traditional therapy for many diseases. In our previous study, we fractionated I. aquatica crude extract into fifteen subfractions through vacuum liquid column chromatography. Here, we studied two subfractions, namely, IA6–1 (Dichloromethane/ethyl acetate) (75:25) (v/v) and IA9–2 (Ethyl acetate/methanol) (50:50) (v/v). The phytochemical constituents of the methanolic extract of I. aquatica were measured through standard approaches, and the results revealed the presence of substantial quantities of phenolics, flavonoids, saponins, terpenoids, and steroids. Subsequently, UPLC-QTOF-MS fingerprinting analysis of the fraction IA9-2 recognized the presence of phenolics, such as salicylic acid and dihydroxybenzoic acid, in addition to flavonoids, such as rutin, isoquercitrin, and nicotiflorin [15].
Both I. aquatica fractions (IA6–1 and IA9–2) demonstrated significant radical scavenging activity, resulting in an increase in serum TAC. This observed antioxidant effect aligns with previous findings that highlight the hepatoprotective and antioxidant properties of plant-derived extracts [21,22]. This activity may be attributed to the presence of diverse bioactive constituents within these fractions, including flavonoids, phenolic acids, and terpenes, all of which are well-documented for their antioxidant potential [23,24]. Flavonoids are recognized as potent reducing agents that protect against oxidative reactions within the body [25]. They prevent protein degradation and cellular dysfunction caused by free radicals while enhancing the antioxidant capacity of human cells. Moreover, the antioxidant properties of flavonoids contribute to mitigating cardiovascular disorders, aging-related complications, and other diseases associated with oxidative stress. Therefore, extracting flavonoids from I. aquatica represents a promising approach for producing value-added by-products aimed at improving health outcomes [26].
The diabetic control rats displayed significantly lower serum protein and albumin levels compared to the normal control. In contrast, Groups III and VI showed that both fractions, IA6-1 and IA9-2, restored serum protein and albumin levels to near-normal values but with different effects. Fraction IA6-1 had a more beneficial effect on albumin synthesis, while fraction IA9-2 appeared to have a stimulating effect on the production of total protein. Previous studies have reported that different plant extract fractions can possess different chemical profiles and biological activities [27,28]. Sajak et al. [29] detected metabolite changes with 19 potential biomarkers following administration of I. aquatica ethanolic extract in obese diabetic-induced rats. Therefore, the bioactive compounds present in fractions IA6-1 and IA9-2 may have different mechanisms of action, resulting in their differential effects on liver function parameters and serum biomarkers. Liver-related indicators including AST and ALT were higher in the diabetic group compared with the control and I. aquatica groups. The activities of AST and ALT serve as a connection between carbohydrate and protein metabolism by facilitating the interconversion of metabolic pathway intermediates [30]. Specifically, AST catalyzes the conversion of aspartic acid and α-ketoglutaric acid into oxaloacetic acid and glutamic acid, while ALT catalyzes the conversion of alanine and α-ketoglutaric acid into pyruvic acid and glutamic acid [31]. These reactions ultimately contribute keto acids to the Krebs cycle. Because IA6–1 and IA9–2 lowered AST and ALT levels, it is reasonable to conclude that IA6–1 and IA9–2 reduce hepatocellular injury in diabetic rats and may warrant further investigation as a potential treatment for diabetes mellitus.
The protein composition observed in this study is consistent with the protein types found in normal blood plasma, where albumin and globulin (α1, α2, β, and γ) are the major components [32]. Apelin is a peptide hormone that plays a key role in regulating energy balance and glucose homeostasis [33]. The apparent increase in C-RP and apelin protein expression observed in diabetic animals compared to the control suggests that inflammation may be associated with the development of diabetes and its complications. Previous research has established that C-RP levels are higher in people with diabetes [34], and the present study further supports this finding. The intensity of protein bands detected by Western blotting is proportional to the amount of protein present in the sample [35,36], suggesting that the increased intensity of C-RP and apelin bands observed in STZ-induced rats may be due to higher protein concentrations. The increase in the expression of apelin and C-RP in the STZ-induced rats is consistent with previous studies that have reported an increase in these proteins in diabetes and related complications [37,38]. Dray et al. [39] showed that administered apelin increased glucose utilization in normal and obese insulin-resistant mice. The study establishes a rationale for investigating apelin in metabolic disease, but it does not show that a stronger plasma immunoreactive signal necessarily reflects beneficial or harmful apelin activity in the present model. TNF-α, an inflammatory cytokine elevated during insulin resistance associated with obesity, increases apelin expression in human and mouse adipocytes [40]. In this regard, the expression of the apelin gene in adipose tissue is increased by insulin and TNF-α. Therefore, the role of apelin in the regulation of energy and obesity-related disorders should be given attention in the pathophysiology of these conditions.
Cytotoxicity is the ability of a substance to damage or kill cells, and in vitro cytotoxicity assays promote the use of cultured cells and tissues [41]. Determining the lethal dose of a drug is an essential step in evaluating its anticancer potential. Human cancer cell lines are commonly employed as experimental models in cancer research. Among the available methods, the MTT assay is a widely used method to measure cell viability and proliferation. This assay is based on the ability of viable cells to reduce a yellow tetrazolium salt to a purple formazan product [42]. We measured the IC50 values for doxorubicin and two fractions, IA6-1 and IA9-2, against the HepG2 cell lines. Among the two fractions, IA9-2 reduced HepG2 cell viability, with an IC50 value of 1180.94 ± 10.83 µg/mL, whereas IA6-1 showed relatively low anticancer activity, with an IC50 value of 4333.54 ± 6.66 µg/mL. In comparison, doxorubicin exhibited an IC50 value of 106.6 ± 5.38 µg/mL. Cell growth decreased progressively with increasing concentrations of the tested compounds compared to the control. The differential activity of these compounds across cell lines may be attributed to variations in genetic and molecular characteristics, including differences in the expression of drug targets, transporters, and/or drug-metabolizing enzymes [43]. The observed cytotoxic effects of IA6-1 and IA9-2 suggest that these fractions contain bioactive compounds with potential for drug development. The presence of flavonoids and phenolics in fraction IA9-2 may contribute to its in vitro cytotoxic activity, as these compounds are shown to exhibit potent anticancer effects [44,45]. Notably, IA9-2 exhibited concentration-dependent cytotoxicity, as evidenced by a reduction in HepG2 cell viability with increasing concentrations. This finding is in agreement with previous studies reporting concentration-dependent cytotoxicity of natural compounds against cancer cells [46,47].
5. Conclusions
The results of this study demonstrate that liver function, plasma profile, biochemical parameters, and oxidative stress are significantly altered in STZ-induced diabetic rats. Furthermore, in vivo findings revealed that I. aquatica fractions (IA6-1 and IA9-2) significantly improved biochemical parameters in diabetic rats and effectively compensated for deficits in the antioxidant defense system. Fraction IA9-2 also exhibited in vitro cytotoxic activity by reducing the viability of HepG2 cells in a concentration-dependent manner. Additionally, the study showed changes in C-RP and apelin expressions in STZ-induced diabetic rats, suggesting that inflammation may be associated with the development of diabetes. Overall, these findings support the functional and traditionally reported benefits of I. aquatica in managing diabetes and highlight its potential as a source of bioactive compounds for therapeutic applications. The tumor selectivity of IA6-1 and IA9-2 remains undetermined and requires further evaluation using non-cancerous cell lines.
Author Contributions
Conceptualization, M.H.G., N.M.E.-S. and T.N.H.; methodology, M.H.G., A.M.A.E., T.N.H. and A.S.A.; validation, M.A., N.M.E.-S., A.M.A.E. and T.Y.-M.; formal analysis, T.N.H. and A.S.A.; investigation, M.H.G., M.A., N.M.E.-S., A.M.A.E. and T.Y.-M.; data curation, T.N.H. and A.S.A.; writing—original draft, T.N.H. and A.S.A.; writing—review and editing, M.H.G., N.M.E.-S., T.N.H. and A.S.A.; supervision, N.M.E.-S. and T.N.H. All authors have read and agreed to the published version of the manuscript.
Funding
This research received no external funding.
Institutional Review Board Statement
The animal experiments were approved by Sohag University, Faculty of Science Institutional Animal Care and Use Committee (SU-FS-IACUC), under IACUC Protocol Number SU-FS-33-26.
Data Availability Statement
The original contributions presented in this study are included in the article. Further inquiries can be directed to the corresponding author.
Conflicts of Interest
The authors declare no conflicts of interest.
References
- Tiwari, R.; Singh, R.; Tiwari, S. Study of lipid profile in type 2 diabetes mellitus. J. Assoc. Physicians India 2002, 50, 1133–1136. [Google Scholar]
- International Diabetes Federation. IDF Diabetes Atlas, 10th ed.; International Diabetes Federation: Brussels, Belgium, 2021. [Google Scholar]
- Argaev-Frenkel, L.; Rosenzweig, T. Redox Balance in Type 2 Diabetes: Therapeutic Potential and the Challenge of Antioxidant-Based Therapy. Antioxidants 2023, 12, 994. [Google Scholar] [CrossRef] [Scilit] [PubMed]
- Giacco, F.; Brownlee, M. Oxidative Stress and Diabetic Complications. Circ. Res. 2010, 107, 1058–1070. [Google Scholar] [CrossRef] [Scilit] [PubMed]
- Samuel, A.J.; Mohan, S.; Chellappan, D.K.; Kalusalingam, A.; Ariamuthu, S. Hibiscus vitifolius (Linn.) root extracts show potent protective action against anti-tubercular drug-induced hepatotoxicity. J. Ethnopharmacol. 2012, 141, 396–402. [Google Scholar] [CrossRef] [Scilit] [PubMed]
- Guven, A.; Ciftci, I.H.; Ciftci, T. Non-alcoholic fatty liver disease in type 2 diabetes mellitus. Hepatogastroenterology 2006, 53, 371–376. [Google Scholar]
- Levinthal, G.N.; Tavill, A.S. Liver disease and diabetes mellitus. Clin. Diabetes 1999, 17, 73–93. [Google Scholar]
- Bugianesi, E.; McCullough, A.J.; Marchesini, G. Insulin resistance: A metabolic pathway to chronic liver disease. Hepatology 2005, 42, 987–1000. [Google Scholar] [CrossRef] [Scilit] [PubMed]
- Leclercq, I.A.; da Silva Morais, A.; Schroyen, B.; van Hul, N.; Geerts, A. Insulin resistance in hepatocytes and sinusoidal liver cells: Mechanisms and consequences. J. Hepatol. 2007, 47, 142–156. [Google Scholar] [CrossRef] [Scilit] [PubMed]
- Khleifat, K.M.; Matar, S.A.; Jaafreh, M.; Qaralleh, H.; Al-limoun, M.O.; Alsharafa, K.Y. Essential Oil of Centaurea damascena Aerial Parts, Antibacterial and Synergistic Effect. J. Essent. Oil Bear. Plants 2019, 22, 356–367. [Google Scholar] [CrossRef] [Scilit]
- Kooti, W.; Farokhipour, M.; Asadzadeh, Z.; Ashtary-Larky, D.; Asadi-Samani, M. The role of medicinal plants in the treatment of diabetes: A systematic review. Electron. Physician 2016, 8, 1832. [Google Scholar] [CrossRef] [Scilit] [PubMed]
- Chopra, R.N.; Nayar, S.L.; Chopra, I.C. Glossary of Indian Medicinal Plants; C SIR: New Delhi, India, 1956.
- Dua, T.K.; Dewanjee, S.; Gangopadhyay, M.; Khanra, R.; Zia-Ul-Haq, M.; de Feo, V. Ameliorative effect of water spinach, Ipomea aquatica (Convolvulaceae), against experimentally induced arsenic toxicity. J. Transl. Med. 2015, 13, 81. [Google Scholar] [CrossRef] [Scilit] [PubMed]
- Vasu, K.; Goud, J.V.; Suryam, A.; Charya, M.A.S. Biomolecular and phytochemical analyses of three aquatic angiosperms. Afr. J. Microbiol. Res. 2009, 3, 418–421. [Google Scholar]
- Gad, H.; Tuenter, M.; El-Sawi, E.; Younes, N.; El-Ghadban, S.; Demeyer, E.M.; Pieters, K.; van der Heyden, L.; Mangelings, Y. Identification of some Bioactive Metabolites in a Fractionated Methanol Extract from Ipomoea aquatica (Aerial Parts) through TLC, HPLC, UPLC-ESI-QTOF-MS, and LC-SPE-NMR Fingerprints Analyses. Phytochem. Anal. PCA 2018, 29, 5–15. [Google Scholar] [CrossRef] [Scilit] [PubMed]
- Saha, P.; Selvan, V.; Thamil, M.; Susanta, K.; Mazumder, U.K.; Gupta, M. Antidiabetic and antioxidant activity of methanol extract of Ipomoea reptans Poir aerial parts in streptozotocin-induced diabetic rats. Pharmacologyonline 2008, 1, 409–421. [Google Scholar]
- Benzie, I.F.; Strain, J.J. The ferric reducing ability of plasma (FRAP) as a measure of “antioxidant power”: The FRAP assay. Anal. Biochem. 1996, 239, 70–76. [Google Scholar] [CrossRef] [Scilit] [PubMed]
- Gornall, A.G.; Bardawill, C.J.; David, M.M. Determination of serum proteins by means of the biuret reaction. J. Biol. Chem. 1949, 177, 751–766. [Google Scholar] [CrossRef] [Scilit]
- Laemmli, U.K. Cleavage of structural proteins during the assembly of the head of bacteriophage T4. Nature 1970, 227, 680–685. [Google Scholar] [CrossRef] [Scilit] [PubMed]
- Hames, B.D. Gel Electrophoresis of Proteins: A Practical Approach; OUP: Oxford, UK, 1998; Volume 197. [Google Scholar]
- Ebrahimzadeh, M.A.; Nabavi, S.M.; Nabavi, S.F.; Bahramian, F.; Bekhradnia, A.R. Antioxidant and free radical scavenging activity of H. officinalis L. var. angustifolius, V. odorata, B. hyrcana and C. speciosum. Pak. J. Pharm. Sci. 2010, 23, 29–34. [Google Scholar] [PubMed]
- Sultana, B.; Anwar, F.; Ashraf, M. Effect of extraction solvent/technique on the antioxidant activity of selected medicinal plant extracts. Molecules 2009, 14, 2167–2180. [Google Scholar] [CrossRef] [Scilit] [PubMed]
- Hilal, B.; Khan, M.M.; Fariduddin, Q. Recent advancements in deciphering the therapeutic properties of plant secondary metabolites: Phenolics, terpenes, and alkaloids. Plant Physiol. Biochem. 2024, 211, 108674. [Google Scholar] [CrossRef] [Scilit] [PubMed]
- Karamać, M. Chelation of Cu(II), Zn(II), and Fe(II) by tannin constituents of selected edible nuts. Int. J. Mol. Sci. 2009, 10, 5485–5497. [Google Scholar] [CrossRef] [Scilit] [PubMed]
- Routray, W.; Orsat, V. Microwave-assisted extraction of flavonoids: A review. Food Bioprocess Technol. 2012, 5, 409–424. [Google Scholar] [CrossRef] [Scilit]
- Zhang, X.Y.; Chen, J.; Li, X.-L.; Yi, K.; Ye, Y.; Liu, G.; Wang, S.-F.; Hu, H.-L.; Zou, L.; Wang, Z.-G. Dynamic changes in antioxidant activity and biochemical composition of tartary buckwheat leaves during Aspergillus niger fermentation. J. Funct. Foods 2017, 32, 375–381. [Google Scholar] [CrossRef] [Scilit]
- Ncube, N.S.; Afolayan, A.J.; Okoh, A.I. Assessment techniques of antimicrobial properties of natural compounds of plant origin: Current methods and future trends. Afr. J. Biotechnol. 2008, 7, 1797–1806. [Google Scholar] [CrossRef] [Scilit]
- Khan, I.; Nisar, M.; Ehsanullah, R. Phytochemical screening and biological activities of different extracts of Artemisia scoparia. J. Chem. 2015, 2015, 1–7. [Google Scholar]
- Sajak, A.B.; Mediani, A.; Maulidiani, A.; Mohd Dom, N.S.; Machap, C.; Hamid, M.; Ismail, A.; Khatib, A.; Abas, F. Effect of Ipomoea aquatica ethanolic extract in streptozotocin (STZ) induced diabetic rats via 1H NMR-based metabolomics approach. Phytomed. Int. J. Phyther. Phytopharm. 2017, 36, 201–209. [Google Scholar] [CrossRef] [Scilit] [PubMed]
- Chamundeswaramma, K.V.; Das, P.; Rathnamma, V.V.; Philip, G.H. Activity levels of aspar-tate transaminase (AST) and alaninetransaminase (ALT) in freshwater fish Labeorohita exposed to deltamethrin. Ecol. Environ. Conserv 2010, 16, 145–148. [Google Scholar]
- Benecky, M.J.; Copeland, R.A.; Rava, R.P.; Feldhaus, R.; Scott, R.D.; Metzler, C.M.; Metzler, D.E.; Spiro, T.G. Resonance Raman spectra of the pyridoxal coenzyme in aspartate aminotransferase:Evidence for pyridine protonation and a novel photochemical H/D exchange atthe imine carbon atom. J. Biol. Chem. 1985, 260, 11671–11678. [Google Scholar] [CrossRef] [Scilit]
- Zaias, J.; Mineau, M.; Cray, C.; Yoon, D.; ALTman, N.H. Reference values for serum proteins of common laboratory rodent strains. J. Am. Assoc. Lab. Anim. Sci. JAALAS 2009, 48, 387–390. [Google Scholar] [PubMed]
- Laurell, C.; Dray, I.; Attané, C.; Duparc, C.; Knauf, T.; Valet, C. Apelin, diabetes, and obesity. Endocrine 2011, 40, 1–9. [Google Scholar] [CrossRef] [Scilit] [PubMed]
- Ford, E.S. Body mass index, diabetes, and C-reactive protein among U.S. adults. Diabetes Care 1999, 22, 1971–1977. [Google Scholar] [CrossRef] [Scilit] [PubMed]
- East, M.L.; Dehnhard, M. Chemical Signals in Vertebrates 12; Springer: New York, NY, USA, 2013. [Google Scholar]
- Roberts, K.; Alberts, B.; Johnson, A.; Walter, P.; Hunt, T. Molecular Biology of the Cell, 4th ed.; Garland science: New York, NY, USA, 2002. [Google Scholar]
- Bertrand, C.; Valet, P.; CASTan-Laurell, I. Apelin and energy metabolism. Front. Physiol. 2015, 6, 115. [Google Scholar] [CrossRef] [Scilit] [PubMed]
- Bisoendial, R.J.; Boekholdt, S.M.; Vergeer, M.; Stroes, E.S.; KASTelein, J.J. C-reactive protein is a mediator of cardiovascular disease. Eur. Heart J. 2010, 31, 2087–2091. [Google Scholar] [CrossRef] [Scilit] [PubMed]
- Dray, C.; Knauf, C.; Daviaud, D.; Waget, A.; Boucher, J.; Buléon, M.; Cani, P.D.; Attané, C.; Guigné, C.; Carpéné, C.; et al. Apelin stimulates glucose utilization in normal and obese insulin-resistant mice. Cell Metab. 2008, 8, 437–445. [Google Scholar] [CrossRef] [Scilit] [PubMed]
- Carpéné, C.; Dray, C.; Attané, C.; Valet, P.; Portillo, M.P.; Churruca, I.; Milagro, F.I.; CASTan-Laurell, I. Expanding role for the apelin/APJ system in physiopathology. J. Physiol. Biochem. 2007, 63, 359–373. [Google Scholar] [CrossRef] [Scilit] [PubMed]
- Méry, B.; Guy, J.-B.; Vallard, A.; Espenel, S.; Ardail, D.; Rodriguez-Lafrasse, C.; Rancoule, C.; Magné, N. In Vitro Cell Death Determination for Drug Discovery: A Landscape Review of Real Issues. J. Cell Death. 2017, 10, 1–8. [Google Scholar] [CrossRef] [Scilit] [PubMed]
- Mosmann, T. Rapid colorimetric assay for cellular growth and survival: Application to proliferation and cytotoxicity assays. J. Immunol. Methods 1983, 65, 55–63. [Google Scholar] [CrossRef] [Scilit] [PubMed]
- Kelland, L. The resurgence of platinum-based cancer chemotherapy. Nat. Rev. Cancer 2007, 7, 573–584. [Google Scholar] [CrossRef] [Scilit] [PubMed]
- Kopustinskiene, D.M.; Jakstas, V.; Savickas, A.; Bernatoniene, J. Flavonoids as Anticancer Agents. Nutrients 2020, 12, 457. [Google Scholar] [CrossRef] [Scilit] [PubMed]
- Huang, W.Y.; Cai, Y.Z.; Zhang, Y. Natural phenolic compounds from medicinal herbs and dietary plants: Potential use for cancer prevention. Nutr. Cancer 2010, 62, 1–20. [Google Scholar] [CrossRef] [Scilit] [PubMed]
- Prasad, S.; Tyagi, A.K.; Aggarwal, B.B. Recent developments in delivery, bioavailability, absorption and metabolism of curcumin: The golden pigment from golden spice. Cancer Res. Treat. 2014, 46, 2–18. [Google Scholar] [CrossRef] [Scilit] [PubMed]
- Bishayee, A. The role of inflammation and liver cancer. Adv. Exp. Med. Biol. 2014, 816, 401–435. [Google Scholar] [CrossRef] [Scilit] [PubMed]
Disclaimer/Publisher’s Note: The statements, opinions and data contained in all publications are solely those of the individual author(s) and contributor(s) and not of MDPI and/or the editor(s). MDPI and/or the editor(s) disclaim responsibility for any injury to people or property resulting from any ideas, methods, instructions or products referred to in the content. |
© 2026 by the authors. Licensee MDPI, Basel, Switzerland. This article is an open access article distributed under the terms and conditions of the Creative Commons Attribution (CC BY) license.