


Abstract
Destinations increasingly offer curated leisure tours to business visitors, but little is known about the people who take part in them. This foundational study profiles participants in pilot bleisure tours run by the Seoul Metropolitan Government, compares three participant types (meeting and exhibition attendees, corporate business travelers, and accompanying persons), and examines how participants evaluate the tours. Post-tour survey data from 554 participants (May–September 2026) were analyzed with Holm-corrected chi-square and Kruskal–Wallis tests and partial least squares structural equation modeling. Participants were mostly first-time visitors from North America and Europe with one or two days of free time who mostly joined because they had spare time. The participant types differed in travel party, region of origin, and free time; no significant differences were detected in leisure preferences, information sources, concerns, or desired support, although questionnaire changes and unequal subgroups limit these comparisons. Tour quality was positively associated with satisfaction (β = 0.399) and recommendation (β = 0.332), with a small indirect path through satisfaction. Evaluations differed more across tour programs than across participant types. The findings provide a baseline for designing and promoting bleisure tours for business visitors.
1. Introduction
Bleisure, the combination of business and leisure within the same trip, has moved from a niche practice to a mainstream feature of business travel (Lichy & McLeay, 2018). Its rise reflects broader changes in how work and travel are organized. Hybrid work has blurred the boundary between working time and personal time (Yoon & Jang, 2026), and business trips are increasingly treated as opportunities for rest, recovery, and personal experience rather than purely instrumental journeys (Batala & Slevitch, 2024; Unger et al., 2016). At the same time, business travel is becoming more valuable but more selective: global business travel spending is projected to reach USD 1.71 trillion in 2026, a 7.2% increase over 2025, while the number of trips is expected to grow by only 1.3% (GBTA, 2026). Employers are adapting to this shift. In a 2025 poll of corporate travel buyers, 43% reported a clearly defined bleisure policy in their organization, and 71% saw or expected improved employee satisfaction and well-being as a benefit of bleisure (GBTA, 2025). Research likewise shows that leisure during business trips helps travelers adjust to the destination, increases their trip satisfaction, and yields both work-related and personal benefits (Liu et al., 2024; Ramsey et al., 2025; Tsaur & Tsai, 2023). Flexible work arrangements are further blurring the line between business and leisure travel (Miao et al., 2024), and a growing number of business event participants now combine their trips with family travel (Zhang et al., 2026). For destinations, bleisure therefore offers a way to convert business visits into additional tourism demand and to introduce the destination to visitors who may later return for leisure.
Destinations have begun to compete for this market, and their efforts increasingly target business visitors rather than individual leisure tourists. Convention bureaus and national tourism organizations now design products and incentives that encourage meeting delegates and corporate travelers to explore the destination and extend their stay. The Thailand Convention and Exhibition Bureau, for example, expanded its “Meet Well in Thailand” campaign for 2026, offering business event delegates discounts on wellness programs, shopping, and dining through more than 130 partner providers in 14 destinations (TTGmice, 2025b). The Hong Kong Tourism Board distributed passes to a major food and wine festival to participants of concurrent conferences and exhibitions in order to integrate leisure into their business trips (TTGmice, 2025a). In Japan’s capital region, convention bureaus and exhibition centers have launched a range of marketing initiatives to encourage business travelers to spend more on leisure, although these initiatives were found to be implemented in a fragmented way (Chung et al., 2020). Academic studies have also begun to assess cities’ competitiveness as bleisure destinations (Caicedo-Barreth et al., 2020), and research on trade fair visitors in Thessaloniki shows that even attendees of specialized business fairs often pursue entertainment alongside their professional goals (Kourkouridis et al., 2024).
Seoul has entered this competition from a strong position. The Republic of Korea hosted 491 international association meetings in 2025, the second-highest number worldwide, and Seoul ranked third among cities with 216 meetings (Union of International Associations [UIA], 2026). Seoul was named Asia’s best leisure destination by the travel magazine Global Traveler in 2025 (Korea JoongAng Daily, 2025), and in 2026 it ranked seventh among global bleisure destinations, with business travelers’ weekday hotel bookings up 67% and Friday check-ins up 54% year-on-year (Korea Times, 2026). Building on these strengths, the Seoul Metropolitan Government launched a bleisure activation project in 2025 that aims to convert business visitors’ time before and after work into tourism demand. In 2026, the project piloted short guided tours in two formats: open-recruitment pilot tours for business visitors and their companions, recruited through an online platform, consultations, and promotional booths at international congresses, and hotel-linked pilot tours (“SEOUL, After Business”) developed with international hotels for their corporate guests.
Despite this practical momentum, research on bleisure offers limited guidance for destinations that design such programs, and its findings are not fully consistent. Existing studies have described bleisure motivations and typologies (Lichy & McLeay, 2018), constraints and facilitators (Rittichainuwat et al., 2025), the experience of balancing work and leisure (Batala & Slevitch, 2024; Unger et al., 2016), and the effects of leisure on travelers’ well-being and satisfaction (Ramsey et al., 2025). It remains unclear whether business visitors form distinct segments with different leisure needs: typology studies distinguish bleisure travelers by motivation (Lichy & McLeay, 2018), and business tourism is commonly divided into event attendees, corporate travelers, and accompanying persons (Davidson, 2019), whereas Harris and Pressey (2021) argue that the presumed idiosyncrasy of business tourists is largely a myth. A recent systematic review of bleisure scholarship in Africa concluded that the field remains emergent and exploratory, relies mainly on descriptive and qualitative designs, and gives little attention to destination planning and governance (Ndita & Bama, 2026). Two gaps follow. First, most studies treat bleisure as a self-organized activity of individual travelers, and there is little quantitative information on who actually joins the curated programs that destinations now offer: their trip conditions, leisure preferences, information sources, and concerns. Second, it is unknown whether different types of business visitors join such programs for different reasons and with different needs, which matters for how destinations target and design them. This lack of evidence limits the ability of destinations to design and promote such programs effectively.
This study addresses these gaps using post-tour survey data from 554 international participants in Seoul’s pilot bleisure tours between May and September 2026. As a foundational study, it pursues three objectives: (1) to profile bleisure tour participants in terms of demographics, trip characteristics, leisure preferences, information sources, participation reasons, concerns, and desired support; (2) to compare three participant types, namely meeting and exhibition (MICE) attendees, corporate business travelers, and accompanying persons; and (3) to describe how participants evaluate the tours and how tour quality is associated with satisfaction and recommendation. The study provides an empirical baseline on a little-studied market, adds evidence from an actual destination program to the debate on whether business visitors form distinct segments, and translates the findings into guidance for DMOs, convention organizers, and hotels that can be tested in future programs.
2. Literature Review and Hypotheses
2.1. Bleisure and Business Visitors
Bleisure refers to the combination of business and leisure activities within a single trip (Lichy & McLeay, 2018). Business trips have long been recognized as more than instrumental: business travelers experience moments of relaxation and novelty around work (Unger et al., 2016; Ye & Xu, 2020), conference attendees report leisure motives alongside professional ones (Tretyakevich & Maggi, 2012), and bleisure episodes become an important part of how business trips are remembered (Unger & Uriely, 2022). Bleisure travelers plan more carefully and fit leisure into short windows (Batala & Slevitch, 2024), and leisure exploration helps international business travelers adjust to the destination and improves their trip satisfaction (Ramsey et al., 2025). Research on related hybrid forms such as workations similarly links work-embedded travel experiences to travelers’ life satisfaction (Yoon & Jang, 2026). Tsaur and Tsai (2023) developed a scale to measure the bleisure travel experience, and Liu et al. (2024) showed that business travel can deliver both work-related and personal benefits when leisure is integrated into the trip. The evidence on the consequences of such leisure is mixed: travel benefits can reduce work–leisure conflict (Liu et al., 2024), but business trips can also deplete well-being (Ye & Xu, 2020), and combining business events with family travel creates work–family conflicts (Zhang et al., 2026). A common thread is perceived control: leisure is beneficial when travelers can decide how and when it fits around work (Liu et al., 2024; Zhang et al., 2026).
Business tourism comprises several segments, including participants in meetings, conferences, and exhibitions, corporate travelers on meetings or inspections, and accompanying persons who travel with them (Davidson, 2019). What these visitors have in common is that leisure must fit around a schedule set by others. Time scarcity, work obligations, unfamiliarity with the destination, language barriers, and difficulties in booking are recurring constraints on bleisure, whereas organizer support, reliable information, and attractive activities act as facilitators (Pinho & Marques, 2021; Rittichainuwat et al., 2025). These constraints correspond to the intrapersonal, interpersonal, and structural levels of leisure constraints theory (Crawford et al., 1991). Organized tours address the structural level directly: they provide information, language support, transport, and a ready-made itinerary within a fixed time slot. As a result, bleisure becomes a managed service whose quality can be evaluated and improved. In the bleisure tourism experience chain proposed by Chung et al. (2020), such ancillary programs are a key link through which destinations and event organizers can extend business travelers’ experiences beyond the business event and capture additional spending. Such tours may also strengthen travelers’ sense of control over scarce free time, which Zhang et al. (2026) identified as a resource that helps business travelers cope with competing demands during a trip.
Despite this practical relevance, quantitative evidence on who joins curated bleisure tours is scarce. Earlier studies profiled business travelers’ bleisure intentions or motivations in general (Lichy & McLeay, 2018; Rittichainuwat et al., 2025) or examined conference attendees’ interest in tourism offerings (Beardsley et al., 2019; Severt et al., 2007), but not the participants of tours that destinations provide. Because the objectives and leisure interests of business visitors vary with the type of event and visitor (Kourkouridis et al., 2024), and because research on bleisure in some regions, such as Africa, remains descriptive and fragmented (Ndita & Bama, 2026), a basic profile of these participants is a prerequisite for product design and targeted promotion (Ezeuduji, 2024). We therefore pose the first research question:
RQ1. What are the demographic and trip characteristics, leisure preferences, information sources, participation reasons, concerns, and desired support of participants in bleisure tours?
Business visitors are not a single group. Meeting and exhibition attendees follow an event program set by organizers, often travel alone, and are reached through event channels; corporate travelers on inspection tours, business meetings, or exchange programs travel on itineraries arranged by their companies, often with colleagues; and accompanying persons have more discretionary time but depend on the schedule of the business traveler they accompany (Davidson, 2019; Zhang et al., 2026). Research on trade fairs shows that the objectives and leisure interests of business visitors vary with the type of visitor (Kourkouridis et al., 2024), Korean exhibition research has found that attendees of different exhibition types differ in their characteristics and in the media they use for information (Kim, 2006), and convention research has identified leisure motives specific to attendees (Tretyakevich & Maggi, 2012). Conversely, Harris and Pressey (2021) argue that business tourists are less distinct from other tourists than often assumed. Whether these types differ in who they are, how much free time they have, what they want to do, and where they look for information is therefore an open question, and the answer determines whether destinations need segment-specific bleisure products or a common product with different distribution channels. We therefore ask:
RQ2. How do MICE attendees, corporate business travelers, and accompanying persons who join bleisure tours differ in their profiles, leisure preferences, information sources, and needs?
2.2. Hypothesis Development: Tour Quality, Satisfaction, and Recommendation
Because the tours examined here are new products, how participants evaluate them is also part of understanding the market. The hypotheses draw on the service quality–satisfaction–behavioral intention framework, which models the evaluation of a service as a sequence from cognitive appraisal to affective response to conative outcome (Cronin et al., 2000; Oliver, 1980). Perceived service quality is a cognitive, attribute-based judgment of how well specific elements of a service perform, whereas satisfaction is a more holistic, partly affective evaluation of the consumption experience as a whole (Baker & Crompton, 2000; Gotlieb et al., 1994). The two constructs are related but distinct, and their ordering matters: experimental and field evidence indicates that quality judgments precede and shape satisfaction, and that both feed into behavioral intentions such as loyalty and word of mouth (Gotlieb et al., 1994; Zeithaml et al., 1996). Research on attribute-level performance supports the same ordering: evaluations of individual service attributes are distinct from, and antecedent to, the overall satisfaction judgment, which also reflects elements of the experience that no single attribute captures (Mittal et al., 1998; Oliver, 1993). In tourism, this chain has been supported at the level of individual services, festivals, and destinations (Baker & Crompton, 2000; Žabkar et al., 2010), and it provides a parsimonious structure for evaluating a newly introduced tourism product such as a curated bleisure tour.
Guided tours are a well-suited setting for this framework because their performance is delivered through a small set of observable attributes. Research on package and guided tours has identified the itinerary, the guide’s interpretation and conduct, transport, and the overall organization of the tour as the core service elements that tourists evaluate (Chan et al., 2015; Huang et al., 2010). These same elements constitute the four quality attributes measured in this study. Because the attributes were rated on a satisfaction scale, they are treated here as attribute-level performance evaluations, the form in which perceived quality is commonly measured in tour research (Huang et al., 2010).
Studies of guided and package tours consistently show that the performance of tour attributes is closely related to tourists’ satisfaction. Huang et al. (2010) found that tour guide performance in Shanghai package tours predicted satisfaction with both the guiding service and the tour experience. Chan et al. (2015) showed, for Chinese tourists in Hong Kong, that tour guiding was the element most strongly associated with tourists’ satisfaction with the tour services, while other elements such as leisure activities shaped satisfaction with the overall experience. In a study of senior Korean tourists on overseas package tours, Hwang et al. (2023) likewise found that perceived tour quality was positively related to tour satisfaction. The relationship also holds in business event settings. A meta-analysis of convention research concluded that attendees’ perceptions of service quality outweigh perceived value in determining their satisfaction (Jung & Tanford, 2017), and the perceived performance of convention components predicts attendee satisfaction (Severt et al., 2007). Among Korean exhibition attendees, perceived service quality has likewise been related to both satisfaction and behavioral intentions (Han, 2014). The relationship should be particularly pronounced for business visitors. Their free time is short, so a tour that wastes it through poor routing, waiting, or disorganization is costly, and their professional routines accustom them to well-organized services against which a tour is likely to be judged. A well-designed itinerary, a competent guide, reliable transport, and smooth operations should therefore be reflected in satisfaction with the tour.
H1.
Bleisure tour quality is positively associated with tour satisfaction.
Service quality is also related to behavioral intentions directly, not only through satisfaction. Zeithaml et al. (1996) showed that customers who perceive high service quality are more likely to say positive things about the provider and to recommend it to others, and Cronin et al. (2000) found that quality had a direct effect on behavioral intentions in several service industries, in addition to its indirect effect through satisfaction. In tourism, Baker and Crompton (2000) found that festival performance quality was related to behavioral intentions both directly and through satisfaction, and Chan et al. (2015) reported that behavioral intentions were shaped primarily by the quality of guide services. Hwang et al. (2023) similarly found a direct relationship between tour quality and word of mouth.
There are reasons to expect a substantial direct association in the bleisure context. Recommending a tour to a colleague or fellow delegate is, in effect, advice on how to use scarce free time on a business trip. Such advice is likely to rest on concrete, communicable performance information, such as whether the itinerary was well chosen and the operation punctual, rather than only on a general feeling of enjoyment (Zeithaml et al., 1996). Business visitors also recommend within professional networks, where the recommender’s credibility is at stake, which further favors judgments that can be justified by observable performance. In addition, word of mouth among business travelers and conference attendees is an important channel for business event and destination choice (Jung & Tanford, 2017; Tanford et al., 2012). We therefore propose:
H2.
Bleisure tour quality is positively associated with recommendation intention.
Satisfaction is one of the most established antecedents of word of mouth. Satisfied customers are more likely to share positive experiences, and the relationship between satisfaction and word of mouth has been documented across service industries (Anderson, 1998). In tourism, satisfaction predicts intentions to recommend at the level of destinations, festivals, and tours (Baker & Crompton, 2000; Žabkar et al., 2010), and Hwang et al. (2023) showed that tour satisfaction was positively related to tourists’ word of mouth about package tours. In convention settings, satisfied attendees are more loyal and more likely to promote the event (Jung & Tanford, 2017; Tanford et al., 2012). For bleisure travelers, a satisfying leisure episode is also an important part of how a business trip is remembered and recounted afterwards (Unger & Uriely, 2022), which gives satisfied participants material to share with colleagues and companions. Accordingly, business visitors who are satisfied with a bleisure tour should be more willing to recommend it.
H3.
Tour satisfaction is positively associated with recommendation intention.
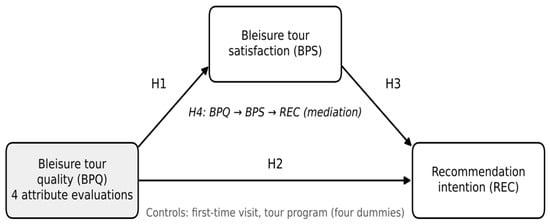
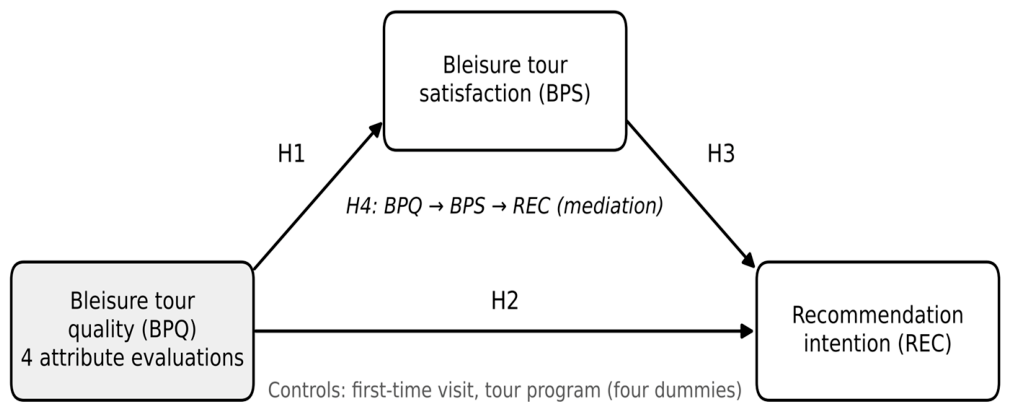
Taken together, H1–H3 imply that satisfaction carries part of the association between quality and recommendation. Gotlieb et al. (1994) showed that perceived quality relates to behavioral intentions through satisfaction, and Cronin et al. (2000) found that models including both the direct and the satisfaction-mediated paths from quality to behavioral intentions fit the data best. In tourism, Baker and Crompton (2000) and Žabkar et al. (2010) reported that satisfaction partly mediates the relationship between quality and behavioral intentions. Because the direct association between quality and recommendation is expected to be substantial in the bleisure context (H2), we expect partial rather than full mediation, with a comparatively small indirect path (see Figure 1).
Figure 1.
Research model. BPQ = bleisure tour quality; BPS = bleisure tour satisfaction; REC = recommendation intention. Control variables: first visit and tour program.
H4.
Tour satisfaction mediates the association between tour quality and recommendation intention.
Figure 1 presents the research model. In addition, we describe whether evaluations differ across participant types and tour programs.
3. Methods
3.1. Research Context and Data Collection
Data were collected through the Seoul Bleisure Tourism Activation Project, which was commissioned by the Seoul Metropolitan Government and implemented by a contracted travel agency. The project ran from January to September 2026; January to mid-April was a preparation period, and the tours began on 18 April 2026. All tours were pilot runs to develop a bleisure tour product rather than regular commercial tours. Open-recruitment pilot tours were offered to business visitors and their companions, who were recruited through the project’s online platform, tourism consultations, and promotional booths at international congresses held in Seoul. Hotel-linked pilot tours were co-developed with international hotels and offered to their corporate guests on specific dates. The tours were partly free: guide and vehicle costs were covered by the project, whereas admission fees, meals, and other expenses were paid by participants. Typical itineraries included half-day heritage tours (e.g., Jogyesa Temple, Gyeongbokgung Palace with hanbok experience, and Gwangjang Market), museum and city tours, and evening tours combining the Han River bus, a riverside park, and local food experiences.
Data were collected with an anonymous English-language online questionnaire, which did not ask for names or contact details, between 18 May and 19 September 2026; participants in tours held between 18 April and 17 May are not included in the data. At the end of each tour, participants received a QR code linking to the questionnaire, which covered their visit (visit history, main purpose, party size, gender, age, and nationality), their trip (length of stay and planned free time for leisure), leisure preferences, information sources, and their evaluation of the tour. All items were therefore answered after the tour, and trip characteristics and leisure preferences were reported retrospectively. A revised questionnaire was used from August onward (the second half); it added items on leisure planning, preferred program timing, concerns, desired support for a longer stay, tourism and leisure spending, participation reasons, and the tour’s influence on sightseeing and stay extension. These items were therefore answered only by second-half respondents. In both versions, the multiple-response items asked respondents to select all applicable options and set no limit on the number of selections. Nevertheless, almost all first-half respondents selected the same number of options (most often five leisure activities, three types of dining, and four information sources), whereas most second-half respondents selected one or two; the reason for this difference could not be determined. Because first-half respondents selected more options, percentages are higher in the first-half data, pooled percentages depend on the mix of the two versions and are not directly comparable with external figures, and pooled comparisons of participant types are confounded with questionnaire version; the participant types are therefore compared mainly within the first half (Section 4.2). The questionnaire also contained items on respondents’ evaluations of Seoul as a destination; these items are analyzed in a separate study and are not used here. The authors obtained the anonymized data from the project for secondary analysis; personally identifying information collected for tour registration was removed before the data were shared.
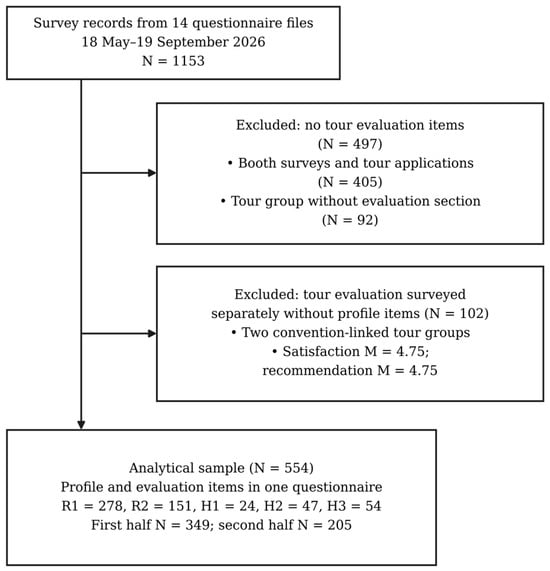
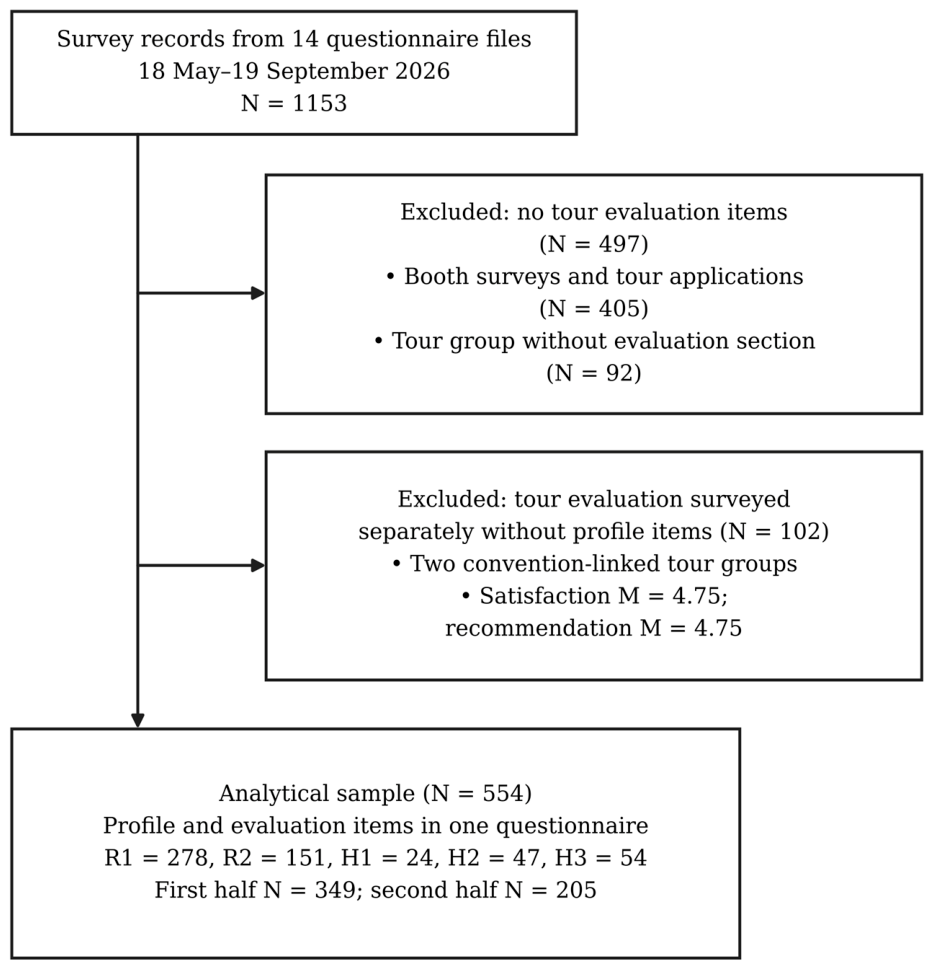
The analysis was restricted to tour participants who answered both the profile items and the tour evaluation items; these inclusion criteria were defined by the authors before the analysis. Because the questionnaire was distributed only at the end of each tour, completing it confirms participation, and characteristics and evaluations come from the same person. Figure 2 shows the sample flow. The project dataset contained 1153 records from 14 survey files. Of these, 497 were excluded because their questionnaires contained no tour evaluation items: 405 were surveys and tour applications collected mainly at convention booths, for which participation could not be confirmed, and 92 came from a convention-linked tour group whose questionnaire did not include the tour evaluation section. A further 102 records from two convention-linked tour groups were excluded because tour satisfaction was surveyed separately without the profile items, so the evaluations could not be matched to participant characteristics; these participants rated the tours similarly to the analytical sample (satisfaction: M = 4.75 vs. 4.62; recommendation: M = 4.75 vs. 4.73). The final sample consisted of 554 participants from five tour programs: open-recruitment pilot tours in the first half (R1, N = 278) and second half (R2, N = 151) and three hotel-linked programs (H1, one hotel, n = 24; H2, two hotels, n = 47; H3, one hotel, two sessions, N = 54); 205 participants (R2 and H3) answered the revised questionnaire. Because the tours were pilots run for product development, the sample is defined by confirmed participation rather than by a sampling frame.
Figure 2.
Sample flow.
3.2. Measures
Participant types were derived from the main purpose of the visit: MICE attendees (attending a meeting or conference, or attending or visiting an exhibition; N = 177), corporate business travelers (industrial inspection or business tour, business meeting, visiting a branch office, or a corporate exchange event; N = 304), and accompanying persons (tourism as an accompanying person; N = 73). Region of origin was coded from an open nationality question into world regions. Leisure activities, dining, information sources, concerns, and desired support were multiple-response items (“select all that apply”); the other profile items were single-choice items. The wording and response options of all items used are given in Appendix A (Table A1 and Table A2). All evaluation items used five-point scales. Tour quality (BPQ) was measured with four items asking how satisfied respondents were with the tour program and itinerary, the guide and interpretation, transportation, and the tour operation and overall process (1 = very dissatisfied, 5 = very satisfied). These items capture attribute-level performance evaluations (Mittal et al., 1998; Oliver, 1993), consistent with performance-based measures of guided tour quality (Huang et al., 2010). Because both these items and the global satisfaction item use a satisfaction scale, the two constructs are close, and H1 is interpreted as the degree to which the overall evaluation reflects attribute performance. Tour satisfaction (BPS) was measured with the item “How satisfied were you overall with the Seoul Bleisure tour experience?” and recommendation intention (REC) with “Would you recommend this Bleisure tour experience to others?” (1 = definitely no, 5 = definitely yes). Single-item measures are appropriate for concrete constructs such as global satisfaction and behavioral intentions (Bergkvist & Rossiter, 2007; Diamantopoulos et al., 2012), but their reliability cannot be estimated.
3.3. Data Analysis
Analyses were conducted with IBM SPSS Statistics 29 and SmartPLS 4. Participant characteristics (RQ1) were summarized with frequencies and percentages. Differences between participant types (RQ2) were tested with chi-square tests (Cramér’s V) and, for length of stay, a Kruskal–Wallis test. Because the number of choices made in the multiple-response items differed between the first- and second-half questionnaires, type differences in these items were tested with binary logistic regressions that entered questionnaire version in the first block and participant type in the second block (likelihood ratio test). Items asked only in the second half were compared between MICE attendees and corporate travelers, because only six accompanying persons answered them. All p values in the type comparisons were adjusted with the Holm procedure (Holm, 1979). Because participant type overlapped with questionnaire version, the multiple-response items were also compared among first-half respondents only, who all answered the same version (MICE attendees, N = 49; corporate travelers, N = 233; accompanying persons, N = 67). For these and the second-half comparisons, unadjusted p values and Cramér’s V with bootstrap 95% confidence intervals are reported in Supplementary Tables S1 and S2.
Tour evaluations were described with means, medians, and top-box percentages, and differences across participant types and tour programs were tested with Kruskal–Wallis tests (ε2) followed by pairwise comparisons with Bonferroni correction, with Holm adjustment across tests. Differences by gender, age, region, visit history, and free time were examined in the same way, and differences that remained significant were re-examined with general linear models controlling for tour program. Because session identifiers were not recorded, sessions were approximated by combinations of tour program and survey date (112 clusters; median size 4, range 1–24), and non-independence of ratings within sessions was assessed with intraclass correlations from random-intercept mixed models. H1–H4 were tested with partial least squares structural equation modeling, which accommodates single-item constructs and non-normal data (Hair et al., 2019, 2022). The model included first visit and tour program (four dummy variables) as control variables and was estimated with the path weighting scheme; significance was assessed with 5000 bootstrap subsamples and 95% percentile confidence intervals, and mediation was classified following Zhao et al. (2010). Because BPQ combines four attributes, the contribution of each attribute was also examined by entering the itinerary, guide, transport, and operation ratings separately as predictors of satisfaction and recommendation. Differences between the attribute coefficients were tested with Wald tests. The robustness of the structural results was examined in five ways: (a) the paths were re-estimated in SPSS with generalized estimating equations (GEE) on the composite quality score, with sessions as clusters and robust standard errors, to account for non-independence; (b) BPQ was specified as a composite (Mode B) construct in SmartPLS; (c) the model was re-estimated for business travelers only, excluding accompanying persons; (d) ordinal logistic regressions were estimated in SPSS as a simpler model that respects the ordinal response scale; and (e) the attribute-level models described above were estimated with GEE, with sessions as clusters. Common method bias cannot be ruled out for the evaluation items, which were reported at the same time; all full collinearity VIFs were below 3.3 (Kock, 2015).
4. Results
4.1. Participant Profile and Types
Table 1 profiles the 554 participants. Most were women (60.3%) and aged 30 to 49 (61.9%). They came mainly from North America (43.7%), Europe (23.8%), and Asia (18.1%), and nearly four in five (79.2%) were visiting Seoul for the first time. Corporate business travelers were the largest group (54.9%), followed by MICE attendees (31.9%) and accompanying persons (13.2%). The median planned stay was 5 nights (M = 5.76), but free time for leisure was limited: 46.2% planned one day or less, 30.9% two days, and only 18.8% three days or more.
The three participant types did not differ significantly in gender, age, visit history, length of stay, or tour format, but differed in three respects. First, their travel parties differed sharply (V = 0.52): MICE attendees most often traveled alone (41.7%), corporate travelers in pairs (51.3%), and accompanying persons in groups of four or more (84.9%). This difference is partly definitional, because accompanying persons travel with the person they accompany. Second, MICE attendees came more often from Asia and other regions (46.3% combined, compared with 27.2% of corporate travelers). Third, MICE attendees had less free time: 37.9% planned only half a day, compared with 15.1% of corporate travelers and 8.2% of accompanying persons. Because MICE attendees made up most of the second-half participants, part of this difference reflects the timing of the programs: free time was shorter among second-half participants in all three groups.
Table 1.
Profile of participants by participant type (%).
Table 2.
Leisure preferences, information sources, and needs by participant type (%).
4.2. Leisure Preferences, Information Sources, and Needs
Table 2 summarizes participants’ leisure preferences and information sources. City landmarks and city tours (63.0%), shopping (54.9%), food tourism (46.6%), and heritage sites (42.4%) were the most frequently selected activities, and general Korean restaurants (66.1%) and street food areas (51.6%) the most frequently selected dining options; because some categories overlap (e.g., heritage sites and cultural performances), these rankings indicate broad preferences rather than a strict order. Portal sites (58.6%) and travel review platforms (41.0%) were the most used information sources, followed by video platforms, generative AI services, Instagram, and word of mouth, whereas public institution websites were used by only 9.9%. The hotel concierge option was offered only in the first-half questionnaire and was selected by 56.4% of the first-half respondents to whom it was offered. Because the two questionnaire versions elicited different numbers of selections, pooled percentages understate the use of some sources and are not compared with external figures; among first-half respondents, for example, 47.0% used generative AI services.
Among the 205 second-half respondents, 85.4% had considered leisure when planning the trip. The most common reason for joining the tour was having free time during the business trip (44.4%), followed by learning about the program through the event organizer or hotel (23.4%) and interest in Seoul’s tourism experiences (21.5%). Weekday evenings were the most preferred time for such programs (48.3%). The most frequently cited concerns were lack of tourism information (26.5%), language barriers (23.3%), transport (20.6%), and reservations and payment (19.6%). Transport support (35.1%), small-group or customized tours (25.4%), and discounts (22.4%) were the most desired incentives for staying longer. Most respondents reported spending USD 300 or more per person on tourism and leisure (64.8%). Finally, 64.4% said the tour had at least somewhat influenced their decision to go sightseeing, and 11.7% said they had extended their stay because of it; this is a retrospective self-report given at the end of the tour.
In contrast to their travel parties and free time, no significant differences between the participant types were detected in their leisure preferences, dining preferences, information sources, participation reasons, preferred timing, concerns, desired support, spending, or the tour’s influence once multiple testing and questionnaire version were taken into account (all pHolm > 0.09). These comparisons are limited in two ways. First, participant type overlapped with questionnaire version, because most MICE attendees answered the revised questionnaire. Among first-half respondents, who all answered the same version, the large pooled contrasts in Table 2 largely disappeared (e.g., wellness: MICE attendees 51.0%, corporate travelers 54.1%, accompanying persons 61.2%; video platforms: 59.2%, 60.1%, and 65.7%), and the largest unadjusted differences, for word of mouth (V = 0.16, 95% CI [0.08, 0.25]), Instagram (V = 0.14, [0.06, 0.26]), and city landmarks (V = 0.14, [0.06, 0.23]), did not survive Holm adjustment (Table S1). Second, the items asked only in the second half compared MICE attendees (N = 128) with corporate travelers (N = 71) only, because just six accompanying persons answered them; the largest difference, for language barriers (28.8% vs. 15.4%; unadjusted p = 0.042, V = 0.15), did not survive adjustment (Table S2). Because the subgroups were unequal and partly small, the confidence intervals do not exclude small-to-moderate differences; these results therefore show that no significant differences were detected, not that the types share the same preferences.
4.3. Tour Evaluations
Tour evaluations were very favorable (Table 3). The median of every item was 5, and between 69.7% and 81.4% of participants chose the highest category for each item; guide and interpretation received the highest mean rating (M = 4.77) and the itinerary the lowest (M = 4.67). These ceiling effects limit the variance available for detecting differences. MICE attendees rated tour quality, the itinerary, the guide, and operations lower than the other two types, but satisfaction and recommendation did not differ after adjustment. Most MICE attendees took part in the second-half programs, and when tour program was controlled, the type differences were no longer significant (all p > 0.20); because participant type and program overlap, the two cannot be fully separated.
Table 3.
Tour evaluations overall and by participant type.
Evaluations differed more across tour programs than across participant types (Table 4). The H2 hotel-linked tours and the first-half open-recruitment tours (R1) received the highest ratings and the second-half programs (R2 and H3) the lowest, with medium effects for tour quality (ε2 = 0.140) and the itinerary (ε2 = 0.135) and small effects for satisfaction (ε2 = 0.032) and recommendation (ε2 = 0.029). Ratings clustered modestly within sessions (ICC = 0.023–0.117). No evaluation differed significantly by gender, age, region of origin, or visit history after Holm adjustment. Participants with one day or less of free time rated tour quality and the itinerary lower (pHolm < 0.01; n = 531), but they were concentrated in the second-half programs, and the differences were no longer significant when tour program was controlled (tour quality: b = −0.025, p = 0.520; itinerary: b = −0.093, p = 0.102).
Table 4.
Tour evaluations by tour program (means).
4.4. Tour Quality, Satisfaction, and Recommendation
The measurement model of BPQ was adequate though modest (loadings 0.670–0.781; α = 0.703; ρC = 0.818; AVE = 0.530), and the square root of its AVE (0.728) exceeded its correlations with BPS (0.410) and REC (0.391), with HTMT values below 0.85 (Henseler et al., 2015). Because BPS and REC are single items, this evidence of discriminant validity is limited. Tour quality was positively associated with satisfaction (β = 0.399) and recommendation (β = 0.332), and satisfaction had a small association with recommendation (β = 0.118), supporting H1–H3 (Table 5). The indirect path through satisfaction was significant but small (β = 0.047, 95% CI [0.008, 0.090]), supporting H4; because the direct and total effects were also significant, this indicates complementary partial mediation (Zhao et al., 2010), with about one eighth of the total effect running through satisfaction. The model explained 17.7% of the variance in satisfaction and 17.3% in recommendation, which is weak by conventional benchmarks (Hair et al., 2019). Inner-model VIFs were below 1.32. Because these paths refer to tour quality as a whole, each of the four attributes was also examined separately (Section 4.5, Table 6). All four attributes were significantly related to satisfaction, with operations (β = 0.168) and the itinerary (β = 0.145) showing the largest coefficients, whereas only the guide (β = 0.147) and the itinerary (β = 0.125) were significantly related to recommendation. However, Wald tests did not reject the equality of the four attribute coefficients for either satisfaction (χ2(3) = 0.55, p = 0.91) or recommendation (χ2(3) = 0.60, p = 0.90), so these differences in significance should be regarded as exploratory.
Table 5.
Structural model results (n = 554).
Table 6.
Robustness checks and attribute-level results.
4.5. Robustness Checks and Attribute-Level Results
The structural results were robust (Table 6, Panel A). Accounting for clustering within sessions with GEE left the estimates and their significance unchanged, the composite (Mode B) specification of BPQ produced nearly identical paths, and ordinal logistic regressions led to the same conclusions. When accompanying persons were excluded, the direct path from quality to recommendation remained significant (β = 0.368), whereas the path from satisfaction to recommendation and the indirect path were no longer significant. The attribute-level results reported in Section 4.4 are shown in Panel B: transport and operations were related to satisfaction but not to recommendation, although the four attribute coefficients did not differ significantly from one another, and satisfaction remained related to recommendation (β = 0.119) when the four attributes were included. The variance explained by the attribute-level models (R2 = 0.177 for satisfaction and 0.175 for recommendation) was similar to that of the main model.
5. Discussion
As a foundational study of a little-researched market, this paper examined who joins destination-curated bleisure tours, whether different types of business visitors join for different reasons and with different needs, and how participants evaluate the tours. Three findings stand out.
First, the participants form a recognizable market: first-time visitors from North America and Europe, mostly in their thirties and forties, staying about five nights but with only one or two days of free time. Among second-half respondents, the most common reason for joining was simply having free time during the trip, and about a quarter learned about the tour through the event organizer or hotel. These findings are consistent with the view of bleisure as leisure fitted into short windows around work (Batala & Slevitch, 2024; Unger et al., 2016) and suggest that organized tours may help such visitors use their limited free time for sightseeing. The structural constraints identified in earlier research, namely lack of information, language barriers, transport, and booking difficulties (Pinho & Marques, 2021; Rittichainuwat et al., 2025), were also reported by visitors who did take part in a tour, consistent with leisure constraints theory’s view that constraints are negotiated rather than eliminated (Crawford et al., 1991; Jackson et al., 1993). The preference for landmarks, local food, and heritage echoes the assets that experts identified as most important for attracting bleisure travelers to Porto (Pinho & Marques, 2021), and the reliance on portal sites, review platforms, and other digital channels rather than public institution websites suggests that official destination information reaches business visitors mainly indirectly.
These patterns are broadly consistent with earlier evidence. Expedia data reported by Pinho and Marques (2021) showed that bleisure travelers value local cuisine (56%), historical monuments and sightseeing (49%), and iconic must-visit places (39%), which resembles the preferences of the first-half participants in this study, who all answered the same questionnaire version, for landmarks and city tours (71.1%), food tourism (57.9%), and heritage sites (49.9%). Among trade fair visitors in Thessaloniki, 70.7% reported fun and entertainment as an objective alongside information gathering (Kourkouridis et al., 2024), and 85.4% of the second-half respondents in this study had considered leisure when planning their business trip.
Second, the three participant types differed in how they travel, whereas no significant differences were detected in what they want. MICE attendees more often traveled alone, came from a wider range of regions, and had less free time; corporate travelers mostly traveled in pairs; and accompanying persons traveled in groups, which is partly definitional. Once questionnaire version and multiple testing were taken into account, the types did not differ significantly in leisure preferences, dining preferences, information sources, participation reasons, preferred timing, concerns, or desired support, and the first-half comparisons, which were free of the version difference, showed only small effects. This pattern is consistent with Harris and Pressey’s (2021) argument that business tourists are less idiosyncratic than often assumed, but it offers only limited support: the comparisons were confounded with questionnaire version and tour program, the second-half items involved only two of the three types, and the subgroups were too unequal and partly too small to establish equivalence. What clearly distinguished the types was the structure of their trip, namely who they travel with and how much time they have, which corresponds to the structural level of leisure constraints (Crawford et al., 1991). Accompanying persons (13.2% of participants), who mostly traveled in groups, also show that bleisure tours serve companions as well as business travelers, a segment whose needs and potential work–family tensions deserve attention (Zhang et al., 2026).
Third, participants evaluated the tours very favorably. Tour quality was positively associated with satisfaction and recommendation, mainly through a direct path, which is consistent with the quality–satisfaction–behavioral intention framework (Cronin et al., 2000; Oliver, 1980) and with the view that business visitors recommend a tour on the basis of how well it was designed and run (Zeithaml et al., 1996). At the attribute level, all four attributes were related to satisfaction, whereas only the itinerary and the guide were significantly related to recommendation; because the four coefficients did not differ significantly from one another, this pattern is exploratory, although it is consistent with research showing that individual attributes can carry different weights for overall satisfaction and for behavioral intentions (Mittal et al., 1998). Among business travelers alone, the indirect path through satisfaction was not significant, but its confidence interval overlapped with the full-sample estimate, so this result does not show that their recommendations rest on performance rather than enjoyment. Because the attribute and overall evaluations were all satisfaction ratings collected at the same time, the association between quality and satisfaction partly reflects shared measurement and should not be read as a causal effect, and the model left most of the variance unexplained. Evaluations differed more across tour programs than across participant types, and the lower ratings of MICE attendees could not be separated from the programs they joined. The programs differed in season, itinerary, participant composition, group size, and staffing, and the data do not allow these factors to be separated; their effects should be examined in future research with session-level records.
6. Conclusions
Using post-tour survey data from 554 participants in Seoul’s pilot bleisure tours, this study provides a baseline profile of the participants in destination-curated bleisure tours. Participants were mostly first-time visitors with limited free time, and MICE attendees, corporate travelers, and accompanying persons differed in their travel parties and free time, whereas no significant differences were detected in their leisure preferences, information sources, and needs. Participants rated the tours very highly, and tour quality was positively associated with satisfaction and recommendation. The study makes two modest contributions.
First, it provides one of the first quantitative profiles of participants in destination-curated bleisure tours, complementing research on self-organized bleisure (Batala & Slevitch, 2024; Lichy & McLeay, 2018) with evidence from an actual program and responding to calls for evidence on specific traveler groups and on destination programs (Ezeuduji, 2024; Ndita & Bama, 2026). Second, by comparing participant types, it shows that business visitors who join curated tours differ in the structure of their trip, whereas no significant differences in their preferences were detected; this adds tentative evidence from a destination program to the debate on whether business tourists form distinct segments (Harris & Pressey, 2021). In addition, the attribute-level results offer exploratory evidence that all four tour attributes were reflected in satisfaction, whereas only the itinerary and the guide were significantly related to recommendation; because the attribute coefficients did not differ significantly, this pattern should be tested in future studies rather than taken as a refinement of the quality–satisfaction–behavioral intention framework (Mittal et al., 1998; Zeithaml et al., 1996).
The findings suggest several implications for DMOs, convention organizers, and hotels; because they rest on cross-sectional data from one city, they should be treated as hypotheses to be tested in future programs. First, because the types differed in time and travel party, and no differences in their preferences and needs were detected, a common core product may serve all of them, adapted in format rather than content: short half-day or evening tours for MICE attendees, who often travel alone with little free time; tours for pairs of colleagues for corporate travelers; and family-friendly options and companion passes for accompanying persons, as recommended for business events by Zhang et al. (2026). Second-half respondents preferred weekday evenings, and evening products such as the Han River bus and night food experiences may fit business schedules well.
Second, because participants rely on portal sites, review platforms, and other digital channels, and about a quarter learned about the tour through organizers or hotels, DMOs may reach business visitors more effectively through these intermediaries, such as event registration systems, hotel concierge desks, and booking platforms, than through public websites. Consistent with Chung et al. (2020) and Pinho and Marques (2021), DMOs, event organizers, and hotels could plan these touchpoints jointly.
Third, the main concerns (information, language, transport, and booking) point to bundled support, such as transit passes, multilingual guides, and one-stop booking. Fourth, because evaluations differed across programs, routine post-tour monitoring of the four attributes by program can help identify underperforming programs. The attribute-level results suggest where to look: all four attributes were related to satisfaction, but recommendation, on which a new program depends for word of mouth, was significantly related only to the itinerary and the guide, so route design and guide quality may deserve particular attention, although this exploratory pattern needs confirmation. Finally, 64.4% of second-half respondents said the tour had at least somewhat influenced their sightseeing decisions, whereas 11.7%, about one in nine, said they had extended their stay because of it (a retrospective self-report); whether promotion before arrival can generate additional nights should be tested with booking data.
Several limitations should be noted. First, the data were collected for program evaluation, so satisfaction and recommendation were measured with single items, the attribute and global evaluations used the same satisfaction scale, and all items were answered at the same time after the tour; construct overlap and common method variance cannot be ruled out, and trip characteristics, leisure preferences, and information sources were reported retrospectively and may be subject to recall and hindsight bias. Second, the questionnaire was revised during fieldwork: second-half respondents selected far fewer options in the multiple-response items, some options were offered in only one version, and participant type overlapped with questionnaire version and tour program, which limits the participant-type comparisons; pooled percentages should therefore not be compared with external figures. Moreover, under the strong ceiling effects observed in the evaluations, the absence of statistically significant differences does not demonstrate that the groups are homogeneous, and equivalence testing could be considered in future work. Third, the sample consisted only of participants in pilot tours whose guide and transport costs were covered by the project; these conditions may have encouraged favorable responses and contributed to the ceiling effects, and because the tours were pilots without a defined sampling frame, non-response and selection bias could not be assessed. Two convention-linked tour groups were excluded because their evaluations could not be matched to participant characteristics, so MICE attendees on convention-organized tours may be underrepresented. The results cannot be generalized to business visitors who did not join a tour. Fourth, session identifiers were not recorded, so clustering could be assessed only with sessions approximated by program and survey date. Finally, the respondents came from one city and five programs, and replication in other destinations and types of bleisure programs is needed. Future research could compare participants with non-participants, apply equivalence tests to the comparison of participant types, examine the sources of differences between programs, and track how curated tour experiences shape stay extension, spending, and evaluations of the destination.
Supplementary Materials
The following supporting information can be downloaded at: https://www.mdpi.com/article/10.3390/tourhosp7110369/s1, Table S1: Participant-type comparisons of the multiple-response items among first-half respondents (%); Table S2: Comparisons of the second-half multiple-response items between MICE attendees and corporate travelers (%).
Author Contributions
Conceptualization, M.H. and H.Y.; methodology, H.Y.; formal analysis, M.H. and H.Y.; data curation, M.H.; writing—original draft preparation, M.H.; writing—review and editing, H.Y. All authors have read and agreed to the published version of the manuscript.
Funding
This research received no external funding. The survey was conducted and funded by the Seoul Metropolitan Government as part of the Seoul Bleisure Tourism Activation Project.
Institutional Review Board Statement
Ethical approval was waived for this study as the data was taken from the Seoul Metropolitan Government with permission to use the data from a co-author affiliated with the Seoul Metropolitan Government who transferred the secondary administrative dataset for public research and policy analysis.
Informed Consent Statement
Informed consent was waived for this study because the data was taken from the Seoul Metropolitan Government with permission to use the data from a co-author affiliated with the Seoul Metropolitan Government. Informed consent was voluntarily obtained prior to survey participation by the Seoul Metropolitan Government at the time of data collection.
Data Availability Statement
The de-identified data and a codebook of the variables used are available from the corresponding author upon reasonable request with the permission of the Seoul Metropolitan Government, which owns the data.
Acknowledgments
The authors thank the Seoul Metropolitan Government and the project operator for providing access to the survey data. ChatGPT-6 (OpenAI) was utilized for English language refinement and cross-checking information during the drafting of this manuscript. However, the authors maintain full responsibility for the final content and accuracy of the paper.
Conflicts of Interest
M.H. is employed by the Tourism Policy Division of the Seoul Metropolitan Government, which commissioned the Seoul Bleisure Tourism Activation Project and holds the survey data. M.H. was involved in administering the project and contributed to data curation and writing of this article in an academic capacity. The views expressed in this article are those of the authors and do not represent those of the Seoul Metropolitan Government. As an institution, the Seoul Metropolitan Government had no role in the design of the analysis, the interpretation of the results, the writing of the manuscript, or the decision to publish. H.Y. declares no conflicts of interest.
References
- Anderson, E. W. (1998). Customer satisfaction and word of mouth. Journal of Service Research, 1(1), 5–17. [Google Scholar] [CrossRef] [Scilit]
- Baker, D. A., & Crompton, J. L. (2000). Quality, satisfaction and behavioral intentions. Annals of Tourism Research, 27(3), 785–804. [Google Scholar] [CrossRef] [Scilit]
- Batala, B., & Slevitch, L. (2024). Keeping two balls in the air: The bleisure travel experience. Annals of Tourism Research Empirical Insights, 5(1), 100115. [Google Scholar] [CrossRef] [Scilit]
- Beardsley, M., Jung, S., Kim, H., & Kim, Y. (2019). Tourism experiences during a convention: A case study from South Korea. Tourism Analysis, 24(1), 81–86. [Google Scholar] [CrossRef] [Scilit]
- Bergkvist, L., & Rossiter, J. R. (2007). The predictive validity of multiple-item versus single-item measures of the same constructs. Journal of Marketing Research, 44(2), 175–184. [Google Scholar] [CrossRef] [Scilit]
- Caicedo-Barreth, A., Pavón, E. S., & Santos, L. L. (2020). Competitiveness of Guayaquil towards bleisure tourism. European Journal of Tourism, Hospitality and Recreation, 10(2), 118–133. [Google Scholar] [CrossRef] [Scilit]
- Chan, A., Hsu, C. H. C., & Baum, T. (2015). The impact of tour service performance on tourist satisfaction and behavioral intentions: A study of Chinese tourists in Hong Kong. Journal of Travel & Tourism Marketing, 32(1–2), 18–33. [Google Scholar] [CrossRef] [Scilit]
- Chung, J. Y., Choi, Y.-K., Yoo, B.-K., & Kim, S.-H. (2020). Bleisure tourism experience chain: Implications for destination marketing. Asia Pacific Journal of Tourism Research, 25(3), 300–310. [Google Scholar] [CrossRef] [Scilit]
- Crawford, D. W., Jackson, E. L., & Godbey, G. (1991). A hierarchical model of leisure constraints. Leisure Sciences, 13(4), 309–320. [Google Scholar] [CrossRef] [Scilit]
- Cronin, J. J., Jr., Brady, M. K., & Hult, G. T. M. (2000). Assessing the effects of quality, value, and customer satisfaction on consumer behavioral intentions in service environments. Journal of Retailing, 76(2), 193–218. [Google Scholar] [CrossRef] [Scilit]
- Davidson, R. (2019). Business events (2nd ed.). Routledge. [Google Scholar]
- Diamantopoulos, A., Sarstedt, M., Fuchs, C., Wilczynski, P., & Kaiser, S. (2012). Guidelines for choosing between multi-item and single-item scales for construct measurement: A predictive validity perspective. Journal of the Academy of Marketing Science, 40(3), 434–449. [Google Scholar] [CrossRef] [Scilit]
- Ezeuduji, I. O. (2024). Bleisure travel reimagined: Implications for research. International Conference on Tourism Research, 7(1), 2–9. [Google Scholar] [CrossRef] [Scilit]
- Global Business Travel Association. (2025). Business travel outlook poll: October 2025. Available online: https://gbta.org/wp-content/uploads/GBTA-Business-Travel-Outlook-Poll-Results-publication-October-2025-FINAL.pdf (accessed on 23 September 2026).
- Global Business Travel Association. (2026). 2026 GBTA business travel index: Annual global report and forecast. Available online: https://gbta.org/research/2026-business-travel-index-bti/ (accessed on 23 September 2026).
- Gotlieb, J. B., Grewal, D., & Brown, S. W. (1994). Consumer satisfaction and perceived quality: Complementary or divergent constructs? Journal of Applied Psychology, 79(6), 875–885. [Google Scholar] [CrossRef]
- Hair, J. F., Hult, G. T. M., Ringle, C. M., & Sarstedt, M. (2022). A primer on partial least squares structural equation modeling (PLS-SEM) (3rd ed.). Sage. [Google Scholar]
- Hair, J. F., Risher, J. J., Sarstedt, M., & Ringle, C. M. (2019). When to use and how to report the results of PLS-SEM. European Business Review, 31(1), 2–24. [Google Scholar] [CrossRef] [Scilit]
- Han, S.-J. (2014). The relationship among participation motivation of exhibition attendees, perceived service quality, satisfaction and behavior intentions. International Journal of Trade Fairs and Exhibition Studies, 9(1), 23–43. (In Korean) [Google Scholar]
- Harris, L. C., & Pressey, A. (2021). The myth of business tourist idiosyncrasy. Annals of Tourism Research, 91, 103186. [Google Scholar] [CrossRef] [Scilit]
- Henseler, J., Ringle, C. M., & Sarstedt, M. (2015). A new criterion for assessing discriminant validity in variance-based structural equation modeling. Journal of the Academy of Marketing Science, 43(1), 115–135. [Google Scholar] [CrossRef] [Scilit]
- Holm, S. (1979). A simple sequentially rejective multiple test procedure. Scandinavian Journal of Statistics, 6(2), 65–70. [Google Scholar]
- Huang, S., Hsu, C. H. C., & Chan, A. (2010). Tour guide performance and tourist satisfaction: A study of the package tours in Shanghai. Journal of Hospitality & Tourism Research, 34(1), 3–33. [Google Scholar] [CrossRef] [Scilit]
- Hwang, J., Joo, K., & Moon, J. (2023). Relationships among experience economy, tour quality, tour satisfaction, and word-of-mouth in the senior tourism context in Korea: The moderating role of tour guiding services. Sustainability, 15(8), 6367. [Google Scholar] [CrossRef] [Scilit]
- Jackson, E. L., Crawford, D. W., & Godbey, G. (1993). Negotiation of leisure constraints. Leisure Sciences, 15(1), 1–11. [Google Scholar] [CrossRef] [Scilit]
- Jung, S., & Tanford, S. (2017). What contributes to convention attendee satisfaction and loyalty? A meta-analysis. Journal of Convention & Event Tourism, 18(2), 118–134. [Google Scholar] [CrossRef] [Scilit]
- Kim, D.-K. (2006). Study on the attendees’ characteristics by types of exhibitions: Focused on the differences of media selection and preference. International Journal of Trade Fairs and Exhibition Studies, 1(1), 49–74. (In Korean) [Google Scholar]
- Kock, N. (2015). Common method bias in PLS-SEM: A full collinearity assessment approach. International Journal of e-Collaboration, 11(4), 1–10. [Google Scholar] [CrossRef] [Scilit]
- Korea JoongAng Daily. (2025, May 14). Seoul named top leisure city in Asia by U.S. publication global traveler. Available online: https://www.koreajoongangdaily.com/korea/seoul-named-top-leisure-city-in-asia-by-us-publication-global-traveler/12123021 (accessed on 23 September 2026).
- Korea Times. (2026, August 5). Seoul ranks No. 7 among global bleisure destinations; Singapore tops list. Available online: https://www.koreatimes.co.kr/lifestyle/travel-food/20260805/seoul-ranks-no-7-among-global-bleisure-destinations-singapore-tops-list (accessed on 23 September 2026).
- Kourkouridis, D., Frangopoulos, I., & Salepaki, A. (2024). Business travel motivations and objectives of trade fairs visitors: Experience from the trade fairs in Thessaloniki, Greece. Geojournal of Tourism and Geosites, 53(2), 442–453. [Google Scholar] [CrossRef] [Scilit]
- Lichy, J., & McLeay, F. (2018). Bleisure: Motivations and typologies. Journal of Travel & Tourism Marketing, 35(4), 517–530. [Google Scholar] [CrossRef] [Scilit]
- Liu, J., Hsu, F.-C., Bai, Y., & Mai, H. (2024). A dual-benefit perspective of business travel. Annals of Tourism Research, 109, 103827. [Google Scholar] [CrossRef] [Scilit]
- Miao, L., Yang, F. X., Im, J., & Zhang, Q. (2024). Flexwork and flextravel. Annals of Tourism Research, 106, 103763. [Google Scholar] [CrossRef] [Scilit]
- Mittal, V., Ross, W. T., Jr., & Baldasare, P. M. (1998). The asymmetric impact of negative and positive attribute-level performance on overall satisfaction and repurchase intentions. Journal of Marketing, 62(1), 33–47. [Google Scholar] [CrossRef] [Scilit]
- Ndita, A., & Bama, H. K. N. (2026). A systematic review of bleisure tourism scholarship in Africa: Scope and trends. African Journal of Hospitality, Tourism and Leisure, 15(2), 545–555. [Google Scholar] [CrossRef] [Scilit]
- Oliver, R. L. (1980). A cognitive model of the antecedents and consequences of satisfaction decisions. Journal of Marketing Research, 17(4), 460–469. [Google Scholar] [CrossRef] [Scilit]
- Oliver, R. L. (1993). Cognitive, affective, and attribute bases of the satisfaction response. Journal of Consumer Research, 20(3), 418–430. [Google Scholar] [CrossRef] [Scilit] [PubMed]
- Pinho, M., & Marques, J. (2021). The bleisure tourism trend and the potential for this business-leisure symbiosis in Porto. Journal of Convention & Event Tourism, 22(4), 346–362. [Google Scholar] [CrossRef] [Scilit]
- Ramsey, J. R., Zhang, Y., Lorenz, M. P., & Hosany, S. (2025). Travel stress, leisure exploration, and trip satisfaction: The mediating role of travel adjustment. Journal of Travel Research, 64(7), 1619–1638. [Google Scholar] [CrossRef] [Scilit]
- Rittichainuwat, B., Chakraborty, G., & Tham, A. (2025). Mixing business with leisure? A framework of bleisure participation featuring constraints, facilitators, and shopping motivation. Event Management, 29(4), 507–523. [Google Scholar] [CrossRef] [Scilit]
- Severt, D., Wang, Y., Chen, P.-J., & Breiter, D. (2007). Examining the motivation, perceived performance, and behavioral intentions of convention attendees: Evidence from a regional conference. Tourism Management, 28(2), 399–408. [Google Scholar] [CrossRef] [Scilit]
- Tanford, S., Montgomery, R., & Nelson, K. B. (2012). Factors that influence attendance, satisfaction, and loyalty for conventions. Journal of Convention & Event Tourism, 13(4), 290–318. [Google Scholar] [CrossRef] [Scilit]
- Tretyakevich, N., & Maggi, R. (2012). Not just for business: Some evidence on leisure motivations of conference attendees. Current Issues in Tourism, 15(4), 391–395. [Google Scholar] [CrossRef] [Scilit]
- Tsaur, S.-H., & Tsai, C.-H. (2023). Bleisure travel experience: Scale development and validation. Journal of Travel & Tourism Marketing, 40(1), 21–37. [Google Scholar] [CrossRef] [Scilit]
- TTGmice. (2025a, November 10). HKTB boosts bleisure integration with mega events. Available online: https://www.ttgmice.com/?p=66109 (accessed on 27 September 2026).
- TTGmice. (2025b, November 24). TCEB unveils expanded Meet Well in Thailand campaign at IBTM World. Available online: https://www.ttgmice.com/?p=67146 (accessed on 27 September 2026).
- Unger, O., & Uriely, N. (2022). The bleisure memories of business travelers. Annals of Tourism Research, 97, 103497. [Google Scholar] [CrossRef] [Scilit]
- Unger, O., Uriely, N., & Fuchs, G. (2016). The business travel experience. Annals of Tourism Research, 61, 142–156. [Google Scholar] [CrossRef] [Scilit]
- Union of International Associations [UIA]. (2026). International meetings statistics report (67th ed.). Union of International Associations. [Google Scholar]
- Ye, T., & Xu, H. (2020). The impact of business travel on travelers’ well-being. Annals of Tourism Research, 85, 103058. [Google Scholar] [CrossRef] [Scilit]
- Yoon, H., & Jang, H. (2026). Workation experience and life satisfaction through the lens of border theory: The mediating role of perceived contribution to work-life balance. Journal of MICE & Tourism Research, 26(3), 445–461. [Google Scholar] [CrossRef]
- Zeithaml, V. A., Berry, L. L., & Parasuraman, A. (1996). The behavioral consequences of service quality. Journal of Marketing, 60(2), 31–46. [Google Scholar] [CrossRef] [Scilit]
- Zhang, X., Li, J., Shao, X., & Han, H. (2026). Navigating work–family and family–work conflicts during bleisure travel with family: The roles of personal involvement and perceived control. Tourism Management, 113, 105331. [Google Scholar] [CrossRef] [Scilit]
- Zhao, X., Lynch, J. G., Jr., & Chen, Q. (2010). Reconsidering Baron and Kenny: Myths and truths about mediation analysis. Journal of Consumer Research, 37(2), 197–206. [Google Scholar] [CrossRef] [Scilit]
- Žabkar, V., Brenčič, M. M., & Dmitrović, T. (2010). Modelling perceived quality, visitor satisfaction and behavioural intentions at the destination level. Tourism Management, 31(4), 537–546. [Google Scholar] [CrossRef] [Scilit]

Disclaimer/Publisher’s Note: The statements, opinions and data contained in all publications are solely those of the individual author(s) and contributor(s) and not of MDPI and/or the editor(s). MDPI and/or the editor(s) disclaim responsibility for any injury to people or property resulting from any ideas, methods, instructions or products referred to in the content. |
© 2026 by the authors. Licensee MDPI, Basel, Switzerland. This article is an open access article distributed under the terms and conditions of the Creative Commons Attribution (CC BY) license.