


Abstract
Behavioral observation is central to animal welfare assessment in zoological institutions, but manual observation is time-consuming and difficult to apply continuously. We developed and applied a LabGym-based workflow for automated behavioral monitoring of captive lions (Panthera leo). Development footage from three Danish zoological institutions was used to train a lion detector and a seven-class behavior categorizer; video collected on 22–28 December 2025 was temporally held out from model development and used for applied validation. Detector performance was moderate (bounding-box AP 47.1%; segmentation AP 41.6%), while the internal categorizer validation reached 0.62 accuracy and weighted F1. In the held-out validation, 52.6% of manually annotated lion-time received a retained pipeline prediction. Fine-scale end-to-end accuracy was 0.231 and increased to 0.440 when calculated only on covered lion-time. Grouping behaviors as active, inactive/maintenance, and pacing-like locomotion increased these values to 0.317 and 0.602, respectively. Coverage varied substantially among institutions (33.8–59.8%) and was particularly low for cubs and nighttime footage. Although model macro-F1 exceeded simple majority-class baselines, end-to-end accuracy did not. The workflow demonstrates the potential of computer-vision approaches for scalable behavioral quantification and future welfare assessment in zoological settings, while highlighting the importance of accounting for prediction coverage and classification performance when interpreting automated behavioral data.
1. Introduction
Welfare assessments in zoological institutions rely on multiple approaches, including behavioral observations, physical condition indicators (e.g., injuries or clinical signs of disease), and physiological measurements (e.g., heart rate and hormonal biomarkers) [1,2,3]. There are several reasons why behavioral observations are often preferred, as they are non-invasive, are relatively cost-effective and can be applied across multiple species [1,2,3,4]. In addition, behavioral changes can serve as early indicators of compromised welfare, allowing potential health issues or disease states to be identified before clinical signs become apparent [2,5,6]. Furthermore, they provides one of the most informative, sensitive and accessible indicators of an animal’s internal state [7,8].
One way to conduct behavioral observations is through video recordings, either continuously or at selected intervals throughout the day. The behavior performed by the animal is annotated, often on a per-second basis, and subsequently categorized according to a predefined ethogram, typically carried out by zoologists, zookeepers or researchers. This method is relatively easy to implement and the observed behaviors are typically straightforward to categorize [1,4,9,10,11]. However, manual behavioral observations present several challenges. It is highly time-consuming, monitoring multiple animals simultaneously is difficult, continuous 24/7 observation is nearly impossible and inter-rater reliability may influence the categorization of behaviors [12,13,14,15]. These limitations are particularly relevant when long-term monitoring is required to assess welfare trends, social dynamics, stereotypic behaviors or the effects of management changes [14,15,16,17,18,19]. As a result, there is a growing need for a scalable, objective and continuous behavioral monitoring method [16,18,19,20]. In response to this need, machine learning (ML) and computer vision are promising tools for complementing and possibly completely automating behavioral analysis.
ML algorithms can learn patterns from labeled data and classify behaviors directly from video recordings, reducing the need for human observation [21,22,23,24]. Automated systems have already been tested on laboratory animals and selected zoo species, with varying success, demonstrating the potential for high-throughput and non-invasive behavioral quantification [12,13,14,15,20]. However, despite these advances, few studies have applied ML-based behavioral classification to large carnivores in zoological settings, and even fewer have investigated whether such models can generalize across different institutions with varying enclosure designs, weather conditions, and social group compositions [12,19]. In this context, lions (Panthera leo) present a suitable model species to investigate these questions, as they are widely kept in zoological gardens and their behavior includes both movement-based activities and subtle social interactions [11,25,26,27,28]. To address these challenges, LabGym [29] provides a flexible framework for implementing instance segmentation-based behavioral classification from video data. Its modular design allows for the development and evaluation of models, making it well-suited for applications in zoological settings [29,30].
Aim of This Paper
This technical note develops, documents and evaluates a LabGym-based workflow for automated behavioral analysis of captive lions. The intended transferable components are the sequence of video standardization, detector and categorizer development, explicit post-processing, and coverage-aware validation against temporally held-out manual annotations. In contrast, the detector classes, ethogram, confidence thresholds, enclosure-specific corrections and pacing parameters are study-specific and require validation before transfer to another species, enclosure or institution. Because recordings from all three institutions contributed to model development, the study evaluates cross-enclosure performance within the included institutions rather than generalization to a completely unseen zoo. The evaluation addressed three objectives:
- (1)
- Quantify internal development-validation performance of the detector and behavior categorizer.
- (2)
- Quantify prediction coverage and behavior-classification performance of the complete workflow on temporally held-out video, including performance conditional on a retained prediction.
- (3)
- Compare coverage and classification performance among the three included zoological institutions and identify major sources of applied error.
2. Materials and Methods
2.1. Video Collection and Preprocessing
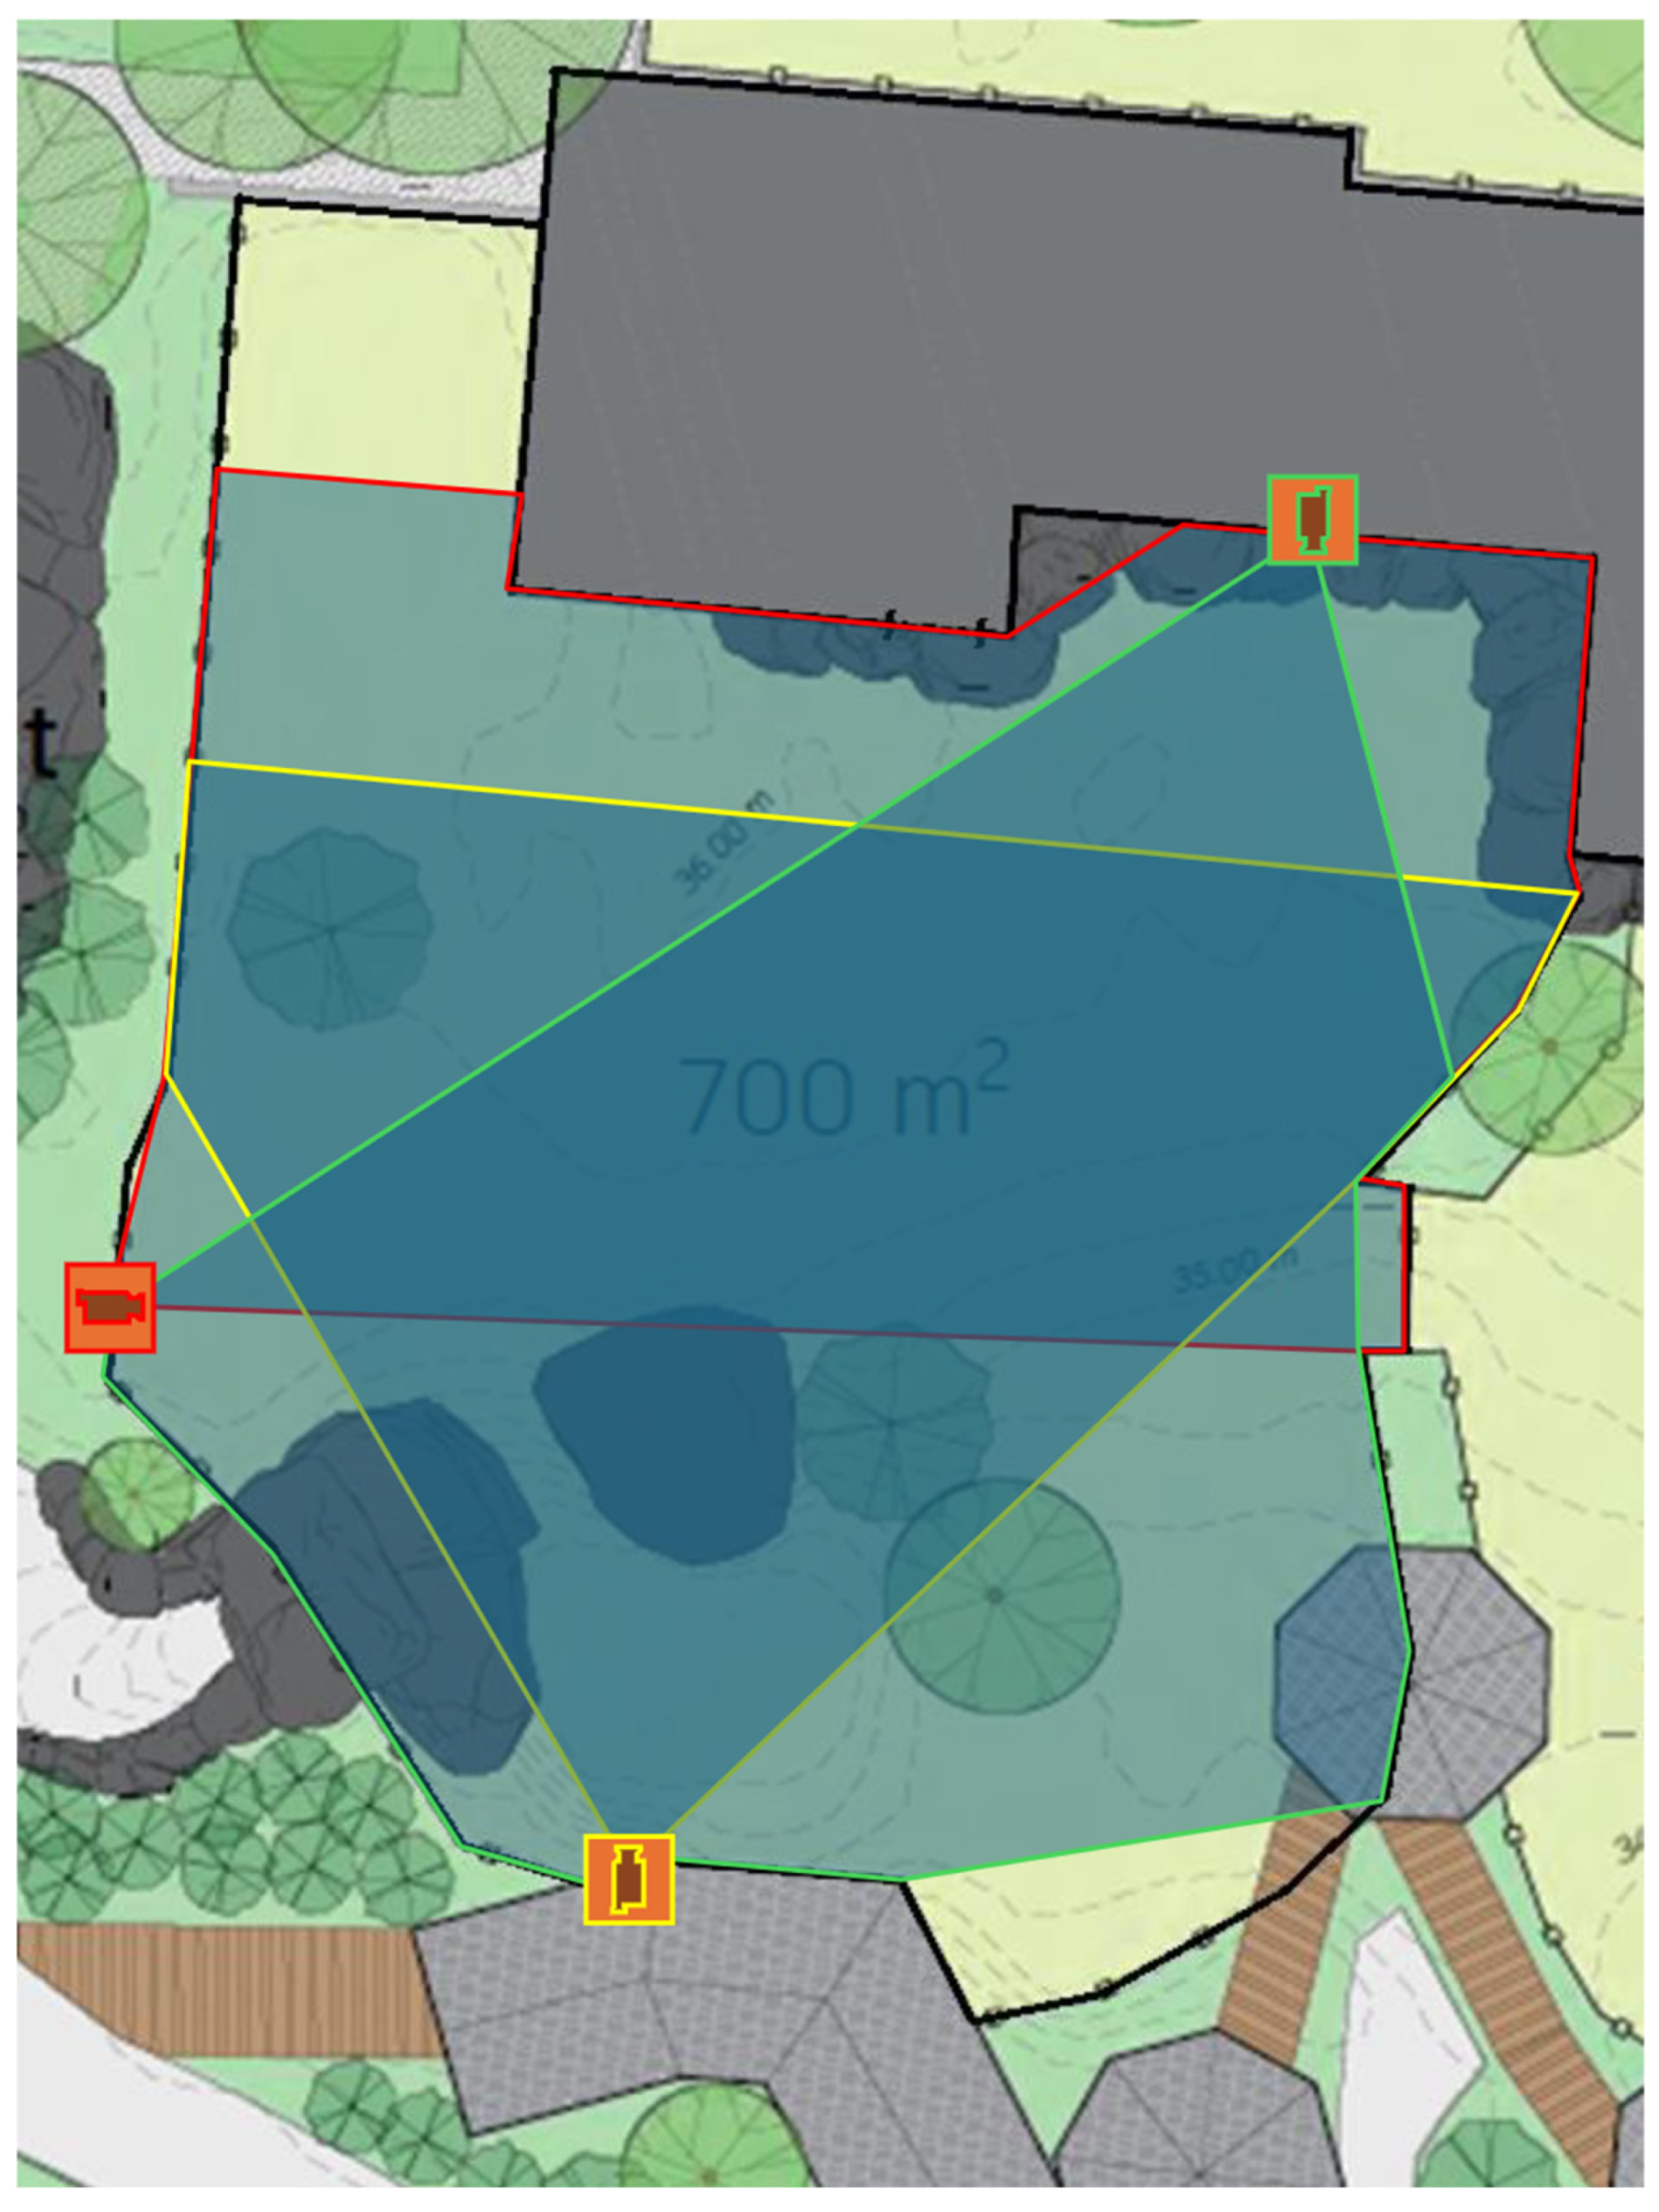
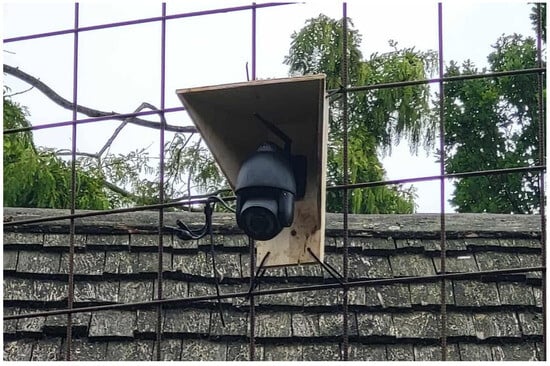
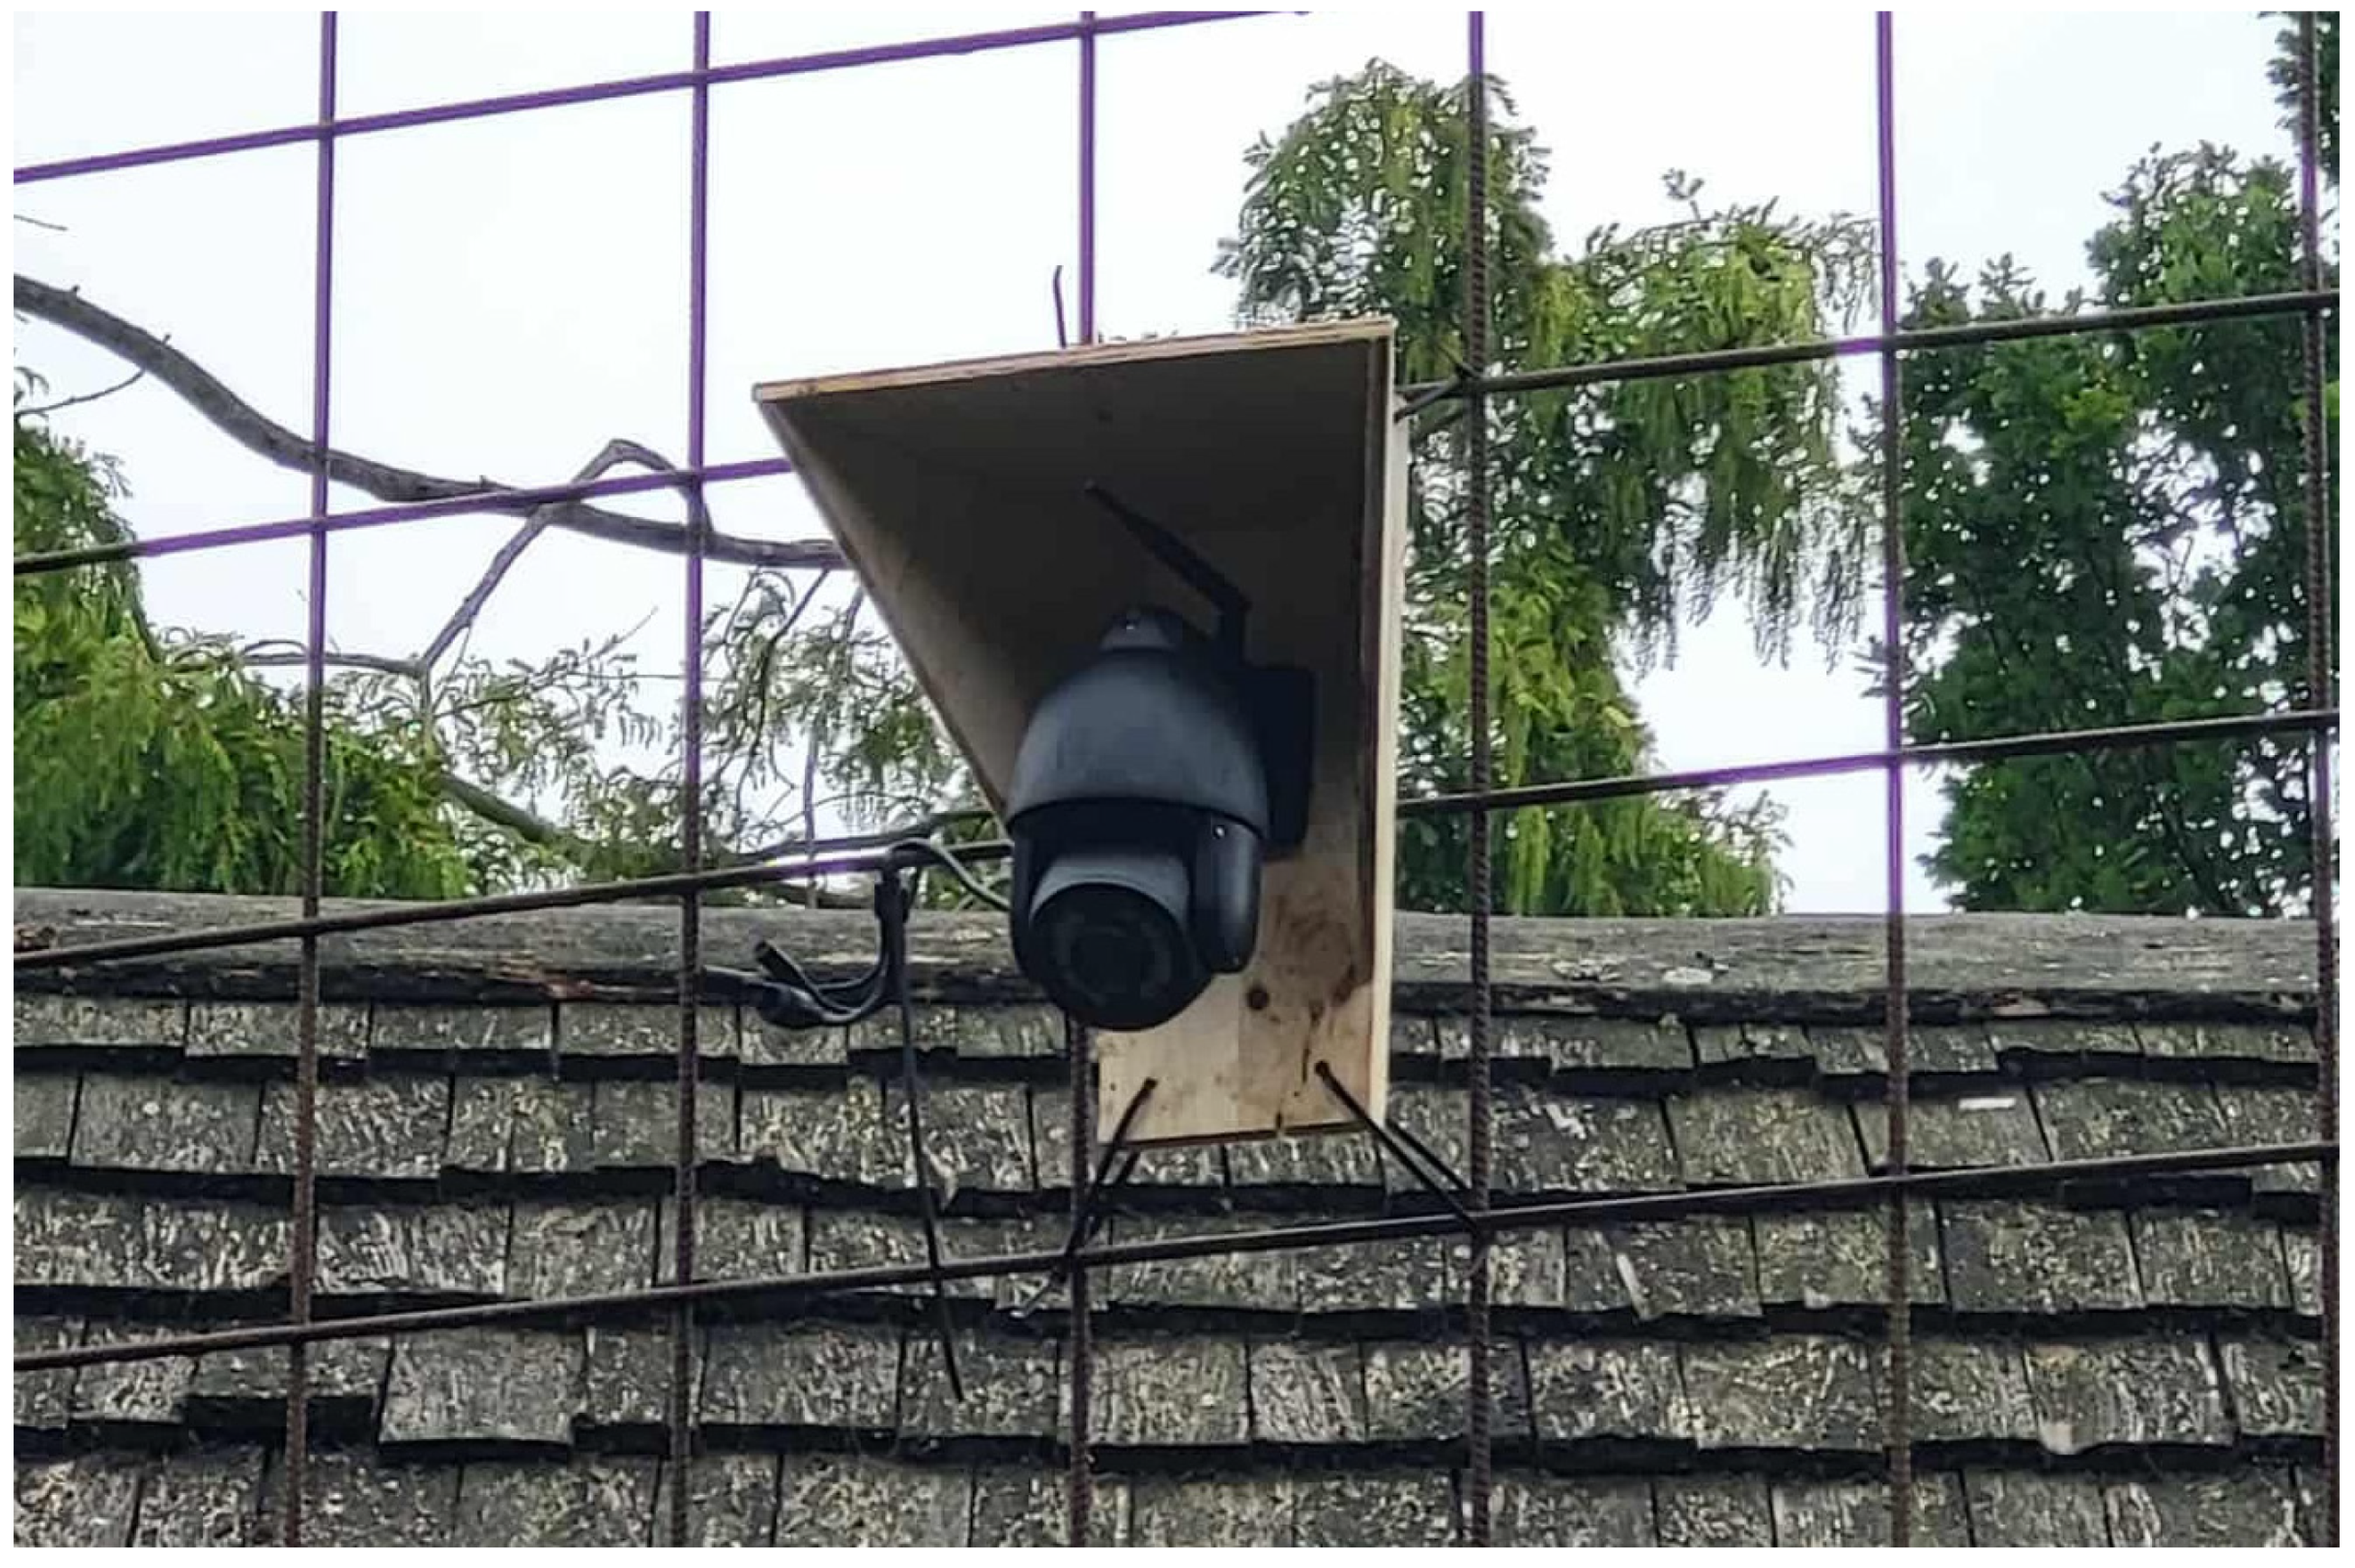
Video recordings for model development were collected between 9 October and 14 December 2025. Video recordings for analysis were collected between 22 and 28 December 2025 and were completely excluded from model development. Eight mini PTZ Wi-Fi IP outdoor surveillance cameras (Camwon PTZW-IP5S500F (manufactured in Guangzhou, Guangdong Province, China)) recorded continuously at 10 frames per second (fps); see Figure 1. The cameras were specified as 5 MP devices and automatically activated six infrared LEDs in low-light conditions. Across the analysis period, approximately 1281 h of video were recorded. The cameras had a 96° field of view when unzoomed. The held-out validation period occurred within a narrow winter sampling window close to the winter solstice; this design is appropriate for methodological validation but does not represent seasonal variation in lion activity. Three cameras were installed at each of the participating zoological institutions Aalborg Zoo (Aalborg, Denmark), Zoo Copenhagen (Copenhagen, Denmark), and Odense Zoo (Odense, Denmark). Due to technical issues at Zoo Copenhagen, one camera remained non-functional throughout the study period (Appendix Figure A1), resulting in a total of eight operational cameras. The three cameras in Odense Zoo were unstable throughout the study period and thus generally collected data in small chunks. Furthermore, one of the cameras in Odense Zoo was disabled between 23:00 and 09:00 every night. Cameras were strategically positioned to maximize visibility and coverage within each enclosure. The placement of the cameras and blind spots can be seen in Appendix Figure A1, Figure A2 and Figure A3.
Figure 1.
Image of one of the cameras installed at Aalborg Zoo (Aalborg, Denmark). A protective casing was constructed to minimize rain exposure on the lens, ensuring high image quality and recording resolution.
All video files were preprocessed using a custom preprocessing Python script (Python version 3.13.9; FFmpeg version 8.0 “Huffman” [31]) rather than LabGym’s internal preprocessing module, to optimize video quality, reduce file size, and convert files from AVI to MP4 format. All videos were processed using FFmpeg. The video width was standardized to 1280 pixels while preserving the original aspect ratio, resulting in a resolution of 1280 × 960 pixels for the videos included in this study. Brightness and contrast were adjusted using values of 0.6 and 1.5, respectively. The videos were encoded using H.264 (libx264) with the “veryfast” preset and a Constant Rate Factor (CRF) of 20. The output frame rate was standardized to 10 frames per second, the pixel format was set to yuv420p, and the audio track was removed. These fixed settings were applied consistently across institutions.
2.2. Model Development
The analysis of lion behavior was supported by a machine learning pipeline developed primarily in a custom version of LabGym version 3.0.1, supplemented by external tools for annotation and validation. LabGym is an open-source Python-based platform for automated behavioral analysis from video material. It combines instance segmentation, behavior categorization and quantitative behavioral output. In this study, LabGym was used to develop a species- and context-specific model for detecting lions and classifying welfare-relevant behaviors from a predefined ethogram (Appendix Table A1).
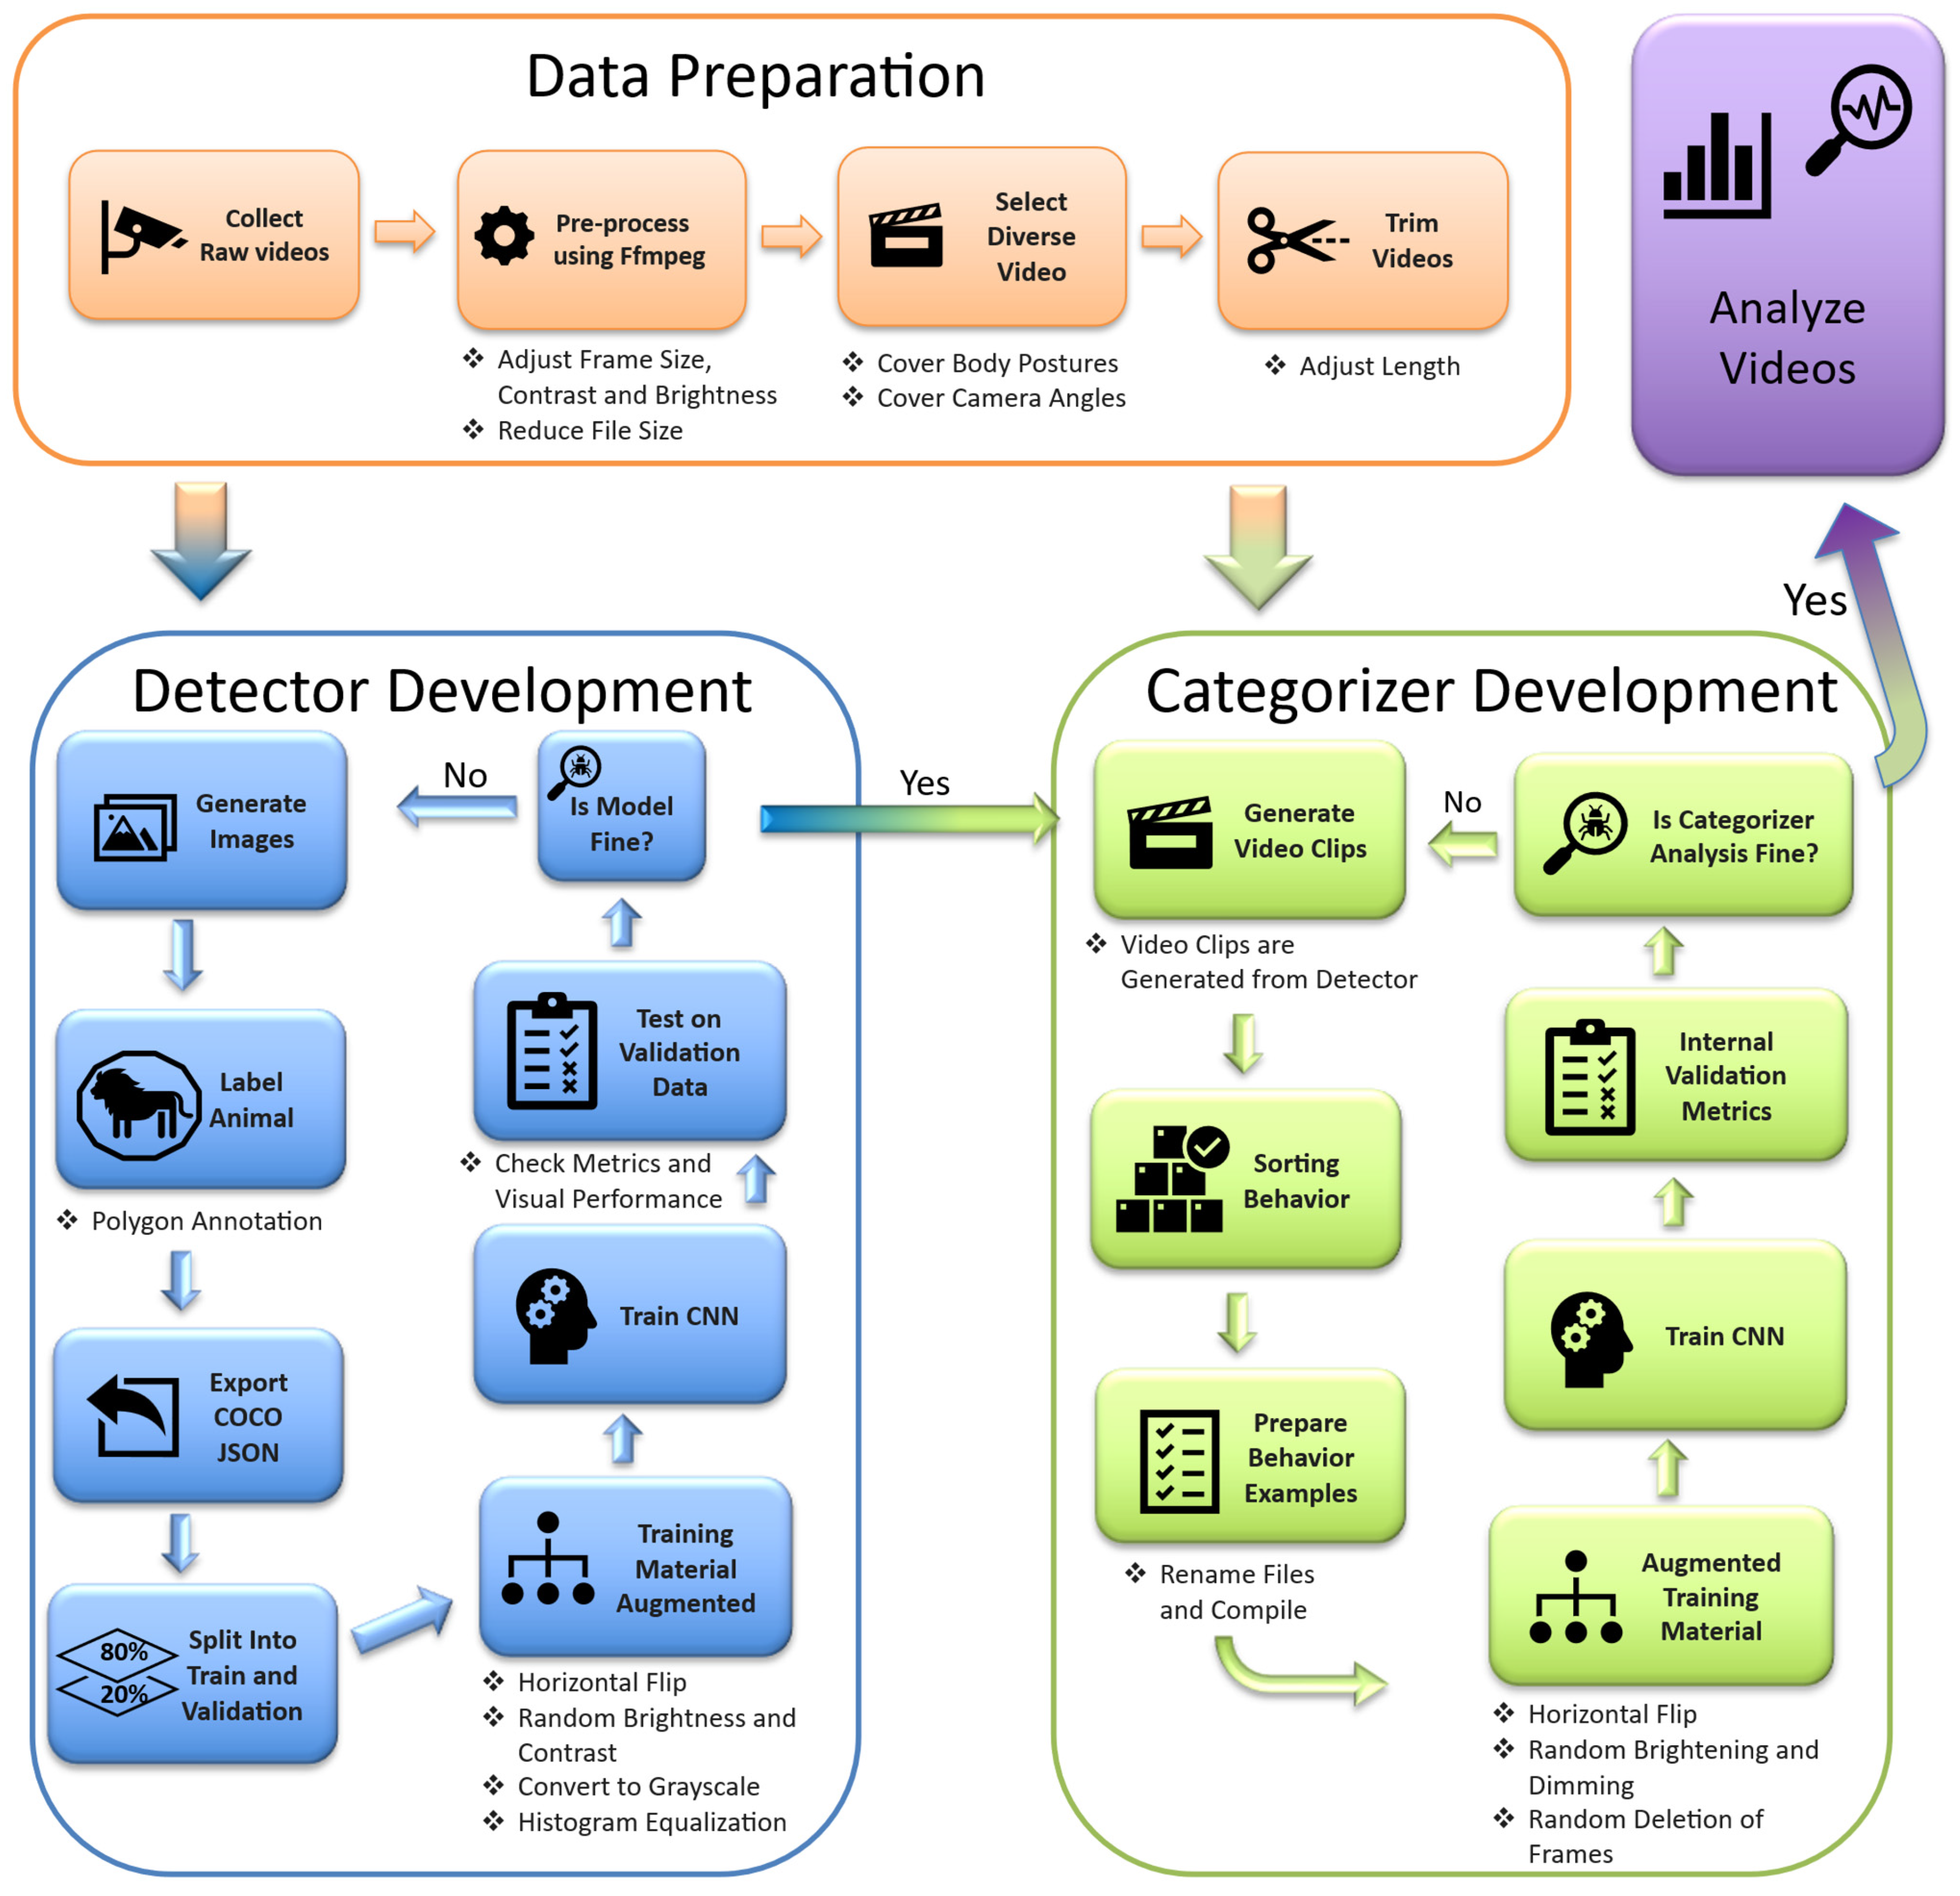
The adaptations in the custom LabGym version were primarily done to fit video recordings from zoo environments and make the data output more intuitive for this study. The main modifications focused on improving robustness for long videos, multiple individuals and videos not containing any individuals in a class, including batch-wise behavior categorization, memory management, and safer handling of empty detections. Additional post-processing was added to reduce short classification gaps in the same behavior sequence using backfilling, while preserving raw predictions for validation. The output structure was also customized to export one analysis-ready Excel file per video, containing metadata, such as recording date and time, and video name. The Excel files also contain tracking results, behavior predictions, prediction probabilities, movement metrics and behavioral summaries. Finally, biological rules were added so that sex-specific behaviors could not be assigned to the wrong animal class. Instead of changing the animal class to fit the predicted behavior, the pipeline kept the original class and selected the next most likely behavior that was allowed for that class. The model development pipeline can be seen in Figure 2.
Figure 2.
Pipeline showing the workflow of model construction from data preparation to creation of the two model types and analysis in LabGym.
During the held-out validation period, the three institutions differed in lion-group composition. Aalborg Zoo housed two adult females, aged 12 and 6 years, both belonging to the mixed-group detector category. Zoo Copenhagen housed seven lions: one 15-year-old adult male, two 13-year-old adult females and four one-year-old juveniles; the females and juveniles belonged to the mixed-group detector category. Odense Zoo housed nine lions: one adult male, three adult females, two approximately 1.5-year-old juveniles and three approximately four-month-old cubs. The adult females and juveniles belonged to the mixed-group detector category, whereas the three youngest animals belonged to the cub category. Thus, cubs were represented only at Odense Zoo.
2.2.1. Detector Development
A LabGym detector was trained to identify three visually defined lion classes: adult male, a mixed group consisting of adult females and non-adult individuals of both sexes, and cubs of both sexes. The detector formed the first step in the analysis pipeline, where it was used to localize individual lions in video footage before behavior categorization. Training images were generated from representative video clips recorded across the three study enclosures. Frames were selected to capture variation in lighting conditions, backgrounds, day and night recordings, camera angles and lion postures. In total, 812 frames were annotated, containing 2028 individual lion instances across the three object classes: 482 adult males, 1399 mixed group and 147 cubs.
Image annotation was performed using DigitalSreeni Image Annotator (version 0.8.12 [32]), an open-source, Python-based annotation tool. Individual lions were labeled with polygon masks with semi-automated SAM-2 support. The data were exported in COCO JSON format. DigitalSreeni generated a random 80/20 image-level training/validation split. Because the split was random at image level rather than by source video, camera or recording date, visually similar frames from the same source recording could potentially occur in both subsets; detector validation is therefore treated as development validation rather than as an independent external test.
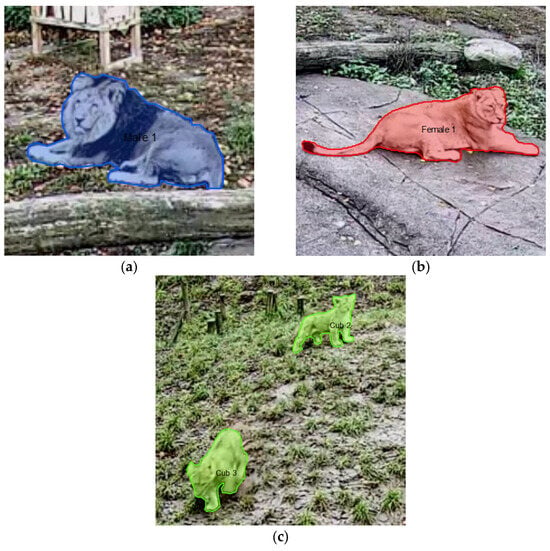
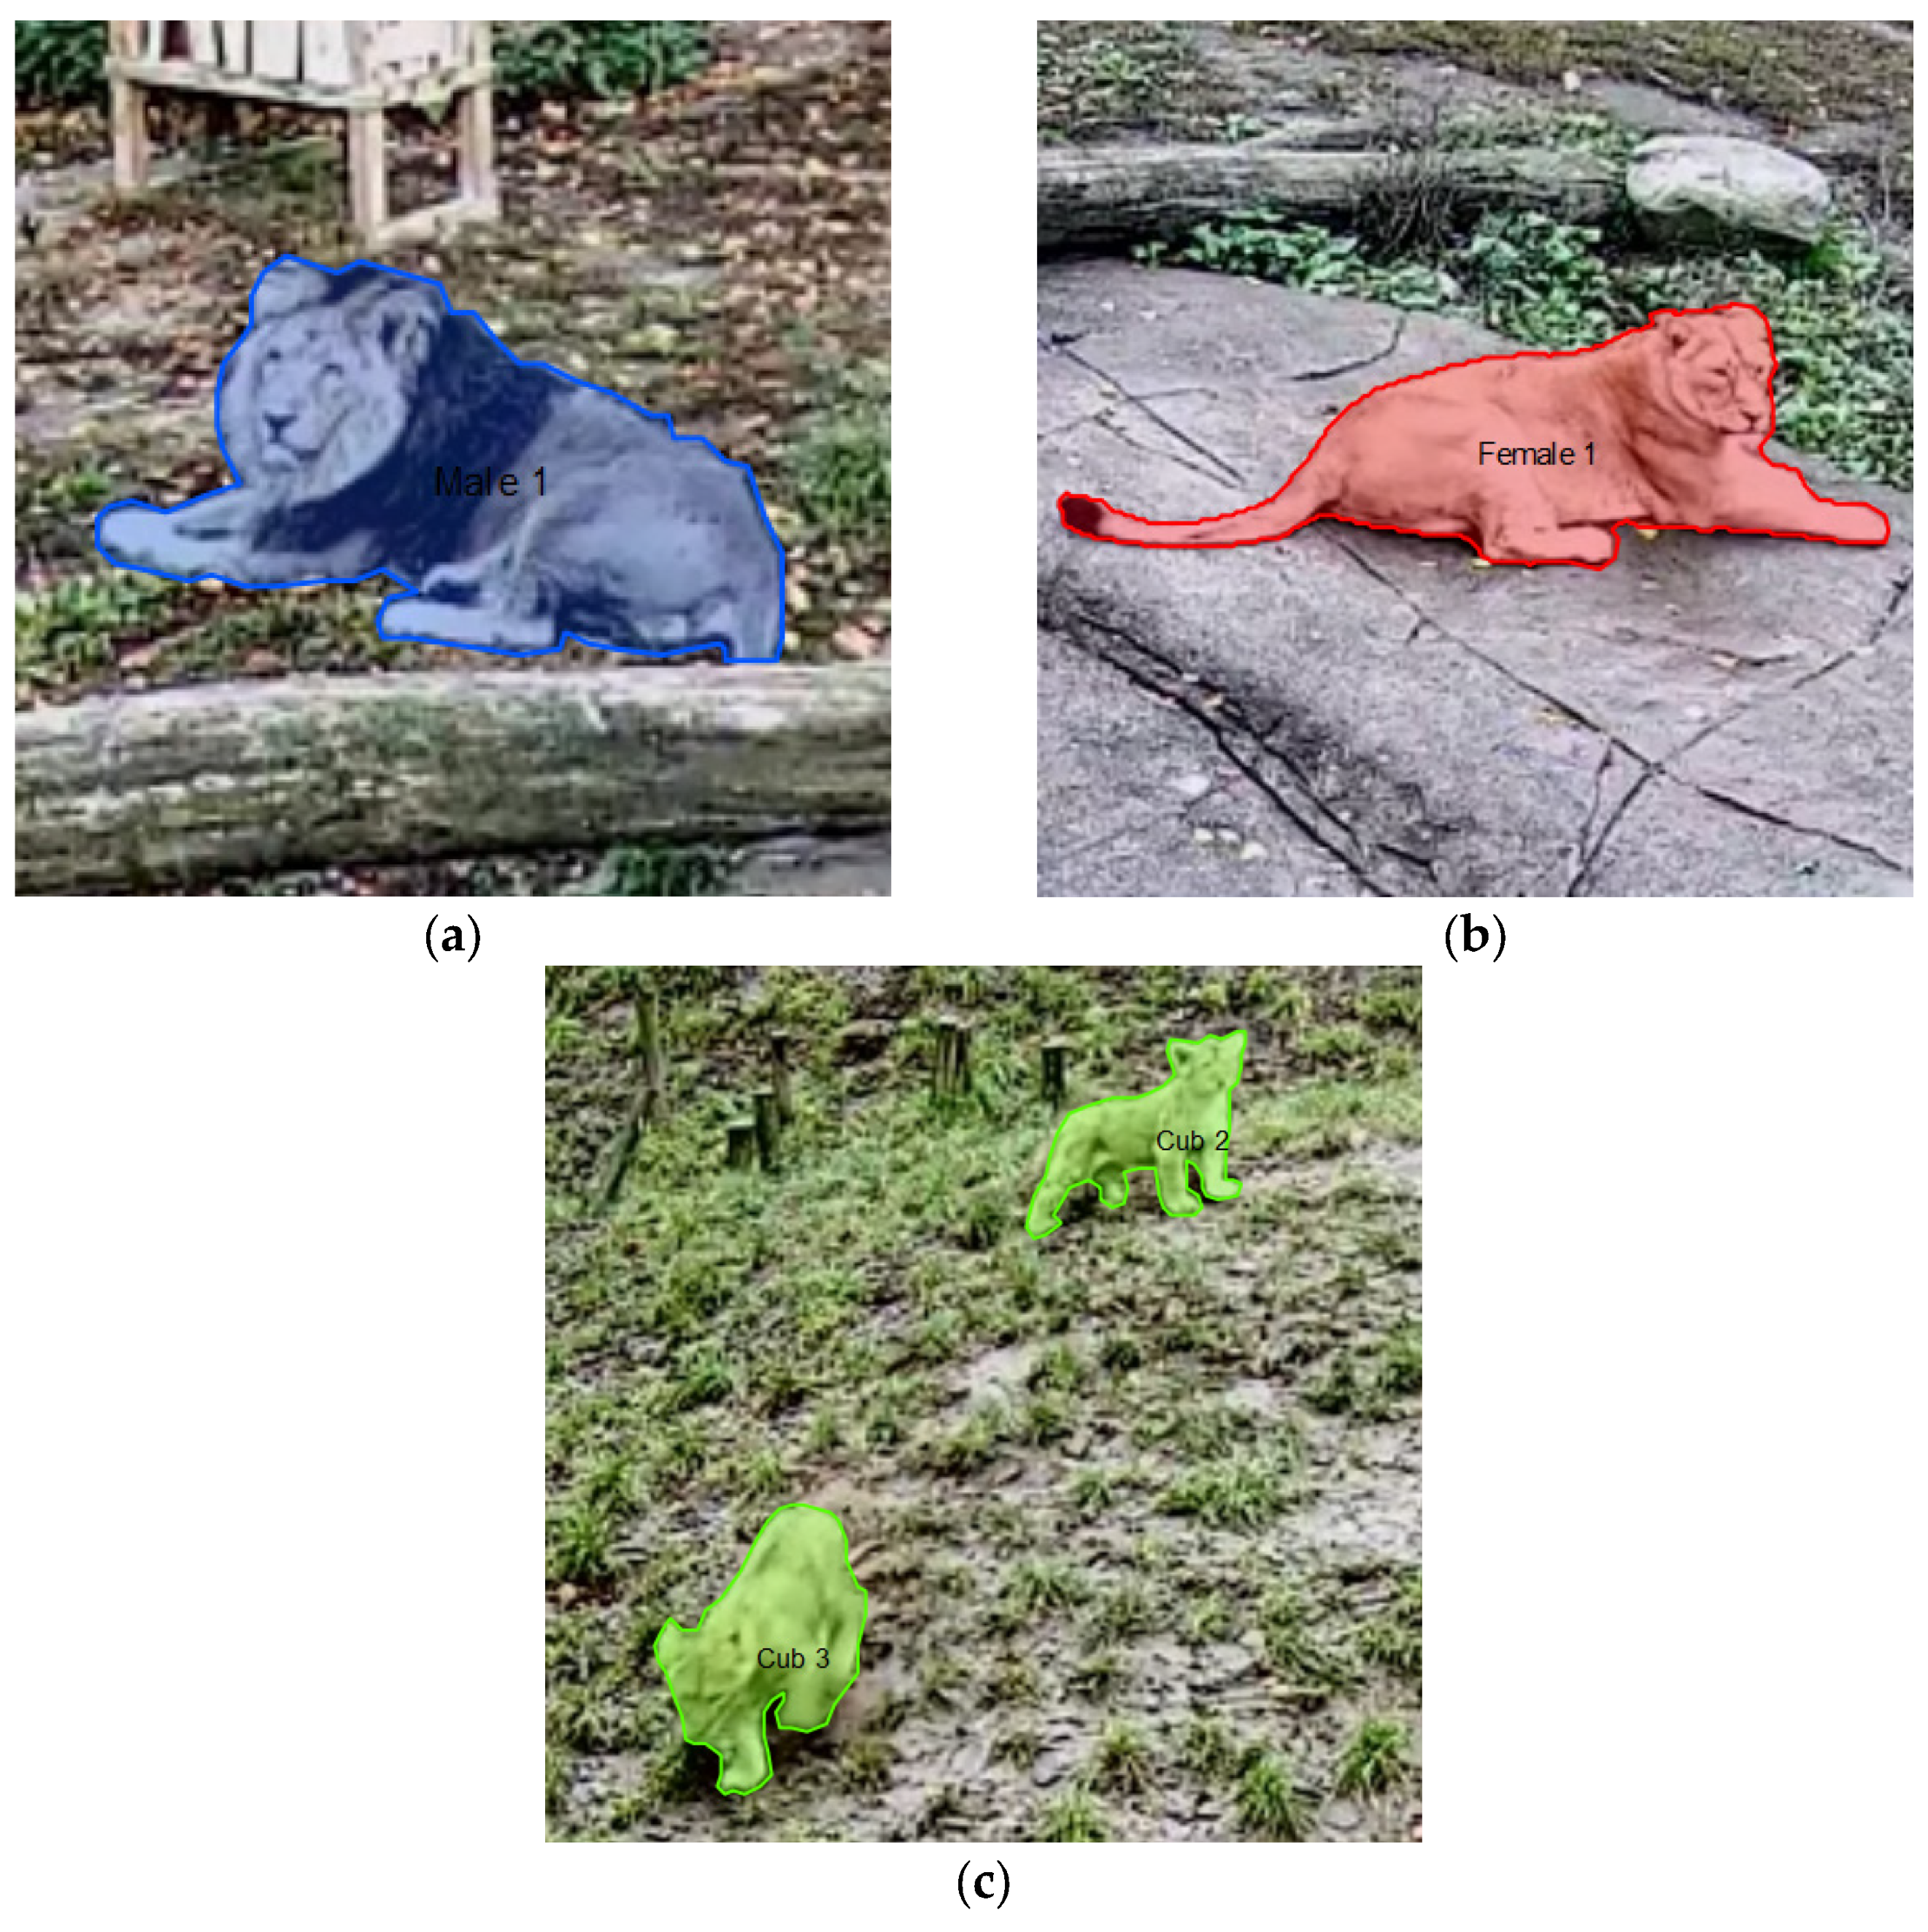
Training augmentation included random brightness and contrast adjustment, horizontal flipping, grayscale conversion and histogram equalization, resulting in 3889 augmented training images. The detector was trained for 10,000 iterations. Development was iterative: additional images, annotation refinements and augmentation adjustments were introduced after inspection of development-validation performance. Consequently, the internal validation data informed model development and should not be interpreted as a fully untouched test set. Examples of polygon labeling of lions can be seen in Figure 3.
Figure 3.
Examples of manually annotated training images representing the three object classes used for detector training in LabGym: adult male (a), mixed group (b) and cub (c). Images were annotated in DigitalSreeni Image Annotator using polygon masks to outline each individual lion.
2.2.2. Behavior Categorizer Development
A LabGym behavior categorizer was trained using representative clips from the three enclosures. A study-specific ethogram based on Stanton et al. (2015) [10] was adapted to the behaviors relevant to the study (Appendix Table A1). Categories were mutually exclusive at annotation. The ethogram itself imposed a specificity rule: locomotion was used only when the animal moved without another distinct behavior, and inactive was used for stationary states that did not meet a more specific action category. When an interval could plausibly contain more than one action, one primary observable behavior was recorded; multi-label annotation was not used. The vocalization category specifically represented roaring and was restricted to adult males in the present model. This was a study-specific modeling decision because roaring by adult males was accompanied by a clear and visually distinctive behavioral pattern in the available video material, whereas roaring by females was generally expressed more discretely and could not be identified reliably from the visual information available to the categorizer.
Categorizer training used LabGym’s “Interact Advanced” mode, which supports behaviors by single animals and interactions among animals. Background information was retained because enclosure context could contribute to classification. The categorizer was trained for eight epochs with a 32 × 32 pixel input and 40 frames per example. Augmentation included horizontal flipping, random brightening, random dimming and random frame deletion. The final pre-augmentation dataset contained 1315 behavior examples: 160 feeding (12.2%), 264 inactive (20.1%), 354 interacting (26.9%), 255 locomotion (19.4%), 60 marking (4.6%), 95 self-grooming (7.2%) and 127 vocalization (9.7%). During training, LabGym divided the prepared behavior examples using a stratified random 80/20 training-validation split, preserving approximately the same behavior-class distribution in both subsets. The split was performed at the individual behavior-example level rather than by source video, individual animal, enclosure or institution, and no fixed random seed was specified. Consequently, examples originating from the same source recording could occur in both the training and validation subsets. The split was performed before data augmentation. Following augmentation, LabGym reported 37,872 training examples. In the present model, the internal validation set contained 263 examples. Model labels and augmentation settings were iteratively refined while internal validation outputs were available. The final categorizer checkpoint was selected automatically by LabGym during the training procedure rather than manually by the authors. Training was conducted for eight epochs and the retained model was the model selected by LabGym after the training had converged. The authors did not manually select the final epoch based on validation accuracy or validation loss, and no additional author-defined early-stopping procedure was implemented.
2.3. Data Analysis
2.3.1. Internal Model Validation
The detector and behavior categorizer were evaluated separately during model development. These internal results were used to characterize model performance but were not treated as independent estimates of applied performance. The detector used a random image-level split, while the categorizer used a random 80/20 split at the behavior-example level. Because neither split was grouped by source video, recording session or institution, visually or temporally related material could occur in both training and validation subsets. Furthermore, internal validation results were available during iterative model refinement. The temporally held-out December footage described in Section 2.3.3 therefore provided the independent applied validation of the complete pipeline. Detector performance was summarized using COCO-style metrics. Average precision (AP) across intersection-over-union (IoU) thresholds 0.50–0.95 was the primary detector metric, with AP50 and AP75 reported separately. AP was calculated for bounding boxes and segmentation masks and by apparent object size (small, medium and large). The behavior categorizer’s internal validation output was summarized using overall accuracy and class-specific precision, recall and F1-score (Table 1). Macro averages treated all behavior classes equally, whereas weighted averages accounted for validation support. No universal pass/fail threshold was applied because detector AP, classification accuracy and F1-score measure different aspects of performance and are not directly comparable.
Table 1.
Overview of performance metrics used to evaluate the LabGym detector and behavior categorizer.
The following formulas were used to calculate metrics:
Class-specific metrics were interpreted descriptively, with particular attention to low-support classes and discrepancies between training and validation curves. No separate, untouched test set was used during iterative refinement.
The applied validation described below was therefore given greater weight than internal development metrics when assessing practical performance.
2.3.2. Post-Processing of LabGym Output
Following LabGym analysis, frame-level behavioral predictions were postprocessed in R (version 4.4.2) [33]. Behavior predictions were retained only when the corresponding animal was marked as detected and the behavior confidence was ≥0.60. The 0.60 confidence threshold was established during model development, before evaluation of the temporally held-out validation footage, as a balance between retaining potentially correct predictions and excluding low-confidence classifications. Between 17:00 and 08:00, likely static false detections were removed in 300 s windows when a track was detected for at least 10 s, at least 80% of frame-to-frame movements were <5 pixels, and median frame-to-frame movement was ≤1 pixel. In Aalborg, where the held-out lion group contained no adult male, detections assigned to the adult-male class were reassigned to the mixed-group class for downstream animal-type matching. Short behavior flickers <0.2 s were smoothed to the adjacent behavior.
Retained predictions were converted to animal-time using the video frame interval. When multiple lions were simultaneously visible, each detected animal contributed separately to behavioral duration. Cleaned outputs were aggregated by video, enclosure, animal class and behavior for validation.
Pacing-like locomotion was detected in a separate centroid-based post-processing step because repeated back-and-forth movement is a temporal pattern rather than a single-frame posture. The automated term “pacing-like” is used because a geometric movement pattern alone does not establish that a bout is stereotypic. Tracks were split when detection gaps exceeded 2 s or apparent movement exceeded four body heights per second; gaps of ≤1 s could be linearly interpolated. Tracking points contributed only when the associated behavior-model probability was ≥0.70. Movement was evaluated in 30 s windows advanced in 5 s steps, and centroid coordinates were projected onto the dominant movement axis using principal component analysis (PCA).
A window was classified as pacing-like when at least 70% of points were detected, at least 80 valid points were available, total path length was ≥2.5 apparent body heights, there were ≥3 directional reversals, path linearity (net displacement/total distance) was ≤0.40, the dominant PCA axis explained ≥70% of positional variance, and the track switched between its 20th- and 80th-percentile endpoints at least twice. Reversal counting used 0.5 s positional smoothing and ignored excursions of <0.35 body heights. Positive windows belonging to the same tracklet were merged when separated by no more than the 5 s window step. These thresholds were fixed before the pooled validation reported here.
2.3.3. Manual Ground-Truth Annotation and Applied Validation
To evaluate the performance of the complete applied analysis pipeline, an additional ground-truth validation was performed using manually annotated video segments. This validation differed from the internal LabGym validation because it tested the full workflow on video material after preprocessing, detection, confidence filtering, behavior classification and post-processing. The total manually annotated behavioral duration per category is summarized in Appendix Table A2, while the count can be found in Appendix Table A3.
The ground-truth dataset was balanced to include one hour of annotated material per zoo collected from randomized 5 min clips. This was distributed equally between cameras, with 20 min per camera for Aalborg Zoo and Odense Zoo, and 30 min per camera for Copenhagen Zoo. Within each zoo, the selected material consisted of approximately 80% daytime and 20% nighttime footage. Rare behaviors were prioritized to ensure that they each made up at least 5% of the selected material. Vocalization did not reach 5% as only two instances were found in the whole study period and were therefore excluded from the confusion matrix.
Because individual identity was not retained in the downstream analyses, validation was performed at the animal-type level rather than at the individual level. Manual annotations were therefore pooled by video, frame, and animal type, and compared with LabGym predictions pooled using the same structure. This ensured that all individuals belonging to the same animal type, such as all cubs within a video frame, contributed to a shared behavioral pool.
LabGym predictions were filtered using the preprocessing criteria, including confidence filtering, detection-based filtering and removal of static nighttime false detections.
Stereotypic pacing was incorporated as a post-processing prediction rather than as a direct LabGym behavior class. Pacing intervals identified from centroid tracking were used to overwrite the LabGym behavior prediction as pacing behavior when they overlapped with the corresponding animal-type prediction. A temporal tolerance was applied to account for the rolling-window structure of the pacing detector.
All applied ground-truth annotations were completed by a single observer who was a biologist with experience in behavioral biology. The behavioral definitions used in the study-specific ethogram had been agreed upon before annotation, and the observer annotated the validation footage according to the same ethogram used during model development. The observer was unaware of the corresponding model predictions while performing the manual annotations. No independent inter-rater reliability assessment was conducted for the applied validation dataset.
Confusion matrices were generated from pooled lion-seconds, with rows representing manually annotated behaviors and columns representing pipeline outcomes, including “No prediction” as an explicit outcome. Missing predictions were treated as false negatives in recall and F1-score calculations and as errors in overall end-to-end accuracy. Extra model predictions without a corresponding manually annotated lion-second were retained as false positives in precision and F1-score calculations but were not included in the denominator of manual-time accuracy. Macro-averaged metrics weighted all behavior classes equally, whereas support-weighted metrics weighted class-specific performance according to the number of manually annotated lion-seconds. For the grouped analysis, feeding, interacting, locomotion, marking and vocalization were combined as active behavior; inactive and self-grooming were combined as inactive/maintenance behavior; and pacing-like locomotion was retained as a separate category. Fine-scale and grouped analyses were performed for the complete validation dataset and separately for each zoological institution.
2.3.4. Coverage-Aware Metrics, Baselines and Uncertainty
Applied performance was evaluated in two complementary ways: prediction coverage and classification accuracy. Prediction coverage describes how often the pipeline produces a usable behavior prediction. It was calculated as the proportion of manually annotated lion-seconds for which the pipeline produced a retained prediction after detection and confidence filtering. A lion-second was therefore considered covered only when the animal was detected and a behavior prediction remained after filtering.
Two measures of accuracy were then calculated. End-to-end accuracy described the performance of the complete pipeline and was calculated as the proportion of all manually annotated lion-seconds that were classified correctly. If the pipeline failed to produce a prediction for a manually observed lion-second, that second was counted as incorrect. Conditional accuracy described how accurately behavior was classified when the pipeline successfully produced a prediction. It was therefore calculated only from lion-seconds with a retained prediction. Together, these measures made it possible to distinguish between errors caused by the pipeline failing to produce a prediction and errors caused by assigning the wrong behavior. Prediction coverage was also summarized separately by zoological institution, behavior, animal category, camera and day/night period (Appendix D).
Because some behaviors occurred much more often than others, pipeline performance was also compared with a simple majority-class baseline. This baseline represents the accuracy that would be obtained by always predicting the most common manually observed behavior, without using any video information. Separate baselines were calculated for the fine-scale behavior categories and for the broader grouped activity categories. This provided a simple reference for assessing whether the pipeline performed better than a strategy based only on which behavior was most common.
3. Results
3.1. Detector Training Performance
Detector training loss decreased from 2.72 early in training to 0.24 at the final recorded iteration. The detector validation set contained 409 annotated lion instances, comprising 99 adult-male, 279 mixed-group and 31 cub instances. Detector performance was evaluated separately for bounding-box detection and segmentation masks.
Overall average precision (AP) was 47.1% for bounding boxes and 41.6% for segmentation masks. At an intersection-over-union threshold of 0.50, AP50 was 73.9% for bounding boxes and 72.1% for segmentation masks (Table 2). Performance increased with apparent object size: bounding-box AP was 39.2% for small, 59.5% for medium and 62.9% for large objects, while segmentation AP was 31.9%, 51.2% and 67.1%, respectively.
Table 2.
COCO-style detector validation results for bounding-box detection and segmentation. AP is reported as percentage average precision.
Per-category bounding-box AP was 53.0% for adult males, 57.0% for the mixed group and 31.2% for cubs. Corresponding segmentation AP values were 46.5%, 52.3% and 26.0%, respectively (Table 3). The cub estimates were based on only 31 validation instances, compared with 99 adult male and 279 mixed-group instances.
Table 3.
Per-category detector validation results. AP is reported as percentage average precision.
3.2. Behavior Categorizer Training Performance
The behavior categorizer was developed using seven behavior categories: feeding, inactive, interacting, locomotion, marking, self-grooming and vocalization. Before augmentation, the prepared dataset contained 1315 behavior examples. Interacting was the most frequent category with 354 examples (26.9%), followed by inactive with 264 (20.1%), locomotion with 255 (19.4%), feeding with 160 (12.2%), vocalization with 127 (9.7%), self-grooming with 95 (7.2%) and marking with 60 (4.6%). Following LabGym’s internal data splitting and augmentation procedures, 37,872 augmented training examples and 263 validation examples were created. Overall validation accuracy was 0.62. Weighted precision, recall, and F1-score were 0.63, 0.62, and 0.62, respectively, while macro-averaged precision, recall, and F1-score were 0.60, 0.59, and 0.59 (Table 4).
Table 4.
Precision, recall and F1-score are shown for each behavior category using the internal validation set. Support indicates the number of validation examples for each behavior. Macro averages treat all behaviors equally, whereas weighted averages account for differences in the number of validation examples per behavior.
Class-specific F1-scores ranged from 0.29 to 0.67. Vocalization had the highest F1-score (0.67), followed by locomotion (0.66), self-grooming (0.65), interacting (0.64), inactive (0.62) and feeding (0.61). Marking had the lowest F1-score (0.29), based on 12 validation examples. Precision and recall for marking were 0.33 and 0.25, respectively.
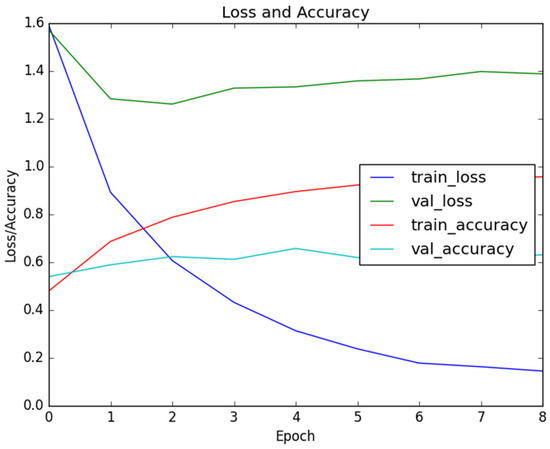
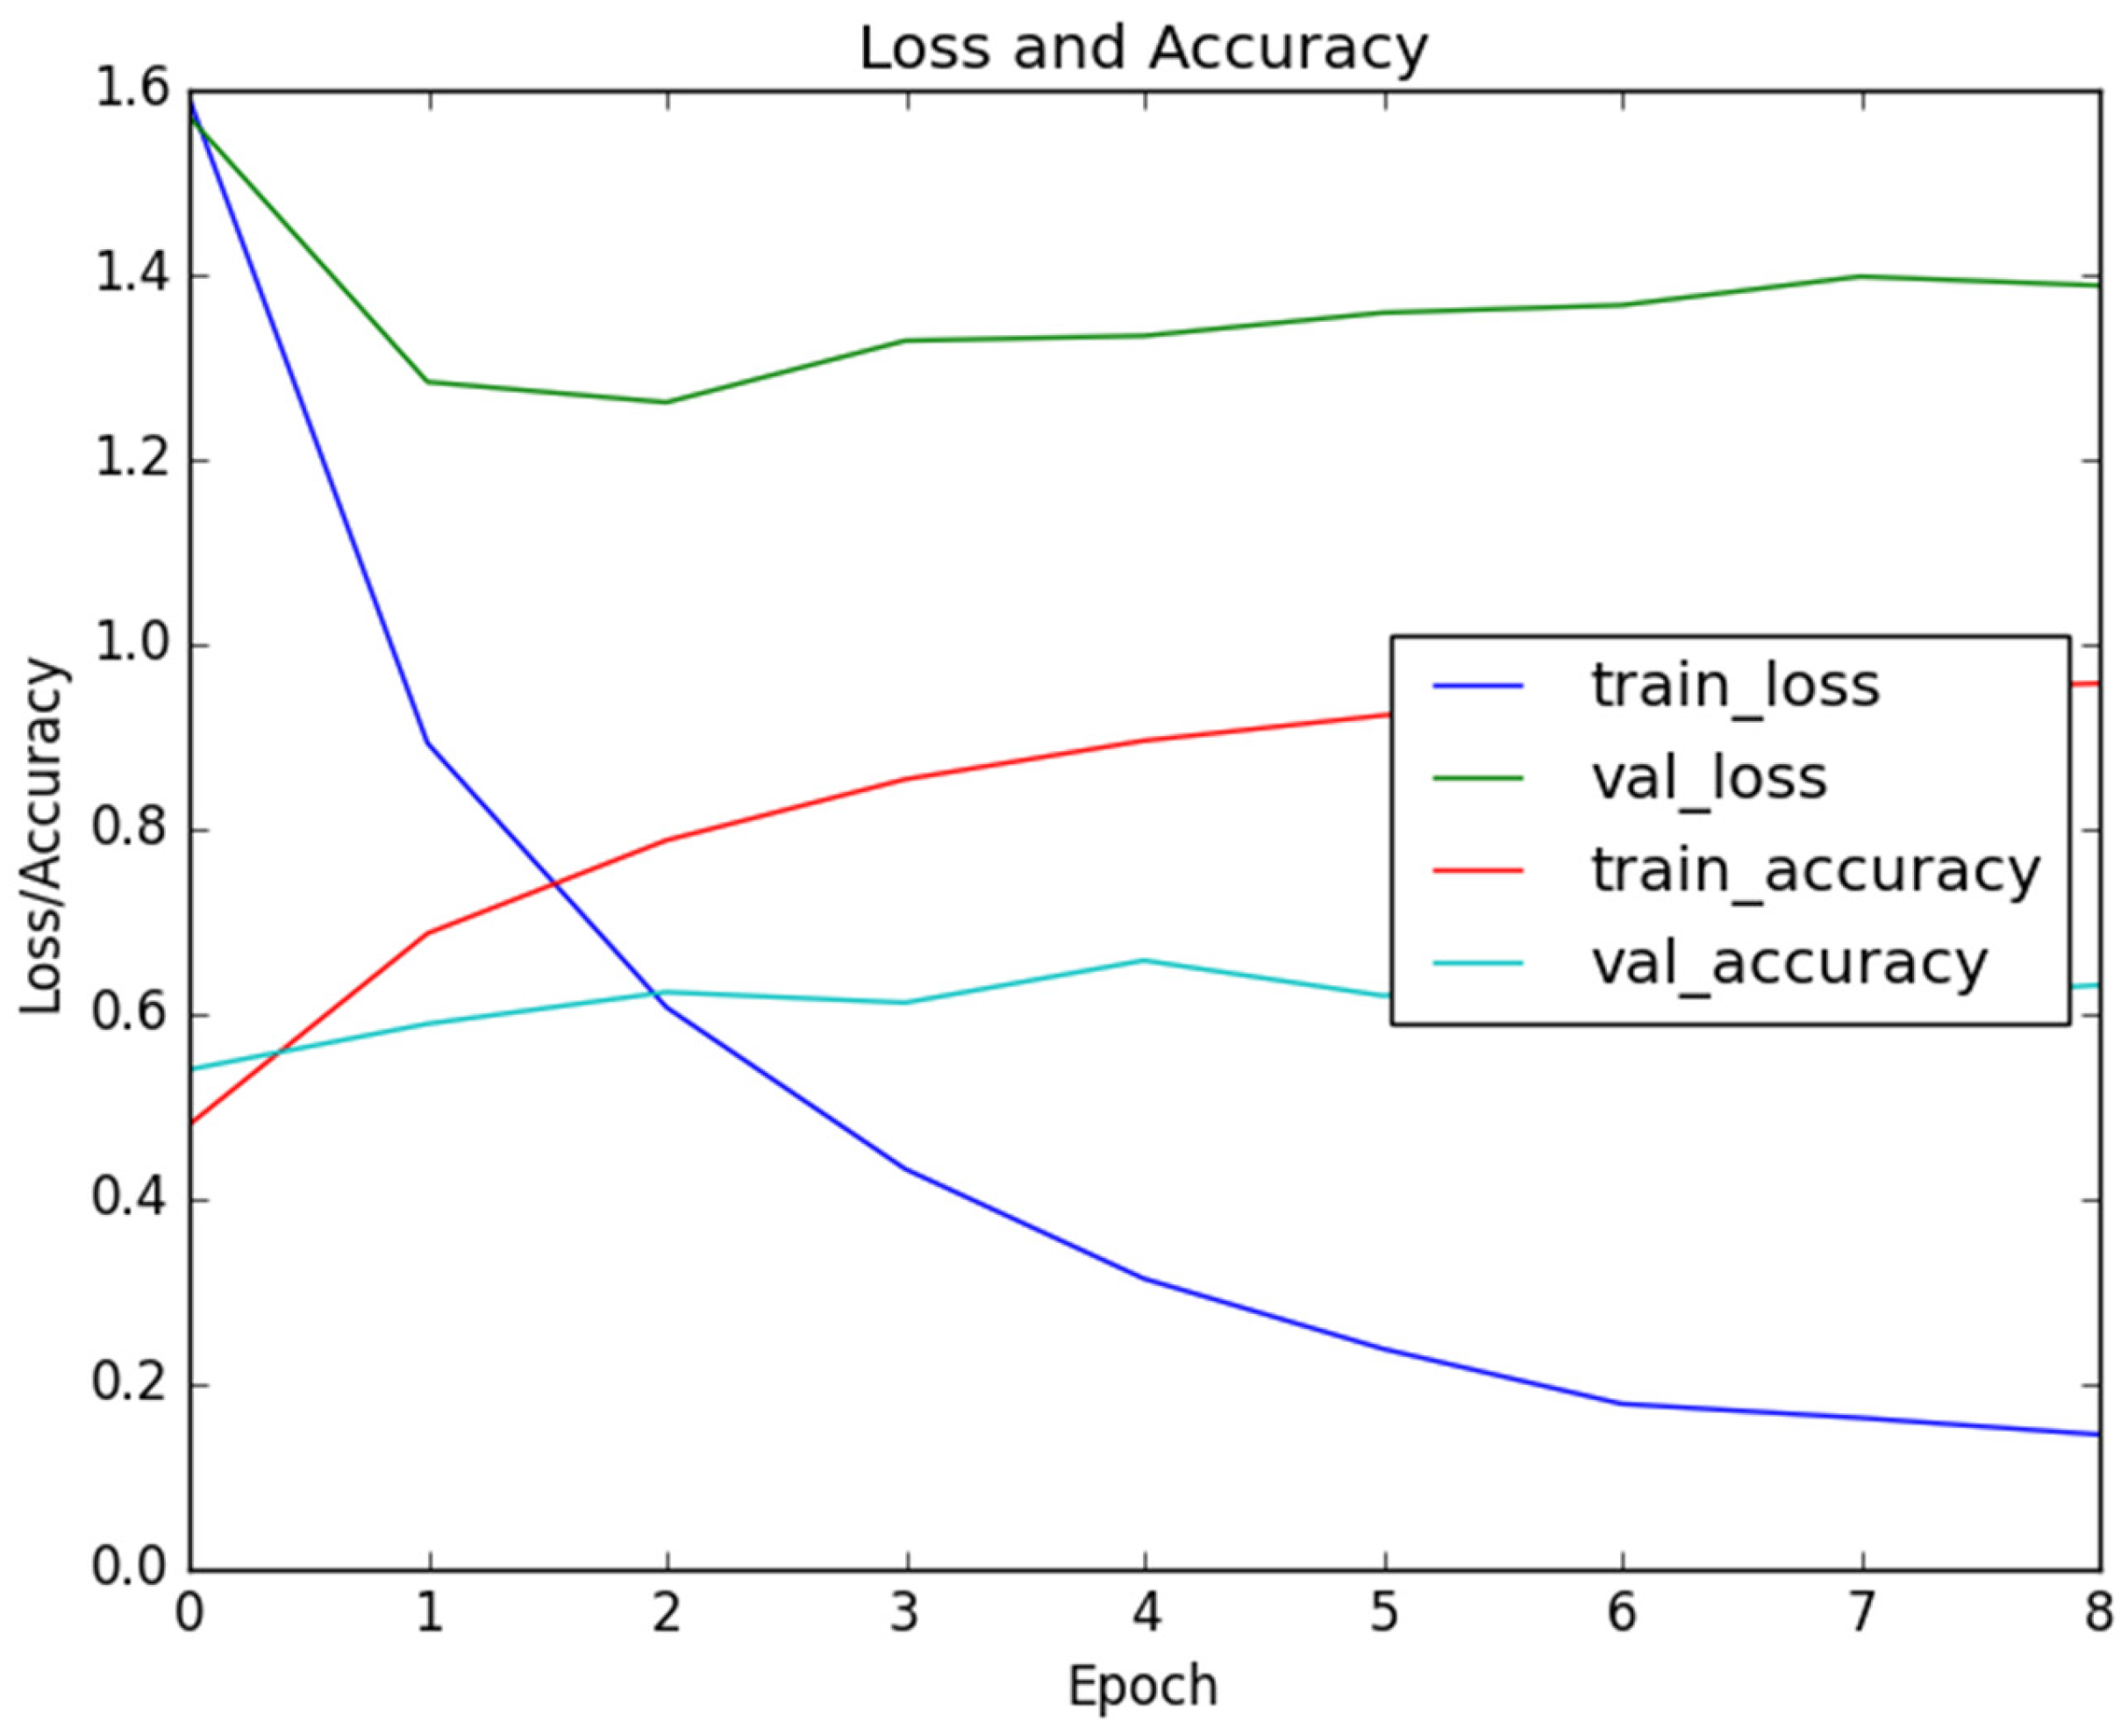
Training accuracy increased across epochs and reached approximately 0.95, whereas validation accuracy remained approximately 0.60–0.65 (Figure 4). Consequently, the difference between training and validation accuracy increased during training.
Figure 4.
The figure shows changes in accuracy and loss during training. Training accuracy increased and training loss decreased across epochs, while validation accuracy remained lower and changed less across training.
3.3. Pooled Ground-Truth Validation on Manually Annotated Video Segments
The temporally held-out applied validation contained 7158.9 pooled, manually annotated lion-seconds. Of this manually annotated lion-time, 3766.9 s could be matched to a retained pipeline behavior prediction, corresponding to a prediction coverage of 52.6%.
The remaining 3392.0 s (47.4%) had no matched behavior prediction and were therefore represented as “No prediction” in the confusion matrices. In addition, the pipeline produced 521.8 s of retained behavior predictions that could not be matched to manually annotated lion-time. These extra predictions were treated as false positives when calculating precision and F1-score but were not included in the denominator used to calculate accuracy from manually annotated lion-time.
At the fine-scale behavior level, 1656.2 of the 7158.9 manually annotated lion-seconds were classified correctly, corresponding to an end-to-end accuracy of 0.231. Macro-averaged precision, recall and F1-score were 0.396, 0.180 and 0.215, respectively. Support-weighted precision, recall and F1-score were 0.439, 0.231 and 0.273. When only the 3766.9 manually annotated lion-seconds with a retained behavior prediction were considered, conditional accuracy was 0.440 (Table 5).
Table 5.
Prediction coverage and end-to-end versus conditional accuracy in the temporally held-out applied validation. Conditional accuracy uses only manually annotated lion-seconds with a retained pipeline prediction.
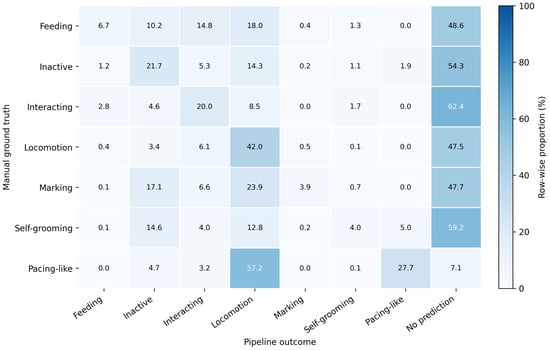
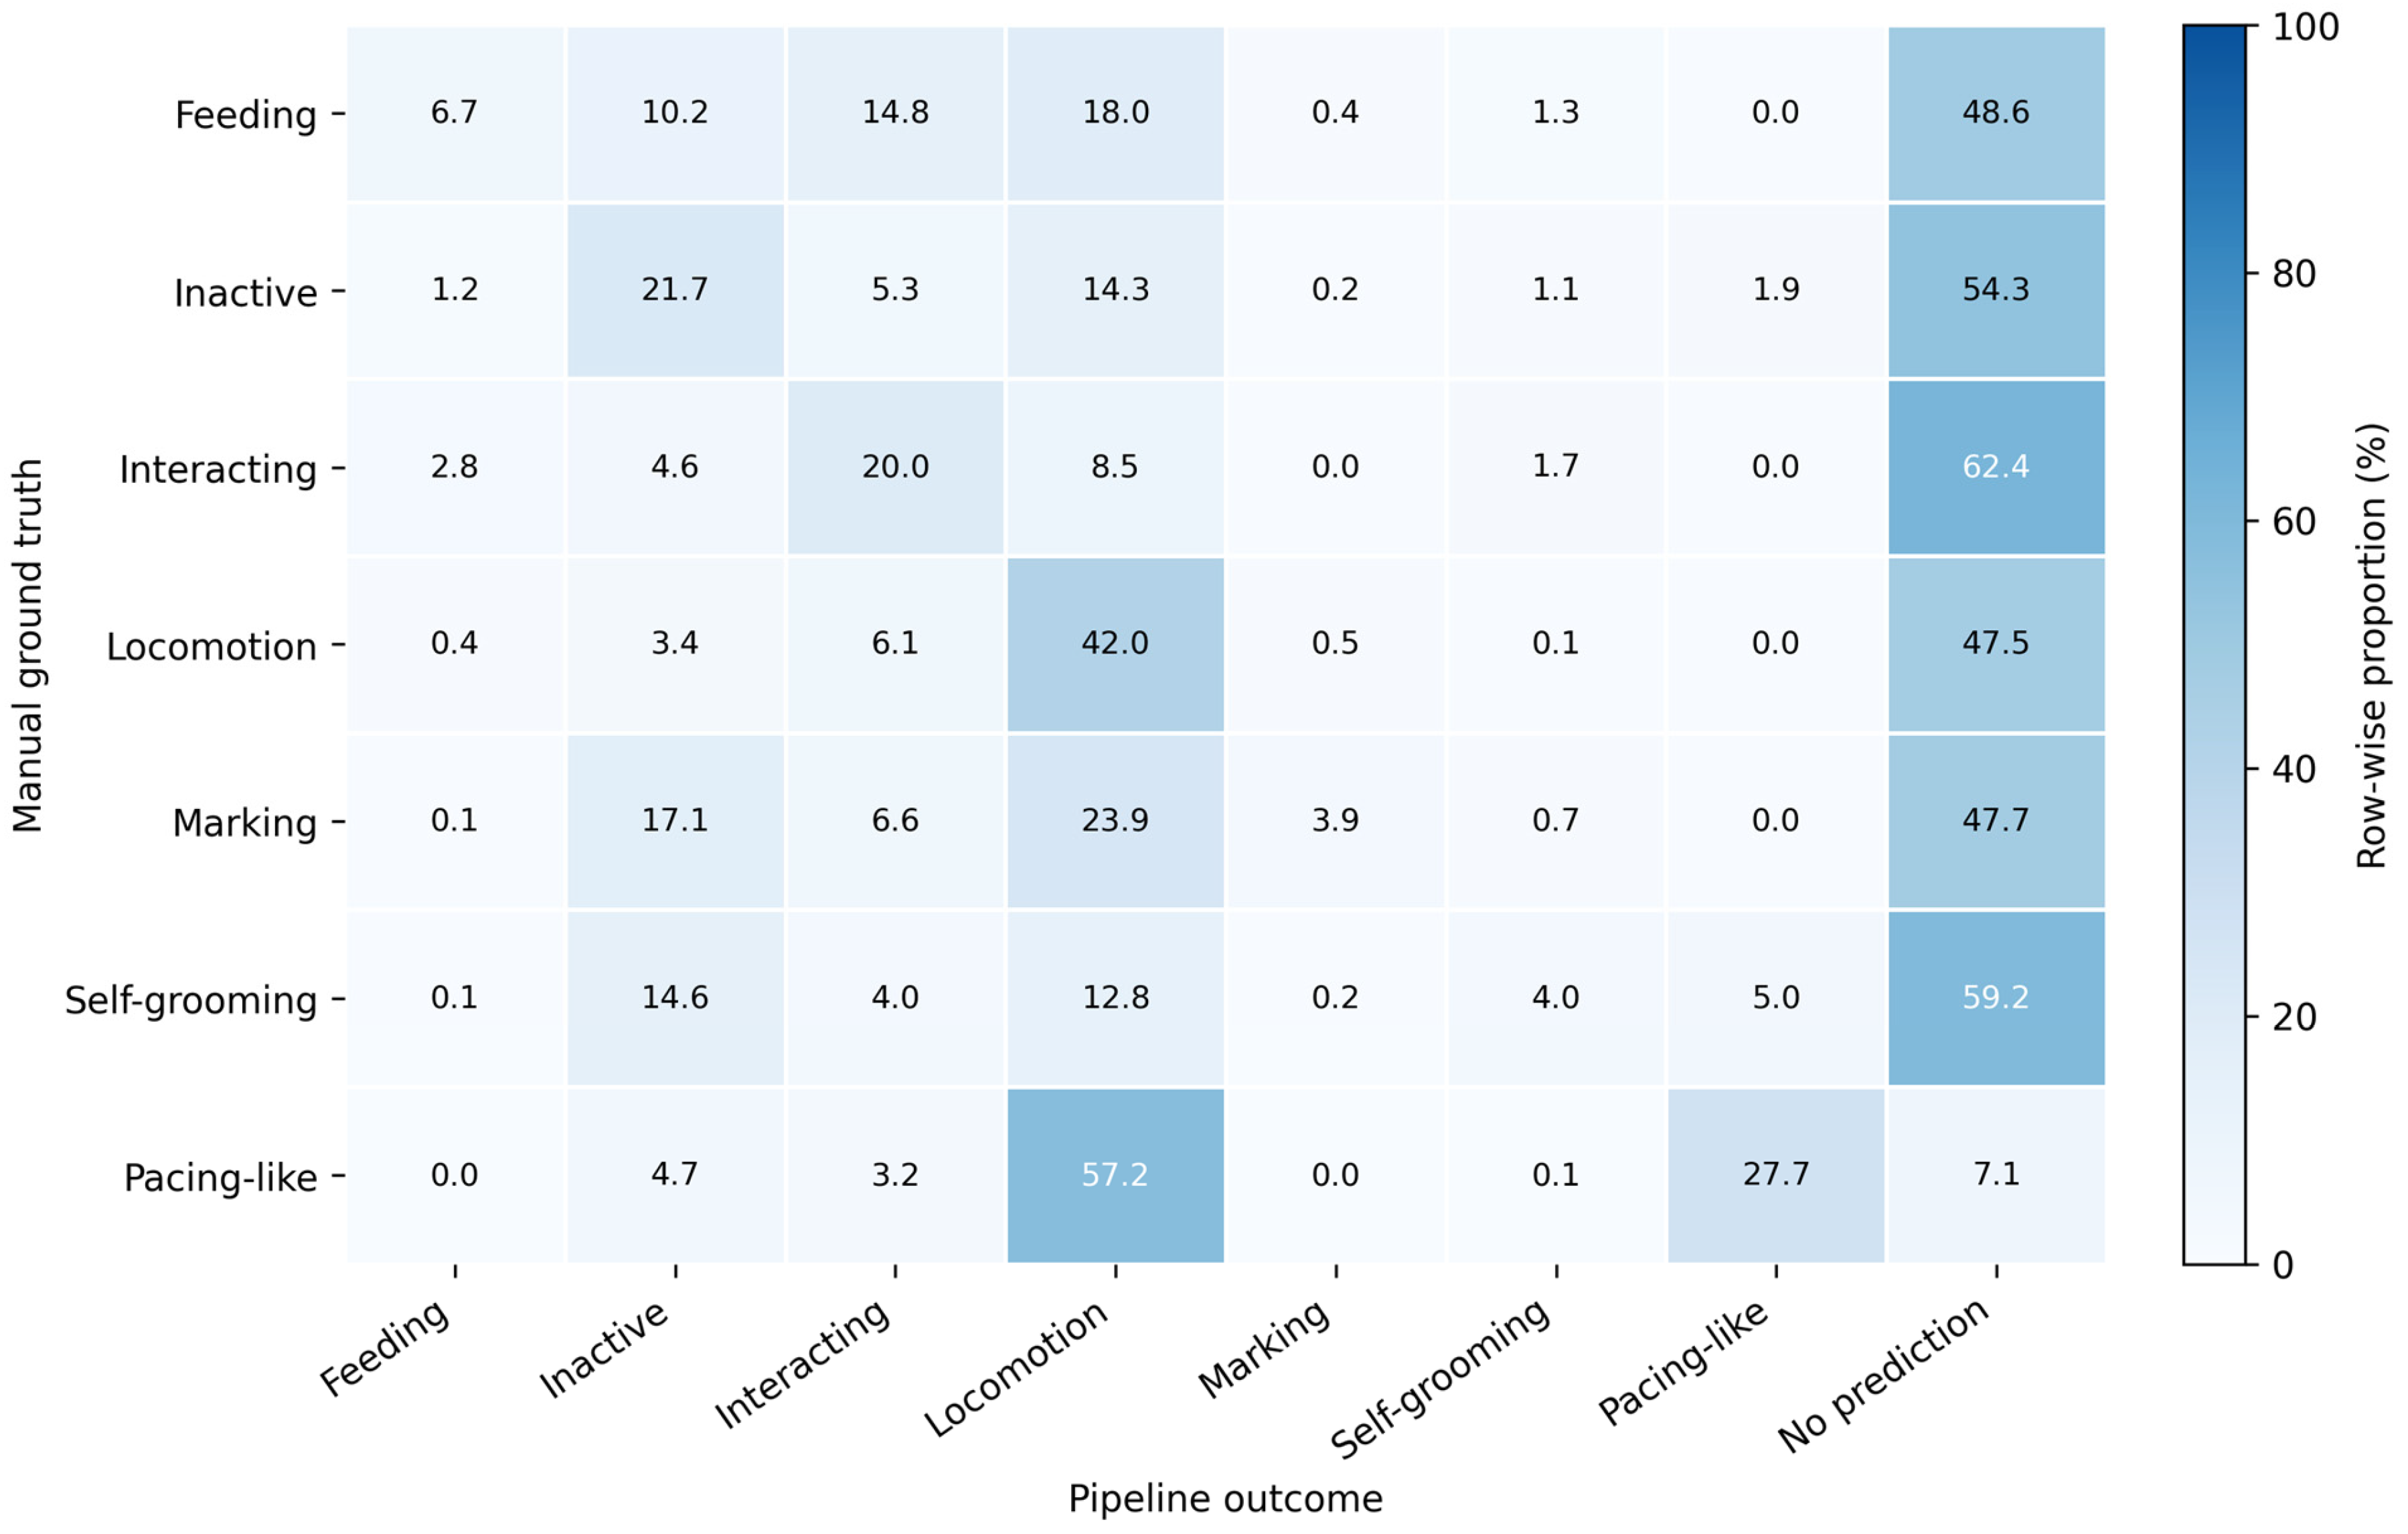
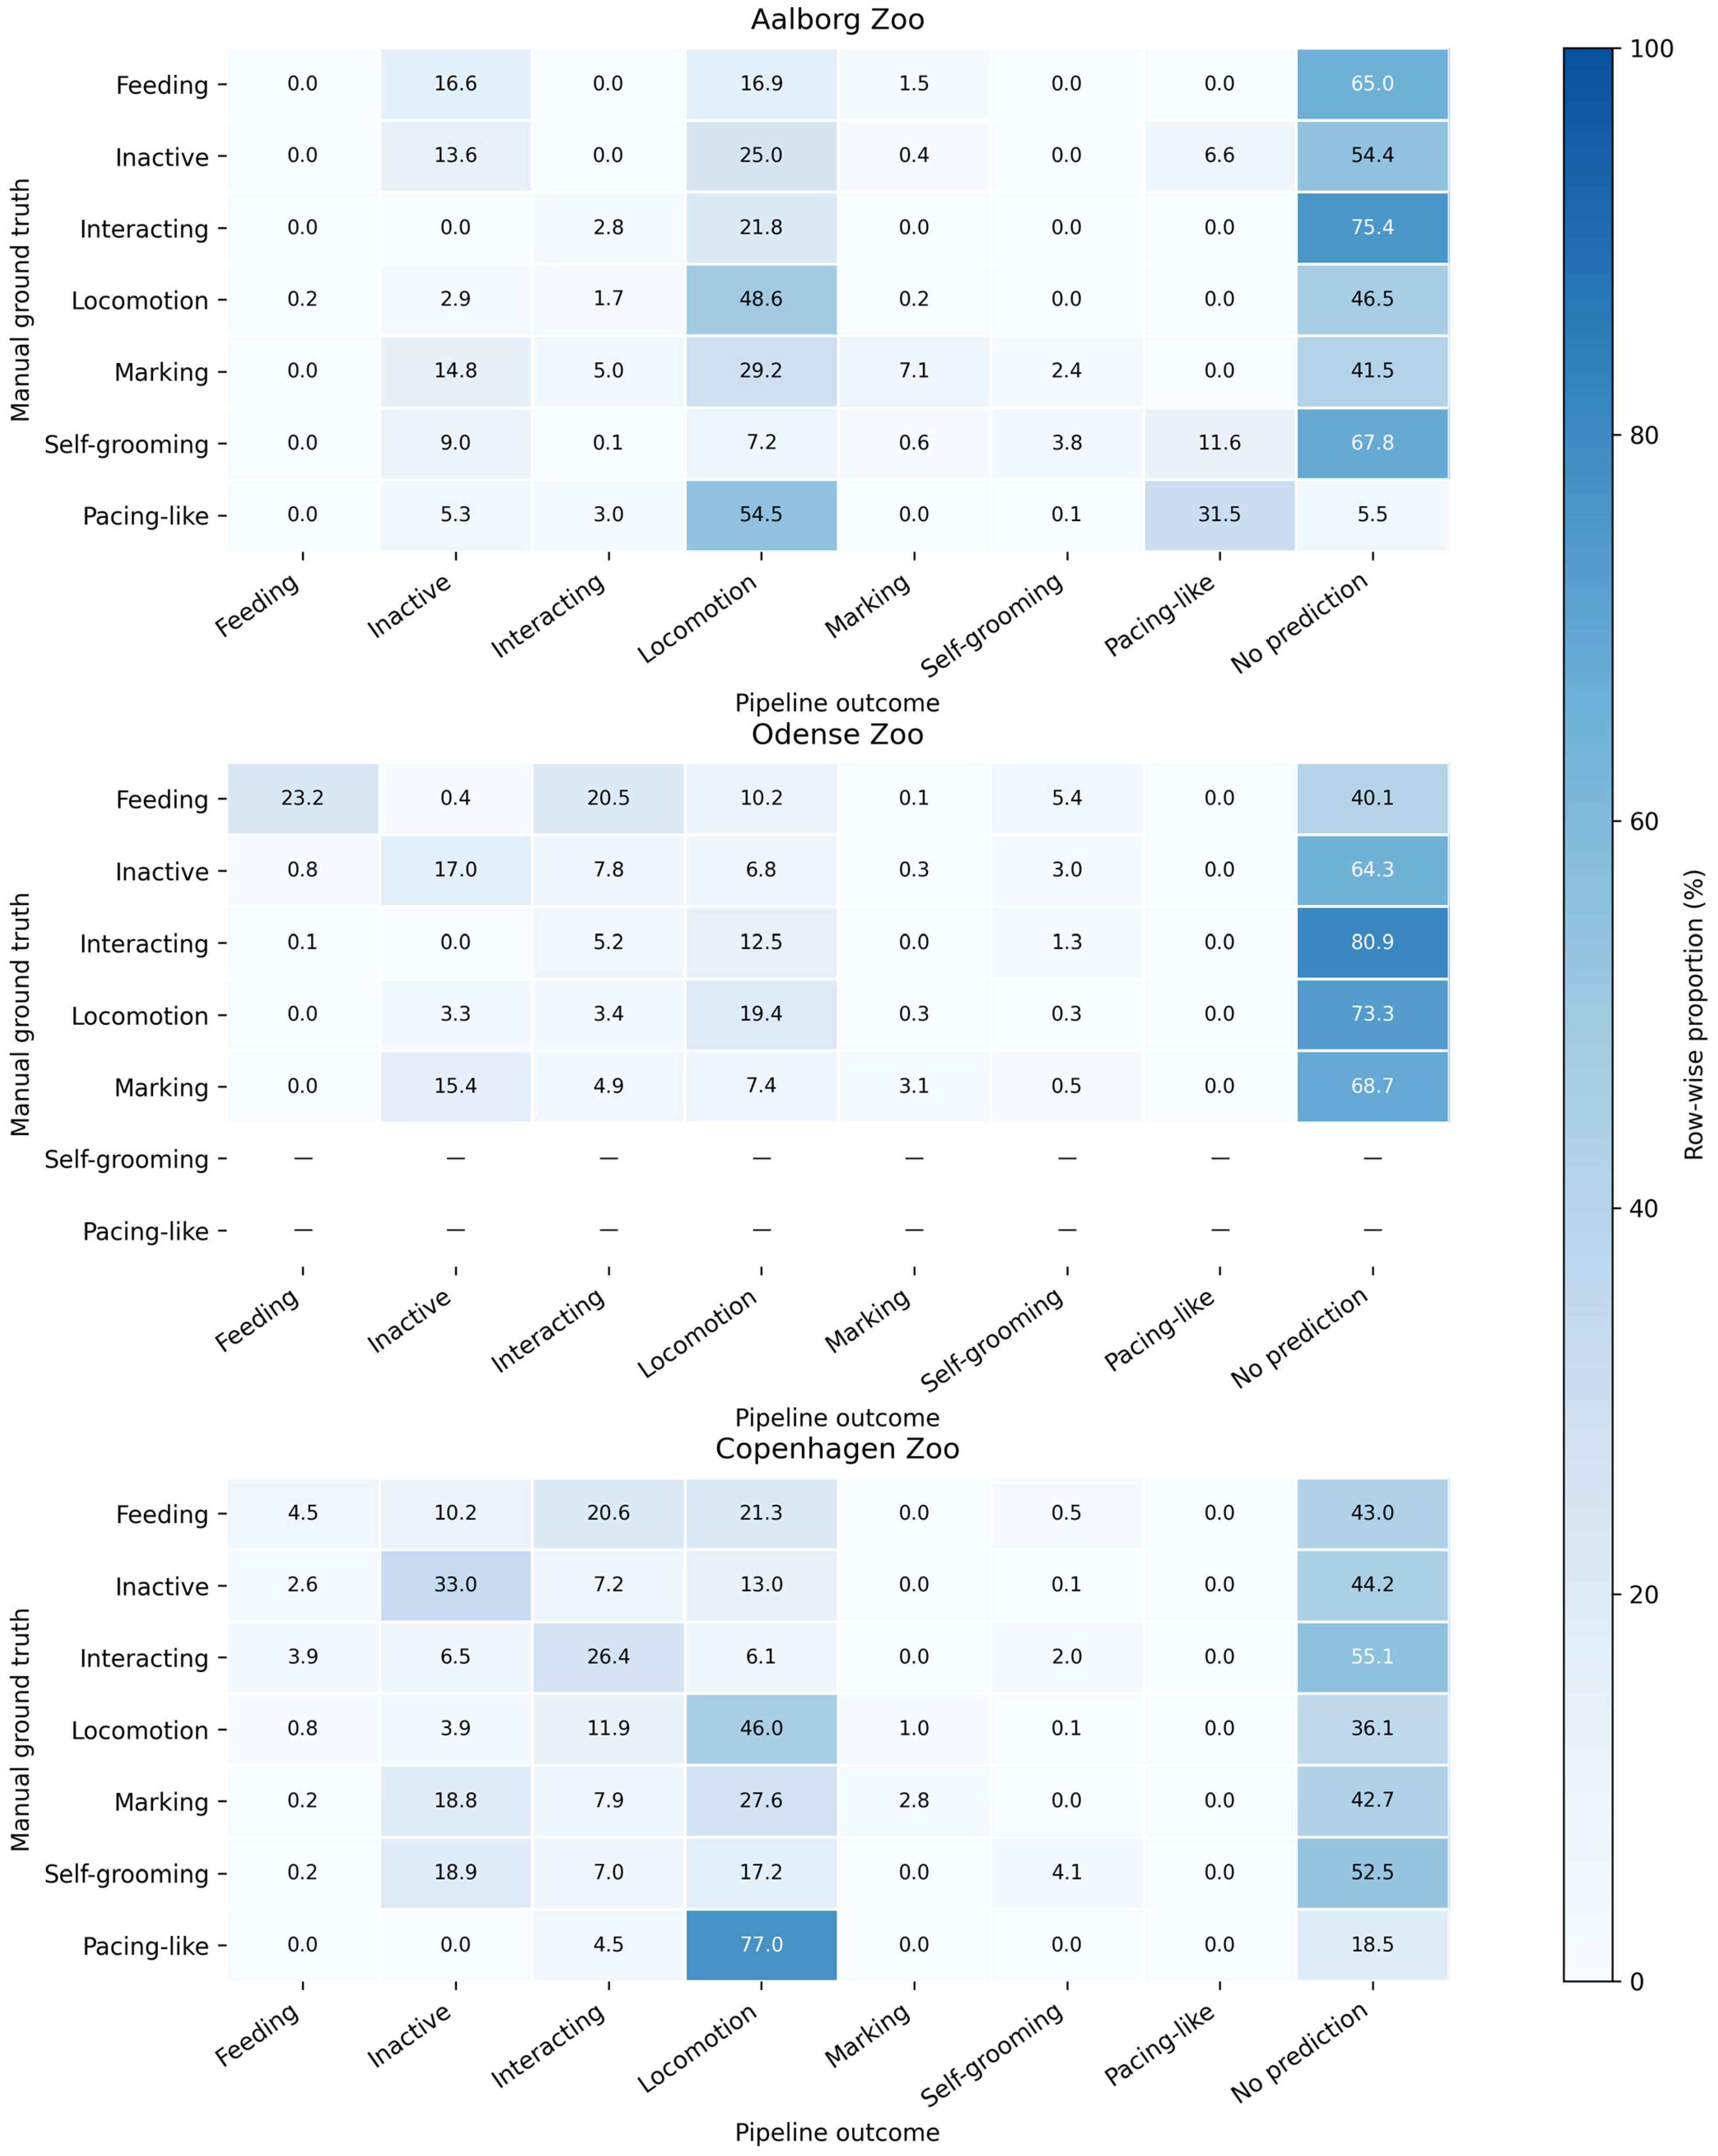
The fine-scale confusion matrix shows substantial variation among behaviors in both prediction coverage and classification outcome (Figure 5). “No prediction” accounted for 48.6% of manually observed feeding, 54.3% of inactive behavior, 62.4% of interacting, 47.5% of locomotion, 47.7% of marking, 59.2% of self-grooming and 7.1% of pacing-like locomotion. When all manually annotated lion-time was included, the proportion correctly classified as the corresponding behavior was 6.7% for feeding, 21.7% for inactive, 20.0% for interacting, 42.0% for locomotion, 3.9% for marking, 4.0% for self-grooming and 27.7% for pacing-like locomotion.
Figure 5.
Fine-scale confusion matrix for the held-out applied validation. Rows are manual behaviors; columns are pipeline outcomes. Values are row-wise percentages and explicitly include “No prediction”. “Pacing-like” denotes the centroid-based pacing-like locomotion output.
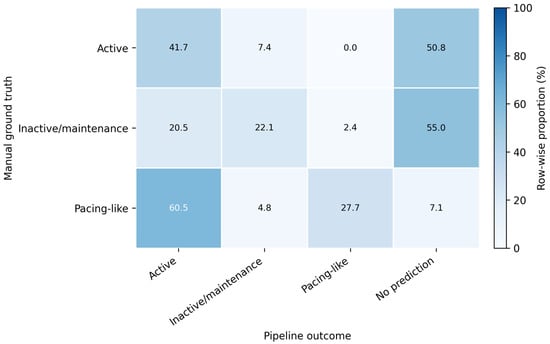
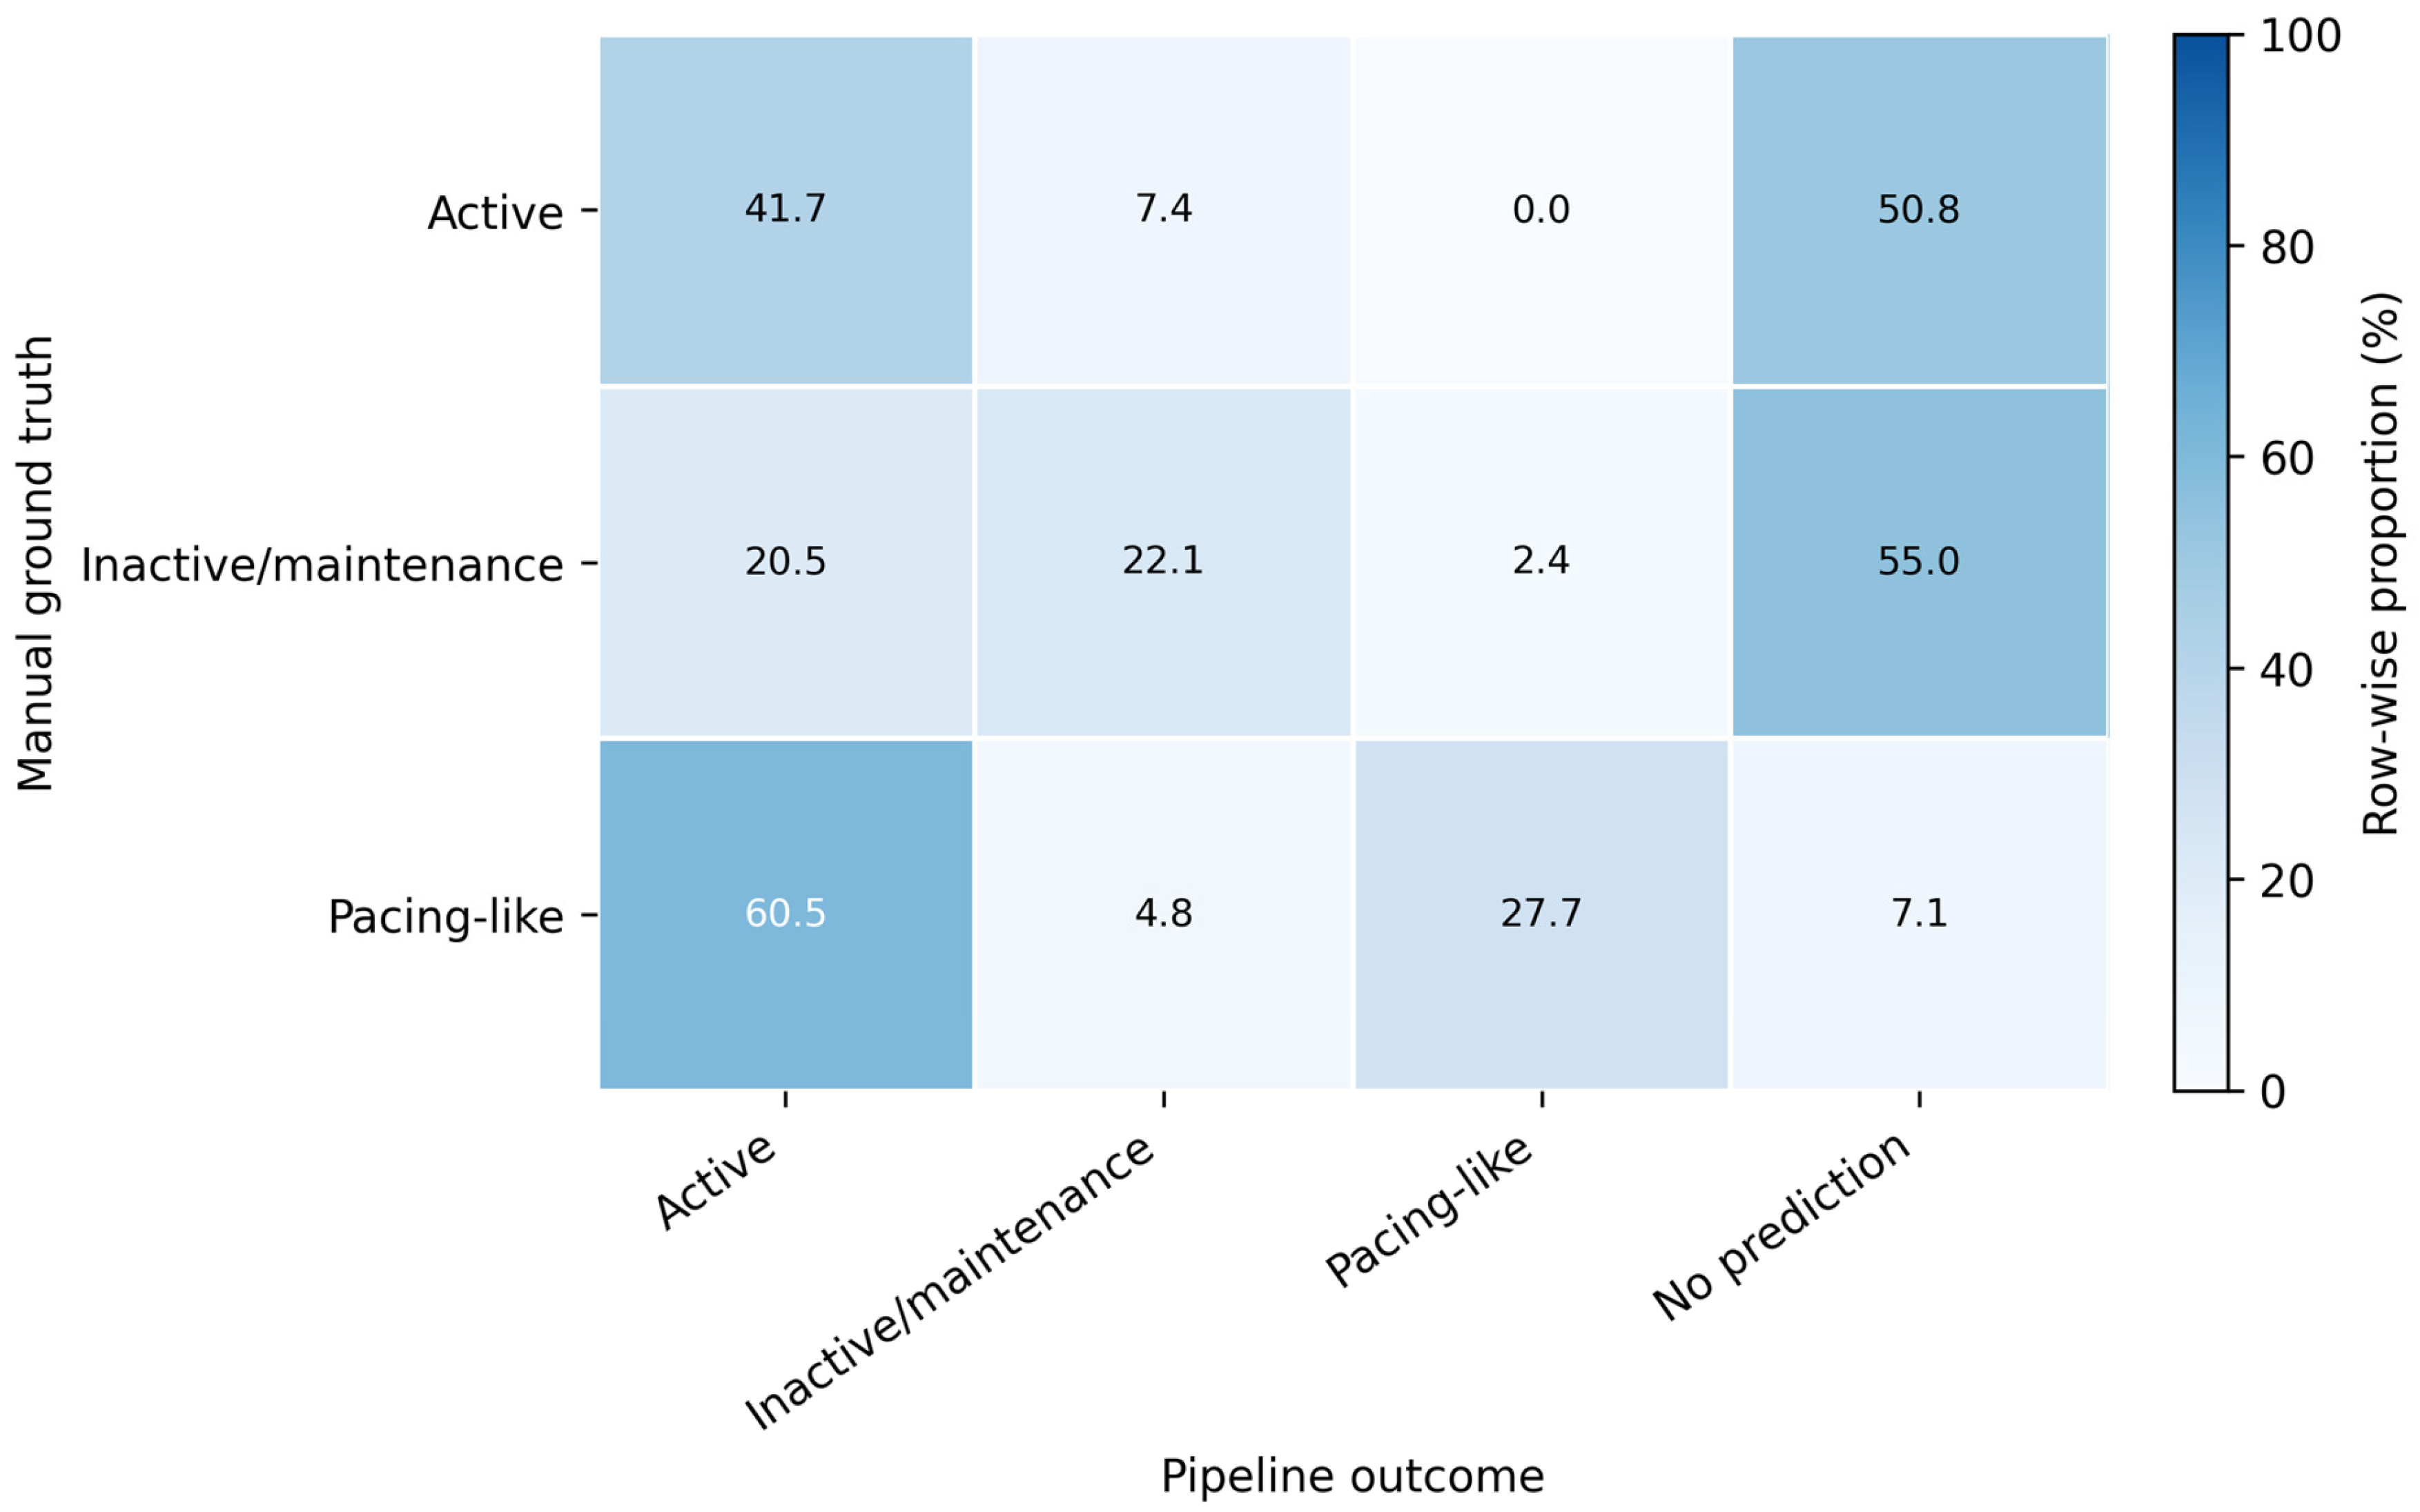
Grouping behaviors into active, inactive/maintenance, and pacing-like locomotion increased end-to-end accuracy from 0.231 to 0.317. At the grouped level, macro-averaged precision, recall and F1-score were 0.559, 0.305 and 0.383, respectively, while support-weighted precision, recall and F1-score were 0.556, 0.317 and 0.388. Conditional grouped accuracy was 0.602.
The grouped confusion matrix shows that 41.7% of manually observed active lion-time was correctly classified as active, while 50.8% received no prediction (Figure 6). For inactive/maintenance behavior, 22.1% was correctly classified and 55.0% received no prediction. Pacing-like locomotion differed from the other two groups: only 7.1% received no prediction, but 60.5% was classified as active and 27.7% was correctly classified as pacing-like locomotion.
Figure 6.
Activity-grouped confusion matrix for the held-out applied validation. Behaviors were grouped as active, inactive/maintenance and pacing-like locomotion. Values are row-wise percentages and include “No prediction” as a pipeline outcome.
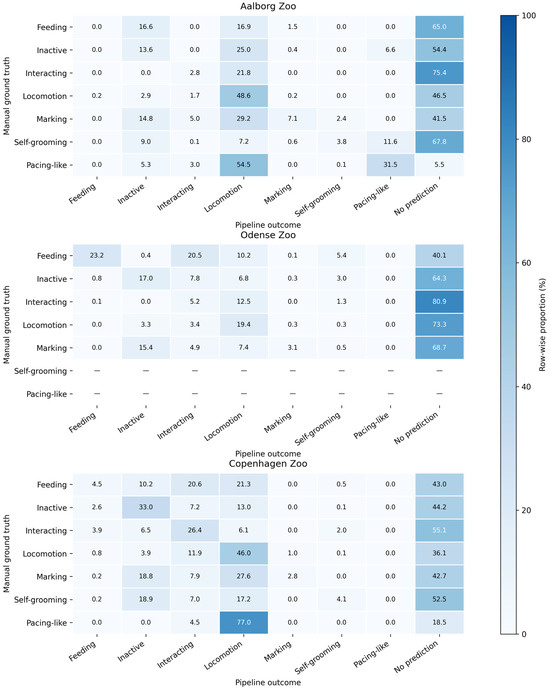
Prediction coverage differed substantially among institutions (Table 5; Figure 7). Coverage was highest in Aalborg Zoo at 59.8%, followed by Copenhagen Zoo at 56.2%, and was lowest in Odense Zoo at 33.8%. The corresponding proportions of manually annotated lion-time without a retained prediction were 40.2%, 43.8% and 66.2%, respectively.
Figure 7.
Fine-scale applied validation confusion matrices by institution. Values are row-wise percentages and include “No prediction”. Rows shown with a dash had no manual support in that institution’s final pooled validation set.
Fine-scale end-to-end accuracy was 0.250 in Aalborg, 0.160 in Odense and 0.253 in Copenhagen. Macro-F1 was 0.192, 0.201 and 0.223, respectively, while weighted F1 was 0.280, 0.247 and 0.297. In contrast, conditional fine-scale accuracy, calculated only where a retained prediction was available, was 0.418 in Aalborg, 0.472 in Odense and 0.451 in Copenhagen. Thus, Odense had the lowest end-to-end accuracy but the highest conditional fine-scale accuracy of the three institutions.
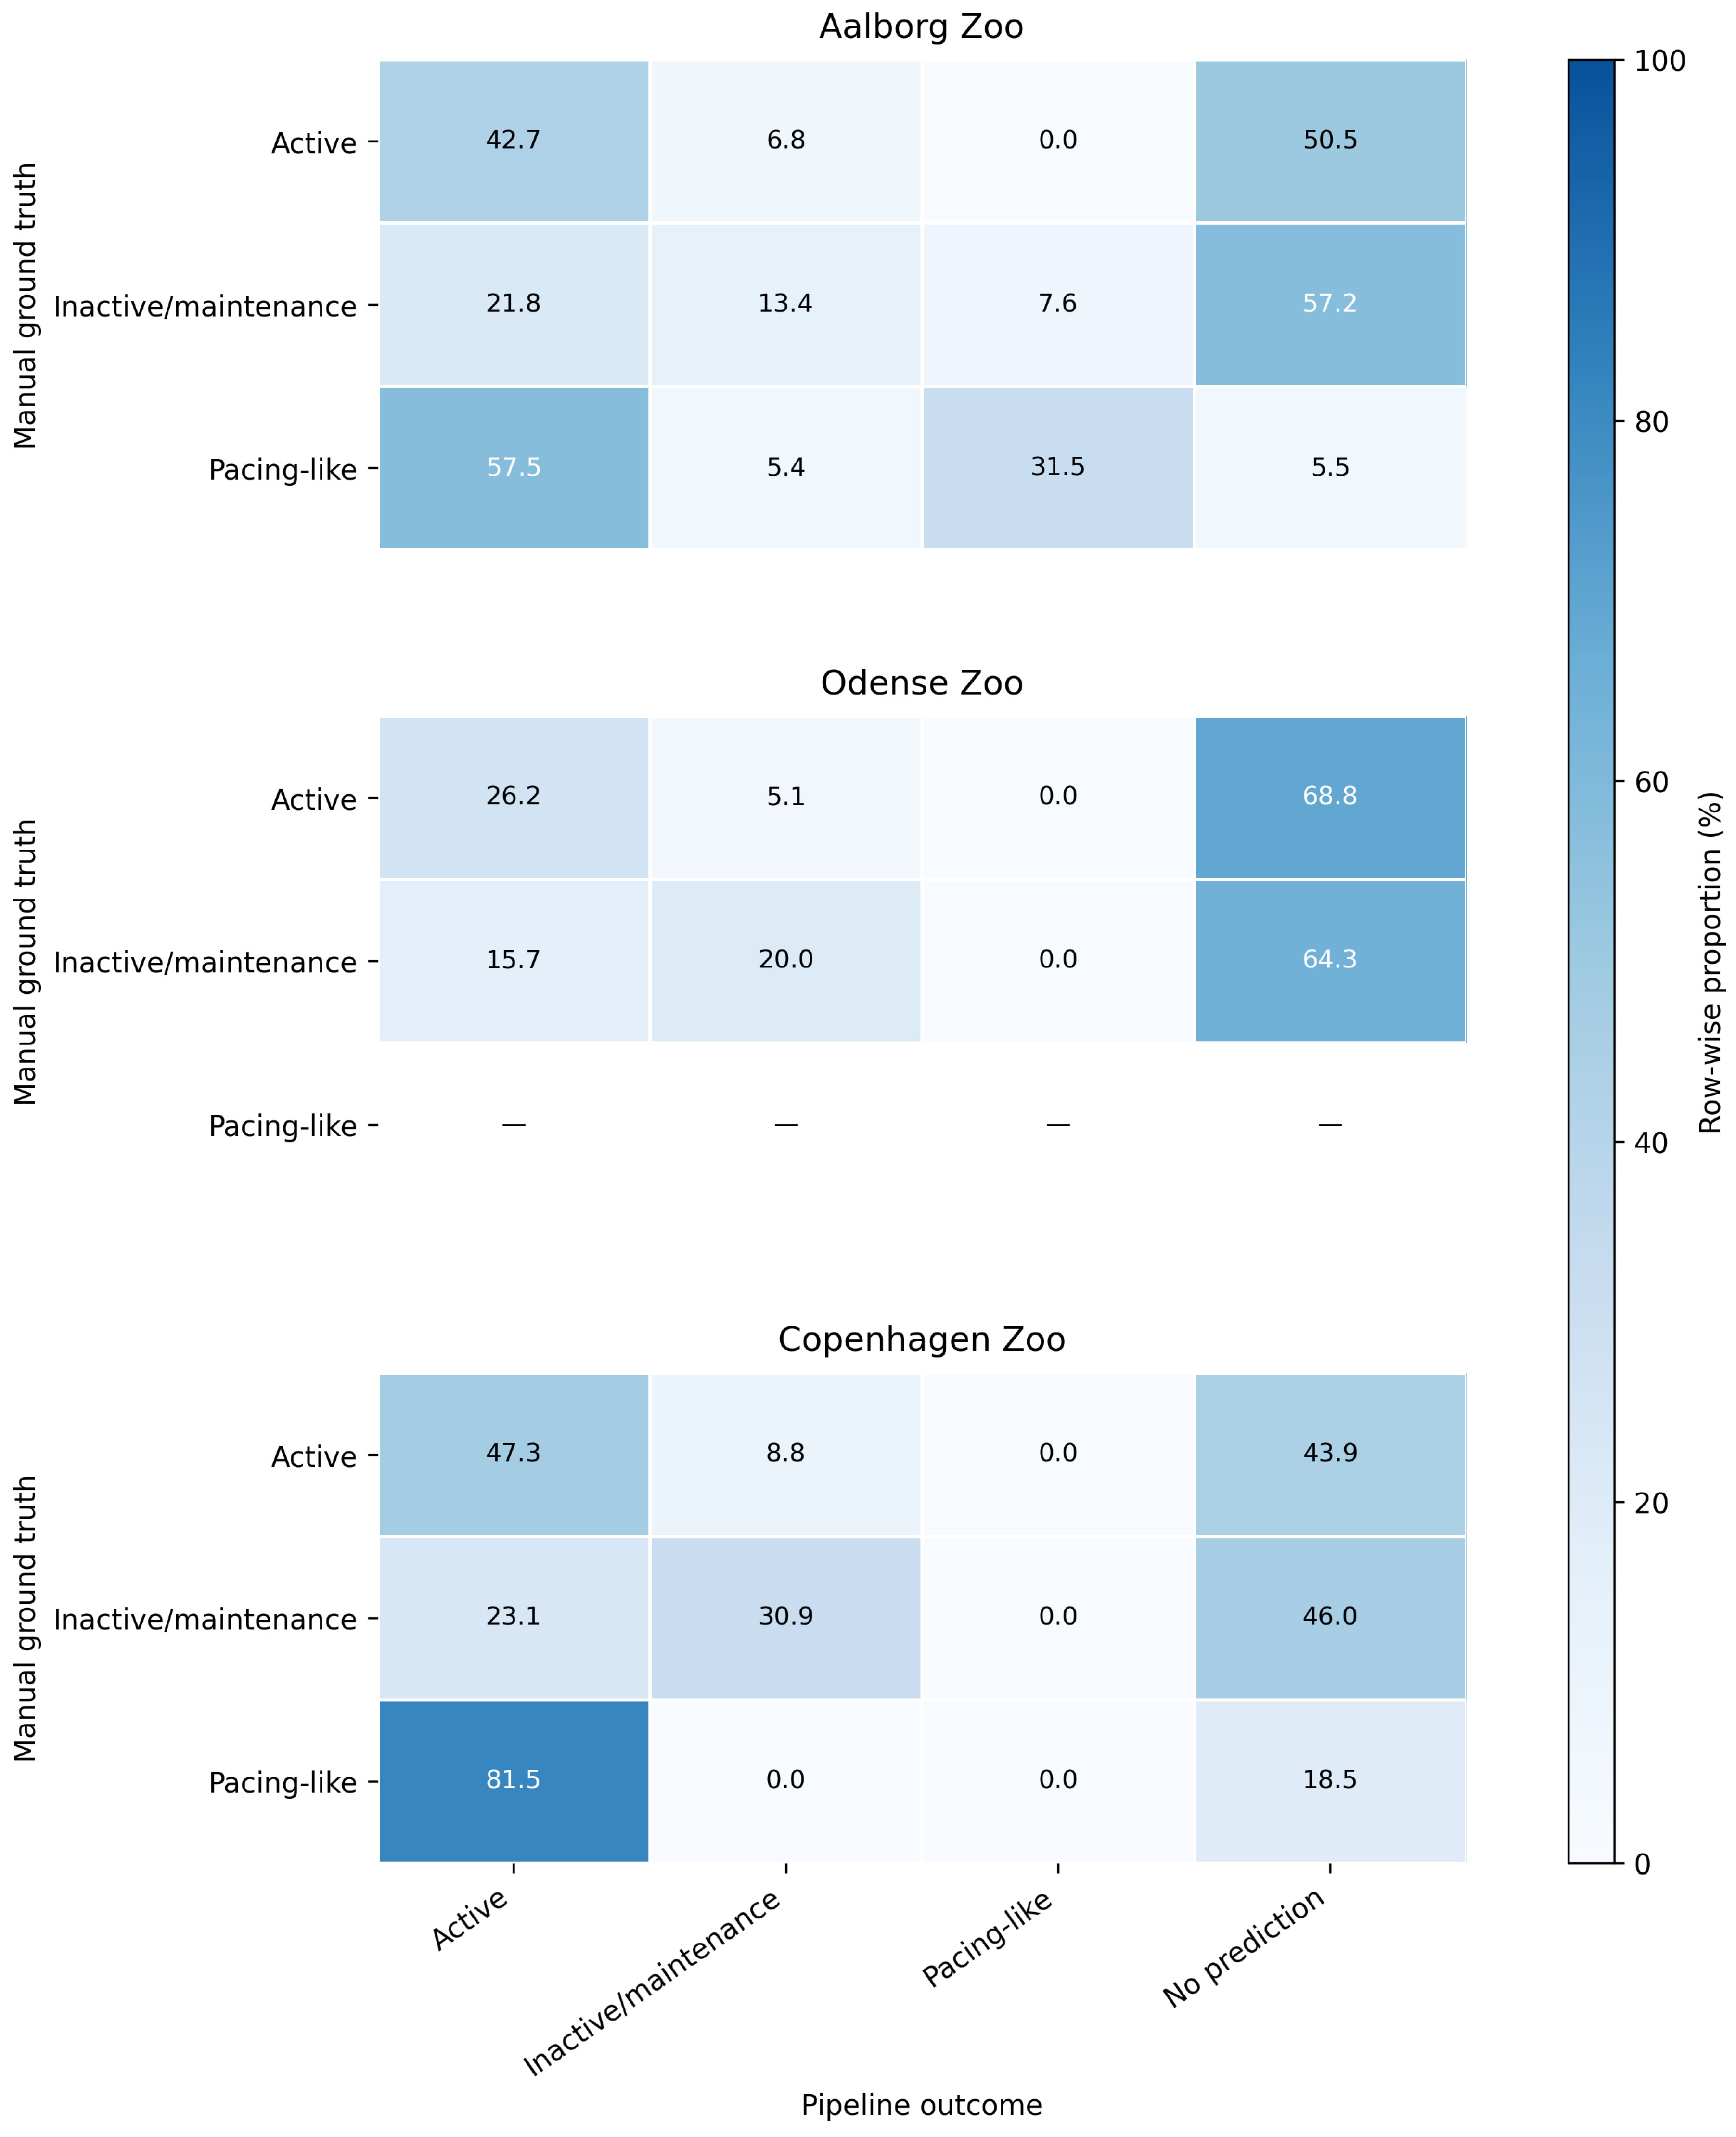
At the grouped level, end-to-end accuracy was 0.290 in Aalborg, 0.226 in Odense and 0.390 in Copenhagen (Table 5; Figure 8). Macro-F1 was 0.324, 0.334 and 0.487, respectively, while weighted F1 was 0.317, 0.333 and 0.497. Conditional grouped accuracy was 0.484 in Aalborg, 0.668 in Odense and 0.695 in Copenhagen.
Figure 8.
Activity-grouped applied-validation confusion matrices by institution. Values are row-wise percentages and include “No prediction”. Rows shown with an em dash had no manual support in that institution’s final pooled validation set.
Prediction coverage also differed among observation conditions and animal categories (Appendix D). Coverage was 58.1% during daytime footage and 27.0% during nighttime footage. By manually annotated animal category, coverage was 56.8% for females, 38.9% for adult males and 5.5% for cubs. Camera-specific coverage ranged from 33.8% to 85.8%. Coverage also varied among manually observed behaviors. It was highest for pacing-like locomotion at 92.9%, followed by locomotion at 52.5%, marking at 52.3%, feeding at 51.4%, inactive behavior at 45.7%, self-grooming at 40.8% and interacting at 37.6%. The complete pipeline was additionally compared with an always-majority baseline. At the fine-scale level, always predicting the most common manually observed behavior, inactive, produced an accuracy of 0.363, a macro-F1 of 0.076 and a weighted F1 of 0.194. The complete pipeline had lower end-to-end accuracy (0.231) but higher macro-F1 (0.215) and weighted F1 (0.273). At the grouped level, always predicting the most common activity category, active, produced an accuracy of 0.454, a macro-F1 of 0.208 and a weighted F1 of 0.283. The pipeline again had lower end-to-end accuracy (0.317) but higher macro-F1 (0.383) and weighted F1 (0.388). A tendency to assign retained predictions to locomotion was also evident. Locomotion represented 255 of the 1315 raw pre-augmentation categorizer examples (19.4%), whereas 2039.3 of 4288.7 s of retained fine-scale behavior predictions in the applied validation were assigned to locomotion (47.6%). When only manually annotated lion-time with a retained prediction was considered, 35.0% of covered feeding observations, 45.7% of covered marking observations and 61.6% of covered pacing-like observations were classified as locomotion. In comparison, interacting was the largest class in the raw pre-augmentation training dataset, comprising 354 examples (26.9%).
4. Discussion
4.1. Internal Validation of the Detector and Categorizer
The detector showed clear convergence during training, with total loss decreasing from 2.72 to 0.24 by the final recorded iteration. However, the COCO-style development-validation results indicated only moderate detection performance. Bounding-box detection reached an overall AP of 47.1%, while segmentation mask prediction reached an AP of 41.6%. At the more permissive IoU threshold of 0.50, performance was higher, with AP50 values of 73.9% for bounding boxes and 72.1% for segmentation masks. Thus, the detector was generally capable of identifying lions in the development-validation images, while accurate localization and segmentation remained more challenging.
Detector performance also depended on apparent object size and animal category. AP was consistently lower for small objects than for medium and large objects, indicating that animals occupying fewer pixels in the image were more difficult to detect and localize accurately. This is particularly relevant in zoological settings, where camera distance, enclosure structure and animal position can result in substantial variation in apparent body size. Cub performance was lower than performance for the other detector classes, although this estimate was based on only 31 validation instances compared with 99 adult male and 279 mixed-group instances. The low number of cub examples limits the precision with which cub-specific detector performance can be estimated. Nevertheless, the applied validation also showed very low prediction coverage for cubs, suggesting that detection of small animals remained an important practical challenge [19,29].
The detector development-validation results should also be interpreted in light of the way the dataset was divided. The detector used a random image-level training/validation split rather than a split by source video, camera or recording date. Consequently, visually similar frames originating from the same recordings may have occurred in both subsets. Furthermore, development was iterative, and validation performance was available while images, annotations and augmentation settings were refined. The internal detector metrics therefore characterize development performance rather than performance on a fully independent test dataset. This distinction emphasizes the importance of validating computer-vision systems on temporally or otherwise independently held-out material rather than relying solely on training diagnostics or internal validation metrics [23].
The behavior categorizer likewise showed moderate development-validation performance, with an overall accuracy and weighted F1-score of 0.62. However, training accuracy increased to approximately 0.95 while validation accuracy remained around 0.60–0.65. The increasing difference between training and validation performance suggests overfitting to the training examples. Because LabGym does not expose the independent unit used for its internal training/validation split and because internal validation outputs were available during iterative model refinement, these results should also be regarded as development-validation metrics rather than as an independent estimate of applied performance. Performance differed among behavior classes, but the pattern was not explained simply by whether a behavior involved prominent movement. Locomotion performed relatively well during internal validation, with an F1-score of 0.66, whereas marking had the lowest F1-score at 0.29. However, self-grooming and interacting also achieved F1-scores of 0.65 and 0.64, respectively, despite involving more localized or complex movements. Inactive behavior, which might be expected to be visually simple, achieved an intermediate F1-score of 0.62. Classification performance therefore likely reflected several interacting factors, including visual distinctiveness, similarity between ethogram categories, representation in the training material, annotation consistency and the quality of detector-generated behavioral clips [16,17,23].
The particularly low internal performance for marking should be interpreted cautiously because only 12 marking examples were present in the validation set. Marking also includes several visually different actions, including rubbing, urination, defecation, and clawing, some of which may be brief or visually similar to other stationary or low-amplitude behaviors [10]. A larger and more varied sample would therefore be required before firm conclusions can be drawn about the ability of the categorizer to recognize marking specifically.
The applied validation further showed a tendency for retained predictions to be assigned to locomotion. Locomotion constituted 19.4% of the raw pre-augmentation categorizer examples but 47.6% of retained fine-scale prediction time in the held-out validation. Interacting, rather than locomotion, was the most common category in the raw training dataset. The locomotion bias therefore cannot be attributed simply to locomotion being the majority training class. It may instead reflect that locomotion contains visually prominent and relatively consistent movement patterns, that other active behaviors share movement features with locomotion, or that the categorizer learned locomotion as a common alternative when behavioral information was ambiguous. Future model development should therefore consider not only class balance, but also the visual overlap and internal heterogeneity of the behavior categories.
4.2. Performance of the Full Applied Pipeline on Pooled Animal-Type Validation
The temporally held-out validation provided a substantially more conservative assessment of performance than the internal development-validation results. Only 52.6% of manually annotated lion-time could be matched to a retained pipeline behavior prediction. Fine-scale end-to-end accuracy, which included missing predictions as errors, was 0.231. When analysis was restricted to lion-time for which a retained prediction was available, conditional accuracy increased to 0.440. This distinction demonstrates that two different sources of error affected applied performance: failure to produce a usable prediction and incorrect behavior classification after a prediction had been produced.
Prediction coverage is therefore an important performance measure in its own right. A classifier can perform reasonably when an animal is successfully detected and a prediction survives confidence filtering, but such performance has limited practical value for continuous behavioral monitoring if large portions of observable animal-time are not represented in the final output. In the present study, 47.4% of manually annotated lion-time had no retained prediction. This loss of data occurred before or during behavioral classification and may reflect missed detections, insufficient prediction confidence, filtering of likely false detections, tracking instability, or combinations of these factors. Applied evaluation of multi-stage computer-vision pipelines should therefore distinguish classification accuracy from the proportion of observable behavior that actually reaches the classification output.
The grouped activity-level analysis improved classification performance but did not remove the coverage limitation. Grouping the fine-scale behaviors into active, inactive/maintenance, and pacing-like locomotion increased end-to-end accuracy from 0.231 to 0.317 and conditional accuracy from 0.440 to 0.602. This indicates that some errors occurred between fine-scale behaviors that nevertheless belonged to the same broader activity category. Such grouping may therefore be useful when the biological question concerns general activity rather than precise ethogram states.
However, the grouped confusion matrix also shows why the improvement should not be interpreted as evidence that the current pipeline is ready for independent activity monitoring. Approximately half of manually observed active behavior and more than half of inactive/maintenance behavior received no prediction. Furthermore, the grouped pipeline did not outperform the simple majority-class baseline in end-to-end accuracy. Always assigning the most common grouped category produced an accuracy of 0.454, compared with 0.317 for the complete pipeline. The pipeline nevertheless achieved higher macro- and weighted F1-scores than the majority baseline, showing that it discriminated among multiple categories rather than simply reproducing the dominant class. Taken together, these results indicate that the model contained meaningful behavioral information, but insufficient prediction coverage substantially reduced its practical end-to-end performance.
Pacing-like locomotion showed a different error pattern from the other activity categories. Prediction coverage was high for manually annotated pacing-like periods, but many of these observations were classified as active rather than retained as pacing-like locomotion. This suggests that the main limitation for this category was not failure to observe the animal, but discrimination between ordinary locomotion and the repeated movement pattern identified by the centroid-based post-processing procedure. The term “pacing-like locomotion” is therefore appropriate for the automated output because the geometric movement criteria identify repeated back-and-forth movement but do not, in themselves, establish that the movement is stereotypic in a behavioral or welfare sense. Manual confirmation or additional contextual criteria would be required before automatically detected bouts could be interpreted as stereotypic behavior.
Performance also differed substantially among the three zoological institutions. Odense Zoo had the lowest prediction coverage at 33.8%, compared with 59.8% in Aalborg and 56.2% in Copenhagen. Consequently, Odense also had the lowest fine-scale end-to-end accuracy. However, when the analysis was restricted to lion-time with a retained prediction, Odense had the highest conditional fine-scale accuracy of the three institutions. A similar pattern was observed after grouping behaviors. This demonstrates that differences in end-to-end performance among enclosures cannot be interpreted solely as differences in the categorizer’s ability to distinguish behaviors. In Odense, failure to obtain retained predictions was a particularly important limitation.
Several characteristics of the recording conditions may have contributed to these differences. Prediction coverage was substantially lower at night than during daytime footage, and the Odense cameras were less stable during the study period. Camera placement, enclosure structure, lighting, infrared illumination, distance to the animals and temporary obstruction can all affect the quality of detections available to subsequent stages of an automated pipeline. Comparable challenges have been reported in other applications of deep-learning-based animal monitoring in heterogeneous zoo environments [19]. The very low coverage for cubs is also consistent with the detector’s weaker performance for small objects and the relatively limited number of cub examples used during detector development.
Enclosure size and spatial structure may also have contributed to differences in prediction coverage. In larger enclosures, lions can occur farther from the cameras and consequently occupy fewer pixels in the image, which is relevant given the lower detector AP observed for small objects. Vegetation, shelters, elevation changes and other structural elements may additionally increase occlusion and create camera blind spots. Conversely, more open areas or locations that constrain animals to predictable movement paths may provide more favorable recording conditions. These effects were not tested independently in the present study, and enclosure-related differences should therefore be interpreted as potential contributors rather than causal explanations for the observed variation among institutions.
The present study evaluates cross-enclosure performance within three institutions that all contributed material to model development rather than generalization to an entirely unseen zoo. The differences observed among the three enclosures nevertheless demonstrate substantial sensitivity to recording conditions and enclosure context. A stronger test of institutional generalization would require development using footage from a subset of institutions followed by evaluation on a completely unseen institution.
The manual ground-truth validation also has limitations. All ground-truth annotations used for the confusion-matrix validation were completed by a single observer, and no independent inter-rater reliability assessment was therefore available for this dataset. This means that potential observer-specific annotation errors or ambiguities could not be quantified, particularly for broad or visually overlapping behavior categories. Three people contributed annotations during model training, but agreement among these annotators was not formally assessed. In addition, validation was performed at the pooled animal-type level because stable individual identity was not retained by the pipeline. Pooling allowed all animals belonging to the same detector category to contribute to a common behavioral pool, but it also means that the validation could not determine whether the correct behavior was assigned to the correct individual when several animals of the same category were visible simultaneously. The results should therefore be interpreted as validation of pooled animal-type behavioral output rather than individual-level monitoring.
Finally, the held-out validation material was collected during a narrow seven-day period in late December. This temporal separation from the development material strengthened the methodological validation, but the sampling period does not capture seasonal variation in daylight, weather, enclosure use or lion activity. The validation therefore addresses technical performance under the recorded winter conditions rather than the representativeness of long-term biological activity budgets.
Overall, the applied validation demonstrates why internal model metrics alone are insufficient for evaluating automated behavioral-monitoring systems. The detector and categorizer both showed moderate internal performance, but practical performance depended on whether animals were detected, whether predictions exceeded confidence thresholds, how reliably behaviors could be separated, and how recording conditions differed among cameras and institutions. Reporting prediction coverage alongside conditional and end-to-end classification performance provides a more informative description of these interacting limitations.
4.3. Future Improvements and Perspectives
Future development should address both prediction coverage and behavior classification. Improved camera placement, reduced blind spots and better nighttime imaging may increase detector coverage, particularly for cubs and distant animals. Detector training would also benefit from larger and more representative datasets spanning different cameras, recording dates, lighting conditions and degrees of occlusion. Training and validation data should ideally be separated by independent units such as source video, recording day or camera [19,23].
Behavior classification may be improved through larger and better balanced datasets, particularly for rare classes such as marking. However, some of the current categories also contain visually heterogeneous or overlapping behaviors. Future work should therefore investigate whether fewer, more visually distinct categories, or a hierarchical approach in which broad activity states are classified before more specific behaviors, provide more robust performance. The strong tendency to predict locomotion should also be investigated through targeted analysis of misclassified examples and refinement of class definitions, dataset balance and temporal modeling.
From a practical zoo perspective, the workflow can be implemented using relatively conventional surveillance camera footage, but the present version should not be considered a fully plug-and-play system. Initial implementation requires suitable camera placement, collection and annotation of representative training footage, model training, video preprocessing and validation under the specific enclosure conditions. The present workflow also combines LabGym with external Python and R-based preprocessing and post-processing steps, requiring some technical expertise during setup. Once models and processing settings have been established for a given enclosure, however, large volumes of subsequently recorded footage can be processed using the same workflow with substantially less manual behavioral annotation. Future development should therefore focus not only on model performance but also on simplifying installation, model adaptation and automated data processing for zoo staff.
Despite the present limitations, the workflow demonstrates how automated video analysis can be used to generate quantitative behavioral data from large amounts of zoo footage. Even when classification is imperfect, repeated automated observations can provide structured information on activity, inactivity, locomotion, spatial use and other behavioral patterns that would be difficult to quantify continuously through manual observation alone. Such outputs may be particularly valuable for exploratory biological analyses, identifying temporal or environmental patterns and highlighting periods or animals that warrant closer manual examination. In this role, automated analysis should be viewed as a complement to, rather than a replacement for, direct behavioral observation. This distinction is particularly relevant for welfare assessment. Behavioral welfare evaluation rarely depends on a single observation or behavioral category, but instead draws on changes in activity, behavioral diversity, repetitive behavior, social behavior and other indicators over time [1,2,3,4,5,6,7,8]. Automated behavioral quantification therefore has potential to contribute to welfare assessment by increasing the temporal coverage and consistency of behavioral data, provided that model limitations, prediction coverage and uncertainty in individual behavior categories are taken into account. The present workflow provides a basis for demonstrating this type of biological application while also identifying the technical improvements required before such systems can be used independently. Automated systems for zoological use must also balance image quality, model complexity and computational demands. Higher-resolution footage and more complex models may improve performance but increase storage and processing requirements. Systems intended for routine zoo use therefore need to combine sufficient predictive performance with practical deployment requirements. More broadly, the present results emphasize the value of developing and validating behavioral analysis systems under realistic zoological conditions rather than assuming that performance obtained in controlled settings will transfer directly [16,19]. Future validation should continue to report detector performance, behavior-classification performance, prediction coverage and complete end-to-end performance separately, as these measures describe different stages of the analysis pipeline. This transparency allows automated outputs to be used according to the level of performance actually demonstrated and provides a clearer basis for their gradual integration into biological research and welfare monitoring.
5. Conclusions
This study developed and evaluated a LabGym-based workflow for automated behavioral analysis of captive lions under realistic zoological conditions. Internal development validation showed moderate detector and behavior-categorizer performance, while temporally held-out validation demonstrated that applied performance was additionally constrained by incomplete prediction coverage. Only 52.6% of manually annotated lion-time received a retained pipeline prediction. Fine-scale end-to-end accuracy was 0.231 and increased to 0.440 when calculated only for lion-time with a retained prediction. Grouping behaviors into broader activity categories increased end-to-end and conditional accuracy to 0.317 and 0.602, respectively. Performance also differed among institutions, recording conditions and animal categories, demonstrating that camera coverage, visibility, detection and confidence filtering strongly influence the behavioral data available for classification. These findings emphasize that the performance of a complete automated behavioral monitoring system cannot be evaluated from behavior-classification accuracy alone.
The current workflow is not yet sufficiently reliable to replace manual observation or function as an independent welfare-monitoring system. Nevertheless, it demonstrates the feasibility of automatically extracting and quantifying biologically relevant behavioral information from large volumes of video recorded under realistic zoo conditions. In particular, the ability to summarize broad activity patterns and pacing-like movement illustrates how automated analysis can complement manual observations and support investigations of behavioral variation over time, between animals or groups, and under different environmental conditions. The value of the present framework therefore lies both in identifying the technical limitations that currently restrict automated monitoring and in demonstrating a pathway toward scalable behavioral quantification. With improved prediction coverage, more representative training datasets, refined behavior categories, and further independent validation, similar systems could provide increasingly useful supplementary information for behavioral research and welfare assessment in zoological institutions.
Author Contributions
Conceptualization, F.G., S.M.L., J.N., T.L.F., T.H.J., S.P. and C.P.; methodology, F.G., S.M.L. and J.N.; software, F.G., S.M.L. and J.N.; formal analysis, F.G., S.M.L. and J.N.; investigation, F.G., S.M.L. and J.N.; resources, F.G., S.M.L., J.N., T.L.F., K.A.H. and F.N.; data curation, F.G., S.M.L. and J.N.; writing—original draft preparation, F.G., S.M.L. and J.N.; writing—review and editing, F.G., S.M.L., J.N., T.L.F., T.H.J., S.P., K.A.H., F.N. and C.P.; visualization, F.G., S.M.L. and J.N.; supervision, T.L.F., T.H.J., S.P. and C.P.; funding acquisition, F.G., S.M.L., J.N. and C.P. All authors have read and agreed to the published version of the manuscript.
Funding
This research was funded by Aalborg Zoo Conservation Foundation, grant number: 2024-06.
Institutional Review Board Statement
The Ethical Review Board was not consulted for the purposes of this study, as this study did not interfere with the daily routines of the subjects studied, and solely involved passive observation through video footage.
Data Availability Statement
The data presented in this study and the custom Python and R scripts used for preprocessing, post-processing and validation are available from the corresponding author upon reasonable request.
Acknowledgments
We would like to thank the staff at Aalborg Zoo, Odense Zoo and Copenhagen Zoo for their continued support and helpfulness in making this study possible. During the preparation of this study, the authors used ChatGPT (OpenAI; GPT-5 series, accessed September 2025–September 2026) for the purpose of developing and debugging Python code for model development and R code for data analysis. The authors have reviewed and edited the output and take full responsibility for the content of this publication.
Conflicts of Interest
The authors declare no conflicts of interest.
Appendix A
Figure A1.
Map of Zoo Copenhagen enclosure, showing camera placements and approximate viewing area for each camera. The cross marks the camera out of function.
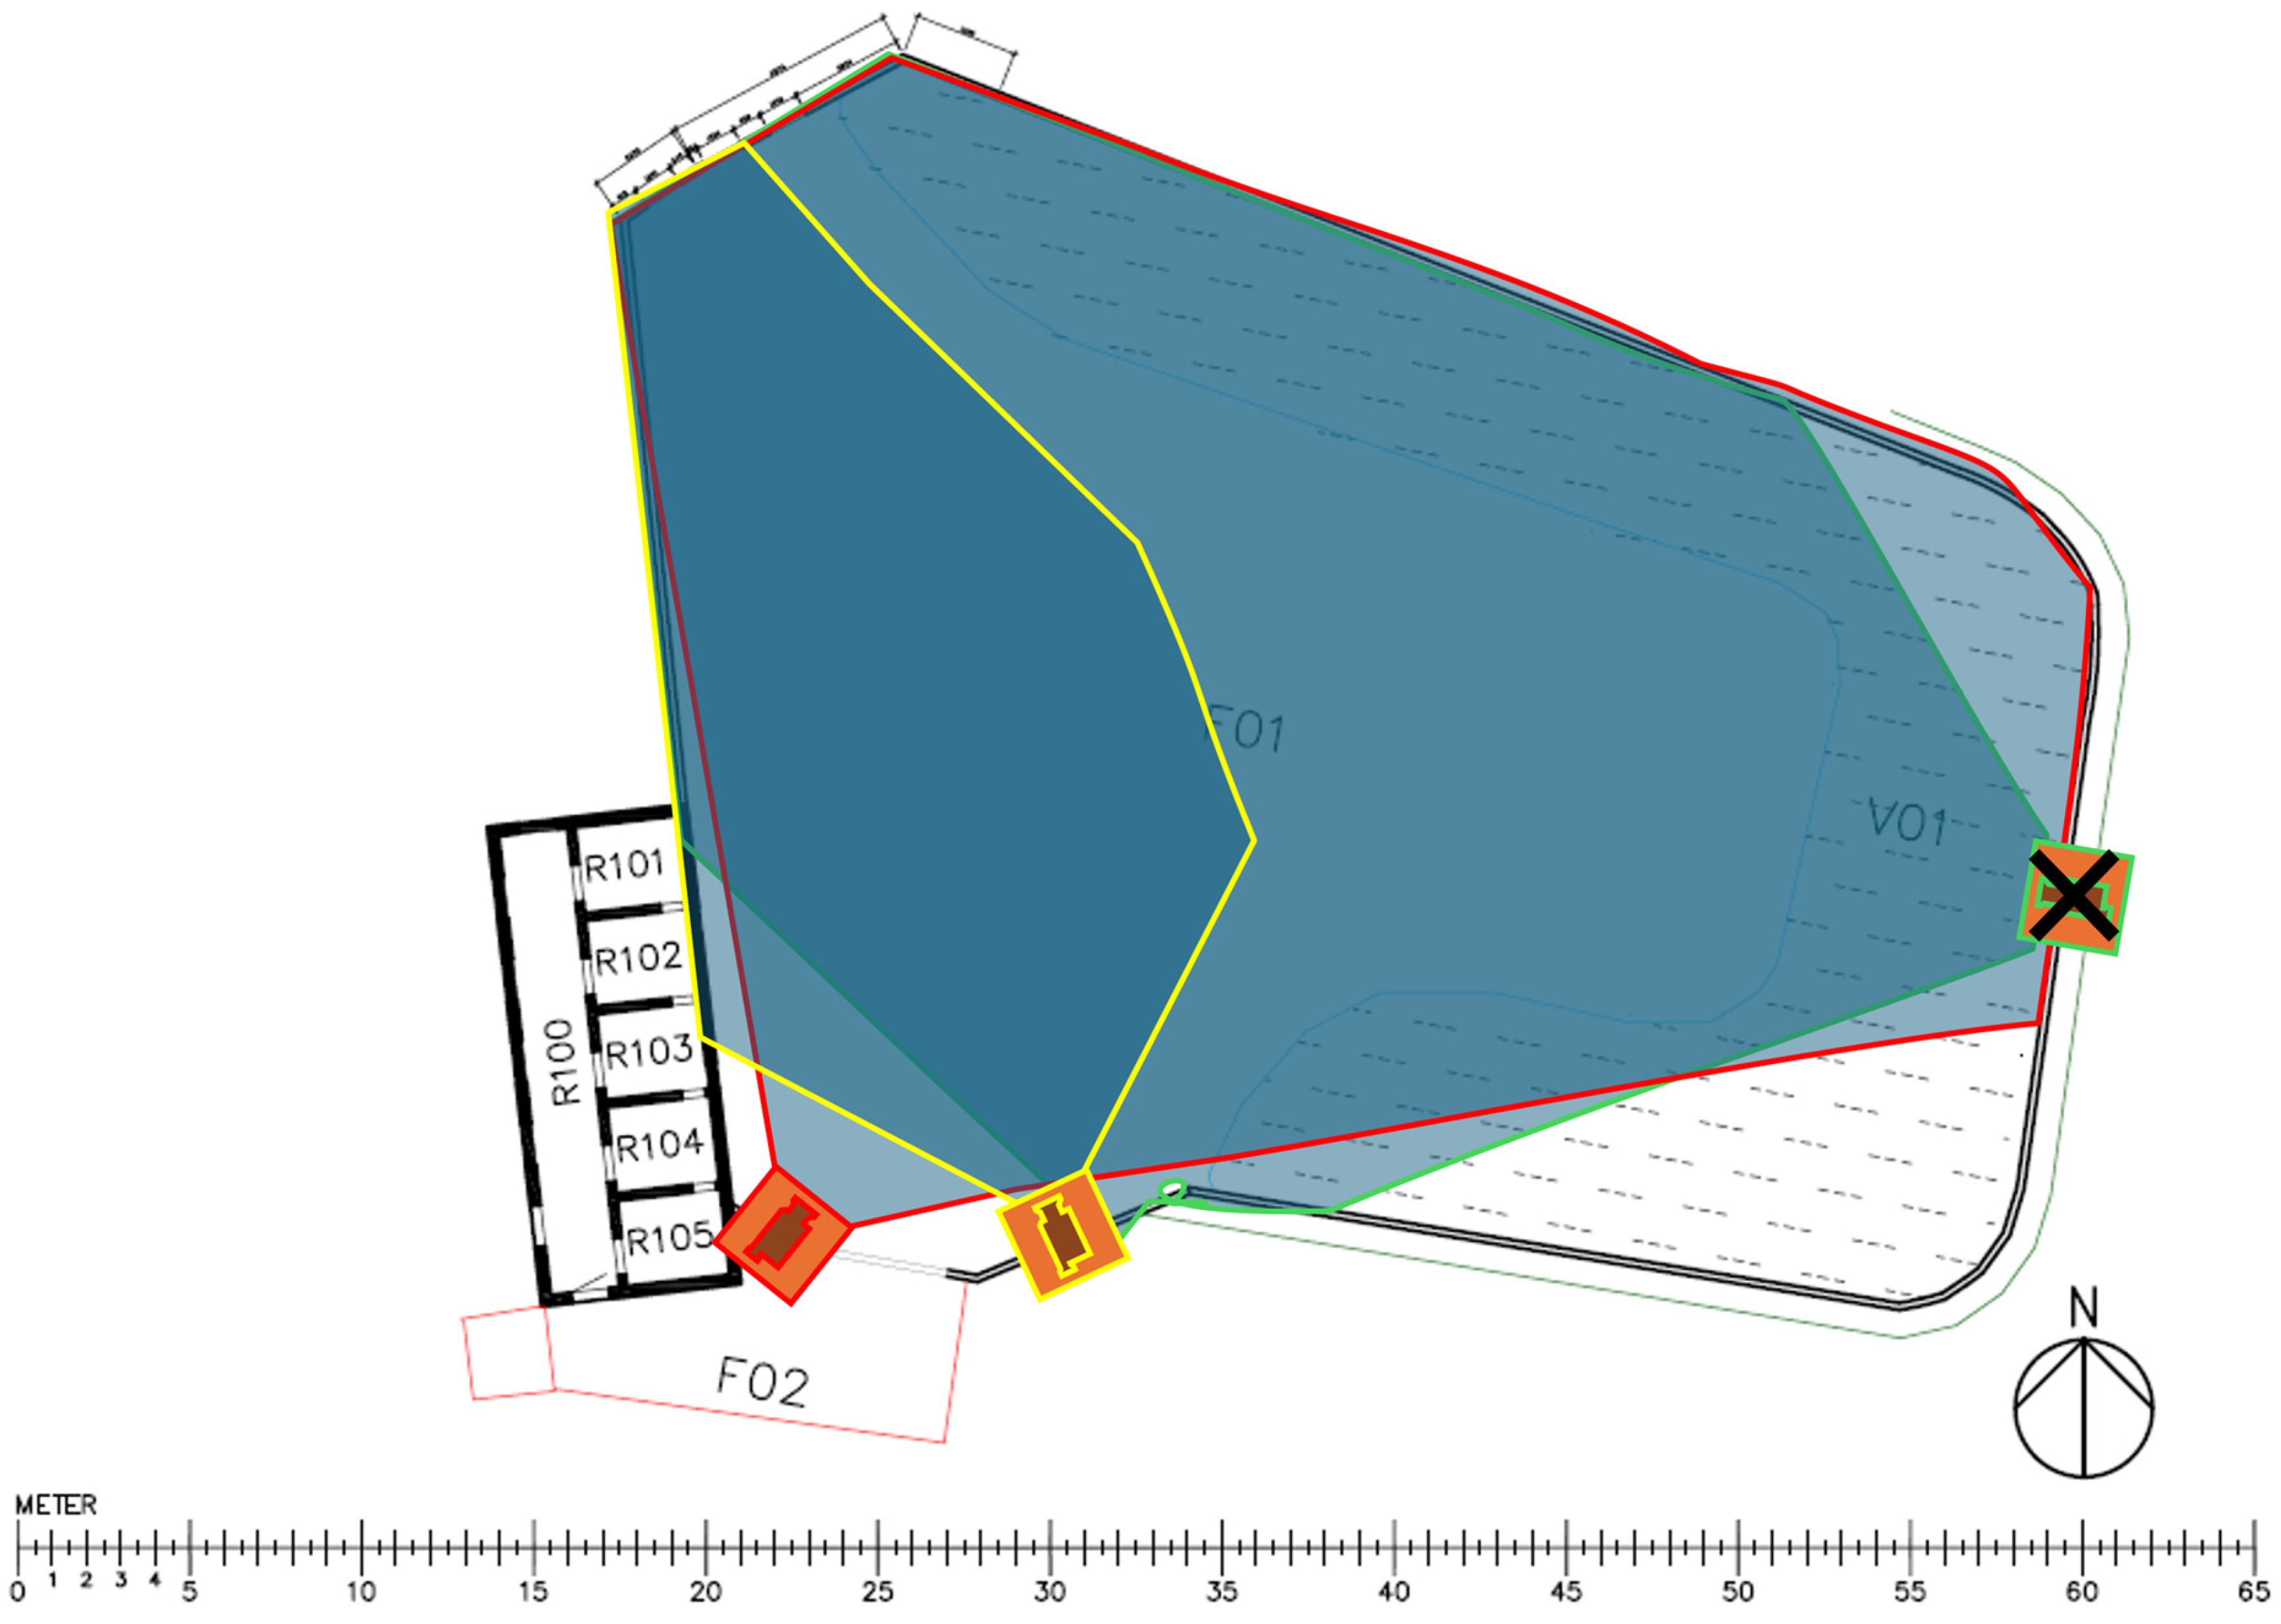
Figure A2.
Map of Odense Zoo enclosure, showing camera placements and approximate viewing area for each camera.
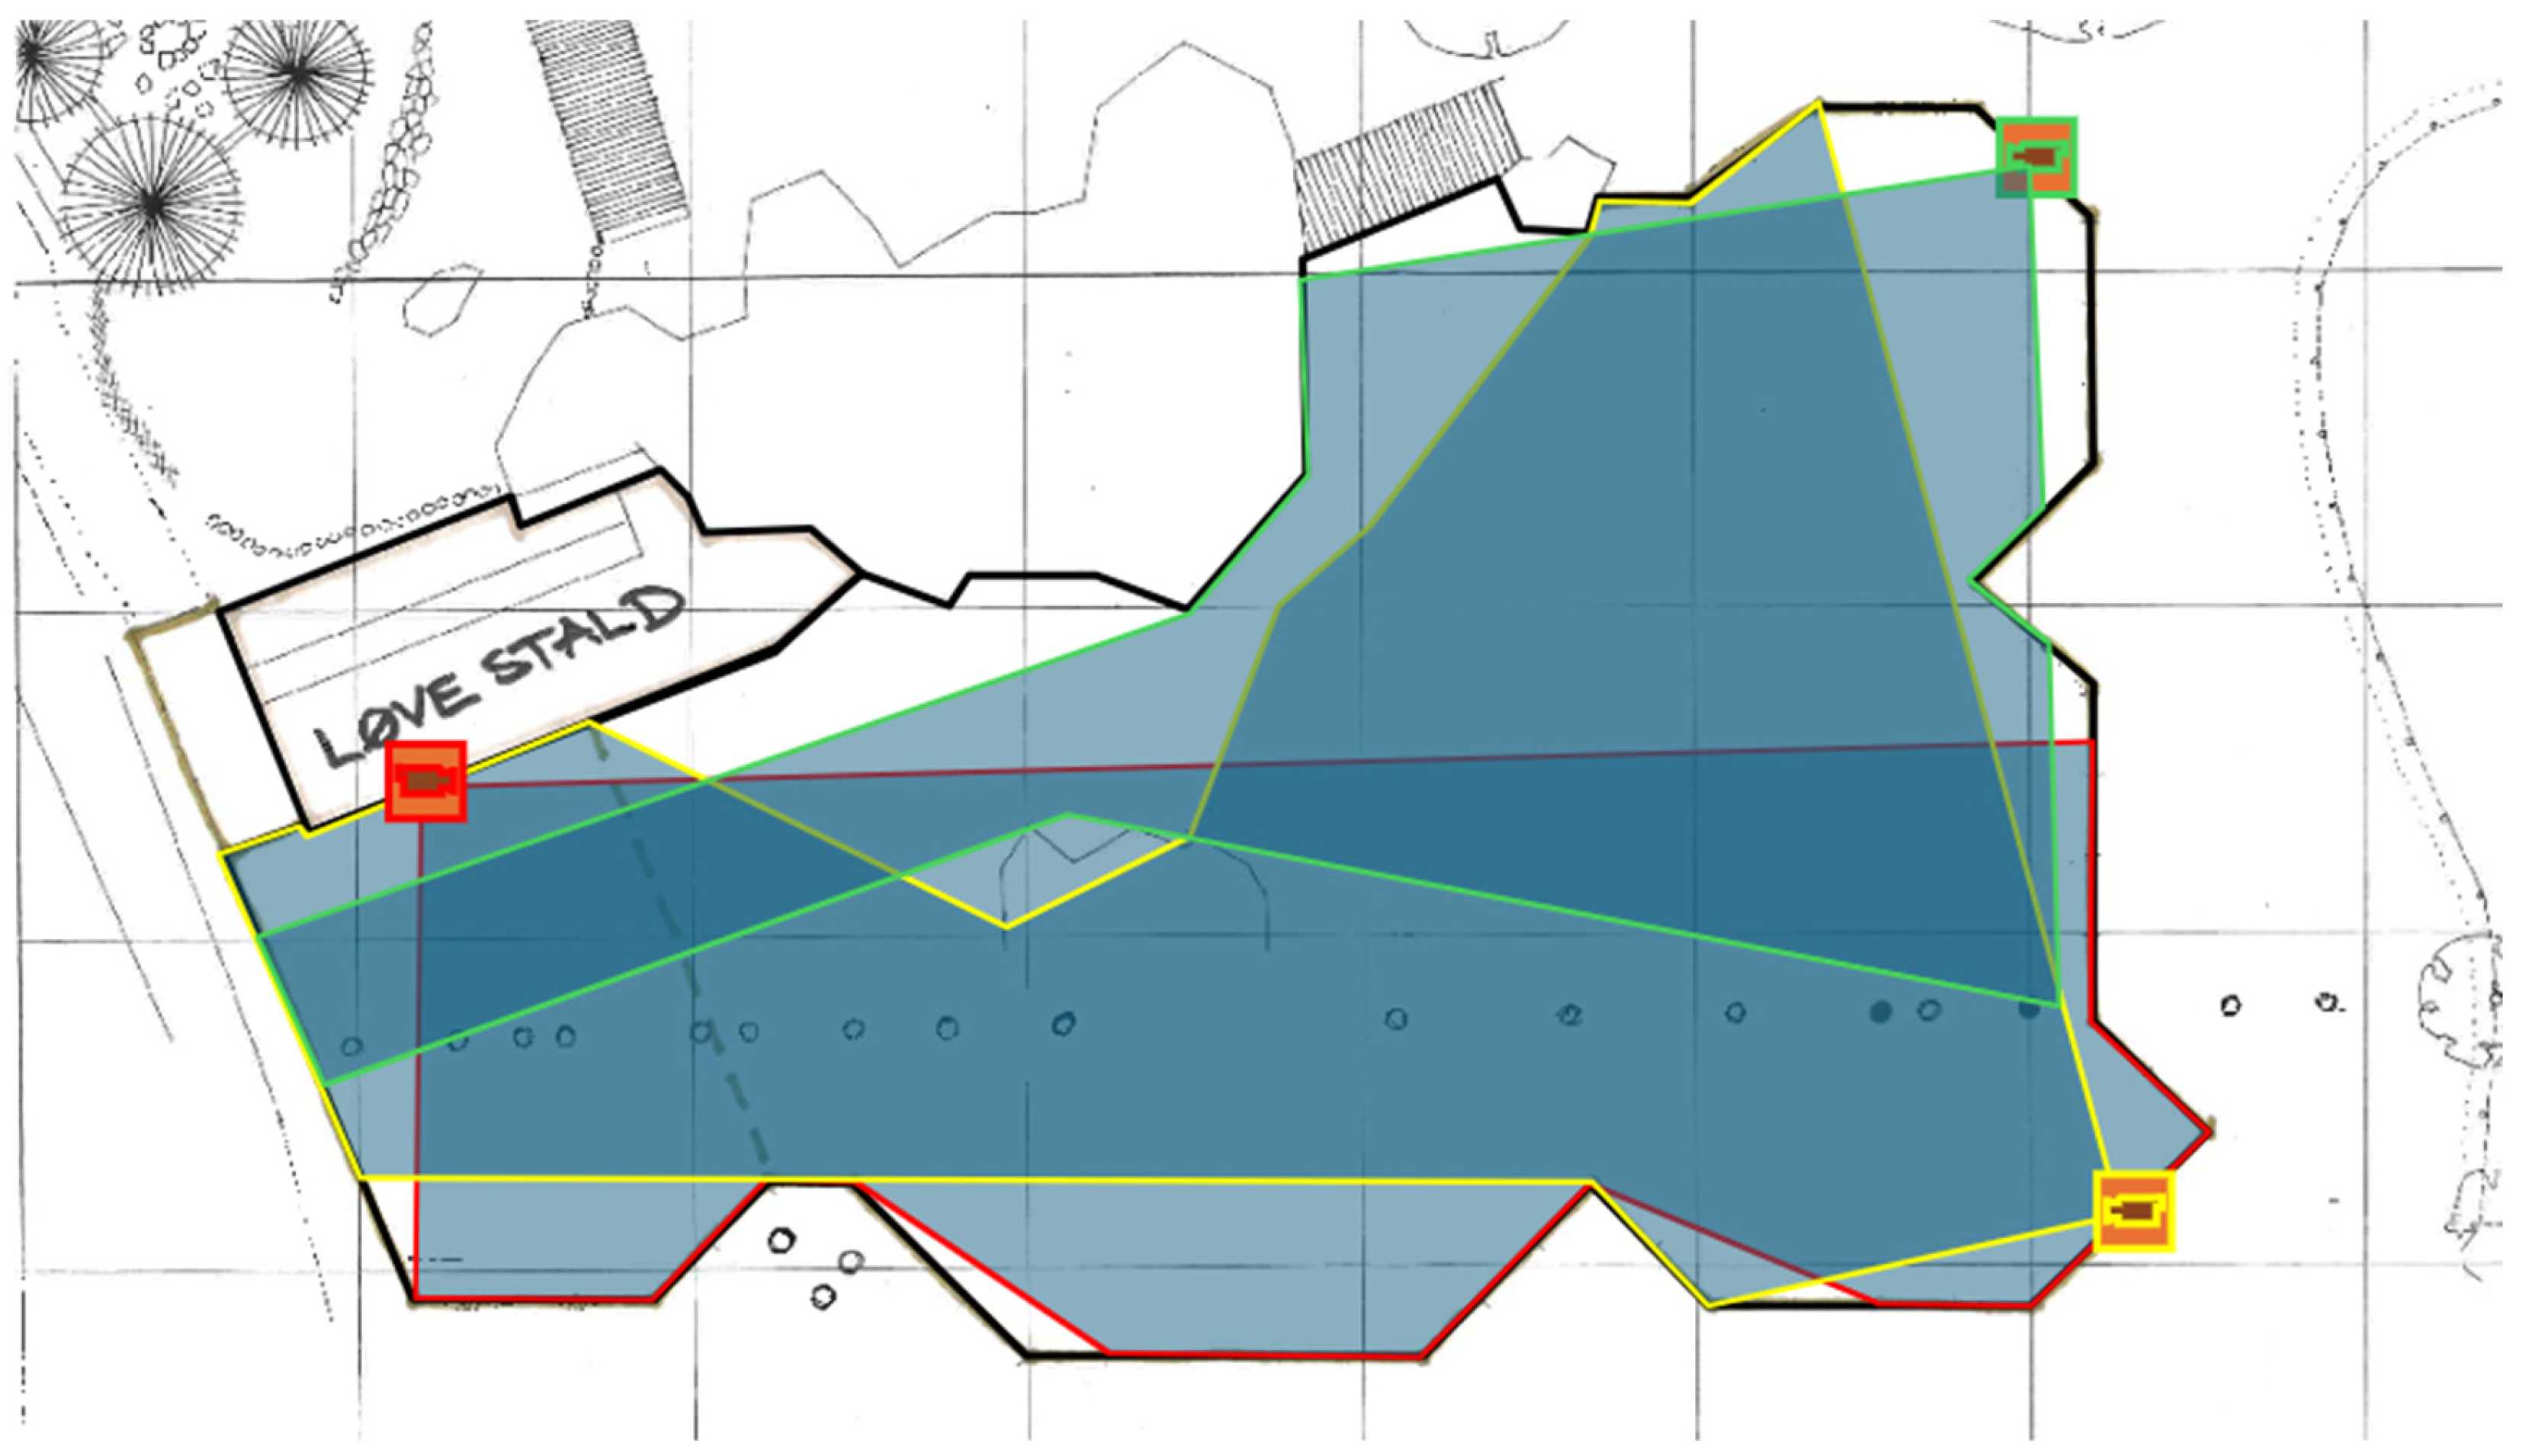
Figure A3.
Map of Aalborg Zoo enclosure, showing camera placements and approximate viewing area for each camera.
Appendix B
Table A1.
Ethogram of selected behaviors to use for LabGym Categorizer. * Categories requiring additional post-processing and not treated as direct categorizer outputs. ** Sex-specific category applied only to adult males.
Appendix C
Table A2.
Total manually annotated behavioral duration per category across the validation dataset. These data served as ground truth for the confusion matrix validation.
Table A3.
Total manually annotated behavioral counts per category across the validation dataset. These data served as ground truth for the confusion matrix validation.
Appendix D
Table A4.
Prediction coverage by manually annotated behavior in the held-out applied validation.
Table A5.
Prediction coverage by manual animal category and by day/night period.
Table A6.
Prediction coverage by camera in the held-out applied validation. Only cameras represented in the final usable validation data are shown.
References
- Dawkins, M.S. Behaviour as a Tool in the Assessment of Animal Welfare. Zoology 2003, 106, 383–387. [Google Scholar] [CrossRef] [Scilit]
- Wolfensohn, S.; Shotton, J.; Bowley, H.; Davies, S.; Thompson, S.; Justice, W.S.M. Assessment of Welfare in Zoo Animals: Towards Optimum Quality of Life. Animals 2018, 8, 110. [Google Scholar] [CrossRef] [Scilit]
- Mellor, D.J.; Beausoleil, N.J.; Littlewood, K.E.; McLean, A.N.; McGreevi, P.D.; Jones, B.; Wilkins, C. The 2020 Five Domains Model: Including Human–Animal Interactions in Assessments of Animal Welfare. Animals 2020, 10, 1870. [Google Scholar] [CrossRef] [Scilit]
- Hosey, G.; Melfi, V.; Pankhurst, S. Zoo Animals: Behavior, Management and Welfare, 2nd ed.; Oxford University Press: Oxford, UK, 2013. [Google Scholar]
- Hart, B.L. Biological Basis of the Behavior of Sick Animals. Neurosci. Biobehav. Rev. 1988, 12, 123–137. [Google Scholar] [CrossRef] [Scilit]
- Miller, L.J.; Vicino, G.A.; Sheftel, J.; Lauderdale, L.K. Behavioral Diversity as a Potential Indicator of Positive Animal Welfare. Animals 2020, 10, 1211, Erratum in Animals 2023, 13, 1904. [Google Scholar] [CrossRef] [Scilit]
- Mellor, D.J.; Beausoleil, N.J. Extending the ‘Five Domains’ Model for Animal Welfare Assessment to Incorporate Positive Welfare States. Anim. Welf. 2015, 24, 241–253. [Google Scholar] [CrossRef] [Scilit]
- Arndt, S.S.; Goerlich, V.C.; Van der Staay, F.J. A Dynamic Concept of Animal Welfare: The Role of Appetitive and Adverse Internal and External Factors and the Animal’s Ability to Adapt to Them. Front. Anim. Sci. 2022, 3, 908513. [Google Scholar] [CrossRef] [Scilit]
- Powell, D.M. Preliminary Evaluation of Environmental Enrichment Techniques for African Lions (Panthera leo). Anim. Welf. 1995, 4, 361–370. [Google Scholar] [CrossRef] [Scilit]
- Stanton, L.A.; Sullivan, M.S.; Fazio, J.M. A Standardized Ethogram for the Felidae: A Tool for Behavioral Researchers. Appl. Anim. Behav. Sci. 2015, 173, 3–16. [Google Scholar] [CrossRef] [Scilit]
- Khan, B.N.; Ahmad, R.; Ali, Z.; Mehmood, S.; Raza, H.; Azhar, M.; Zakir, A. Impact of Different Captive Environmental Conditions on Behavior of African Lions and Their Welfare at Lahore Zoo and Safari Zoo, Lahore. Pak. J. Zool. 2018, 50, 523–531. [Google Scholar] [CrossRef] [Scilit]
- Gammelgård, F.; Nielsen, J.; Nielsen, E.J.; Hansen, M.G.; Alstrup, A.K.O.; Perea-García, J.O.; Jensen, T.H.; Pertoldi, C. Application of Machine Learning for Automating Behavioral Tracking of Captive Bornean Orangutans (Pongo pygmaeus). Animals 2024, 14, 1729. [Google Scholar] [CrossRef] [Scilit]
- Lund, S.M.; Nielsen, J.; Gammelgård, F.; Nielsen, M.G.; Jensen, T.H.; Pertoldi, C. Behavioral Coding of Captive African Elephants (Loxodonta africana): Utilizing DeepLabCut and Create ML for Nocturnal Activity Tracking. Animals 2024, 14, 2820. [Google Scholar] [CrossRef] [Scilit]
- Lund, S.M.; Gammelgård, F.; Nielsen, J.; Larsen, L.L.N.; Christensen, N.; Hansen, S.P.; Kristensen, T.; Rodkjær, H.H.Ø.; Sivagnanasundram, S.M.; Thomsen, B.Ø.; et al. Comparing Manual and Automated Spatial Tracking of Captive Spider Monkeys Using Heatmaps. Animals 2025, 15, 3056. [Google Scholar] [CrossRef] [Scilit]
- Nielsen, J.; Lund, S.M.; Gammelgård, F.; Præstekær, A.S.B.; Frandsen, A.V.; Strandqvist, C.; Nielsen, M.H.; Olsen, R.N.; Pagh, S.; Faddersbøll, T.L.; et al. Olfactory Enrichment of Captive Pygmy Hippopotamuses with Applied Machine Learning. Animals 2026, 16, 385. [Google Scholar] [CrossRef] [Scilit]
- Anderson, D.J.; Perona, P. Toward a Science of Computational Ethology. Neuron 2014, 84, 18–31. [Google Scholar] [CrossRef] [Scilit]
- Gomez-Marin, A.; Paton, J.J.; Kampff, A.R.; Costa, R.M.; Mainen, Z.F. Big Behavioral Data: Psychology, Ethology, and the Foundations of Neuroscience. Nat. Neurosci. 2014, 17, 1455–1462. [Google Scholar] [CrossRef] [Scilit]
- Dell, A.I.; Bender, J.A.; Branson, K.; Straw, A.D.; Wikelski, M.; Brose, U. Automated Image-Based Tracking and Its Application in Ecology. Trends Ecol. Evol. 2014, 29, 417–428. [Google Scholar] [CrossRef] [Scilit]
- Zuerl, M.; Stoll, P.; Brehm, I.; Raab, R.; Zanca, D.; Kabri, S.; Happold, J.; Nille, H.; Prechtel, K.; Wuensch, S.; et al. Automated Video-Based Analysis Framework for Behavior Monitoring of Individual Animals in Zoos Using Deep Learning—A Study on Polar Bears. Animals 2022, 12, 692. [Google Scholar] [CrossRef] [Scilit]
- Christensen, P.O.F.; Clausen, M.H.; Faddersbøll, T.L.; Gammelgård, F.; Lund, S.M.; Nielsen, A.P.M.; Nielsen, J.; Olsen, N.H.; Olsen, T.K.; Pagh, S.; et al. Assessing Welfare in Ex Situ Lowland Tapirs through Activity Patterns and Machine Learning. J. Zool. Bot. Gard. 2026, 7, 11. [Google Scholar] [CrossRef] [Scilit]
- Zhao, Z.-Q.; Zheng, P.; Xu, S.-T.; Wu, X. Object Detection with Deep Learning: A Review. IEEE Trans. Neural Netw. Learn. Syst. 2019, 30, 3212–3232. [Google Scholar] [CrossRef] [Scilit]
- Marques, O. Machine Learning with Core ML. In Image Processing and Computer Vision in iOS; SpringerBriefs in Computer Science; Springer: Cham, Switzerland, 2020; pp. 29–40. [Google Scholar]
- Zhou, Z.-H. Machine Learning, 1st ed.; Springer: Berlin/Heidelberg, Germany, 2021. [Google Scholar]
- Hebbar, P.K.; Pullela, P.K. Deep Learning in Object Detection: Advancements in Machine Learning and AI. In Proceedings of the 2023 International Conference on the Confluence of Advancements in Robotics, Vision and Interdisciplinary Technology Management (IC-RVITM), Bangalore, India, 28–29 November 2023; IEEE: New York, NY, USA, 2023; pp. 1–7. [Google Scholar]
- Schaller, G.B. The Serengeti Lion: A Study of Predator-Prey Relations; Wildlife Behavior and Ecology; University of Chicago Press: Chicago, IL, USA, 1972. [Google Scholar]
- Packer, C.; Pusey, A.E. Divided We Fall: Cooperation among Lions. Sci. Am. 1997, 276, 52–59. [Google Scholar] [CrossRef] [Scilit]
- Clubb, R.; Mason, G. Captivity Effects on Wide-Ranging Carnivores. Nature 2003, 425, 473–474. [Google Scholar] [CrossRef] [Scilit]
- Haas, S.K.; Hayssen, V.; Krausman, P.R. Panthera Leo. Mamm. Species 2005, 2005, 3504539. [Google Scholar] [CrossRef] [Scilit]
- Hu, Y.; Ferrario, C.R.; Maitland, A.D.; Xi, Y.; Zhou, J.; Ye, B. LabGym: Quantification of User-Defined Animal Behaviors Using Learning-Based Holistic Assessment. Cell Rep. Methods 2023, 3, 100415. [Google Scholar] [CrossRef] [Scilit]
- Ardoin, T.; Sueur, C. Automatic Identification of Stone-Handling Behaviour in Japanese Macaques Using LabGym Artificial Intelligence. Primates J. Primatol. 2024, 65, 159–172. [Google Scholar] [CrossRef] [Scilit]
- FFmpeg Developers. FFmpeg. 2025. Available online: https://ffmpeg.org (accessed on 14 September 2026).
- Bhattiprolu, S. DigitalSreeni Image Annotator, Version 0.8.12; Github: San Francisco, CA, USA, 2024.
- R Core Team. R: A Language and Environment for Statistical Computing; R Foundation for Statistical Computing: Vienna, Austria, 2025. [Google Scholar]

Disclaimer/Publisher’s Note: The statements, opinions and data contained in all publications are solely those of the individual author(s) and contributor(s) and not of MDPI and/or the editor(s). MDPI and/or the editor(s) disclaim responsibility for any injury to people or property resulting from any ideas, methods, instructions or products referred to in the content. |
© 2026 by the authors. Licensee MDPI, Basel, Switzerland. This article is an open access article distributed under the terms and conditions of the Creative Commons Attribution (CC BY) license.