


Abstract
Hydrogen (H2) is a promising renewable energy carrier because of its high energy density and environmentally friendly characteristics. The halotolerant cyanobacterium Aphanothece halophytica is a potential biological H2 producer because of its ability to generate H2 via oxygen-sensitive hydrogenase activity under nitrogen-deprived dark anaerobic conditions. This study investigated the effects of various chemical supplements on H2 production by A. halophytica. Initial screening identified glucose, sodium dithionite, and dithiothreitol (DTT) as effective stimulants for enhancing H2 production. Optimization experiments established 10 mM glucose, 5 mM DTT, and 1 mM sodium dithionite as the optimal concentrations for H2 production. Combined supplementation under these optimized conditions resulted in the highest H2 production rate of 0.588 ± 0.028 mL·L−1·h−1 and maximum cumulative H2 yield of 8.445 ± 0.750 mL·L−1 after incubation for 72 h, representing increases of approximately 170–180%, compared with the untreated control. Simultaneously, maximum cumulative O2 production decreased from 20.176 ± 0.850 to 10.405 ± 0.480 mL·L−1, corresponding to approximately a 50% reduction. These findings demonstrate that simultaneous optimization of electron supply, oxygen minimization, and intracellular redox balance using selected stimulants effectively enhances H2 production by A. halophytica, providing a simple and practical strategy for improving biological H2 production.
1. Introduction
Global energy consumption continues to increase due to population growth, industrial development, and expanding technological demands. The continued dependence on fossil fuels has contributed to greenhouse gas emissions, climate change, air pollution, and concerns regarding long-term energy security. Consequently, the development of renewable and sustainable energy technologies has become a global research priority. Hydrogen (H2) is considered a promising energy carrier because of its high gravimetric energy density (141.9 MJ·kg−1) and clean utilization. Its combustion with O2 produces water as the main product without direct emissions of carbon dioxide, sulfur oxides, or particulate pollutants, while fuel cells can convert H2 into electricity with high efficiency [1,2]. These characteristics have positioned H2 as an important component of future low-carbon energy systems, with global demand expected to increase as countries pursue decarbonization and hydrogen-based energy strategies [3].
Despite these advantages, industrial H2 production is currently dominated by thermochemical processes, particularly steam methane reforming and coal gasification, which rely heavily on fossil resources and are associated with substantial carbon emissions and energy consumption [3,4]. Biological H2 production has therefore attracted increasing attention as a potentially more sustainable alternative because it can utilize renewable resources and operate under relatively mild conditions [5]. Biological H2 production is generally classified into dark fermentation, photofermentation, direct biophotolysis, and indirect biophotolysis according to the microorganisms and metabolic pathways involved [4]. Among biological systems, cyanobacteria are particularly attractive because they can use sunlight, water, and carbon dioxide while generating H2 through photosynthetic and fermentative metabolism. Cyanobacterial H2 evolution is primarily mediated by hydrogenase and nitrogenase, which use cellular reducing equivalents to catalyze proton reduction [4,5]. However, the high O2 sensitivity of these enzymes, especially hydrogenase, represents a major constraint on H2 production. O2 accumulation can inhibit hydrogenase activity and interfere with electron allocation toward H2 evolution, thereby reducing overall productivity [6,7]. Controlling O2 accumulation while maintaining sufficient electron supply to H2-producing pathways is therefore an important strategy for improving cyanobacterial biohydrogen production.
Several approaches have been investigated to overcome these limitations, including optimization of cultivation conditions, nutrient manipulation, metabolic and genetic engineering, and supplementation with exogenous compounds [8]. Among these approaches, nitrogen deprivation is particularly effective because it induces metabolic reprogramming and promotes the mobilization of intracellular carbon reserves. Under nitrogen-limited conditions, cellular resources are redirected from biomass synthesis toward the degradation of stored carbohydrates, particularly glycogen, and the activation of fermentative metabolism [9,10]. This process generates reducing equivalents, such as NADH and reduced ferredoxin, which can contribute to electron transfer toward H2-producing reactions [10]. Thus, improving the availability and allocation of reducing power represents an important avenue for increasing H2 evolution under nitrogen-deprived conditions. In parallel, strategies that minimize O2 accumulation can alleviate inhibition of hydrogenase and create more favorable conditions for H2 production [11].
The halotolerant unicellular cyanobacterium Aphanothece halophytica is a promising candidate for biological H2 production because of its ability to tolerate high salinity and osmotic stress. This physiological adaptability may facilitate cultivation in saline environments and reduce competition for freshwater resources [12]. Under nitrogen deprivation and dark anaerobic conditions, A. halophytica can mobilize intracellular glycogen, providing carbon substrates for glycolytic and oxidative pentose phosphate metabolism and generating reducing equivalents that support H2 evolution [13]. Nevertheless, the efficiency of this process can be limited by the availability of suitable electron donors and the persistence of O2 generated or retained within the system.
Previous work has shown that reducing O2 accumulation can substantially improve H2 production by A. halophytica. For example, co-cultivation with O2-consuming bacteria enhanced H2 production by alleviating O2-mediated inhibition of hydrogenase activity [14]. This finding indicates that O2 removal or reduction is an effective complementary strategy for improving H2 evolution. Exogenous carbon sources may provide another means of increasing electron availability. Glucose, for instance, can be metabolized through central carbon metabolic pathways to generate reducing equivalents that may be utilized by H2-producing enzymes [13]. Reducing agents may provide an additional benefit by decreasing O2 availability and maintaining a more favorable chemical environment for anaerobic electron transfer [15,16,17]. Therefore, combining metabolic stimulation with O2 mitigation may address two important constraints on H2 production: limited electron availability and enzyme inhibition by O2.
Although exogenous carbon sources and reducing agents have been investigated in biological H2-producing systems, their effects on A. halophytica under nitrogen-deprived dark anaerobic conditions remain insufficiently characterized. Limited information is available regarding the relative effectiveness of different classes of exogenous stimulants and their effects on H2 and O2 production in this halotolerant cyanobacterium. Compounds with different physiological functions, including sugars, reducing agents, phytohormones, vitamins, and mineral supplements, may influence H2 production through complementary effects on carbon metabolism, electron transfer, enzyme activity, or cellular stress responses. A systematic evaluation of these compounds could therefore identify effective strategies for improving H2 production beyond the optimization of individual cultivation parameters.
Accordingly, this study investigated the effects of selected exogenous stimulants, including sugars, reducing agents, phytohormones, vitamins, and mineral supplements, on H2 production by A. halophytica under nitrogen-deprived dark anaerobic conditions. The most effective stimulants were identified based on their effects on H2 production, while changes in O2 production were also evaluated to assess their potential contribution to process performance. The findings provide insight into the metabolic and redox factors influencing biohydrogen production in A. halophytica and may contribute to the development of more efficient biological H2 production strategies using saline-adapted cyanobacteria.
2. Materials and Methods
2.1. Growth and Adaptation Conditions
The experimental procedure consisted of three sequential stages: (1) cell growth under nutrient-replete light aerobic conditions, (2) nitrogen-deprived adaptation under light aerobic conditions, and (3) H2 production under nitrogen-deprived dark anaerobic conditions. First, the halotolerant cyanobacterium A. halophytica, at an optical density at 730 nm (OD730) of 0.1, was cultivated in 250 mL Erlenmeyer flasks containing 100 mL of BG11 medium (pH 7.4) [18] supplemented with Turk Island salt solution [19]. The cultures were incubated at 30 °C on a rotary shaker at 120 rpm under continuous illumination at a light intensity of 30 μmol photons m−2·s−1 for 7 days. For the adaptation process, cells were harvested by centrifugation at 8000× g for 5 min at 4 °C and subsequently resuspended in 100 mL of nitrogen-deprived BG11 medium (BG110) supplemented with Turk Island salt solution. The cultures were maintained under shaking conditions for 2 days to initiate cellular responses associated with nitrogen deprivation before the H2 production experiments. All experiments were performed using three independent biological replicates.
2.2. Measurement of H2 and O2 Production
Seven-day-old A. halophytica cultures adapted for 2 days in BG110 medium supplemented with Turk Island salt solution were harvested by centrifugation and resuspended in fresh BG110 medium to a final cell density corresponding to an OD730 of 20. A 5 mL aliquot of the cell suspension was transferred into a 12 mL glass vial and sealed with a rubber septum. Anaerobic conditions were established by purging the cell suspension with argon gas for 15 min. The sealed vials were subsequently incubated in the dark at 30 °C with continuous shaking at 120 rpm for 120 h. H2 and O2 concentrations in the vial headspace were analyzed by gas chromatography (Hewlett-Packard HP5890A, Avondale, PA, USA) at 30 °C and 101.325 kPa [20]. High-purity argon (99.999% v/v) was used as the carrier gas at a constant flow rate of 20 mL·min−1. The injector, column, and detector temperatures were maintained at 100, 50, and 100 °C, respectively. The instrument was calibrated using a certified standard gas mixture containing 4% (v/v) H2 in argon (Praxair, Bangkok, Thailand). Gas concentrations were calculated from the corresponding GC measurements using the calibration relationship established with the certified standard. The amounts of H2 and O2 were calculated from their measured concentrations and the vial headspace volume, normalized to the culture volume, and expressed as mL·L−1. Cumulative H2 and O2 production was determined at each sampling time point relative to the initial measurement. Production rates were calculated from the change in cumulative gas production over the corresponding incubation period and expressed as mL·L−1·h−1. The maximum H2 production rate was calculated from cumulative H2 production during the first 24 h of incubation, whereas maximum cumulative H2 and O2 yields were determined at their respective optimal sampling time points and expressed as mL·L−1.
For comparison with previous studies, dry cell weight was determined from the difference between filter weights before and after cell collection. H2 production was also normalized to dry biomass and expressed as μmol H2 g−1 dry weight h−1 for the production rate and μmol H2 g−1 dry weight for cumulative H2 yield. Time-course measurements were used to characterize the temporal pattern of H2 accumulation throughout the 120 h incubation period. All experiments were conducted using three independent biological replicates.
2.3. In Vivo Bidirectional Hydrogenase Activity Assay
In vivo bidirectional hydrogenase activity was determined by measuring H2 production mediated by dithionite-reduced methyl viologen, as previously described [13]. Briefly, cells from each treatment were harvested by centrifugation and washed with 25 mM sodium phosphate buffer (pH 7.6) to remove residual culture medium and externally supplied compounds. Subsequently, 1 mL of cyanobacterial culture was mixed with 1 mL of indicated sodium phosphate buffer containing 20 mM sodium dithionite and 5 mM methyl viologen. The reaction mixture was transferred to a sealed serum vial, flushed with argon gas for 5 min to establish anaerobic conditions, and incubated in the dark at 30 °C for 30 min. The amount of H2 produced was subsequently determined by gas chromatography equipped with a thermal conductivity detector (GC-TCD). Bidirectional hydrogenase activity was expressed as mL H2 L−1·min−1.
2.4. Screening of Stimulants for Enhanced H2 Production
To identify compounds capable of enhancing H2 production by A. halophytica, stimulants belonging to five functional groups, including sugars, reducing agents, phytohormones, vitamins, and minerals, were evaluated. The sugar group consisted of glucose (Carlo Erba Reagents, Milan, Italy) and sucrose (Carlo Erba, Milan, Italy). The reducing agent group included sodium hydrosulfite (Sigma-Aldrich, Taufkirchen, Germany), DL-dithiothreitol (DTT) (Sigma-Aldrich, Oakville, ON, Canada), methyl viologen dichloride hydrate (Sigma-Aldrich, Taufkirchen, Germany), and L-cysteine (Sigma-Aldrich, Shanghai, China). The phytohormone group consisted of 6-benzylaminopurine (cytokinin) (Sigma-Aldrich, Taufkirchen, Germany), gibberellic acid (GA3) (Sigma-Aldrich, St. Louis, MO, USA), indole-3-acetic acid (IAA) (Merck KGaA, Darmstadt, Germany), and phytomelatonin (Sigma-Aldrich, St. Louis, MO, USA). The vitamin group included cobalamin and riboflavin (Sigma-Aldrich, St. Louis, MO, USA), as well as L-ascorbic acid (Vetec, Shanghai, China). The mineral group consisted of cobalt (II) chloride hexahydrate (Sigma-Aldrich, St. Louis, MO, USA), nickel (II) sulfate hexahydrate (Sigma-Aldrich, St. Louis, MO, USA), ferric citrate (Sigma-Aldrich, St. Louis, MO, USA), magnesium sulfate heptahydrate (Merck KGaA, Darmstadt, Germany), and copper (II) sulfate pentahydrate (Sigma-Aldrich, St. Louis, MO, USA). Each stimulant was individually added to nitrogen-adapted A. halophytica cultures at a final concentration of 1 mM. H2 and O2 concentrations in the vial headspace were determined using GC–TCD. Compounds exhibiting the greatest enhancement of H2 production were subsequently selected for concentration optimization experiments.
2.5. H2 Production Kinetic Analysis by Modified Gompertz Model
Cumulative H2 production kinetics were analyzed using the modified Gompertz model by nonlinear regression [21]:
where H is the cumulative H2 production (mL·L−1) at time t (h), A is the maximum cumulative H2 production potential (mL·L−1), Rm is the maximum H2 production rate (mL·L−1·h−1), λ is the lag phase (h), and e is Euler’s number (2.71828). Model parameters were estimated by nonlinear least-squares regression using GraphPad Prism 11.2, and the fitted curves were compared with the experimental data.
2.6. Statistical Analysis
All experiments were performed in three independent biological replicates (n = 3). Data are presented as mean ± standard deviation (SD). The assumptions of normality of residuals and homogeneity of variance were assessed before one-way ANOVA. Statistical significance among treatment groups was evaluated using one-way analysis of variance (ANOVA) followed by Duncan’s multiple range test. Differences were considered statistically significant at p < 0.05. Detailed ANOVA results, including degrees of freedom, F statistics, p-values, and partial eta squared values, are provided in Tables S1–S6.
3. Results
3.1. Screening of Stimulants for H2 and O2 Production
The effects of various stimulants belonging to five stimulant groups, including sugars, reducing agents, phytohormones, vitamins, and minerals, on H2 and O2 production by A. halophytica under nitrogen-deprived dark anaerobic conditions are summarized in Table 1. Among the sugar treatments, glucose exhibited the strongest stimulatory effect on H2 production. Glucose supplementation increased the H2 production rate from 0.218 ± 0.012 to 0.326 ± 0.018 mL·L−1·h−1 (approximately 50% increase) and increased maximum cumulative H2 production from 3.043 ± 0.120 to 5.199 ± 0.180 mL·L−1 (approximately 71% increase). Simultaneously, maximum cumulative O2 production decreased from 20.175 ± 0.450 to 14.503 ± 0.340 mL·L−1. In contrast, sucrose reduced cumulative H2 production to 2.467 ± 0.110 mL·L−1 and increased cumulative O2 accumulation to 24.008 ± 0.520 mL·L−1. Among the reducing agents tested, sodium dithionite and dithiothreitol produced the most pronounced positive effects. Sodium dithionite increased maximum cumulative H2 production to 4.529 ± 0.180 mL·L−1 (approximately 49% increase), whereas DTT increased maximum cumulative H2 production to 4.085 ± 0.160 mL·L−1 (approximately 34% increase). Both treatments were accompanied by lower O2 accumulation compared with the control culture. In contrast, cysteine and methyl viologen at 1 mM decreased H2 production compared with the untreated control.
Table 1.
Screening of H2 and O2 production by A. halophytica incubated in BG110 medium supplemented with Turks Island salt solution and various stimulants at a final concentration of 1 mM under dark anaerobic conditions for 120 h. Different superscript letters within the same column indicate significant differences among all treatments according to Duncan’s multiple range test at p < 0.05.
Phytohormones generally exerted inhibitory effects on H2 production. Gibberellic acid produced the strongest inhibition, reducing the H2 production rate to 0.045 ± 0.006 mL·L−1·h−1. Similarly, cytokinin, indole-3-acetic acid, and phytomelatonin all decreased H2 production relative to the untreated control. Vitamin supplementation did not improve H2 production. Riboflavin and L-ascorbic acid markedly increased O2 accumulation while simultaneously reducing H2 production. Likewise, mineral supplementation failed to enhance H2 production. Ferric citrate, magnesium sulfate, and copper sulfate strongly inhibited H2 evolution, with maximum cumulative H2 yields below 0.25 mL·L−1. Notably, magnesium sulfate and copper sulfate reduced maximum cumulative H2 production to only 0.095 ± 0.015 and 0.092 ± 0.015 mL·L−1, respectively. Overall, treatments that enhanced H2 production generally reduced O2 accumulation, whereas treatments associated with elevated O2 production exhibited lower H2 productivity. Based on these results, glucose, sodium dithionite, and DTT were selected for subsequent optimization experiments because they significantly enhanced H2 production while simultaneously lowering O2 accumulation relative to the control treatment.
3.2. Effect of Glucose Concentration on H2 and O2 Production
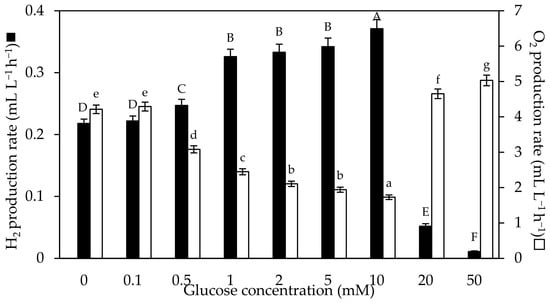
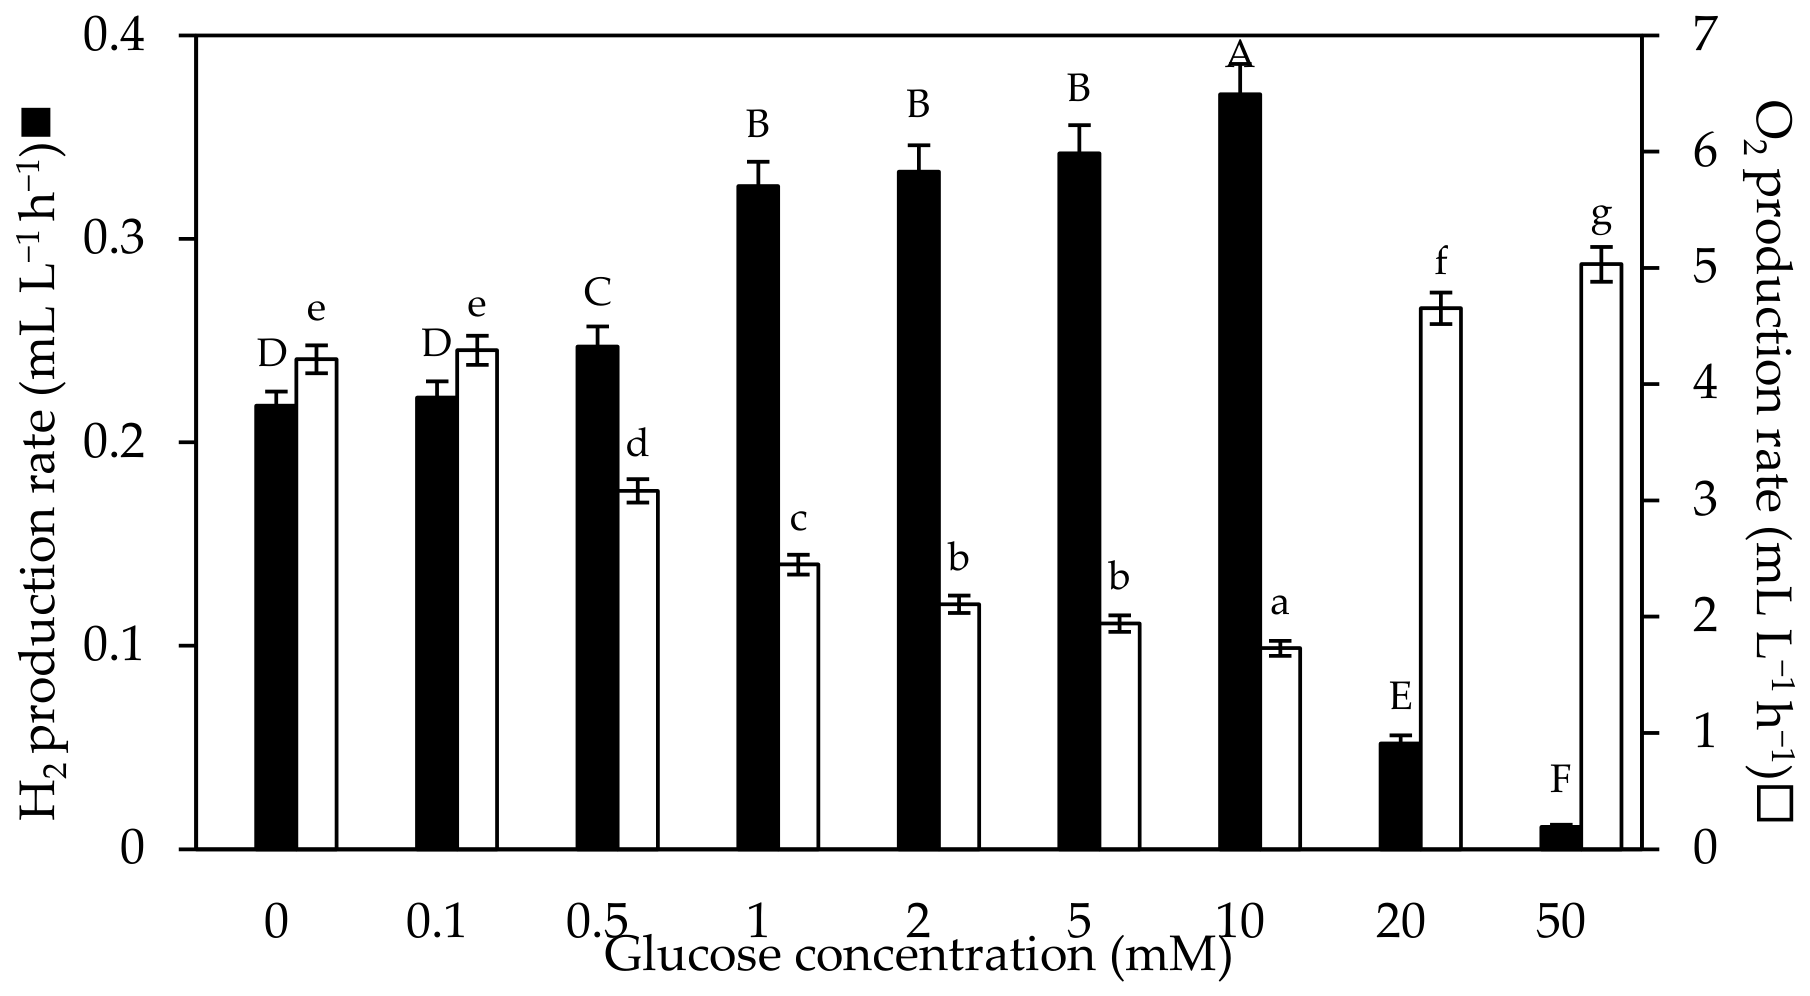
H2 production increased progressively with increasing glucose concentration from 0.1 to 10 mM. The maximum H2 production rate increased from 0.222 ± 0.008 mL·L−1·h−1 at 0.1 mM glucose to 0.371 ± 0.015 mL·L−1·h−1 at 10 mM glucose (approximately 67% increase) (Figure 1). Similarly, maximum cumulative H2 production increased steadily and reached a maximum value of 6.394 ± 0.502 mL·L−1 at 10 mM glucose. This value was approximately 110% higher than that observed in the untreated control culture (3.043 ± 0.120 mL·L−1). The enhancement of H2 production was accompanied by a substantial reduction in O2 production. The O2 production rate decreased from 4.214 ± 0.120 mL·L−1·h−1 in the control culture to 1.729 ± 0.065 mL·L−1·h−1 at 10 mM glucose (Figure 1), corresponding to a reduction of approximately 59%. Concurrently, the highest H2 production rate was observed at this concentration. However, higher glucose concentrations than 10 mM increased the O2 production rate, resulting in a decrease in the H2 production rate (Figure 1). In contrast, glucose concentrations above the optimum (20 and 50 mM) resulted in a pronounced decline in H2 production accompanied by a marked increase in O2 production. These findings suggest that excessive glucose supplementation adversely affected H2-producing conditions, leading to substantially lower H2 production than that observed at the optimal concentration of 10 mM.
Figure 1.
H2 and O2 production rates by A. halophytica incubated in BG110 medium supplemented with Turks Island salt solution containing different glucose concentrations under dark anaerobic incubation for 24 h. Values are presented as mean ± SD (n = 3). Error bars represent standard deviations from three independent biological replicates. Different uppercase letters indicate significant differences in H2 production rates, whereas different lowercase letters indicate significant differences in O2 production rates according to Duncan’s multiple range test (p < 0.05).
3.3. Effect of Sodium Dithionite Concentration on H2 and O2 Production
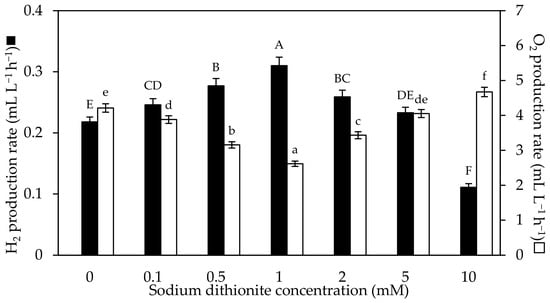
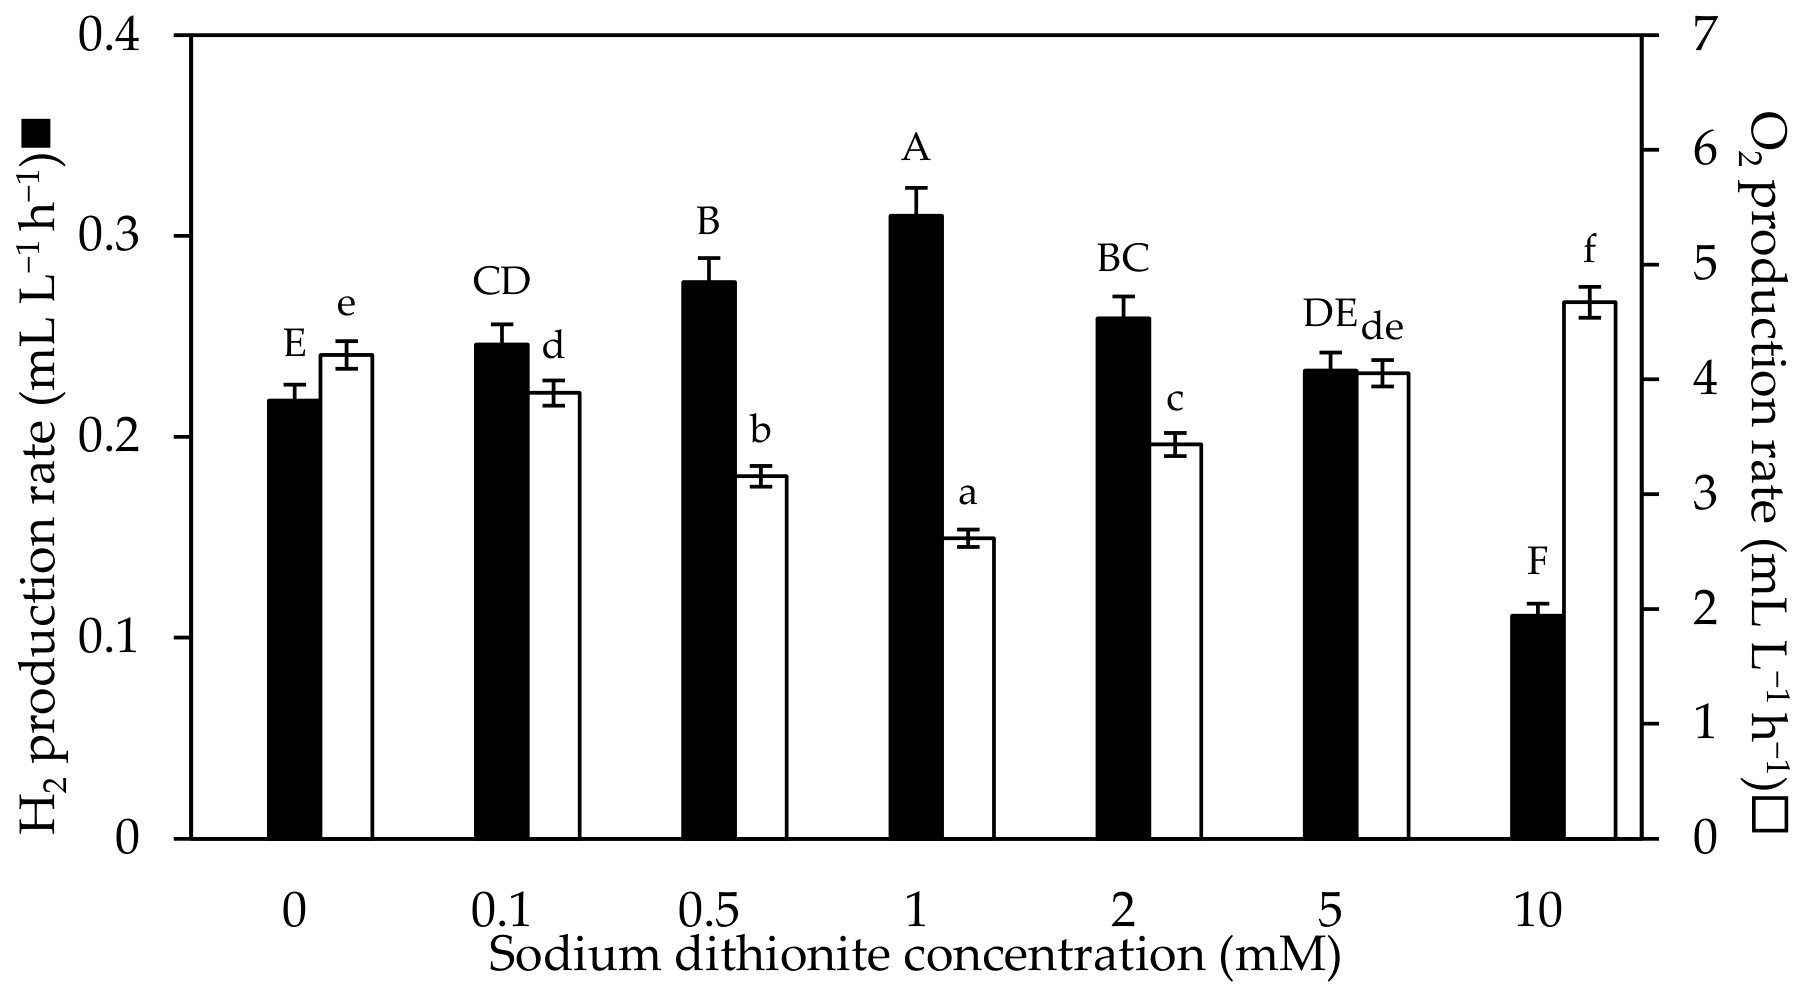
H2 production increased as sodium dithionite concentration increased from 0.1 to 1 mM. The highest H2 production rate of 0.310 ± 0.014 mL·L−1·h−1 was obtained at 1 mM sodium dithionite (Figure 2). This rate represented an increase of approximately 42% compared with the control. Concurrently, O2 accumulation decreased with increasing sodium dithionite concentration. The lowest O2 production rate was observed at 1 mM sodium dithionite, reaching 2.617 ± 0.075 mL·L−1·h−1, compared with 4.214 ± 0.120 mL·L−1·h−1 in the untreated control (Figure 2). Further increases in sodium dithionite concentration beyond 1 mM resulted in decreased H2 production. At 10 mM sodium dithionite, the H2 production rate declined to 0.111 ± 0.006 mL·L−1·h−1. Simultaneously, the O2 production rate increased to 4.672 ± 0.135 mL·L−1·h−1 (Figure 2). These findings indicate that moderate O2 scavenging promotes H2 evolution, whereas excessive reducing conditions adversely affect H2-producing metabolism.
Figure 2.
H2 and O2 production rates by A. halophytica incubated in BG110 medium supplemented with Turks Island salt solution containing different concentrations of sodium dithionite under dark anaerobic incubation for 24 h. Values are presented as mean ± SD (n = 3). Error bars represent standard deviations from three independent biological replicates. Different uppercase letters indicate significant differences in H2 production rates, whereas different lowercase letters indicate significant differences in O2 production rates according to Duncan’s multiple range test (p < 0.05).
3.4. Effect of DTT Concentration on H2 and O2 Production
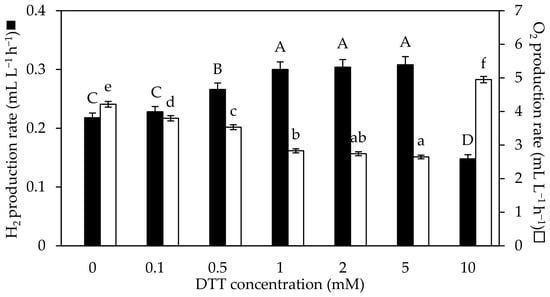
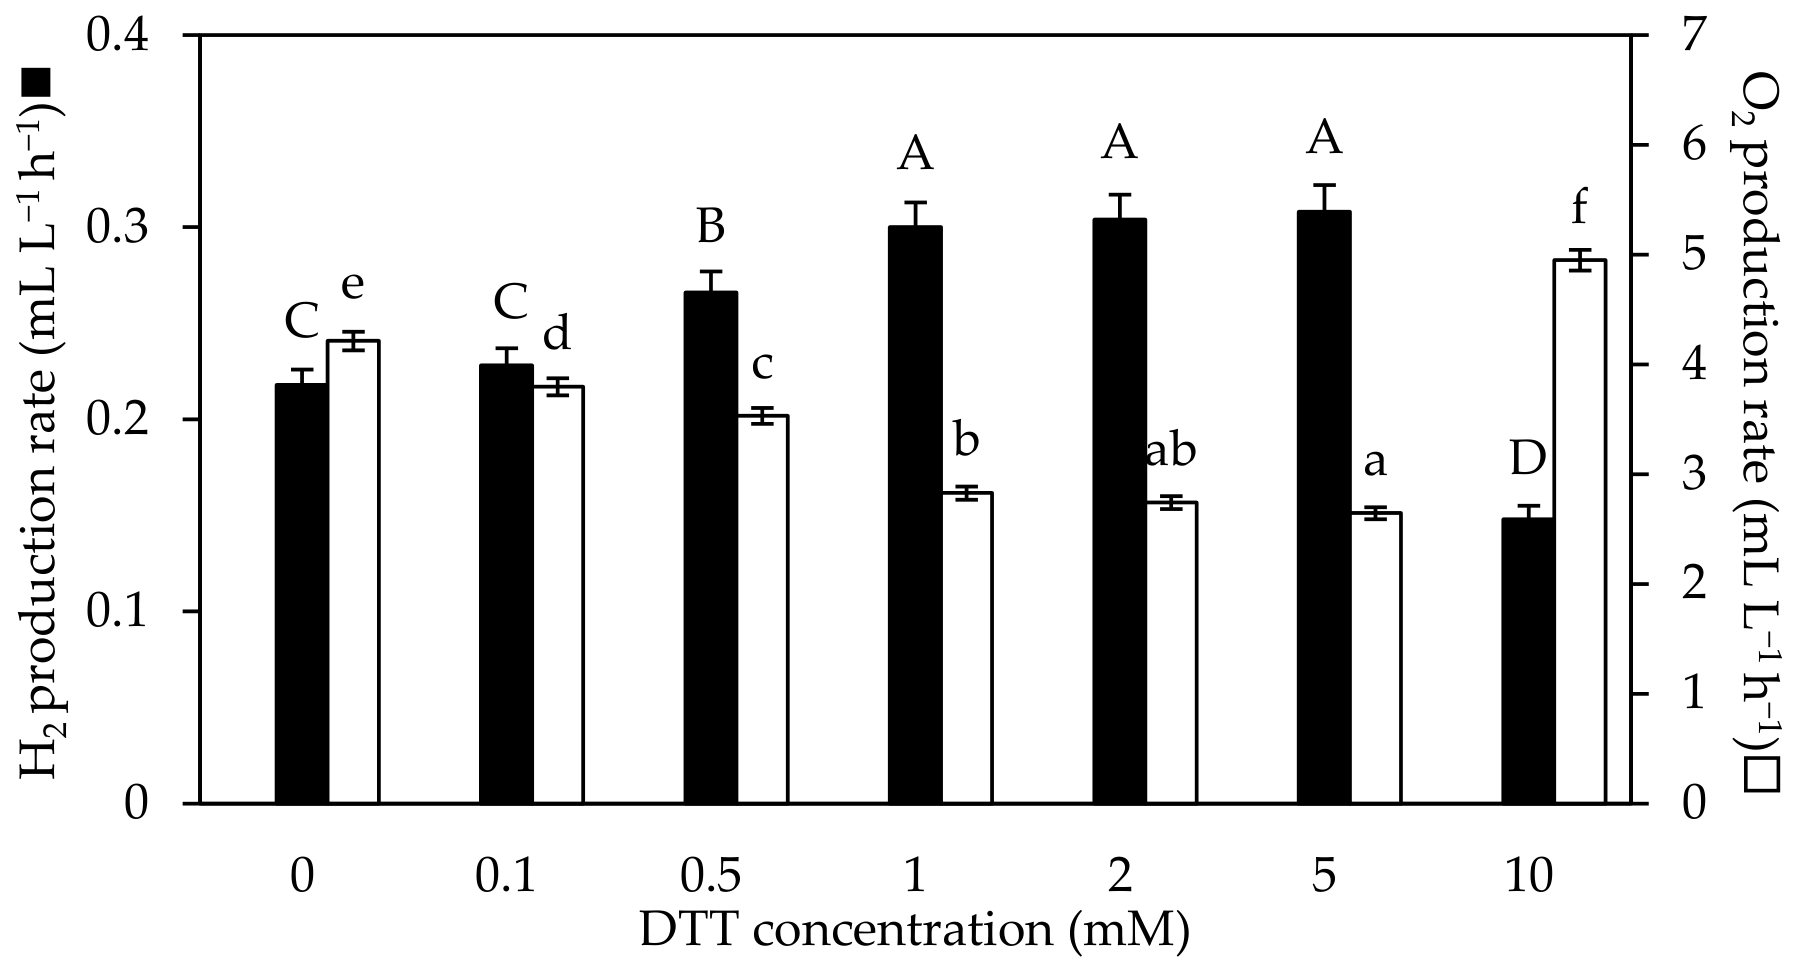
H2 production increased progressively as DTT concentration increased from 0.1 to 5 mM. Maximum H2 production rates were observed at 1–5 mM DTT, with no significant differences among these concentrations (Figure 3), approximately a 41% increase compared with the control. However, 5 mM DTT produced the highest cumulative H2 yield at 4.502 ± 0.360 mL·L−1 after dark anaerobic incubation for 72 h and was therefore selected as the optimal concentration for subsequent experiments. The increase in H2 production was accompanied by a reduction in O2 production. The lowest O2 production rate was observed at 5 mM DTT, reaching 2.646 ± 0.055 mL·L−1·h−1, compared with 4.214 ± 0.085 mL·L−1·h−1 in the untreated control (Figure 3). These results indicate that improvement of the cellular redox environment positively influences H2-producing metabolism. However, further increases in DTT concentration resulted in reduced H2 production. At 10 mM DTT, the H2 production rate decreased to 0.148 ± 0.007 mL·L−1·h−1, while the O2 production rate increased to 4.95 ± 0.095 mL·L−1·h−1 (Figure 3).
Figure 3.
H2 and O2 production rates by A. halophytica incubated in BG110 medium supplemented with Turks Island salt solution containing different concentrations of DTT under dark anaerobic incubation for 24 h. Values are presented as mean ± SD (n = 3). Error bars represent standard deviations from three independent biological replicates. independent experiments. Different uppercase letters indicate significant differences in H2 production rates, whereas different lowercase letters indicate significant differences in O2 production rates according to Duncan’s multiple range test (p < 0.05).
3.5. Combined Effects of Combined Stimulants with Optimal Concentrations on H2 Production and Hydrogenase Activity
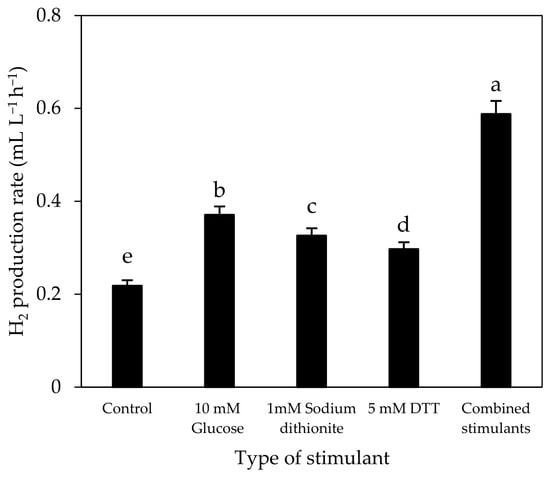
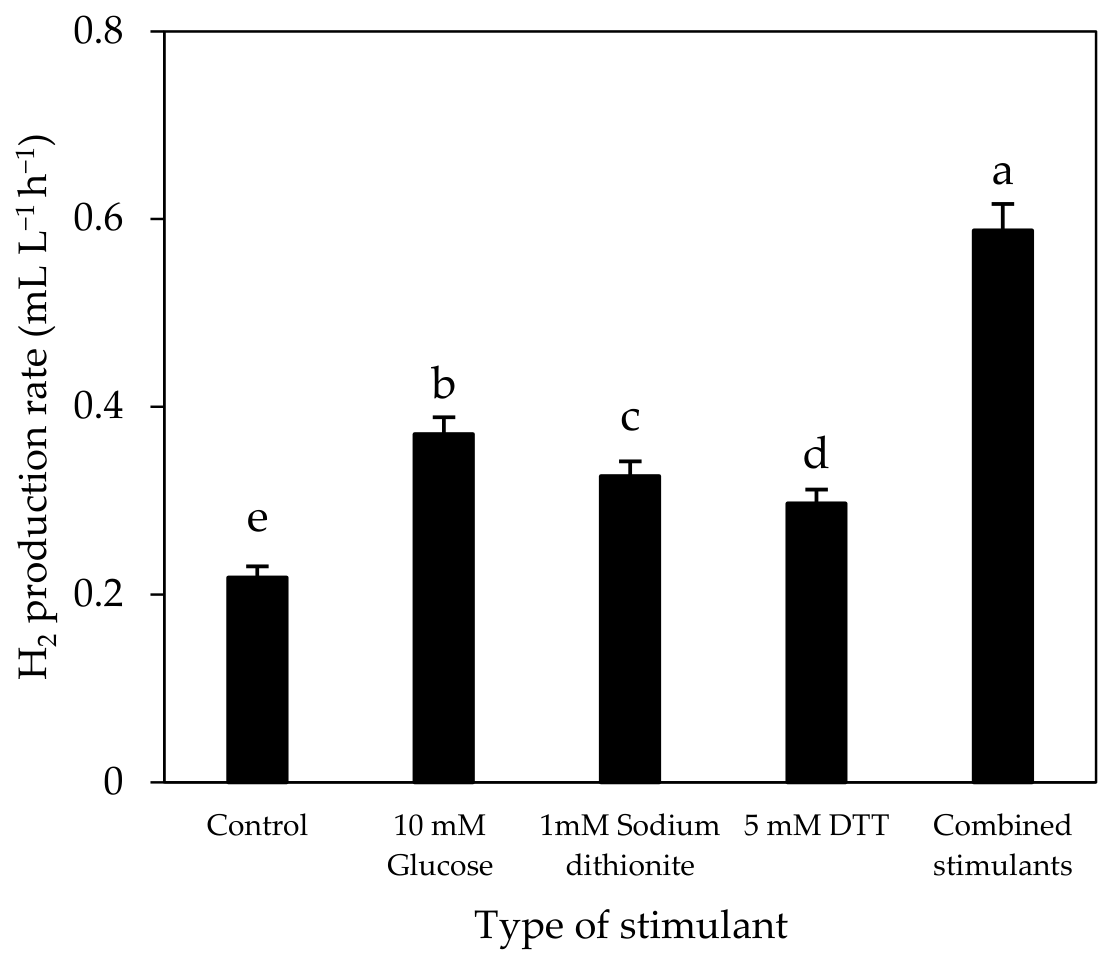
The effects of the single and combined selected stimulants with their optimal concentrations on H2 production by A. halophytica are presented in Figure 4. Among all treatments evaluated, the combined supplementation of 10 mM glucose, 1 mM sodium dithionite, and 5 mM DTT resulted in the greatest enhancement of H2 production. The combined treatment achieved the highest H2 production rate of 0.588 ± 0.028 mL·L−1·h−1, which represented an increase of approximately 170% compared with the control. This rate was significantly higher than that obtained with single supplementation of glucose with 0.371 ± 0.018 mL·L−1·h−1, sodium dithionite with 0.311 ± 0.016 mL·L−1·h−1, DTT with 0.307 ± 0.015 mL·L−1·h−1, and the untreated control with 0.218 ± 0.012 mL·L−1·h−1 (Figure 4). Similarly, the maximum cumulative H2 yield reached 8.445 ± 0.750 mL·L−1 after 72 h of incubation, representing approximately 178% enhancement compared with the control treatment of 3.043 ± 0.120 mL·L−1. Among the individual stimulants, glucose produced the strongest positive effect on H2 production, followed by sodium dithionite and DTT. These results indicated that the combined treatment significantly outperformed all individual stimulant treatments, indicating the existence of combined interactions among the three compounds. The time-course profiles demonstrated that the measured H2 accumulation increased progressively during the first 72 h of incubation, followed by an apparent plateau from 72 to 120 h across all treatments, indicating that H2 production approached its maximum production potential during the later stage of incubation.
Figure 4.
Effects of individual and combined stimulants at optimal concentrations on H2 production by A. halophytica under nitrogen-deprived dark anaerobic conditions. Different letters indicate significant differences among treatments (p < 0.05). Values are expressed as mean ± SD (n = 3). Error bars represent standard deviations.
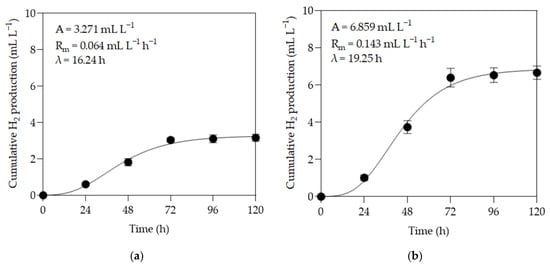
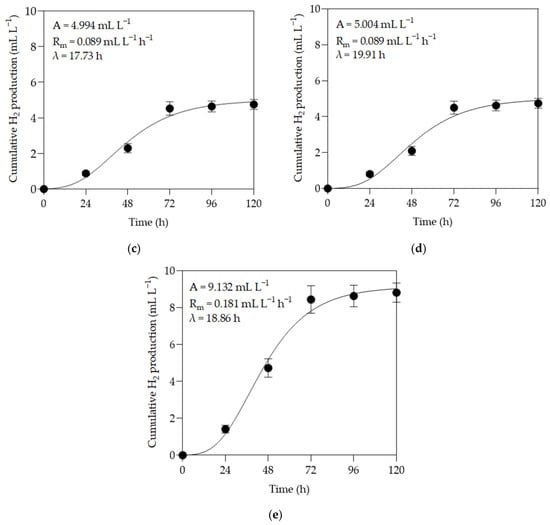
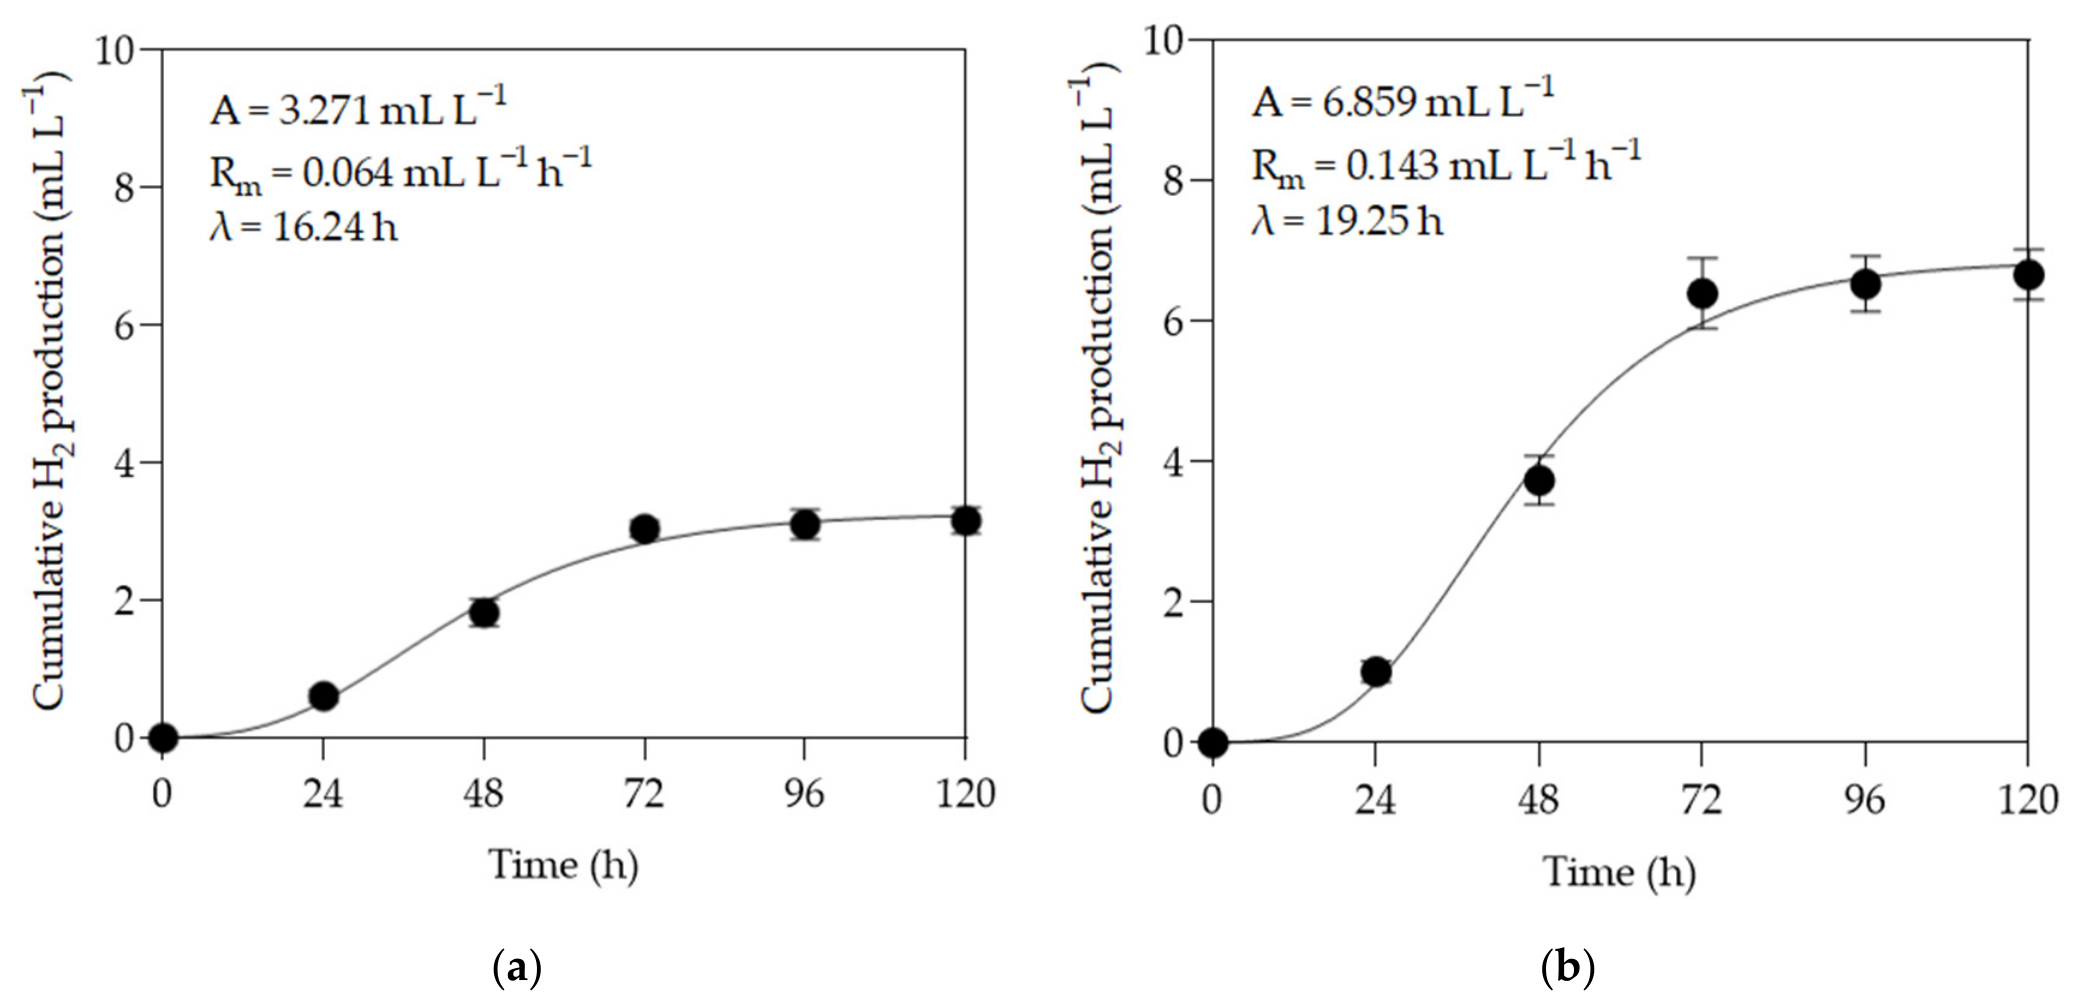
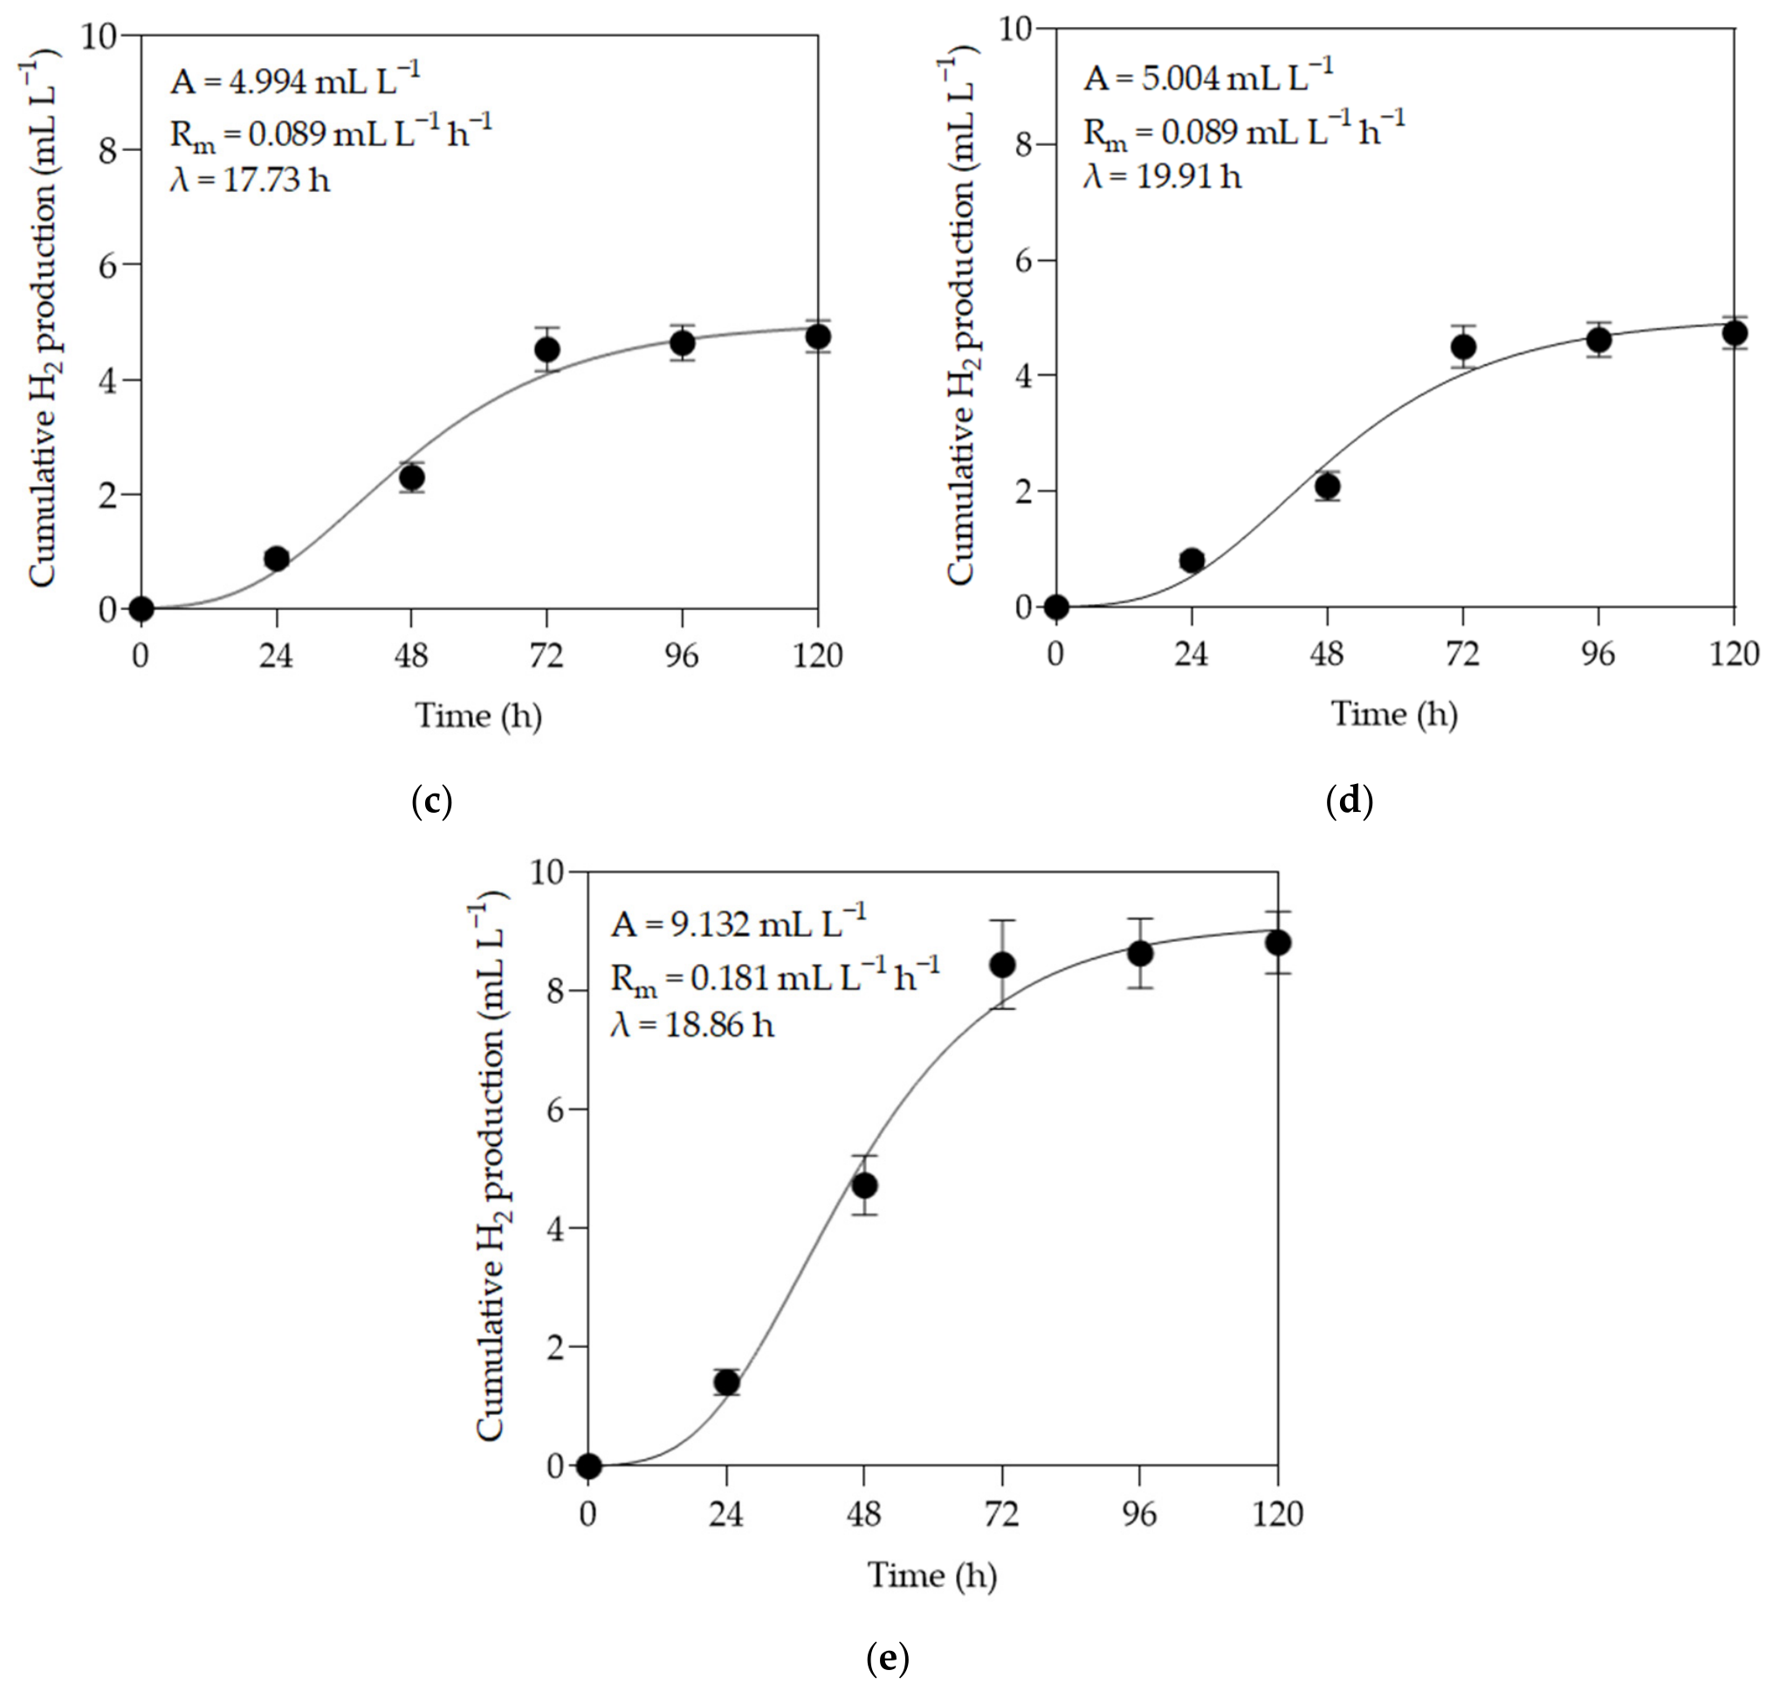
Time course profiles of cumulative H2 production by A. halophytica treated with individual and combined stimulants were analyzed using the modified Gompertz model. All experimental profiles were fitted to the model to characterize the H2 production kinetics under the different treatments (Figure 5). The estimated maximum H2 production potential (A) was 3.271, 6.859, 4.994, 5.004, and 9.132 mL·L−1 for the control, 10 mM glucose, 1 mM sodium dithionite, 5 mM DTT, and combined treatment, respectively. Similarly, the estimated maximum H2 production rate (Rm) increased from 0.064 mL·L−1·h−1 in the control to 0.143, 0.089, 0.089, and 0.181 mL·L−1·h−1 under the respective treatments. The lag phase (λ) ranged from 16.24 to 19.91 h. Notably, the experimentally measured cumulative H2 production at 120 h corresponded to 94.8–97.1% of the respective A values, whereas 90.0–93.2% of the modeled production potential had already been reached by 72 h. Only a relatively small increase in cumulative H2 production was observed from 72 to 120 h, indicating that H2 accumulation had approached a plateau after approximately 72 h.
Figure 5.
Time-course profiles of cumulative H2 production fitted to the modified Gompertz model under different H2-enhancement treatments: Control (a), 10 mM glucose (b), 1 mM sodium dithionite (c), 5 mM DTT (d), and combined stimulants (10 mM glucose + 5 mM DTT + 1 mM sodium dithionite) (e). Symbols (●) represent experimentally measured cumulative H2 production, and solid lines represent the fitted modified Gompertz model. Data points are presented as mean ± SD (n = 3). The fitted parameters A, Rm, and λ represent the maximum H2 production potential (mL·L−1), maximum H2 production rate (mL·L−1·h−1), and lag phase (h), respectively.
The enhancement of H2 production was accompanied by a marked reduction in O2 accumulation and an increase in hydrogenase activity (Table 2). The combined treatment exhibited the lowest O2 production rate of 1.612 ± 0.060 mL·L−1·h−1 and maintained a low cumulative O2 yield of 10.405 ± 0.480 mL·L−1 compared with the untreated control with 20.176 ± 0.850 mL·L−1. Glucose alone also substantially reduced O2 accumulation to 10.553 ± 0.550 mL·L−1, whereas sodium dithionite and DTT resulted in intermediate O2 levels of 15.716 ± 0.750 and 16.139 ± 0.800 mL·L−1, respectively. Consistent with the H2 production results, the combined treatment exhibited the highest hydrogenase activity of 0.437 ± 0.041 mL·L−1·min−1, representing approximately a 168% increase over the untreated control of 0.163 ± 0.015 mL·L−1·min−1.
Table 2.
Effects of selected single and combined stimulants on H2, O2 production and hydrogenase activity of A. halophytica incubated in BG110 medium supplemented with Turks Island salt solution under dark anaerobic conditions. Values are presented as mean ± SD (n = 3). Different superscript letters within the same column indicate significant differences according to Duncan’s multiple range test at p < 0.05.
4. Discussion
4.1. Effects of Different Stimulant Groups on H2 Production
The screening experiment demonstrated that the effectiveness of exogenous stimulants in enhancing H2 production by A. halophytica was strongly dependent on their biochemical function. Among the five stimulant groups evaluated, glucose, sodium dithionite, and DTT significantly enhanced H2 production, whereas phytohormones, vitamins, and mineral supplements provided no apparent benefit and, in several cases, markedly inhibited H2 evolution. This pattern suggests that H2 production in A. halophytica under dark, nitrogen-deprived conditions is influenced primarily by carbon availability and intracellular redox conditions rather than by compounds that primarily regulate growth or serve as micronutrients. Thus, the stimulants that were most effective in the present study appear to act directly or indirectly on the metabolic and redox environment required for H2 evolution.
Although the experiments were performed under dark, argon-purged conditions to minimize photosynthetic O2 evolution, measurable O2 accumulation was still detected in the vial headspace (Table 1). This observation should be interpreted cautiously and does not necessarily ensure that the cultures remained completely anaerobic throughout the experimental period. Because gas samples were collected from the vial headspace, the detected O2 may have resulted from residual O2 remaining after argon purging and/or O2 generated or released during incubation. One possible biological source is intracellular reactive oxygen species (ROS) metabolism. In cyanobacteria, H2O2 can be decomposed by catalase into H2O and O2, providing a potential non-photosynthetic source of O2 under dark conditions [22]. However, because neither H2O2 concentration nor catalase activity was measured in this study, this mechanism remains speculative and cannot be established as the direct source of the observed O2. In addition, dissolved O2 was not independently quantified; therefore, the measured values represent the net O2 accumulated in the headspace rather than the total O2 content of the culture system. The lower O2 accumulation observed following supplementation with glucose, sodium dithionite, and DTT may reflect mitigated net O2 levels under the combined treatment. However, the specific contributions of residual O2, biological O2 generation, and gas–liquid partitioning cannot be distinguished based on the present experimental design. Therefore, the observed reduction should be interpreted as decreased headspace O2 accumulation rather than direct evidence of enhanced O2 scavenging. Nevertheless, this reduction is physiologically relevant because hydrogenases are highly sensitive to O2, and even limited O2 accumulation can compromise their catalytic activity [7]. The contrasting trends in H2 and O2 accumulation across the treatments therefore suggest that maintaining a sufficiently reducing and low-O2 environment may be an important prerequisite for efficient H2 evolution. Future experiments incorporating abiotic blanks, killed-cell controls, leakage tests, and simultaneous measurements of dissolved and headspace O2 would help clarify the origin and dynamics of O2 under these experimental conditions.
The stimulatory effect of glucose is consistent with previous reports showing that exogenous carbon sources can enhance H2 production by increasing substrate availability and generating reducing equivalents through glycolytic and fermentative pathways [13]. In contrast, the limited or negative effects of phytohormones may reflect the physiological state of the cells. Compounds such as cytokinins, gibberellins, and indole-3-acetic acid (IAA) are primarily associated with regulation of growth, photosynthetic activity, and cellular stress responses in cyanobacteria and microalgae [23,24]. Under nitrogen-starved, dark, and anaerobic conditions, however, cellular priorities shift from growth toward survival and energy conservation. Consequently, stimulation of growth-related regulatory pathways may not translate into increased H2 production and could instead divert cellular resources away from H2-generating metabolism. Similarly, the vitamin and mineral supplements tested did not improve H2 production and, in several supplements, were accompanied by increased O2 accumulation. Although vitamins and minerals are essential for cellular metabolism, their addition does not necessarily enhance H2 production when the major limitation lies in electron availability or redox regulation. In some cases, excessive supplementation may disturb cellular homeostasis or promote reactions that increase intracellular oxidative pressure. The observed responses therefore emphasize that increasing the availability of individual nutrients is insufficient to improve H2 production unless the overall metabolic and redox conditions remain favorable for hydrogenase activity.
4.2. Enhancement of H2 Production by Glucose Supplementation
Glucose supplementation substantially enhanced H2 production by A. halophytica, with 10 mM glucose yielding the highest H2 yield among the concentrations tested. This response indicates that glucose can function as an effective external carbon and electron source under dark, nitrogen-deprived conditions. During nitrogen starvation, glycogen degradation provides endogenous carbon and reducing power, while exogenous glucose can supplement this carbon supply and increase flux through glycolytic and fermentative pathways [9,17]. Enhanced glycolytic activity would be expected to increase the formation of pyruvate and reducing equivalents, including NADH, which can subsequently support electron transfer toward H2-producing reactions [17]. The increased H2 production observed following glucose supplementation is therefore consistent with a shift toward greater availability of carbon-derived reducing power.
The simultaneous decrease in O2 production at 10 mM glucose provides additional evidence that the treatment created a more favorable environment for H2 evolution. Because hydrogenases are strongly inhibited by O2, limiting O2 accumulation can increase the fraction of enzyme activity directed toward H2 production [7]. The improvement in H2 production may therefore have resulted from the combined effects of enhanced electron availability and reduced O2-associated inhibition rather than from increased carbon availability alone. However, the beneficial effect of glucose was not maintained at higher concentrations. Increasing the glucose concentration beyond 10 mM resulted in a pronounced decline in H2 production, indicating that carbon availability was not the sole determinant of H2 productivity. Excess glucose may disrupt metabolic homeostasis by increasing osmotic pressure and altering carbon partitioning toward competing metabolic pathways or extracellular fermentation products [9]. Such metabolic diversion could reduce the proportion of reducing equivalents available for H2 production. Notably, the substantial increase in O2 production at 20 and 50 mM glucose further suggests that excessive glucose disturbed the cellular redox balance or stimulated metabolic processes capable of contributing to O2 accumulation. Thus, the response to glucose appears to be concentration-dependent, with 10 mM providing a favorable balance between increased carbon/electron supply and maintenance of a low-O2, reducing environment. These findings highlight the importance of optimizing carbon availability rather than simply maximizing substrate concentration for improving dark anaerobic H2 production by A. halophytica.
4.3. Roles of Sodium Dithionite and DTT in Improving H2 Production
Among the reducing agents tested, sodium dithionite and DTT significantly enhanced H2 production, indicating that modulation of the redox environment can favor H2 evolution under dark, nitrogen-deprived conditions. Sodium dithionite acts as an O2 scavenger that eliminates O2, thereby initiating hydrogenase activity and enhancing H2 production [15,16]. The reduction in O2 accumulation observed at 1 mM sodium dithionite contributed to enhanced H2 production by protecting O2-sensitive hydrogenases from oxidative inactivation. Furthermore, the establishment of a more favorable redox environment may facilitate electron transfer processes associated with proton reduction. DTT exhibited a similar stimulatory effect but likely operated through a different mechanism. DTT is a widely used thiol-based reducing agent that preserves protein thiol groups in their reduced state, thereby helping maintain the activity of redox-sensitive enzymes under reducing conditions [25]. Hydrogenases contain iron–sulfur clusters that are essential for catalytic H2 metabolism and electron transfer processes [7,26]. Therefore, the enhanced H2 production observed following DTT supplementation may be associated with the maintenance of a more favorable reducing environment for H2-producing enzymes, thereby supporting sustained H2 evolution during prolonged incubation. Interestingly, excessive concentrations of both sodium dithionite and DTT reduced H2 production. This observation indicates that an optimal redox balance is required for efficient H2 evolution. Although reducing agents enhanced H2 production at moderate concentrations, further increases resulted in lower H2 yields. This finding suggests that excessively reducing conditions may disrupt cellular redox homeostasis and negatively affect metabolic processes involved in H2 production. Maintaining an appropriate redox balance is important for efficient electron transfer and energy metabolism associated with H2 evolution [17].
4.4. Enhancement of H2 Production by Combined Stimulants
The modified Gompertz model provided a good representation of the observed H2 accumulation profiles under all treatments (Figure 5). The estimated maximum H2 production potential (A) ranged from 3.271 mL·L−1 in the control to 9.132 mL·L−1 in the combined treatment, while the maximum production rate (Rm) ranged from 0.064 to 0.181 mL·L−1·h−1. Notably, the experimentally measured cumulative H2 production at 120 h corresponded to approximately 94.8–97.1% of the respective A values estimated by the model, indicating that H2 accumulation had approached its asymptotic production potential by the end of the incubation period. Consistently, approximately 90.0–93.2% of the estimated production potential had already been reached by 72 h, whereas only a relatively small increase in cumulative H2 production was observed thereafter. These results support the interpretation that H2 accumulation approached a plateau after approximately 72 h. The combined treatment exhibited the highest A and R2 values, which were approximately 2.8-fold higher than those of the control, indicating that the combined application of glucose, sodium dithionite, and DTT enhanced both the overall H2 production potential and the maximum production rate. The agreement between the experimentally measured accumulation profiles and the model-derived parameters further supports the effectiveness of the combined treatment in enhancing H2 production.
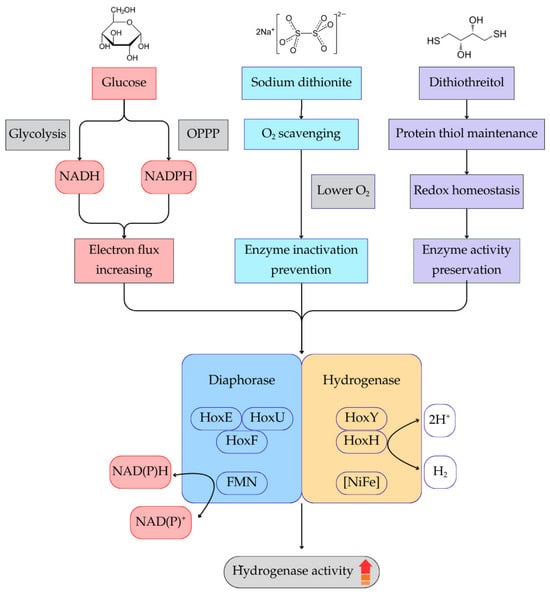
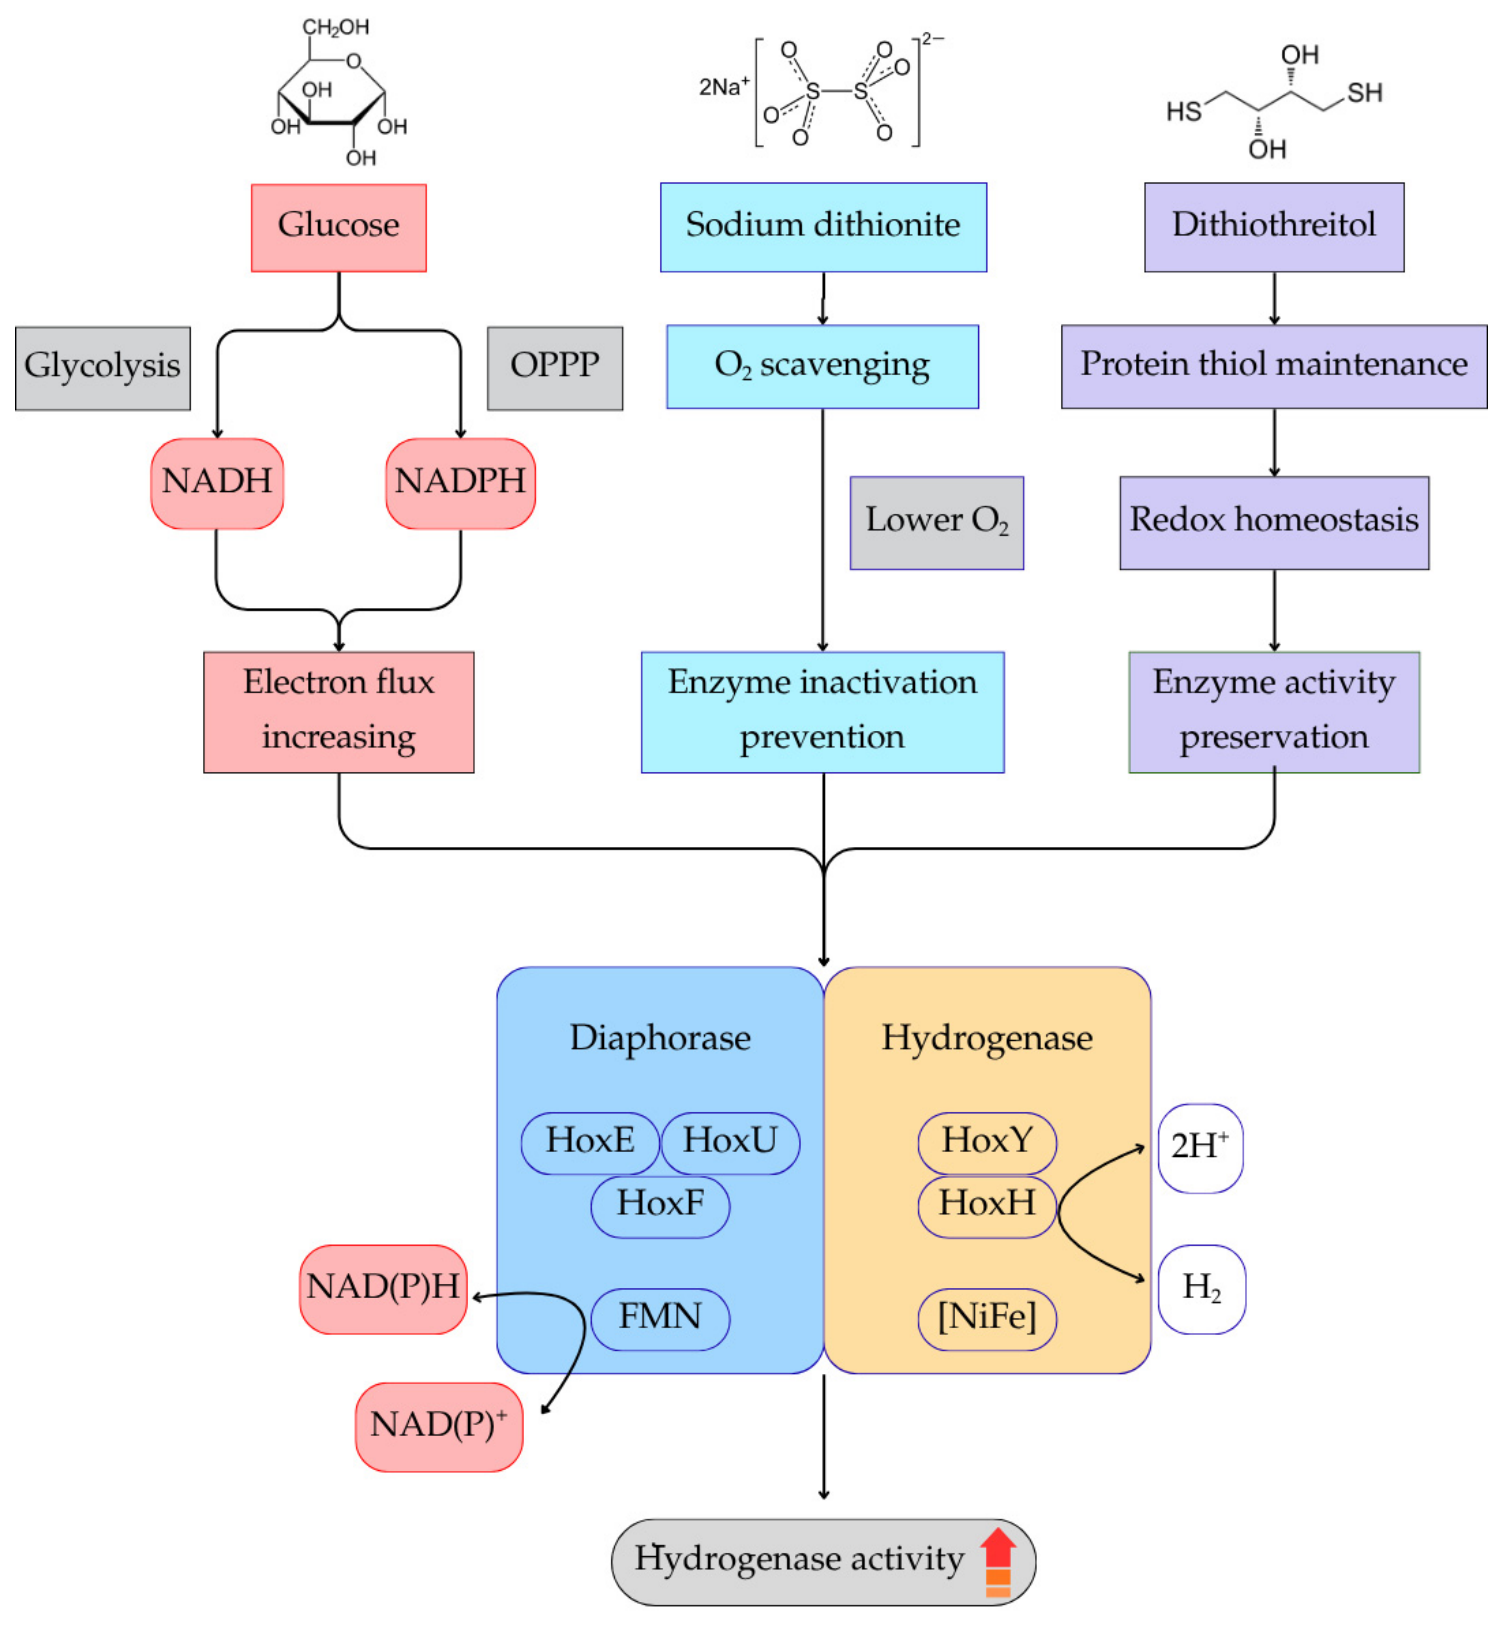
The most significant finding of this study was the enhancement of H2 production achieved through the combined application of glucose, sodium dithionite, and DTT. The combined treatment produced a cumulative H2 yield of 8.445 ± 0.750 mL·L−1 (Table 2), which was approximately 178% greater than that of the untreated control and substantially higher than any individual stimulant treatment. This result indicates that the three stimulants targeted complementary physiological processes that collectively enhanced H2 production. The enhancement observed under combined supplementation suggests that glucose, sodium dithionite, and DTT target complementary physiological processes. A hypothetical metabolic model explaining these interactions for enhanced H2 production in A. halophytica under nitrogen-deprived dark anaerobic conditions is presented in Figure 6. Under nitrogen starvation, cellular metabolism may shift from growth-associated processes toward glycogen degradation, glycolysis, and fermentative metabolism, potentially increasing the generation of NADH and other reduced electron carriers. Supplementation with glucose may further increase carbon availability and glycolytic activity, potentially increasing the supply of reducing equivalents available for hydrogen-producing pathways [11]. The degradation of intracellular carbon reserves together with exogenous glucose metabolism may increase the generation of reducing equivalents through glycolysis and associated fermentative pathways, thereby supporting H2 production under nitrogen-deprived conditions [13]. Exogenous glucose may stimulate not only glycolytic metabolism but also the oxidative pentose phosphate pathway, thereby increasing NADPH generation available for hydrogen-producing reactions [13]. Collectively, these metabolic processes are proposed to increase intracellular electron flux toward the bidirectional [NiFe]-hydrogenase, which could increase proton reduction and H2 evolution. Simultaneously, sodium dithionite scavenges dissolved O2 and promotes anaerobic conditions favorable for hydrogenase activity [15,16]. The resulting reduction in intracellular O2 may minimize oxygen-mediated inactivation of hydrogenase and facilitate continuous electron transfer to the catalytic site. DTT contributes to the maintenance of cellular redox homeostasis by preserving protein thiol groups in a reduced state [25]. Maintenance of intracellular redox homeostasis may also preserve the activity of redox-sensitive proteins involved in hydrogenase-mediated electron transfer. The bidirectional [NiFe]-hydrogenase of A. halophytica consists of a diaphorase module (HoxEFU), which accepts electrons from NAD(P)H, and a hydrogenase module (HoxHY), where electrons are utilized for proton reduction to produce H2. Therefore, reducing equivalent availability while simultaneously minimizing oxygen-mediated inhibition and maintaining intracellular redox balance is expected to enhance hydrogenase activity. This proposed hypothetical mechanism is consistent with the present results, in which the combined treatment exhibited the highest hydrogenase activity together with the greatest H2 production and the lowest O2 accumulation (Table 2).
Figure 6.
Proposed hypothetical mechanism illustrating the effects of glucose, sodium dithionite, and DTT on H2 production in A. halophytica under nitrogen-deprived, dark and anaerobic conditions. Arrows indicate proposed relationships and potential metabolic or biochemical interactions leading to enhanced hydrogenase activity and H2 production.
A possible molecular basis for the enhanced H2 production may involve regulation of the bidirectional hydrogenase encoded by the hox operon. In Aphanothece halophytica, the hoxE-hoxF-hoxU-hoxY-hoxH genes are co-transcribed as a single operon, and nitrogen deprivation has been reported to increase hoxH transcript abundance concomitantly with enhanced H2 production and hydrogenase activity [27]. Recently, nitrogen and potassium deprivation in A. halophytica were associated with increased hydrogenase activity and H2 production, which was attributed, at least in part, to reduced O2 availability under dark conditions [20]. Similar responses have been reported in other cyanobacteria. For example, low-O2 conditions strongly induced hox transcription in Anabaena, while darkness further enhanced hox transcript accumulation under anaerobic conditions [28]. Likewise, the hox operon in Synechocystis sp. PCC 6803 was upregulated under low-O2 conditions [29]. The sensitivity of hydrogenase to O2 is an important factor determining its activity under H2-producing conditions. Therefore, a decrease in local O2 availability may reduce oxidative inhibition of the enzyme and help preserve its catalytically active state. In the present study, the use of sodium dithionite and DTT may have contributed to the maintenance of a more reducing environment, thereby creating conditions favorable for hydrogenase activity. Glucose may have further supported this process by providing an additional carbon and energy source and promoting the generation of reducing equivalents through cellular metabolism. Thus, the enhanced H2 production observed following combined treatment with glucose and reducing agents may reflect complementary effects involving increased availability of metabolic reducing equivalents and maintenance of a reducing environment favorable for hydrogenase activity. However, the present study did not directly determine hox transcription, intracellular O2 concentration, or the redox state of hydrogenase. Therefore, it cannot be concluded that glucose, sodium dithionite, or DTT directly induced hox expression or directly protected hydrogenase at the molecular level. Rather, the observed enhancement is consistent with an indirect mechanism in which nitrogen deprivation and dark anaerobic conditions establish a low-O2 environment, while the exogenous reducing agents further promote reducing conditions that may help preserve hydrogenase activity. Future studies combining hox gene-expression analysis, intracellular redox measurements, and direct assessment of hydrogenase protein or enzyme activity would be required to confirm this proposed mechanism.
To facilitate comparison with previous studies, the H2 production rate and cumulative H2 yield obtained in the present study were additionally expressed on a biomass-normalized basis (µmol H2 g−1 dry weight h−1 and µmol H2 g−1 dry weight, respectively; Table 3). The volumetric H2 production data were converted to µmol H2 based on the molar volume of H2 under the corresponding experimental conditions and normalized to the dry biomass concentration. The H2 production performance achieved in the present study was compared with previously reported enhancement strategies for A. halophytica (Table 3). The combined supplementation of glucose, sodium dithionite, and DTT resulted in a maximum H2 production rate of 327.76 ± 15.61 µmol H2 g−1 dry wt h−1, which was approximately 2.4 to 8.3-fold higher than most previously reported strategies, including optimized seawater cultivation, photosystem II inhibition, combined nitrogen and potassium deprivation, cell immobilization, and bacterial co-cultivation [14,20,30]. Furthermore, the cumulative H2 yield reached 4707.37 ± 418.06 µmol H2 g−1 dry wt, representing the highest value among the conditions summarized in Table 3. The comparatively high H2 production may be attributed to the integrated metabolic–redox strategy employed in this study. Unlike previous approaches that primarily targeted individual physiological or environmental constraints, the combined treatment simultaneously enhanced reducing-equivalent availability, reduced O2 accumulation, and maintained a favorable redox environment for hydrogenase-mediated H2 production. Although direct comparisons among studies should be interpreted cautiously because of differences in experimental conditions, these findings demonstrate the potential of integrated metabolic and redox regulation as an effective strategy for enhancing dark fermentative H2 production in A. halophytica.
Table 3.
Comparison of maximum H2 production rates and cumulative H2 yields of Aphanothece halophytica under different H2-enhancement strategies (NA = Not Available).
Although this strategy substantially enhanced H2 production under the tested laboratory conditions, its practical and sustainability implications require careful consideration. Sodium dithionite and DTT are exogenous reducing agents, and their costs, stability under cultivation conditions, and potential environmental impacts were not evaluated in the present study. Glucose may represent a comparatively simpler alternative because it enhanced H2 production without requiring an exogenous reducing agent; nevertheless, its economic and environmental advantages cannot be established from the present data. Furthermore, the feasibility of applying these compounds at larger scales, including their required dosages and potential effects on downstream processing, remains uncertain. Therefore, the present findings should be regarded as a laboratory-scale proof of concept rather than evidence of an immediately practical or sustainable H2 production strategy. Further techno-economic and environmental assessments, together with scale-up studies and optimization of stimulant consumption, are needed to determine the commercial viability and sustainability of this approach.
5. Conclusions
Supplementing nitrogen-deprived, dark anaerobic cultures of the halotolerant cyanobacterium A. halophytica with selected reductants markedly enhanced H2 production. Among five compound classes tested, only glucose, sodium dithionite, and DTT increased H2 yields; phytohormones, vitamins, and minerals were ineffective. Optimal concentrations (10 mM glucose, 1 mM sodium dithionite, 5 mM DTT) maximized performance, and their combined application yielded a 178% increase in cumulative H2 and the highest production rate relative to the untreated control. Enhancement coincided with reduced O2 accumulation, consistent with improved operation of hydrogen-evolving enzymes. The synergy likely reflects concurrent optimization of electron supply (glucose), O2 scavenging (dithionite), and intracellular redox balance (DTT). These results establish a simple, effective strategy to boost biohydrogen output and underscore the promise of halotolerant cyanobacteria as sustainable platforms for renewable H2 production.
Supplementary Materials
The following supporting information can be downloaded at: https://www.mdpi.com/article/10.3390/gases6030041/s1, Table S1: Analysis of variance of H2 and O2 production under different chemical supplement treatments presented in Table 1; Table S2: Statistical analysis of H2 and O2 production rates presented in Figure 1; Table S3: Statistical analysis of H2 and O2 production rates presented in Figure 2; Table S4: Statistical analysis of H2 and O2 production rates presented in Figure 3; Table S5; Statistical analysis of H2 production rates presented in Figure 4; Table S6: Statistical analysis of H2 and O2 production, cumulative gas yields, and hydrogenase activity under different conditions presented in Table 2.
Author Contributions
Conceptualization, S.P.; methodology, N.C. (Nattanon Chinchusak), N.P., N.C. (Nanthakan Chotiwan), S.A. and S.P.; validation, N.C. (Nattanon Chinchusak) and S.P.; formal analysis, N.C. (Nattanon Chinchusak); investigation, N.P., N.C. (Nanthakan Chotiwan) and S.A.; resources, S.P. and A.I.; data curation, N.C. (Nattanon Chinchusak); writing—original draft preparation, N.C. (Nattanon Chinchusak), N.P., N.C. (Nanthakan Chotiwan) and S.A.; writing—review and editing, N.C. (Nattanon Chinchusak), A.I. and S.P.; visualization, N.C. (Nattanon Chinchusak); supervision, S.P.; project administration, S.P.; funding acquisition, S.P. All authors have read and agreed to the published version of the manuscript.
Funding
This research was funded by King Mongkut’s Institute of Technology Ladkrabang, grant number RE-KRIS/FF67/034, which has been funded by the NSRF.
Data Availability Statement
The data presented in this study are available from the corresponding author upon reasonable request.
Acknowledgments
The authors acknowledge the Department of Biology, School of Science, King Mongkut’s Institute of Technology Ladkrabang for providing laboratory facilities and technical support. The authors gratefully acknowledge Arthittaya Suyalan, Pimpisa Elakanonda, Jariya Sanonok and Chutikarn Somsin for their valuable technical assistance and support with the laboratory experiments. The authors also acknowledge the limited use of Canva AI for image enhancement and editing in the preparation of the graphical abstract. The authors reviewed and approved the final graphical abstract and take full responsibility for its content and accuracy.
Conflicts of Interest
The authors declare no competing interests.
Abbreviations
The following abbreviations are used in this manuscript:
| DTT | Dithiothreitol |
| NADH | Nicotinamide adenine dinucleotide |
| NAD(P)H | Nicotinamide adenine dinucleotide phosphate |
| OPP | Oxidative pentose phosphate pathway |
References
- Wang, J.; Azam, W. Natural resource scarcity, fossil fuel energy consumption, and total greenhouse gas emissions in top emitting countries. Geosci. Front. 2024, 15, 101757. [Google Scholar] [CrossRef] [Scilit]
- McCay, M.H.; Shafiee, S. Hydrogen. In Future Energy; Elsevier: Amsterdam, The Netherlands, 2020; pp. 475–493. [Google Scholar] [CrossRef] [Scilit]
- Richards, M.; Shenoy, A. H2-Mhr Pre-Conceptual Design Summary for Hydrogen Production. Nucl. Eng. Technol. 2007, 39, 1–8. [Google Scholar] [CrossRef] [Scilit]
- Martino, M.; Ruocco, C.; Meloni, E.; Pullumbi, P.; Palma, V. Main Hydrogen Production Processes: An Overview. Catalysts 2021, 11, 547. [Google Scholar] [CrossRef] [Scilit]
- Kumar, R.; Kumar, A.; Pal, A. An overview of conventional and non-conventional hydrogen production methods. Mater. Today Proc. 2021, 46, 5353–5359. [Google Scholar] [CrossRef] [Scilit]
- Redding, K.E.; Appel, J.; Boehm, M.; Schuhmann, W.; Nowaczyk, M.M.; Yacoby, I.; Gutekunst, K. Advances and challenges in photosynthetic hydrogen production. Trends Biotechnol. 2022, 40, 1313–1325. [Google Scholar] [CrossRef] [Scilit] [PubMed]
- Wang, Y.; Yang, H.; Zhang, X.; Han, F.; Tu, W.; Yang, W. Microalgal Hydrogen Production. Small Methods 2020, 4, 1900514. [Google Scholar] [CrossRef] [Scilit]
- Bozieva, A.M.; Khasimov, M.K.; Rao, M.S.; Sinetova, M.A.; Voloshin, R.A.; Dunikov, D.O.; Tsygankov, A.A.; Leong, Y.K.; Chang, J.-S.; Allakhverdiev, S.I.; et al. Optimizing cyanobacterial hydrogen production: Metabolic and genetic strategies with glycerol supplementation. Front. Energy Res. 2025, 13, 1547215. [Google Scholar] [CrossRef] [Scilit]
- Kato, Y.; Hidese, R.; Matsuda, M.; Ohbayashi, R.; Ashida, H.; Kondo, A.; Hasunuma, T. Glycogen deficiency enhances carbon partitioning into glutamate for an alternative extracellular metabolic sink in cyanobacteria. Commun. Biol. 2024, 7, 233. [Google Scholar] [CrossRef] [Scilit] [PubMed]
- Koksharova, O.A.; Butenko, I.O.; Pobeguts, O.V.; Safronova, N.A.; Govorun, V.M. Proteomic Insights into Starvation of Nitrogen-Replete Cells of Nostoc sp. PCC 7120 under β-N-Methylamino-L-Alanine (BMAA) Treatment. Toxins 2020, 12, 372. [Google Scholar] [CrossRef] [Scilit] [PubMed]
- Jaramillo, A.; Satta, A.; Pinto, F.; Faraloni, C.; Zittelli, G.C.; Silva Benavides, A.M.; Torzillo, G.; Schumann, C.; Méndez, J.F.; Berggren, G.; et al. Outlook on Synthetic Biology-Driven Hydrogen Production: Lessons from Algal Photosynthesis Applied to Cyanobacteria. Energy Fuels 2025, 39, 4987–5006. [Google Scholar] [CrossRef] [Scilit] [PubMed]
- Waditee-Sirisattha, R.; Kageyama, H. Halotolerance, stress mechanisms, and circadian clock of salt-tolerant cyanobacteria. Appl. Microbiol. Biotechnol. 2023, 107, 1129–1141. [Google Scholar] [CrossRef] [Scilit] [PubMed]
- Chinchusak, N.; Incharoensakdi, A.; Phunpruch, S. Enhancement of dark fermentative hydrogen production in nitrogen-deprived halotolerant unicellular cyanobacterium Aphanothece halophytica by treatment with reducing agents. Biomass Bioenergy 2022, 167, 106624. [Google Scholar] [CrossRef] [Scilit]
- Somsin, C.; Chinchusak, N.; Incharoensakdi, A.; Phunpruch, S. Enhanced Hydrogen Production by the Halotolerant Cyanobacterium Aphanothece halophytica Through Bacterial Co-Cultivation. Fermentation 2026, 12, 221. [Google Scholar] [CrossRef] [Scilit]
- Paramesh, K.; Chandrasekhar, T. Improvement of photobiological hydrogen production in Chlorococcum minutum using various oxygen scavengers. Int. J. Hydrogen Energy 2020, 45, 7641–7646. [Google Scholar] [CrossRef] [Scilit]
- Sudha, N.R.; Varaprasad, D.; Riazunnisa, K.; Chandrasekhar, T.; Prasanna, V.A.; Reddy, P.R. Effects of oxygen scavengers (Sodium sulfite, sodium bisulfite, sodium dithionite, and sodium metabisulfite) on growth and accumulation of biomass in the green alga Asterarcys quadricellulare. J. Appl. Biol. Biotechnol. 2022, 10, 136–140. [Google Scholar] [CrossRef] [Scilit]
- Cui, P.; Wang, D.; Wang, S.; Su, H.; Wang, Y. Regulatory mechanism of antioxidant enzymes on microbial metabolism and NADH in anaerobic fermentation of food waste for hydrogen production. J. Clean. Prod. 2024, 474, 143607. [Google Scholar] [CrossRef] [Scilit]
- Rippka, R.; Stanier, R.Y.; Deruelles, J.; Herdman, M.; Waterbury, J.B. Generic Assignments, Strain Histories and Properties of Pure Cultures of Cyanobacteria. Microbiology 1979, 111, 1–61. [Google Scholar] [CrossRef] [Scilit]
- Garlick, S.; Oren, A.; Padan, E. Occurrence of facultative anoxygenic photosynthesis among filamentous and unicellular cyanobacteria. J. Bacteriol. 1977, 129, 623–629. [Google Scholar] [CrossRef] [Scilit] [PubMed]
- Chinchusak, N.; Incharoensakdi, A.; Phunpruch, S. Dark fermentative hydrogen production and transcriptional analysis of genes involved in the unicellular halotolerant cyanobacterium Aphanothece halophytica under nitrogen and potassium deprivation. Front. Bioeng. Biotechnol. 2023, 10, 1028151. [Google Scholar] [CrossRef] [Scilit] [PubMed]
- Martínez, V.L.; Salierno, G.L.; García, R.E.; Lavorante, M.J.; Galvagno, M.A.; Cassanello, M.C. Biological hydrogen production by dark fermentation in a stirred tank reactor and its correlation with the pH time evolution. Catalysts 2022, 12, 1366. [Google Scholar] [CrossRef] [Scilit]
- Rai, S.; Sitther, V. Oxidative stress in cyanobacteria: Sources, mitigation, and defense. In Expanding Horizon of Cyanobacterial Biology; Academic Press: Amsterdam, The Netherlands, 2022; pp. 163–178. [Google Scholar] [CrossRef] [Scilit]
- Zhou, J.-L.; Gao, F. Phytohormones: Novel strategy for removing emerging contaminants and recovering resources. Trends Biotechnol. 2023, 41, 992–995. [Google Scholar] [CrossRef] [Scilit] [PubMed]
- Fang, Y.; Lin, G.; Liu, Y.; Zhang, J. Contaminant removal performance and lipid productivity of a cyanobacteria-bacteria consortium containing exogenous phytohormones during the treatment of antibiotic-polluted wastewater. Chemosphere 2024, 361, 142473. [Google Scholar] [CrossRef] [Scilit] [PubMed]
- Mthembu, S.N.; Sharma, A.; Albericio, F.; de la Torre, B.G. Breaking a Couple: Disulfide Reducing Agents. ChemBioChem 2020, 21, 1947–1954. [Google Scholar] [CrossRef] [Scilit] [PubMed]
- Britt, R.D.; Rao, G.; Tao, L. Bioassembly of complex iron–sulfur enzymes: Hydrogenases and nitrogenases. Nat. Rev. Chem. 2020, 4, 542–549. [Google Scholar] [CrossRef] [Scilit]
- Phunpruch, S.; Taikhao, S.; Incharoensakdi, A. Identification of bidirectional hydrogenase genes and their co-transcription in unicellular halotolerant cyanobacterium Aphanothece halophytica. J. Appl. Phycol. 2016, 28, 967–978. [Google Scholar] [CrossRef] [Scilit]
- Kiss, É.; Mituletu, M.; Vass, I. Transcriptional regulation of the bidirectional hydrogenase by oxygen and light in two Anabaena species. N. Z. J. Bot. 2014, 52, 28–35. [Google Scholar] [CrossRef] [Scilit]
- Summerfield, T.C.; Nagarajan, S.; Sherman, L.A. Gene expression under low-oxygen conditions in the cyanobacterium Synechocystis sp. PCC 6803 demonstrates Hik31-dependent and-independent responses. Microbiology 2011, 157, 301–312. [Google Scholar] [CrossRef] [Scilit] [PubMed]
- Pansook, S.; Incharoensakdi, A.; Phunpruch, S. Simazine enhances dark fermentative H2 production by unicellular halotolerant cyanobacterium Aphanothece halophytica. Front. Bioeng. Biotechnol. 2022, 10, 904101. [Google Scholar] [CrossRef] [Scilit] [PubMed]

Disclaimer/Publisher’s Note: The statements, opinions and data contained in all publications are solely those of the individual author(s) and contributor(s) and not of MDPI and/or the editor(s). MDPI and/or the editor(s) disclaim responsibility for any injury to people or property resulting from any ideas, methods, instructions or products referred to in the content. |
© 2026 by the authors. Licensee MDPI, Basel, Switzerland. This article is an open access article distributed under the terms and conditions of the Creative Commons Attribution (CC BY) license.