


Abstract
Renewable hydrogen storage can absorb surplus wind and solar generation, reduce curtailment, and provide a flexible energy carrier. Its value depends not only on the electrolyzer, storage tank, and fuel cell, but also on the operational strategy used to coordinate these components. This study develops a sensor-informed model predictive control (MPC) framework for renewable hydrogen storage and evaluates its performance against a no-hydrogen configuration and a reactive hydrogen storage controller under identical operating conditions, component parameters, and evaluation metrics. The MPC uses receding horizon optimization with measured hydrogen storage and safety states, together with short-term forecasts of renewable generation, load, electricity price, and hydrogen service demand. Using synthetic but physically motivated time-series profiles, the results show that hydrogen hardware under reactive rule-based operation eliminates renewable curtailment and reduces operating cost; however, it frequently depletes the tank to the reserve boundary and fails to reliably meet subsequent hydrogen demand. In contrast, the sensor-informed MPC achieves full hydrogen accessibility, eliminates curtailment, reduces total operating cost to 71.2% of the no-hydrogen baseline, and lowers cost by 46.3% relative to the rule-based controller. The MPC imports more grid electricity than the rule-based case, showing a clear trade-off between hydrogen service reliability and grid dependence. These results indicate that reliable renewable-hydrogen operation depends not only on storage hardware, but also on predictive supervisory control that coordinates renewable use, hydrogen service, reserve security, and grid interaction.
1. Introduction
Renewable hydrogen is a practical response to the timing mismatch in low-carbon energy systems. Wind and photovoltaic generation can produce electricity when local load is low, while fuel, or backup energy may be required at later hours [1,2]. An electrolyzer can convert part of the renewable surplus into hydrogen, a tank can store it, and the stored inventory can later be delivered to an external hydrogen user or reconverted to electricity through a fuel cell. This architecture links short-term renewable variability with chemical storage and with energy services that are difficult to electrify directly [3,4,5,6,7,8].
The operation of such a system is nevertheless not a simple dispatch problem [9]. The supervisory controller must coordinate two coupled domains [10]. In the electrical domain, renewable generation, local load, grid import, grid export, curtailment, electrolyzer consumption, and fuel cell output must balance at each time step [11]. In the hydrogen domain, the same controller must preserve storage inventory, supply hydrogen demand, avoid excessive reconversion losses, respect pressure and temperature limits, and respond to leak or starvation alarms [12,13,14]. A decision that is attractive in one domain can be undesirable in the other [15]. For example, fuel cell operation may reduce grid import during an electrical deficit, but it may also empty the tank before a later refueling or industrial hydrogen demand [16]. Similarly, aggressive electrolysis can reduce curtailment during the present hour, but it may fill the tank before a larger surplus arrives or may operate when grid electricity has a high carbon or economic cost [17].
The central methodological problem is that many renewable-hydrogen studies formulate the plant as a complete energy management problem and then compare the proposed method with a baseline that may differ in configuration, modeling scope, or control assumptions [18,19,20,21,22]. A proposed controller may be evaluated with a different storage capacity, electrolyzer rating, tariff, demand profile, or input data structure [23,24]. Under such comparisons, one cannot easily identify whether the reported improvement comes from the hydrogen hardware, component sizing, forecast information, price assumptions, or the control law itself [25,26]. This issue is especially important for MPC because forecast information, constraints, and the selected plant boundary are part of the receding horizon formulation itself [27].
Recent studies have applied conventional, economic, hierarchical, and distributed MPC to renewable–hydrogen microgrids, hydrogen refueling systems, and hybrid energy storage systems [16,19,20,21]. These studies establish receding horizon optimization as an effective method for coordinating electrolyzers, hydrogen storage, fuel cells, and grid exchange [27]. Nevertheless, differences in plant configuration, component parameters, control objectives, and benchmark design make the reported benefits difficult to compare directly. In particular, improvements resulting from hydrogen system integration are not always clearly separated from those resulting from predictive control.
The present work addresses this limitation without proposing a new class of MPC. The controller retains the conventional state feedback and receding horizon structure, with measured hydrogen inventory serving as the principal dynamic feedback state. The term sensor-informed refers to the inclusion of pressure, temperature, hydrogen flow, leakage, and starvation information in defining equipment availability factors and safety constraints. Hydrogen storage and leakage risks are discussed in [12,13,14], while recent sensor-based leakage detection and hydrogen-monitoring approaches are reported in [28,29]. Thus, the distinction from conventional state feedback MPC lies not in the feedback principle or optimization procedure, but in the supervisory integration of operational and safety information and the explicit treatment of hydrogen service and reserve preservation requirements.
To evaluate the resulting framework, three operating configurations are implemented within a common physical model and performance evaluation structure: a no-hydrogen baseline, a hydrogen storage system operated by a reactive rule-based controller, and the same hydrogen storage system operated by the sensor-informed MPC controller. All configurations use identical renewable generation, electrical load, electricity price, export limit, time-step, and performance metric assumptions. The two hydrogen-enabled configurations additionally share the same electrolyzer and fuel cell ratings, storage capacity, efficiencies, initial inventory, reserve requirement, and safety limits. This nested comparison first quantifies the operational effect of introducing hydrogen storage and then identifies the additional effect of predictive supervision under unchanged physical conditions. Accordingly, the research question is how system performance changes as operation progresses from no hydrogen storage to reactive hydrogen storage and finally to sensor-informed predictive hydrogen storage.
This work makes five contributions. First, it establishes a common reduced-order plant model and performance evaluation framework for no-hydrogen, reactive hydrogen storage, and predictive hydrogen storage operation. Second, it introduces a nested comparison that separates the operational benefit of hydrogen system integration from the additional benefit of predictive control. Third, it clarifies the hydrogen inventory balance by separating served hydrogen demand from unmet demand, thereby avoiding sign ambiguity and making reserve preservation explicit. Fourth, it defines the information boundary of each configuration: no hydrogen storage operation in the baseline, present-time measurements in the reactive case, and measured states, sensor-derived equipment availability, and short-term forecasts in the MPC case. Fifth, it evaluates the configurations using cost, curtailment, grid import, emissions, renewable utilization, green electrolysis fraction, hydrogen accessibility, reserve security, welfare, and safety violations. This multi-metric assessment reveals the trade-offs among renewable energy utilization, grid dependence, hydrogen service reliability, storage preservation, and safe operation.
2. Methods
This section presents the materials and methods used in the study. Section 2.1 describes the renewable–hydrogen plant architecture and the main modeling assumptions. Section 2.2 introduces the first operating case, which represents the no-hydrogen baseline. Section 2.3 presents the second case, where the hydrogen storage system is operated using a rule-based controller. Section 2.4 formulates the sensor-informed MPC strategy. Section 2.5 defines the performance indicators used to compare the operating cases. Finally, Section 2.6 describes the input data, parameter selection, and implementation procedure.
2.1. Plant Architecture
The plant is a grid-connected renewable hydrogen energy system operated at a supervisory time scale. Time is discrete, with index and step length . The exogenous input at each step includes renewable generation, local electrical load, import and export price, and external hydrogen demand. Hydrogen demand is written in energy-equivalent power units to keep the inventory balance linear. In addition, the controllable variables include electrolyzer power, fuel cell electrical output, grid import, grid export, renewable curtailment, and served hydrogen demand.
The Nomenclature section groups the symbols according to their roles in the model, including indices and horizons, electrical and hydrogen variables, safety and availability quantities, economic and MPC parameters, benchmark profile parameters, performance indicators, and welfare measures. Here, the unmet demand is not an independent physical flow; it is defined by
When a normalized state of charge is needed, it is obtained as
where is the usable tank capacity. Writing the state equation in terms of usable hydrogen inventory rather than its state of charge is important because the no-hydrogen baseline can then be represented without an artificial division by zero. In the no-hydrogen boundary, the storage capacity and inventory are simply fixed at zero.
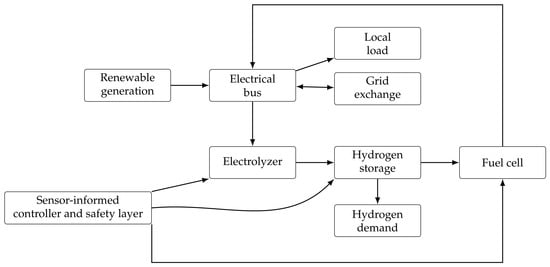
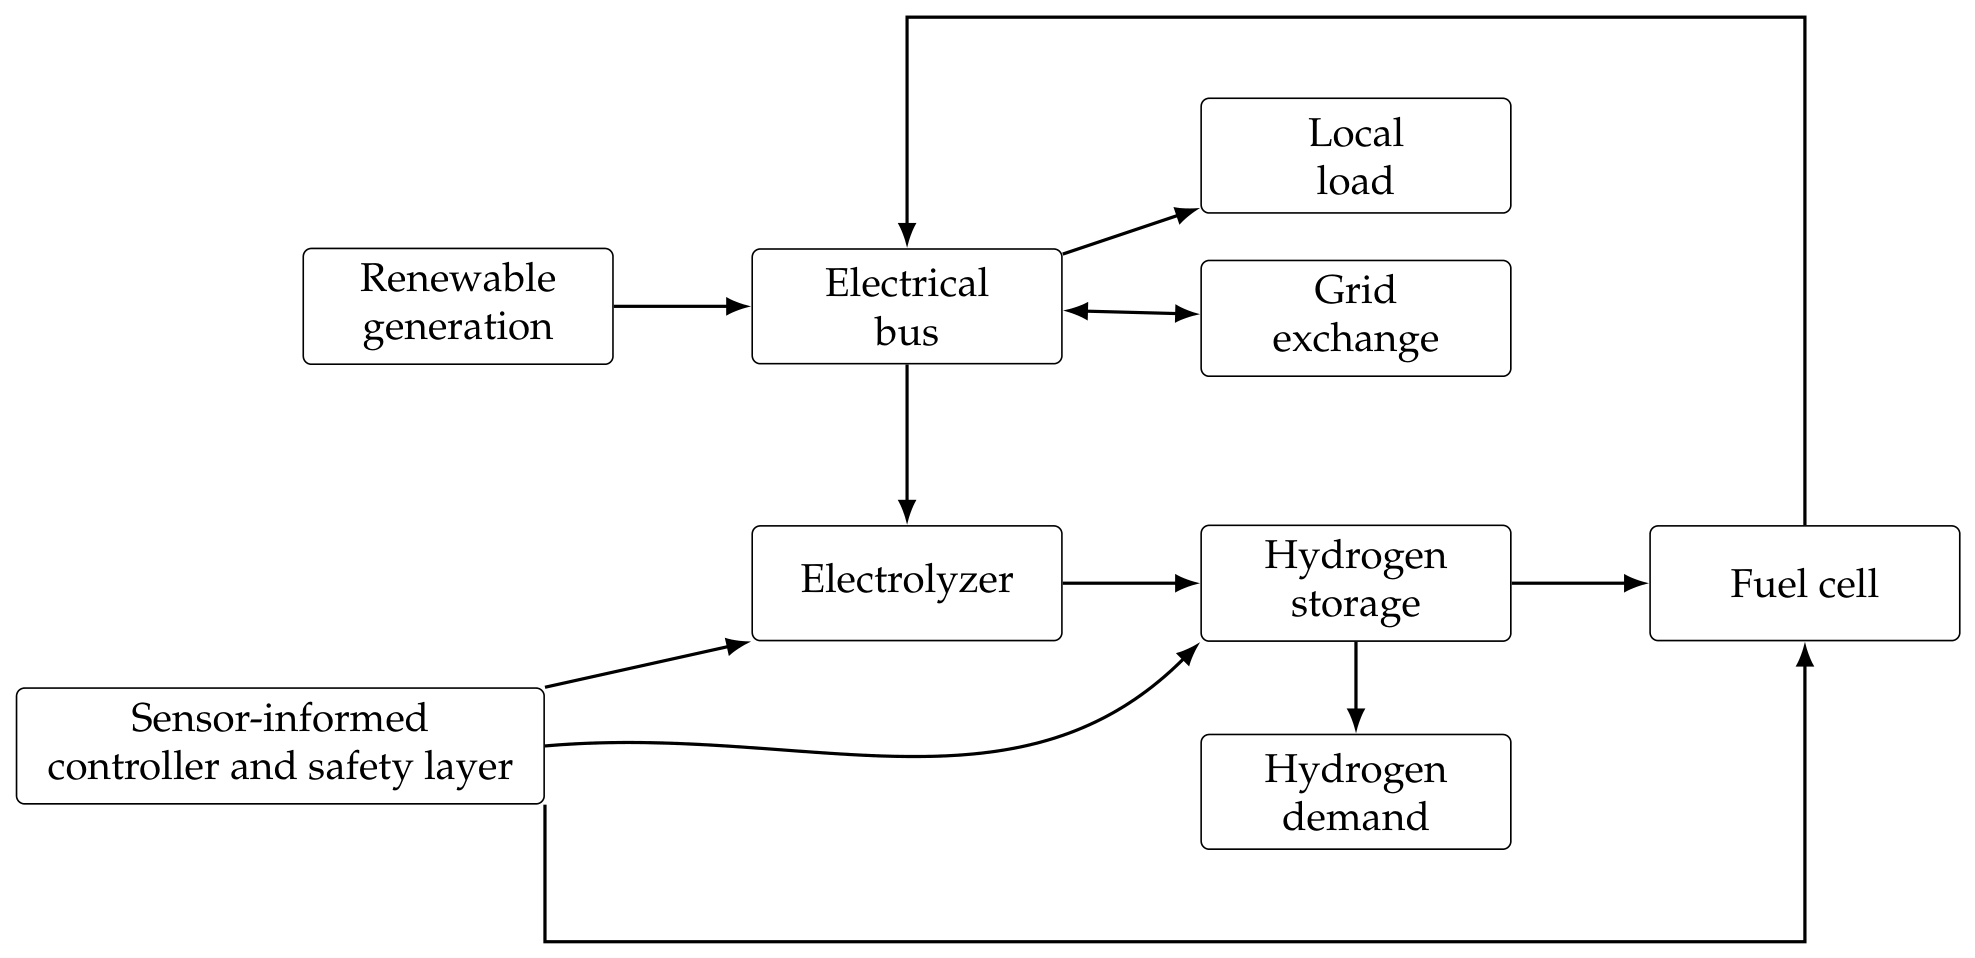
Figure 1 summarizes the plant architecture. Renewable generation supplies the electrical bus. The bus exchanges energy with the grid, supplies the local load, and can feed the electrolyzer. Stored hydrogen can be supplied to the hydrogen demand or used by the fuel cell. The sensor-informed layer observes storage and safety states before the command is applied. Pressure, temperature, leakage, starvation, and inventory measurements are processed by a safety layer before controller commands are applied.
Figure 1.
Supervisory architecture of a hydrogen-enabled renewable energy system integrating grid interaction, hydrogen storage, fuel cell conversion, and sensor-informed control.
In this architecture, we consider three different intervention scenarios. First, we consider the no hydrogen baseline, where renewable generation supplies the local electrical load first, while any deficit is imported from the grid and any surplus is exported or curtailed. During this process, the electrolyzer, hydrogen storage, fuel cell, hydrogen demand pathway, and controller remain inactive. Second, we consider hydrogen storage under reactive rule-based control, where renewable surplus powers the electrolyzer to produce and store hydrogen to meet the demand, and any remaining hydrogen above the required reserve be supplied to the fuel cell to reduce the current electrical deficit. These decisions depend only on present renewable surplus and current storage level. Third, we consider a hydrogen storage framework under sensor-informed MPC, where measured storage conditions and forecasts of renewable generation, load, electricity prices, and hydrogen demand are used to optimally schedule hydrogen production, storage, delivery, fuel cell operation, and grid exchange while maintaining reserves for future demand.
The supervisory controller seeks an operating trajectory that minimizes the overall operating cost while maintaining hydrogen service and preserving future inventory. The operating objective is formulated as follows:
where the first term represents the cost of grid electricity purchases, the second term represents export revenue, the third term penalizes renewable energy curtailment via the positive weighting coefficient , and the fourth term penalizes unmet hydrogen demand via the positive weighting coefficient . The terminal term assigns an economic value to the remaining hydrogen inventory at the end of the planning horizon, encouraging the controller to retain sufficient reserves for future operation rather than depleting the storage solely for short-term gains. Consequently, the objective balances economic performance, renewable energy utilization, hydrogen service reliability, and storage security within a unified supervisory framework. The objective function (3) defines the economic objective used directly by the MPC controller, while the no-hydrogen and rule-based scenarios do not solve this optimization problem but are evaluated using the same performance indicators for comparison.
In this setting, the electrical balance is given as follows:
On the other hand, the hydrogen inventory balance is provided as follows:
Electrolysis increases inventory, fuel cell production withdraws hydrogen according to conversion efficiency, and served external demand is a direct inventory withdrawal. Unmet demand is not added to the tank; it is determined from (1). The device, grid, and service limits are given as
The storage limits are
The measured safety condition is represented by
where and represent pressure and temperature limits respectively. Measured safety conditions for electrolyzer power and fuel cell are mapped to actuator availability flags as
respectively. The flags are parameters supplied by the safety supervisor, not optimization decisions. Unsafe commands are blocked before economic or service scheduling is applied.
2.2. No-Hydrogen Baseline Model
This section presents the first scenario, namely the no-hydrogen baseline model. In this framework, the renewable energy system operates without hydrogen production, storage, or fuel cell utilization. Excess renewable electricity can only be exported to the grid up to the export limit, while any remaining surplus is curtailed. Similarly, electricity deficits are satisfied entirely through grid imports. Consequently, hydrogen demand cannot be served and is treated as unmet demand throughout the simulation. More precisely, the no-hydrogen baseline is obtained by disabling the hydrogen pathway with the following boundary condition:
Equation (1) then gives . Thus, the no-hydrogen plant is not allowed to serve external hydrogen demand, which makes the electrical balance reduce to
When , , and curtailment is penalized or neutral, the baseline dispatch has a direct algebraic form. Namely, renewable power first serves the local load, and the deficit is imported if . If a surplus exists, export is used up to and the remaining surplus is curtailed. Based on these perspectives, we arrange power import, export and curtailment as follows:
respectively. The baseline is therefore to quantify what is lost when the plant has no chemical storage or hydrogen service pathway.
2.3. Reactive Rule-Based Hydrogen Storage
This part presents the second scenario of the hydrogen storage technique, in which the complete hydrogen conversion and storage pathway is incorporated into the energy system. The rule-based benchmark enables the hydrogen hardware, while the controller is implemented as a causal present-time policy. Accordingly, the electrolyzer, hydrogen storage tank, external hydrogen demand connection, and fuel cell are available for operation, whereas the control decisions are determined exclusively from measurements available at the current time step.
The purpose of this scenario is to evaluate the operational benefit of combining hydrogen storage with a simple, transparent, and reproducible supervisory control strategy. At each sampling interval, the controller observes the instantaneous renewable generation, local electrical load, external hydrogen demand, hydrogen inventory, and measured safety conditions. Based on these present-time quantities, it determines whether surplus renewable electricity should be converted into hydrogen, whether the external hydrogen demand can be supplied, and whether the remaining stored hydrogen can be reconverted into electricity through the fuel cell.
The information available to the rule-based controller at time step k is represented by
No forecasts of renewable generation, electrical load, electricity price, or future hydrogen demand are used. Therefore, the controller reacts only to the current operating condition and does not anticipate future system requirements. The instantaneous renewable power surplus is defined as
Here, a positive value of the surplus indicates that renewable generation exceeds the local electrical load, whereas a negative value indicates an electrical power deficit. During surplus hours, the rule sends as much surplus as possible to the electrolyzer while respecting rating, storage headroom, and safety availability:
Inequality (18) tells that the first term limits electrolysis to the instantaneous renewable surplus, the second enforces the electrolyzer rating and safety availability, and the third prevents the hydrogen inventory from exceeding its maximum allowable value.
To prevent the simultaneous allocation of the same stored hydrogen to external service and fuel cell generation, hydrogen service is assigned priority over fuel cell discharge. After the electrolyzer power has been determined, the provisional inventory available above the required reserve is calculated as
The external hydrogen service is then determined by
The inventory remaining above reserve after the served hydrogen demand is
Only this remaining inventory is available for electricity generation through the fuel cell. During electrical deficit periods, the fuel cell output is determined as
The fuel cell output is therefore limited by the instantaneous electrical deficit, the rated and safety-permitted fuel cell capacity, and the amount of hydrogen remaining above the reserve level. Equations (18)–(22) collectively define the deterministic control policy. In this scenario, the controller does not minimize the operating objective over a future prediction horizon. Instead, each control action is determined sequentially from the current measurements and the predefined operating priorities. Consequently, once the exogenous input profiles and initial hydrogen inventory are specified, the operating trajectory becomes deterministic and is obtained through forward simulation.
2.4. Sensor-Informed MPC Hydrogen Storage
The sensor-informed MPC framework uses the same electrolyzer, hydrogen storage tank, external hydrogen service connection, fuel cell, and safety supervision as the reactive rule-based scenario but replaces the causal present-time policy with forecast-based receding horizon optimization. At each sampling instant k, the measured hydrogen inventory initializes the predicted storage state according to
where the vertical bar denotes a predicted quantity within the optimization problem solved at time k. Thus, represents the hydrogen inventory predicted for time using the information available at time k. The forecast set is
In the nominal benchmark, no abnormal safety events are imposed; therefore, the safety information and the associated equipment availability parameters remain fixed throughout the simulation horizon. These parameters enter the electrolyzer and fuel cell operating bounds, while the measured hydrogen inventory and forecast set are refreshed at each sampling instant. The MPC determines the predicted control actions and hydrogen inventory states over the horizon as
Then, the MPC solves
subject to the predicted electrical power balance (4), the hydrogen inventory dynamics (5), and the hydrogen demand balance (1). Only hydrogen delivered to the external user is withdrawn from storage; unmet demand is instead recorded as a service failure and penalized in the objective. The electrolyzer and fuel cell powers satisfy the operating bounds in (6), while the predicted inventory remains within the storage limits in (7). These constraints prevent depletion below the reserve level and operation above the maximum usable inventory. At each sampling instant k, the MPC solves the finite-horizon optimization problem and obtains the optimal control sequence
This sequence minimizes the MPC objective over the prediction horizon subject to the current measured state, forecast data, and operating constraints. Only its first element, which is the optimal action for the current sampling interval, is applied:
At the next sampling instant, the predicted state is reinitialized using the latest measured hydrogen inventory, the forecasts are refreshed, and a new optimal finite-horizon sequence is computed. The safety availability parameters remain fixed throughout the nominal simulation. This repeated optimization defines the receding horizon implementation. Because the objective function, system dynamics, and operating constraints are linear, and the safety availability flags are treated as known parameters, each finite-horizon MPC problem is a linear program. The complete receding horizon procedure is summarized in Algorithm 1.
2.5. Performance Indicators
This section presents performance indicators to evaluate and compare the different control strategies given in this work. The indicators cover economic performance, hydrogen service delivery, reserve security, and environmental performance. All metrics are calculated from the simulated operation of each controller under the same operating scenario to ensure a fair comparison.
The first group of indicators characterizes economic operating performance. Grid-market interaction is quantified through total import cost and export revenue:
The direct electricity bill is then
Because the controller is also expected to limit renewable curtailment and hydrogen service shortfall, two soft penalty terms are included:
The resulting operating cost is defined as
This metric should be interpreted as a short-horizon operating-and-service cost. It is not a complete economic cost, since it excludes capital expenditure, fixed and variable maintenance, stack replacement, water supply, compression, land, taxes, financing, and hydrogen sales revenue. In addition, the no-hydrogen baseline is penalized for unmet hydrogen demand; therefore, its reported operating objective is not equivalent to its electricity bill.
| Algorithm 1 Sensor-informed MPC framework |
| Require: Horizon N, prediction horizon , initial inventory , forecasts, safety information, and plant parameters Ensure: Applied control sequence and inventory trajectory
|
The second group of indicators evaluates hydrogen service delivery. Total requested, served, and unmet hydrogen energy are calculated as
respectively. Hydrogen accessibility is then defined as
This indicator measures the fraction of requested hydrogen service that is actually delivered. A value of indicates complete fulfilment of the hydrogen demand profile, whereas lower values indicate partial service shortfall.
Reserve adequacy is assessed from the lowest hydrogen inventory reached during the simulation:
The reserve security indicator is defined as
where represents targeted hydrogen storage. The clipping operation restricts the score to the interval . Thus, trajectories that fall to the minimum reserve inventory receive zero reserve security credit, while trajectories whose minimum inventory remains at or above the target reserve receive full credit. Intermediate values indicate partial reserve security. The minimum hydrogen storage state of charge is also reported as
For the no-hydrogen baseline, the inventory trajectory is only a placeholder. Accordingly, the reserve security score is set to zero, and the minimum state of charge is treated as undefined.
The third group of indicators characterizes grid dependence, operational emissions, and renewable energy utilization. Total imported grid electricity is
and the associated operational emissions are
where is the grid emission factor in kgCO2/kWh. The reported quantity represents comparative grid-associated operational emissions only. It accounts for emissions associated with grid imports, assigns no emissions credit to exported electricity, and does not include embodied, construction, maintenance, replacement, or other life-cycle emissions. Therefore, it should not be interpreted as a complete carbon footprint. Time-varying grid carbon intensity is also not represented.
Renewable energy utilization is measured as the fraction of available renewable generation that is not curtailed:
where
is the complementary curtailed renewable fraction. Finally, the share of electrolyzer operation matched to instantaneous local renewable surplus is reported as
This quantity is a local surplus-matching proxy. It does not trace physical electricity flows, account for renewable energy certificates, or establish compliance with certificate-based or regulatory definitions of renewable hydrogen. If the electrolyzer does not operate, the indicator is undefined and is stored as unavailable.
To provide a unified comparison, an operational welfare score is constructed from the economic, environmental, and hydrogen service security indicators defined above. Let denote the set of compared control strategies, and let denote one strategy. Since the operating cost and emissions are lower-is-better indicators, we define the following scores:
The environmental score combines low-emission performance and renewable energy utilization:
The hydrogen service security score combines hydrogen accessibility and reserve security:
A larger weight is assigned to hydrogen accessibility because meeting hydrogen demand is the primary service requirement, while reserve security captures the additional value of maintaining inventory above the minimum reserve.
The operational welfare score is then defined as
The score ranges from 0 to 100, with larger values indicating better combined economic, environmental, and hydrogen service security performance. The green electrolysis fraction is retained as a separate diagnostic indicator because it is undefined when the electrolyzer does not operate and represents a local surplus-matching proxy rather than a complete environmental performance measure.
Together, these indicators provide the decision framework used to compare the controllers. The framework separates market cost, hydrogen service fulfilment, inventory reserve security, grid emission exposure, and renewable utilization performance, thereby avoiding reliance on a single aggregate metric.
2.6. Data Description and Implementation
This section describes the data and its implementation in numerical simulations. The experiment begins at midnight with a virtual renewable–hydrogen plant that has four days to prove how it should be operated. During each hour, the plant observes a local electrical demand, receives electricity from a solar–wind resource, faces an electricity purchase and export price, and is asked to deliver a prescribed amount of hydrogen. Hourly simulation is common in techno-economic studies of renewable and electrolytic hydrogen systems [5,24]. Hourly PV and wind time-series are also standard inputs to renewable-integration studies [1,2,30,31]. In the literature, synthetic time-series profiles are often used when measured site-specific data are unavailable or when the objective is to test control and optimization methods under repeatable benchmark conditions. Such profiles typically preserve important physical and operational features, including daily solar patterns, load peaks, wind variability, and random disturbances [32,33,34].
The model boundary includes renewable generation, local electrical load, grid import, grid export, renewable curtailment, an electrolyzer, usable hydrogen energy inventory, direct hydrogen service, and a fuel cell. The boundary excludes detailed pressure dynamics, compressor operation, water treatment, thermal states, gas purity, start-up and shutdown sequences, degradation, maintenance, capital recovery, and distribution of hydrogen outside the plant. Therefore, the study intends to provide a supervisory energy management comparison, not a detailed process-design.
The study horizon contains hourly intervals, corresponding to four consecutive days. The sampling period is The discrete-time index is . The hour of day and day index are calculated as
The story of each simulated day begins with sunrise. A dimensionless solar-shape function is defined by
This construction is reasonable, since is zero outside the nominal 06:00–18:00 solar window and reaches its maximum near noon (when ). Raising the positive part to the power narrows the curve and creates a more pronounced midday peak than a simple half-sine [30]. In addition, day-to-day cloud variability is represented by
The four values create, respectively, a nearly clear day, a cloudy day, a partly clear day, and a moderately cloudy day. PV power is then
The coefficient 135.00 is a scenario scaling value selected to create several midday periods in which renewable generation exceeds local load. It should not be interpreted as an optimized or measured array rating.
On the other hand, wind generation plays a different role in the story. Unlike the solar profile, it can contribute during the night and shoulder hours. It is represented by a mean component, two smooth oscillatory components, and Gaussian noise:
The first sinusoid produces a daily cycle, while the second produces a slower two-day modulation. The random term prevents the wind series from becoming an unrealistically smooth repetition. The final wind power is clipped to a physically nonnegative range as follows:
The use of multi-timescale variability reflects the fact that wind-power time series exhibit variability and ramping over time scales from minutes to days [31].
Hence, the available renewable power is the sum of PV and wind, which gives
The local electrical load is built as the sum of a base demand, a daily oscillation, an evening activity peak, a smaller morning bump, and Gaussian noise:
The load is clipped according to
The evening term deliberately reaches its strongest values after the solar profile begins to decline. This creates the classic operational conflict in which midday renewable energy can be exported, curtailed, or stored for later use. The morning term creates a smaller secondary load feature. The clipping limit is considered as a safeguard.
We consider the purchasing tariff as a three-period time-of-use structure and formulated as follows:
where is a purchase price multiplier equal to 1.0 in the base case. Across four days, the profile contains 36 off-peak hours, 36 daytime hours, and 24 evening peak hours. The average purchase price is $0.18375/kWh. During this period, the export price is set as constant as follows:
The export price is intentionally lower than every purchase price period, which removes the economic incentive for simultaneous import and export under normal cost-minimizing operation. Their structure is supported by the general purpose of time-varying tariffs [17].
Hydrogen demand is expressed in energy-equivalent units, per hour, rather than kilograms per hour. This keeps the storage and fuel cell equations linear. Every day contains a morning service window from 08:00 through 10:00 at and an evening service window from 17:00 through 20:00 at . On the third simulated day, the evening window is overwritten by a more severe stress event from 17:00 through 21:00 at . Therefore, we present a detailed four-day overview of hydrogen demand as follows:
with the third-day stress condition.
3. Results
This section presents the numerical simulations and comparative analysis of the three operating strategies considered in this study. The comparison is conducted using the same synthetic four-day benchmark data set for all cases, so that differences in performance arise from the control logic rather than from differences in external operating conditions. To ensure reproducibility, the random-number generator is initialized with a fixed seed equal to 7. Consequently, the same stochastic disturbance sequences are used in the wind and load profiles in every simulation. In the nominal benchmark case, the hydrogen demand multiplier and purchase price multiplier are both set equal to 1.0, while the export price is fixed at .
The numerical implementation also requires plant, storage, and controller parameters that are separate from the exogenous data profiles. These parameters define the physical operating limits of the renewable–hydrogen plant and the penalty weights used in the optimization problem. The electrolyzer and fuel cell are rated at and , respectively. The usable hydrogen energy inventory is limited to the range , with an initial value of . The electrolyzer stores per kilowatt-hour of electrical input, while the fuel cell produces of electricity per kilowatt-hour of hydrogen energy consumed. The MPC uses a 24-h prediction horizon and assigns penalties to curtailed renewable energy and unmet hydrogen demand, while also assigning a terminal value to stored hydrogen inventory. In addition, the grid emission factor is taken as . Together with the exogenous profile definitions in Section 2.6, these parameters fully specify the nominal benchmark and are held unchanged across the three operating configurations.
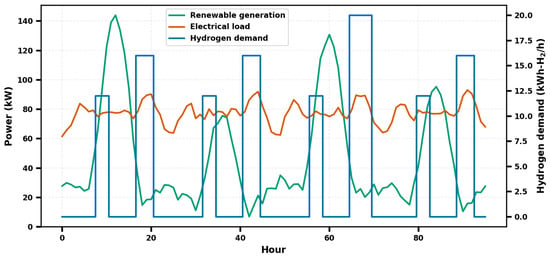
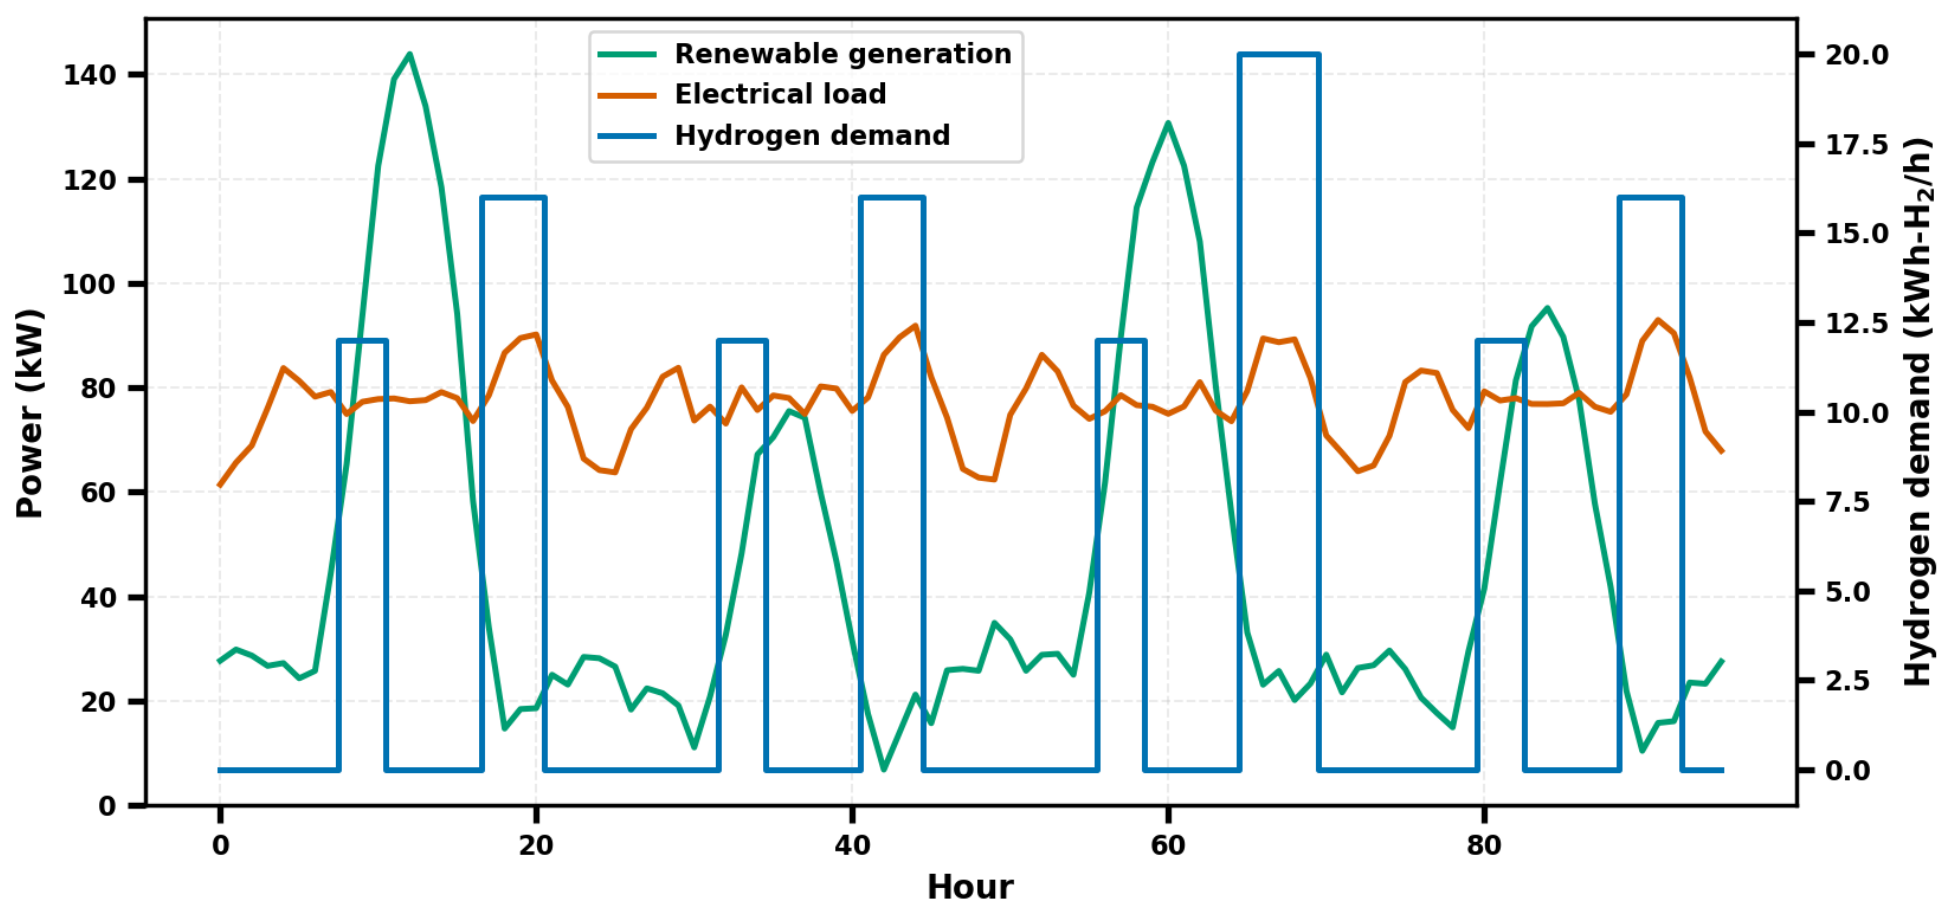
Figure 2 represents the 96-h benchmark input profiles used for all simulation scenarios, including renewable generation, local electrical load, and external hydrogen demand. Here, renewable generation varies strongly with daily solar peaks and wind fluctuations, while the electrical load remains comparatively steady with daily demand variations. On the other hand, the hydrogen demand profile appears in scheduled morning and evening service windows, with a higher stress demand period on the third day as given in (62).
Figure 2.
Exogenous benchmark profiles for the 96-h simulation. Renewable generation, electrical load, and hydrogen demand are shown together to highlight the timing mismatch, motivating storage and predictive dispatch.
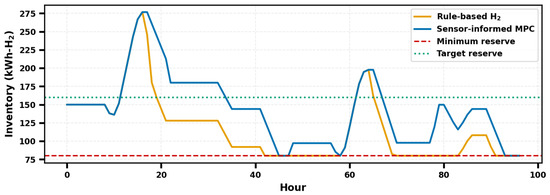
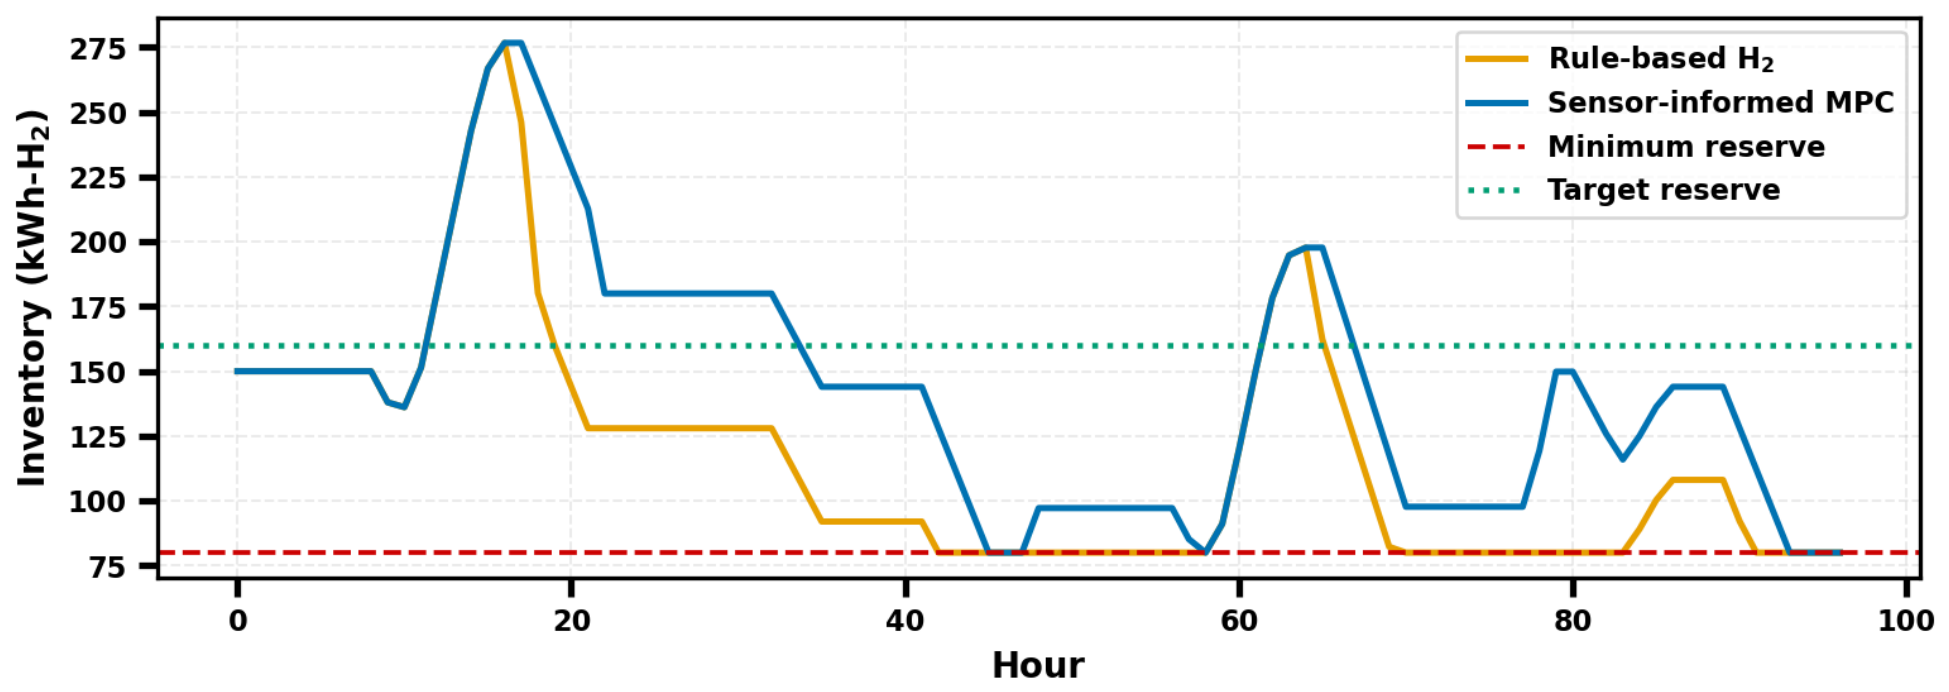
Figure 3 explains the hydrogen inventory evolution over the 96-h simulation for the rule-based hydrogen controller and the sensor-informed MPC. Both strategies begin from the same initial inventory and increase storage during renewable surplus periods, but their later behavior differs significantly. The rule-based controller frequently depletes the tank to the minimum reserve because it reacts only to current surplus and demand, whereas the MPC maintains a higher inventory for longer periods by anticipating future hydrogen demand events.
Figure 3.
Hydrogen inventory under rule-based (orange curve) and sensor-informed MPC (blue curve) operations, where the rule-based controller reaches the minimum reserve (dashed red line) more frequently, while the MPC preserves inventory ahead of future service (dotted green line) needs.
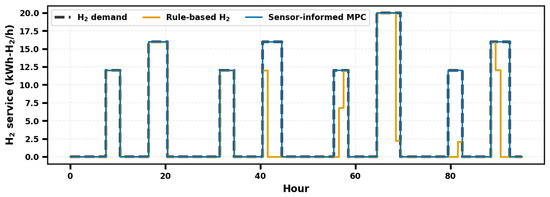
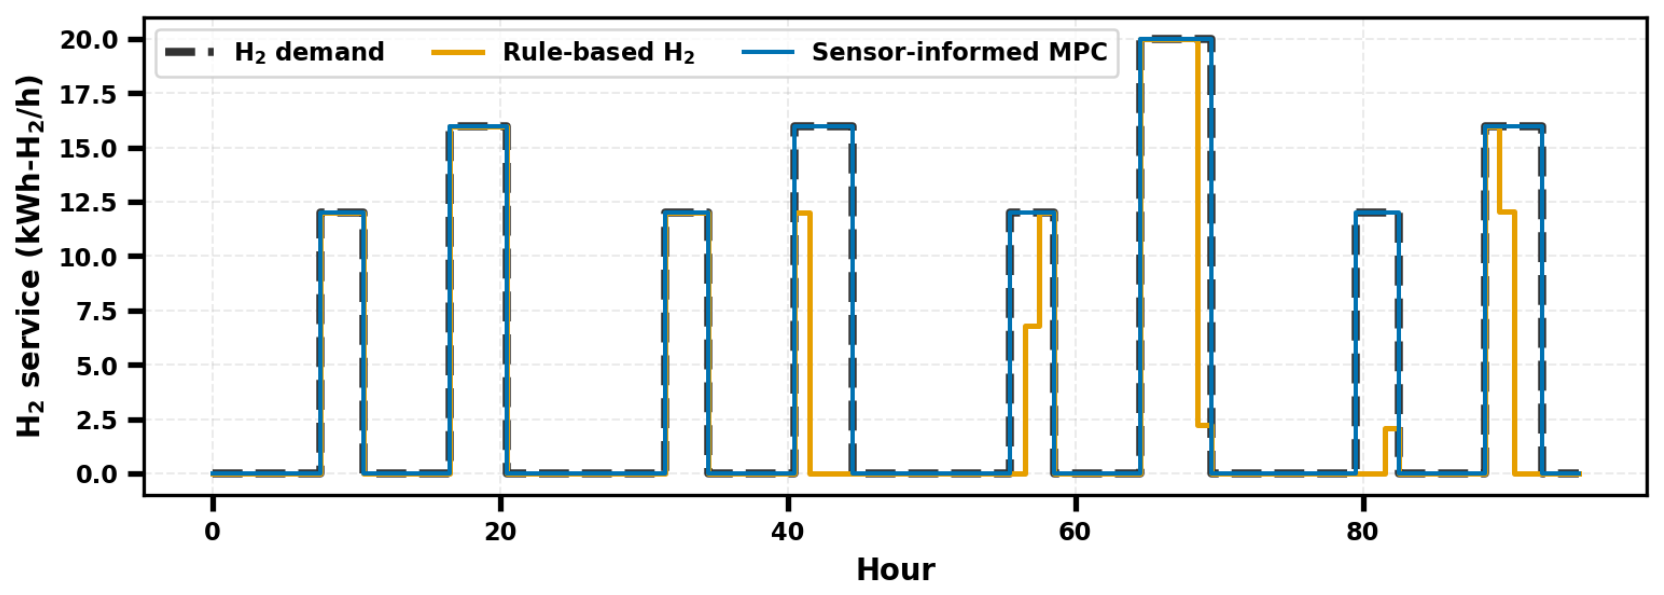
Figure 4 explains the hydrogen service performance of the rule-based hydrogen controller and the sensor-informed MPC compared with the scheduled hydrogen demand profile. The MPC closely follows the demand profile over nearly all service windows, including the high-demand stress period on the third day, because it anticipates future hydrogen requirements and preserves sufficient inventory. In contrast, the rule-based controller fails to fully serve several demand periods because it reacts only to current conditions and often reaches the minimum reserve before future demand occurs.
Figure 4.
Hydrogen-service delivery compared with demand, where the MPC (blue curve) tracks the requested demand profile (dashed black curve) in the nominal case, while the rule-based controller (orange curve) shows shortfalls during selected service windows.
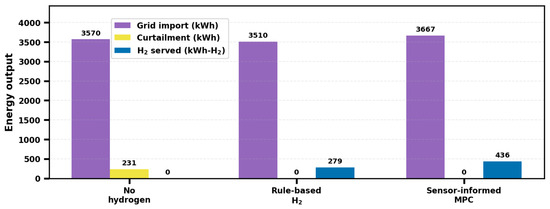
Figure 5 compares the total grid import, renewable curtailment, and served hydrogen energy for the three operating strategies over the 96-h simulation. Here, we see that the no-hydrogen baseline imports 3570 kWh from the grid, curtails 231 kWh of renewable energy, and serves no hydrogen demand due to the absence of the hydrogen pathway. On the other hand, the rule-based hydrogen strategy reduces grid import slightly to 3510 kWh, eliminates curtailment by using surplus renewable energy for electrolysis, and serves 279 kWh-H2 of hydrogen demand. But, the sensor-informed MPC serves the largest amount of hydrogen, 436 kWh-H2, and also eliminates curtailment, although its grid import increases to 3667 kWh because the MPC strategically uses additional electricity to satisfy hydrogen demand and preserve service reliability.
Figure 5.
Comparison of cumulative grid-imported electricity (purple bar), curtailed renewable electricity (yellow bar), and served hydrogen energy (blue bar) over the four-day simulation horizon. Grid import and curtailment are reported in kWh, while served hydrogen is reported in . The hydrogen-enabled strategies eliminate renewable curtailment, whereas the MPC delivers the largest amount of hydrogen.
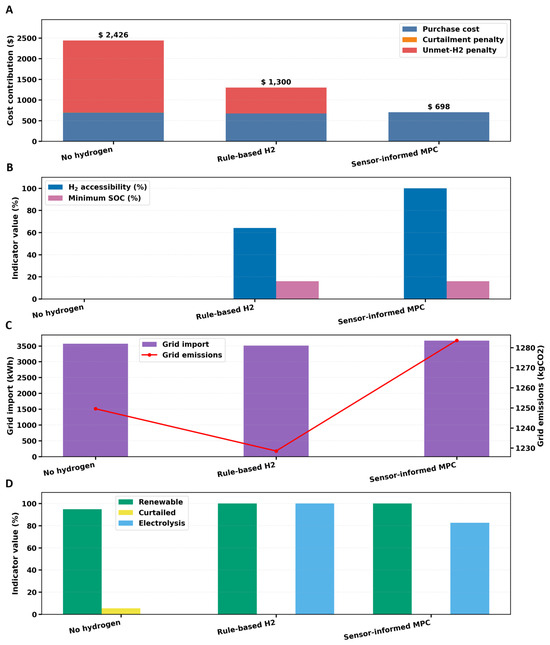
Figure 6 summarizes the comparative performance of the three operating strategies in terms of cost, hydrogen service, grid dependence, emissions, and renewable energy use. Panel A shows that the no-hydrogen case has the highest total operating cost because all hydrogen demand is unmet, while the rule-based strategy reduces this penalty and the MPC achieves the lowest cost by serving hydrogen demand more effectively. Panel B shows that hydrogen accessibility increases from zero in the no-hydrogen case to partial service, %64 under rule-based control and full service, %100 under the MPC, while both hydrogen strategies reach similar minimum storage level, %16 near the reserve limit. Panel C compares grid import and associated emissions, showing that MPC imports more electricity because it prioritizes hydrogen service, whereas rule-based control has the lowest import and emissions. Panel D shows that both hydrogen strategies eliminate renewable curtailment by using surplus renewable energy for electrolysis, with the rule-based case achieving a higher green electrolysis fraction (%100) than MPC (%82.61).
Figure 6.
Detailed performance indicators with four panels showing comparative cost components (Panel A), hydrogen service indicators (Panel B), grid import emissions (Panel C), and renewable-use indicators (Panel D) across the three strategies.
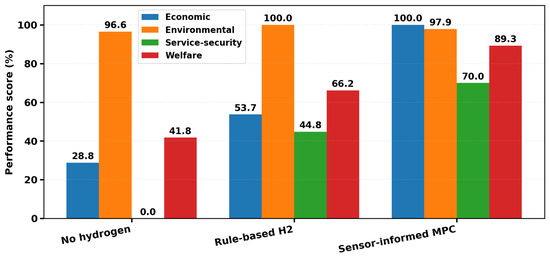
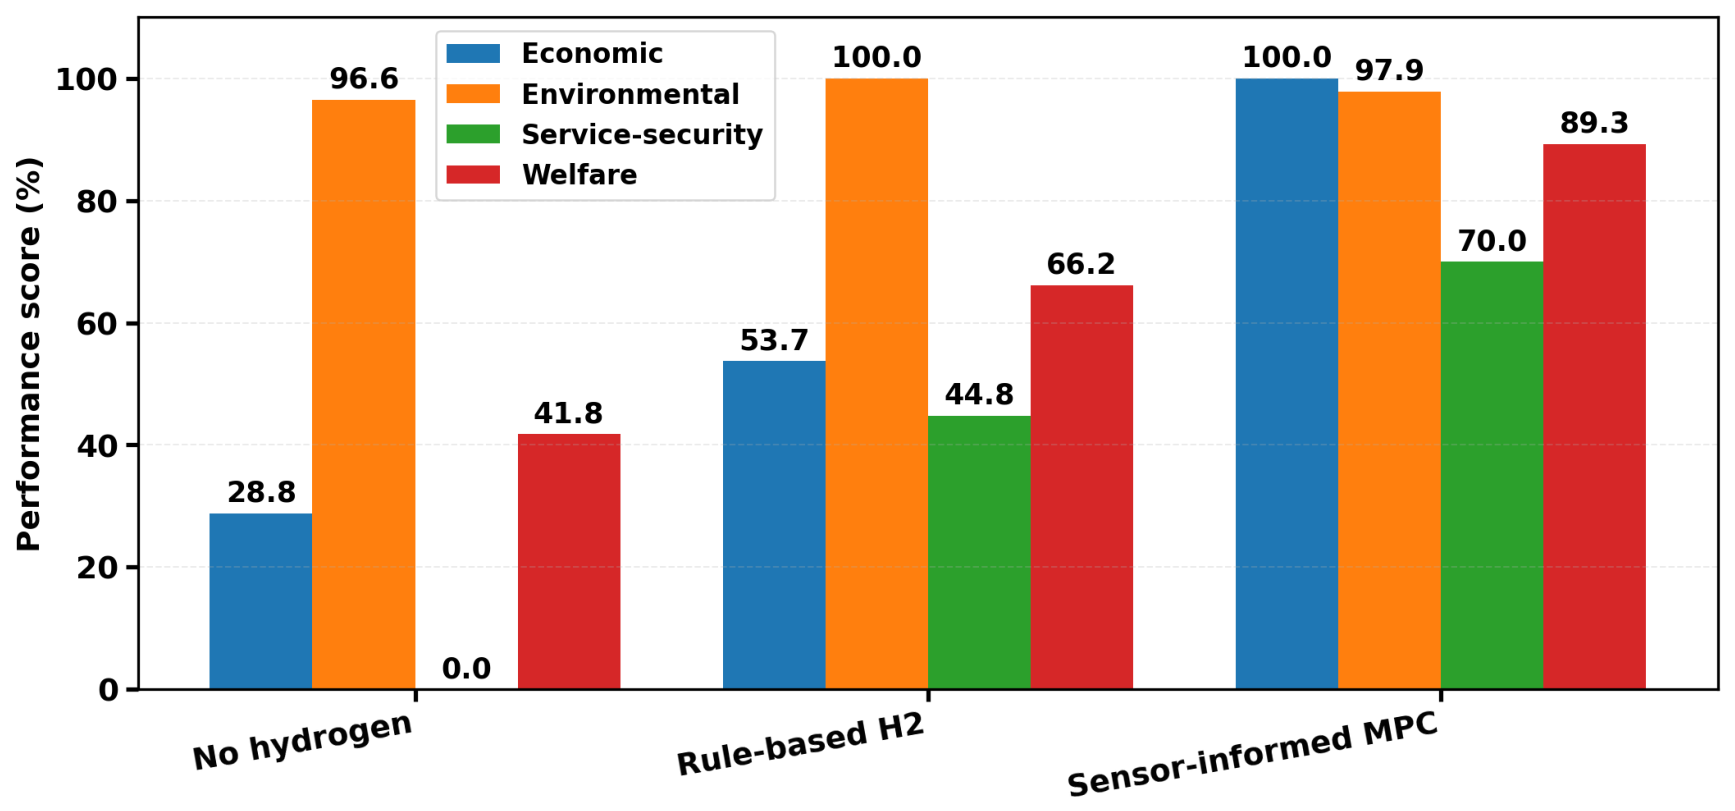
Figure 7 explains the normalized performance scores of the three operating strategies across economic, environmental, service security, and overall welfare indicators. The no-hydrogen baseline obtains a high environmental score because it does not operate the electrolyzer, but it has zero service security performance because no hydrogen demand is served. On the other hand, the rule-based hydrogen strategy improves the economic and service security scores by enabling hydrogen production and partial demand satisfaction, while maintaining the highest environmental score due to lower grid import and full renewable utilization. In addition, the sensor-informed MPC achieves the best economic score and the highest overall welfare score because it fully serves hydrogen demand and improves service security, although its environmental score is slightly lower due to increased grid import.
Figure 7.
Normalized economic (blue bar), environmental (orange bar), service security (green bar), and welfare (red bar) performance scores.
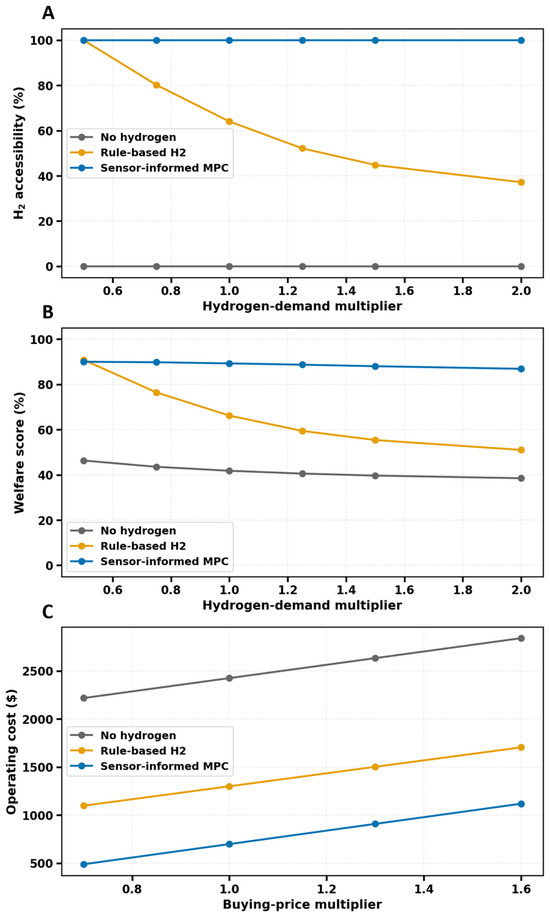
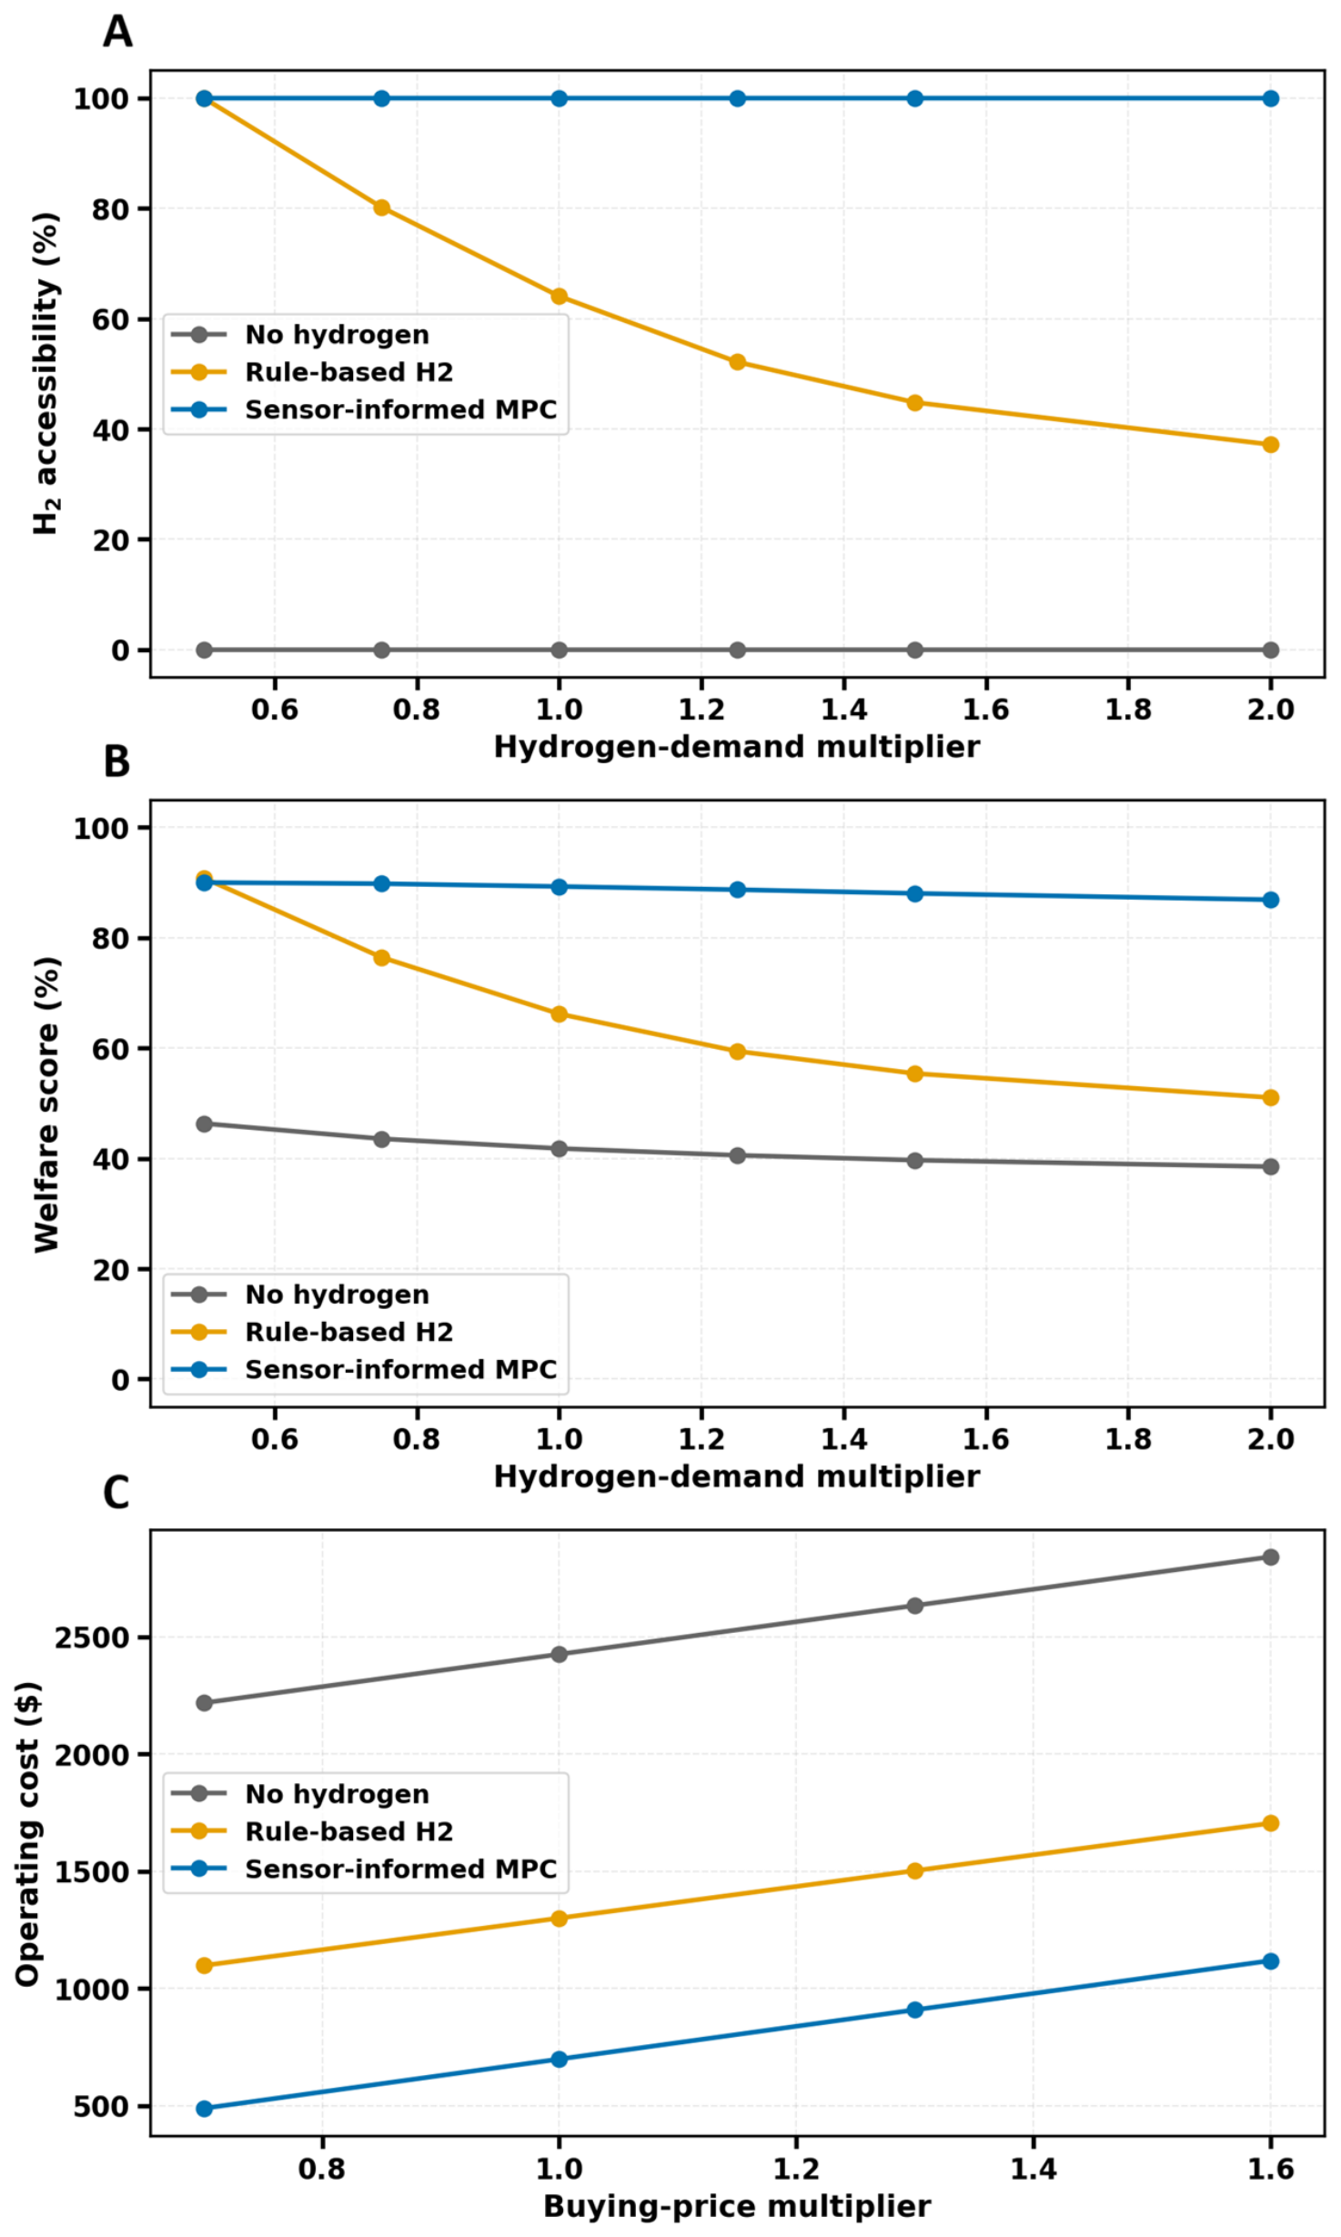
Figure 8 presents the sensitivity of the three operating strategies to changes in hydrogen demand and electricity purchase price. Panel A shows that the no-hydrogen case maintains zero hydrogen accessibility because no hydrogen service pathway is available. The rule-based strategy loses accessibility as hydrogen demand increases because it responds only to current conditions and frequently reaches the reserve limit. In contrast, the sensor-informed MPC maintains full accessibility across the tested demand multipliers by scheduling electrolysis and storage use in anticipation of future demand. Panel B shows the corresponding welfare response, with the MPC retaining the highest combined performance because it preserves hydrogen service and reserve security, while the rule-based and no-hydrogen cases decline. Panel C shows that operating cost increases for all strategies as the electricity purchase price multiplier rises; however, the MPC remains the least-cost strategy because it coordinates grid purchases, hydrogen production, and inventory over the prediction horizon. The rule-based strategy remains intermediate, whereas the no-hydrogen baseline is the most expensive because all hydrogen demand is penalized as unmet.
Figure 8.
Sensitivity analysis under hydrogen demand and electricity price multipliers, where the MPC remains the strongest strategy under demand stress and price variation.
4. Discussions
The numerical results demonstrate that the value of hydrogen storage depends not only on the presence of the electrolyzer, storage tank, and fuel cell, but also on the supervisory control strategy used to operate them. Introducing hydrogen storage under the rule-based controller improves performance substantially. The rule-based strategy eliminates renewable curtailment by converting surplus renewable electricity into stored hydrogen. Its grid import decreases slightly and the total operating cost falls. However, the rule-based controller remains limited by its myopic structure due to its reaction to present renewable surplus, demand, and inventory. Hence, it frequently depletes the tank to the minimum reserve and cannot reliably prepare for future hydrogen demand windows. This behavior is visible in the inventory and service profiles, where the rule-based controller fails to fully satisfy several demand periods after the storage level approaches the reserve boundary.
On the other hand, the sensor-informed MPC provides the strongest overall performance because it uses forecasts and inventory feedback to coordinate electrolysis, hydrogen service, fuel cell discharge, grid exchange, and reserve preservation over a receding prediction horizon. The MPC achieves full hydrogen accessibility in the benchmark while eliminating renewable curtailment. It also lowers total operating cost to 71.2% of the no-hydrogen baseline and achieves a 46.3% cost reduction relative to the rule-based controller. This improvement occurs because the MPC anticipates future hydrogen demand events and assigns economic value to stored hydrogen, rather than using inventory only according to current-hour conditions, which results in a more reliable hydrogen service trajectory and a higher overall welfare score.
A trade-off is observed between service reliability and grid dependence. The MPC imports more electricity than the other strategies, using the additional energy to reduce unmet hydrogen demand and improve hydrogen service reliability. Therefore, the MPC does not simply minimize grid import; instead, it minimizes the combined cost of grid purchases, curtailment, unmet hydrogen demand, and terminal inventory value. This explains why the MPC achieves the lowest total operating cost despite importing more electricity. In addition, the MPC achieves a more stable trade-off across economic efficiency, environmental impact, and hydrogen accessibility, and remains robust when both demand pressure and electricity prices increase. The corresponding emissions are also higher than the rule-based case because emissions are calculated directly from grid import. Thus, improving hydrogen service reliability may require additional grid electricity unless electrolysis is limited to renewable surplus or operated under a stricter carbon-aware objective.
The uniqueness of the proposed model lies in its integrated supervisory comparison of three operating strategies within a common renewable–hydrogen benchmark, which distinguishes it from recent hydrogen-microgrid energy management studies that typically focus on a single optimized control architecture or system configuration [19,20,21,35]. The MPC framework combines renewable generation, local electrical load, grid import and export, electrolyzer operation, usable hydrogen energy inventory, direct hydrogen service, fuel cell reconversion, reserve constraints, and a sensor-informed safety layer. Unlike a purely electrical dispatch model, the formulation explicitly tracks hydrogen inventory and unmet hydrogen service, reflecting the need to treat hydrogen not only as electrical backup storage but also as a deliverable energy service [22]. Unlike a simple storage arbitrage model, it evaluates hydrogen accessibility, reserve security, green electrolysis fraction, emissions, and welfare in addition to operating cost, consistent with recent multi-objective, cost-emission, and refueling-oriented hydrogen energy management studies [6,25,36]. Moreover, by expressing hydrogen demand and inventory in energy-equivalent units, the model preserves a linear supervisory balance and allows the MPC problem to be solved as a linear program, following recent hydrogen system scheduling approaches [6,28]. This makes the approach computationally transparent and suitable for comparative supervisory energy management studies.
The findings are consistent with recent literature on renewable integration and hydrogen energy systems. Previous studies have shown that energy storage can reduce renewable curtailment and improve the utilization of variable renewable generation [7,37]. Electrolytic hydrogen has also been widely discussed as a flexible power-to-hydrogen pathway for converting surplus renewable electricity into a storable energy carrier [38,39]. The present results support these conclusions, as both hydrogen-enabled strategies eliminate curtailment by using surplus renewable energy for electrolysis. The results also agree with energy management studies showing that predictive and optimization-based controllers can outperform rule-based operation when future demand, renewable generation, and prices affect current decisions [40,41,42]. Moreover, the safety layer should be interpreted as a hard supervisory constraint rather than as a source of performance improvement in the nominal benchmark, consistent with recent hydrogen safety studies that emphasize monitoring, leak detection, fault diagnosis, and emergency shutdown as risk mitigation functions [13,14]. During the reported simulations, no pressure, temperature, leakage, starvation, or reserve safety violation was introduced. Consequently, all actuator availability flags remained active, and the safety supervisor did not alter the nominal dispatch. This is appropriate for a benchmark study focused on energy management performance. The safety formulation nevertheless provides a consistent mechanism for blocking electrolyzer or fuel cell operation under abnormal sensor conditions, and it can be used in future fault injection or resilience studies [29,43].
Several limitations should be noted. The benchmark uses synthetic but reproducible renewable generation, load, price, and hydrogen demand profiles rather than site-measured data. Although these profiles capture the main temporal patterns required for a controlled comparison, the results should not be interpreted as site-specific or field-validated performance. The hourly supervisory model also omits fast electrical transients, detailed pressure, compressor and thermal dynamics, gas purity, start-up and shutdown behavior, degradation, water use, and stack replacement. In addition, the economic objective excludes capital, financing, fixed maintenance, and hydrogen revenue terms, while emissions are estimated using a constant grid factor. Future work should therefore include measured datasets, higher-fidelity process constraints, time-varying carbon intensity, seasonal operation, and experimental validation, together with component sizing, capital investment, capital recovery, maintenance, and hydrogen revenue to support a complete techno-economic profitability assessment.
5. Conclusions
This study established a common supervisory framework for comparing no-hydrogen operation, reactive hydrogen storage, and sensor-informed MPC under identical plant and operating conditions. The results show that hydrogen hardware alone does not ensure reliable hydrogen service. Rule-based control effectively absorbs immediate renewable surplus, but its myopic operation can deplete the usable inventory before later demand periods. In contrast, the MPC anticipates future demand, preserves storage reserves, and delivers hydrogen more reliably by coordinating electrolysis, fuel cell operation, grid exchange, and terminal inventory.
The central finding is that the value of renewable hydrogen storage depends strongly on the supervisory control strategy. Predictive operation improves service reliability and overall system performance, although this may require additional grid electricity when future hydrogen demand must be protected. Accordingly, the preferred strategy depends on the operator’s priorities among renewable-only electrolysis, low grid dependence, and reliable hydrogen delivery.
Funding
This research received no external funding.
Informed Consent Statement
Not applicable.
Data Availability Statement
The case study data analyzed in this work is publicly available. All simulations were performed in Python 3. The code used for data analysis, simulation, and figure generation is available from the corresponding author upon reasonable request.
Acknowledgments
The author would like to acknowledge the use of ChatGPT (OpenAI, GPT-5.5 version) and QuillBot (web-based version accessed in 2026) for assistance with wording and grammar in this work.
Conflicts of Interest
The author declares that there are no conflicts of interest regarding the publication of this manuscript.
Nomenclature
| Symbol | Description | Symbol | Description |
| Indices and horizons | Economic and MPC quantities | ||
| k | Discrete time index | Grid electricity purchase price | |
| i | Prediction-step index | Grid electricity export price | |
| Hour of day | Purchase price multiplier | ||
| Simulated day index | Curtailment penalty | ||
| N | Number of simulation intervals | Unmet hydrogen demand penalty | |
| MPC prediction horizon | Terminal inventory value | ||
| Effective prediction horizon | J | Full-horizon operating objective | |
| Sampling interval | Finite-horizon MPC objective | ||
| Electrical variables | Forecast information set available at time k | ||
| Photovoltaic generation | Predicted hydrogen inventory | ||
| Wind generation | Predicted control action vector | ||
| Unclipped wind-power profile | Optimal predicted control sequence | ||
| Available renewable power | Optimal predicted inventory trajectory | ||
| Local electrical load | Implemented control action | ||
| Unclipped electrical load profile | Benchmark profile parameters | ||
| Electrolyzer power consumption | Dimensionless solar-shape function | ||
| Fuel cell electrical output | Daily cloud factor | ||
| Grid import power | Wind profile random disturbance | ||
| Grid export power | Load profile random disturbance | ||
| Curtailed renewable power | Economic and service indicators | ||
| Renewable power surplus | Total grid electricity purchase cost | ||
| Electrolyzer power limit | Total grid export revenue | ||
| Fuel cell power limit | Net electricity bill | ||
| Grid export limit | Curtailment penalty cost | ||
| Hydrogen variables | Unmet hydrogen demand penalty | ||
| Usable hydrogen energy inventory | Operating-and-service cost | ||
| Measured hydrogen inventory | Total requested hydrogen energy | ||
| Initial hydrogen inventory | Total served hydrogen energy | ||
| Minimum reserve inventory | Total unmet hydrogen energy | ||
| Maximum usable inventory | Hydrogen-accessibility fraction | ||
| Usable hydrogen-tank capacity | Reserve and environmental indicators | ||
| Hydrogen storage state of charge | Minimum hydrogen inventory reached | ||
| External hydrogen service demand | Target hydrogen storage inventory | ||
| Served hydrogen demand | Reserve security score | ||
| Unmet hydrogen demand | Minimum hydrogen storage state of charge | ||
| Provisional inventory | Total grid-imported electricity | ||
| Inventory remaining | Grid-associated operational emissions | ||
| Net electrolyzer efficiency | Grid emission factor | ||
| Net fuel cell efficiency | Renewable energy utilization fraction | ||
| Safety and availability | Curtailed renewable fraction | ||
| Measured safety condition set | Local renewable surplus matching fraction | ||
| Electrolyzer availability flag | Welfare indicators | ||
| Fuel cell availability flag | Set of compared operating strategies | ||
| Hydrogen storage pressure | Indices for operating strategies | ||
| Hydrogen storage temperature | Normalized economic performance score | ||
| Maximum allowable pressure | Normalized emissions score | ||
| Maximum allowable temperature | Environmental performance score | ||
| Hydrogen leak alarm signal | Hydrogen service security score | ||
| Fuel cell starvation alarm signal | Operational welfare score | ||
Abbreviations
The following abbreviations are used in this manuscript:
| MPC | Model Predictive Control |
| SOC | State of Charge |
| PV | Photovoltaics |
| kW | Kilowatt |
References
- Pfenninger, S.; Staffell, I. Long-term patterns of European PV output using 30 years of validated hourly reanalysis and satellite data. Energy 2016, 114, 1251–1265. [Google Scholar] [CrossRef] [Scilit]
- Staffell, I.; Pfenninger, S. Using bias-corrected reanalysis to simulate current and future wind power output. Energy 2016, 114, 1224–1239. [Google Scholar] [CrossRef] [Scilit]
- Kourougianni, F.; Arsalis, A.; Olympios, A.V.; Yiasoumas, G.; Konstantinou, C.; Papanastasiou, P.; Georghiou, G.E. A comprehensive review of green hydrogen energy systems. Renew. Energy 2024, 231, 120911. [Google Scholar] [CrossRef] [Scilit]
- Haoxin, D.; Qiyuan, D.; Chaojie, L.; Nian, L.; Zhang, W.; Hu, M.; Xu, C. A comprehensive review on renewable power-to-green hydrogen-to-power systems: Green hydrogen production, transportation, storage, re-electrification and safety. Appl. Energy 2025, 390, 125821. [Google Scholar] [CrossRef] [Scilit]
- Lund, H.; Mathiesen, B.V. Energy system analysis of 100% renewable energy systems—The case of Denmark in years 2030 and 2050. Energy 2009, 34, 524–531. [Google Scholar] [CrossRef] [Scilit]
- Barba, J.; Cañas-Carretón, M.; Carrión, M.; Hernández-Labrado, G.R.; Merino, C.; Muñoz, J.I.; Zárate-Miñano, R. Integrating hydrogen into power systems: A comprehensive review. Sustainability 2025, 17, 6117. [Google Scholar] [CrossRef] [Scilit]
- Li, C.; Li, H.; Yue, H.; Lv, J.; Zhang, J. Flexibility value of multimodal hydrogen energy utilization in electric–hydrogen–thermal systems. Sustainability 2024, 16, 4939. [Google Scholar] [CrossRef] [Scilit]
- Bødal, E.F.; Mallapragada, D.; Botterud, A.; Korpås, M. Decarbonization synergies from joint planning of electricity and hydrogen production: A Texas case study. Int. J. Hydrogen Energy 2020, 45, 32899–32915. [Google Scholar] [CrossRef] [Scilit]
- Han, L.; Wang, S.; Cheng, Y.; Chen, S.; Wang, X. Multi-timescale scheduling of an integrated electric-hydrogen energy system with multiple types of electrolysis cells operating in concert with fuel cells. Energy 2024, 307, 132707. [Google Scholar] [CrossRef] [Scilit]
- Zhang, J.; Li, J. Revolution in renewables: Integration of green hydrogen for a sustainable future. Energies 2024, 17, 4148. [Google Scholar] [CrossRef] [Scilit]
- Hassan, M. Artificial intelligence powered intelligent energy management framework for hydrogen storage and dispatch in smart microgrids. Sci. Rep. 2025, 15, 40394. [Google Scholar] [CrossRef] [Scilit] [PubMed]
- Davies, E.; Ehrmann, A.; Schwenzfeier-Hellkamp, E. Safety of hydrogen storage technologies. Processes 2024, 12, 2182. [Google Scholar] [CrossRef] [Scilit]
- Calabrese, M.; Portarapillo, M.; Di Nardo, A.; Venezia, V.; Turco, M.; Luciani, G.; Di Benedetto, A. Hydrogen safety challenges: A comprehensive review on production, storage, transport, utilization, and CFD-based consequence and risk assessment. Energies 2024, 17, 1350. [Google Scholar] [CrossRef] [Scilit]
- Qanbar, M.W.; Hong, Z. A review of hydrogen leak detection regulations and technologies. Energies 2024, 17, 4059. [Google Scholar] [CrossRef] [Scilit]
- Farah, S.; Bokde, N.D.; Andresen, G.B. Cost and CO2 emissions co-optimisation of green hydrogen production in a grid-connected renewable energy system. Int. J. Hydrogen Energy 2024, 84, 164–176. [Google Scholar] [CrossRef] [Scilit]
- Cardona, P.; Costa-Castelló, R.; Roda, V.; Carroquino, J.; Valiño, L.; Serra, M. Model predictive control of an on-site green hydrogen production and refuelling station. Int. J. Hydrogen Energy 2023, 48, 17995–18010. [Google Scholar] [CrossRef] [Scilit]
- Alberta Utilities Commission. Time Varying Rates: Assessment of Costs and Benefits; Alberta Utilities Commission: Calgary, AB, Canada, 2025; Available online: https://media.auc.ab.ca/prd-consultation/sites/2/2025/06/2025-06-19-FINAL-TVR-REPORT.pdf (accessed on 17 June 2026).
- Sarwar, F.A.; Hernando-Gil, I.; Vechiu, I. Review of energy management systems and optimization methods for hydrogen-based hybrid building microgrids. Energy Convers. Econ. 2024, 5, 259–279. [Google Scholar] [CrossRef] [Scilit]
- Guo, X.; Gu, F.; Liu, H.; Yu, Y.; Li, R.; Wang, J. Sustainable PV-hydrogen-storage microgrid energy management using a hierarchical economic model predictive control framework. Energy Inform. 2025, 8, 18. [Google Scholar] [CrossRef] [Scilit]
- Pan, T.; Hou, J.; Jin, X.; Yu, Z.; Zhou, W.; Wang, Z. Distributed control of hydrogen-based microgrids for the demand side: A multiagent self-triggered MPC-based strategy. Algorithms 2024, 17, 251. [Google Scholar] [CrossRef] [Scilit]
- Zhu, Z.; Liu, X.; Kong, X.; Ma, L.; Lee, K.Y.; Xu, Y. PV/hydrogen DC microgrid control using distributed economic model predictive control. Renew. Energy 2024, 222, 119871. [Google Scholar] [CrossRef] [Scilit]
- Tang, Y.; Xun, Q.; Liserre, M.; Yang, H. Energy management of electric-hydrogen hybrid energy storage systems in photovoltaic microgrids. Int. J. Hydrogen Energy 2024, 80, 1–10. [Google Scholar] [CrossRef] [Scilit]
- Agha Kassab, F.; Rodriguez, R.; Celik, B.; Locment, F.; Sechilariu, M. A comprehensive review of sizing and energy management strategies for optimal planning of microgrids with PV and other renewable integration. Appl. Sci. 2024, 14, 10479. [Google Scholar] [CrossRef] [Scilit]
- Xi, W.; Boyd, M.; Ruth, M.; Kurup, P. Electrolyzers in the System Advisor Model (SAM): A Techno-Economic Potential Study (No. NREL/TP-6A20-83155); National Renewable Energy Laboratory (NREL): Golden, CO, USA, 2023.
- Rey, J.; Segura, F.; Andújar, J.M.; Ferrario, A.M. The economic impact and carbon footprint dependence of energy management strategies in hydrogen-based microgrids. Electronics 2023, 12, 3703. [Google Scholar] [CrossRef] [Scilit]
- Sharma, P.; Mathur, H.D.; Mishra, P.; Bansal, R.C. A critical and comparative review of energy management strategies for microgrids. Appl. Energy 2022, 327, 120028. [Google Scholar] [CrossRef] [Scilit]
- Joshal, K.S.; Gupta, N. Microgrids with model predictive control: A critical review. Energies 2023, 16, 4851. [Google Scholar] [CrossRef] [Scilit]
- Totaro, M.; Santonocito, D.; Risitano, G.; Barbera, O.; Giacoppo, G. A novel hydrogen leak detection method for PEM fuel cells using active thermography. Energies 2025, 18, 1185. [Google Scholar] [CrossRef] [Scilit]
- Herbeck-Tazibt, J.; Djeziri, M.A.; Fiorido, T.; Seguin, J.-L. Review of hydrogen sensors in aerobic and anaerobic environments coupled with artificial intelligence tools. Sensors 2025, 25, 6936. [Google Scholar] [CrossRef] [Scilit] [PubMed]
- Denholm, P.; Drury, E.; Margolis, R.M. The Solar Deployment System (SolarDS) Model: Documentation and Sample Results (No. NREL/TP-6A2-45832); National Renewable Energy Laboratory (NREL): Golden, CO, USA, 2009.
- King, J.; Clifton, A.; Hodge, B.M. Validation of Power Output for the WIND Toolkit (No. NREL/TP-5D00-61714); National Renewable Energy Laboratory (NREL): Golden, CO, USA, 2014.
- Li, H.; Yeo, J.H.; Bornsheuer, A.L.; Overbye, T.J. The creation and validation of load time series for synthetic electric power systems. IEEE Trans. Power Syst. 2021, 36, 961–969. [Google Scholar] [CrossRef] [Scilit]
- Richardson, I.; Thomson, M.; Infield, D.; Clifford, C. Domestic electricity use: A high-resolution energy demand model. Energy Build. 2010, 42, 1878–1887. [Google Scholar] [CrossRef] [Scilit]
- Widén, J.; Wäckelgård, E. A high-resolution stochastic model of domestic activity patterns and electricity demand. Appl. Energy 2010, 87, 1880–1892. [Google Scholar] [CrossRef] [Scilit]
- Qamar, H.G.M.; Guo, X.; Ghith, E.; Tlija, M. A novel approach to energy management with power quality enhancement in hydrogen based microgrids through numerical simulation. Appl. Sci. 2024, 14, 7607. [Google Scholar] [CrossRef] [Scilit]
- Şafak, B.; Çiçek, A. Multi-objective optimal energy management strategy for grid-interactive hydrogen refueling stations in rural areas. Sustainability 2025, 17, 2663. [Google Scholar] [CrossRef] [Scilit]
- Geng, Y.; Liu, Q.; Zheng, H.; Yan, S. Two-stage collaborative power optimization for off-grid wind–solar hydrogen production systems considering reserved energy of storage. Energies 2025, 18, 2970. [Google Scholar] [CrossRef] [Scilit]
- Dulău, L.-I. Power cost and CO2 emissions for a microgrid with hydrogen storage and electric vehicles. Sustainability 2023, 15, 15750. [Google Scholar] [CrossRef] [Scilit]
- Abdallah, R.Y.; Shaaban, M.F.; Osman, A.H.; Ali, A.; Obaideen, K.; Albasha, L. Synergizing gas and electric systems using power-to-hydrogen: Integrated solutions for clean and sustainable energy networks. Smart Cities 2025, 8, 81. [Google Scholar] [CrossRef] [Scilit]
- Topa, A.O.; Gil, J.D.; Álvarez, J.D.; Torres, J.L. A hybrid-MPC based energy management system with time series constraints for a bioclimatic building. Energy 2024, 287, 129652. [Google Scholar] [CrossRef] [Scilit]
- Bakare, M.S.; Abdulkarim, A.; Shuaibu, A.N.; Muhamad, M.M. Energy management controllers: Strategies, coordination, and applications. Energy Inform. 2024, 7, 57. [Google Scholar] [CrossRef] [Scilit]
- Wang, J.; Wen, J.; Wang, J.; Yang, B.; Jiang, L. Coordinated scheduling of wind-solar-hydrogen-battery storage system for techno-economic-environmental optimization of hydrogen production. Energy Convers. Manag. 2024, 314, 118695. [Google Scholar] [CrossRef] [Scilit]
- Gregorovičová, E.; Pospíšil, J. Hydrogen safety in energy infrastructure: A review. Energies 2025, 18, 5470. [Google Scholar] [CrossRef] [Scilit]
Disclaimer/Publisher’s Note: The statements, opinions and data contained in all publications are solely those of the individual author(s) and contributor(s) and not of MDPI and/or the editor(s). MDPI and/or the editor(s) disclaim responsibility for any injury to people or property resulting from any ideas, methods, instructions or products referred to in the content. |
© 2026 by the author. Licensee MDPI, Basel, Switzerland. This article is an open access article distributed under the terms and conditions of the Creative Commons Attribution (CC BY) license.