


Abstract
Autistic traits have been associated with enhanced perceptual processing, attention to detail, and systemizing, all of which may be linked to numerical cognition. However, little is known about whether these traits are related to symbolic numerical processing. This study examined the association between autistic traits and numerical comparison performance in adults. Data were collected online from N = 463 participants who performed some numerical tasks and then responded to a number of psychological questionnaires. Of major concern to the current study was whether two types of numerical processing effects (distance and size), as well as an overall processing efficiency measure derived from a single-digit numerical comparison task, were potentially related to self-reported measures of autistic traits and systemizing levels, as well as to performance on a double-digit arithmetic performance task. Although currently available numerical and autistic processing theories would suggest that such relations should indeed exist, none were evident in the results, even though both robust distance and size effects were obtained. However, robust sex and academic major differences were observed for both distance and size effects (smaller for both males and those majoring in STEM).
1. Introduction
Researchers have increasingly studied links between autistic traits and individual differences in information and cognitive processing, aiming to understand how these individual differences might be connected to the autism spectrum [1,2,3]. A significant portion of this research has focused on understanding how performance on fundamental cognitive tasks correlates with scores on the Autism-Spectrum Quotient (AQ) questionnaire [4]. Autistic traits, as measured by the AQ, are continuously distributed in the general population, with individuals diagnosed with autism spectrum disorder (ASD) typically scoring at the upper end of this distribution [5]. Importantly, studies have shown that a number of cognitive-behavioral patterns are similar between typically developing individuals with high AQ scores and those with high-functioning ASD [6].
One issue of growing interest is whether individuals with higher autistic traits or ASD exhibit enhanced mathematical proficiency relative to their typically developing peers [7,8,9,10]. As basic numerical processing is considered a fundamental building block of mathematical ability and arithmetic skills [11,12,13], understanding individual differences in numerical processing may provide insight into potential cognitive strengths associated with autistic traits.
1.1. Basic Numerical Processing
Basic numerical processing involves knowledge about the numerical information that is used to perform operations such as estimation and magnitude comparison [14,15]. Understanding basic numerical processing is crucial for studying individual differences related to math abilities [16,17]. Numerical information can be either ordinal (position of a number in a sequence) or cardinal (numericity of a set) [17]. Numerical processing can be examined using either non-symbolic (dot) or symbolic (digit) tasks [16]. However, symbolic numerical processing tasks are more strongly associated with math abilities than are non-symbolic tasks [18]; thus, the current study focuses on a symbolic numerical processing task, namely the numerical comparison task (e.g., which is larger, 5 or 7) [19,20].
Several robust processing effects are present in the performance data obtained from this task. Two key ones are distance effects (i.e., performance is better for magnitudes that are farther apart) and size effects (i.e., performance is better for smaller numbers than larger numbers). Researchers typically use reaction time (RT), accuracy, or both as indices of performance to study numerical processing related to individual differences [16]. In this vein, the numerical distance effect has been calculated in various ways across studies. For example, Holloway and Ansari (2009) calculated the numerical distance effect for each individual by subtracting RTs for larger distances from RTs for smaller distances and then dividing that difference by RTs for larger distances [21]. Maloney et al. (2010) computed distance effects by subtracting RTs for trials with a distance of four (e.g., 5 vs. 9) from those with a distance of 1 (e.g., 5 vs. 6) [22]. Additionally, a distance effect slope can be used as a measure of this effect by performing a linear regression with RT as the dependent variable and distance (e.g., 1, 2, and 3) as the independent variable [23]. Slopes indexing the size effect can also be computed in an analogous manner (e.g., a regression of RT on the sum of the two numbers being compared) [23].
Different explanations for the distance and size effect have been proposed that reflect models of how number magnitude is represented. First, an explanation for both effects that is based on the analog number system (ANS) postulates that numbers have a continuous and noisy magnitude representation (in accordance with a Gaussian distribution) [24]. When two numbers that are close to each other are compared, greater overlap of the two signals is present, leading to worse performance (i.e., slower RT and lower accuracy). The ANS model also incorporates Weber’s law, such that the distance effect is regarded as being analogous to a ratio effect. As such, in line with Weber’s law, performance is better when comparing two small numbers than when comparing two large numbers, given larger ratio effects in the former case than in the latter case [25]. According to this view, individuals who have a more precise ANS (i.e., less noisy) would be assumed to perform better on the numerical comparison task [16].
A version of this analog-based model that specifically considers the decision process would assume that evidence corresponding to the difference between the analog magnitudes of each number is being accumulated and used to make the decision [26]. Larger subjective differences between the members of a comparison pair (as for further distances and smaller numbers) would then naturally lead to stronger evidence signals for the response, resulting in faster and more accurate decisions. People who access and process such magnitudes more efficiently within this decision process might then be more likely to manifest smaller processing effects (e.g., distance and size).
Another model, referred to as the discrete semantic system (DSS), is based on a mental lexical or conceptual network view of numerical representation where digits are nodes and statistical relations shape the connections between nodes. In this model, size and distance effects are independent because the distance effect is based on semantic number relations (association-based) and the size effect is based on number frequency (frequency-based), given that smaller numbers are more frequent during the learning of numerical information than are larger numbers [25,27]. One semantic account for the distance effect is that numbers might be differentially associated with smaller and larger number “nodes” [25].
1.2. Autistic Traits and Numerical Processing
There are a number of reasons to consider the possibility that there is a relation between generalized autistic traits and basic numerical processing. First, there are some important common factors that are associated with both numerical processing and autism. For example, studies have reported enhanced performance on perceptual and visual encoding such as visual search, discrimination, and visual mental imagery in individuals with ASD [28]. Moreover, people with autism make better use of lower-level sensory information, which is associated with enhanced attention to detail and localizing elements in space [29]. Importantly, lower-level sensory information processing may be associated with the development of numerosity skills among these individuals [30].
Next, autistic traits are related to hyper-systemizing [31]. According to empathizing-systemizing (E-S) theory, individuals with high systemizing prefer predictability and lawfulness and have difficulties coping with changes to rules [32]. Moreover, a recent study examining the relation between systemizing and autistic traits showed that attention to detail is closely related to self-reported systemizing [33]. With respect to math abilities, Iuculano et al. (2014) also noted that because systematic, logical thinking is thought to be enhanced in individuals with ASD, and because “mathematics represents the most concrete instantiation of such abilities”, then “mathematics potentially represents an ideal domain to experimentally measure potential cognitive strengths in ASD” (p. 223) [9]. Nonetheless, the evidence for the relation between systemizing and math ability has been mixed. For example, Morsanyi et al. (2012 [34]; see also Escovar et al., 2016 [35]) tested the association of systemizing with mathematics prerequisites, mathematics self-efficacy, mechanical reasoning, attitudes toward statistics, and statistics anxiety in 105 undergraduate students. Although systemizing (as measured by the Systemizing Quotient or SQ [36]) was associated with attitudes toward statistics, math self-efficacy, and statistics anxiety, it was not associated with math performance [36]. On the other hand, Bressan (2018) found that higher self-rated systemizing predicted both mathematical intelligence (i.e., as assessed by the arithmetic subtest of the Wechsler Adult Intelligence Scale-Revised) and self-assessed math skills in a sample of young adults [32].
On the other hand, although neurodevelopmental empirical work involving children with ASD also indicates that symbolic numerical processing is an important component of mathematical cognition, findings regarding ASD-related differences have been mixed. For example, Hiniker et al. (2016) found that children with ASD showed reduced non-symbolic numerical acuity but preserved symbolic numerical processing, with symbolic acuity being more strongly related to mathematical ability [37]. Aagten-Murphy et al. (2015) reported that symbolic numerical processing was a stronger predictor of arithmetic ability than non-symbolic processing, although children with ASD showed lower performance on both tasks compared with typically developing children [38]. More recently, Bejarano-Martín et al. (2024) found that autistic children showed differences in early numerical skills, while demonstrating comparable arithmetic performance to non-autistic children [39]. Interestingly, the predictors of mathematical performance differed between groups, with non-symbolic numerical skills being more relevant for autistic children [39]. These findings suggest that numerical cognition in ASD may involve heterogeneous developmental patterns, with the contribution of symbolic and non-symbolic processes varying depending on task demands and developmental stage. Whether similar patterns extend to autistic adults or individuals with varying levels of autistic traits, however, remains unclear.
1.3. Theories of Autism and Numerical Processing
Regarding the semantic representation of number magnitude underlying the numerical comparison task, according to the ANS view, the more precise the ANS, the better the performance on numerical processing tasks [16]. In this vein, two theories of perceptual processing in autism are in line with the presence of a more precise ANS representation of number. The low neural noise model proposes that individuals with autism would be likely to exhibit better performance on discrimination tasks such as those involving noisy and crowded items in a continuum space [40]. Likewise, a look-up-table (LUT) learning style assumes the application of narrow tuning functions to stimulus representations that favor the learning of rigid, precise, and low-dimensional stimuli [41].
With respect to the DSS-related accounts for the distance effect, the low neural noise account cannot make predictions about whether the association-based learning that is assumed to be responsible for this effect may differ for those higher on the autism spectrum. However, according to the LUT learning-style account, individuals with higher autistic traits may prefer learning number information in a fact-by-fact manner rather than through an integrated representation system. Such learning may reduce the generalization of numerical relationships. In other words, individuals with high ASD traits may be more likely to supplement such an integrated numerical representation with factual knowledge. If so, then the greater use of remembered fact-based knowledge of the relation between pairs of stimuli would be expected to diminish the distance effect [22]. With respect to the frequency-based DSS account for the size effect, differential learning associated with smaller and larger numbers among individuals higher in autistic traits would not be expected to arise from either the low neural noise or LUT learning accounts; that is, any differential environmental occurrences of smaller and larger numbers should be approximately the same for all individuals.
Based on these theoretical perspectives, the presence of more a precise ANS representation of number magnitude for those higher in autistic traits would lead to the hypothesis that such individuals should show reduced distance effects. Such a result would also be in line with the enhanced use of direct look-up of comparison facts within a DSS representational framework. The presence of a more precise ANS representation of number magnitude for those higher in autistic traits would lead to the hypothesis that such individuals should also show reduced size effects. According to the DSS representational account, on the other hand, no differences in the size of this effect would be expected for those higher and lower in autistic traits given that the relative frequency of smaller and larger numbers in the learning environment should be similar across individuals.
2. Methods
2.1. Participants
Participants were recruited from the Carleton University Psychology Participant Pool. Participants received course credit for their participation. In total, 463 (Mage = 19.63, SD = 4.00; 66.38% female) volunteers participated in the current study. The study was approved by the Carleton University Research Ethics Board (Protocol #110433). All participants completed an informed consent form. The experiment was programmed in the online platform Gorilla (i.e., Anwyl-Irvine et al., 2020 [42]). Data collection for the experiments took place between September 2021 and November 2022.
2.2. Measures
2.2.1. Demographic Form
Demographic information was collected, including academic major (categorized as STEM or non-STEM), biological sex (female, male, or other), age (continuous variable), handedness, and language background. Academic major was operationalized based on primary disciplinary domain: STEM included formal and natural sciences (e.g., Computer Science, Engineering, Mathematics, Chemistry, Biology), whereas non-STEM included social, behavioral, cognitive, and human sciences, as well as humanities and business (e.g., Psychology, Cognitive Science, Neuroscience, Criminology, Business).
2.2.2. Numerical Comparison Task
The numerical comparison task involved the presentation of pairs of single digits from 1 to 9 to the left and right of the center of a computer screen. Participants had to indicate either which one was larger in magnitude (on some trials) or which one was smaller in magnitude (on other trials) by pressing left and right response keys on the computer keyboard. Given the digits 1–9, there were 8 pairs that were separated by 1 (e.g., [1,2], [2,3], etc.), 7 pairs that were separated by 2 (e.g., [1,3], [2,4], etc.), and 6 pairs that were separated by 3 (e.g., [1,4], [2,5], etc.). In each of four blocks of 84 trials, these 21 pairs were presented two times each (once in reverse order on the screen), with each form of the comparison (i.e., choosing the larger and choosing the smaller) queried randomly in an intermixed fashion within each block. A short practice block of 42 trials was presented before the first block. On each trial, the digit stimulus pair was presented until a response was made and trials were separated by 2 s (a 1 s blank screen and a 1 s “+” sign fixation point). In total, participants responded to 336 trials (excluding practice) for this task, and it was expected to take 20–25 min to complete. RT and accuracy performance for each participant were recorded.
For each individual, mean correct RT for each digit magnitude separation (i.e., 1, 2, and 3) was regressed against those distances. The linear slopes of those regressions were taken as an index of the size of the distance effect. Additionally, for a fixed digit separation of 1, mean correct RT was regressed against both centered pair magnitude (i.e., average of the two numbers of each pair) and centered pair magnitude squared (i.e., a quadratic component designed to account for any curvature in the size–RT relation). The linear slopes of those regressions were taken as an index of the size of the numerical size effect. Finally, for each individual, an overall measure of performance on the numerical comparison task was also calculated using the balanced integration score (BIS; [43]):
where zPC represents an individual’s standardized score on accuracy and zRT represents the standardized score of their mean RT on correct items.
BIS = zPC − zRT.
As prescribed by Liesefeld and Janczyk (2019) [43], overall accuracy and RT were standardized using the grand means for all participants along with the standard deviation of the mean accuracy and mean correct RTs across participants. The BIS is a balanced measure of RT and accuracy that is not dependent on what the task measures. It helps to increase statistical power and measures the combined effect of both RT and accuracy. Importantly, the BIS is not as sensitive to speed–accuracy trade-offs compared to other methods of combining RT and accuracy such as the inverse efficiency score (IES) and the linear integrated speed–accuracy score (LISAS; [43]).
2.2.3. The Autism-Spectrum Quotient (AQ; Baron-Cohen et al., 2001; [4])
The AQ is a measure designed to assess autistic traits in typically developing adults with normal intelligence. The AQ is composed of 50 items (26 of which are reverse scored) assessing five principal dimensions of autism spectrum conditions, namely Social Skills, Attention Switching, Attention to Detail, Imagination, and Communication rated on a 4-point Likert scale. In the current study, separate social (Social Skills, Communication, Imagination, and Attention Switching) and non-social (Attention to Detail) components were derived for correlational analyses based on theoretical work of Grove et al. (2015) [33]. To calculate the social component, the raw Likert scale scores of Social Skills, Communication, Imagination, and Attention Switching were summed.
2.2.4. The Systemizing Quotient (SQ-Short; Greenberg et al., 2018; [44])
The SQ is designed to measure systemizing tendencies involving an interest in understanding how things work or are structured. It is composed of 10 items (5 of which are reverse scored) each rated on a 4-point Likert scale. To calculate the SQ, the raw Likert scale scores were summed.
2.2.5. Addition Test
Participants also completed a brief addition test at the end of the session. In this test, answers to 20 two-digit addition problems (e.g., 28 + 13; taken from the paper-and-pencil Calculation Fluency Test developed by Sowinski et al., 2014; [45]) were shown with answers to be typed in the corresponding text boxes. Before starting the test, participants were asked to solve a couple of practice problems and the test was not time-limited here. The total number of accurate answers across all the addition problems was considered as the total score of the test.
2.3. Data Screening
2.3.1. Numerical Comparison Task
In the initial RT filtering, RTs between 200 ms and 5000 ms were filtered along with all correct RTs not more than 3 SDs from the mean RT of each individual participant. Subsequently, all participants with an accuracy of ≥55.4% were included in the analysis (i.e., 0.50 + 2 × [0.5 (0.5)/336]1/2), which is 2 SDs above chance responding. After 25 participants were dropped, RT outliers were checked. Individuals having mean RTs on the numerical comparison task with z-scores higher than +3 or lower than −3 were dropped from the analysis, with 5 participants meeting this criterion. Separate slopes corresponding to the distance effect and size effect were then calculated for each remaining individual. After computing slopes, outliers were checked with respect to z-scores of greater than +3 and less than −3. Of the remaining cases, 5 for the distance effect (leaving 428 distance slopes) and 7 for the size effect (leaving 426 size slopes) met this criterion. Accordingly, their data were treated as empty cells in the dataset. Mean accuracy on the numerical comparison task for the remaining participants was 0.911 (SD = 0.07). Overall task performance was also computed for each of the individuals who had slope data for the distance effect using the following formula: BIS = zPC − zRT. Seven cases that had BIS values more than 3 SDs below the mean were dropped, leaving BIS values for 421 participants.
2.3.2. The AQ
First, participants with either totally incomplete AQ data or having >10% missing observations for the AQ were identified and excluded from the dataset (N = 7). Second, all remaining missing item values were imputed using the expectation–maximization (EM) procedure in SPSS version 28. Third, careless responses were checked using three methods, namely AQ completion times, responders’ SDs (with smaller values indicating overly consistent responding), and responders’ Mahalanobis distances (indicating multivariate outliers) [46]. Twenty-eight participants were dropped due to fast completion times and 18 participants were excluded from the analysis due to being high multivariate outliers. In total, AQ data were retained for 410 participants.
2.3.3. The SQ
First, participants with either totally incomplete SQ data or having >10% missing observations for the SQ were identified and excluded from the dataset (N = 9). Second, all remaining missing item values were imputed using the expectation–maximization (EM) procedure in SPSS version 28. Third, careless responses were checked using three methods, namely SQ completion times, responder’s SDs (indicating overly consistent responding when small), and responders’ Mahalanobis distances (indicating multivariate outliers) [46]. Thirty-two participants were dropped due to fast completion times and nine participants were excluded from the analysis due to having very small SDs across the 10 SQ scale items. In total, SQ data were retained for 413 participants.
2.3.4. Addition Test
Twenty-eight participants with incomplete data for the addition test were identified and excluded from the dataset. Eleven participants with a total score below 10 out of 20 (i.e., more than 3 SDs below the mean) were excluded. In total, 424 participants contributed scores for this test.
2.4. Data Analysis
All analyses were performed in SPSS version 28. First, statistics for the numerical comparison task RTs and slope effects were reported. One-sample t-tests were used to compare mean slopes to 0, with significant results indicating the presence of the effect. Cohen’s d is reported to determine the corresponding effect sizes. A d value between 0.2 and 0.49 is regarded as a small effect size, a d value between 0.5 and 0.79 is regarded as a medium effect size, and a d value above 0.8 is regarded as a large effect size [47]. Bayes factors (BF01) are also computed here to examine the strength of the evidence for the hypothesis that mean slopes differ from 0. BFs assess the support for the null hypothesis versus the alternative hypothesis, with a value closer to 0 indicating more evidence for the alternative hypothesis. A BF of 1 indicates no evidence, with a BF of 1–1/3 indicating anecdotal evidence for the alternative hypothesis, a BF of 1/3–1/10 indicating moderate evidence, a BF of 1/10–1/30 indicating strong evidence, a BF of 1/30–1/100 indicating very strong evidence, and a BF of <1/100 indicating extreme evidence [48].
Split-half reliabilities for the distance and size slopes and RTs were also derived using Pearson correlations between values computed for a random split of each participant’s data. Pearson coefficients were transformed to the Spearman–Brown coefficient for test length adjustment according to the following formula:
r Spearman-Brown = 2r/(1 + r)
In this formula, r is the correlation coefficient between the halves [49]. The p-values reported in this study were based on the significance levels of the Pearson correlations. The reliability coefficients reported in this study were computed for the data of participants who were not screened out of the analyses.
For each variable, potential sex differences and differences between STEM and non-STEM participants were tested using independent group t-tests. Means (M), standard deviations (SD), and d effect sizes for significant effects were reported. Finally, the associations of the slope effects/numerical comparison task performance with autistic traits, systemizing, and addition test performance were tested using correlational analyses.
3. Results
3.1. Numerical Comparison Task
The mean correct RT was 786 ms (SD = 188). The mean RT observed in the current study was much longer than that observed in Banks et al.’s original study (1976; 587 ms) [19], which, however, involved comparisons of single digits to a standard of 5. The reliability of the numerical comparison task RT was 0.99, which was larger than in previous studies (e.g., 0.94 at Time 1 and 0.85 at Time 2 reported by Xu, 2018; [50]).
A significant effect of sex on RT was observed, t (418) = 3.304, p = 0.001, d = 0.34. Mean RT on the numerical comparison task was faster for males (M = 742, SD = 170) compared to females (M = 806, SD = 191). A significant effect of STEM vs. non-STEM academic major on RT was also observed, t (414) = 2.006, p = 0.045, d = 0.26. Mean RT for STEM participants was faster in (M = 745, SD = 168) compared to non-STEM participants (M = 795, SD = 192).
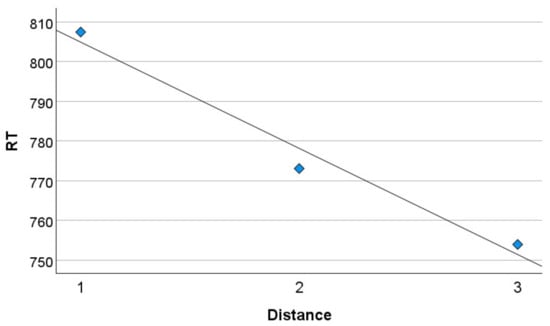
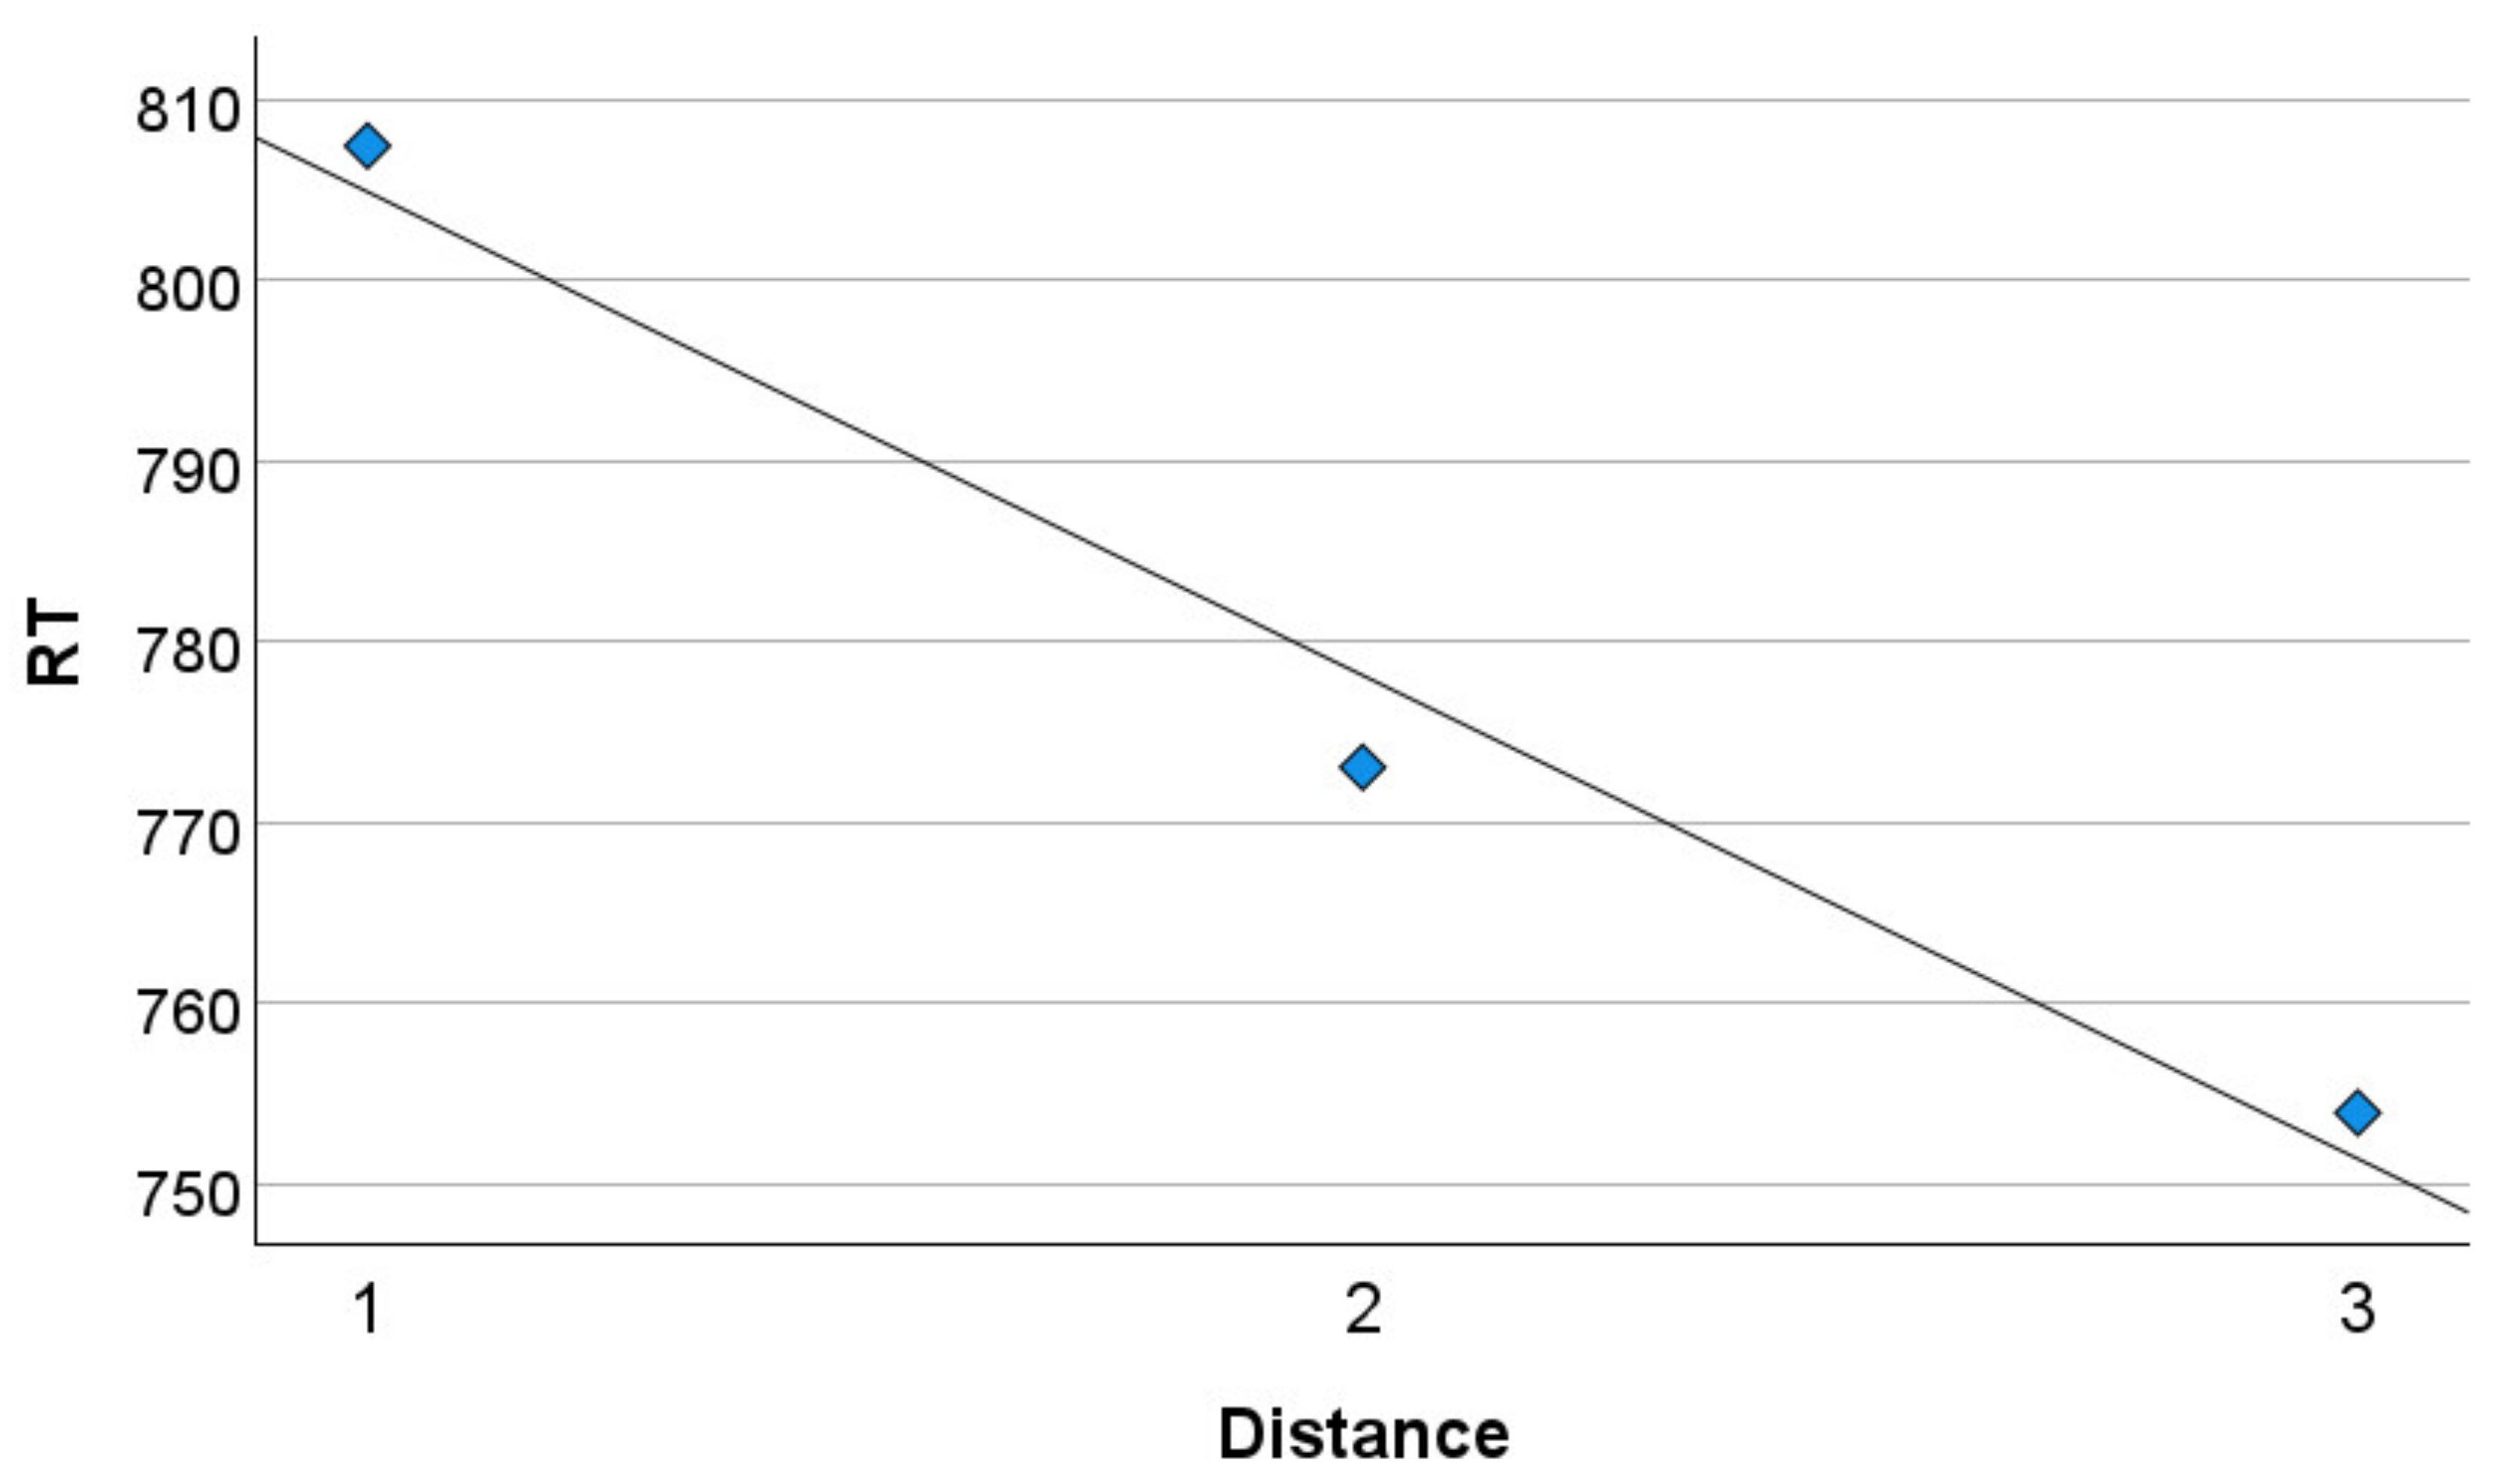
Distance and size effects (Table 1) were calculated from the RT data obtained in the numerical comparison task. Very strong evidence for a large effect size (d = −1.09) for the distance effect was found, indicating faster responses to number pairs that have more numerical distance compared to number pairs that have less numerical distance (see Figure 1). A total of 91.6% of the participants exhibited negative distance slopes, which was comparable with Hohol et al.’s study (2020), which reported 91% negative slopes [51]. These results indicate the presence of a robust distance effect in the current sample.
Table 1.
Descriptive statistics for the numerical processing slopes.
Figure 1.
Overall distance effect in the final sample of participants. Note: Mean reaction time (RT, in milliseconds) is shown for numerical pairs with distances of 1, 2, and 3.
A significant effect of sex on the distance effect was observed, t (418) = 4.982, p < 0.001, d = 0.52. Distance effects were smaller for males (M = −17.9, SD = 18.3) compared to females (M = −30.1, SD = 25.7). A significant effect of academic major on the distance effect was observed, t (414) = 2.293, p = 0.022, d = 0.30. Distance effects were smaller for STEM participants (M = −20.0, SD = 20.5) compared to non-STEM participants (M = −27.2, SD = 24.6).
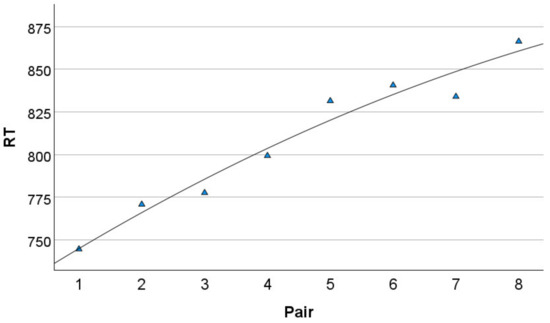
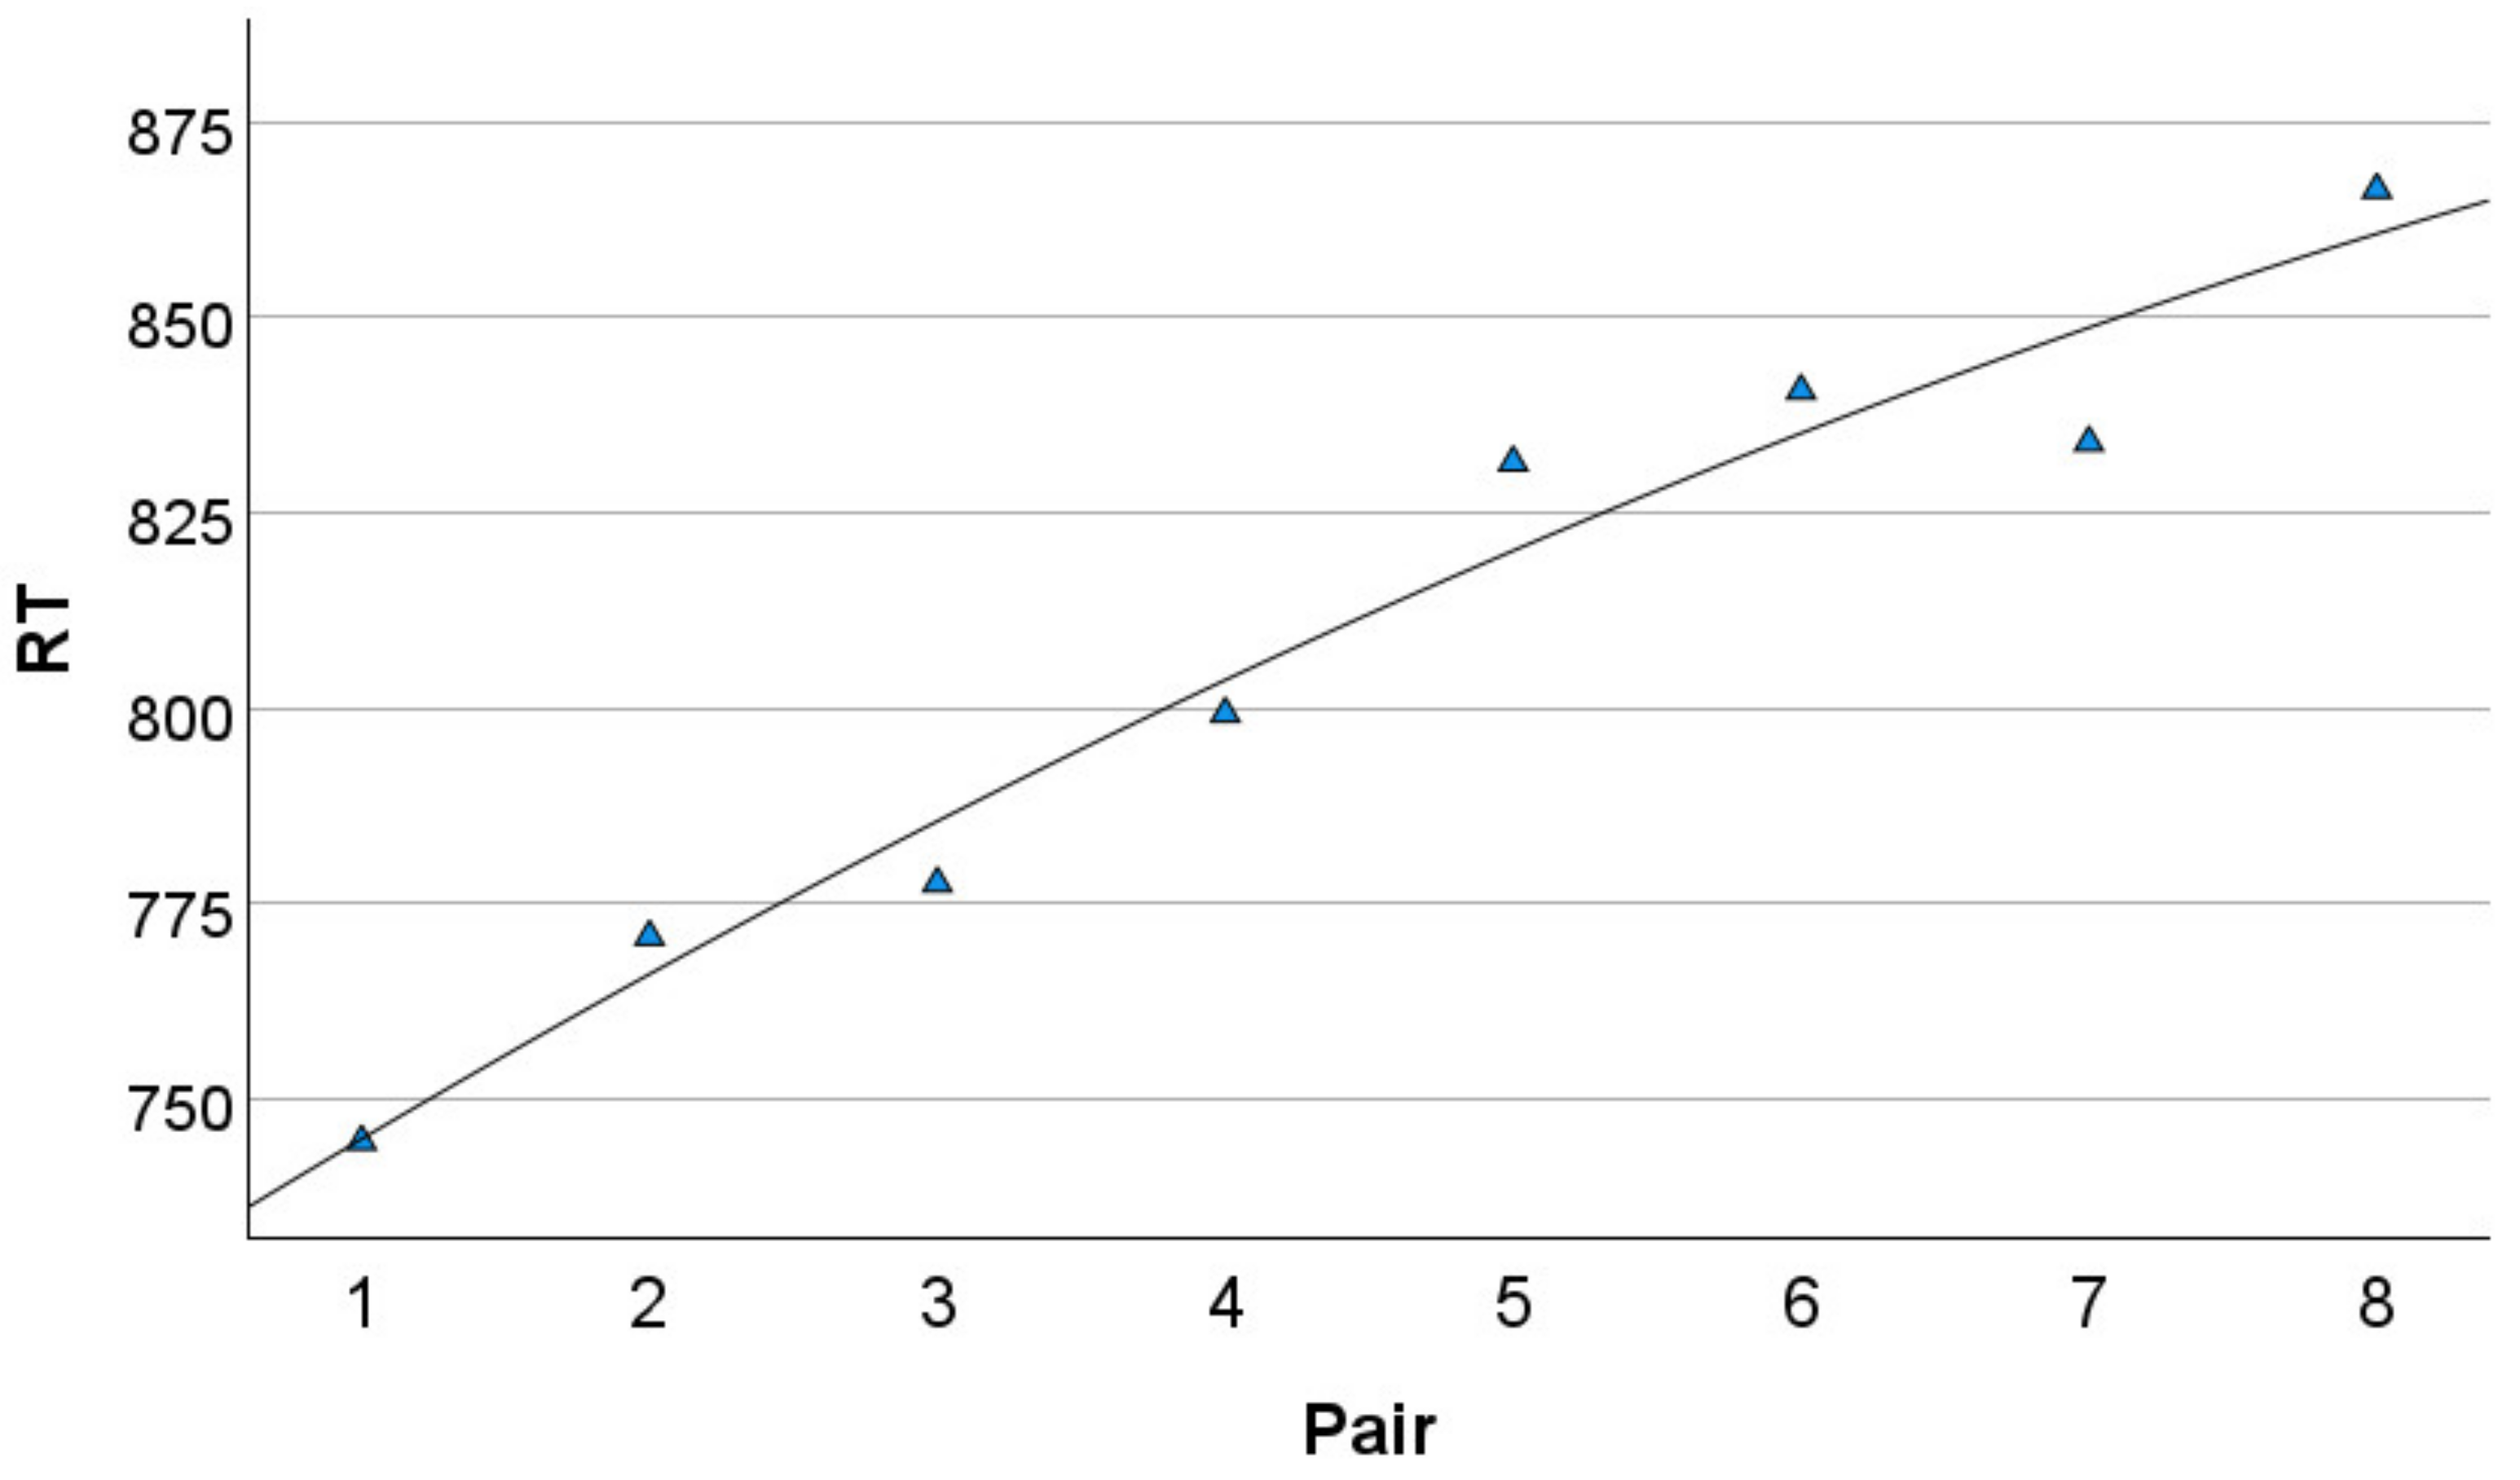
Regarding the size effect, there was very strong evidence for a large effect size (d = 1.06). Participants showed slower responses when comparing two larger numbers and faster responses when comparing two smaller numbers (see Figure 2). A total of 89.0% of the participants exhibited positive size slopes. The current study showed more consistent positive slopes for the size effect compared to Hohol et al.’s (2020) study [51], which reported only 29%. These results indicate the presence of a robust size effect in the current sample. The correlation between distance effect and size effect was also examined. Results showed that more negative distance slopes were associated with larger size effects (r = −0.207, p < 0.001, BF01 = 0.003).
Figure 2.
Overall size effect in the final sample of participants. Note: Mean reaction time (RT, in milliseconds) for each numerical pair as a function of pair size. The pair identifiers are the smallest digit in the pair (i.e., [1, 2], [2, 3], etc.).
A significant effect of sex on the size effect was observed, t (417) = 1.975, p = 0.049, d = 0.21. Size effects were smaller for males (M = 13.9, SD = 14.5) compared to females (M = 17.0, SD = 15.3). A significant effect of academic major on the size effect was observed, t (411) = 2.149, p = 0.032, d = 0.28. Size effects were smaller for STEM participants (M = 12.3, SD = 10.8) compared to non-STEM participants (M = 16.6, SD = 15.9).
Regarding the reliability of these slope effects, significant Spearman–Brown correlations of 0.526 and 0.385 were found for the distance and size effects, respectively. These correlation coefficients were statistically significant based on the frequentist approach (Table 2). Likewise, strong evidence against the null hypothesis was found according to the Bayes factors (Table 2). In line with these findings, Goffin and Ansari (2016) reported a reliability of 0.563 for the distance effect [52]. Also, Maloney et al. (2010) reported a reliability of 0.38 in their Experiment 1 but only 0.14 in their Experiment 2 (both of which employed distances of 1–4) [22]. Hohol et al. (2020) demonstrated a reliability of 0.84 for distance effects obtained in a single stimulus magnitude comparison task that involved comparing digits to a reference magnitude of 5 [51]. In that same study, Hohol et al. (2020) also reported a reliability of 0.70 for a numerical size effect that was obtained from that same single-stimulus magnitude comparison task (which was somewhat confounded with distance, though, given the nature of that task, i.e., each digit was always compared to 5) [51].
Table 2.
Reliability for the numerical processing slopes.
With respect to the BIS performance measure, results showed a significant main effect of sex on numerical comparison task BIS, t (412) = 2.706, p = 0.007, d = 0.28. The mean BIS for the numerical comparison task was higher in males (M = 0.349, SD = 1.25) than in females (M = −0.042, SD = 1.44). The effect of academic major on BIS was not significant.
3.2. The AQ
The mean total AQ score was 117.64 (SD = 14.15), with the mean scores for the Social Communication component and the Attention to Detail (non-Social) component being 90.50 (SD = 13.59) and 26.14 (SD = 4.10), respectively. The distribution of this scale approximated normality. No effects involving sex or academic major were significant. In contrast, most previous studies have reported higher mean AQ scores in males than in females [4,53,54], and Ruzich et al. (2015) reported that STEM students scored higher on the AQ compared to non-STEM students [54].
The AQ showed good reliability, with a Cronbach’s alpha coefficient of 0.83. This reliability coefficient was higher than those reported in previous studies. For example, a comprehensive psychometric study by English et al. (2020) showed a Cronbach’s alpha coefficient of 0.69 for the 50-item AQ scale in a sample of undergraduate students [55]. The reliability coefficient for the AQ Attention to Detail subscale was 0.61, which was comparable to that of previous studies. For instance, Hoekstra et al. (2008) reported an alpha of 0.63 and 0.68 for this subscale in undergraduate students and the general population, respectively [56]. The internal consistency for the aggregated Social Communication component (i.e., Social Skills, Communication, Imagination, and Attention Switching combined) was 0.86.
3.3. The SQ
The mean total SQ score was 24.67 (SD = 4.75). No significant effects involving sex or academic major were observed for SQ. The distribution of this scale approximated normality. The SQ showed a Cronbach’s alpha coefficient of 0.654. SQ scores were correlated with the AQ Attention to Detail component (r = 0.348, p < 0.001, BF01 = 3.3988 × 10⁻¹⁰), but not with the Social Communication component (r = −0.004, p = 0.934, BF01 = 24.735).
3.4. Arithmetic Test
Mean accuracy on the arithmetic test was 95.5%. No significant effects of sex or academic major were found. The arithmetic accuracy distribution was negatively skewed.
3.5. The Relation Between Autistic Traits, Arithmetic, and Numerical Comparison Task Performance/Effects
A set of bivariate correlations was performed, as shown in Table 3. No evidence for an association between either the distance or size effects and autistic traits, systemizing, or addition task performance was found. Similarly, the BIS for the numerical comparison task was not associated with autistic traits, systemizing, or addition task performance. Moreover, supplementary interaction analyses examining whether the findings may differ across the biological sexes did not reveal any significant moderation effects.
Table 3.
Bivariate correlations between numerical comparison slope effects/performance, autistic traits, systemizing, and the addition test.
4. Discussion
The current study aimed to examine the relations between autistic traits and numerical comparison effects in an online experiment using the Gorilla platform. Findings revealed that the RTs for the numerical comparison task were highly reliable and somewhat longer than those reported previously in the lab. The longer RTs obtained in this study could have been due to different factors. It has been noted by researchers that RTs are generally longer in online experiments compared to in-lab experiments [57]. Internet speed [42] and the transmission speed between the participant and the server could explain long RTs in online experiments [57,58]. Participants may also have other webpages or folders open, which may lead to increased processing load and lower levels of consistency for RT recording [42]. Additionally, computer/laptop hardware can contribute to RT recording. For example, having a gaming computer (e.g., high CPU, GPU, and RAM) is more appropriate for collecting data [42]. Moreover, the lack of supervision that occurs in online studies may also impact the results, especially with respect to participants’ attention and motivation.
As expected, in the numerical comparison task, a significant distance effect was found, indicating that RTs were faster for number pairs with a greater numerical distance compared to those with less numerical distance. In simpler terms, as the numerical distance increases, the time it takes to compare numbers decreases. This finding has been replicated in numerous other studies [22,52]. Moreover, a significant numerical size effect was observed, indicating that participants had slower RTs when comparing two large numbers and faster RTs when comparing two small numbers [20]. Both the distance and size effects were larger for females compared to males and for STEM compared to non-STEM participants. Accordingly, the current findings provide evidence for the possibility that individuals who have likely had more exposure to symbolic numbers (i.e., males and STEM majors) have an enhanced ability to access and use numerical magnitude information.
Additionally, there was evidence for a relation between the numerical distance and size effects. That is, larger distance effects (i.e., faster RTs for larger distances and slower RTs for smaller distances) tended to go with larger numerical size effects (i.e., faster RTs for small digits and slower RTs for larger digits), suggesting the possibility that there are some potential common mechanisms underlying these comparison effects. Note that relations between the distance and size effects might have been expected given that size effects could be regarded as being conceptually comparable to distance effects if a logarithmic compression of the mental number line is assumed. One caveat regarding the above results is that, among the two available studies that have measured and correlated both distance and size effects in numerical comparison, no significant associations between the two effects have been found [25,51]. Importantly, though, the lack of such a relation was regarded in both studies as inconsistent with the view that both arise from mental number line processing but also implying that each effect may derive from different mechanisms consistent with a discrete semantic system (DSS) view of the processing that underlies each effect (i.e., semantic relatedness and exposure frequency, respectively) [25]. That is, if there was no relationship between the distance and size effects, the DSS view would be plausible. However, the presence of a small relation between these two effects here sits in contrast to this view.
Regarding the relation between the numerical comparison effects/performance and autistic traits and arithmetic performance that was the key focus of the current work, no evidence of a relation between any of the numerical comparison slopes or overall performance (i.e., BIS) measures with either the Attention to Detail or the Social Communication component of the AQ, the SQ, or arithmetic performance was found. Moreover, given the BF values, these results appear to reflect real null effects rather than Type II errors.
With respect to the initial hypotheses, the presence of a more precise ANS representation of number magnitude for those higher in autistic traits was expected to lead to both reduced distance and size effects for such individuals. Hence, these hypotheses were not supported. On the other hand, reductions in the size of these two effects as a function of higher levels of autistic traits were not expected according to the DSS framework. One caveat was that when the processing within this framework is accompanied by the direct look-up of numerical comparison facts, a diminished distance effect would have been expected, which did not occur. Hence, the lack of an association of autistic traits with the two numerical effects of concern provided more support for the DSS account of the symbolic comparison process than for the ANS account.
One potential explanation for the null findings could also be that autistic traits in the general population may not map directly onto the cognitive mechanisms underlying symbolic numerical comparison. Although both the literature and theories/models of autism emphasize enhanced local processing [29], attention to detail/systemizing [9], and more precise perceptual representations [40], these characteristics may not necessarily be linked to the rapid retrieval of symbolic numerical magnitude required for basic number comparison. Instead, they may be more relevant to other aspects of mathematical cognition, such as rule-based reasoning, complex problem solving, or non-symbolic numerical processing, with further research needed in order to clarify these possibilities. Alternatively, the theoretical mechanisms proposed here may be more pronounced in individuals with clinically diagnosed ASD than in the general population, where autistic traits are distributed dimensionally and may not be sufficiently associated with basic numerical processing.
Nonetheless, it should also be acknowledged that the degree of measurement error in these two slope effects as indexed by their split-half reliabilities (α = 0.526 and 0.385 for the distance and size effects, respectively) may have attenuated the size of the associations observed here. Such attenuation would have reduced the sensitivity available to detect small, but still theoretically meaningful, effects. Even so, these slope measurements were sensitive enough to demonstrate significant differences across both sex and academic major.
An additional consideration is the fact that previous studies involving numerical abilities in ASD have focused on children, whereas adults were examined in the present study. Hence, developmental differences may contribute to any discrepancies, as numerical abilities in ASD may vary across developmental stages and task demands. Consistent with this possibility, previous studies in children with ASD have reported heterogeneous patterns, including preserved symbolic numerical processing [39,40] and differences in the contribution of symbolic and non-symbolic skills to mathematical performance [41].
Results also showed that the total arithmetic score was not associated with any autism-related traits. This finding challenges the assumption that individuals on the autism spectrum inherently possess superior mathematical skills. Nonetheless, the current result does not claim that some individuals with autistic traits cannot excel in arithmetic or other mathematical fields. Indeed, several studies conducted among children indicate that individuals with ASD perform better in mathematical tasks [8,9]. Nevertheless, it is crucial to understand that such abilities may not be a default trait of autism, but rather a personal attribute of some individuals within the spectrum. The current finding is mostly consistent with the review conducted by Chiang and Lin (2007) [7]. They showed that the mean mathematics score among high-functioning autistic students tended to fall within the average range [7].
Limitations
There were limitations in the current study. First, the current work was conducted online due to the COVID-19 pandemic. Hence, environmental noise was not directly controlled while participants performed the tasks. That is, it could have been a factor leading to the small reliability for the slope effects that was observed. However, a 6-point Likert scale (from “silent” to “extremely noisy”) was included to assess the environmental noise by the participants. To test the effect of the environmental noise, partial correlations controlling for this scale were performed. No changes in correlations were observed.
Second, because the questionnaire set was completed after the numerical task (which was also accompanied by two other number tasks that were relevant to other work), it is possible that fatigue or boredom may have contaminated the responding to the questionnaire items. However, great care was taken here to identify and drop any potential careless responders. Although it would have been possible to have the questionnaires responded to before the numerical task, it was felt that doing so may induce demand characteristics such that the participants could try to guess what the study is about and respond to the numerical task accordingly.
Third, a Calculation Fluency Test was used to measure arithmetic performance, which required participants to perform double-digit addition. As this study was online, it was not possible to control whether participants may have used an external aid (e.g., calculator) to help with this task or not. Hence, future online studies of arithmetic ability should provide explicit instructions not to use such devices and also add an item afterward probing whether such assistance was used.
Fourth, the sample of the present study was undergraduate students who are assumed to know basic arithmetic. This relatively homogeneous educational background may have restricted variability in arithmetic ability, potentially attenuating associations between numerical processing and arithmetic performance. In addition, participants were relatively young (mean age = 19.63 years), and the sample had an unequal distribution of sexes. Such limitations could restrict the extent to which the present findings can be generalized. Accordingly, future studies should consider samples with more diverse educational backgrounds, ages, and a more balanced representation of sex.
Fifth, the current study used self-report questionnaires (AQ and SQ) to measure autistic traits and systemizing tendencies. Such questionnaires capture broad behavioral characteristics rather than the specific cognitive traits that may underlie numerical comparison performance. Therefore, these measures may not fully reflect individual differences in numerical processing indexed by reaction time effects. Future studies could benefit from combining self-report measures with behavioral or neurocognitive assessments in order to better examine the relationships between autistic traits and domain-specific cognitive processes.
5. Conclusions
In conclusion, the present study replicated robust numerical distance and size effects, with both effects varying as functions of sex and academic major. However, neither autistic traits nor arithmetic performance was associated with numerical comparison effects or overall task performance. These findings do not support the predicted association between autistic traits and enhanced numerical magnitude processing and are broadly consistent with the DSS account of symbolic numerical comparison. Future research should examine more diverse samples beyond undergraduate student populations and consider including individuals with clinically diagnosed ASD to further clarify the relationship between autistic traits and numerical processing.
Author Contributions
Conceptualization, S.M.M.M.F. and C.L.-S.; methodology, S.M.M.M.F. and C.L.-S.; software, S.M.M.M.F. and C.L.-S.; validation, S.M.M.M.F. and C.L.-S.; formal analysis, S.M.M.M.F. and C.L.-S.; investigation, S.M.M.M.F.; resources, C.L.-S.; data curation, S.M.M.M.F. and C.L.-S.; writing—original draft preparation, S.M.M.M.F. and C.L.-S.; writing—review and editing, S.M.M.M.F. and C.L.-S.; visualization, S.M.M.M.F. and C.L.-S.; supervision, C.L.-S.; project administration. S.M.M.M.F. All authors have read and agreed to the published version of the manuscript.
Funding
This research received no external funding.
Institutional Review Board Statement
The study was conducted in accordance with the Declaration of Helsinki, and approved by the Carleton University Research Ethics Board (CUREB-B) (protocol code 110433) on 1 May 2019, with annual renewal reviews thereafter.
Informed Consent Statement
Informed consent was obtained from all subjects involved in the study.
Data Availability Statement
The data presented in this study are openly available in OSF at https://osf.io/5ux4y.
Acknowledgments
The content of this paper is derived from the first author’s Ph.D. dissertation at Carleton University.
Conflicts of Interest
The authors declare no conflict of interest.
References
- Stewart, M.E.; Griffiths, T.D.; Grube, M. Autistic Traits and Enhanced Perceptual Representation of Pitch and Time. J. Autism Dev. Disord. 2018, 48, 1350–1358. [Google Scholar] [CrossRef] [Scilit]
- Moshirian Farahi, S.M.M.; Leth-Steensen, C. Development of a novel, theoretically motivated scale to assess cognitive learning styles related to the autism spectrum. BMC Psychiatry 2022, 22, 696. [Google Scholar] [CrossRef] [Scilit]
- Stevenson, R.A.; Sun, S.Z.; Hazlett, N.; Cant, J.S.; Barense, M.D.; Ferber, S. Seeing the Forest and the Trees: Default Local Processing in Individuals with High Autistic Traits Does Not Come at the Expense of Global Attention. J. Autism Dev. Disord. 2018, 48, 1382–1396. [Google Scholar] [CrossRef] [Scilit]
- Baron-Cohen, S.; Wheelwright, S.; Skinner, R.; Martin, J.; Clubley, E. The Autism-Spectrum Quotient (AQ): Evidence from Asperger Syndrome/High-Functioning Autism, Males and Females, Scientists and Mathematicians. J. Autism Dev. Disord. 2001, 31, 5–17. [Google Scholar] [CrossRef] [Scilit]
- Gökçen, E.; Petrides, K.V.; Hudry, K.; Frederickson, N.; Smillie, L.D. Sub-threshold autism traits: The role of trait emotional intelligence and cognitive flexibility. Br. J. Psychol. 2014, 105, 187–199. [Google Scholar] [CrossRef] [Scilit]
- Reed, P.; Lowe, C.; Everett, R. Perceptual learning and perceptual search are altered in male university students with higher Autism Quotient scores. Pers. Individ. Dif. 2011, 51, 732–736. [Google Scholar] [CrossRef] [Scilit]
- Chiang, H.-M.; Lin, Y.-H. Mathematical ability of students with Asperger syndrome and high-functioning autism. Autism 2007, 11, 547–556. [Google Scholar] [CrossRef] [Scilit]
- Jones, C.R.G.; Happé, F.; Golden, H.; Marsden, A.J.S.; Tregay, J.; Simonoff, E.; Pickles, A.; Baird, G.; Charman, T. Reading and arithmetic in adolescents with autism spectrum disorders: Peaks and dips in attainment. Neuropsychology 2009, 23, 718–728. [Google Scholar] [CrossRef] [Scilit]
- Iuculano, T.; Rosenberg-Lee, M.; Supekar, K.; Lynch, C.J.; Khouzam, A.; Phillips, J.; Uddin, L.Q.; Menon, V. Brain Organization Underlying Superior Mathematical Abilities in Children with Autism. Biol. Psychiatry 2014, 75, 223–230. [Google Scholar] [CrossRef] [Scilit]
- Tonizzi, I.; Usai, M.C. Math abilities in autism spectrum disorder: A meta-analysis. Res. Dev. Disabil. 2023, 139, 104559. [Google Scholar] [CrossRef] [Scilit]
- Cirino, P.T.; Tolar, T.D.; Fuchs, L.S.; Huston-Warren, E. Cognitive and numerosity predictors of mathematical skills in middle school. J. Exp. Child. Psychol. 2016, 145, 95–119. [Google Scholar] [CrossRef] [Scilit]
- Merkley, R.; Ansari, D. Why numerical symbols count in the development of mathematical skills: Evidence from brain and behavior. Curr. Opin. Behav. Sci. 2016, 10, 14–20. [Google Scholar] [CrossRef] [Scilit]
- Lyons, I.M.; Ansari, D. Foundations of Children’s Numerical and Mathematical Skills: The Roles of Symbolic and Nonsymbolic Representations of Numerical Magnitude. In Advances in Child Development and Behavior; Benson, J.B., Ed.; Elsevier: Amsterdam, The Netherlands, 2015; pp. 93–116. [Google Scholar] [CrossRef] [Scilit]
- Oliveira Lde, F.S.; Júlio-Costa, A.; dos Santos, F.C.; Carvalho, M.R.S.; Haase, V.G. Numerical Processing Impairment in 22q11.2 (LCR22-4 to LCR22-5) Microdeletion: A Cognitive-Neuropsychological Case Study. Front. Psychol. 2018, 9, 2193. [Google Scholar] [CrossRef] [Scilit]
- Siegler, R.S.; Braithwaite, D.W. Numerical Development. Annu. Rev. Psychol. 2017, 68, 187–213. [Google Scholar] [CrossRef] [Scilit]
- De Smedt, B.; Noël, M.-P.; Gilmore, C.; Ansari, D. How do symbolic and non-symbolic numerical magnitude processing skills relate to individual differences in children’s mathematical skills? A review of evidence from brain and behavior. Trends Neurosci. Educ. 2013, 2, 48–55. [Google Scholar] [CrossRef] [Scilit]
- Cipora, K.; He, Y.; Nuerk, H. The spatial–numerical association of response codes effect and math skills: Why related? Ann. N. Y. Acad. Sci. 2020, 1477, 5–19. [Google Scholar] [CrossRef] [Scilit]
- Schneider, M.; Beeres, K.; Coban, L.; Merz, S.; Schmidt, S.S.; Stricker, J.; De Smedt, B. Associations of non-symbolic and symbolic numerical magnitude processing with mathematical competence: A meta-analysis. Dev. Sci. 2017, 20, e12372. [Google Scholar] [CrossRef] [Scilit]
- Banks, W.P.; Fujii, M.; Kayra-Stuart, F. Semantic congruity effects in comparative judgments of magnitudes of digits. J. Exp. Psychol. Hum. Percept. Perform. 1976, 2, 435–447. [Google Scholar] [CrossRef]
- Verguts, T.; Fias, W.; Stevens, M. A model of exact small-number representation. Psychon. Bull. Rev. 2005, 12, 66–80. [Google Scholar] [CrossRef] [Scilit]
- Holloway, I.D.; Ansari, D. Mapping numerical magnitudes onto symbols: The numerical distance effect and individual differences in children’s mathematics achievement. J. Exp. Child. Psychol. 2009, 103, 17–29. [Google Scholar] [CrossRef] [Scilit]
- Maloney, E.A.; Risko, E.F.; Preston, F.; Ansari, D.; Fugelsang, J. Challenging the reliability and validity of cognitive measures: The case of the numerical distance effect. Acta Psychol. 2010, 134, 154–161. [Google Scholar] [CrossRef] [Scilit]
- Dietrich, J.F.; Huber, S.; Moeller, K.; Klein, E. The influence of math anxiety on symbolic and non-symbolic magnitude processing. Front. Psychol. 2015, 6, 1621. [Google Scholar] [CrossRef] [Scilit]
- Krajcsi, A.; Szűcs, T. Symbolic number comparison and number priming do not rely on the same mechanism. Psychon. Bull. Rev. 2022, 29, 1969–1977. [Google Scholar] [CrossRef] [Scilit]
- Krajcsi, A.; Kojouharova, P. Symbolic Numerical Distance Effect Does Not Reflect the Difference between Numbers. Front. Psychol. 2017, 8, 2013. [Google Scholar] [CrossRef] [Scilit]
- Reike, D.; Schwarz, W. One model fits all: Explaining many aspects of number comparison within a single coherent model—A random walk account. J. Exp. Psychol. Learn. Mem. Cogn. 2016, 42, 1957–1971. [Google Scholar] [CrossRef] [Scilit]
- Krajcsi, A.; Kojouharova, P.; Lengyel, G. Processing Symbolic Numbers: The Example of Distance and Size Effects. In A Life in Cognition: Studies in Cognitive Science in Honor of Csaba Pléh; Gervain, J., Csibra, G., Kovács, K., Eds.; Springer International Publishing: Cham, Switzerland, 2022; pp. 379–394. [Google Scholar] [CrossRef] [Scilit]
- Soulières, I.; Hubert, B.; Rouleau, N.; Gagnon, L.; Tremblay, P.; Seron, X.; Mottron, L. Superior estimation abilities in two autistic spectrum children. Cogn. Neuropsychol. 2010, 27, 261–276. [Google Scholar] [CrossRef] [Scilit]
- Meaux, E.; Taylor, M.J.; Pang, E.W.; Vara, A.S.; Batty, M. Neural substrates of numerosity estimation in autism. Hum. Brain Mapp. 2014, 35, 4362–4385. [Google Scholar] [CrossRef] [Scilit]
- Baron-Cohen, S.; Ashwin, E.; Ashwin, C.; Tavassoli, T.; Chakrabarti, B. Talent in autism: Hyper-systemizing, hyper-attention to detail and sensory hypersensitivity. Philos. Trans. R. Soc. B Biol. Sci. 2009, 364, 1377–1383. [Google Scholar] [CrossRef] [Scilit]
- Baron-Cohen, S. The hyper-systemizing, assortative mating theory of autism. Prog. Neuropsychopharmacol. Biol. Psychiatry 2006, 30, 865–872. [Google Scholar] [CrossRef] [Scilit]
- Bressan, P. Systemisers are better at maths. Sci. Rep. 2018, 8, 11636. [Google Scholar] [CrossRef] [Scilit]
- Grove, R.; Baillie, A.; Allison, C.; Baron-Cohen, S.; Hoekstra, R.A. Exploring the quantitative nature of empathy, systemising and autistic traits using factor mixture modelling. Br. J. Psychiatry 2015, 207, 400–406. [Google Scholar] [CrossRef] [Scilit]
- Morsanyi, K.; Primi, C.; Handley, S.J.; Chiesi, F.; Galli, S. Are systemizing and autistic traits related to talent and interest in mathematics and engineering? Testing some of the central claims of the empathizing–systemizing theory. Br. J. Psychol. 2012, 103, 472–496. [Google Scholar] [CrossRef] [Scilit]
- Escovar, E.; Rosenberg-Lee, M.; Uddin, L.Q.; Menon, V. The Empathizing-Systemizing Theory, Social Abilities, and Mathematical Achievement in Children. Sci. Rep. 2016, 6, 23011. [Google Scholar] [CrossRef] [Scilit]
- Wakabayashi, A.; Baron-Cohen, S.; Wheelwright, S. Individual and gender differences in Empathizing and Systemizing: Measurement of individual differences by the Empathy Quotient (EQ) and the Systemizing Quotient (SQ). Jpn. J. Psychol. 2006, 77, 271–277. [Google Scholar] [CrossRef] [Scilit]
- Hiniker, A.; Rosenberg-Lee, M.; Menon, V. Distinctive Role of Symbolic Number Sense in Mediating the Mathematical Abilities of Children with Autism. J. Autism Dev. Disord. 2016, 46, 1268–1281. [Google Scholar] [CrossRef] [Scilit]
- Aagten-Murphy, D.; Attucci, C.; Daniel, N.; Klaric, E.; Burr, D.; Pellicano, E. Numerical Estimation in Children With Autism. Autism Res. 2015, 8, 668–681. [Google Scholar] [CrossRef] [Scilit]
- Bejarano-Martín, Á.; Casado-Vara, R.; Magán-Maganto, M.; Díez, E.; Jenaro, C.; Flores, N.; Orrantia, J.; Canal-Bedia, R. Early numerical skills and mathematical domains in autistic students in primary school. Front. Psychiatry 2024, 15, 1509137. [Google Scholar] [CrossRef] [Scilit]
- Davis, G.; Plaisted-Grant, K. Low endogenous neural noise in autism. Autism 2015, 19, 351–362. [Google Scholar] [CrossRef] [Scilit]
- Qian, N.; Lipkin, R.M. A Learning-Style Theory for Understanding Autistic Behaviors. Front. Hum. Neurosci. 2011, 5, 77. [Google Scholar] [CrossRef] [Scilit]
- Anwyl-Irvine, A.L.; Massonnié, J.; Flitton, A.; Kirkham, N.; Evershed, J.K. Gorilla in our midst: An online behavioral experiment builder. Behav. Res. Methods 2020, 52, 388–407. [Google Scholar] [CrossRef] [Scilit]
- Liesefeld, H.R.; Janczyk, M. Combining speed and accuracy to control for speed-accuracy trade-offs(?). Behav. Res. Methods 2019, 51, 40–60. [Google Scholar] [CrossRef] [Scilit]
- Greenberg, D.M.; Warrier, V.; Allison, C.; Baron-Cohen, S. Testing the Empathizing–Systemizing theory of sex differences and the Extreme Male Brain theory of autism in half a million people. Proc. Natl. Acad. Sci. USA 2018, 115, 12152–12157. [Google Scholar] [CrossRef] [Scilit]
- Sowinski, C.; Dunbar, K.; LeFevre, J. Calculation Fluency Test; Math Lab, Carleton University: Ottawa, ON, Canada, 2014. [Google Scholar]
- Meade, A.W.; Craig, S.B. Identifying careless responses in survey data. Psychol. Methods 2012, 17, 437–455. [Google Scholar] [CrossRef] [Scilit]
- Lakens, D. Calculating and reporting effect sizes to facilitate cumulative science: A practical primer for t-tests and ANOVAs. Front. Psychol. 2013, 4, 863. [Google Scholar] [CrossRef] [Scilit] [PubMed]
- Srimaneekarn, N.; Leelachaikul, P.; Thiradilok, S.; Manopatanakul, S. Agreement test of P value versus Bayes factor for sample means comparison: Analysis of articles from the Angle Orthodontist journal. BMC Med. Res. Methodol. 2023, 23, 43. [Google Scholar] [CrossRef] [Scilit]
- Durrheim, K.; Tredoux, C. Numbers, Hypotheses & Conclusions: A Course in Statistics for the Social Sciences; Juta and Company Ltd.: Cape Town, South Africa, 2004. [Google Scholar]
- Xu, C. Knowledge of Number Integration. Doctoral Dissertation, Carleton University, Ottawa, ON, Canada, 2018. [Google Scholar]
- Hohol, M.; Willmes, K.; Nęcka, E.; Brożek, B.; Nuerk, H.-C.; Cipora, K. Professional mathematicians do not differ from others in the symbolic numerical distance and size effects. Sci. Rep. 2020, 10, 11531. [Google Scholar] [CrossRef] [Scilit]
- Goffin, C.; Ansari, D. Beyond magnitude: Judging ordinality of symbolic number is unrelated to magnitude comparison and independently relates to individual differences in arithmetic. Cognition 2016, 150, 68–76. [Google Scholar] [CrossRef] [Scilit]
- Broadbent, J.; Galic, I.; Stokes, M.A. Validation of Autism Spectrum Quotient Adult Version in an Australian Sample. Autism Res. Treat. 2013, 2013, 984205. [Google Scholar] [CrossRef] [Scilit]
- Ruzich, E.; Allison, C.; Smith, P.; Watson, P.; Auyeung, B.; Ring, H.; Baron-Cohen, S. Measuring autistic traits in the general population: A systematic review of the Autism-Spectrum Quotient (AQ) in a nonclinical population sample of 6,900 typical adult males and females. Mol. Autism 2015, 6, 2. [Google Scholar] [CrossRef] [Scilit]
- English, M.C.W.; Gignac, G.E.; Visser, T.A.W.; Whitehouse, A.J.O.; Maybery, M.T. A comprehensive psychometric analysis of autism-spectrum quotient factor models using two large samples: Model recommendations and the influence of divergent traits on total-scale scores. Autism Res. 2020, 13, 45–60. [Google Scholar] [CrossRef] [Scilit]
- Hoekstra, R.A.; Bartels, M.; Cath, D.C.; Boomsma, D.I. Factor Structure, Reliability and Criterion Validity of the Autism-Spectrum Quotient (AQ): A Study in Dutch Population and Patient Groups. J. Autism Dev. Disord. 2008, 38, 1555–1566. [Google Scholar] [CrossRef] [Scilit]
- Cipora, K.; Soltanlou, M.; Reips, U.-D.; Nuerk, H.-C. The SNARC and MARC effects measured online: Large-scale assessment methods in flexible cognitive effects. Behav. Res. Methods 2019, 51, 1676–1692. [Google Scholar] [CrossRef] [Scilit]
- Reips, U.-D. Standards for Internet-Based Experimenting. Exp. Psychol. 2002, 49, 243–256. [Google Scholar] [CrossRef] [Scilit]

Disclaimer/Publisher’s Note: The statements, opinions and data contained in all publications are solely those of the individual author(s) and contributor(s) and not of MDPI and/or the editor(s). MDPI and/or the editor(s) disclaim responsibility for any injury to people or property resulting from any ideas, methods, instructions or products referred to in the content. |
© 2026 by the authors. Licensee MDPI, Basel, Switzerland. This article is an open access article distributed under the terms and conditions of the Creative Commons Attribution (CC BY) license.