


Abstract
Background/Objectives: Phospholipase C zeta (PLCZ1; PLCζ) is a sperm-specific enzyme responsible for the Ca2+ oscillations required for oocyte activation, and altered PLCζ expression has been associated with fertilization failure in assisted reproductive technologies, particularly intracytoplasmic sperm injection (ICSI). This study aimed to develop and analytically validate a flow cytometry–based protocol for PLCζ quantification in human spermatozoa. Methods: The assay was established using normozoospermic samples and included validated positive and negative technical controls. Antibody specificity was confirmed by Western blot analysis. A defined gating strategy was used to assess linearity between fluorescence intensity and PLCζ expression. Analytical performance was evaluated for precision, reproducibility, stability, and sensitivity, including applicability to low sperm concentrations. Results: A linear relationship between fluorescence intensity and PLCζ expression was demonstrated. The assay showed high precision, reproducibility, and stability, with consistent results in samples stored up to 24 h at room temperature or up to one week post-fixation at 4 °C. Sensitivity testing confirmed suitability for low sperm concentrations. Conclusions: This work provides a standardized and analytically validated framework for PLCζ quantification using flow cytometry. Although the assay measures protein expression rather than functional competence or subcellular localization, it establishes a solid analytical basis for future studies to define clinically relevant PLCζ thresholds and assess its value as a biomarker of fertilization capacity.
1. Introduction
Infertility affects an estimated 8–12% of couples worldwide, with male factors contributing to 20–30% of cases [1,2]. Intracytoplasmic sperm injection (ICSI) is the most widely used assisted reproductive technology procedure and represents a gold-standard treatment for male infertility [3]. While ICSI achieves fertilization in most cases, total fertilization failure still occurs in 1–5% of cycles, often linked to oocyte activation deficiency (OAD) [4,5]. OAD is thought to account for ~40% of ICSI failures and remains one of the most challenging barriers in clinical practice [6,7].
The sperm-specific protein phospholipase C zeta (PLCζ) has been identified as the central factor responsible for triggering the Ca2+ oscillations that drive oocyte activation, meiosis resumption, and early embryo development [8,9]. Reduced or aberrant PLCζ expression and localization in sperm from infertile men have been consistently associated with fertilization failure [10,11]. Several studies further suggest that advanced paternal age, high sperm DNA fragmentation, and chromatin condensation defects may impair PLCζ function [12].
PLCζ research has experienced significant momentum in recent years. Landmark studies published in 2023–2024 have expanded our understanding of PLCζ beyond complete oocyte activation failure, demonstrating that PLCζ levels and localization patterns are prognostic biomarkers for fertilization success, embryo quality, and pregnancy outcomes across broader patient populations. Notably, a 2024 study by Kashir et al. showed for the first time that minimal PLCζ levels within specific threshold ranges are required for optimal early embryogenesis and successful pregnancy [11]. Additionally, recent work by Che et al. (2024) revealed that PLCζ deficiency not only contributes to ICSI failure but is also associated with polyspermy and low fertilization rates in conventional IVF [13], expanding the clinical relevance of PLCζ assessment beyond previously recognized patient groups with complete fertilization failure. These findings suggest that PLCζ evaluation may benefit not only patients with complete fertilization failure, but also the larger population of couples seeking fertility treatment, including those undergoing conventional IVF.
However, despite compelling evidence, a critical gap remains: no standardized, validated, and clinically applicable protocol currently exists to measure PLCζ in human sperm. To date, most investigations have relied on immunofluorescence, Western blotting, or experimental assays that are semi-quantitative, labor-intensive, and poorly reproducible across laboratories [7,14,15]. As a result, while PLCζ has strong potential as a biomarker of fertilization capacity, its translation into clinical practice has been severely limited.
The present study addresses this gap by developing and validating a robust, reproducible, and clinically adaptable flow cytometry-based method to quantify PLCζ in human sperm. Beyond demonstrating assay specificity, reproducibility, and stability, this protocol establishes the technical controls and performance metrics required for routine implementation in diagnostic laboratories. By providing the first standardized approach for PLCζ assessment, this work lays the foundation for transforming previous biological associations into a clinically actionable diagnostic tool that can guide individualized infertility treatment strategies.
2. Materials and Methods
2.1. Ethics
This study strictly followed ethical standards described in the 1964 Declaration of Helsinki and the ethical guidelines for studies in which human gametes or embryos are used as materials in Canada. The Tri-Agency Research Integrity Policy including policies from the Canadian Institutes of Health Research, the Natural Sciences and Engineering Research Council of Canada, and the Social Sciences and Humanities Research Council of Canada was applied with the governance of the Assisted Human Reproduction Act, S.C. 2004. This work did not involve interventional research or the recruitment of participants for experimental purposes. It focused exclusively on the improvement, verification, and analytical validation of a laboratory method using surplus sperm samples that were scheduled for disposal following routine clinical analysis. All participants provided informed, written consent authorizing the use of their surplus biological material for method validation purposes. No additional procedures were performed, and no clinical decisions or patient management were influenced by this research activity. In accordance with local regulations governing quality improvement and analytical method validation using anonymized surplus clinical material, formal Research Ethics Board approval was therefore not required.
2.2. Patients
Consenting patients consulting for infertility at Fertilys (Laval, QC, Canada) who underwent semen analysis were considered for this study. For validation purposes, only samples presenting normozoospermic parameters, as defined by the WHO 2021 reference values [16], were included. In accordance with routine clinical practice at our center, all samples also underwent assessment of sperm DNA fragmentation and chromatin decondensation, and only those with normal results for both parameters were retained. This ensured that the study population consisted exclusively of samples with globally normal sperm quality.
2.3. Semen Analysis
Eligible sperm samples were collected by masturbation following 2 to 7 days of sexual abstinence. After collection, the samples were liquified for at least 30 min and analyzed within one hour, in accordance with Fertilys’ standard operating procedures.
2.4. Flow Cytometry
Sperm PLCζ expression was quantified by flow cytometry. All wash steps were performed with phosphate-buffered saline (1× PBS) followed by centrifugation at 400× g for 10 min at RT. Six million sperm cells were washed and fixed in 3.7% formaldehyde for 30 min at room temperature (RT). Samples were then permeabilized for 4 min at 4 °C using 1% sodium citrate and 0.1% Triton X-100 in deionized water. Following washing, non-specific binding was blocked with 3% bovine serum albumin (MilliporeSigma, Oakville, ON, Canada) in PBS 1× for 1 h at RT. Spermatozoa were then incubated for 2 h at 4 °C with 5 µg/mL rabbit anti-human PLCZ1 antibody (Abcam, Cambridge, MA, USA). Cells were washed and incubated with 1 µg/mL FITC-conjugated goat anti-rabbit IgG (Abcam, Cambridge, MA, USA) for 1 h at RT in the dark. After two washes, samples were analyzed on a BD Accuri C6 flow cytometer (BD Biosciences, San Jose, CA, USA). For each sample, 30,000 events gated on spermatozoa were recorded. Instrument calibration was performed before each analysis using Spherotech 8-Peak Validation Beads (653144, BD Biosciences, San Jose, CA, USA). FITC-positive spermatozoa were evaluated at a flow rate below 100 µL/min.
Gating was applied to spermatozoa based on size and granularity, excluding debris and doublets. A threshold of 80,000 arbitrary units (a.u.) was set on the FSC axis to eliminate cellular debris. PLCζ expression was assessed using the FITC fluorescence channel. A positivity threshold of 1980 a.u. was defined based on linearity testing (see Section 3.3), allowing for discrimination between PLCζ-positive and PLCζ-negative spermatozoa. Cells exhibiting fluorescence above this threshold were classified as PLCζ-positive, whereas those below were considered negative. For all analyses, “% PLCζ” represents the proportion of spermatozoa exhibiting FITC fluorescence above this predefined threshold, after subtraction of background signal from unstained controls, and is expressed as the percentage of PLCζ-positive cells within the gated sperm population. Data were analyzed using BD Accuri C6 software (version 1.0.264.21; BD Biosciences, San Jose, CA, USA). A detailed step-by-step protocol for the PLCζ flow cytometry assay is provided in the Supplementary Materials (Supplementary Protocol S1).
2.5. SDS-PAGE and Western Blot
Human spermatozoa were provided by Fertilys (Laval, QC, Canada), while murine OP9-DL4 (Delta-like 4 Notch ligand) and ATDC5 cell lines were obtained from the Plateforme Reprogrammation, Centre de Recherche Azrieli du CHU Sainte-Justine (Montréal, QC, Canada). Both human spermatozoa and cultured cells (OP9-DL4 and ATDC5) were processed using the same protocol. Two million cells were resuspended in 250 µL SDS buffer (100 mM Tris-HCl, pH 7.6, 2% SDS, protease inhibitors; complete Tablets, Roche #04693132001, Mannheim, Germany) and lysed by sonication (Sonics Vibra Cell™, power 30%, 15 min total, 7 s on/3 s off). Lysates were cleared by centrifugation (13,000× g, 10 min, 4 °C), and protein concentrations were determined using a Bradford or BCA assay (Pierce™ BCA Protein Assay Kit, Thermo Scientific #23227, Waltham, MA, USA). Protein samples (20–60 µg) were mixed with 4× Laemmli sample buffer containing β-mercaptoethanol (Bio-Rad #1610747, Hercules, CA, USA) and heated at 95 °C for 10 min. Samples were separated on 4–20% SDS-PAGE gels (Novex™ 4–20% Tris-Glycine Plus WedgeWell™, Invitrogen XP04200BOX, Thermo Fisher Scientific, Waltham, MA, USA) and transferred onto PVDF membranes (Power Blotter, Invitrogen #PB9220, Thermo Fisher Scientific, Waltham, MA USA) at 100 V for 1 h. Membranes were blocked in 5% non-fat dry milk in TBS-T, washed, and incubated with primary antibodies: anti-PLCZ1 (1:500, Abcam #ab181816, Cambridge, MA, USA), anti-Pan-Actin (1:2000, Santa Cruz #sc4968, Dallas, TX, USA), anti-GAPDS (1:2000, Abcam #ab153802, Cambridge, MA, USA), anti-GAPDH (1:2000, Abcam #AM4300, Cambridge, MA, USA), and anti-Hsp90 (1:2000, BD Biosciences #610419, San Jose, CA, USA). Secondary antibodies included m-IgGκ BP-HRP (1:10,000, Santa Cruz #sc516102, Dallas, TX, USA) and mouse anti-rabbit IgG-HRP (1:10,000, Santa Cruz #sc-2357, Dallas, TX, USA). Bands were visualized using chemiluminescent substrates and imaged with a ChemiDoc MP system (Bio-Rad Laboratories, Hercules, CA, USA).
2.6. PLCζ Positive Control
HisPur Ni-NTA magnetic beads (ThermoFisher Scientific, Waltham, MA, USA) were used as a technical positive control to mimic PLCζ expression in sperm. These beads, with a mean diameter of 1 μm and high affinity for His-tagged proteins, were incubated with 50 µg/mL recombinant His-SUMO-tag PLCζ protein (Cederlane Laboratories, Burlington, ON, Canada) in equilibrium buffer (100 mM sodium phosphate, 600 mM sodium chloride, 0.05% Tween-20) for 1 h at RT with gentle vortex agitation every 10 min. Prior to incubation, beads were washed twice in equilibrium buffer according to the manufacturer’s protocol. After a final wash in PBS, they underwent the same staining procedure as sperm samples, beginning with blocking of non-specific binding. PLCζ expression was then quantified on 30,000 gated bead events using a BD Accuri C6 flow cytometer (BD Biosciences, San Jose, CA, USA).
2.7. PLCζ Negative Controls
Two technical negative controls were included in each analysis. First, each patient sample was divided in half at the start of staining: one half was processed without primary antibody, while the other was stained with both primary and secondary antibodies. This paired design ensured that each patient had an internal control to account for non-specific secondary antibody staining. Second, spermatozoa were treated with 0.1 mg/mL proteinase K (ThermoFisher Scientific, Waltham, MA, USA) for 1 h at 56 °C to digest cellular proteins before proceeding with the staining protocol.
2.8. Statistical Analysis
Normality was assessed with the Shapiro–Wilk test. For two-group paired comparisons (untreated vs. treated samples, antibody absorption controls, positive-control stability, proteinase K optimization, sample stability, and detection-limit assays), a paired Student’s t-test was applied when data were normally distributed, or the Wilcoxon signed-rank test when non-normal. For independent two-group comparisons, Welch’s t-test was used when normal and the Mann–Whitney U test when non-normal. Statistical analyses were performed using GraphPad Prism 9.2 (GraphPad Software, San Diego, CA, USA), and p-values < 0.05 were considered statistically significant.
3. Results
3.1. Anti-PLCZ1 Antibody Specificity
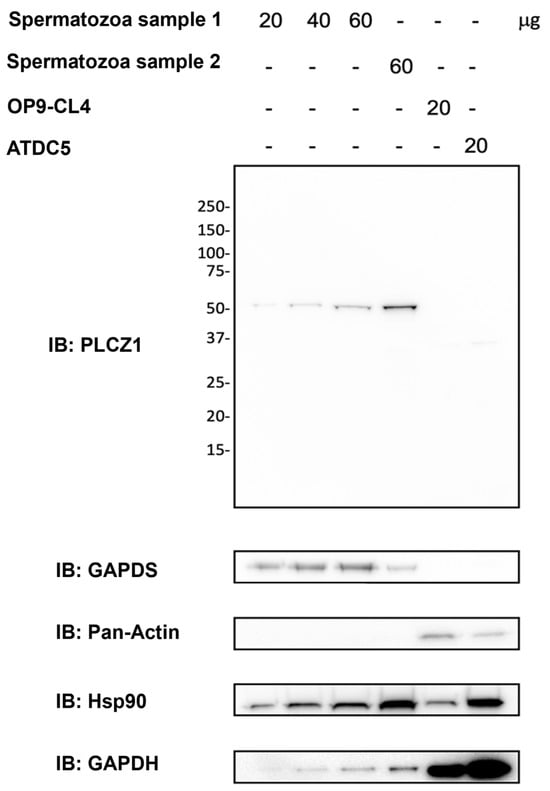
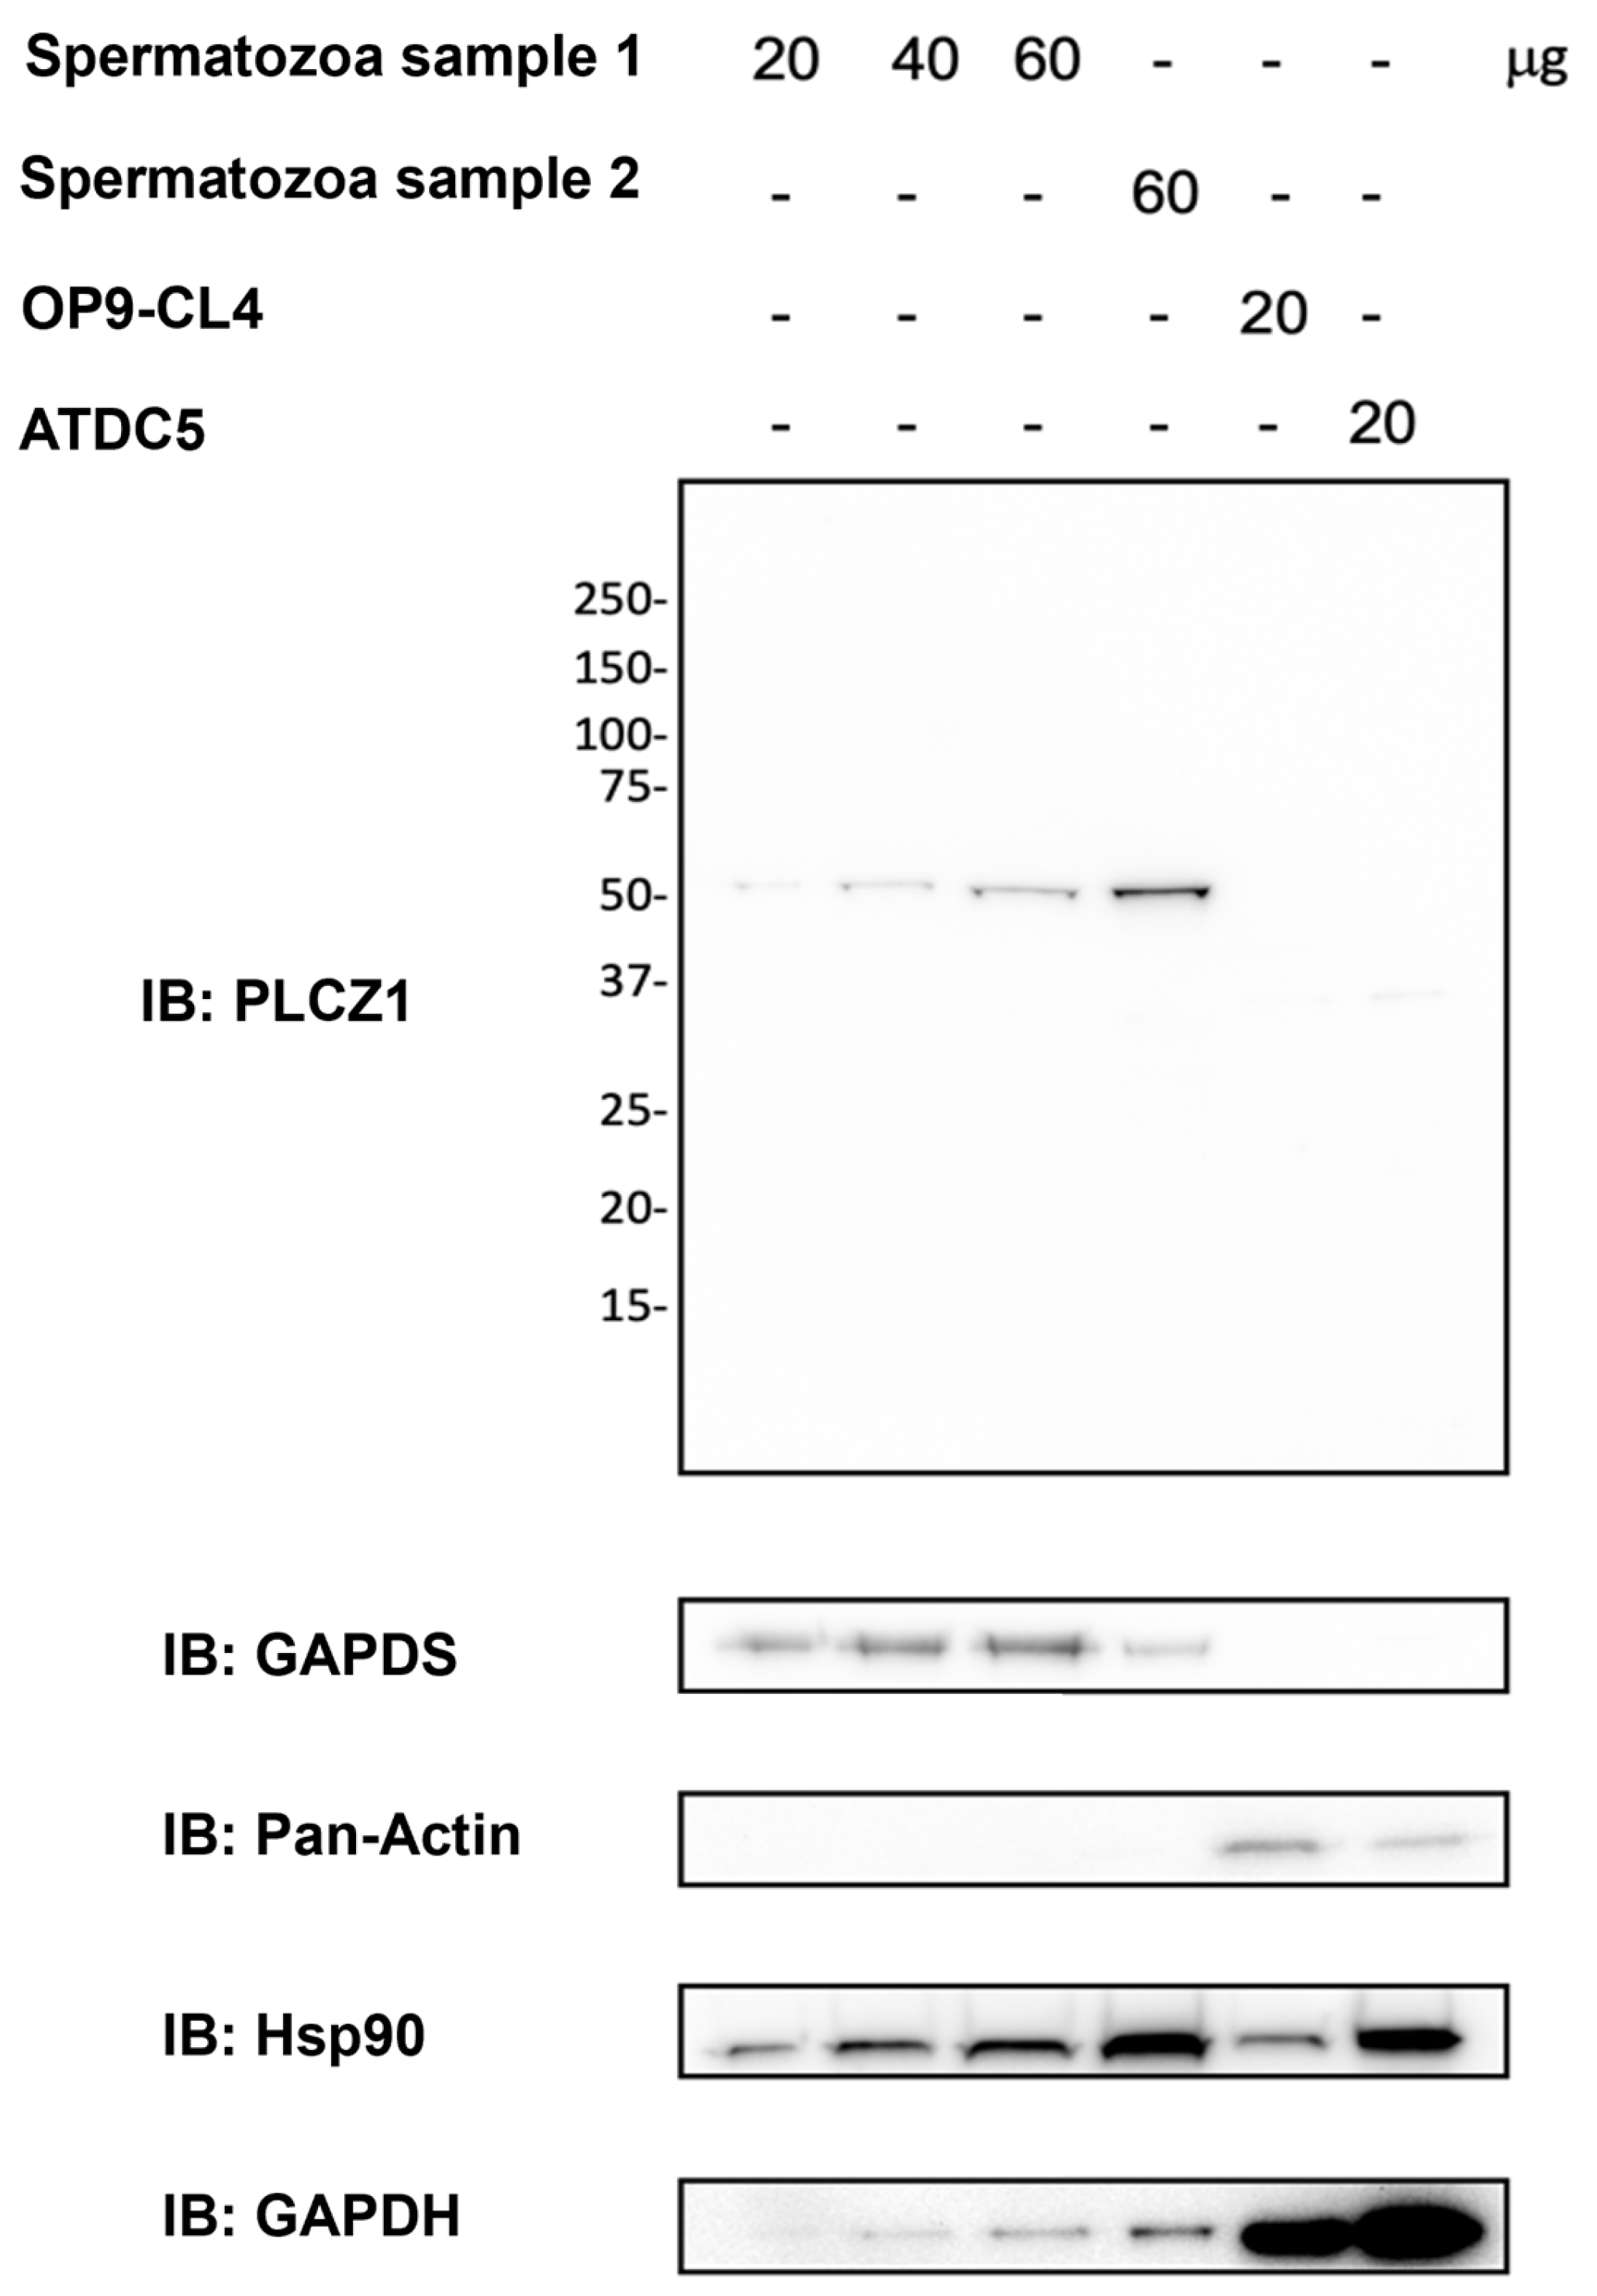
Western blot analysis supported antibody specificity, revealing a single band at approximately 60 kDa (Figure 1). To ensure appropriate interpretation, four control proteins were included. GAPDS, a sperm-specific glycolytic enzyme, confirmed the identity of the sperm samples and was detected only in spermatozoa. Pan-Actin, a cytoskeletal protein, served as a loading control for OP9-DL4 and ATDC5 cell lines, which do not express GAPDS, and was absent in sperm extracts. GAPDH, a glycolytic housekeeping enzyme, was detected in both sperm and murine cells and served as a general loading control. Hsp90, a molecular chaperone with stable expression, was included as an additional reference protein to assess overall sample integrity. These controls ensured accurate protein loading, validated the sample identities, and reinforced the reliability of the anti-PLCZ1 antibody specificity assessment. Raw densitometry values and normalized intensity ratios used for Western blot quantification are provided in Supplementary Tables S1 and S2.
Figure 1.
Primary antibody specificity control. Western blot analysis of PLCζ1 expression. Total proteins were extracted from two human samples, OP9-DL4 and ATDC5 cell lines (from left to right). Western blotting was performed with 20–60 μg of proteins. PLCζ1 (top panel), GAPDS (second panel), Pan-Actin (third panel), Hsp90 (fourth panel), and GAPDH (last panel) were revealed as described in the Section 2. (The original Western blot membranes corresponding to Figure 1 are provided in the Supplementary Materials (Supplementary Figures S1–S5)).
3.2. Technical Positive and Negative Controls
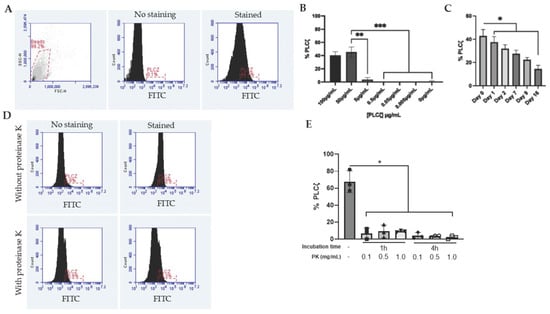
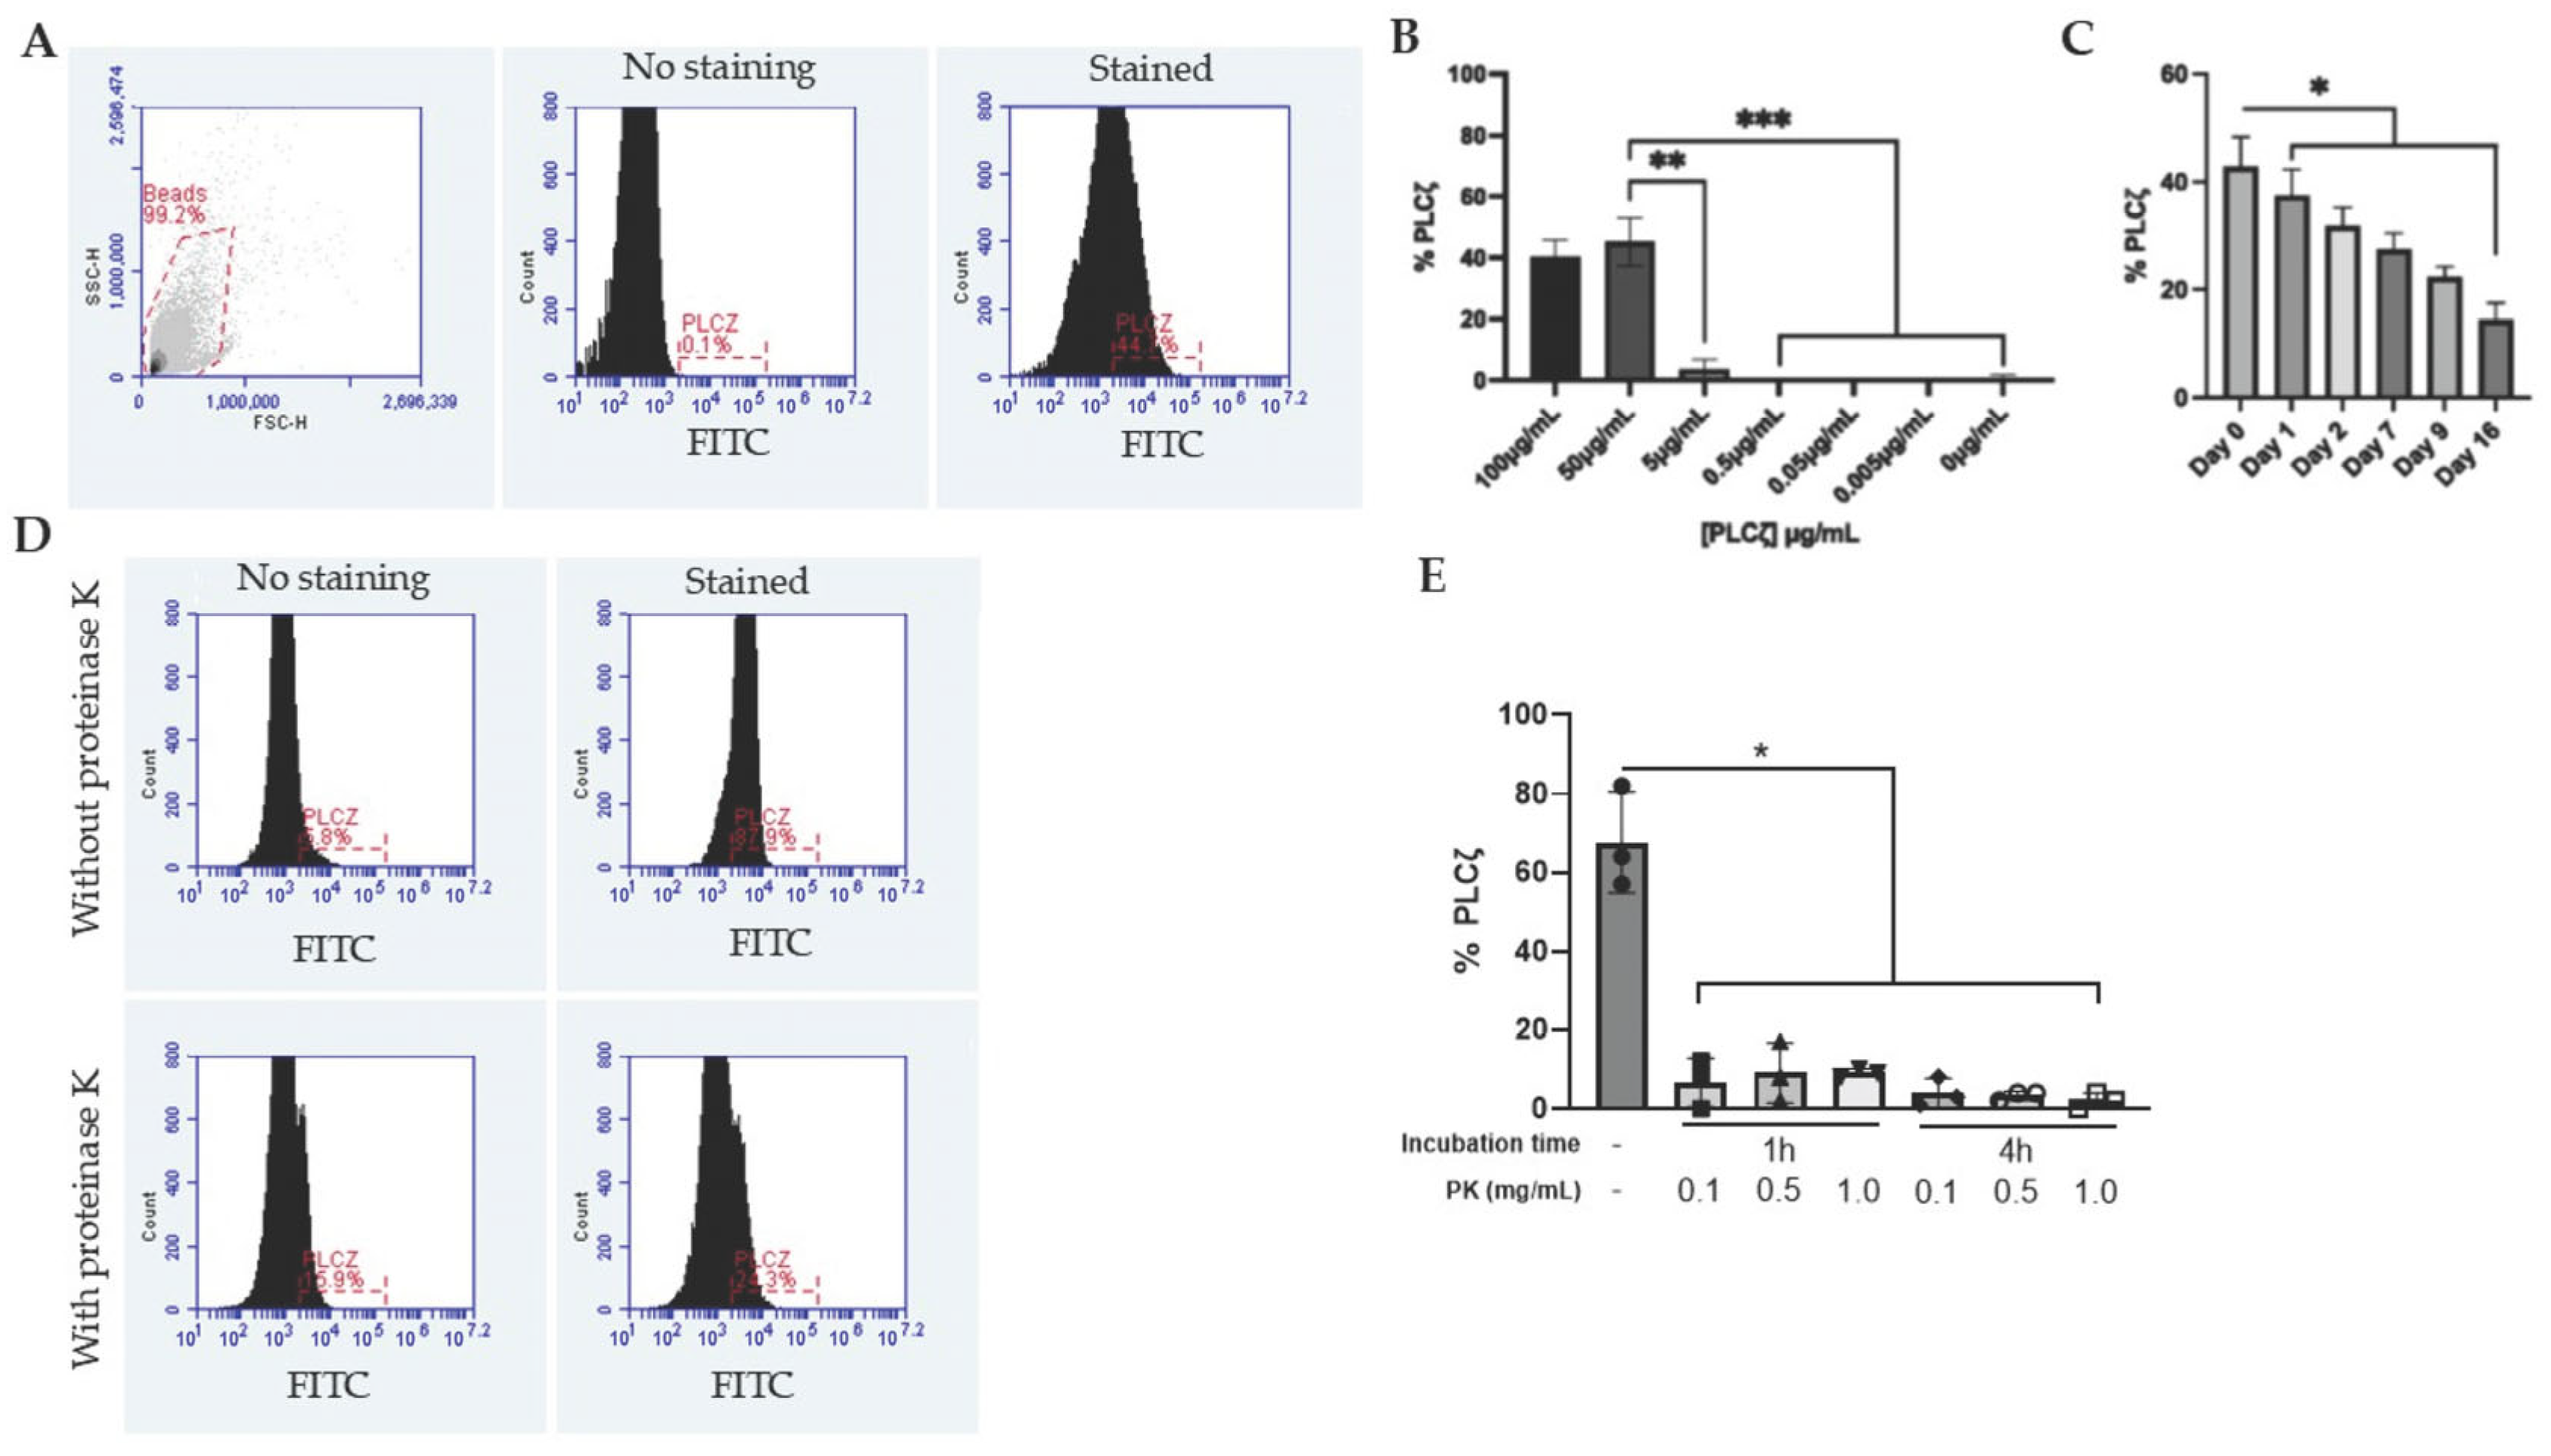
As PLCζ cannot be overexpressed in spermatozoa, a biologically appropriate positive control could not be generated; therefore, magnetic beads were used (Figure 2A). To establish the optimal concentration of recombinant PLCζ protein, beads were incubated with six concentrations (0.005, 0.05, 0.5, 5, 50, and 100 µg/mL). The PLCζ signal plateaued at 50 µg/mL (n = 3; p-values vs. 50 µg/mL: 100 µg/mL (p = 0.42), 5 µg/mL (** p = 0.001), 0.5 µg/mL (*** p = 0.0006), 0.05 µg/mL (*** p = 0.0006), 0.005 µg/mL (*** p = 0.0006), and 0 µg (*** p = 0.0006)), indicating saturation occurring at concentrations ≥50 µg/mL (Figure 2B). The stability of stained beads stored at 4 °C was monitored at five time points (1, 2, 7, 9, and 16 days). A gradual decline in fluorescence was detected after day 1 (* p = 0.009), day 2 (* p = 0.035), day 7 (* p = 0.022), day 9 (* p = 0.038), compared to the day of staining (day 0), with a significant reduction after 16 days (* p = 0.0221) (Figure 2C).
Figure 2.
Optimization of the positive and negative controls for PLCζ detection. (A) Forward scatter (FSC) and side scatter (SSC) plots showing bead size and complexity, and PLCζ fluorescence intensity histograms of stained and unstained bead samples. (B) PLCζ expression detected in beads incubated with increasing concentrations of recombinant PLCζ protein (0.005, 0.05, 0.5, 5, 50, and 100 µg/mL; n = 3). Comparisons vs. 50 µg/mL: 100 µg/mL (p = 0.42), 5 µg/mL (p = 0.001), 0.5 µg/mL (p = 0.0006), 0.05 µg/mL (p = 0.0006), 0.005 µg/mL (p = 0.0006), and 0 µg/mL (p = 0.0006). (C) Stability of stained beads after 1, 2, 7, 9, and 16 days compared to the day of staining (day 0; n = 3): day 1 (p = 0.009), day 2 (p = 0.035), day 7 (p = 0.022), day 9 (p = 0.038), and day 16 (p = 0.0221). (D) Fluorescence intensity histograms of a stained and unstained sperm sample without proteinase K treatment (top) and after 1 h treatment with 0.1 mg/mL proteinase K (bottom). (E) PLCζ levels after proteinase K treatment under six conditions (n = 3): 1 h with 0.1, 0.5, and 1.0 mg/mL (p = 0.011, p = 0.037, and p = 0.015, respectively) and 4 h with 0.1, 0.5, and 1.0 mg/mL (p = 0.018, p = 0.015, and p = 0.010, respectively), all compared to untreated controls. Statistical significance is indicated as follows: p < 0.05 (*), p < 0.01 (**), and p < 0.001 (***).
For a biologically relevant negative control, spermatozoa were treated with proteinase K to digest cellular proteins, including PLCζ (Figure 2D). Normozoospermic samples were used to test enzyme concentrations (0.1, 0.5, and 1 mg/mL) and incubation times (1 and 4 h). A significant reduction in PLCζ signal was observed in all enzyme concentrations and incubation times: 1 h with 1.0 mg/mL, 0.5 mg/mL, and 0.1 mg/mL of proteinase K (* p = 0.015, * p = 0.037 and * p = 0.011, respectively, n = 3) and 4 h with 1.0 mg/mL, 0.5 mg/mL, and 0.1 mg/mL of proteinase K (* p = 0.01, * p = 0.015 and * p = 0.018, respectively, n = 3) (Figure 2E). Therefore, the lowest concentration (0.1 mg/mL) and shortest incubation time (1 h) is suggested.
3.3. Gating Strategy
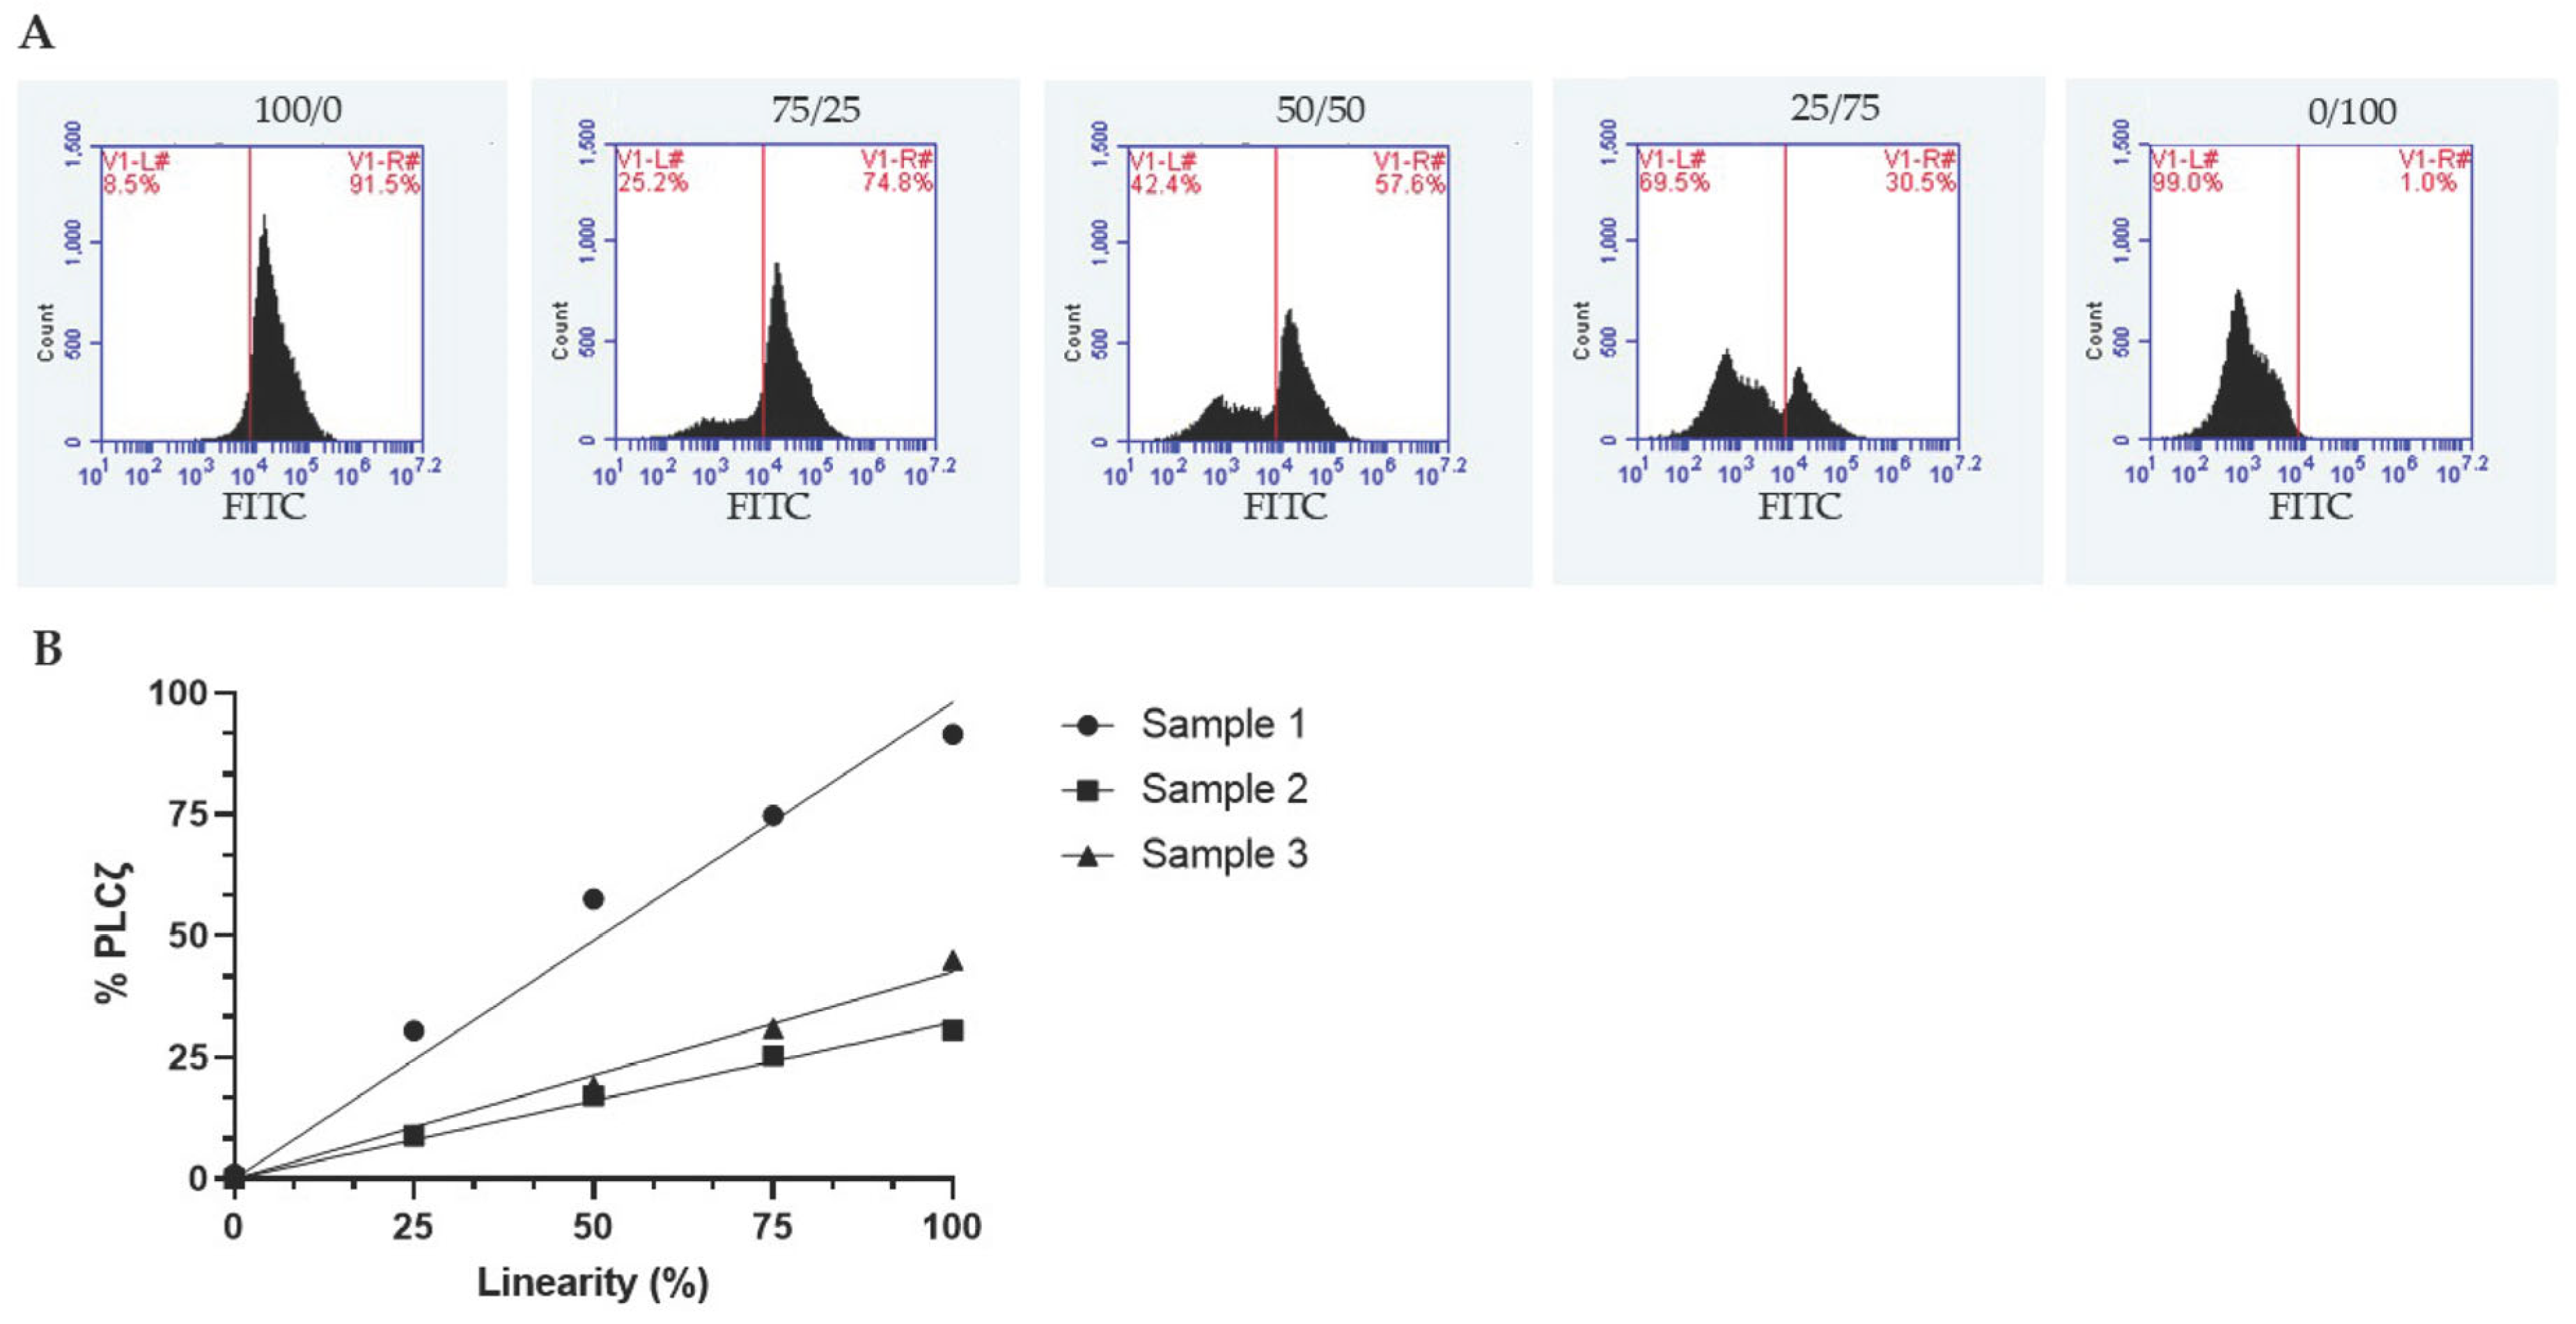
The analysis gate was defined using a linearity test in which stained and unstained samples from the same donor were mixed at different ratios (100:0, 75:25, 50:50, 25:75, and 0:100) (Figure 3B). This approach allowed for a clear discrimination of two cell populations: PLCζ-positive and PLCζ-negative spermatozoa (Figure 3A).
Figure 3.
Linearity of PLCζ staining. (A) Florescence intensity plots showing signal obtained from the mixture of stained and unstained spermatozoa from the same donor at a ratio of 100:0, 75:25, 50:50, 25:75 and 0:100. (B) Linear regression of three samples: Sample 1 y = 0.9815x (R2 = 0.98), Sample 2 y = 0.3226x (R2 = 0.99), and Sample 3 y = 0.4267x (R2 = 0.99).
3.4. Analytical Stability, Lower Limit of Detection, and Precision
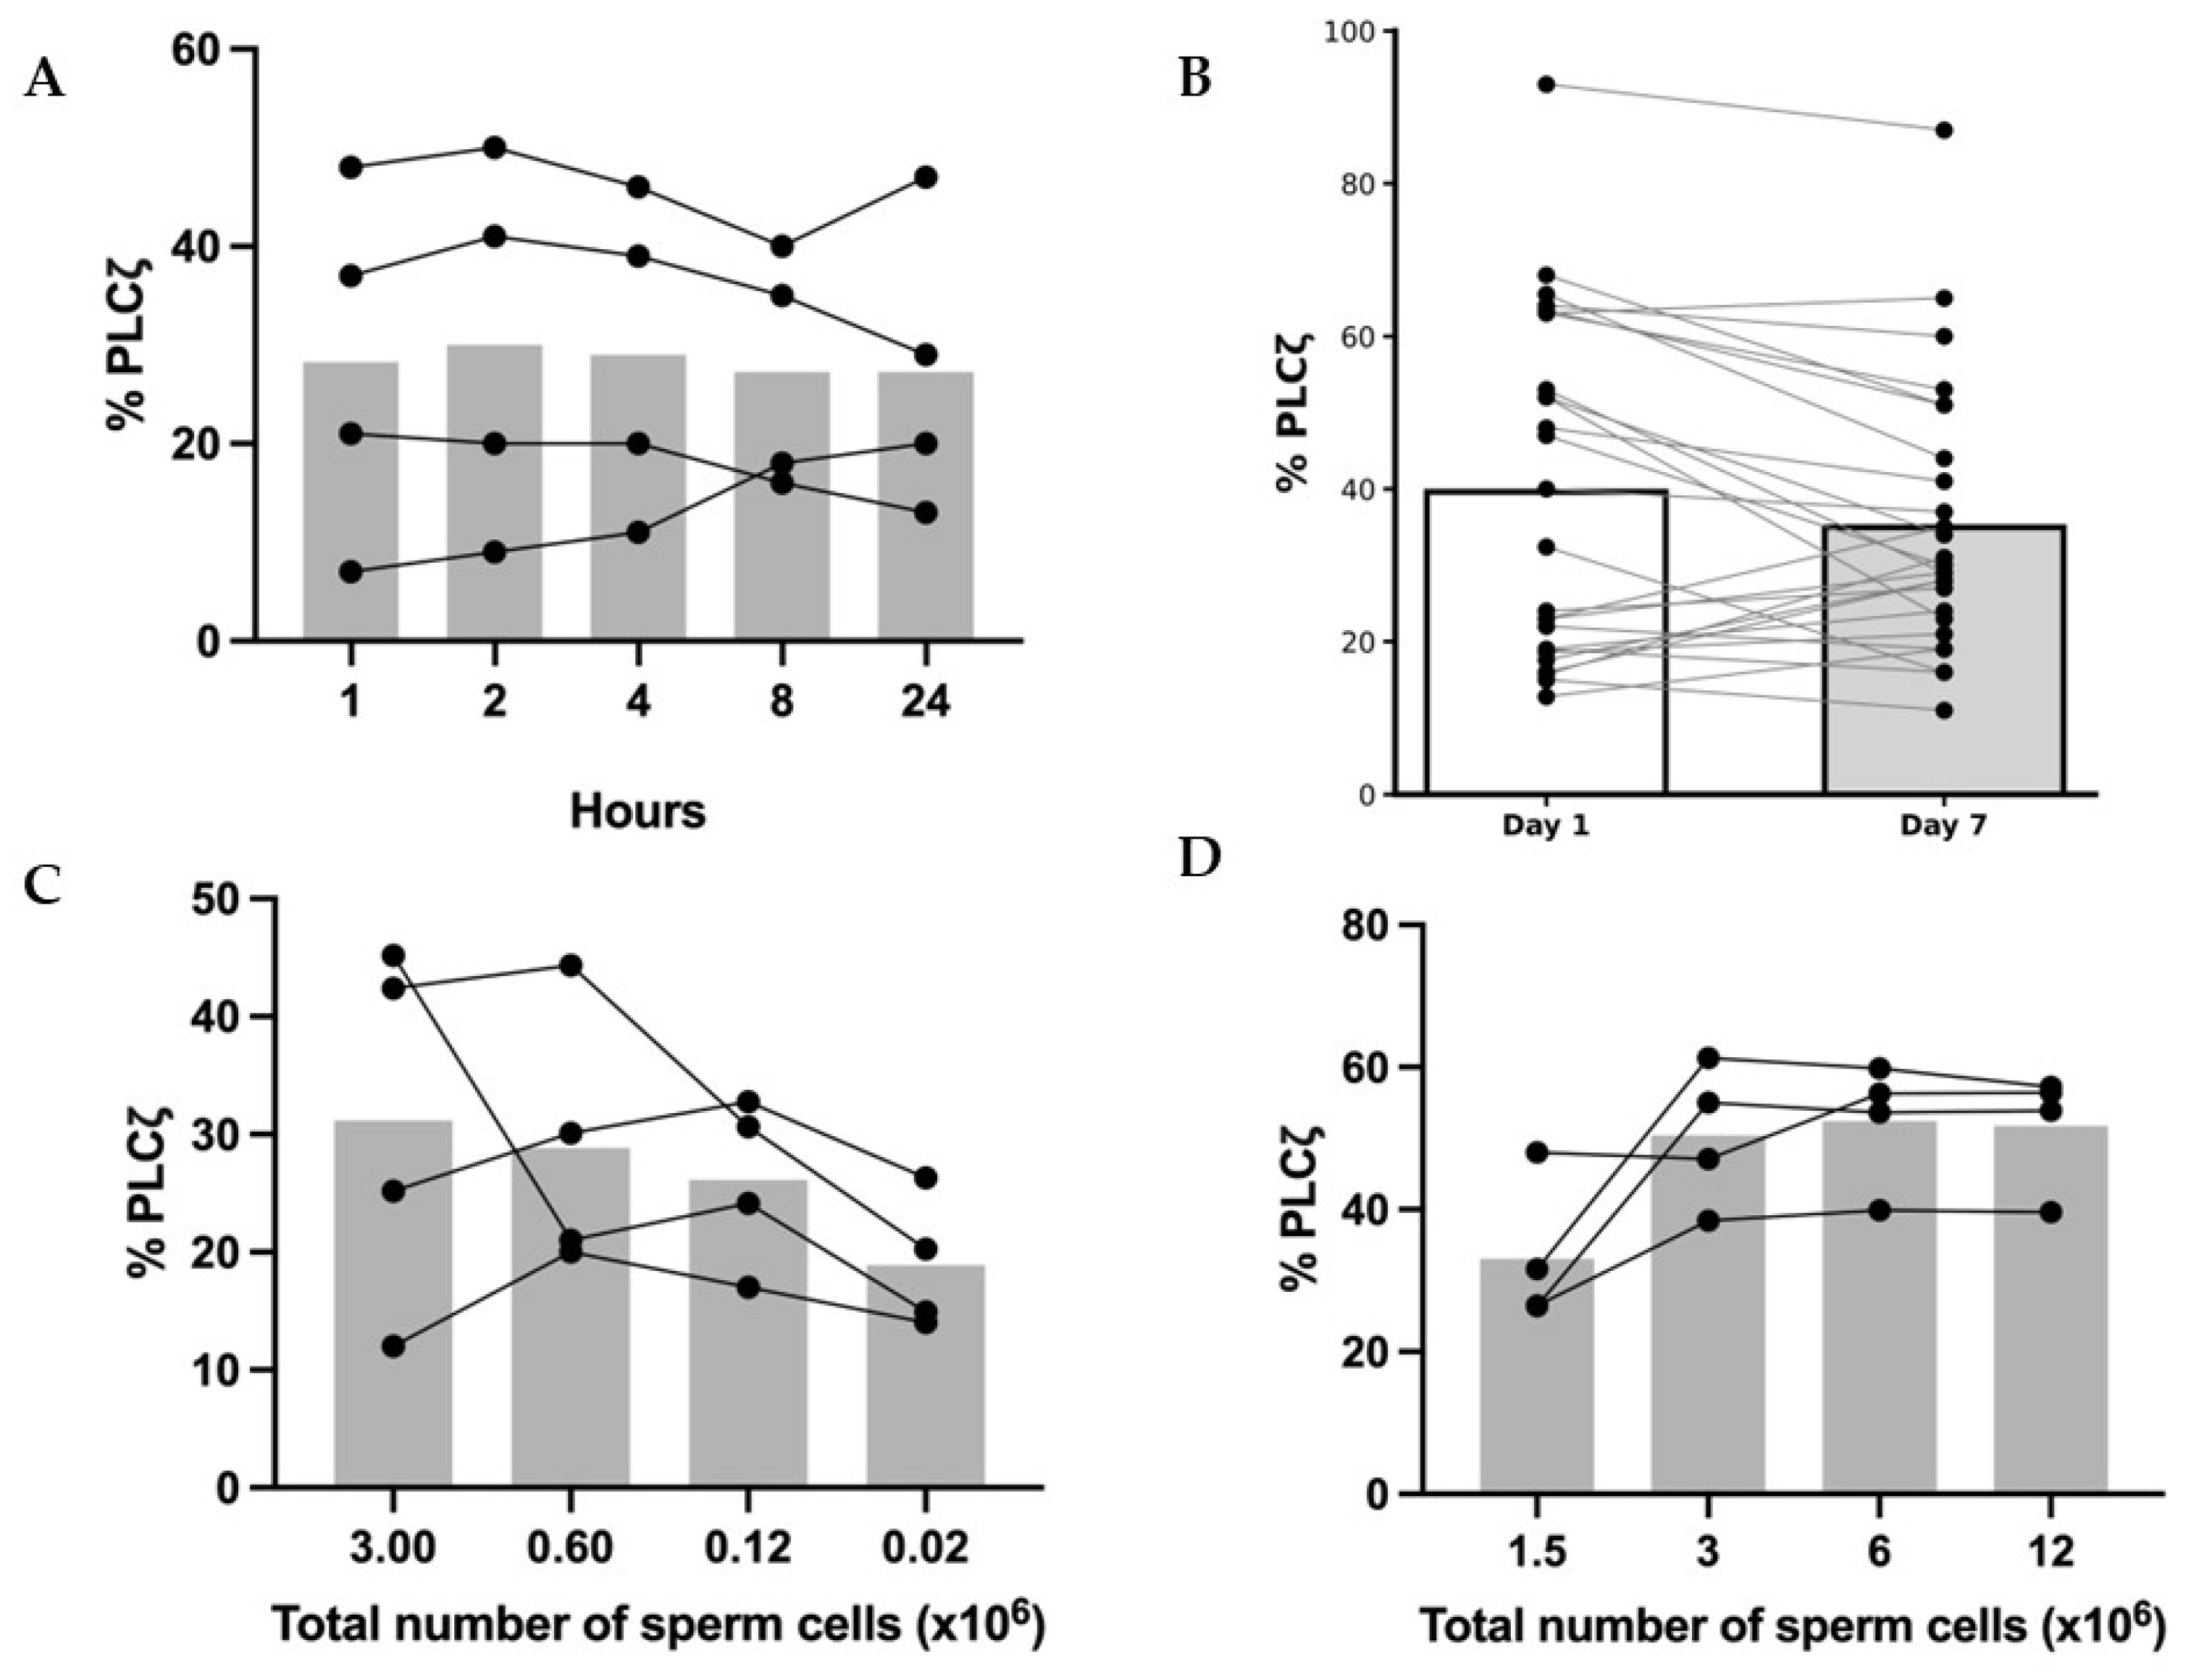
To assess bench-top stability, six million spermatozoa were aliquoted after collection and left at RT in seminal plasma for 1, 2, 4, 8, and 24 h. At each time point, samples were washed, fixed, and processed according to the flow cytometry protocol. No significant difference in PLCζ expression was observed across time points, even after 24 h at RT (p = 0.8528, n = 4) (Figure 4A). To evaluate longer-term stability, sperm samples were fixed and stored at 4 °C for 7 days, with no significant change in PLCζ expression (p = 0.06, n = 26) (Figure 4B).
Figure 4.
Sample stability and limits of detection. (A) Bench-top stability of samples analyzed immediately (1 h) or after incubation at RT in seminal plasma for 2 (p = 0.19), 4 (p = 0.62), 8 (p = 0.83), and 24 h (p = 0.85) (n = 4). (B) Stability of fixed samples stored at 4 °C for 7 days compared to samples analyzed the day after collection (p = 0.06) (n = 26). (C) Lower limit of detection was assessed by serial dilutions of the same sample, using 3 million spermatozoa as the reference concentration compared with 0.6 million (p = 0.77), 0.12 million (p = 0.51), and 0.02 million (p = 0.23) (n = 4). (D) Upper limit of detection was assessed by serial dilutions of the same sample using 3 million spermatozoa as the reference concentration compared with 1.5 million (p = 0.10), 6 million (p = 0.49), and 12 million (p = 0.68) (n = 4).
The assay’s range of detection was evaluated for upper and lower limits. For the upper limit, four normozoospermic samples were analyzed at increasing sperm concentrations (1.5, 3, 6, and 12 million). No significant difference in PLCζ expression was observed at 1.5 million (p = 0.10), 6 million (p = 0.49), or 12 million (p = 0.68) compared to 3 million spermatozoa (n = 4) (Figure 4D). For the lower limit, four independent samples were diluted to decreasing sperm numbers (3, 0.6, 0.12, and 0.024 million). No significant differences were observed at 0.6 million (p = 0.77), 0.12 million (p = 0.51), or 0.024 million (p = 0.23) compared to 3 million spermatozoa (n = 4) (Figure 4C).
Intra-assay reproducibility was determined by analyzing six study samples in triplicate (30 total runs), yielding a mean coefficient of variation (CV) of 11% (Table 1). Flow cytometer precision was assessed by acquiring five consecutive reads from each of six sperm samples (30 total measurements), resulting in a mean CV of 5% (n = 6) (Table 2).
Table 1.
Comparisons of PLCζ levels between 3 replicates of the same sample. SD: standard deviation. CV: coefficient of variation.
Table 2.
Comparisons of PLCζ levels between 5 reads of the same sample. SD: standard deviation. CV: coefficient of variation.
4. Discussion
This study established and validated a flow cytometry-based protocol for quantifying PLCζ levels in human sperm. The method incorporates appropriate technical controls, demonstrates stability under clinically relevant conditions, and performs reliably across a broad range of sperm concentrations. Together, these findings support the potential integration of PLCζ measurement into routine semen analysis.
For a cell-based assay like this, adherence to clinical validation guidelines, such as those set by the Clinical and Laboratory Standards Institute (CLSI) or joint International Clinical Cytometry Society (ICCS)/International Society for Standards in Hematology (ISLH) guidelines, is essential for Laboratory Developed Tests (LDTs) entering the diagnostic setting [17,18,19,20,21,22]. Key performance criteria required for validation including analytical accuracy, precision, linearity, and analytical sensitivity (limits of detection) were rigorously assessed in this protocol.
A key strength of this protocol lies in its reproducibility and precision. The assay demonstrated low intra-assay variability (mean CV of 11%, n = 6 samples, 30 runs) and consistent cytometer performance (mean CV of 5%, n = 6 samples, 30 reads), ensuring robustness for diagnostic use. The stability testing also meets clinical requirements, as PLCζ stability was maintained in samples kept at room temperature for up to 24 h (n = 4) and in fixed samples stored at 4 °C for seven days (n = 26), supporting its practicality in a clinical workflow. Furthermore, robust linearity was established using stained/unstained cell mixing experiments. The assay was also reliable across a broad range of sperm counts, demonstrating applicability down to low concentrations (0.024 million cells, n = 4), which is critical given the variability of semen samples encountered in infertility clinics.
In the context of PLCζ assessment, flow cytometry offers a distinct analytical advantage by enabling quantitative, single-cell evaluation across large sperm populations within a standardized workflow. Previous studies have relied primarily on immunofluorescence microscopy, which provides valuable spatial information but remains inherently semi-quantitative and limited in throughput, making it difficult to derive robust population-level metrics [9]. Bulk approaches such as Western blotting or ELISA average protein content across pooled cells and therefore obscure inter-sperm heterogeneity, a feature that is biologically relevant in human semen. Nucleic acid–based methods, while sensitive, do not reflect protein abundance or post-translational regulation. The present approach does not replace these techniques but complements them by providing a reproducible, population-scale measure of PLCζ expression that can be integrated into existing cytometry-based laboratory workflows.
The present assay also has several limitations that must be acknowledged. Flow cytometry quantifies PLCζ expression but cannot assess its functional activity, and oocyte activation may fail even when PLCζ levels appear normal if the protein is misfolded, enzymatically impaired, or unable to trigger Ca2+ oscillations. The method also cannot evaluate protein localization, which is clinically relevant because aberrant PLCζ distribution within the sperm head has been associated with reduced fertilization potential [7]. In practice, this limitation can be partially addressed by allocating a fraction of the stained sample, after FITC-conjugated secondary antibody incubation and washing, to immunofluorescence microscopy for assessment of PLCζ subcellular localization, while the remaining cells are analyzed by flow cytometry for quantitative measurement, with minor adjustments to the number of spermatozoa processed per condition. In addition, the controls used are technical rather than biological: recombinant PLCζ-coated beads are suitable for calibration but do not reproduce the structural complexity of spermatozoa, and proteinase K digestion, although useful for confirming assay specificity, does not mimic physiological PLCζ deficiency. As with any antibody-based assay, the results may be influenced by epitope accessibility, fixation conditions, and reagent variability, and the technique cannot distinguish full-length PLCζ from truncated or mutated forms. Finally, although this protocol reliably measures PLCζ levels, no clinically validated threshold currently exists to define normal versus deficient expression, and larger prospective studies will be required to correlate quantitative PLCζ values with fertilization outcomes before clinical decision-making can be based on this metric.
5. Conclusions
This study establishes a standardized and analytically validated flow cytometry protocol for quantifying PLCζ (PLCZ1) expression in human spermatozoa. The assay is precise, reproducible, stable under clinically relevant conditions, and applicable across a wide range of sperm concentrations, providing a robust technical framework for future translational research. Importantly, this method measures PLCζ protein expression but does not assess enzymatic function or subcellular localization, nor does it define clinically validated thresholds predictive of fertilization outcomes. It should therefore be viewed as an enabling analytical tool rather than a standalone diagnostic test. Future studies correlating PLCζ values obtained with this protocol with fertilization rates, embryo development, and response to artificial oocyte activation will be required to establish its clinical utility.
By addressing the long-standing lack of a standardized approach to PLCζ quantification, this work represents a critical step toward transforming PLCζ from a research marker into a clinically actionable parameter in male infertility assessment.
Supplementary Materials
The following supporting information can be downloaded at https://www.mdpi.com/article/10.3390/jmp7010008/s1: Figure S1: Uncropped PLCζ1 Western blot; Figure S2: Uncropped GAPDS Western blot; Figure S3: Uncropped Pan-Actin Western blot; Figure S4: Uncropped Hsp90 Western blot; Figure S5: Uncropped GAPDH Western blot; Table S1: Raw densitometry values for Western blot bands; Table S2: Normalized intensity ratios for Western blot bands; Protocol S1: Detailed step-by-step protocol for PLCζ flow cytometric quantification.
Author Contributions
Conceptualization, M.-H.G.P., C.D., F.J., A.C., D.M., M.-C.B., M.B. and P.M.; methodology, M.-H.G.P., C.D., F.J. and A.C.; formal analysis, M.-H.G.P., C.D., F.J. and A.C.; investigation, M.-H.G.P., C.D., F.J. and A.C.; writing—original draft preparation, M.-H.G.P., C.D., F.J., A.C. and R.C.; writing—review and editing, D.M., M.-C.B., M.B. and P.M. All authors have read and agreed to the published version of the manuscript.
Funding
This research received no external funding.
Institutional Review Board Statement
The study was conducted in accordance with the Declaration of Helsinki and the ethical guidelines for studies in which human gametes or embryos are used as materials in Canada. The Tri-Agency Research Integrity Policy including policies from the Canadian Institutes of Health Research, the Natural Sciences and Engineering Research Council of Canada, and the Social Sciences and Humanities Research Council of Canada was applied with the governance of the Assisted Human Reproduction Act, S.C. 2004. The study focused on the improvement, verification, and validation of an analytical method using surplus sperm samples that were scheduled for disposal after routine clinical analysis. No additional procedures were performed, and no clinical decisions or patient management were influenced by this research activity. In accordance with local regulations governing quality improvement and analytical method validation using anonymized surplus clinical material, formal Research Ethics Board approval was therefore not required.
Informed Consent Statement
Informed consent was obtained from all subjects involved in the study for the use of their surplus samples in research and method validation.
Data Availability Statement
The original contributions presented in this study are included in the article. Further inquiries can be directed to the corresponding author.
Acknowledgments
The authors would like to acknowledge the help of all Fertilys employees for their help and support. The authors also thank the CHU Sainte-Justine’s Gene Editing Platform and Romain Gioia for helping in testing the specificity of the antibodies.
Conflicts of Interest
Marie-Hélène Godin Pagé, Debbie Montjean, and Marie-Claire Bélanger are current employees of Fertilys Fertility Center. Fabien Joao, Cyntia Duval, and Annabelle Calvé were employees of Fertilys Fertility Center at the time the study was conducted. Pierre Miron and Moncef Benkhalifa are shareholders and owners of Fertilys Fertility Center.
References
- Kumar, N.; Singh, A.K. Trends of male factor infertility, an important cause of infertility: A review of literature. J. Hum. Reprod. Sci. 2015, 8, 191–196. [Google Scholar] [CrossRef] [Scilit] [PubMed]
- Cheung, S.; Parrella, A.; Tavares, D.; Keating, D.; Xie, P.; Rosenwaks, Z.; Palermo, G.D. Single-center thorough evaluation and targeted treatment of globozoospermic men. J. Assist. Reprod. Genet. 2021, 38, 2073–2086. [Google Scholar] [CrossRef] [Scilit] [PubMed]
- Haddad, M.; Stewart, J.; Xie, P.; Cheung, S.; Trout, A.; Keating, D.; Parrella, A.; Lawrence, S.; Rosenwaks, Z.; Palermo, G.D. Thoughts on the popularity of ICSI. J. Assist. Reprod. Genet. 2021, 38, 101–123. [Google Scholar] [CrossRef] [Scilit] [PubMed]
- Torra-Massana, M.; Cornet-Bartolomé, D.; Barragán, M.; Durban, M.; Ferrer-Vaquer, A.; Zambelli, F.; Rodriguez, A.; Oliva, R.; Vassena, R. Novel phospholipase C zeta 1 mutations associated with fertilization failures after ICSI. Hum. Reprod. 2019, 34, 1494–1504. [Google Scholar] [CrossRef] [Scilit] [PubMed]
- Nicholson, C.L.; Dean, M.; Attia, A.; Milne, P.A.; da Silva, S.M. Artificial oocyte activation improves ICSI outcomes following unexplained fertilization abnormalities. Reprod. Biomed. Online 2023, 49, 104327. [Google Scholar] [CrossRef] [Scilit] [PubMed]
- Heindryckx, B.; Van der Elst, J.; De Sutter, P.; Dhont, M. Treatment option for sperm- or oocyte-related fertilization failure: Assisted oocyte activation following diagnostic heterologous ICSI. Hum. Reprod. 2005, 20, 2237–2241. [Google Scholar] [CrossRef] [Scilit] [PubMed]
- Yelumalai, S.; Yeste, M.; Jones, C.; Amdani, S.N.; Kashir, J.; Mounce, G.; Da Silva, S.J.M.; Barratt, C.L.; McVeigh, E.; Coward, K. Total levels, localization patterns, and proportions of sperm exhibiting phospholipase C zeta are significantly correlated with fertilization rates after intracytoplasmic sperm injection. Fertil. Steril. 2015, 104, 561–568.e4. [Google Scholar] [CrossRef] [Scilit] [PubMed]
- Rahimizadeh, P.; Topraggaleh, T.R.; Nasr-Esfahani, M.H.; Ziarati, N.; Mirshahvaladi, S.; Esmaeili, V.; Seifi, S.; Eftekhari-Yazdi, P.; Shahverdi, A. The alteration of PLCζ protein expression in unexplained infertile and asthenoteratozoospermic patients: A potential effect on sperm fertilization ability. Mol. Reprod. Dev. 2020, 87, 115–123. [Google Scholar] [CrossRef] [Scilit] [PubMed]
- Parrella, A.; Medrano, L.; Aizpurua, J.; Gómez-Torres, M.J. Phospholipase C zeta in human spermatozoa: A systematic review on current development and clinical application. Int. J. Mol. Sci. 2024, 25, 1344. [Google Scholar] [CrossRef] [Scilit] [PubMed]
- Kashir, J.; Ganesh, D.; Jones, C.; Coward, K. Oocyte activation deficiency and assisted oocyte activation: Mechanisms, obstacles and prospects for clinical application. Hum. Reprod. Open 2022, 2022, hoac003. [Google Scholar] [CrossRef] [Scilit] [PubMed]
- Kashir, J.; Mistry, B.V.; Rajab, M.A.; BuSaleh, L.; Abu-Dawud, R.; Ahmed, H.A.; Alharbi, S.; Nomikos, M.; AlHassan, S.; Coskun, S.; et al. The mammalian sperm factor phospholipase C zeta is critical for early embryo division and pregnancy in humans and mice. Hum. Reprod. 2024, 39, 1256–1274. [Google Scholar] [CrossRef] [Scilit] [PubMed]
- Azil, S.; Kaarouch, I.; Montjean, D.; Godin Pagé, M.-H.; Cabry, R.; Louanjli, N.; Ghazi, B.; Benkhalifa, M. Effect of sperm DNA fragmentation and chromatin decondensation on PLCζ efficacy in infertile patients. Curr. Issues Mol. Biol. 2025, 47, 707. [Google Scholar] [CrossRef] [Scilit] [PubMed]
- Che, J.F.; Wu, H.X.; Zeng, S.C.; Wu, Y.R.; Dai, J.; Cheng, D.H.; Gong, F.; Lu, G.X.; Lin, G.; Dai, C. Defects in phospholipase C zeta cause polyspermy and low fertilization after conventional IVF: Not just ICSI failure. Asian J. Androl. 2024, 26, 175–182. [Google Scholar] [CrossRef] [Scilit] [PubMed]
- Kashir, J.; Buntwal, L.; Nomikos, M.; Calver, B.L.; Stamatiadis, P.; Ashley, P.; Vassilakopoulou, V.; Sanders, D.; Knaggs, P.; Livaniou, E.; et al. Antigen unmasking enhances visualization efficacy of the oocyte activation factor, phospholipase C zeta, in mammalian sperm. Mol Hum Reprod. 2017, 23, 54–67. [Google Scholar] [CrossRef] [Scilit] [PubMed]
- Kashir, J.; Jones, C.; Mounce, G.; Ramadan, W.M.; Lemmon, B.; Heindryckx, B.; De Sutter, P.; Parrington, J.; Turner, K.; Child, T.; et al. Variance in total levels of phospholipase C zeta (PLC-ζ) in human sperm may limit the applicability of quantitative immunofluorescent analysis as a diagnostic indicator of oocyte activation capability. Fertil Steril. 2013, 99, 107–117. [Google Scholar] [CrossRef] [Scilit] [PubMed]
- World Health Organization. WHO Laboratory Manual for the Examination and Processing of Human Semen, 6th ed.; WHO: Geneva, Switzerland, 2021. [Google Scholar]
- Clinical and Laboratory Standards Institute (CLSI). H62—Validation of Assays Performed by Flow Cytometry, 1st ed.; CLSI: Wayne, PA, USA, 2023. [Google Scholar]
- Davis, B.H.; Wood, B.; Oldaker, T.; Barnett, D. Validation of cell-based fluorescence assays: Practice guidelines from the ICSH and ICCS—Part I: Rationale and aims. Cytom. B Clin. Cytom. 2013, 84, 282–285. [Google Scholar] [CrossRef] [Scilit] [PubMed]
- Davis, B.H.; Dasgupta, A.; Kussick, S.; Han, J.Y.; Estrellado, A.; ICSH/ICCS Working Group. Validation of cell-based fluorescence assays: Practice guidelines from the ICSH and ICCS—Part II: Preanalytical issues. Cytom. B Clin. Cytom. 2013, 84, 286–290. [Google Scholar] [CrossRef] [Scilit] [PubMed]
- Tangri, S.; Vall, H.; Kaplan, D.; Hoffman, B.; Purvis, N.; Porwit, A.; Hunsberger, B.; Shankey, T.V.; ICSH/ICCS Working Group. Validation of cell-based fluorescence assays: Practice guidelines from the ICSH and ICCS—Part III: Analytical issues. Cytom. B Clin. Cytom. 2013, 84, 291–308. [Google Scholar] [CrossRef] [Scilit] [PubMed]
- Barnett, D.; Louzao, R.; Gambell, P.; De, J.; Oldaker, T.; Hanson, C.A.; ICSH/ICCS Working Group. Validation of cell-based fluorescence assays: Practice guidelines from the ICSH and ICCS—Part IV: Postanalytic considerations. Cytom. B Clin. Cytom. 2013, 84, 309–314. [Google Scholar] [CrossRef] [Scilit] [PubMed]
- Wood, B.; Jevremovic, D.; Béné, M.C.; Yan, M.; Jacobs, P.; Litwin, V.; ICSH/ICCS Working Group. Validation of cell-based fluorescence assays: Practice guidelines from the ICSH and ICCS—Part V: Assay performance criteria. Cytom. B Clin. Cytom. 2013, 84, 315–323. [Google Scholar] [CrossRef] [Scilit] [PubMed]

Disclaimer/Publisher’s Note: The statements, opinions and data contained in all publications are solely those of the individual author(s) and contributor(s) and not of MDPI and/or the editor(s). MDPI and/or the editor(s) disclaim responsibility for any injury to people or property resulting from any ideas, methods, instructions or products referred to in the content. |
© 2026 by the authors. Licensee MDPI, Basel, Switzerland. This article is an open access article distributed under the terms and conditions of the Creative Commons Attribution (CC BY) license.