


Abstract
Vegetation change is regarded as a key indicator of environmental change and ecosystem functional evolution. In mountainous regions, vegetation dynamics arise from complex and non-linear interactions among climate, topography, land use, and human activities, yet the mechanisms governing these interactions remain poorly understood. Clarifying long-term vegetation trajectories and their interacting controls is essential for understanding ecosystem structure and function. In this study, we integrated machine learning and causal modeling by combining random forest (RF) and structural equation modeling (SEM) to quantify both the relative importance and the direct and indirect pathways of natural and anthropogenic drivers of vegetation change in the Longnan region from 2000 to 2020. The RF results showed that the selected driving factors explained 82.62% and 72.39% of the spatial variation in vegetation cover in 2000 and 2020, respectively, with climatic and anthropogenic factors ranking as the most important drivers. Although ecological restoration activities contributed to an overall improvement in vegetation conditions, land-use heterogeneity and ecological constraints imposed by high elevation jointly produced contrasting local responses, resulting in vegetation degradation in surrounding areas. SEM revealed that the net influence of anthropogenic activities shifted from positive to negative over time, mainly due to land-use change, indicating a reorganization of human–vegetation interactions. Climate effects remained positive, with precipitation having a stronger influence than temperature. Topography moderated vegetation responses, as slopes below 40° favored vegetation growth. Soil effects shifted from positive to negative, likely associated with changes in soil organic matter. By jointly applying RF and SEM, this study captures both non-linear responses and causal pathways, providing a system-level perspective on the complex mechanisms underlying vegetation change.
1. Introduction
Vegetation serves as a natural nexus among soil, atmosphere, and aquatic environments, playing a pivotal role in terrestrial ecosystems by regulating energy exchange, biogeochemical cycles, carbon cycling, and maintaining climate stability [1,2,3]. The Normalized Difference Vegetation Index (NDVI) is generally regarded as a significant parameter reflecting environmental changes and the evolution of ecosystem functions [4]. It is affected by various elements such as climate factors, soil properties, topographic factors and anthropogenic activities [5,6]. Studies have shown that changes in precipitation and temperature have a great effect on vegetation evolution [7,8], which varies with terrain conditions and soil types [6,9]; human activities have also become a driving factor that cannot be ignored, affecting the spatio-temporal changes in vegetation in the past few decades [10,11]. As anthropogenic activities became frequent, intensive and diverse, they began to exert tremendous pressure on vegetation growth at the regional scale [12,13]. The interaction between natural factors and human factors makes the dynamic evolution of vegetation more complicated [14,15], and it is still a great challenge to understand the dynamic evolution of vegetation ecosystems. Therefore, accurately quantifying the contributions of major natural and human factors to vegetation change is crucial for scientifically assessing the evolution dynamics of vegetation ecosystem processes and functions under multi-factor coupling, as well as the effective implementation of ecological construction and management and the realization of sustainable development.
Over the past few years, considerable scholarly attention has been devoted to identifying the driving factors of vegetation change [11,13], mainly centered on the influence of climatic variables (total temperature/precipitation) on vegetation variation, generally using regression methods [16] or correlation analysis [17,18] and other traditional methods. Previous studies have largely focused on distinguishing the relative influences of climatic and anthropogenic factors on vegetation dynamics, yet few have systematically quantified their respective effect sizes and importance. Moreover, integrated assessments that combine natural and anthropogenic drivers to explain complex vegetation changes remain scarce. Some researchers have applied the geographical detector model to measure the effects of natural driving factors on vegetation changes in western China and to analyze pairwise interactions among these factors [19]. However, this model is limited to evaluating two-way interactions and categorizing their types, rather than simultaneously disentangling the multifaceted interactions among multiple driving factors [20]. Complex changes in vegetation are influenced by the interaction of multiple factors. Though there are statistical ways to calculate the interaction of two variables, many models cannot efficiently quantify the influence of independent variables by removing the impact of other factors, which can cause biased results [21], although currently some causal models (such as Granger Causality and Convergent Cross Mapping) can eliminate the effects of other factors [21]. However, these models can only extract reliable interactions between two variables, and quantifying the overall impact of multiple influencing factors on target variables remains challenging. Among them, machine learning algorithms represented by random forests have the advantages of simplicity and efficiency, high accuracy, and no reliance on a priori experience, and are considered to be an effective method with the ability to identify the importance of drivers [2,22], and although they cannot control the inner workings of the model, the results can effectively solve the problems of overfitting and multicollinearity, and are therefore widely used in ecological data mining [22]. In contrast, structural equation modeling (SEM) provides a robust framework for quantifying and elucidating the complex interactions among factors driving vegetation change. Specifically, SEM not only isolates the unique effect of each predictor while removing the influence of others, but also takes into account synergies among variables, allowing for an integrated quantification of their combined effects on the aim variable [23]. Therefore, the study attempted to apply SEM to effectively quantify the direct and indirect causal effects of vegetation growth on every driving factor, in which the indirect effects result from the interaction of the factors. The contribution of the main drivers and their long-term variation at the regional scale are still poorly understood, which limits researchers’ in-depth and comprehensive understanding of the driving mechanism of vegetation change. Therefore, this study integrates RF and SEM to explicitly quantify the direct and indirect pathways through which natural and anthropogenic drivers shape vegetation growth. This integrated framework not only quantifies causal pathways but also offers a transferable approach for diagnosing vegetation-driver relationships in other mountainous regions.
Currently, the mountainous vegetation in central and western China has experienced significant changes in response to disturbances from multiple environmental factors [2,24]. However, studies on the interaction of driving factors of vegetation evolution in these regions are limited. The comparative contribution degree of different natural and human activity factors to vegetation change in the mountainous zones of central and western China is unclear. Without considering interactions, the effects of extracted specific driving factors on the change in vegetation may be biased [6]. Therefore, comprehending the intrinsic driving factors of vegetation change and their interplay can offer an essential reference for preventing vegetation degradation and even regulating ecosystem management to ensure the sustainability of fragile ecosystems [25,26]. Longnan is the only region in northwest China and even East Asia that belongs to the Yangtze River basin and has a subtropical climate. Its exceptional topography and geographical environment provide a distinct northwest subtropical biome and natural landscape. In recent years, the transformation of the natural environment by humans has continued to intensify with sustained economic and social development, resulting in constant changes in spatial patterns of land use/cover. Under unprecedented pressure, the natural environment in Longnan is experiencing severe geological disasters such as soil erosion, landslides, and debris flows [27,28]. These disasters have significantly impacted vegetation coverage in the region [11,29]. Therefore, it is significant to understand the uniqueness of vegetation evolution and the interaction between natural and anthropogenic driving factors in the region during diverse periods, to clarify the vegetation changes in the semi-humid zone under global climate change and the influence of various controlling factors on it. To address this gap, this study integrates RF and SEM to quantify the importance and influence coefficients of natural and anthropogenic drivers of vegetation variation in the Longnan region. The objectives of this research are (1) to use RF to identify the primary driving factors affecting vegetation and to quantify their relative importance and (2) to use SEM to assess the direct and indirect effects of driving factors on the changes in vegetation from 2000 to 2020. The results of this research will provide an essential scientific basis for revealing the interaction mechanism of natural and human activity factors and vegetation evolution in the sub-humid region of East Asia and even worldwide.
2. Materials and Methods
2.1. Study Area
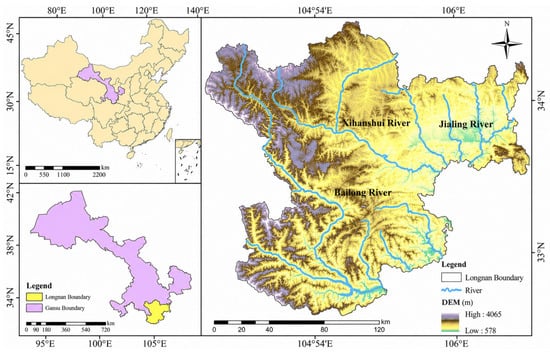
The Longnan region (104°01′19″ E to 106°35′20″ E, 32°35′45″ N to 34°32′00″ N) is situated in west-central China, southeastern Gansu Province, and it is located in the intersection area of the Qinba Mountains, the Qinghai–Tibet Plateau, and the Loess Plateau, three major topographic regions; it is China’s second and third terrain transition zone (Figure 1). The area is about 237 km long from east to west, 230.5 km wide from north to south, and has a land area of 27,923 km2. The west transitions to the Gannan Plateau on the northern edge of the Qinghai–Tibet Plateau, the north transitions to the Longzhong Loess Plateau, the south transitions to the Sichuan Basin, and the east is connected with the West Qinling Mountains and the Hanzhong Basin. The terrain of Longnan is high in the northwest and low in the southeast, with an average altitude of 1000 m. The two mountain systems of West Qinling and Minshan extend into the whole territory from the east and west respectively, forming a complex terrain of high mountains, valleys, and basins in the territory, which are typical mountain basins prone to natural disasters [11]. The climate of Longnan is characterized by distinct vertical climatic zonation, ranging from northern subtropical to warm temperate and mid-temperate zones. The multi-year average temperature, precipitation, wind speed, and sunshine duration over the study period (2000–2020) are 14.7 °C, 600 mm, 1.71 m/s, and 1958.5 h, respectively [28]. Longnan is both mountainous and rich in water resources, with rivers and streams distributed in a crisscross pattern. There are two primary river basins, the Xihan River and Bailong River, tributaries of the Jialing River, which comprise the region with the most plentiful water resources in Gansu. In addition, the soil and vegetation types in the region are intricate and varying, exhibiting specific horizontal and vertical distribution patterns. The main vegetation types are temperate deciduous broad-leaved forest, temperate montane coniferous forest, evergreen broad-leaved forest, cultivated vegetation and alpine coniferous forest. In recent years, with the change in natural environment and the intensification of anthropogenic activities, the structure and function of the Longnan vegetation ecosystem have changed [11,29].
Figure 1.
Geographical location map of Longnan.
2.2. Data Sources
2.2.1. The Normalized Difference Vegetation Index
MODIS NDVI data are NASA’s 2000–2020 MODQ13Q1 vegetation index product (https://ladsweb.modaps.eosdis.nasa.gov/), with a spatial resolution of 250 m (considering the completeness of natural and anthropogenic driver data and their mandatory requirements for inclusion in the model, continuous data from 2000 to 2020 were selected for vegetation data; 2000/2020 were selected for driver data). We converted the original HDF data format to GeoTIFF format by utilizing the MODIS reprojection tool (MRT). To minimize uncertainties caused by factors such as cloud cover, atmospheric disturbances, and solar altitude, and to match the temporal resolution of other drivers, the 16-day composite NDVI products were aggregated to annual data using the maximum value synthesis (MVC) method [30].
2.2.2. Natural Driving Factors
- (1)
- Climate
Numerous studies have shown that precipitation (Pre) and temperature (Tem) have significant influences on vegetation evolution [6,25,31]. The annual mean precipitation and temperature with a spatial resolution of 1000 m for 2000–2020 used in the study were acquired through the National Earth System Science Data Center platform (http://www.geodata.cn/index.html, accessed on 1 September 2026).
- (2)
- Soil properties
The soil type (St) data were derived from China’s soil type spatial distribution dataset, which was digitally generated by the “1:1 million Soil Map of the People’s Republic of China” published by the National Soil Census Office (https://www.resdc.cn/), with a spatial resolution of 1000 m. There are 7 main soil types in the Longnan area, namely alfisol, semi-alleviate soil, calcareous soil, primordial soil, semi-aqueous soil, man-made soil and alpine soil. The selected soil physicochemical parameters included total nitrogen (TN), total potassium (TK), total phosphorus (TP), potential of hydrogen (pH), organic matter (SOM), organic carbon (OC), electrical conductivity (ECE), cation exchange capacity (CEC) and adequate water content (Awc), which were gained from the National Tibetan Plateau Science Data Center (http://data.tpdc.ac.cn/), a Chinese soil dataset on the basis of the World Soil Database (v1.1) (2009) 0–30 cm layer values with a spatial resolution resampled to 1000 m for land surface simulation. The data is the most comprehensive publicly available soil dataset for China with consistent spatial coverage. No updated soil data covering the entire study region were available for 2000 and 2020. Given that key soil properties—such as texture, organic matter, and nutrient content—change slowly over decadal timescales, the 2009 dataset provides a reasonable approximation for both time points in our analysis.
- (3)
- Topography
Topographical conditions not only directly influence vegetation growth, but also disturb the pattern and intensity of anthropogenic activities, thereby indirectly affecting vegetation change [25,32,33]. The research generated the frequently used terrain variable, slope, by using elevation data (DEM).
2.2.3. Human Activity Factors
This study referred to the concept of the human footprint using three human pressure variables [34], land use/cover (LUCC), road impact index (Rii), and population density (Pd), to represent the human activity factor in this study.
Land use/cover refers to how humans use the land, such as for habitation, cultivation, production, etc. [35], and its changes are closely related to vegetation coverage or greenness [36]. These 2000/2020 data came from the Resources and Environmental Science and Data Center of China (RESDC) (https://www.resdc.cn/), with a spatial resolution of 1000 m. The land-use types in Longnan mainly include farmland, forestland, grassland, water area, building land and unused land.
The road data in this study from 2000 to 2020 came from the Resources and Environmental Science and Data Center (https://www.resdc.cn/) with a spatial resolution of 1000 m, including expressways, railways, national roads, provincial roads, rural roads, and another six types of roads (note that road data for 2000 were not available; therefore, 1995 road data were used as an alternative, assuming limited road network changes in Longnan during this short interval). The Euclidean Distance in ArcGIS 10.5 was used to calculate the shortest path (Dj) from each image element to that type of road (j). The latter had a low degree of influence on the former when the distance between the pixel points and the road was greater than 15 km [34]. Therefore, when the shortest distance between a pixel point and a particular type of road exceeded 15 km, the shortest path of that pixel point was set as 15 km. At this time, the overall effect of all kinds of roads on a pixel point was calculated according to Formula (1):
In the above formula, Rii is the total influence value of various roads in a certain pixel. j represents the j-th road type. Qj is the weight value of different road types. The larger the Rii, the stronger the road influence. The weights determined in this research are based on Yang et al. (2021) [6], namely 0.23, 0.21, 0.18, 0.12, 0.09, 0.07, 0.06 and 0.04 for highways, railroads, national roads, provincial roads, county roads, urban trunk roads, urban secondary roads and other roads, respectively.
Population size and gross domestic product are often considered as the main potential cause of anthropogenic activity intensity [37]. The 2000/2020 population density (Pd) data obtained from the World Socio-Economic Data and Applications Center (SEDAC) Gridded Population (GPW), v4 dataset (https://ciesin.columbia.edu/content/data, accessed on 1 September 2026), gross output value of domestic production (GDP) data came from the China Resources and Environment Science Data Center (https://www.resdc.cn/), with a spatial resolution of 1000 m.
2.3. Data Analysis
2.3.1. Vegetation Coverage and Trend Analysis
Since NDVI is sensitive to soil background values, it contains both vegetated and unvegetated land and can be used to invert vegetation cover based on the pixel dichotomy method, which is the simplest pixel decomposition method [38,39]. This method has a high accuracy, with correlation coefficients of 0.89–0.99 and covariances of 0.02–0.06 between the inversion and measurement values [2,40].
NDVIS is the NDVI for bare land and NDVIV is the NDVI for land entirely covered by vegetation. To get rid of some outlier interference, the NDVI value with a cumulative NDVI frequency of 5% is chosen as the NDVIS, while the NDVI value with a cumulative frequency of 95% is chosen as the NDVIV.
The interannual trend of vegetation change is represented by the slope of the least power linear regression equation of the multi-year values of each pixel. If K > 0, it indicates that the vegetation coverage increases; if not, it indicates that the vegetation coverage decreases during this period.
In Equation (3), the value of n is 21, i denotes the year number, and VCi represents the vegetation cover in the i-th year. Currently, there is no consistent standard for the K value classification. Considering the overall distribution of NDVI in the Longnan region, it was found to be in line with the normal distribution by calculating the change in the K value. To clearly present the variation in vegetation, referencing the significance results between levels [2], the change trend is divided into the following five levels: degradation (K ≤ −0.004), mild degradation (−0.004 < K < −0.001), stability (−0.001 ≤ K ≤ 0.001), mild improvement (0.001 < K < 0.004) and improvement (K ≥ 0.004). According to the ANOVA test, the differences among the five categories were statistically significant (p < 0.0001).
2.3.2. Random Forest (RF)
In this study, a total of 14 driving factors of human activities, climate, soil properties and topography were selected to determine the effects of driving factors on vegetation growth in Longnan. The importance of all driving factors was identified, and their explanatory degree quantified by a random forest (RF) algorithm [41]. The RF is an integrated approach presented by Breiman (2001) that extends the standard classification regression tree method by establishing a set of classification trees with binary divisions [41]. In the first place the RF creates N bootstrap samples of the trained dataset; secondly, regression trees are modeled for every bootstrap sample and the fitting degree of every tree is assessed using 1/3 selected out-of-bag data at random [42]; lastly, the predicted results are obtained by averaging the predicted values across all individual regression trees. The significance of each predictor factor was decided by evaluating the amount of increase in mean square error (IncMSE) between the observed and predicted values. Although RF cannot control the inner operation, its results can efficiently resolve the problems of overfitting and multicollinearity, so it is used widely in environmental science, ecology and other fields [43,44]. RF has three significant inner parameters, namely the value of splitting variables used to determine the optimal splitting tree for every tree node (mtry), the minimum value of decision tree nodes (nodesize) and the number of decision trees (ntree). In this research, the RF algorithm parameters mtry, nodesize and ntree are 3, 5 and 1000, respectively. The “randomForest” package was used for the calculation, and the “rfPermute” package was used to evaluate the importance of each driving factor, and cross-validated significance tests were used to improve the evaluation accuracy of all driving factors [22].
2.3.3. Structural Equation Modeling (SEM)
SEM contains a series of multivariate statistical methods, such as factor analysis, regression analysis, path analysis, and joint cubic modeling [45,46]. Structural equation modeling has three main advantages for causal analysis [47,48]: (1) A variable can be the dependent variable of one relation set or the independent variable of another relation set. (2) It is possible to analyze both observed variables and latent variables that cannot be directly calculated, which are usually combinations of observed variables [49]. For instance, the anthropogenic activity variables cannot be directly measured, but can be replaced by observed variables (e.g., GDP, Pd, Rii, etc.). (3) SEM can quantitatively identify direct and indirect causal relationships, while indirect influences arise from the interaction of latent variables. Given the above advantages, SEM is appropriate for exploring the influences of anthropogenic and natural factors on the change in vegetation.
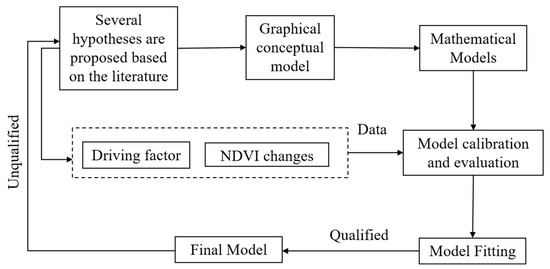
The construction of the SEM model mainly consists of the steps shown in Figure 2 [2,6,22]. Firstly, a graphical conceptual model is established by making hypotheses about the causal relationships among all variables based on knowledge from the literature. Then, the SEM conceptual model is converted to a mathematical model and calibrated against experimental or observational data. An unqualified model fit indicates that the conceptual and mathematical models need to be re-specified, and when the model fit is acceptable, the last SEM model is established. In this study, the SEM meta-model of vegetation change was constructed according to this process, and the causal relationships of all driving factors were summarized based on literature a priori knowledge, with topography, human activities, soil properties, and climatic factors as latent variables and other variables as observed variables (Figure S1). In the contemporaneous SEM, although temperature and precipitation were significantly correlated (the coefficients in 2000/2020 were 0.017 **, 0.344 **, p < 0.01), they were modeled separately as single climate variables because they affect vegetation through distinct mechanisms: temperature primarily influences vegetation growth by regulating photosynthesis and evapotranspiration, whereas precipitation affects vegetation mainly through water availability [2,6]. This approach of separating temperature and precipitation in SEM has been adopted in previous studies to avoid multicollinearity and to better distinguish their respective direct and indirect effects on vegetation [2,6].
Figure 2.
Flowchart for building SEM.
2.3.4. Data Processing and Model Calibration
In this paper, 26,506 calibration points of each factor were generated from the study area with the grid of 1000 m × 1000 m, extracting all driving factors from “2.2 Data sources” at each sampling point. Due to the limitations of model parameters, categorical variables (soil types and land use/cover) were coded according to alphabetical order in the RF model and on the basis of the RESDC classification system in the SEM.
The SEM was evaluated by maximum likelihood estimation. Whether the model achieves maximum optimization was assessed by several fit indices, including the comparative fit index (CFI), root mean squared error of approximation (RMSEA), root mean square residual (SRMR), the goodness of fit index (GFI), and normative fit index (NFI) [49,50,51]. If the initial model was barely fitted, it was corrected iteratively by removing the nonsignificant (p > 0.05) paths [52]. If SRMR is less than 0.08 the model is acceptable, if RMSEA is less than 0.08 the model is convergent, and if CFI, GFI, and RNI are close to 1, the SEM model fits well [53]. If a few models pass this criterion, the best model is decided by making a comparison between the Akaike information criterion (AIC) and the Bayesian information criterion (BIC) of the SEM models. SEM was performed using the “lavaan” package in R [49,54] (https://lavaan.ugent.be/).
3. Results
3.1. Spatio-Temporal Change in Vegetation
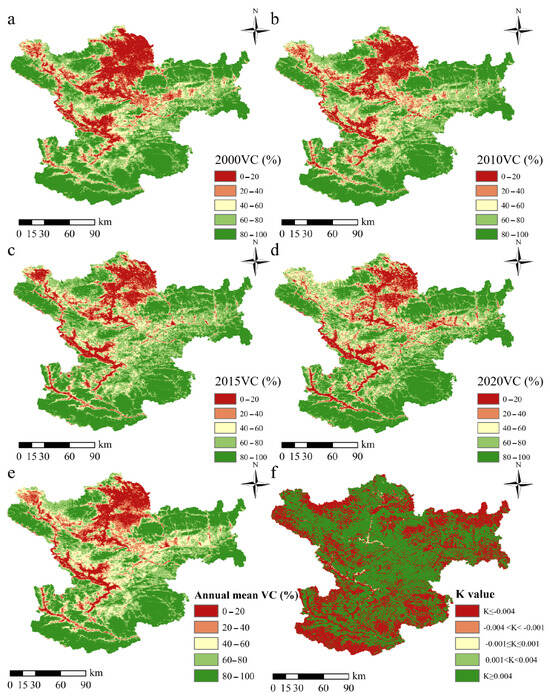
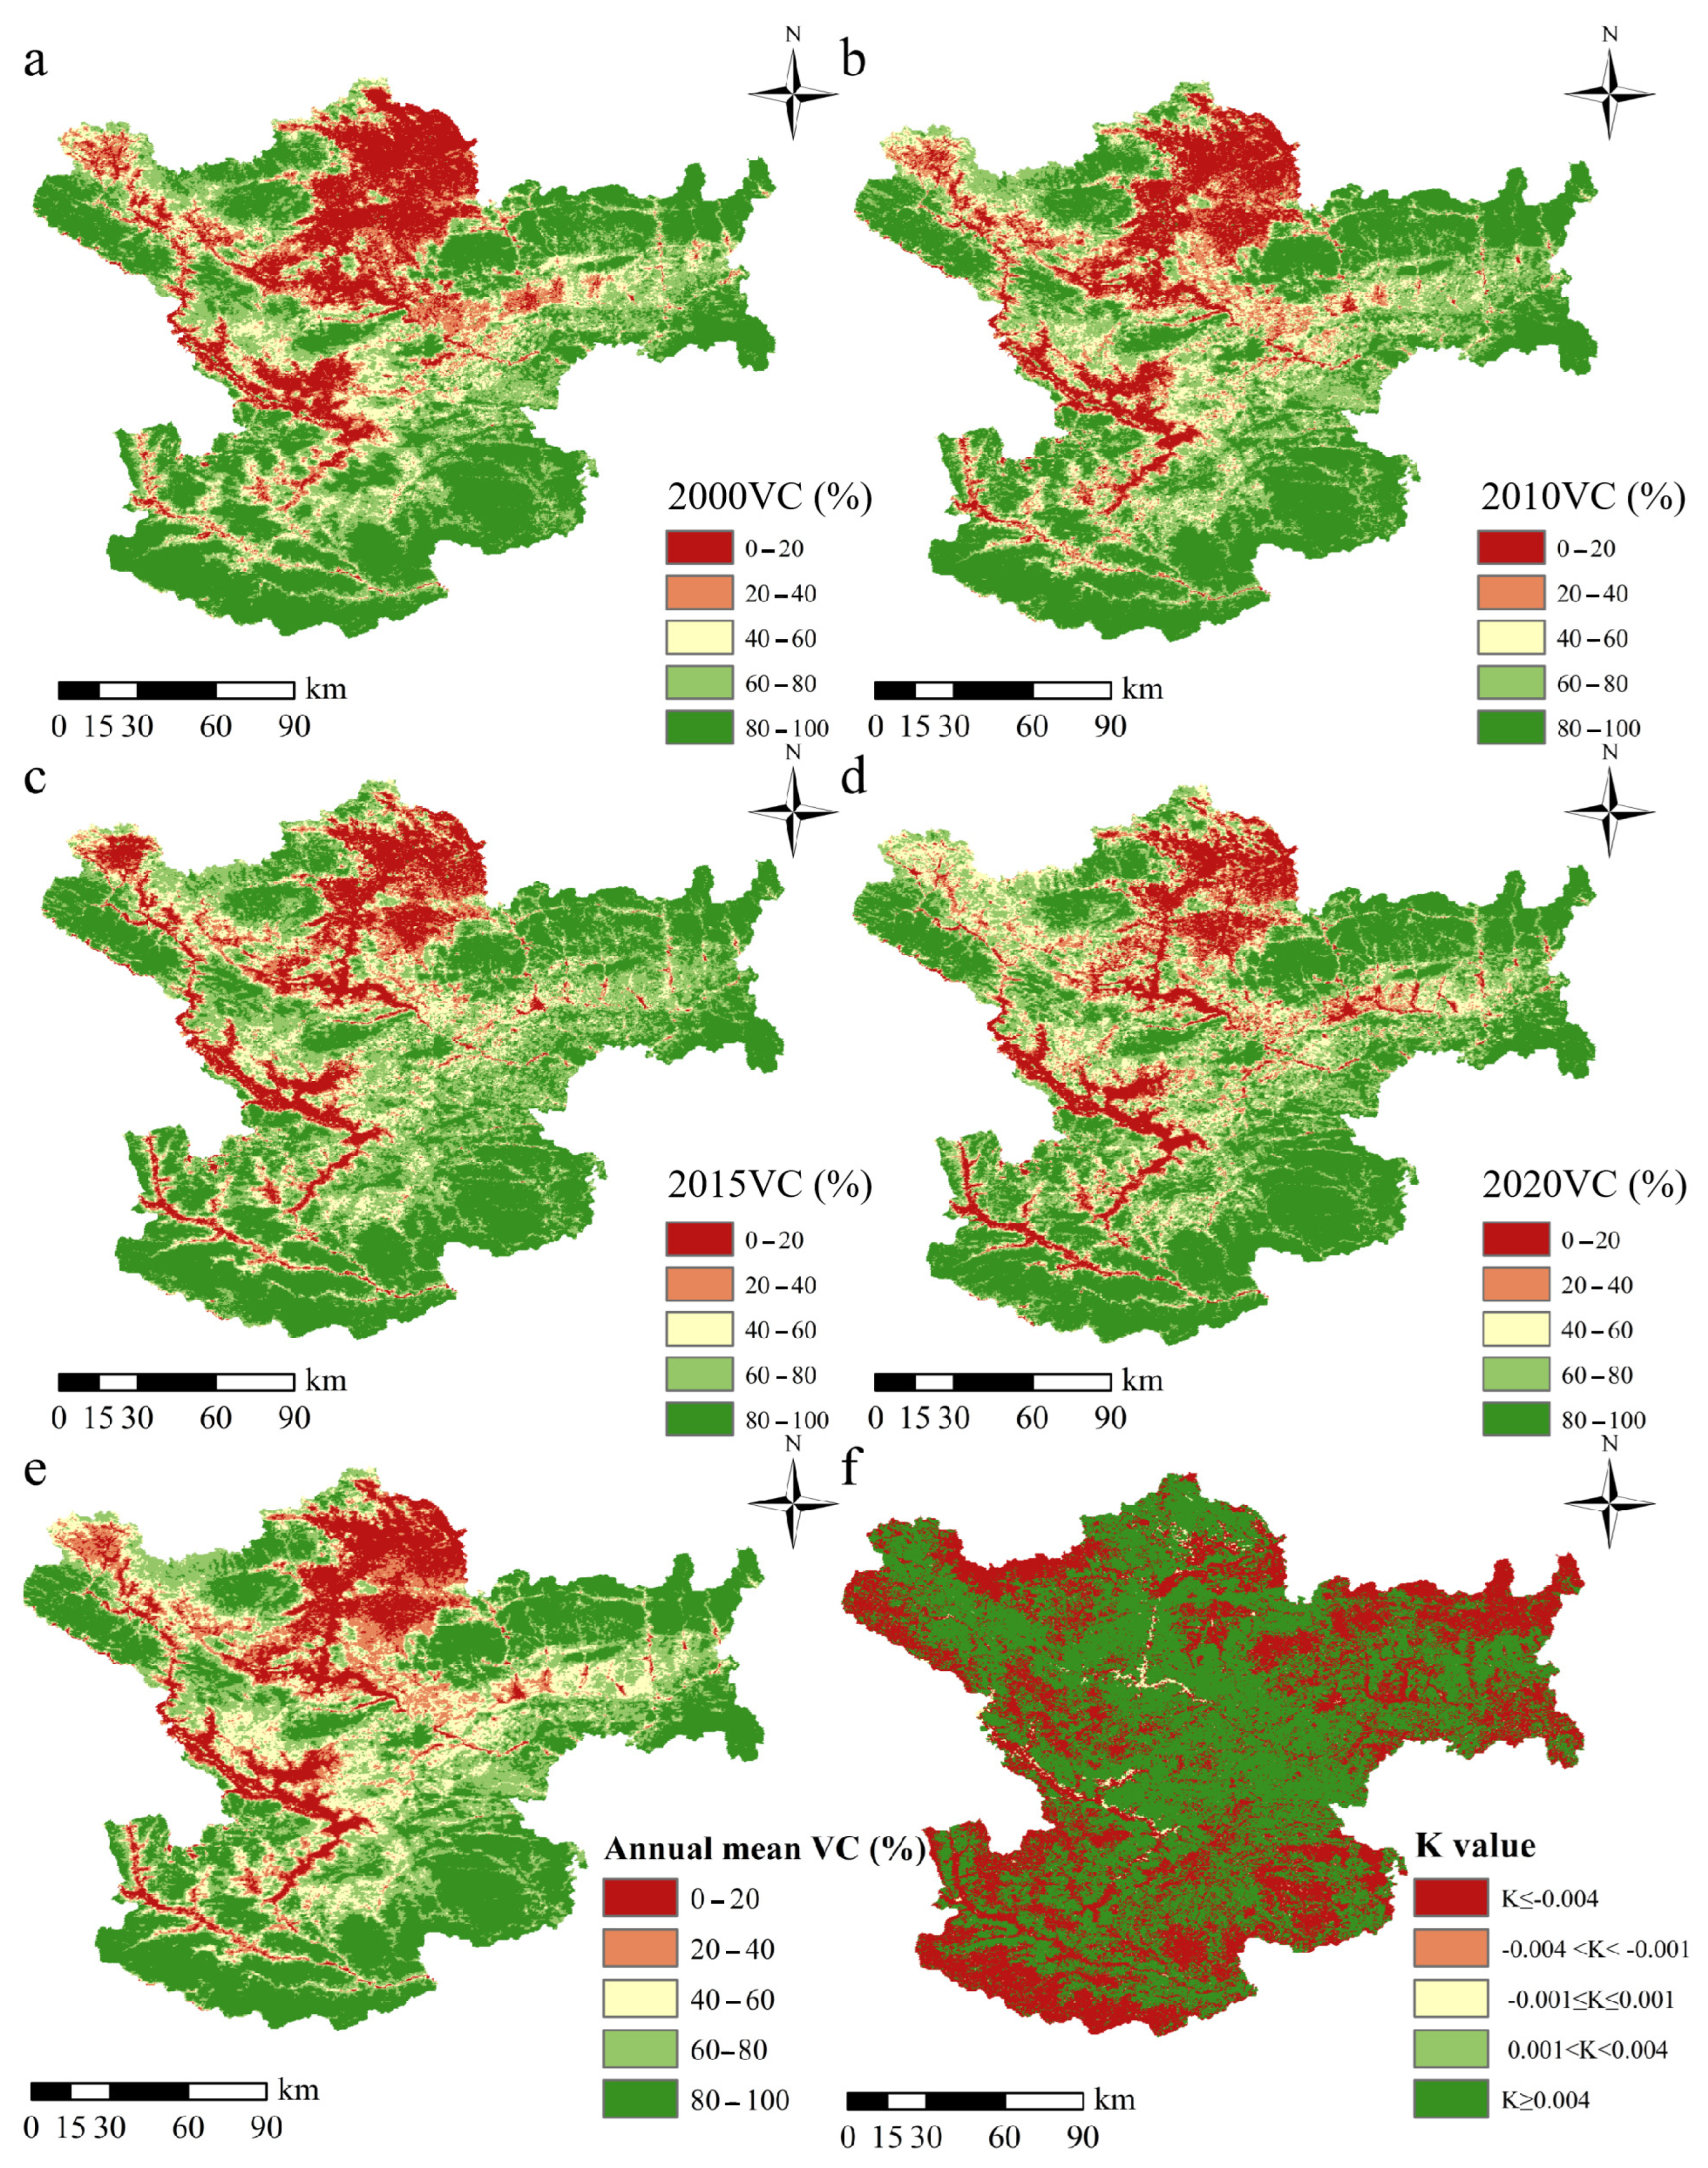
Most areas of Longnan had high or extremely high vegetation cover (>60%) from 2000 to 2020 (Figure 3a–d), with the area proportion fluctuating in the range of 63.00–67.72%, and the area share of vegetation cover below 40% ranging from 18.66% to 23.23% (Table 1). There was significant spatio-temporal heterogeneity in vegetation cover in Longnan over the 21 years; the areas of the central and northern regions with low vegetation cover decreased in 2020 compared to previous years (Figure 3a–d), mainly in the lower (<40%) vegetation cover areas. Compared with the starting year of the study, the reduction areas accounted for 4.53%, and the remaining areas showed good vegetation coverage, but the increased areas were also less, only 4.53% (Table 1). In addition, the regions with low annual mean vegetation coverage (<40%) were mostly situated in the northern and northwestern regions (Figure 3e), with 21.46% of areas, and 62.72% of the areas with average annual vegetation cover >60% (Table 1). The areas with the yearly average vegetation coverage of 20–40% were the least (merely 10.36%), which was similar to the spatio-temporal distribution pattern of vegetation from 2000 to 2020.
Figure 3.
Vegetation cover (VC) changes from 2000 to 2020 in the Longnan region. (a) Vegetation cover in 2000; (b) vegetation cover in 2005; (c) vegetation cover in 2010; (d) vegetation cover in 2020; (e) average annual vegetation cover; and (f) K values.
Table 1.
Area characteristics and changes in Longnan VC from 2000 to 2020.
In terms of interannual variation, vegetation cover showed a significant rising trend (R2 = 0.597, p < 0.001) during the study period (Figure S2), with annual mean vegetation cover ranging from 61.34% (in 2006) to 67.88% (in 2014). Overall, the vegetation cover of the Longnan region improved during 2000–2020 (mean K = 0.3603). The areas with mild vegetation degradation and degradation (K < −0.001) were mostly distributed in the surrounding regions, while areas with stable and improving vegetation cover were distributed in the central regions (Figure 3d). The area percentage of degraded (K ≤ −0.004) and improved (K ≥ 0.004) vegetation were similar and large, 40.92% and 57.95%, respectively (Table 2). However, the percentage of areas with insignificant and stable vegetation degradation and improvement (−0.004 ≤ K ≤ 0.004) was only 1.12% (Table 2), which was basically concentrated in the upper valley section of the Xihan and Bailong River basins flowing into Longnan. Combining the average annual vegetation cover and K values, regions with higher average annual vegetation cover had lower K values (Figure 3f). For instance, there was low vegetation coverage in the northern places of the research region, but the K values were high and there was a significant negative correlation between both (correlation coefficient R′ = −0.205 **, p < 0.001).
Table 2.
Areal distribution of annual average vegetation cover and K value classes in Longnan from 2000 to 2020.
3.2. Primary Driving Factors of Spatio-Temporal Vegetation Change
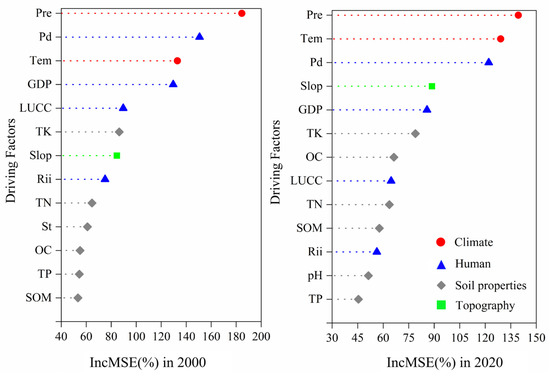
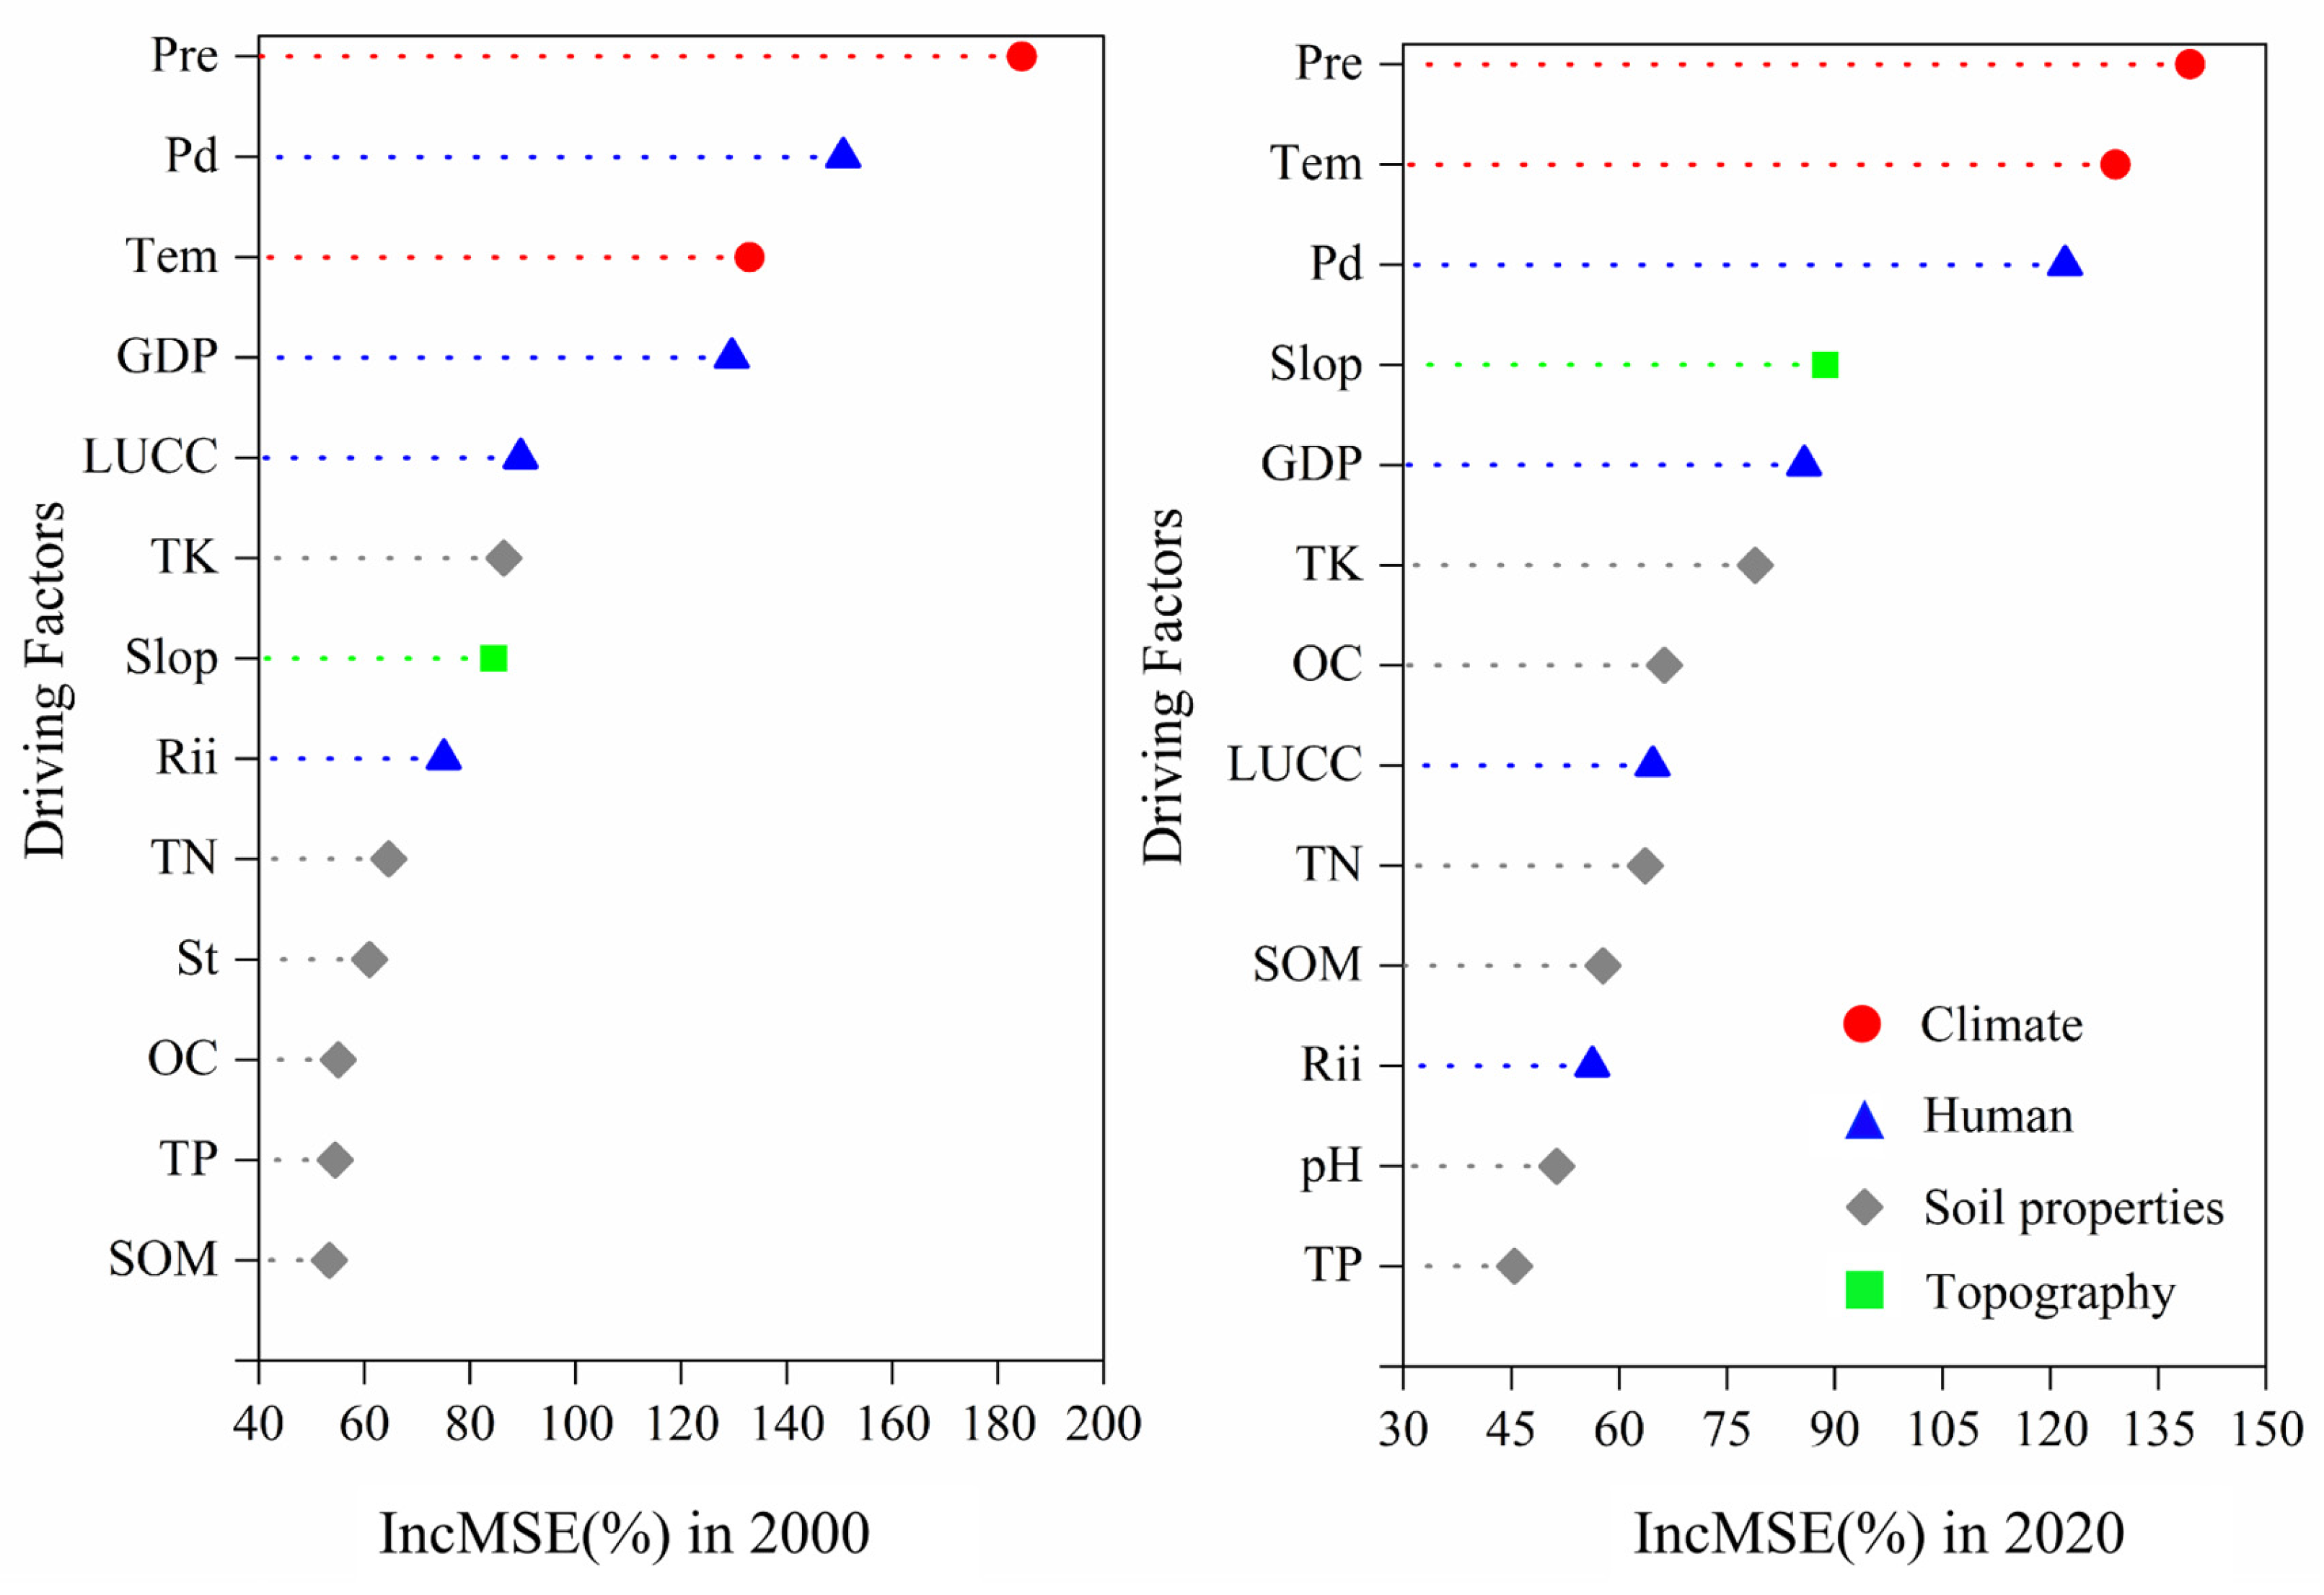
Considering the integrality of datasets on natural and anthropogenic driving factors over the 21-year study period (2000–2020), and based on previous studies on vegetation change using machine learning algorithms [2,6], only vegetation cover data for 2000 and 2020 were selected as the dependent variable in this paper. Finally, 19 driving factors were selected for the random forest (RF) model calculation, and the most significant driving factors affecting the vegetation cover (NDVI) in Longnan were identified as 13 of these (with the lowest tolerance of 0.0034 and 0.0029, respectively). The results of the RF model operation explained 82.62%/72.39% of the vegetation change in 2000/2020. The relative contribution degree of the 13 driving factors exhibited differences in the two years (Figure 4, Table S1). According to the %IncMSE results (expressed as percentage increases in mean squared error upon variable permutation), precipitation (Pre) (184.53%, p < 0.01) was the most critical and total organic matter (SOM) (53.36%, p = 0.019) was the weakest among the driving factors in 2000; the importance of precipitation (Pre) (139.44%, p < 0.01) remained the strongest in 2020, while total phosphorus (TP) (45.45%, p < 0.01) was the weakest. The RF model results for 2000 and 2020 reflect that the most considerable factors influencing vegetation in Longnan were both climatic factors (Per and Tem). The second most important factors were population density (Pd) and gross domestic product (GDP) as the anthropogenic activity factor, while soil properties and topography were inferior to the first two factors.
Figure 4.
Importance of driving factors of vegetation cover in Longnan area in 2000/2020. Pre: precipitation; Tem: temperature; St: soil types; TN: total nitrogen; TK: total potassium; TP: total phosphorus; pH: potential of hydrogen; SOM: organic matter; OC: organic carbon; Slop: slope; LUCC: land use/cover; Rii: road impact index; Pd: population density; the importance values are %IncMSE (percentage increase in mean squared error when the variable is permuted), directly output from the random forest model.
3.3. SEM Model Construction for Spatio-Temporal Vegetation Change
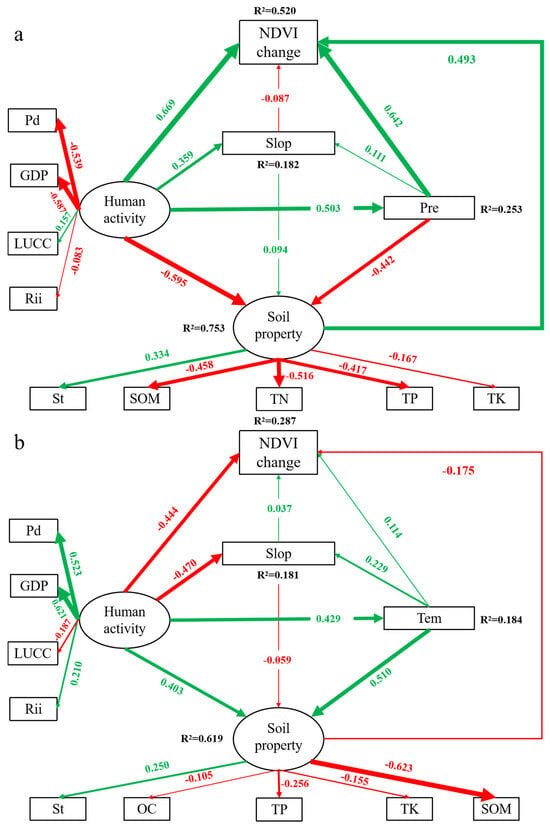
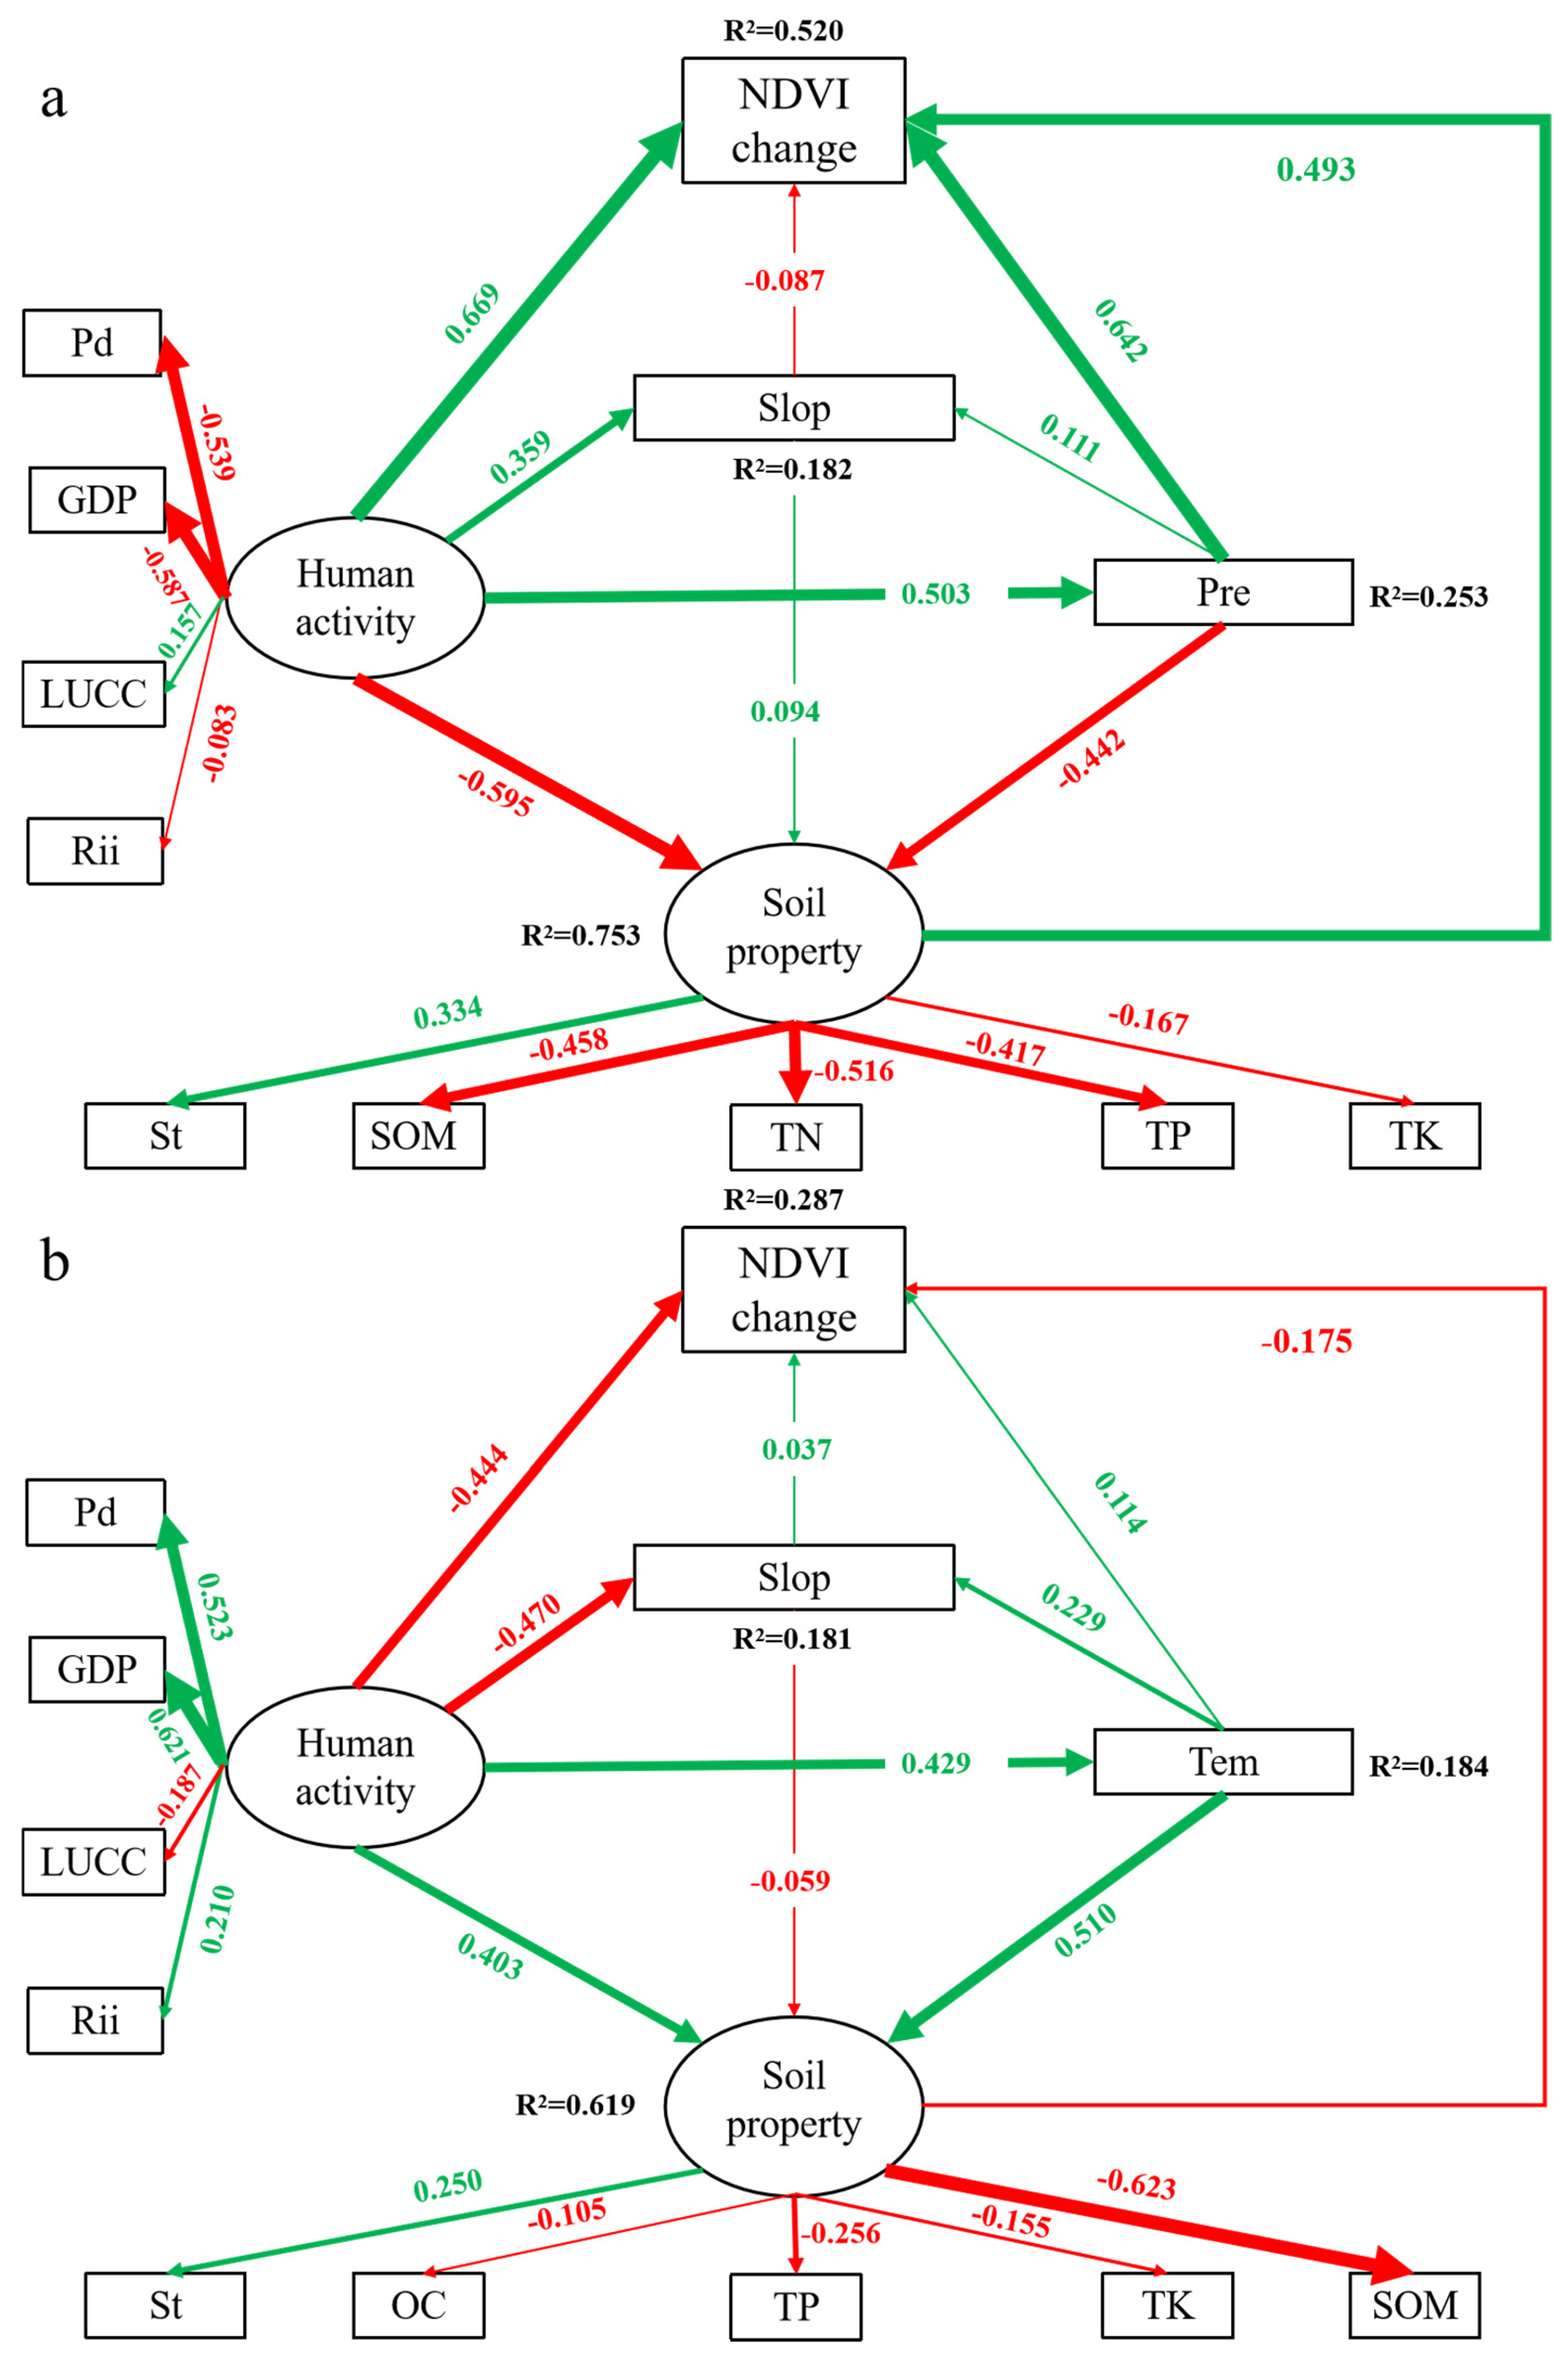
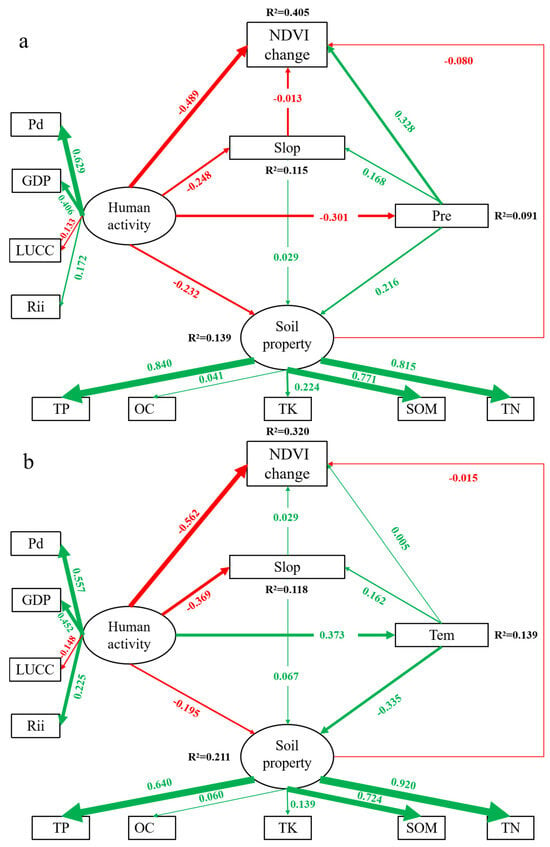
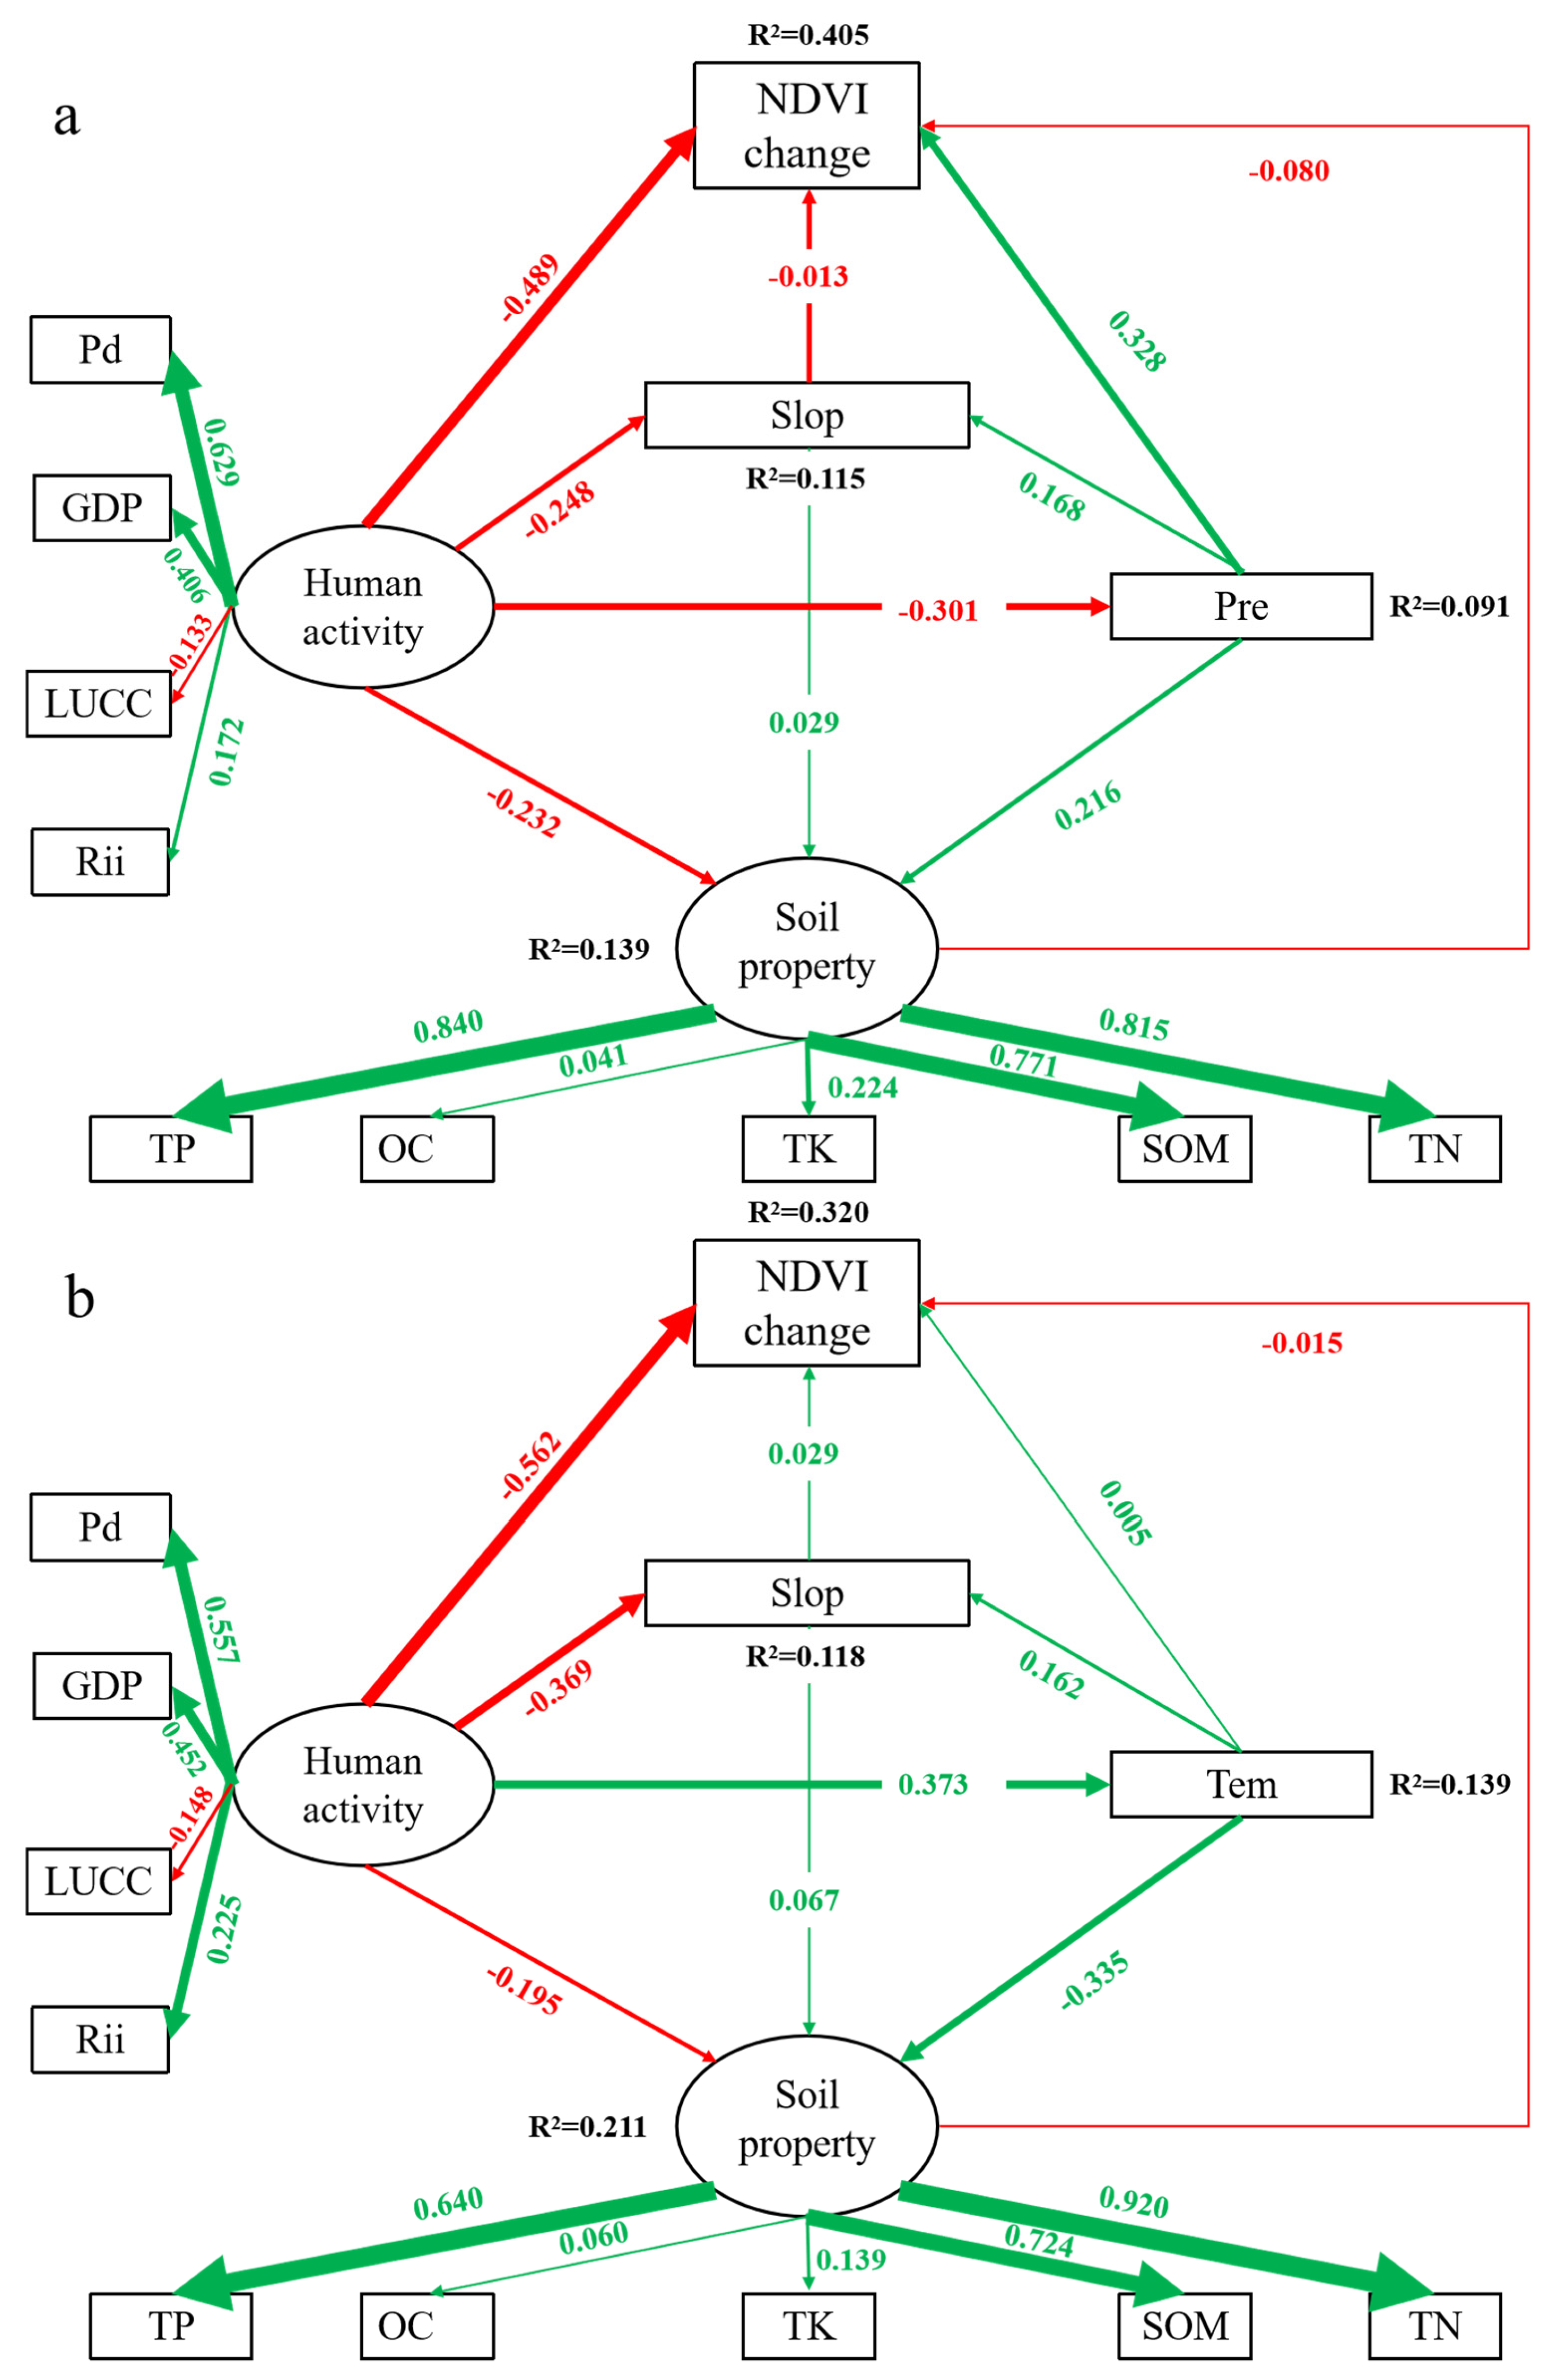
The final structural equation model showed that the interactions between the variables were well supported (Figure 5 and Figure 6). The final goodness of fit of the model in 2000 was: GFI = 0.970, CFI = 0.953, NFI = 0.953, RMSEA = 0.051, SRMR = 0.042, and DF = 45 (Pre model) and GFI = 0.962, CFI = 0.905, NFI = 0.905, RMSEA = 0.060, SRMR = 0.050, and DF = 39 (Tem model). The final goodness of fit of the model in 2020 was GFI = 0.975, CFI = 0.945, NFI = 0.944, RMSEA = 0.070, SRMR = 0.046, and DF = 45 (Pre model) and GFI = 0.965, CFI = 0.943, NFI = 0.942, RMSEA = 0.070, SRMR = 0.050, and DF = 47 (Tem model), indicating a good model fit. NDVI was affected differently by climate change, topographic factors, soil properties and changes in human activities (Figure 5 and Figure 6). The observed variables OC/TN and pH in soil properties did not pass the significance test in 2000 and 2020 (p > 0.05), so the pathway was deleted. Climate change not only had direct effects on NDVI, but also indirect effects, for example, by affecting topographic factors and soil properties (Figure 5 and Figure 6); similarly, human activities not only had a direct influence on NDVI, but also had an indirect influence on NDVI through the topographic factor (Slop), soil properties and climatic factors (Pre and Tem) (Figure 5 and Figure 6); the topographic factor also had an indirect effect on NDVI through soil properties.
Figure 5.
Final structural equation model for Longnan 2000. (a) SEM of precipitation (Pre); (b) SEM of temperature (Tem). Note: The thickness of the green and red solid lines indicates the magnitude of the positive and negative impact path coefficients, respectively.
Figure 6.
Final structural equation model for Longnan 2020. (a) SEM of precipitation (Pre); (b) SEM of temperature (Tem). Note: The thickness of the green and red solid lines indicates the magnitude of the positive and negative impact path coefficients, respectively.
The calculation process and results of the direct and indirect effects of each driver for 2000–2020 are detailed in Tables S2 and S3. In the 2000 SEM (Pre) (Table 3), human activities had an important impact on vegetation cover in Longnan, including positive direct effects and indirect effects through soil properties, slope and precipitation (standardized path coefficient: r = 0.669). The total positive influences of human activities were basically due to the positive effect of LUCC (r = 0.157). In addition, precipitation and soil properties had a positive direct effect on vegetation cover, and slope had negative effects (Figure 5a). However, in the 2000 SEM (Tem), human activities had the largest negative direct effect on vegetation (r = −0.444), followed by soil properties (r = −0.175), mainly from indirect influences of slope (Slop) and negative effects of nutrients (OC, TP, TK and SOM) on soil properties (Figure 5b). In addition, both slope and temperature had positive direct influences on NDVI. In the 2020 SEM (Pre) (Table 4, Figure 6a), human activities had the largest negative effect on NDVI (r = −0.489), precipitation still had a positive effect on vegetation (r = 0.328), and the topographic factor (Slope) and soil properties had smaller negative effects (r = −0.015, −0.080). The 2020 SEM (Tem) results were similar to the 2000 results, with negative direct effects on NDVI for both anthropogenic factors (r = −0.562) and soil properties (r = −0.015), while positive effects remained for temperature (r = 0.015) and slope (r = 0.028). The negative influence of anthropogenic activities also came from the negative effect of LUCC (r = −0.133, −0.148; Figure 6). Overall, in terms of the total effect of the driving factors on NDVI, the positive effects of human activities gradually changed to negative effects in the precipitation model from 2000 to 2020; climate factors have always maintained a positive influence and the positive influence of precipitation was always greater than that of temperature; different direct and indirect positive and negative effects were presented by the topographic factor slope in 2000 and 2020; and there was also a negative effect of soil properties on NDVI except in 2000 (Pre model), but the coefficient was small. The SEM results revealed that the effect of the essential driving factors on vegetation coverage in the Longnan area changed dynamically and varied significantly in different periods.
Table 3.
Direct and indirect effects of various driving factors on vegetation based on the SEM in 2000.
Table 4.
Direct and indirect effects of various driving factors on vegetation based on the SEM in 2020.
4. Discussion
4.1. Spatio-Temporal Changes in Vegetation Coverage
The complex process of vegetation change was often driven by a combination of natural and anthropogenic disturbances [21,55,56]. From 2000 to 2020, vegetation cover in the Longnan region exhibited a significant upward trend within the 95% confidence interval (Figure S2), indicating an overall improvement in vegetation conditions. This improvement was largely driven by large-scale ecological restoration projects, particularly the Grain for Green Program, which was initiated in 1999 and expanded thereafter [57,58]. Thus, government policies (especially ecological management) have been crucial for vegetation coverage over the past several years [59]. However, the low vegetation cover in central and northern Longnan was associated with significantly higher GDP and population density (PD) than in other regions (Figure 3 and Figure S3). This pattern likely reflects the negative effects of accelerated urbanization and rapid economic and population growth, which have damaged local vegetation [2,60], as well as deforestation and urban expansion, which have altered local pristine ecosystems [57]. At the same time, under the influence of global climate change, climatic variables can alter plant growth conditions, and thus affect the vegetation coverage of regional environments [61]. There was an increasing trend of temperature and precipitation from northwest to southeast in Longnan (Figure S3), with temperature and precipitation playing different roles in different areas [62]. Temperature changes can affect vegetation evapotranspiration and further affect vegetation growth [63]. Studies showed that precipitation is significantly and positively correlated with NDVI [64], and fluctuating changes in precipitation can also affect the water requirements of vegetation growth [65]. The areas with insignificant and stable vegetation degradation and improvement (−0.004 ≤ K ≤ 0.004) were mostly centered in the Xihan River and Bailong River basins that flowed into Longnan (Figure 3d). This was due to the fact that higher soil moisture alleviated water stress, which in turn enhanced the efficiency of light and heat utilization and ultimately promoted vegetation greening [3,66]. The results of the combined average annual vegetation cover and K values showed that higher average annual vegetation cover had lower K values (Figure 3e,f). There was a significant negative correlation between the two, which was mostly concentrated in the surrounding research area (Figure 3d). Over the study period, the annual average vegetation cover in the Longnan area was relatively high and exhibited an improving trend. This trend was largely shaped by local topography and soil properties, while grassland and forestland dominated the land-use/cover types (Figure S3). However, the high elevation of the northwest and surrounding areas (Figure 1) hinders vegetation greening when the elevation is greater than 1500 m [16,67]. Furthermore, there was a significant difference between vegetation cover and elevation in different land-use (grassland and forestland) types [68], and the NDVI decreased with elevation while the vegetation type changed from forest to sparse herbaceous vegetation [69]. From the land-use transfer matrix chord diagram (Figure S4), the area of grassland and forestland transferred to farmland was the largest in this region (about 153.34 km2), thus further explaining the existence of vegetation degradation in the surrounding areas of Longnan.
4.2. Main Controlling Factors of Vegetation Change
At the regional scale, vegetation cover dynamics were strongly influenced by climatic driving factors [6,64] and limited by geological background conditions (e.g., soil properties or topography) [2,18]. Furthermore, human activities were also a major controlling factor [6,29]. Nevertheless, most of the research only explored the influences of single natural or human disturbance factors on vegetation and has not fully explored the relative contributions of multi-type driving factors. This study integrated RF with SEM to quantify the relative importance of natural and human-activity variables on vegetation cover and to reveal the driving mechanisms across spatio-temporal scales. Similar to the outcomes of former research [29,64,70], the most significant effect of human activities on vegetation in the Longnan area was observed in the final SEM in 2000 and 2020, and the impact was mainly from the change in land use by human activities (Figure 5 and Figure 6; Table 3 and Table 4). Particularly, greening policies were implemented on a large scale to restore damaged and fragile ecosystems in the study area before 2000, including afforestation, urban greening, agricultural improvements and policies to protect natural areas and natural protected forests [29,59]. Thus, anthropogenic activity factors had the most remarkable positive influence (r = 0.663) on the change in vegetation, and ecological restoration programs had a positive effect on the vegetation and ecosystems of the region [29,59]. The research confirmed that human activities, especially land use (land conversion, management measures and afforestation projects, etc.), were critical factors in the recovery of vegetation in 2000, indirectly contributing to the recovery of vegetation and even improving the regional ecological environment [59,69,71]. As anthropogenic activities to modify the natural environment intensified, resulting in increasing land-use shifts, ecosystems were under unprecedented pressure, and geological hazards, for instance, mudslides, landslides and soil erosion became increasingly serious, thus affecting vegetation cover conditions [27]. Human activities gradually changed from positive effects in 2000 to negative effects in 2020; a series of ecological reconstruction activities caused a large increase in the area of forestlands and grasslands. In the Pre model, precipitation acted as a mediating pathway through which early-stage ecological restoration policies exerted positive effects on vegetation via improved land use; when temperature was used as the climatic driver instead, this mediating pathway weakened, and the direct negative effects of anthropogenic activities (such as urbanization and land-use intensification) became more pronounced even in 2000. However, in recent years, with socio-economic development, anthropogenic activities have destroyed land use, especially woodland and grassland [29,72], resulting in significant degradation of vegetation cover (40.92% of the area with K ≤ −0.004) in the surrounding areas of Longnan (Figure 3d). This shift implies that while large-scale ecological restoration programs (e.g., the Grain for Green Program) have effectively promoted vegetation recovery, their benefits may be offset by subsequent land-use intensification and urban expansion. Therefore, policymakers should prioritize the consolidation of existing restoration gains through stricter protection of reforested areas and more sustainable land-use planning. It should be noted that our framework cannot directly isolate the specific contribution of ecological restoration policies. This inference is supported by the temporal coincidence between the Grain for Green Program (initiated in 1999 and expanded after 2000) and the positive anthropogenic effect observed in 2000 (r = 0.663; Table 3), as well as by previous studies confirming the effectiveness of ecological programs in this region [29,59]. Future policy evaluation studies are needed to directly quantify their causal effects.
The climatic factors always maintain a positive effect, and the total positive impact of precipitation was always greater than that of temperature during 2000–2020 (Table 3 and Table 4). Research has shown that temperature and precipitation are crucial driving factors influencing the growth of vegetation [29,73], and can also influence nutrient availability by affecting the decomposition of soil organic matter. The temperature was mainly influenced by topography, and its spatial distribution has similarity with altitude [18,69], with higher temperatures typically leading to longer growing periods and higher photosynthetic rates [74]. However, precipitation affects water availability for vegetation growth and was influenced by several factors [75]. Therefore, changes in temperature and precipitation have different importance in influencing the evolutionary trends of vegetation growth. However, when compared to climate change, the implementation of ecological projects can better contribute to the recovery of vegetation. The predominant positive effect of precipitation over temperature implies that water availability remains the primary climatic constraint on vegetation growth in this semi-humid region. Under future climate change scenarios, adaptive water resource management, including the protection of watershed hydrological functions and the construction of small-scale water conservation facilities, will be critical to sustaining vegetation recovery.
Longnan is located in a mountainous region with a unique and complex geomorphological structure. The topographic factor (Slope) exhibited different influences in the temperature and precipitation SEM models. In this model, slope (Slop) was treated as a moderating variable rather than a mediator in the temporal causal sense. This could be explained by the fact that topography primarily affected vegetation indirectly by regulating water and heat conditions (temperature and precipitation) [76], and that slope orientation modulated microclimate by influencing the flux of water and heat between the land surface and the atmosphere, thereby regulating vegetation growth and its response to background climate change [77]. Consequently, the diverse slope and soil properties across different areas generated spatial heterogeneity in vegetation responses to climatic variables [29,77]. This interpretation is consistent with recent findings that topography, especially elevation, affect vegetation growth indirectly by influencing climatic change [78], and that slope and aspect mainly affect vegetation response to climate change by regulating precipitation [76]. Moreover, the different levels of relative importance of natural background factors on vegetation cover are also influenced by various climatic factors [2]. The slope range of Longnan was 0–57°, of which the proportion of less than 40° was 98.31%. Zhou et al. (2021) [74] found a rising tendency of vegetation with a slope range of 0–40°, which explains the stronger positive than negative effect of slope in this study. In addition, the Green Grain Program (GGP), launched in 1999, prohibits the cultivation of land above 25°, which has also improved the vegetation ecology of the area. Vegetation growth benefits from nutrients in the soil, but temperature and moisture can negatively affect the soil carbon cycle by negatively affecting the accumulation of organic matter in the soil, which affects not only the soil carbon cycle but also the vegetation carbon cycle [2,79,80], so these interactions can lead to a weak negative effect of soil properties on NDVI. In addition to land-use conversion, the degradation in surrounding high-elevation areas was also constrained by elevation-related ecological mechanisms. First, temperature decreases with elevation; although high-elevation regions experience faster warming, this warming simultaneously exacerbates soil water deficits, which in turn limits vegetation greening rates [81]. Second, soil development is restricted at higher elevations, where low temperatures slow organic matter decomposition and nutrient mineralization, resulting in significantly reduced nitrogen and phosphorus availability with increasing elevation [82,83]. Third, vegetation types shift along elevational gradients from forests to shrublands and herbaceous cover; these high-elevation vegetation types are more sensitive to anthropogenic disturbance and have weaker recovery capacity [78]. In our study area, the conversion of grassland and forestland to farmland (approximately 153.34 km2) further compounded the vulnerability associated with elevation effects. This is particularly evident on steeper slopes, where agricultural activities accelerate soil erosion and hinder natural regeneration [84]. The combined effects of the elevation-related ecological mechanisms and land-use conversion together explain why net vegetation degradation occurred in the surrounding high-elevation areas of Longnan, despite the overall greening trend observed in the region [85]. The significant degradation observed in surrounding high-elevation areas indicates that current ecological policies may need to be refined to account for topographically constrained recovery capacity. Differentiated management strategies—such as grazing restrictions, soil conservation measures, and afforestation with locally adapted species—should be implemented for these vulnerable zones [86].
4.3. Serviceability and Limitations of the SEM Method
Currently, the intricate interactions of driving factors are hardly ever explored in research on vegetation dynamics evolution and their driving mechanisms. Structural equation modeling (SEM) considers all relevant variables as much as possible and explores the causal networks among these driving factors, and is therefore considered a very practical quantitative approach [45,46,49,87]. In this research, human activities, climate, soil properties and topographic factors were defined as latent variables, and their interactive relationships with vegetation cover were quantified. In addition, SEM delineates the direct and indirect influences of driving factors for NDVI changes, and the indirect effects primarily result from the interrelationship of latent variables. For example, human activities (latent variables) not only affect vegetation growth directly, but also influence NDVI changes through their effect on topographic factors (Slope) in this study, so there was also an indirect effect of human activities on NDVI (Figure 5 and Figure 6).
The correlation of different variables with NDVI (Figure S5, Table S4) revealed that precipitation (Pre) had a positive correlation with NDVI, with the greatest correlation coefficient, followed by population density (Pd) among human activity factors (negative coefficient), soil type (St) and pH among soil properties (negative coefficient), and topography factor (Slope) (positive coefficient). In conclusion, soil properties and topographic factors showed significant correlations with NDVI changes. However, the total effects of soil properties and topography compared to human activities and climatic factors were not too high based on the findings of the SEM method (Table 3 and Table 4). This was primarily due to the diverse computational mechanisms of correlation analysis and SEM models, where correlation analysis can merely estimate the degree of correlation of one variable with another variable and has not yet considered the interactions of other variables [6,46]. Correlation analysis can offer an important reference for understanding the relationship between vegetation change and its driving factors, but this method cannot explain the quantitative effects of individual variables on NDVI changes on account of the interaction of different driving factors [88]. In contrast, the standardized path coefficients of the SEM can explain the coupling effect between the two variables by removing the effects of other driving factors [49]. Moreover, SEM can quantify the total effect of latent and observed variables by measuring the direct and indirect influences of independent variables on dependent variables [89,90,91].
Nevertheless, there are limitations of the SEM model in this study, such as the fact that driving factors and NDVI are generally not absolutely linearly related. Nevertheless, it was difficult to quantify the intricate relationships for non-linearities, and more research on such non-linearities ought to be explored in the future. In addition, the fitted models did not completely explain the variation (R2) in vegetation coverage changes, which needs to be explored further. Nevertheless, the goodness-of-fit metrics in this paper show the good fit of the proposed model. In addition, several data substitutions were unavoidable due to data availability constraints. Specifically, 1995 road data were used as a substitute for 2000, and static 2009 soil data for both years. We acknowledge that these substitutions introduce a degree of uncertainty, and future research should incorporate higher-quality time-matched data to reduce uncertainty when such data become available.
5. Conclusions
The direct and indirect influences of anthropogenic activities, climate, topography and soil properties on vegetation change in Longnan were quantified by utilizing the machine learning algorithm random forest (RF) and structural equation modeling (SEM) in this research. The RF model results showed that each driving factor explained 82.62%/72.39% of the spatial variation in vegetation cover in 2000/2020, with the relatively high importance of climate and human factors. The ecological rehabilitation policy resulted in an overall improving trend in vegetation cover in the area (K = 0.3603). The differences in land use and elevation in the research area resulted in a significant negative correlation between annual mean vegetation and K values (p < 0.001), leading to vegetation degradation in the surrounding areas. The final SEM results revealed that the influence of the primary factors of RF screening on vegetation cover varies dynamically over the years. The response of vegetation to human activities in the precipitation model gradually changed from a positive to a negative effect over the study period, mainly due to anthropogenic activities changing land use. Climatic factors consistently exerted positive effects on vegetation, with precipitation showing a stronger influence than temperature. Topographic effects were also positive, as 98.31% of the slopes were less than 40°, which favored vegetation growth. Soil effects shifted from positive to negative, though the negative coefficient was small, likely related to changes in soil organic matter. The machine learning algorithms RF and SEM revealed the direct and indirect influences of the driving factors behind the vegetation evolution patterns and clarified the underlying causes of vegetation change in this research, which has a clear advantage in exploring the driving mechanisms of vegetation change in mountainous areas. The methods proposed a new framework for clarifying the intricate spatio-temporal changes in vegetation, and also provided an essential scientific reference for making the vegetation evolution clear at the global scale.
Supplementary Materials
The following supporting information can be downloaded at: https://www.mdpi.com/article/10.3390/earth7050148/s1, Figure S1: Meta-model of structural equation model of vegetation change and driving factors in 2000 and 2020; Figure S2: Temporal trends of vegetation cover in Longnan from 2000–2020; Figure S3: Spatial distribution of land use/cover (LUCC), gross domestic product (GDP), population density (Pd), temperature (Tem) and precipitation (Pre) in Longnan region in 2000/2020; Figure S4: LUCC transfer matrix of Longnan area from 2000–2020; Figure S5: Correlation of different variables with NDVI; Table S1: Significance of driving factors of vegetation change and their significance test results in 2000 and 2020; Table S2: Calculation method of direct and indirect effects of various driving factors on vegetation based on the SEM method in 2000; Table S3: Calculation method of direct and indirect effects of various driving factors on vegetation based on the SEM method in 2020; Table S4: Correlation coefficients of different variables with NDVI.
Author Contributions
Conceptualization, X.X., Z.Z., J.N., S.C. and F.Y.; methodology, X.X., Z.Z.; software, J.N. and S.C.; validation, X.X., Z.Z., J.N., S.C. and F.Y.; formal analysis, X.X. and Z.Z.; investigation, X.X. and Z.Z.; resources, X.X., Z.Z., J.N., S.C. and F.Y.; data curation, X.X., Z.Z., J.N., S.C. and F.Y.; writing—original draft preparation, X.X.; writing—review and editing, F.Y.; visualization, J.N. and S.C.; supervision, F.Y.; project administration, X.X. and F.Y.; funding acquisition, X.X. All authors have read and agreed to the published version of the manuscript.
Funding
This work was supported by the Special Research Fund of Southwest Forestry University (Grant No. 1102250006), the Scientific Research Fund project of the Education Department of Yunnan Province (Grant No. 2025J0631; Grant No. 2026J0668) and the Basic Research Special Project—Youth Project (Category C) of the Department of Science and Technology of Yunnan Province (Grant No. 202601CI070046).
Data Availability Statement
The raw data supporting the conclusions of this article will be made available by the authors on request.
Acknowledgments
We would like to express our sincere gratitude to the editors and reviewers who have put considerable time and effort into their comments on this paper.
Conflicts of Interest
The authors declare no conflict of interest.
References
- Pettorelli, N.; Vik, J.O.; Mysterud, A.; Gaillard, J.M.; Tucker, C.J.; Stenseth, N.C. Using the satellite-derived NDVI to assess ecological responses to environmental change. Trends Ecol. Evol. 2005, 20, 503–510. [Google Scholar] [CrossRef] [Scilit]
- Hao, J.; Xu, G.; Luo, L.; Zhang, Z.; Yang, H.; Li, H. Quantifying the relative contribution of natural and human factors to vegetation coverage variation in coastal wetlands in China. Catena 2020, 188, 104429. [Google Scholar] [CrossRef] [Scilit]
- Liu, H.; Jiao, F.; Yin, J.; Li, T.; Gong, H.; Wang, Z.; Lin, Z. Nonlinear relationship of vegetation greening with nature and human factors and its forecast–A case study of Southwest China. Ecol. Indic. 2020, 111, 106009. [Google Scholar] [CrossRef] [Scilit]
- Scheffer, M.; Carpenter, S.; Foley, J.A.; Folke, C.; Walker, B. Catastrophic shifts in ecosystems. Nature 2001, 413, 591–596. [Google Scholar] [CrossRef] [Scilit]
- Piao, S.; Wang, X.; Ciais, P.; Zhu, B.; Wang, T.A.O.; Liu, J.I.E. Changes in satellite-derived vegetation growth trend in temperate and boreal Eurasia from 1982 to 2006. Glob. Change Biol. 2011, 17, 3228–3239. [Google Scholar] [CrossRef] [Scilit]
- Yang, L.; Shen, F.; Zhang, L.; Cai, Y.; Yi, F.; Zhou, C. Quantifying influences of natural and anthropogenic factors on vegetation changes using structural equation modeling: A case study in Jiangsu Province, China. J. Clean. Prod. 2021, 280, 124330. [Google Scholar] [CrossRef] [Scilit]
- Díaz, S.; Pascual, U.; Stenseke, M.; Martín-López, B.; Watson, R.T.; Molnár, Z.; Shirayama, Y. Assessing nature’s contributions to people. Science 2018, 359, 270–272. [Google Scholar] [CrossRef] [Scilit]
- Tao, H.; Li, M.; Wang, M.; Lü, G. Genetic algorithm-based method for forest type classification using multi-temporal NDVI from Landsat TM imagery. Ann. GIS 2019, 25, 33–43. [Google Scholar] [CrossRef] [Scilit]
- Leroux, L.; Bégué, A.; Seen, D.L.; Jolivot, A.; Kayitakire, F. Driving forces of recent vegetation changes in the Sahel: Lessons learned from regional and local level analyses. Remote Sens. Environ. 2017, 191, 38–54. [Google Scholar] [CrossRef] [Scilit]
- Liu, Z.; Menzel, L. Identifying long-term variations in vegetation and climatic variables and their scale-dependent relationships: A case study in Southwest Germany. Glob. Planet. Change 2016, 147, 54–66. [Google Scholar] [CrossRef] [Scilit]
- Zhou, Y.; Yue, D.; Li, C.; Mu, X.; Guo, J. Identifying the spatial drivers of net primary productivity: A case study in the Bailong River Basin, China. Glob. Ecol. Conserv. 2021, 28, e01685. [Google Scholar] [CrossRef] [Scilit]
- Rounsevell, M.D.; Pedroli, B.; Erb, K.H.; Gramberger, M.; Busck, A.G.; Haberl, H.; Wolfslehner, B. Challenges for land system science. Land Use Pol. 2012, 29, 899–910. [Google Scholar] [CrossRef] [Scilit]
- Li, C.; Fu, B.; Wang, S.; Stringer, L.C.; Wang, Y.; Li, Z.; Zhou, W. Drivers and impacts of changes in China’s drylands. Nat. Rev. Earth Environ. 2021, 2, 858–873. [Google Scholar] [CrossRef] [Scilit]
- Motesharrei, S.; Rivas, J.; Kalnay, E.; Asrar, G.R.; Busalacchi, A.J.; Cahalan, R.F.; Zeng, N. Modeling sustainability: Population, inequality, consumption, and bidirectional coupling of the Earth and Human Systems. Natl. Sci. Rev. 2016, 3, 470–494. [Google Scholar] [CrossRef] [Scilit]
- Muradyan, V.; Tepanosyan, G.; Asmaryan, S.; Saghatelyan, A.; Dell’Acqua, F. Relationships between NDVI and climatic factors in mountain ecosystems: A case study of Armenia. Remote Sens. Appl. 2019, 14, 158–169. [Google Scholar] [CrossRef] [Scilit]
- Sun, W.; Wang, Y.; Fu, Y.H.; Xue, B.; Wang, G.; Yu, J.; Xu, Z. Spatial heterogeneity of changes in vegetation growth and their driving forces based on satellite observations of the Yarlung Zangbo River Basin in the Tibetan Plateau. J. Hydrol. 2019, 574, 324–332. [Google Scholar] [CrossRef] [Scilit]
- Zhang, Y.; Gao, J.; Liu, L.; Wang, Z.; Ding, M.; Yang, X. NDVI-based vegetation changes and their responses to climate change from 1982 to 2011: A case study in the Koshi River Basin in the middle Himalayas. Glob. Planet. Change 2013, 108, 139–148. [Google Scholar] [CrossRef] [Scilit]
- Guan, Q.; Yang, L.; Pan, N.; Lin, J.; Xu, C.; Wang, F.; Liu, Z. Greening and browning of the Hexi Corridor in Northwest China: Spatial patterns and responses to climatic variability and anthropogenic drivers. Remote Sens. 2018, 10, 1270. [Google Scholar] [CrossRef] [Scilit]
- Peng, W.; Kuang, T.; Tao, S. Quantifying influences of natural factors on vegetation NDVI changes based on geographical detector in Sichuan, western China. J. Clean. Prod. 2019, 233, 353–367. [Google Scholar] [CrossRef] [Scilit]
- Sugihara, G.; May, R.; Ye, H.; Hsieh, C.H.; Deyle, E.; Fogarty, M.; Munch, S. Detecting causality in complex ecosystems. Science 2012, 338, 496–500. [Google Scholar] [CrossRef] [Scilit]
- Chen, C.; Park, T.; Wang, X.; Piao, S.; Xu, B.; Chaturvedi, R.K.; Myneni, R.B. China and India lead in greening of the world through land-use management. Nat. Sustain. 2019, 2, 122–129. [Google Scholar] [CrossRef] [Scilit]
- Shi, Y.; Xu, L.; Zhou, Y.; Ji, B.; Zhou, G.; Fang, H.; Deng, X. Quantifying driving factors of vegetation carbon stocks of Moso bamboo forests using machine learning algorithm combined with structural equation model. For. Ecol. Manag. 2018, 429, 406–413. [Google Scholar] [CrossRef] [Scilit]
- Grace, J.B.; Keeley, J.E. A structural equation model analysis of postfire plant diversity in California shrublands. Ecol. Appl. 2006, 16, 503–514. [Google Scholar] [CrossRef] [Scilit]
- Sun, Y.; Guan, Q.; Wang, Q.; Yang, L.; Pan, N.; Ma, Y.; Luo, H. Quantitative assessment of the impact of climatic factors on phenological changes in the Qilian Mountains, China. For. Ecol. Manag. 2021, 499, 119594. [Google Scholar] [CrossRef] [Scilit]
- Yang, L.; Guan, Q.; Lin, J.; Tian, J.; Tan, Z.; Li, H. Evolution of NDVI secular trends and responses to climate change: A perspective from nonlinearity and nonstationarity characteristics. Remote Sens. Environ. 2021, 254, 112247. [Google Scholar] [CrossRef] [Scilit]
- Ma, Y.; Guan, Q.; Sun, Y.; Zhang, J.; Yang, L.; Yang, E.; Li, H.; Du, Q. Three-dimensional dynamic characteristics of vegetation and its response to climatic factors in the Qilian Mountains. Catena 2022, 208, 105694. [Google Scholar] [CrossRef] [Scilit]
- Zhao, Y.; Meng, X.; Qi, T.; Qing, F.; Xiong, M.; Li, Y.; Chen, G. AI-based identification of low-frequency debris flow catchments in the Bailong River basin, China. Geomorphology 2020, 359, 107125. [Google Scholar] [CrossRef] [Scilit]
- Xiao, X.; Wang, Q.; Guan, Q.; Shao, W.; Luo, H.; Shan, Y.; Mi, J. Assessing the sustainability of ecosystems over fourteen years of cultivation in Longnan City of China based on emergy analysis method. J. Environ. Manag. 2022, 307, 114513. [Google Scholar] [CrossRef] [Scilit]
- Zhou, Y.; Yue, D.; Guo, J.; Chao, Z.; Meng, X. Assessing the impact of land conversion and management measures on the net primary productivity in the Bailong River Basin, in China. Catena 2021, 207, 105672. [Google Scholar] [CrossRef] [Scilit]
- Holben, B.N. Characteristics of maximum-value composite images from temporal AVHRR data. Int. J. Remote Sens. 1986, 7, 1417–1434. [Google Scholar] [CrossRef] [Scilit]
- Coldren, G.A.; Langley, J.A.; Feller, I.C.; Chapman, S.K. Warming accelerates mangrove expansion and surface elevation gain in a subtropical wetland. J. Ecol. 2019, 107, 79–90. [Google Scholar] [CrossRef] [Scilit]
- Okou, F.A.; Tente, B.; Bachmann, Y.; Sinsin, B. Regional erosion risk mapping for decision support: A case study from West Africa. Land Use Pol. 2016, 56, 27–37. [Google Scholar] [CrossRef] [Scilit]
- Kirkby, M.J.; Beven, K.J. A physically based, variable contributing area model of basin hydrology. Hydrol. Sci. J. 1979, 24, 43–69. [Google Scholar] [CrossRef] [Scilit]
- Venter, O.; Sanderson, E.W.; Magrach, A.; Allan, J.R.; Beher, J.; Jones, K.R.; Possingham, H.P.; Laurance, W.F.; Wood, P.; Fekete, B.M.; et al. Sixteen years of change in the global terrestrial human footprint and implications for biodiversity conservation. Nat. Commun. 2016, 7, 12558. [Google Scholar] [CrossRef] [Scilit]
- Geist, H.J.; Lambin, E.F. Proximate Causes and Underlying Driving Forces of Tropical Deforestation: Tropical forests are disappearing as the result of many pressures, both local and regional, acting in various combinations in different geographical locations. BioScience 2002, 52, 143–150. [Google Scholar] [CrossRef] [Scilit]
- Foley, J.A.; DeFries, R.; Asner, G.P.; Barford, C.; Bonan, G.; Carpenter, S.R.; Snyder, P.K. Global consequences of land use. Science 2005, 309, 570–574. [Google Scholar] [CrossRef] [Scilit]
- Cincotta, R.P.; Wisnewski, J.; Engelman, R. Human population in the biodiversity hotspots. Nature 2000, 404, 990–992. [Google Scholar] [CrossRef] [Scilit]
- Qi, J.I.A.G.U.O.; Marsett, R.C.; Moran, M.S.; Goodrich, D.C.; Heilman, P.; Kerr, Y.H.; Zhang, X.X. Spatial and temporal dynamics of vegetation in the San Pedro River basin area. Agric. For. Meteorol. 2000, 105, 55–68. [Google Scholar] [CrossRef] [Scilit]
- Liu, J.Y.; Xie, Z.Q.; Shen, G.Z.; Fan, D.Y.; Xiong, G.M.; Zhao, C.M.; Xu, W.T. Dynamics and analysis of vegetation fraction changes in Shennongjia forest district during 1998 to 2013 by using SPOT-VEGETATION NDVI data. Acta Ecol. Sin. 2018, 38, 3961–3969. [Google Scholar] [CrossRef] [Scilit]
- Li, M. The Method of Vegetation Fraction Estimation by Remote Sensing. Master’s Dissertation, Chinese Academy of Sciences, Beijing, China, 2003. (In Chinese) [Google Scholar]
- Breiman, L. Random forests. Mach. Learn. 2001, 45, 5–32. [Google Scholar] [CrossRef] [Scilit]
- Delgado-Baquerizo, M.; Maestre, F.T.; Reich, P.B.; Jeffries, T.C.; Gaitan, J.J.; Encinar, D.; Singh, B.K. Microbial diversity drives multifunctionality in terrestrial ecosystems. Nat. Commun. 2016, 7, 10541. [Google Scholar] [CrossRef] [Scilit]
- Pham, L.T.; Brabyn, L. Monitoring mangrove biomass change in Vietnam using SPOT images and an object-based approach combined with machine learning algorithms. ISPRS-J. Photogramm. Remote Sens. 2017, 128, 86–97. [Google Scholar] [CrossRef] [Scilit]
- Li, X.; Du, H.; Mao, F.; Zhou, G.; Chen, L.; Xing, L.; Liu, T. Estimating bamboo forest aboveground biomass using EnKF-assimilated MODIS LAI spatiotemporal data and machine learning algorithms. Agric. For. Meteorol. 2018, 256, 445–457. [Google Scholar] [CrossRef] [Scilit]
- Grace, J.B. Structural Equation Modeling and Natural Systems; Cambridge University Press: Cambridge, UK, 2006. [Google Scholar] [CrossRef] [Scilit]
- Grace, J.B.; Anderson, T.M.; Seabloom, E.W.; Borer, E.T.; Adler, P.B.; Harpole, W.S.; Smith, M.D. Integrative modelling reveals mechanisms linking productivity and plant species richness. Nature 2016, 529, 390–393. [Google Scholar] [CrossRef] [Scilit]
- van Asselen, S.; Verburg, P.H. AL and S ystem representation for global assessments and land-use modeling. Glob. Change Biol. 2012, 18, 3125–3148. [Google Scholar] [CrossRef] [Scilit]
- Teferi, E.; Bewket, W.; Uhlenbrook, S.; Wenninger, J. Understanding recent land use and land cover dynamics in the source region of the Upper Blue Nile, Ethiopia: Spatially explicit statistical modeling of systematic transitions. Agric. Ecosyst. Environ. 2013, 165, 98–117. [Google Scholar] [CrossRef] [Scilit]
- Rosseel, Y. Lavaan: An R package for structural equation modeling and more. Version 0.5–12 (BETA). J. Stat. Softw. 2012, 48, 1–36. [Google Scholar] [CrossRef] [Scilit]
- Byrne, B.M. Structural Equation Modeling with AMOS: Basic Concepts, Applications, and Programming; Laurence Erlbaum Associates. Inc., Publishers: Mahwah, NJ, USA, 2001. [Google Scholar]
- Yang, R.M.; Guo, W.W.; Zheng, J.B. Soil prediction for coastal wetlands following Spartina alterniflora invasion using Sentinel-1 imagery and structural equation modeling. Catena 2019, 173, 465–470. [Google Scholar] [CrossRef] [Scilit]
- Grace, J.B.; Anderson, T.M.; Olff, H.; Scheiner, S.M. On the specification of structural equation models for ecological systems. Ecol. Monogr. 2010, 80, 67–87. [Google Scholar] [CrossRef] [Scilit]
- Hooper, D.; Coughlan, J.; Mullen, M.R. Structural equation modelling: Guidelines for determining model fit. Electron. J. Bus. Res. Methods 2008, 6, 53–60. Available online: https://academic-publishing.org/index.php/ejbrm/article/view/1224 (accessed on 1 September 2026).
- R Core Team. R: A Language and Environment for Statistical Computing; R Foundation for Statistical Computing: Vienna, Austria, 2014. [Google Scholar]
- Li, A.; Wu, J.; Huang, J. Distinguishing between human-induced and climate-driven vegetation changes: A critical application of RESTREND in inner Mongolia. Landsc. Ecol. 2012, 27, 969–982. [Google Scholar] [CrossRef] [Scilit]
- Zhou, X.; Yamaguchi, Y.; Arjasakusuma, S. Distinguishing the vegetation dynamics induced by anthropogenic factors using vegetation optical depth and AVHRR NDVI: A cross-border study on the Mongolian Plateau. Sci. Total Environ. 2018, 616, 730–743. [Google Scholar] [CrossRef] [Scilit]
- Liu, Y.; Feng, Y.; Zhao, Z.; Zhang, Q.; Su, S. Socioeconomic drivers of forest loss and fragmentation: A comparison between different land use planning schemes and policy implications. Land Use Pol. 2016, 54, 58–68. [Google Scholar] [CrossRef] [Scilit]
- Li, J.; Peng, S.; Li, Z. Detecting and attributing vegetation changes on China’s Loess Plateau. Agric. For. Meteorol. 2017, 247, 260–270. [Google Scholar] [CrossRef] [Scilit]
- Feng, D.; Bao, W.; Yang, Y.; Fu, M. How do government policies promote greening? Evidence from China. Land Use Pol. 2021, 104, 105389. [Google Scholar] [CrossRef] [Scilit]
- Piao, S.; Wang, X.; Park, T.; Chen, C.; Lian, X.U.; He, Y.; Myneni, R.B. Characteristics, drivers and feedbacks of global greening. Nat. Rev. Earth Environ. 2020, 1, 14–27. [Google Scholar] [CrossRef] [Scilit]
- Chen, X.; An, S.; Inouye, D.W.; Schwartz, M.D. Temperature and snowfall trigger alpine vegetation green-up on the world’s roof. Glob. Change Biol. 2015, 21, 3635–3646. [Google Scholar] [CrossRef] [Scilit]
- Keenan, T.F.; Riley, W.J. Greening of the land surface in the world’s cold regions consistent with recent warming. Nat. Clim. Change 2018, 8, 825–828. [Google Scholar] [CrossRef] [Scilit]
- Jiang, L.; Bao, A.; Guo, H.; Ndayisaba, F. Vegetation dynamics and responses to climate change and human activities in Central Asia. Sci. Total Environ. 2017, 599, 967–980. [Google Scholar] [CrossRef] [Scilit]
- Yang, X.; Liu, S.; Yang, T.; Xu, X.; Kang, C.; Tang, J.; Li, Z. Spatial-temporal dynamics of desert vegetation and its responses to climatic variations over the last three decades: A case study of Hexi region in Northwest China. J. Arid Land 2016, 8, 556–568. [Google Scholar] [CrossRef] [Scilit]
- Shen, M.; Piao, S.; Cong, N.; Zhang, G.; Janssens, I.A. Precipitation impacts on vegetation spring phenology on the Tibetan Plateau. Glob. Change Biol. 2015, 21, 3647–3656. [Google Scholar] [CrossRef] [Scilit]
- Wu, D.; Zhao, X.; Liang, S.; Zhou, T.; Huang, K.; Tang, B.; Zhao, W. Time-lag effects of global vegetation responses to climate change. Glob. Change Biol. 2015, 21, 3520–3531. [Google Scholar] [CrossRef] [Scilit]
- Liu, Q.; Fu, Y.H.; Zeng, Z.; Huang, M.; Li, X.; Piao, S. Temperature, precipitation, and insolation effects on autumn vegetation phenology in temperate China. Glob. Change Biol. 2016, 22, 644–655. [Google Scholar] [CrossRef] [Scilit]
- Zhang, W.; Zhang, Y.; Wang, Z.; Ding, M.; Yang, X.; Lin, X.; Liu, L. Vegetation change in the Mt. Qomolangma Nature Reserve from 1981 to 2001. J. Geogr. Sci. 2007, 17, 152–164. [Google Scholar] [CrossRef] [Scilit]
- Han, J.C.; Huang, Y.; Zhang, H.; Wu, X. Characterization of elevation and land cover dependent trends of NDVI variations in the Hexi region, northwest China. J. Environ. Manag. 2019, 232, 1037–1048. [Google Scholar] [CrossRef] [Scilit]
- Wang, H.; Liu, G.; Li, Z.; Wang, P.; Wang, Z. Assessing the driving forces in vegetation dynamics using net primary productivity as the indicator: A case study in Jinghe river basin in the Loess Plateau. Forests 2018, 9, 374. [Google Scholar] [CrossRef] [Scilit]
- Wang, B.; Liang, Y.; Peng, S. Harnessing the indirect effect of urban expansion for mitigating agriculture-environment trade-offs in the Loess Plateau. Land Use Pol. 2022, 122, 106395. [Google Scholar] [CrossRef] [Scilit]
- Liang, Y.; Hashimoto, S.; Liu, L. Integrated assessment of land-use/land-cover dynamics on carbon storage services in the Loess Plateau of China from 1995 to 2050. Ecol. Indic. 2021, 120, 106939. [Google Scholar] [CrossRef] [Scilit]
- Luo, L.; Ma, W.; Zhuang, Y.; Zhang, Y.; Yi, S.; Xu, J.; Zhang, Z. The impacts of climate change and human activities on alpine vegetation and permafrost in the Qinghai-Tibet Engineering Corridor. Ecol. Indic. 2018, 93, 24–35. [Google Scholar] [CrossRef] [Scilit]
- Zhou, Y.; Yue, D.; Guo, J.; Chen, G.; Wang, D. Spatial correlations between landscape patterns and net primary productivity: A case study of the Shule River Basin, China. Ecol. Indic. 2021, 130, 108067. [Google Scholar] [CrossRef] [Scilit]
- Teng, M.; Zeng, L.; Hu, W.; Wang, P.; Yan, Z.; He, W.; Xiao, W. The impacts of climate changes and human activities on net primary productivity vary across an ecotone zone in Northwest China. Sci. Total Environ. 2020, 714, 136691. [Google Scholar] [CrossRef] [Scilit]
- Sun, J.; Ding, Y.; Wang, Y.; Chongyi, E. Vegetation dynamics and its driving force in the Qinghai Lake Basin, China. Front. Plant Sci. 2025, 16, 1691672. [Google Scholar] [CrossRef] [Scilit]
- Xu, B.; Li, J.; Liu, Y.; Zhang, T.; Luo, Z.; Pei, X. Disentangling the response of vegetation dynamics to natural and anthropogenic drivers over the Qinghai-Tibet Plateau using dimensionality reduction and structural equation model. For. Ecol. Manag. 2024, 554, 121677. [Google Scholar] [CrossRef] [Scilit]
- Lu, S.; Zhang, D.; Wang, L.; Dong, L.; Liu, C. Comparison of plant diversity-carbon storage relationships along altitudinal gradients in temperate forests and shrublands. Front. Plant Sci. 2023, 14, 1120050. [Google Scholar] [CrossRef] [Scilit]
- Zhao, W.; Zhang, R.; Cao, H.; Tan, W. Factor contribution to soil organic and inorganic carbon accumulation in the Loess Plateau: Structural equation modeling. Geoderma 2019, 352, 116–125. [Google Scholar] [CrossRef] [Scilit]
- Yu, Y.; Guo, B.; Wang, C.; Zang, W.; Huang, X.; Wu, Z.; Yang, Y. Carbon storage simulation and analysis in Beijing-Tianjin-Hebei region based on CA-plus model under dual-carbon background. Geomat. Nat. Haz. Risk 2023, 14, 2173661. [Google Scholar] [CrossRef] [Scilit]
- Wang, K.; Zhou, Y.; Han, J.; Chen, C.; Li, T. Long-Term Tibetan Alpine Vegetation Responses to Elevation-Dependent Changes in Temperature and Precipitation in an Altered Regional Climate: A Case Study for the Three Rivers Headwaters Region, China. Remote Sens. 2023, 15, 496. [Google Scholar] [CrossRef] [Scilit]
- Zhang, L.; Wang, Y.; Li, F.; Liu, S.; Gao, J.; Zhou, H. Spatial variations in the difference in elevational shifts between greenness and temperature isolines across the Tibetan Plateau grasslands under warming. Sci. Total Environ. 2024, 906, 167715. [Google Scholar] [CrossRef] [Scilit]
- Nepal, S.; Kc, M.; Pudasaini, N.; Adhikari, H. Divergent Effects of Topography on Soil Properties and Above-Ground Biomass in Nepal’s Mid-Hill Forests. Resour. 2023, 12, 136. [Google Scholar] [CrossRef] [Scilit]
- Bi, W.; Wang, K.; Zhang, L.; Liu, Y.; Li, M.; Yang, F. Effects of land use changes on the soil-vegetation ecosystem in winter in the Huangshui River Basin, China. Ecol. Indic. 2023, 154, 110675. [Google Scholar] [CrossRef] [Scilit]
- Wang, Y.; Chen, X.; Gao, M.; Dong, J. The use of random forest to identify climate and human interference on vegetation coverage changes in southwest China. Ecol. Indic. 2022, 144, 109463. [Google Scholar] [CrossRef] [Scilit]
- Habeeb, H.N.; Mustafa, Y.T. Analyzing the impact of geoenvironmental factors on the Spatiotemporal dynamics of forest cover via random forest. Earth 2025, 6, 3. [Google Scholar] [CrossRef] [Scilit]
- Grace, J.B.; Adler, P.B.; Stanley Harpole, W.; Borer, E.T.; Seabloom, E.W. Causal networks clarify productivity–richness interrelations, bivariate plots do not. Funct. Ecol. 2014, 28, 787–798. [Google Scholar] [CrossRef] [Scilit]
- Chen, Z.; Cai, J.; Gao, B.; Xu, B.; Dai, S.; He, B.; Xie, X. Detecting the Causality Influence of Individual Meteorological Factors on Local PM 2.5 Concentration in the Jing-Jin-Ji Region. Sci. Rep. 2017, 7, 40735. [Google Scholar] [CrossRef] [Scilit]
- Wright, S. The relative importance of heredity and environment in determining the piebald pattern of guinea-pigs. Proc. Natl. Acad. Sci. USA 1920, 6, 320. [Google Scholar] [CrossRef] [Scilit]
- Pascual-García, A.; Bell, T. Community-level signatures of ecological succession in natural bacterial communities. Nat. Commun. 2020, 11, 2386. [Google Scholar] [CrossRef] [Scilit]
- Waller, L.P.; Allen, W.J.; Barratt, B.I.P.; Condron, L.M.; França, F.M.; Hunt, J.E.; Dickie, I.A. Biotic interactions drive ecosystem responses to exotic plant invaders. Science 2020, 368, 967–972. [Google Scholar] [CrossRef] [Scilit]

Disclaimer/Publisher’s Note: The statements, opinions and data contained in all publications are solely those of the individual author(s) and contributor(s) and not of MDPI and/or the editor(s). MDPI and/or the editor(s) disclaim responsibility for any injury to people or property resulting from any ideas, methods, instructions or products referred to in the content. |
© 2026 by the authors. Licensee MDPI, Basel, Switzerland. This article is an open access article distributed under the terms and conditions of the Creative Commons Attribution (CC BY) license.