


Abstract
Groundwater is one of the key factors affecting the changes and evolution of surface processes in arid regions, determining the direction and scope of the evolution of surface eco-hydrological processes. To achieve sustainable water resource management in arid areas, this study aims to systematically explore the dynamic changes in groundwater level and their ecological effects on the basis of multi-source remote sensing data by multivariate statistical methods. The results show that groundwater levels in the Bayin River Basin increased from 2895.35 m in 2005 to 2906.75 m in 2022 at a rate of 6.7 m/decade, driven by increased runoff and irrigation. Conversely, groundwater levels in urbanized areas near Delingha City slightly decreased by approximately 0.3 m/decade, with a general west-to-east declining spatial gradient. These changes have generated cascading ecological effects. Overall, rising groundwater has coincided with increased vegetation index, wetland extent, and soil moisture. Annual average NDVI rose from 0.18 in 2000 to 0.23 in 2022, an increase of 27.7%, and wetland area expanded from 349.25 km2 in 2005 to 355.25 km2 in 2022. Soil moisture content showed an insignificant upward trend form 0.14% in 2003 to 0.15% in 2022, with the slope of 0.01%/yr. However, soil salinization has exhibited an aggravating trend, with salinization index (SI) values of 0.25, 0.26, and 0.31 in 2000, 2010, and 2020, respectively. Affected by human activities and geological constraints, the ecological effects associated with groundwater level changes display pronounced regional heterogeneity. This study provides a solid basis for regional water resource regulation and further quantification of water conveyance benefits.
1. Introduction
Groundwater is the foundation of the hydrological cycle and the largest source of unfrozen freshwater on Earth; it plays an essential role in sustaining ecosystem balance and supporting human survival [1]. Functioning as a critical compensatory buffer during shortages of surface water and precipitation, groundwater is not only heavily relied upon in arid regions but is also growing increasingly indispensable for fulfilling elevated water demand in the context of global warming [2]. When groundwater depletion takes place, water tables may decline to depths that lie beyond the accessible range of associated ecosystems [3], exerting significant impacts on soil water content (SWC), soil salinity, wetland, as well as on vegetation species richness and cover [4,5]. The Bayin River Basin, located in the northeastern Qaidam Basin, is a typical alpine inland river basin characterized by fragile ecosystems and sensitive groundwater-dependent hydrology. Groundwater in the Bayin River Basin is mainly recharged by river infiltration, precipitation, and snowmelt, and generally flows from west to east. It serves as a critical water source for both ecological sustainability and socio-economic development in this arid region. However, recent decades have witnessed pronounced fluctuations of groundwater level, primarily driven by climate change and intensified human activities (e.g., irrigation, urbanization), leading to emerging ecological challenges such as soil salinization, wetland degradation, ecosystem decline, and biodiversity loss. Understanding the dynamic changes in groundwater and its ecological impacts is essential for sustainable water resource management in arid and semi-arid areas.
Water table depth is indispensable to the survival of vegetation in dryland regions, and its suitability exerts a direct determining effect on the physiological activities and growth dynamics of vegetation. Under conditions of optimal groundwater depth, vegetation is capable of efficiently uptaking water and accumulating more biomass [6,7]. Shallow groundwater facilitates water uptake by vegetation; yet an excessively shallow groundwater level may impair root respiratory processes, affecting the healthy growth of vegetation, and even inducing root cell mortality as a result of hypoxic stress [8]. Distinct vegetation types exhibit substantial disparities in their adaptive capacity to variations in groundwater depth. For example, Populus euphratica in the Heihe River Basin primarily depends on shallow groundwater, whereas desert species such as Haloxylon ammodendron are capable of extracting water from deeper groundwater reservoirs [9]. In the Ejina Oasis, the optimal groundwater depth ranges for supporting the healthy growth of vegetation are 1.5 to 4.0 m [10]. Thus, the adaptive capacity of distinct vegetation types to groundwater depth dictates their viable distribution range and ecological roles in arid regions. In addition to influencing the growth of vegetation communities, variations in the groundwater table also affect soil properties in conjunction with vegetation communities [11]. The groundwater table directly governs the spatial distribution and accumulation of soil salts by regulating the lateral and vertical movement of groundwater. Lowering groundwater depth and increasing soil water content promotes vegetation restoration; conversely, inadequate groundwater burial depth exacerbates soil salinization, which in turn hinders the process of vegetation recovery [4,7,12]. Furthermore, groundwater constitutes a cryptic water source for wetland ecosystems, particularly inland swamps and riverine floodplains, and can compensate for the deficits in precipitation and surface runoff. A decline in groundwater levels can result in a diminished extent of wetland water storage areas, reduced water depth, and even the seasonal or perennial desiccation of these wetland systems. Most notably, in addition to being subject to anthropogenic activities, arid and semi-arid regions are also exposed to extreme climatic events, such as prolonged droughts and intense precipitation over short durations, which exert substantial impacts on groundwater levels and, in turn, influence the stability of regional ecosystems [13,14]. Currently, most scholars mainly focus on the impact of groundwater level fluctuations on soil properties or vegetation community characteristics. However, there are few studies considering the ecological effects of changes in groundwater level comprehensively.
Thus, this study focuses on the Bayin River Basin and uses multi-source remote sensing data, and aims to (1) analyze the dynamic changes in groundwater in the Bayin River Basin during 2005–2022; (2) explore the relationship between groundwater and ecological indicators, including vegetation index, soil moisture, wetland area, and soil salinity index systematically, employing a multivariate statistical analysis method. This research will enhance understanding of ecological conditions and their vulnerability to groundwater depletion, offering critical insights for sustainable groundwater management in drylands.
2. Materials and Methods
2.1. Overview of the Study Area
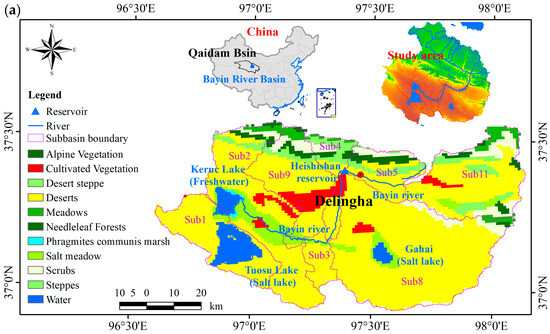
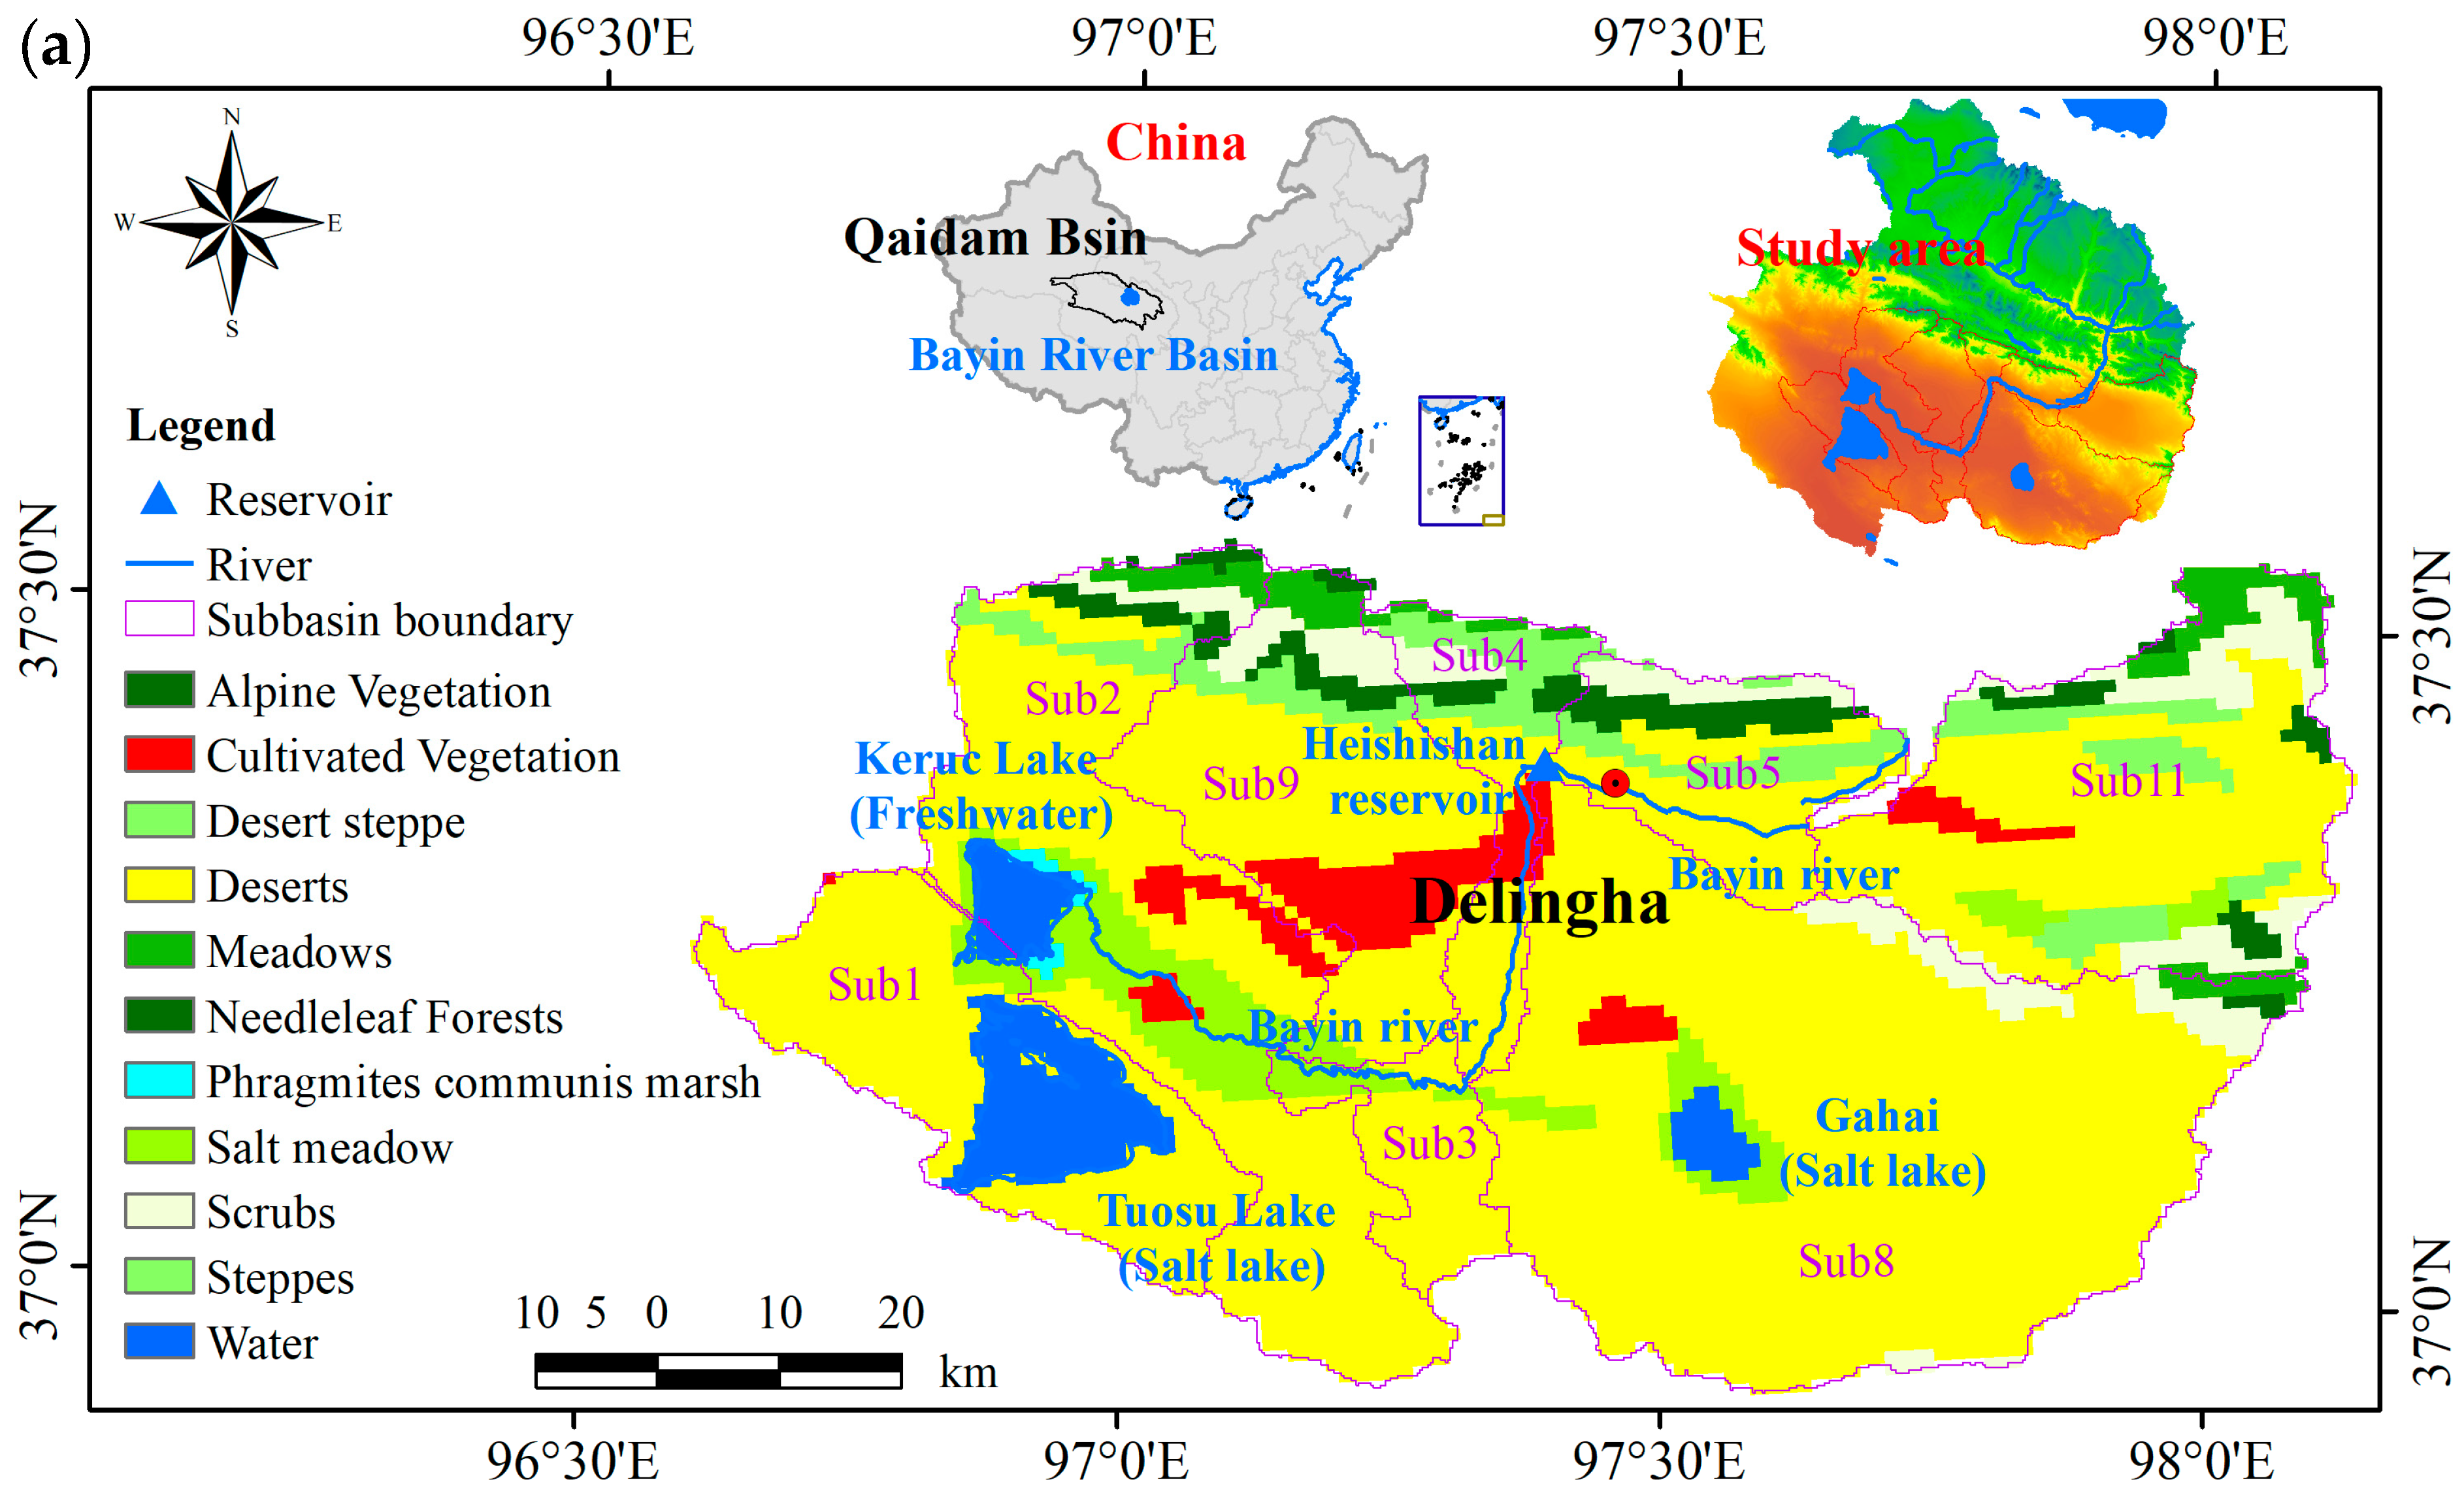
The Bayin River is a vital inland river located in the Qaidam Basin of Qinghai Province, China (Figure 1). Its headwaters lie in the Zongwulong Mountain, which is situated in the southern foothills of the Qilian Mountains. The river then traverses Delingha City, with its waters eventually emptying into Keruc Lake in the southwest and Gahai Lake in the southeast, respectively [15]. The Bayin River primarily obtains its water supply from two sources, including glacial meltwater originating in the Qilian Mountains and seasonal rainfall, covering a catchment area of 17,608 km2, and performing an indispensable role within the regional hydrological system. In our study, the alluvial–proluvial and alluvial–lacustrine plain in front of the mountain, with a total area of 6447 km2, which is characterized by quaternary unconsolidated sediments, was chosen as the research area (Figure 1a).
Figure 1.
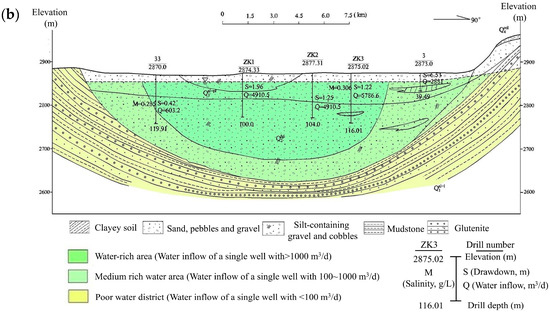
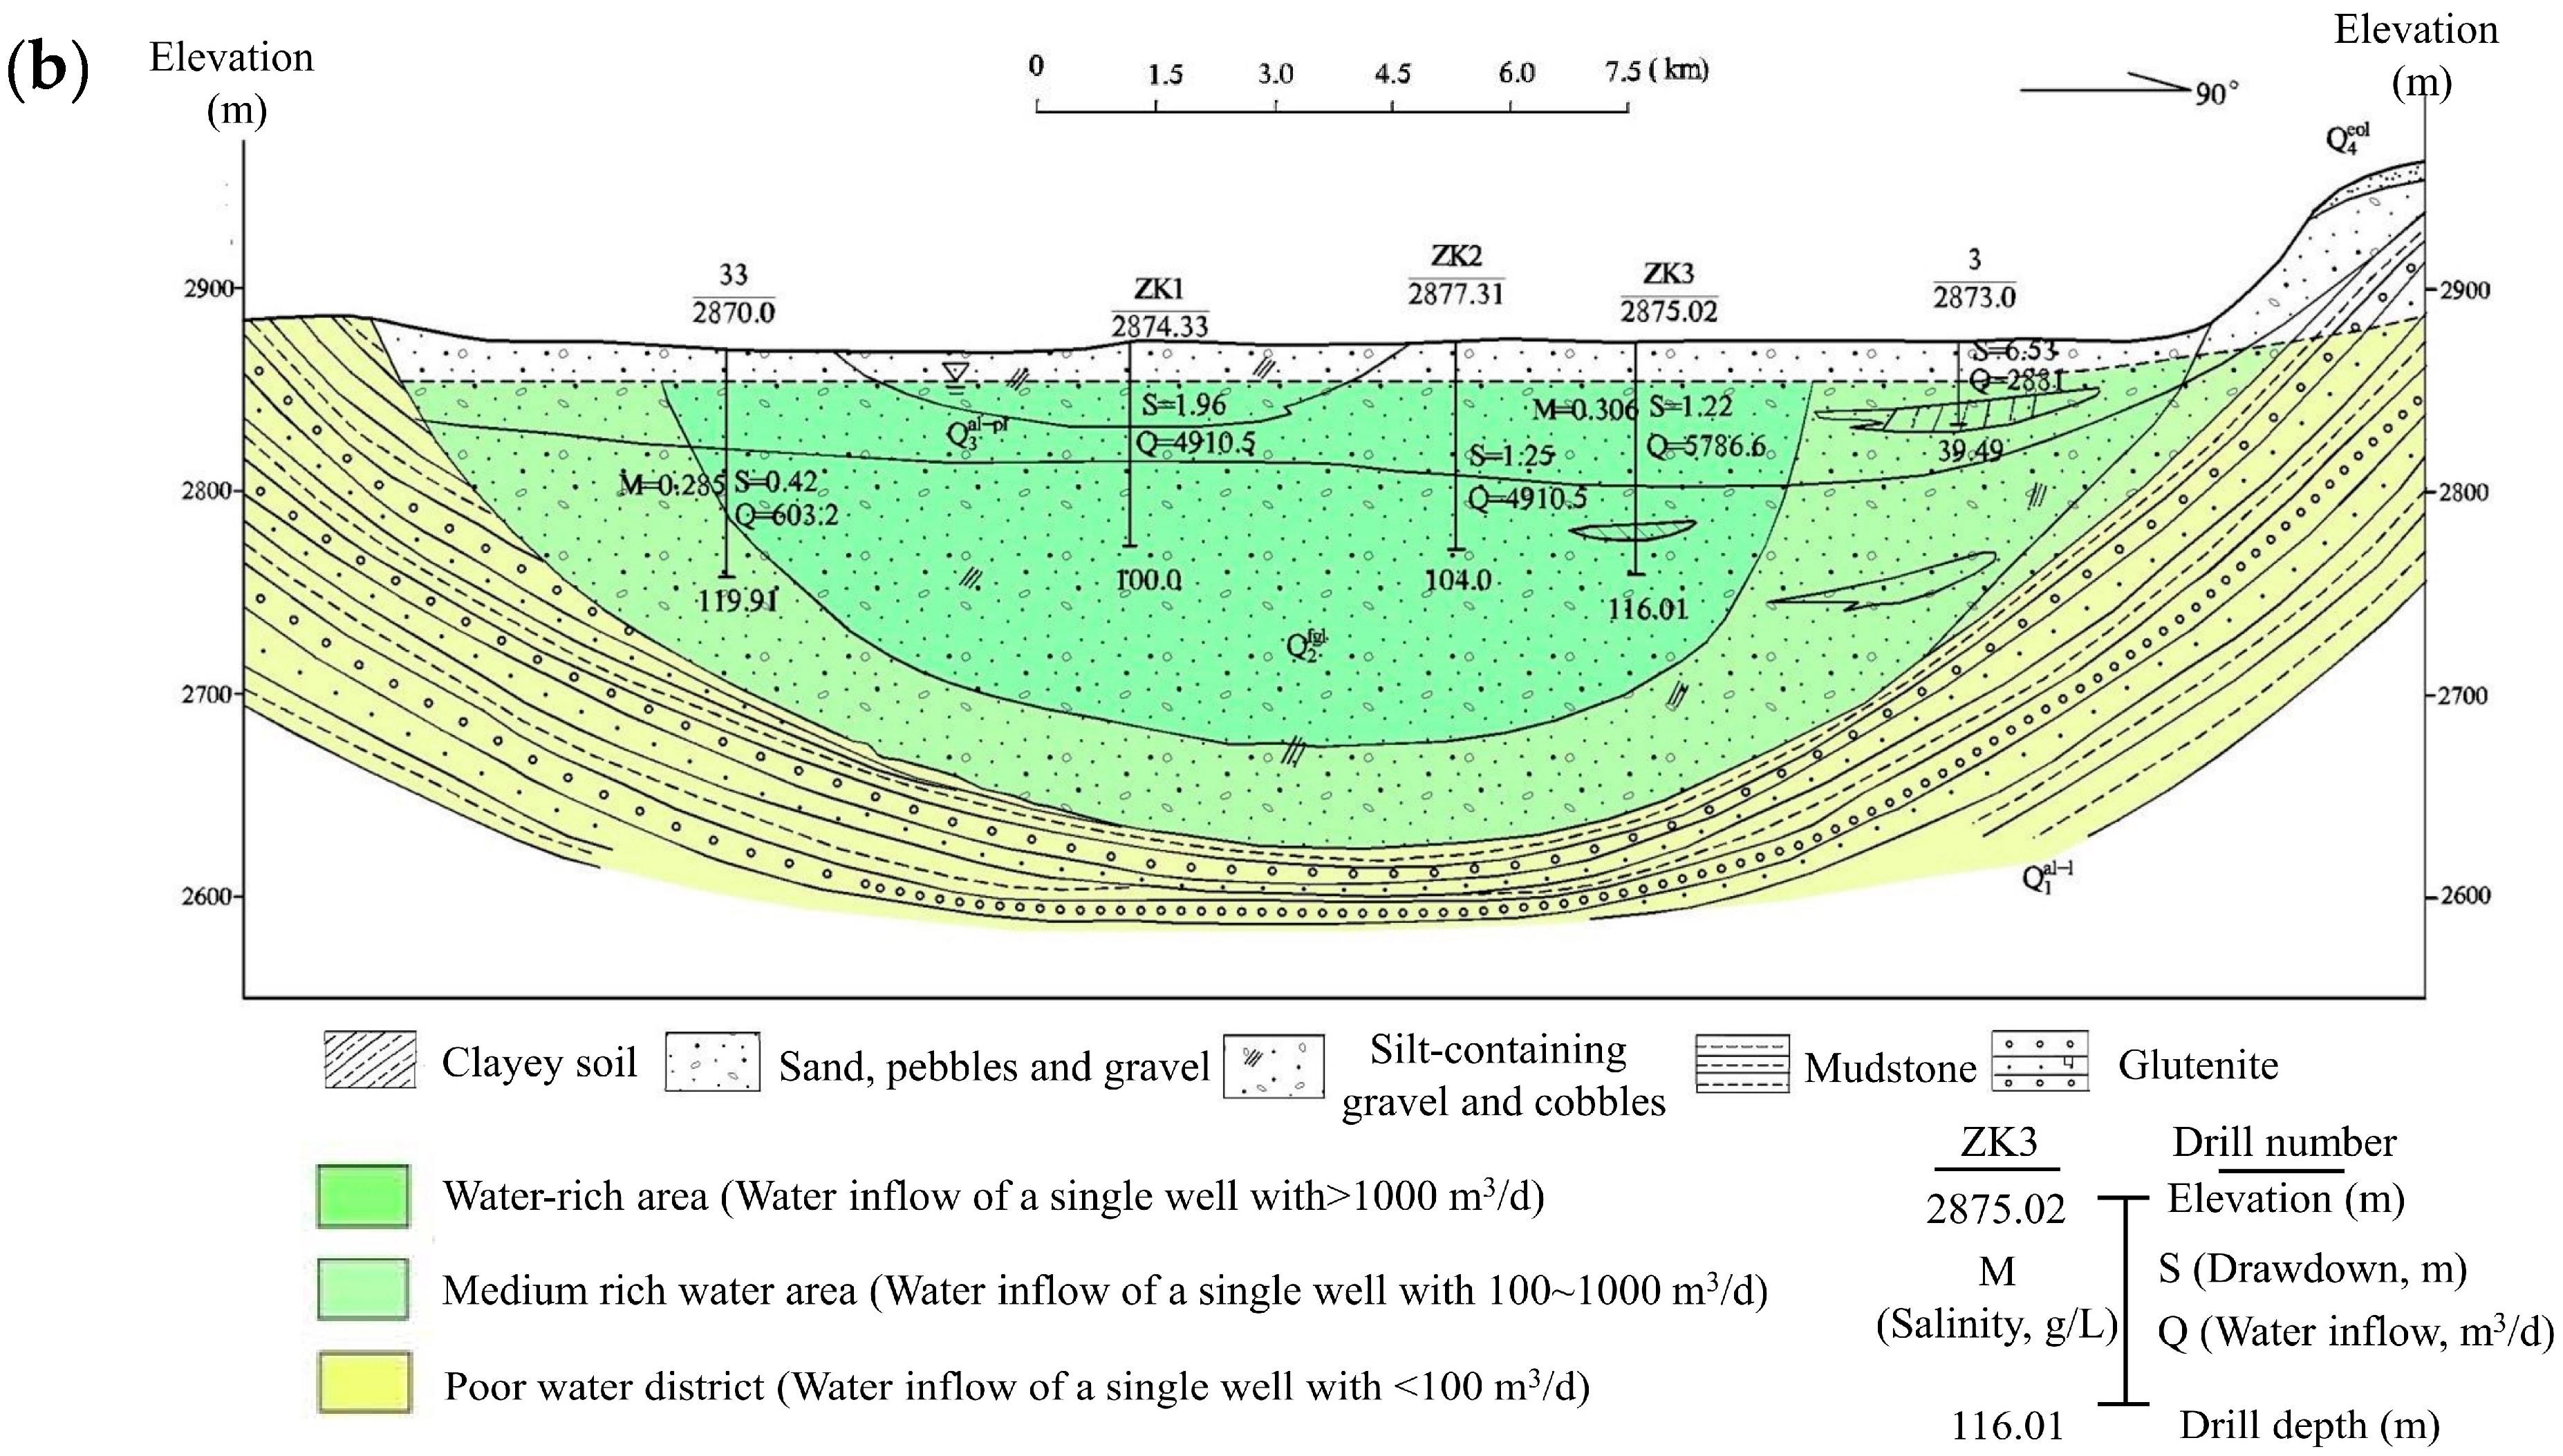
(a) Geographic location of the Bayin River Basin. This map illustrates the Bayin River Basin in north-western China, highlighting key geographical features. (b) Hydrogeological profile of the alluvial–proluvial plain in the piedmont zone of the Bayin River Basin.
The study area encompasses a heterogeneous landscape incorporating plains, mountainous areas, and deserts, with its topography exhibiting a gradual transition from the upstream piedmont zone to the downstream alluvial plain and an elevation range of 2800 to 3200 m. Climatically, this region is dominated by a typical plateau continental climate, with annual precipitation and evaporation ranging from 120 to 192 mm and 1400 to 1900 mm, respectively. The mean annual temperature varies between 4 °C and 6 °C, while the extreme temperatures can drop to −30 °C in winter and rise to 35 °C in summer. Given the low precipitation and high potential evaporation, groundwater resources play an indispensable role in sustaining both natural ecosystems and anthropogenic agricultural activities. From a geological perspective, the Bayin River Basin is primarily composed of Quaternary alluvial fan deposits, which are formed by the accumulation of fluvially transported clastic materials. The aquifer layer in the alluvial plain region, which has a thickness of more than 200 m, is primarily constituted by sand and gravel cobbles and muddy sand cobbles (Figure 1b). The lithology is uncomplicated, and it possesses both favorable recharge conditions and robust water-yield properties. The recharge of groundwater and surface water is mainly based on the melting of ice and snow in high mountains, supplemented by atmospheric precipitation and lateral runoff recharge. The depth of the groundwater ranges from 2.0 to 79.0 m. The permeability coefficient is generally 80–150 m/d, and the pumping capacity of an individual well exceeds 5000 m3/d. The aquifer layer in the Delingha Basin, with a thickness of 5.0–31.5 m, is mainly constituted by alluvial–proluvial sand and gravel, and alluvial–lacustrine fine silt. The depth of the groundwater varies between 3.0 m and 24.7 m. The permeability coefficient is generally 1.18–4.68 m/d, and the single-well pumping yield is between 100–1000 m3/d. The natural vegetation is dominated by grasslands, shrubs, and xerophytic desert plants, all of which have adapted to the harsh arid conditions. Mining constitutes the primary economic activity in this region, supplemented by animal husbandry and groundwater-irrigated croplands distributed in mountainous areas.
2.2. Data Collection and Sources
The monthly groundwater-level data in this study are based on the published grid dataset of groundwater level in China, originating from the “China Geological Environment Monitoring Groundwater Level Yearbook” (2005–2022) [16]. The resolution of this published grid dataset is 1 km. Due to the focus of this study on small watershed scales, it is necessary to improve the resolution of the obtained data. Thus, this study utilized bilinear interpolation for resampling, increasing the resolution of groundwater level grid data from 1 km to 500 m. The groundwater storage (GWS) anomalies (GWSA) originated from the monthly TWS anomaly (TWSA) data based on the law of water balance [17]. TWSA data from April 2003 to February 2022 originated from GRACE and GRACE-FO solutions encompassing Release Number 06 (RL06) and Release Number 05 (RL05) with a spatial resolution of 0.25° × 0.25° (http://www2.csr.utexas.edu/grace accessed on 8 August 2023).
The annual vegetation index (NDVI) data are obtained from the Resource and Environmental Science Data Platform (https://www.resdc.cn/ accessed on 25 July 2025). The spatial resolution of NDVI is 1 km. The wetland area and soil moisture dataset are retrieved from the National Tibetan Plateau Data Center (https://data.tpdc.ac.cn/zh-hans/data/6304c1a4-efc0-4766-bae3-4148bdf7bcfd accessed on 15 May 2025). The spatial resolution of the wetland area and soil moisture data is 500 m and 1 km, respectively. To calculate the salinity index (SI), the Landsat remote sensing imagery during the periods of 2005~2021 are collected from the Geospatial Data Cloud (http://www.gscloud.cn/home accessed on 20 June 2025), including Landsat 5-TM and Landsat 8-OLI. In addition, we also collected the soil salinity of different soil depths (0.1 m, 0.2 m, 0.3 m, 0.5 m, and 1.0 m) in nine soil profiles from the hydrogeological survey report of Qinghai. The soil salinity data were used to further demonstrate the relationship between soil salinity and groundwater level.
2.3. Methods
2.3.1. Calculation of Soil Salinity Index
In this study, the Salinity Index (SI) was selected to characterize soil salinization using remote sensing imagery. The spectral characteristics of the ground surface can directly reflect soil salinization information. There is a positive correlation between the degree of soil salinization and surface reflectance, and salinization information can be extracted on the basis of surface reflectance. Khan et al. (2001) found that the blue and red bands of Landsat ETM+ images have significant sensitivity to soil salinity [18]. Thus, SI is composed of blue and red bands that are sensitive to salt information. The following is the calculation formula:
where SI characterizes the salt index; ρblue and ρred represent the reflectance value of blue and red bands, respectively. To further analyze the spatial distribution patterns of different levels of salt accumulation, SI values were classified into five categories based on certain thresholds: no salt accumulation, weak salt accumulation, low salt accumulation, moderate salt accumulation, and severe salt accumulation [19]. The grading standards are shown in Table 1.
Table 1.
Classification standard of SI value.
2.3.2. Variation Trend and Pearson Correlation Analysis
For the purpose of analyzing the temporal variation trends of target variables, linear regression analysis—a straightforward yet robust statistical approach—was selected for this study. This method is capable of simulating the change trends within each grid cell and comprehensively characterizing the evolution of regional patterns by examining the spatial variability traits of individual pixels across different time periods. Its core merit lies in the fact that the fitting of datasets across distinct time phases helps to mitigate the interference of anomalous factors on the target variables. The following is the calculation formula:
where slope characterizes the trend and rate of change. If slope > 0, this indicates an upward trend of the variable over time. If slope < 0, this indicates a downward trend. n is the research period; Ci is the variable value for the ith year.
The Pearson correlation coefficient is used to evaluate the linear relationship between two continuous variables, and it is calculated using the formula:
where r is the Pearson correlation coefficient (range from −1 to 1); xi and yi are the values of variables x and y; and are the values of variables x and y; n is the number of variables.
2.4. Statistical Analysis
OriginPro 2024 (OriginLab Company, Northampton, MA, USA) served as an efficient tool for conducting Pearson correlation analysis and plotting inter-annual variation trend graphs. ArcGIS 10.4 (Esri, Redlands, CA, USA) was utilized to calculate variation trends and generate spatial distribution maps of groundwater level, NDVI, wetland area, soil salinization, and soil moisture.
3. Results and Discussion
3.1. Groundwater Changes in the Bayin River Basin
3.1.1. Temporal and Spatial Dynamics of Groundwater Level
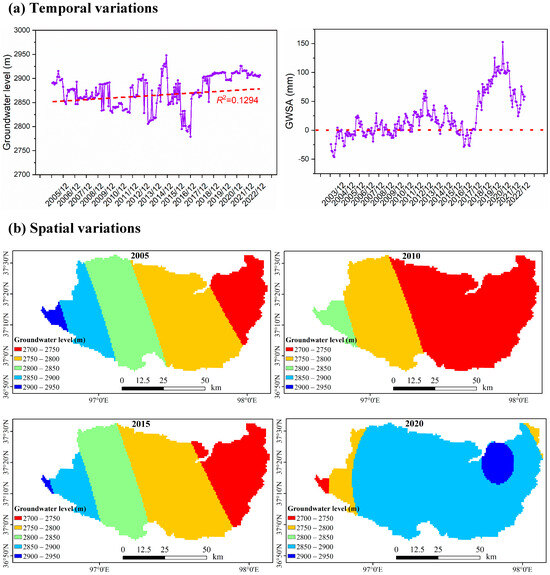
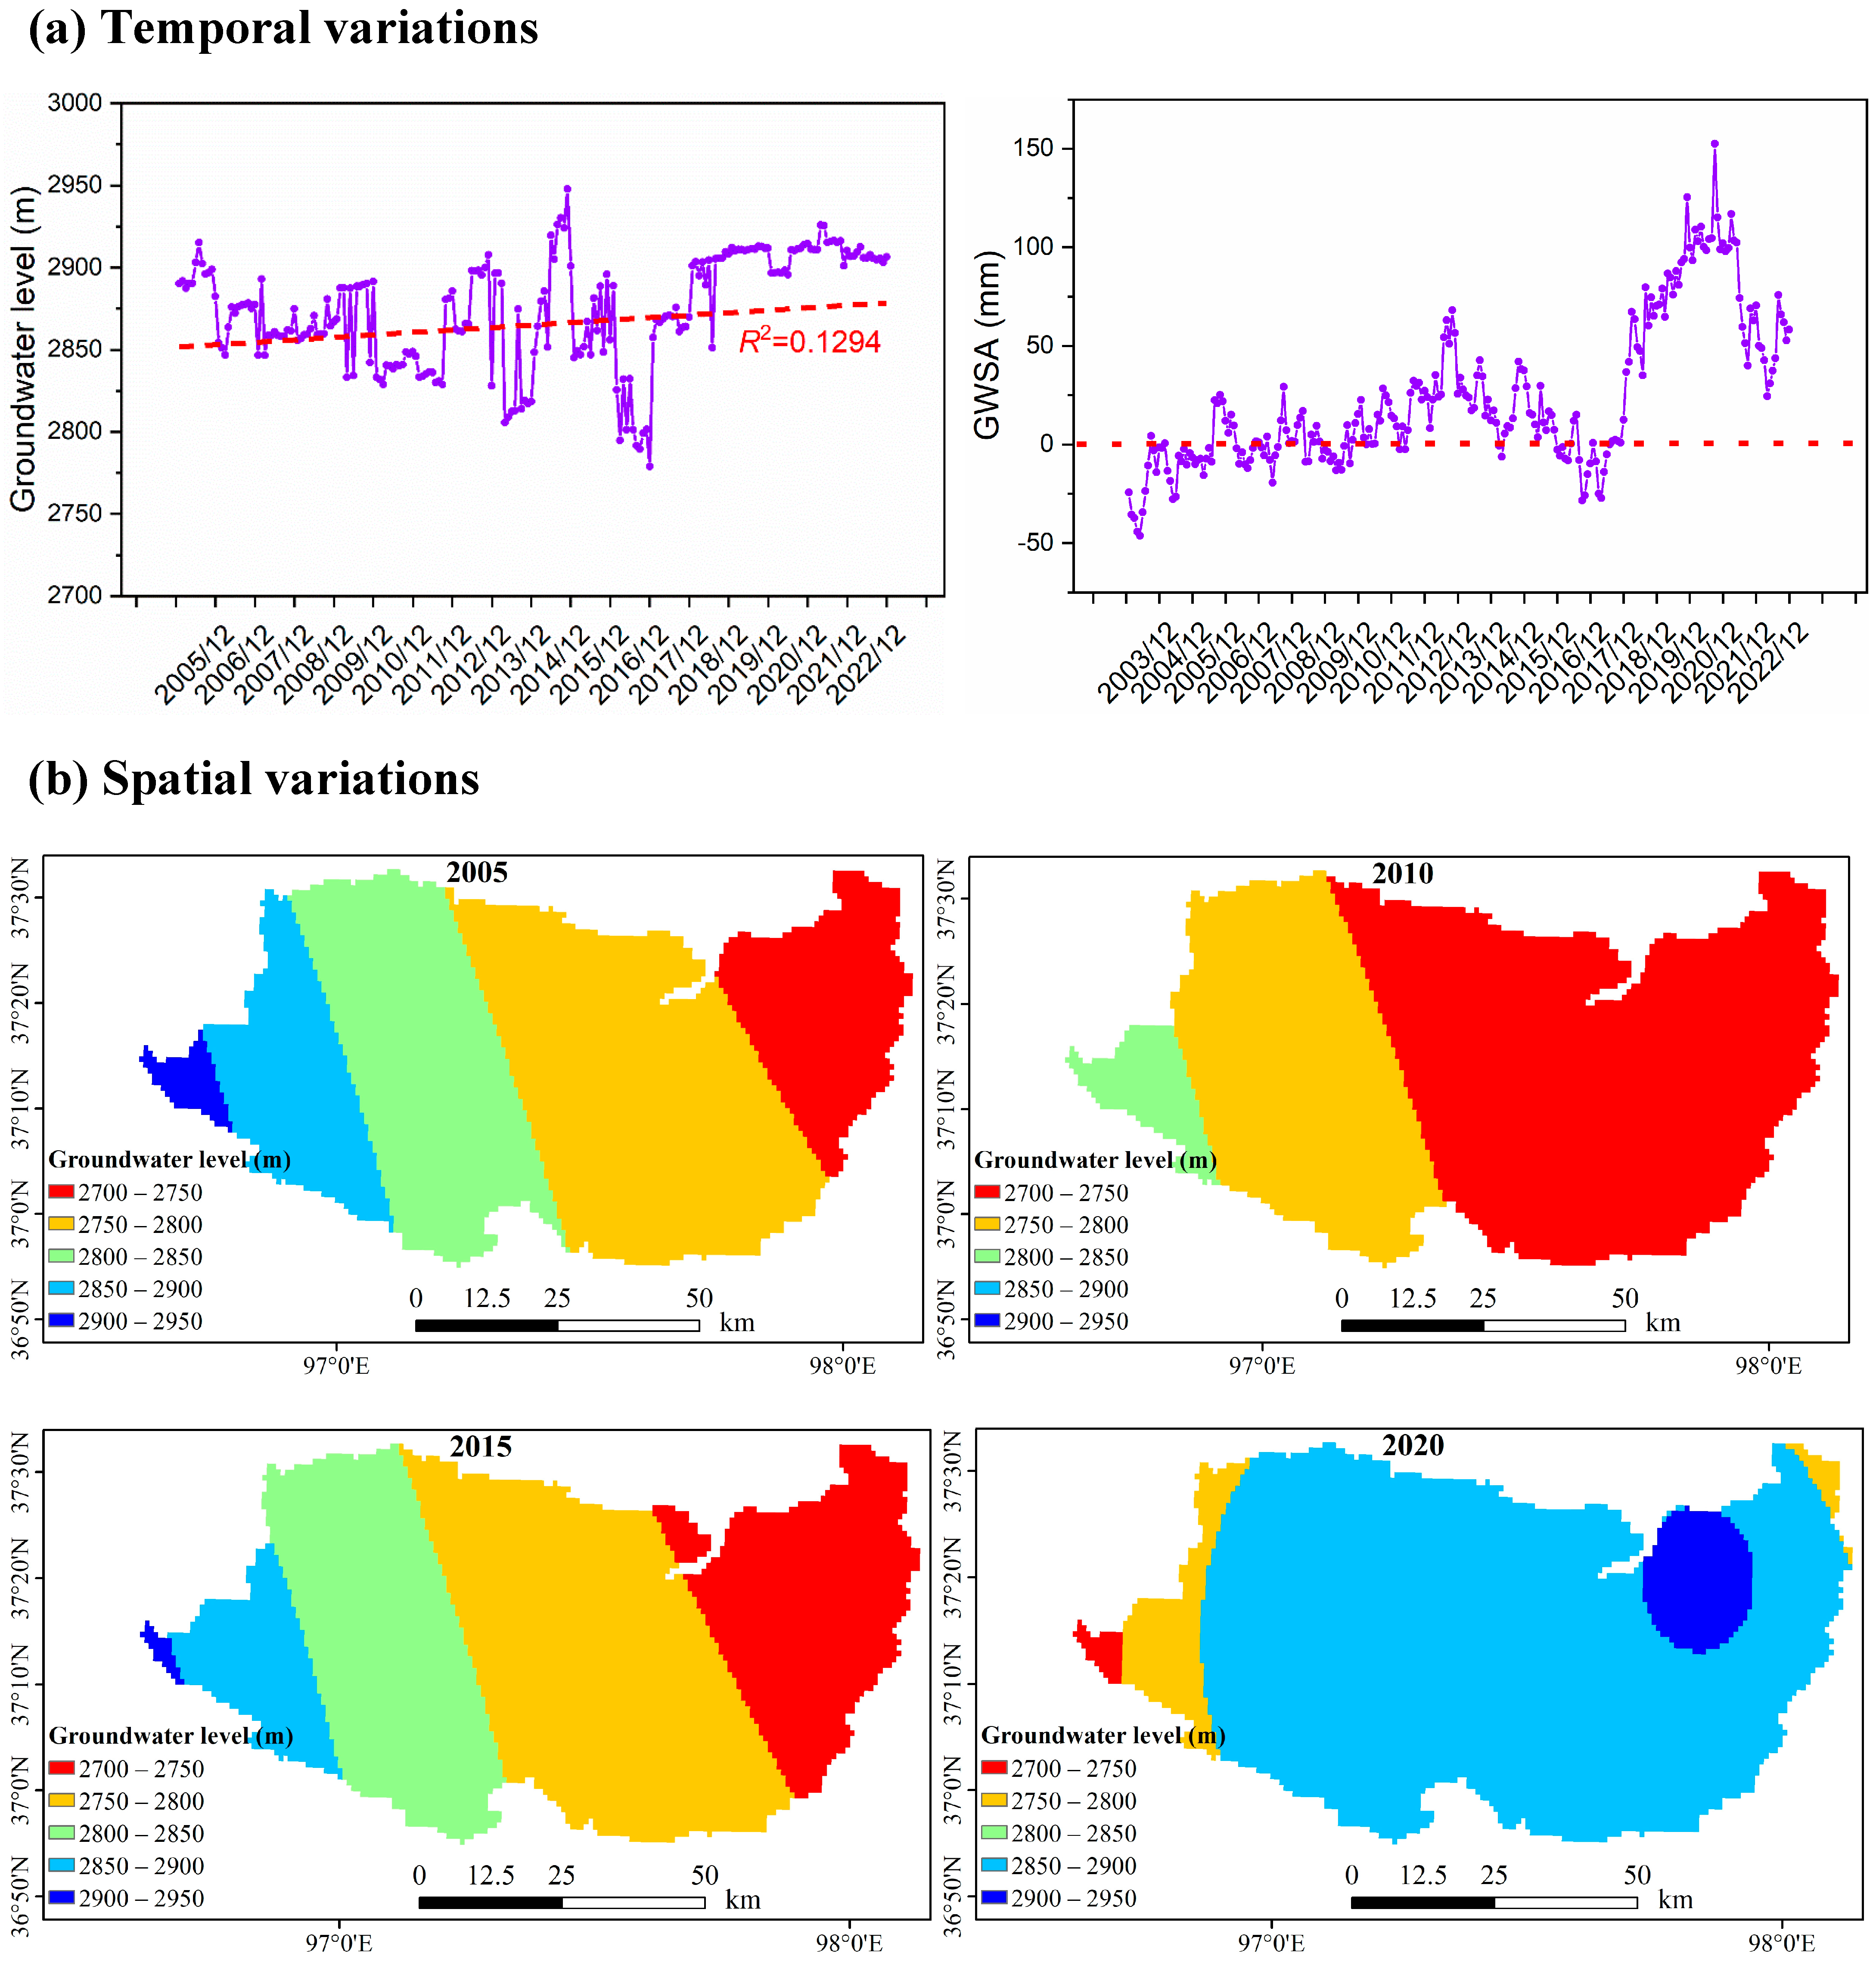
Overall, an increasing trend was observed in the alluvial fan frontier of the Bayin River Basin during 2005–2022. The mean groundwater levels increased from 2895.35 m in 2005 to 2906.75 m in 2022 with a rate of 6.7 m/decade (Figure 2a). Especially in the past few years, the groundwater level has been exceeding the average (since 2018). The GWSA values increased from −35.80 mm/yr in 2002 to 49.38 mm/yr in 2022, which also demonstrated an upward trend in groundwater level. In contrast, the urbanized areas near Delingha City presented a different scenario. These areas experienced a slight decline in groundwater levels, with a rate of about 0.3 m/decade. The main cause of this decline was concentrated groundwater extraction. Urban expansion and population growth have led to increased water demand across domestic, industrial, and commercial sectors. To satisfy this escalating demand, extensive groundwater extraction has been conducted, resulting in declining groundwater levels. Notably, the extraction rate has outpaced the natural recharge rate, ultimately causing a sustained net decline in groundwater levels over time.
Figure 2.
(a) Dynamic change in groundwater level and groundwater storage. (b) Spatial variations in groundwater level in 2005, 2010, 2015, and 2020.
The spatial distributions of simulated groundwater levels were displayed in Figure 2b. The middle and upper reaches of the Bayin River are primarily composed of sand, gravel, and cobbles. The aquifer here features a thickness ranging from 50 to 100 m, with excellent permeability. The groundwater level in this section is relatively low, and the hydraulic gradient is approximately 4.57‰. However, in the downstream areas, the water-blocking effect of the Denan hills and the fine soil belt hinders groundwater runoff, leading to the formation of backwater zones in locations such as Gahai Town and Keluke Town. Here, the groundwater level is relatively high (less than 5 m), and the hydraulic gradient drops to 2.33‰—a condition that makes surface overflow prone during the wet season. Overall, the spatial distribution of groundwater levels in 2005, 2010, and 2015 showed relatively consistent patterns, marked by a west-to-east decreasing gradient. By 2020, though, this spatial pattern has shifted, with an east-to-west decreasing gradient.
3.1.2. Driving Factors of Groundwater Changes
This significant rise can be primarily attributed to two main factors, including natural and anthropogenic factors [20]. Climate-driven alterations have resulted in the augmentation of montane runoff. As the climate warmed, snowmelt and precipitation in the mountainous areas increased, resulting in more surface water flowing towards the alluvial fan region. This additional water infiltrated into the ground, recharging the aquifers and causing the groundwater levels to rise [21]. Topographic attributes also play a pivotal role in governing groundwater flow velocities. Within alluvial fan regions, the hydraulic permeability of sediments exhibits spatial variability. Sediments in the vicinity of river channels are typically coarse-textured, and these coarse-grained deposits possess larger pore spaces that facilitate unimpeded groundwater movement. Consequently, groundwater flow velocities in such zones are relatively rapid, and this accelerated flow regime can further modulate the spatial distribution of groundwater as well as its hydrological interactions with surface water bodies.
Apart from natural factors, agricultural irrigation is the dominant water-use activity in the Bayin River Basin, accounting for 65% of total water use [22,23]. This extensive irrigation has significantly altered the groundwater balance. When water is applied to the fields for irrigation, about 30% of the irrigated water recharges the aquifers. However, this recharge is not always evenly distributed, and it can have both positive and negative impacts. In some areas, excessive irrigation can lead to waterlogging and an increase in the groundwater levels, which may cause problems such as soil salinization [24,25]. On the other hand, in areas where irrigation is not sufficient, the groundwater levels may decline due to the lack of proper recharge. River channel hardening in the upper basin is another significant anthropogenic factor [25]. In an attempt to control floods and manage water flow, many river channels in the upper part of the basin have been hardened. This hardening reduces natural infiltration. As a result, surface water that would have otherwise infiltrated into the ground is redirected downstream. This redirection of surface water leads to an elevation of groundwater levels in the frontier areas. The increased surface water flow in the downstream areas has more opportunity to infiltrate into the ground, causing the groundwater levels to rise. Nevertheless, such shifts in hydrological regimes may also trigger adverse outcomes, including alterations to wetland ecological systems and an elevated risk of downstream flooding when groundwater levels rise excessively.
3.2. Ecological Effects Caused by Changes in Groundwater Level
3.2.1. Vegetation
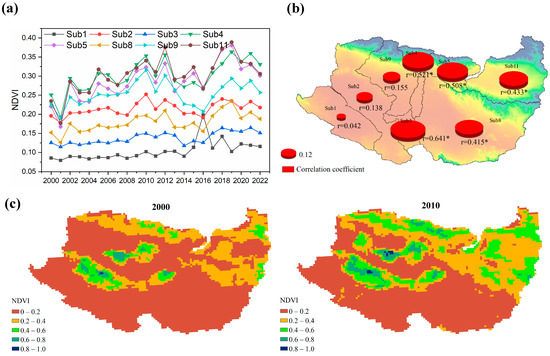
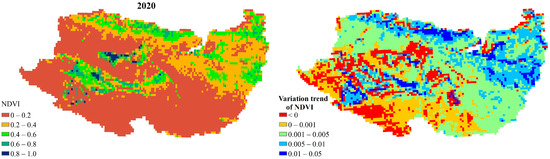
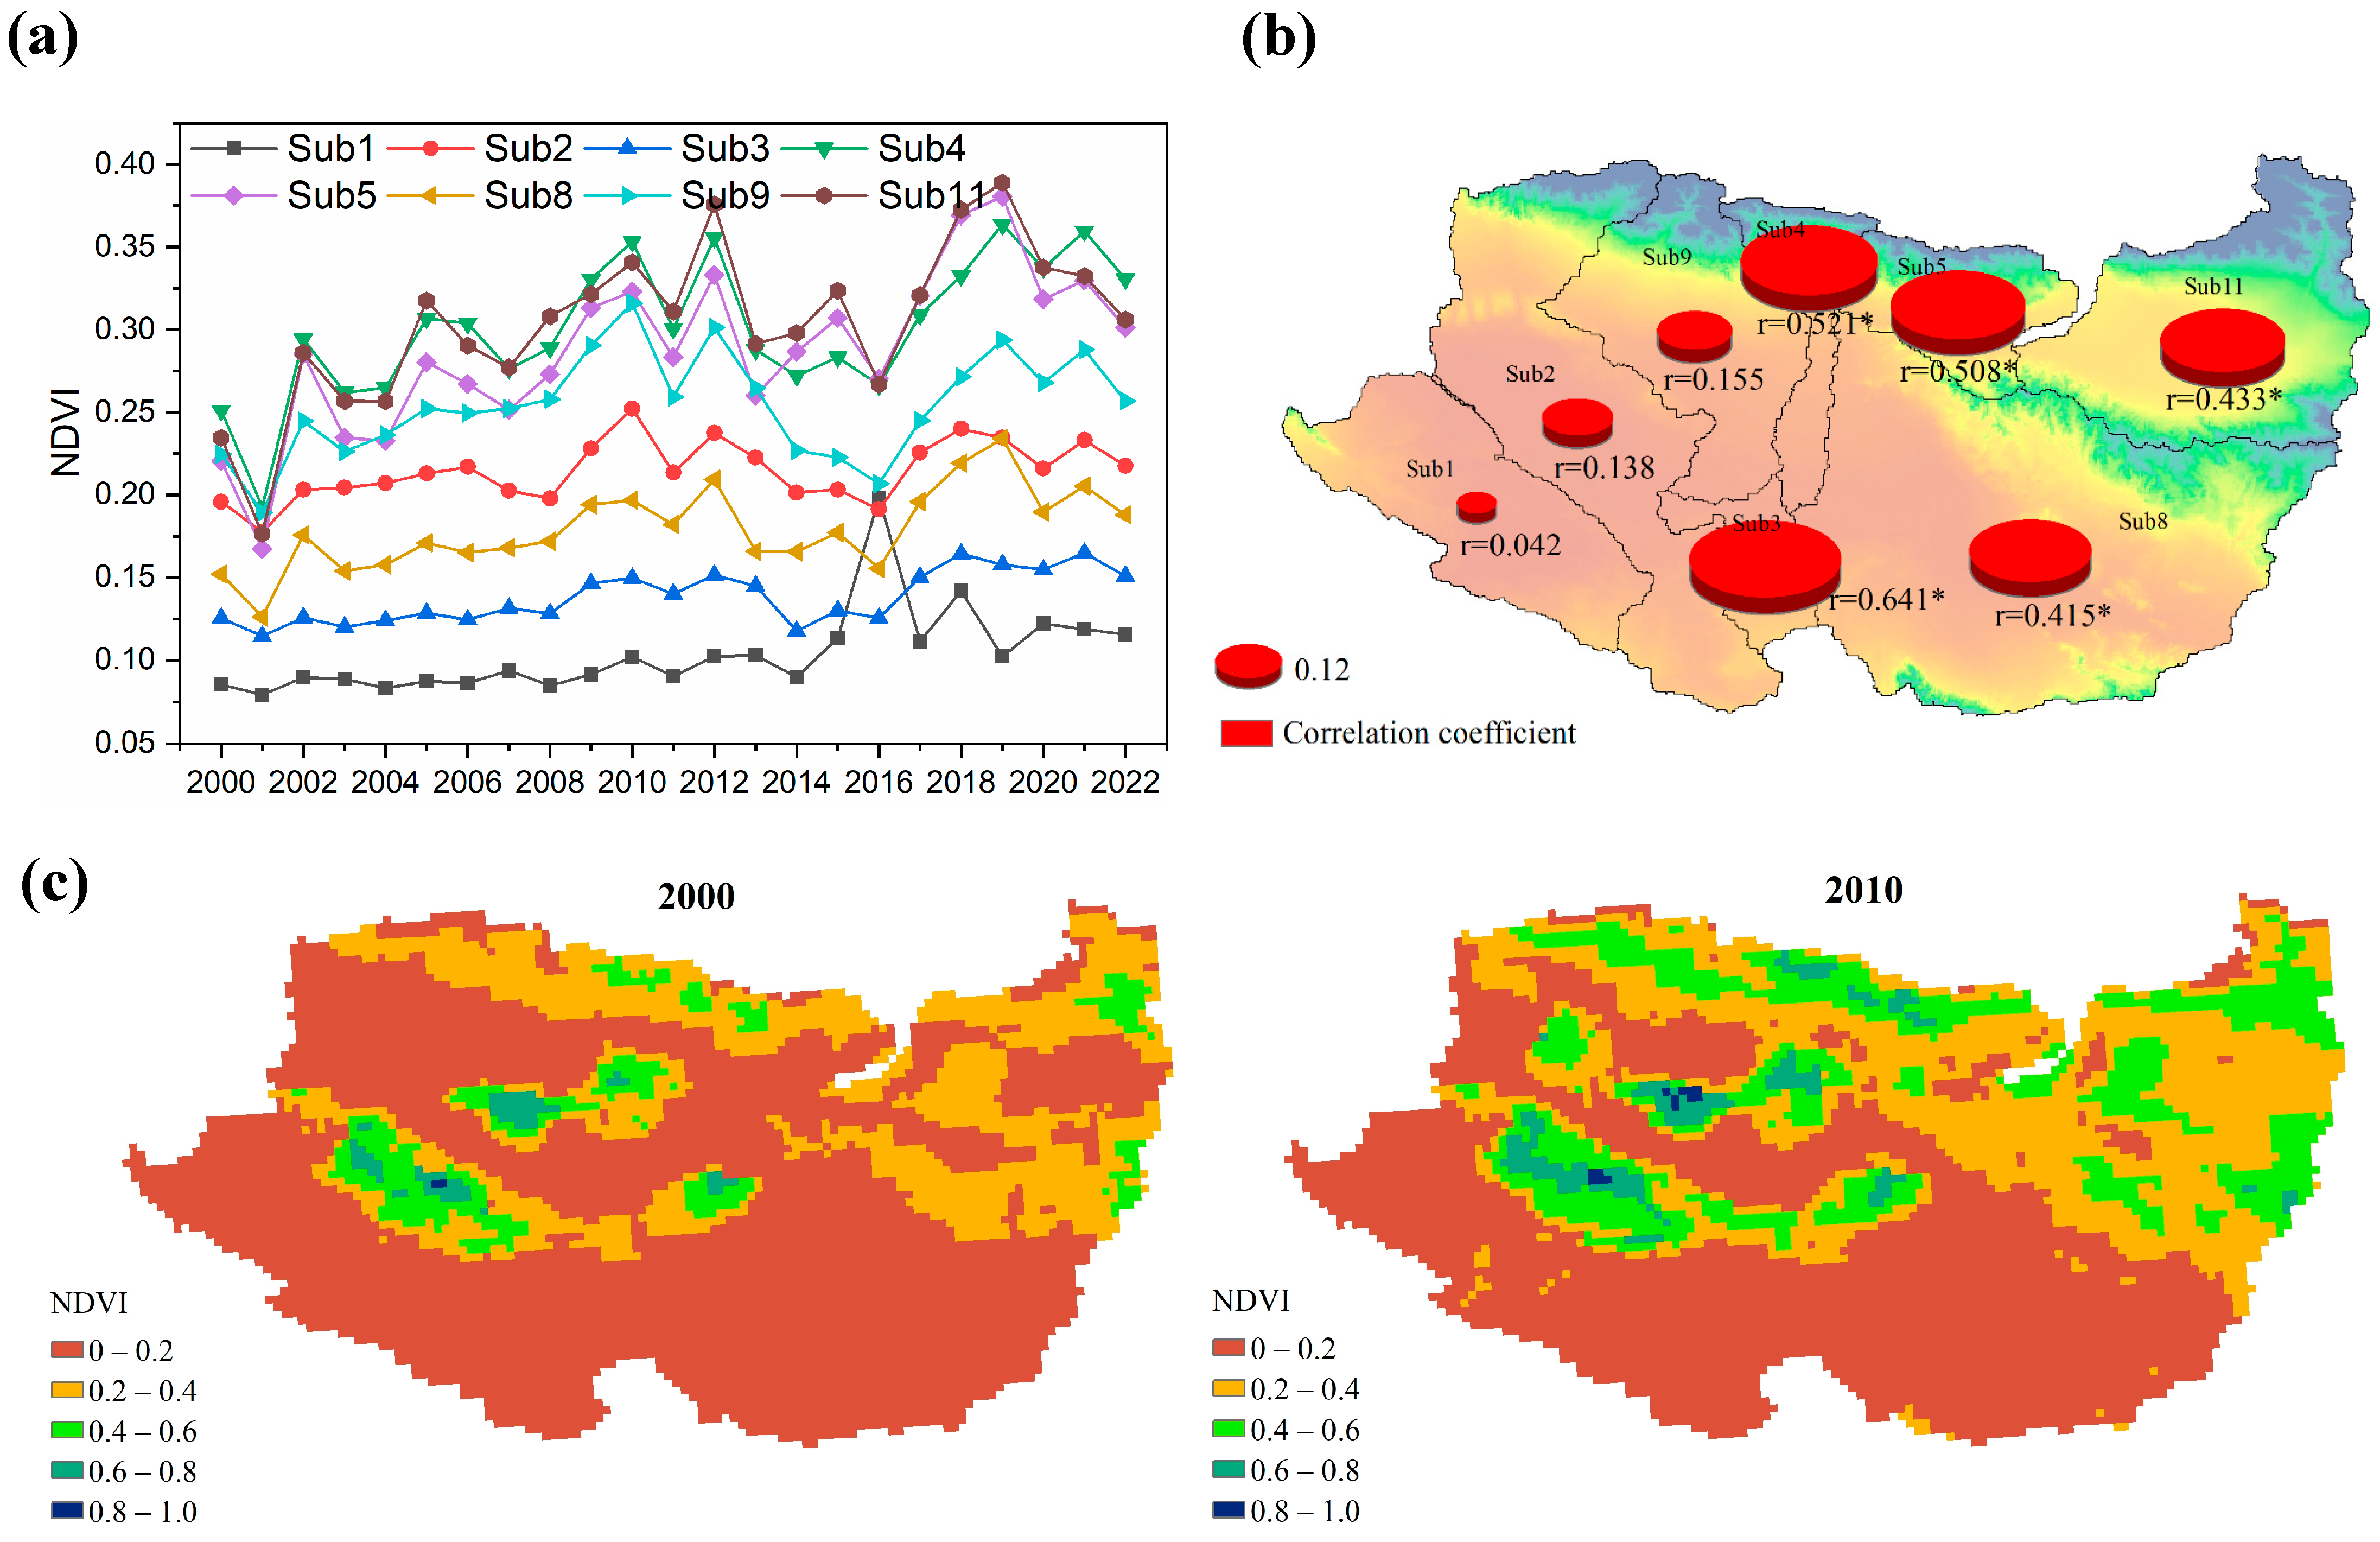
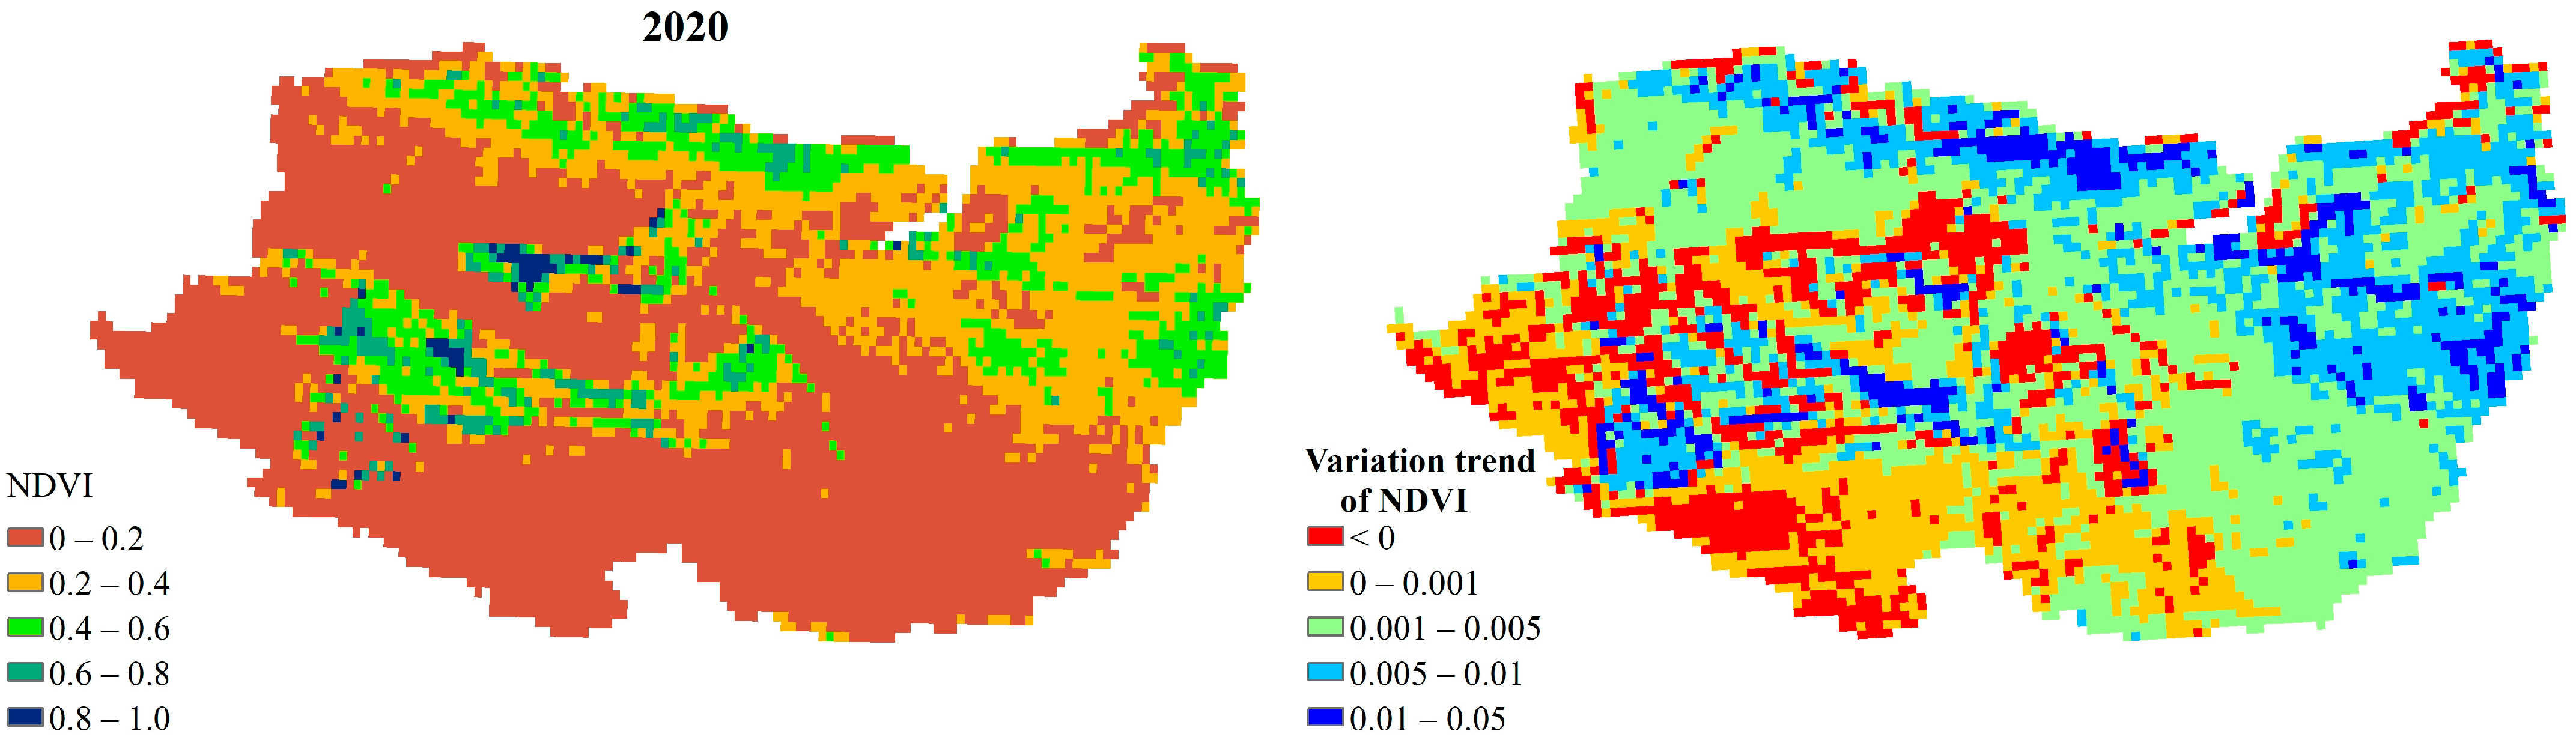
In the alluvial fan region of the Bayin River Basin, the annual average NDVI increased from 0.18 in 2000 to 0.23 in 2022, representing a significant upward trend with an increase of 27.7% (Figure 3a). Affected by the impact of groundwater depth, vegetation types, and intensity of human activities, the spatial distribution of NDVI exhibits a notable gradient feature from the upper area to downstream areas, with significant differences in change rates (Figure 3c). In the area from Heishishan Reservoir to Delingha City, including Sub4, Sub5, and Sub 11, the annual average NDVI increased from 0.23 in 2000 to 0.31 in 2022, representing a growth of 34.8%. In this region, the depth of the groundwater table ranges from 3 to 8 m, which exhibits a significant correlation with NDVI at the 0.05 level, with the correlation coefficient of 0.433~0.521 (Figure 3b). The vegetation is primarily composed of goji berry gardens and irrigated grasslands. In the area from Delingha City to Keluke Lake-Tuosu Lake, including Sub1, Sub2, Sub3, Sub8, and Sub9, the annual average NDVI increased from 0.15 in 2000 to 0.18 in 2022, representing a growth of 20%. The depth of the groundwater table ranges from 1 to 3 m, which exhibits a correlation with NDVI, with a correlation coefficient of 0.042~0.641. The vegetation is primarily composed of wetland plants such as reeds and Achnatherum splendens.
Figure 3.
(a) Dynamic change in vegetation index during the period 2000–2022. (b) Spatial variations in vegetation index in 2005, 2010, 2015, and 2020. (c) The correlation between NDVI and groundwater level. * indicates significant correlation at the 0.05 level.
Among all the influencing factors, groundwater variation is the key driver. The depth of groundwater affects soil moisture content through capillary rise, which in turn controls vegetation growth [26]. Relevant research indicates that an optimal range for groundwater depth is 2–3 m in the arid regions, with an NDVI mean value of 0.42. If the depth exceeds 5 m, the NDVI drops below 0.2 [3,27]. Groundwater serves as a stable water source for vegetation in arid areas, with a contribution rate of 45–55%. The increase in vegetation coverage leads to enhanced evapotranspiration, with an annual increase of 6.1–26.52 mm, forming a local microclimate that promotes rainfall infiltration and replenishes groundwater [28].
3.2.2. Wetland Ecosystems
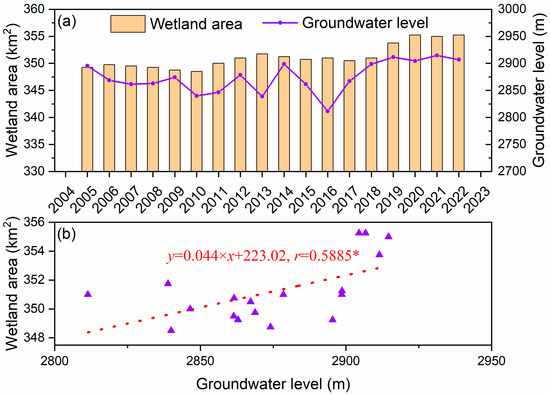
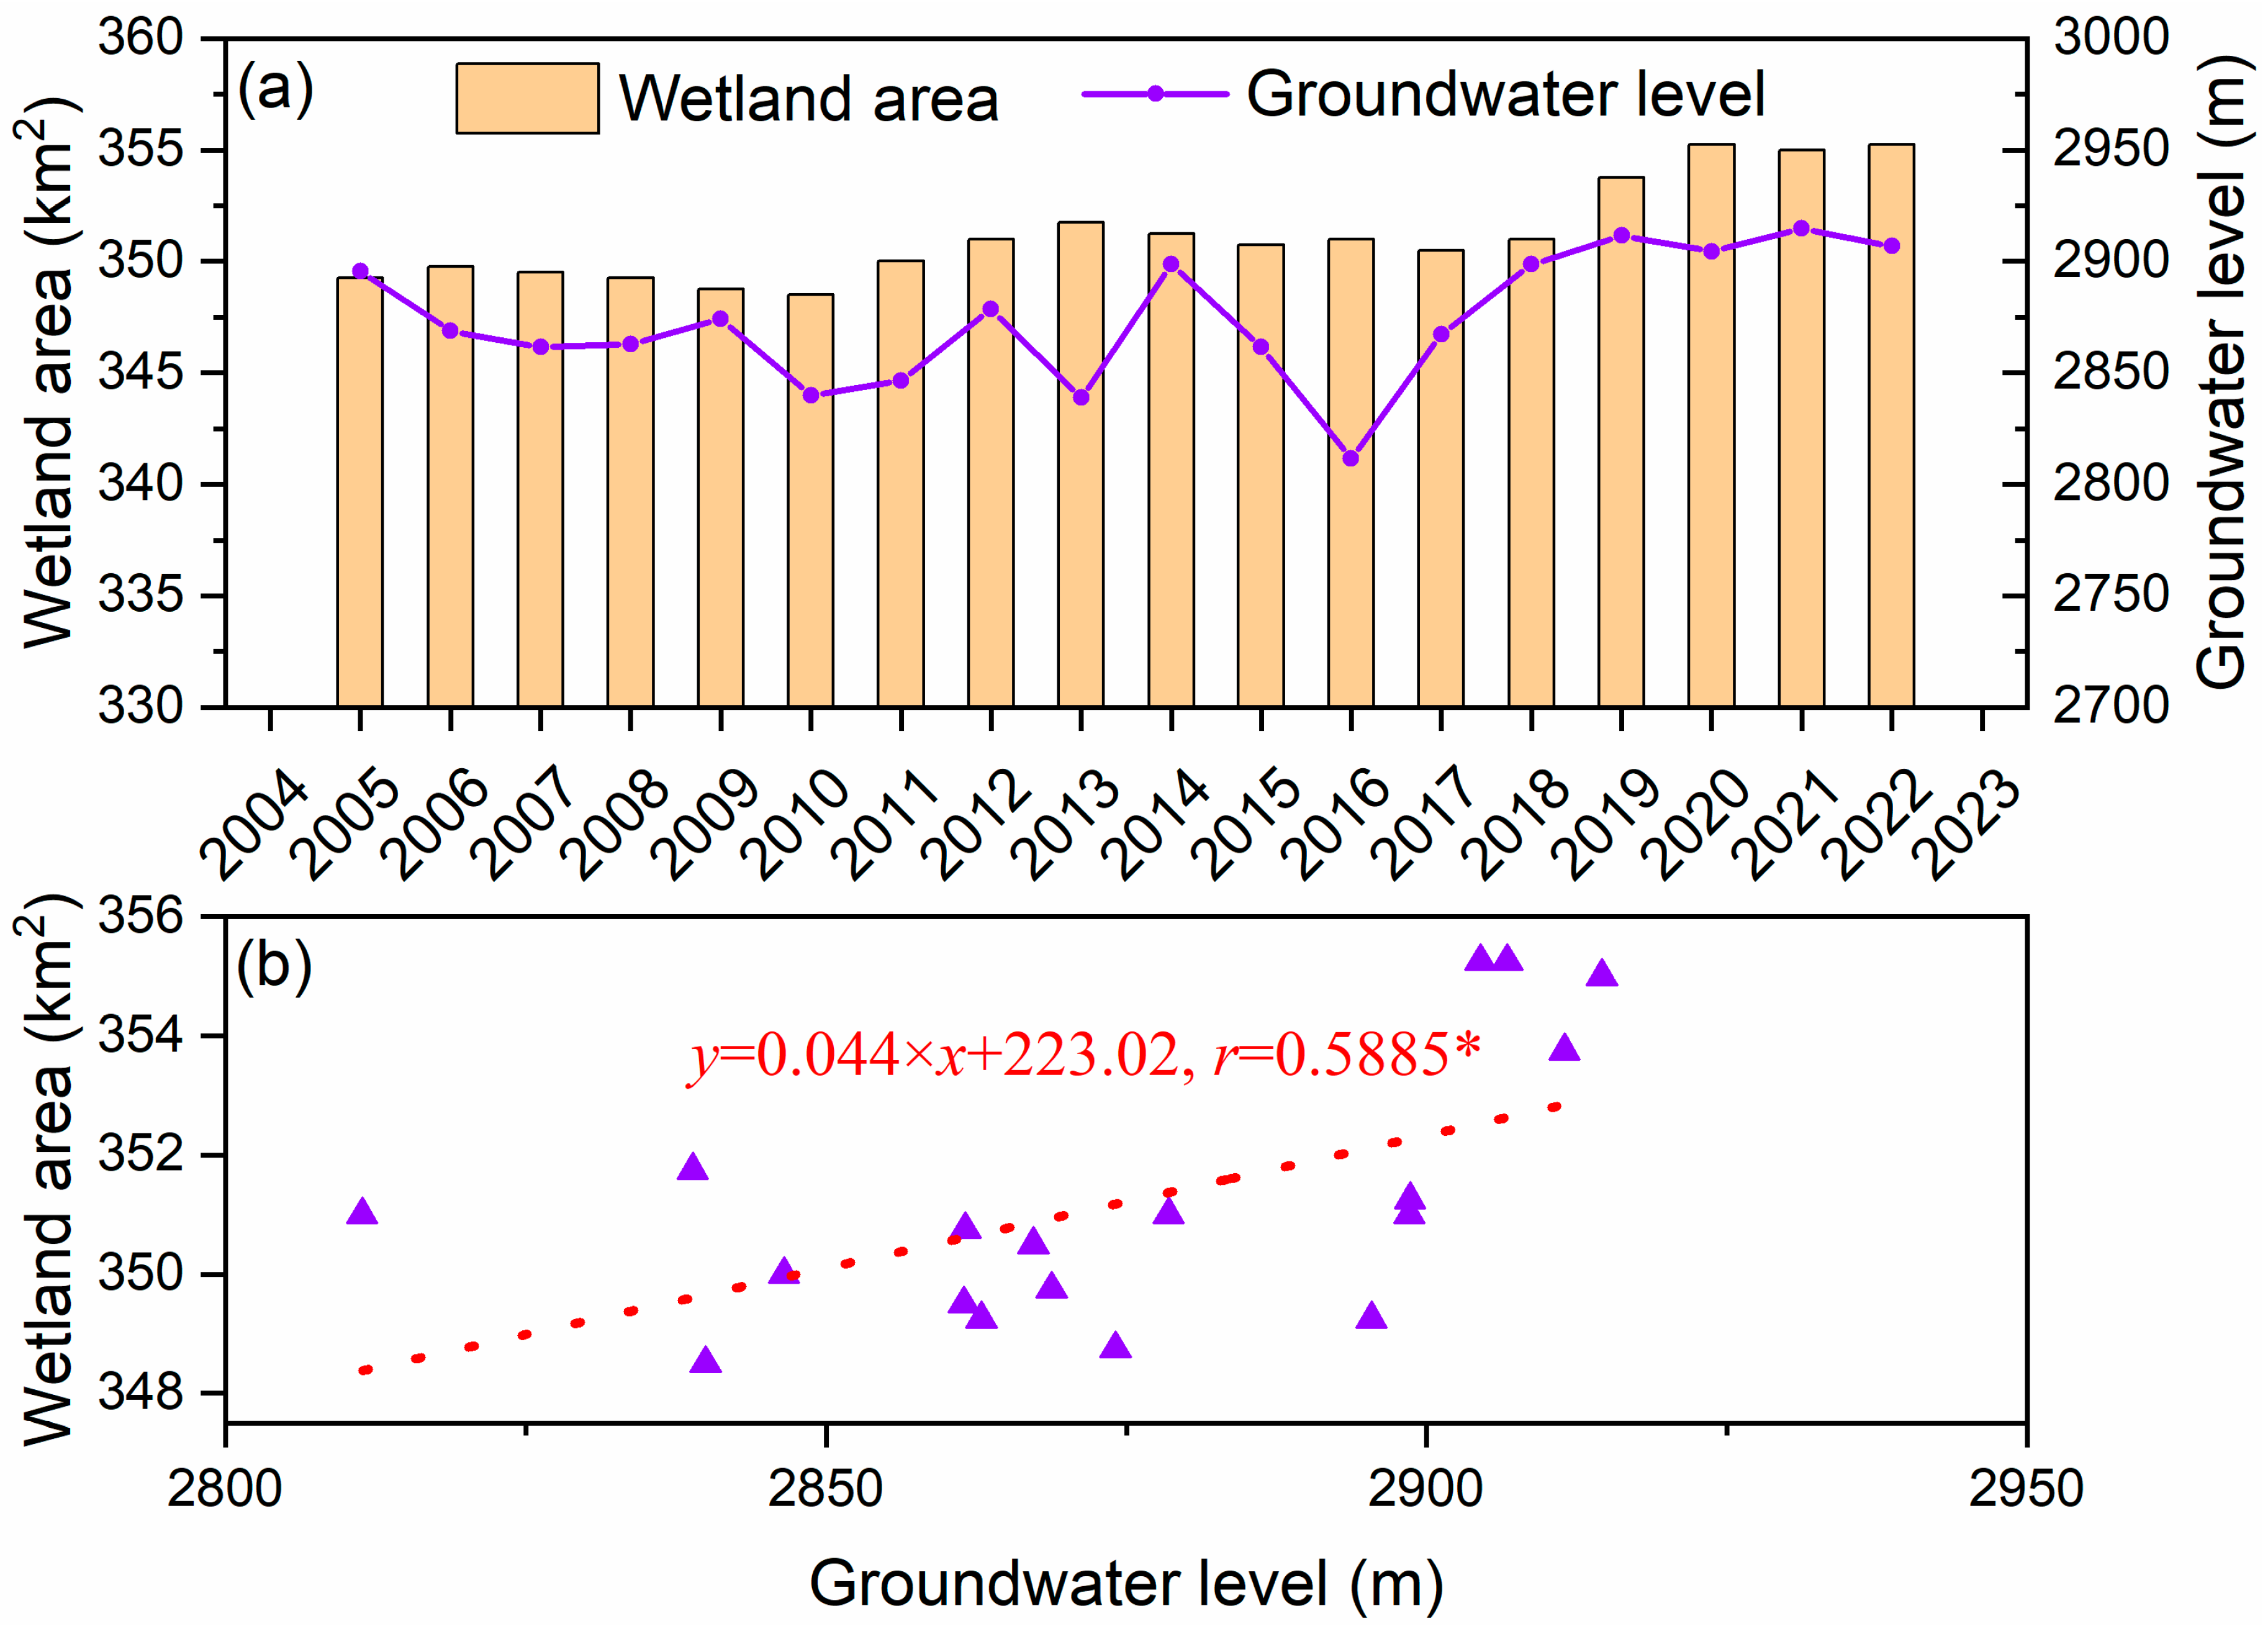
As a whole, there has been a notable expansion of wetlands from 349.25 km2 in 2005 to 355.25 km2 in 2022, increasing by 1.7% (Figure 4a). The main reason is that the rising groundwater levels in the low-lying areas at the fan frontier of the Bayin River Basin have provided more water sources for these wetlands, causing them to expand. There was a significant correlation between groundwater level and wetland area at the 0.05 level, with the correlation coefficient of 0.5885 (Figure 4b). However, a different situation has occurred in the areas adjacent to urban zones. These wetlands have shrunk by 18% due to the overexploitation of groundwater. As urban areas expand and the demand for water increases, more groundwater is pumped out, leading to a decline in the groundwater levels in these areas. Wetlands, which are highly dependent on groundwater for their water supply [29], are severely affected by this decline. The reduction in wetland area has led to a decrease in species richness. Approximately 10% fewer species are found in these shrunken wetlands compared to their previous state. The loss of wetland habitats means that many plant and animal species that rely on these wetlands for survival, such as certain amphibians, water birds, and wetland-specific plants, have less space and resources available, leading to a decline in their populations.
Figure 4.
(a) Dynamic changes in the wetland area of each sub-basin from 2003 to 2022. (b) The correlation between wetland area and groundwater level. * indicates significant correlation at the 0.05 level.
3.2.3. Soil Salinization
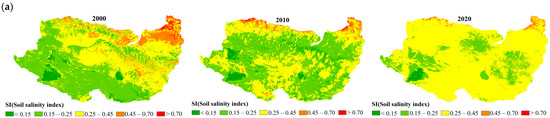
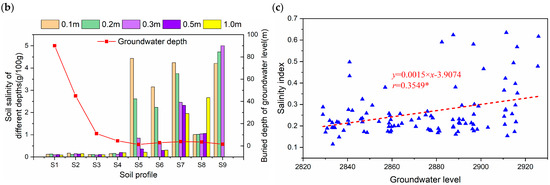
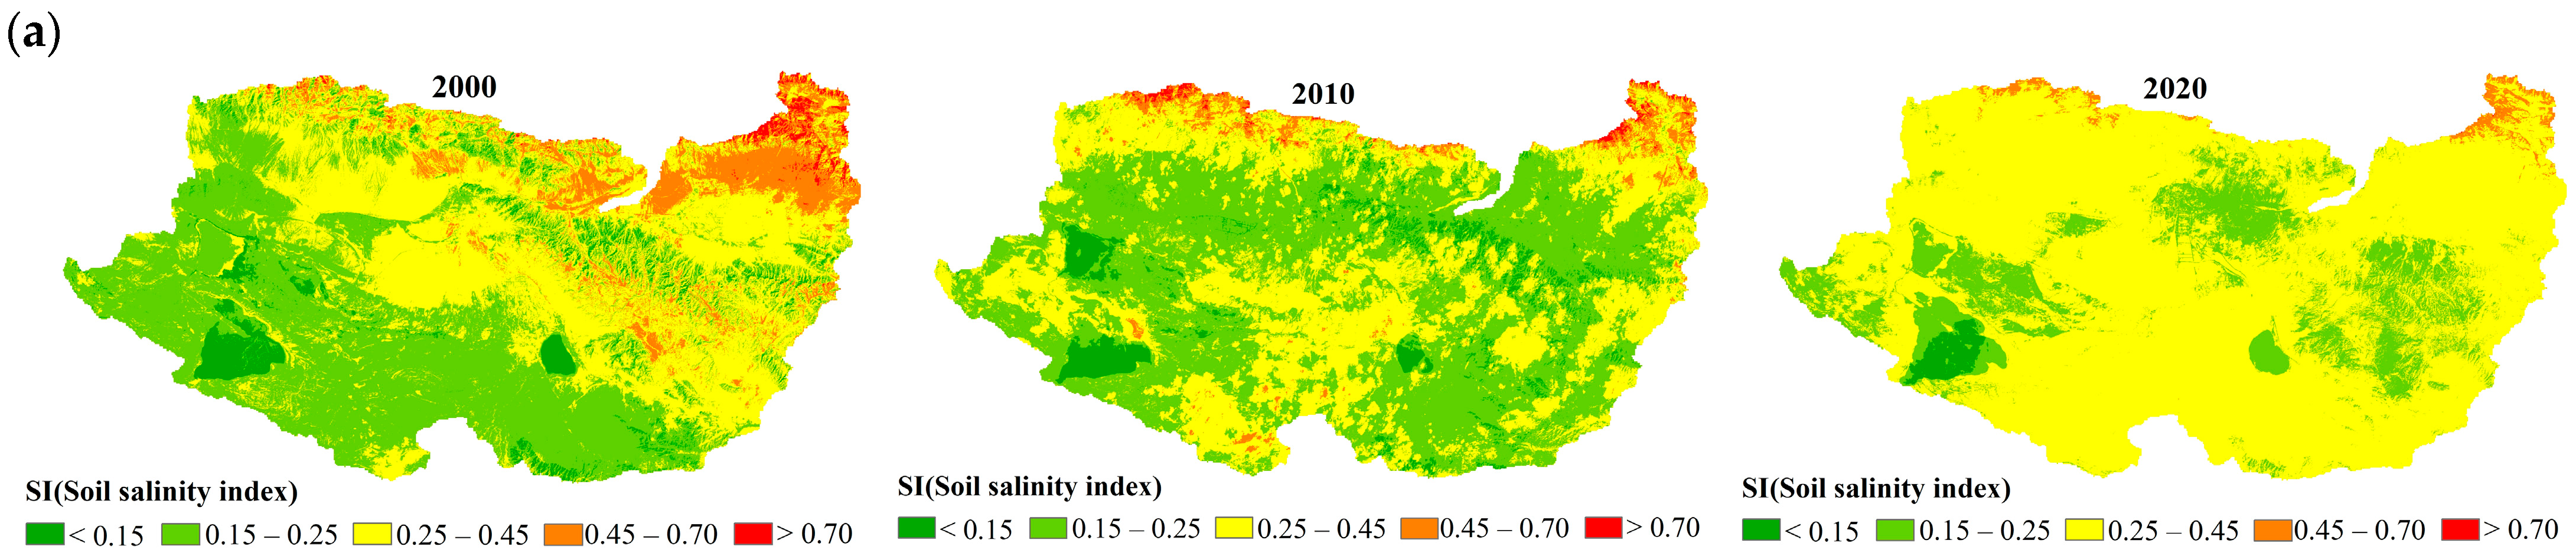
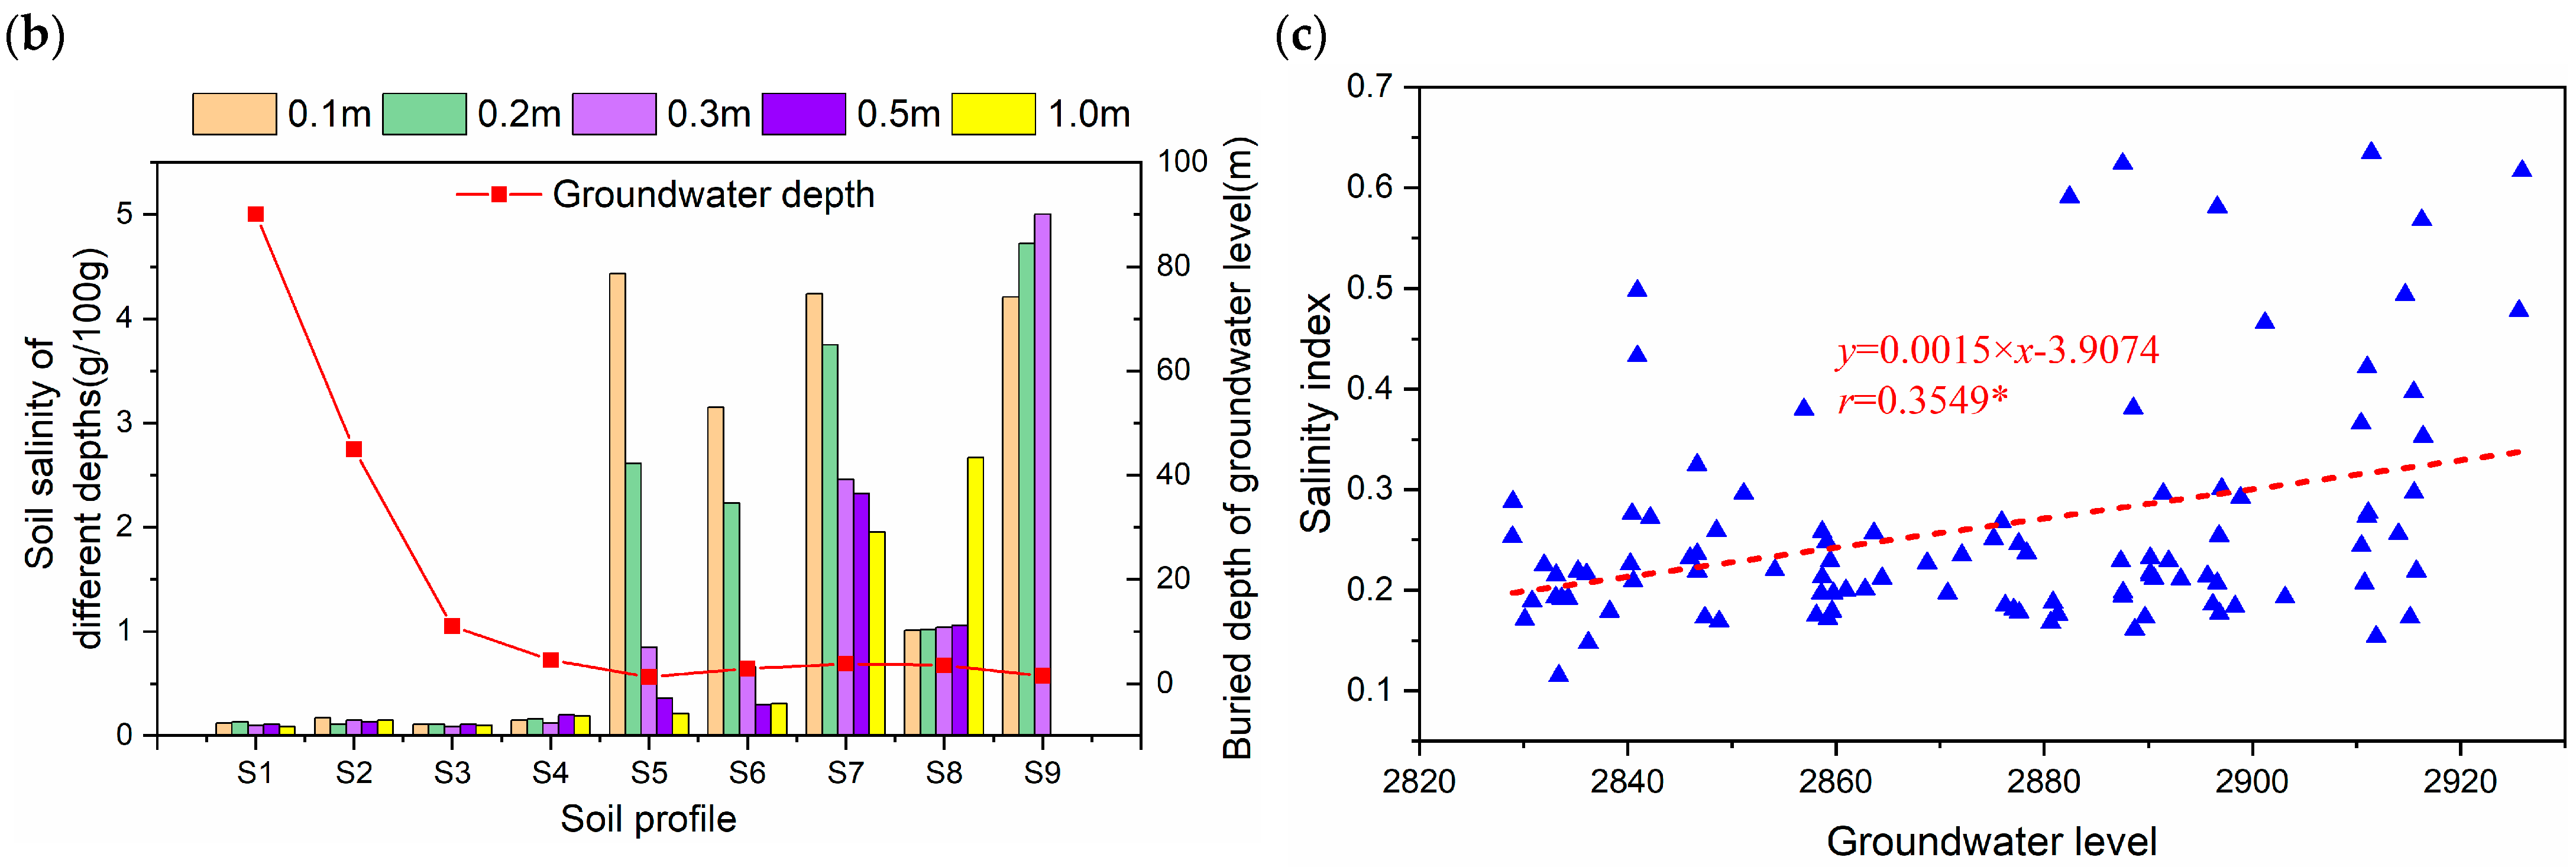
The SI values in 2000, 2010, and 2020 were 0.25, 0.26, and 0.31, respectively, which indicates an increasing trend of soil salinization (Figure 5a). From the perspective of spatial distribution, the SI values in the northern region are higher than those in the southern region. The distribution area with a salinization index ranging from 0.25 to 0.45 shows an expanding trend from 2000 to 2020. The salt content in the vadose zone of arid areas is largely regulated by the groundwater level, which is related to the capillary rise height of the vadose zone lithology and the depth of the groundwater table. The results from the survey data of nine locations suggest that as the depth of the groundwater table becomes shallower, the soil salt content gradually increases (Figure 5b). The Pearson correlation analysis also indicates there was a significant relationship between groundwater level and SI at the 0.05 level, with a correlation coefficient of 0.3549 (Figure 5c).
Figure 5.
(a) Spatial variations in soil salinity index. (b) The variations in soil salt content with soil depth at nine sites of the study area. (c) The correlation between the soil salinity index and the groundwater level. * indicates significant correlation at the 0.05 level.
The impact of groundwater level changes on soil salinization is complex. When the groundwater level rises above the critical depth (approximately 1.5–2.0 m in arid areas), groundwater rises to the surface through capillary action. After evaporation, salt accumulates in the surface soil, resulting in salinization. For instance, the rise in groundwater level has led to the formation of a large area of salinization around Gahai in the Bayin River Basin. When the groundwater level drops below the critical depth, the capillary rise effect weakens, which slows down the development of soil salinization. However, an excessively rapid decline in water level may lead to destruction of soil structure and affect vegetation growth, indirectly influencing the transport of soil salt. In addition, the decline in groundwater level leads to a reduction in groundwater recharge, which may increase the mineralization of surface water bodies such as Tuosu Lake, forming a vicious cycle and affecting the salinization status of the surrounding soil.
3.2.4. Soil Water Content
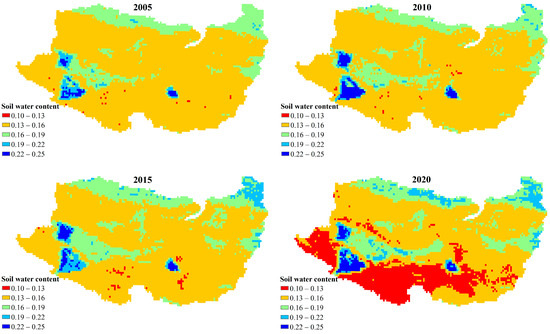
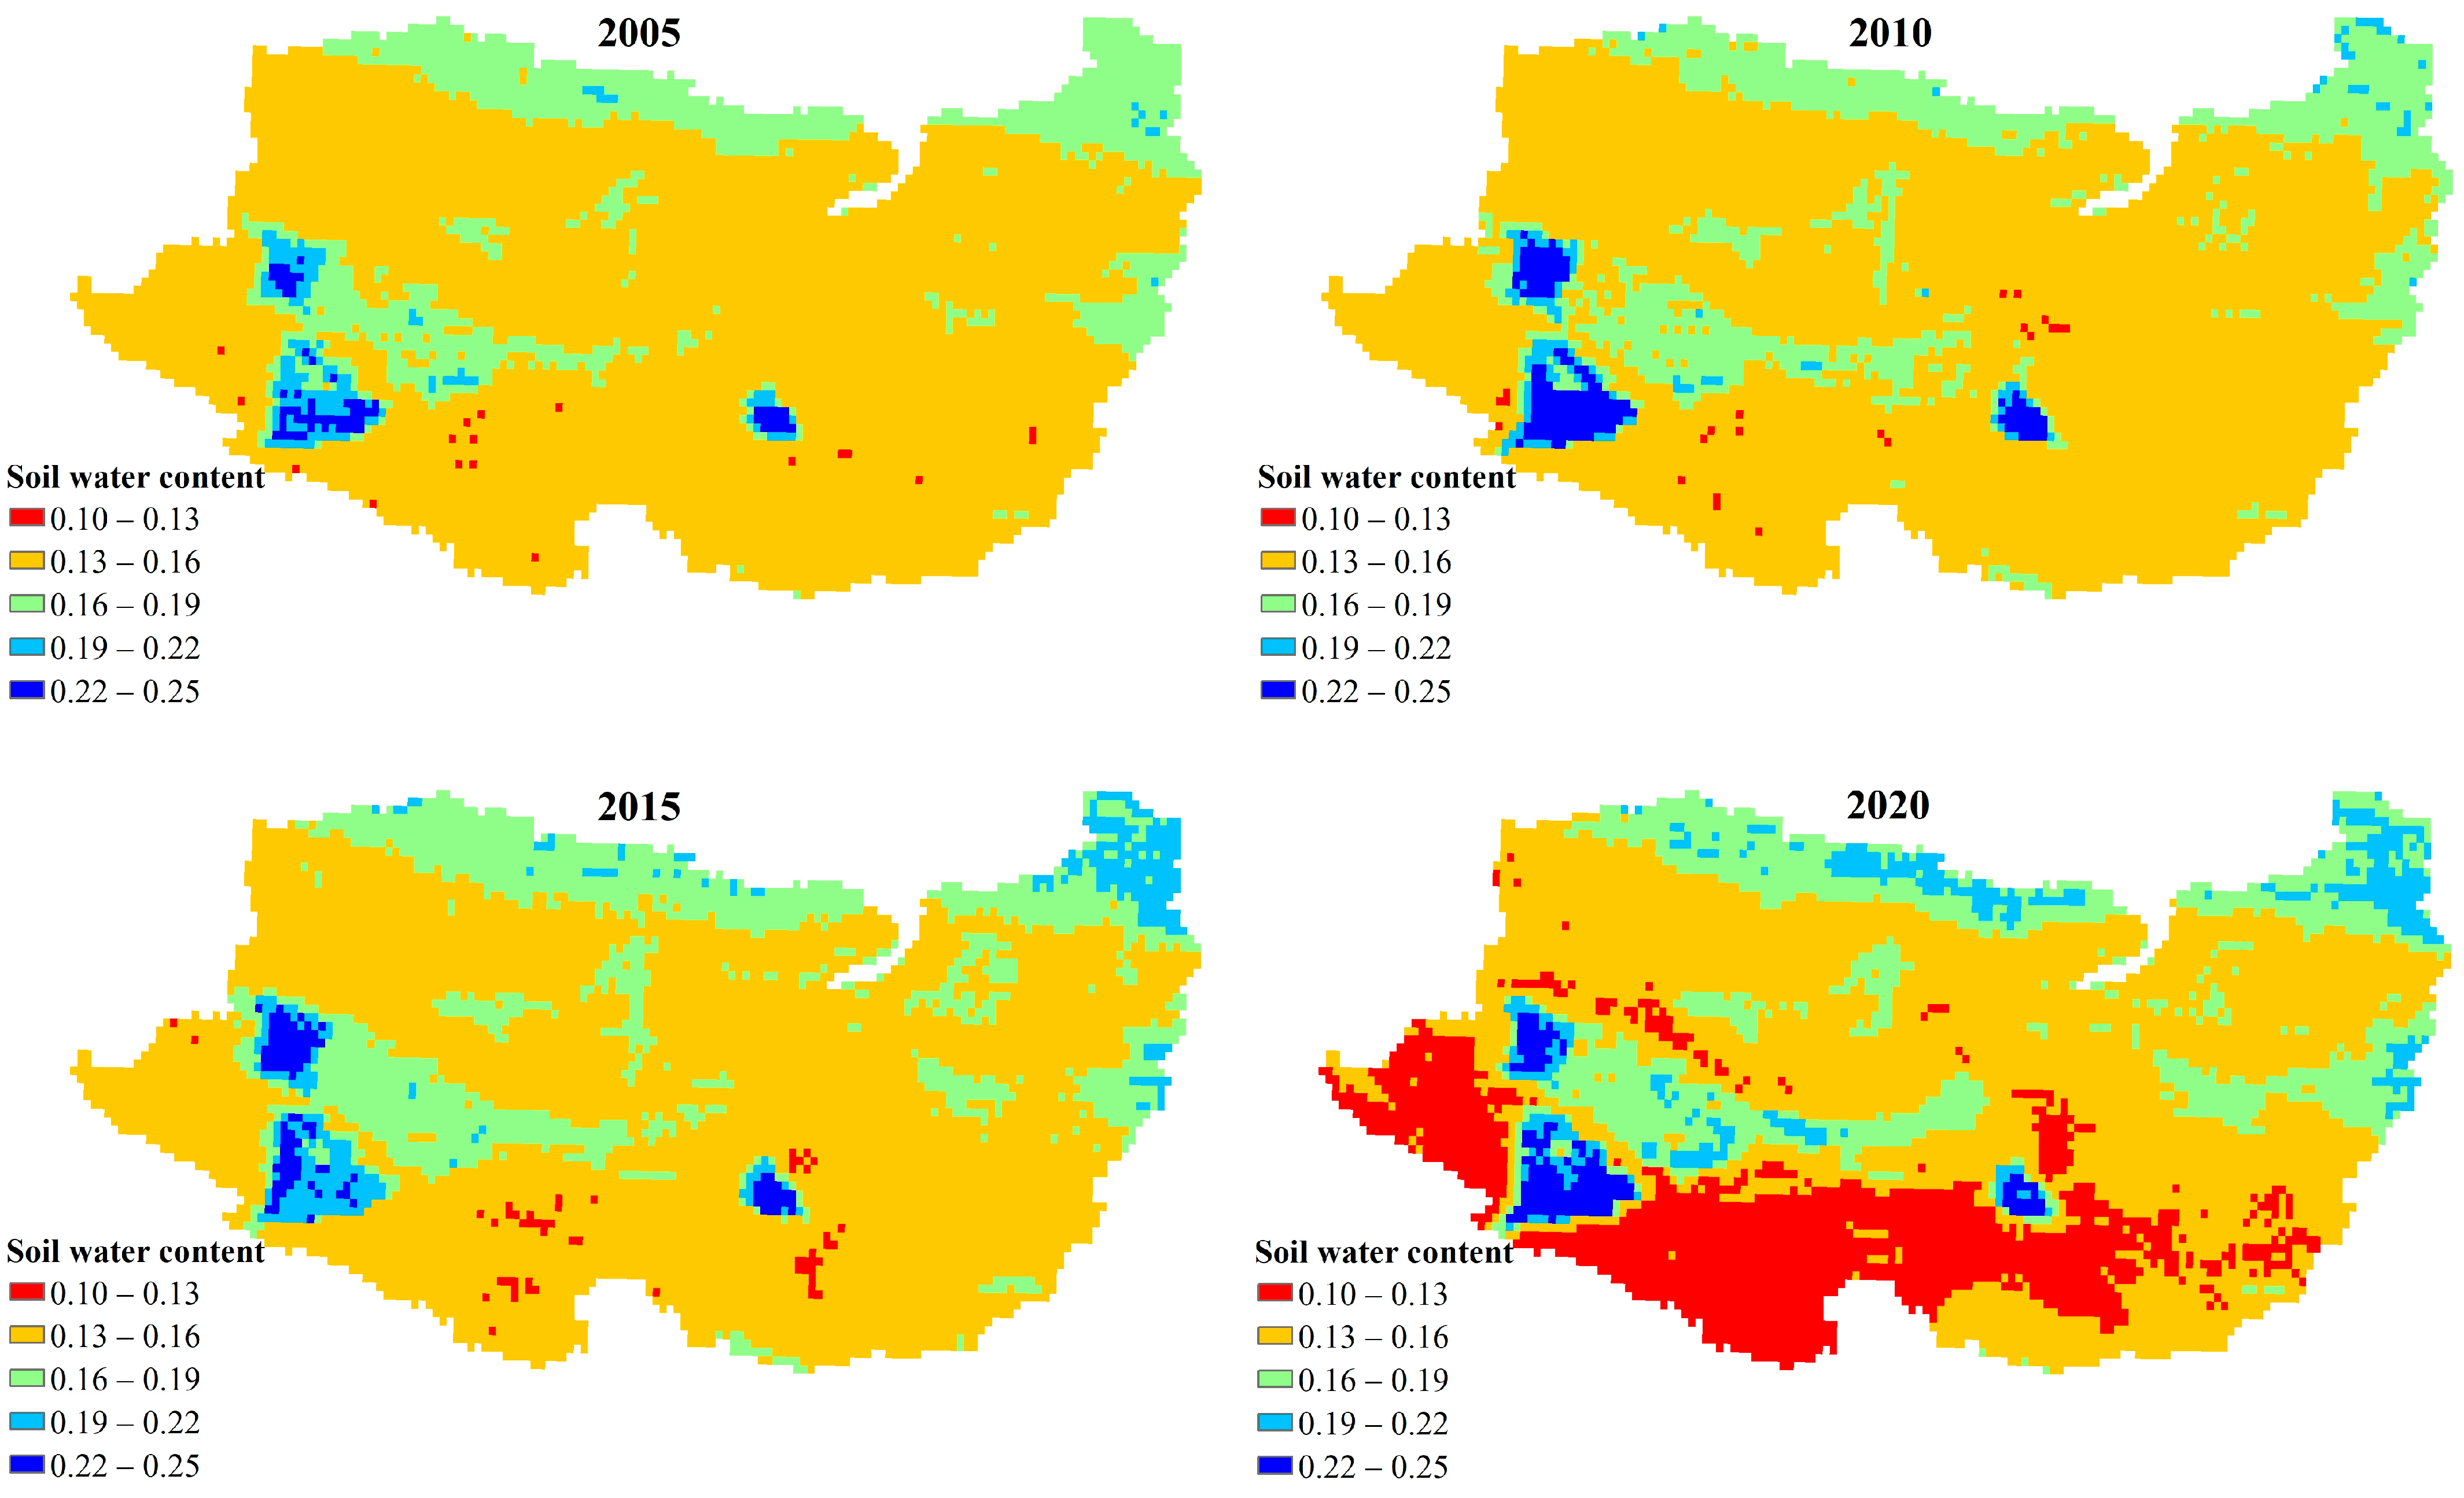
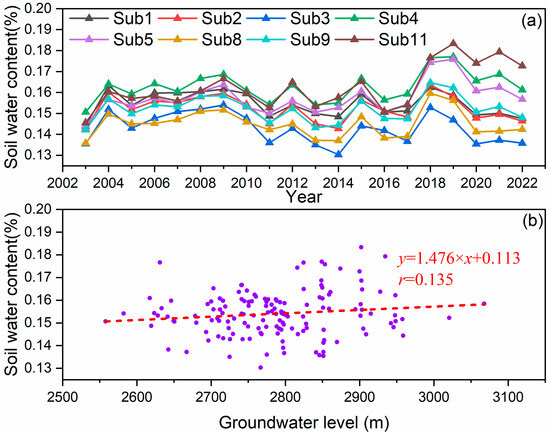
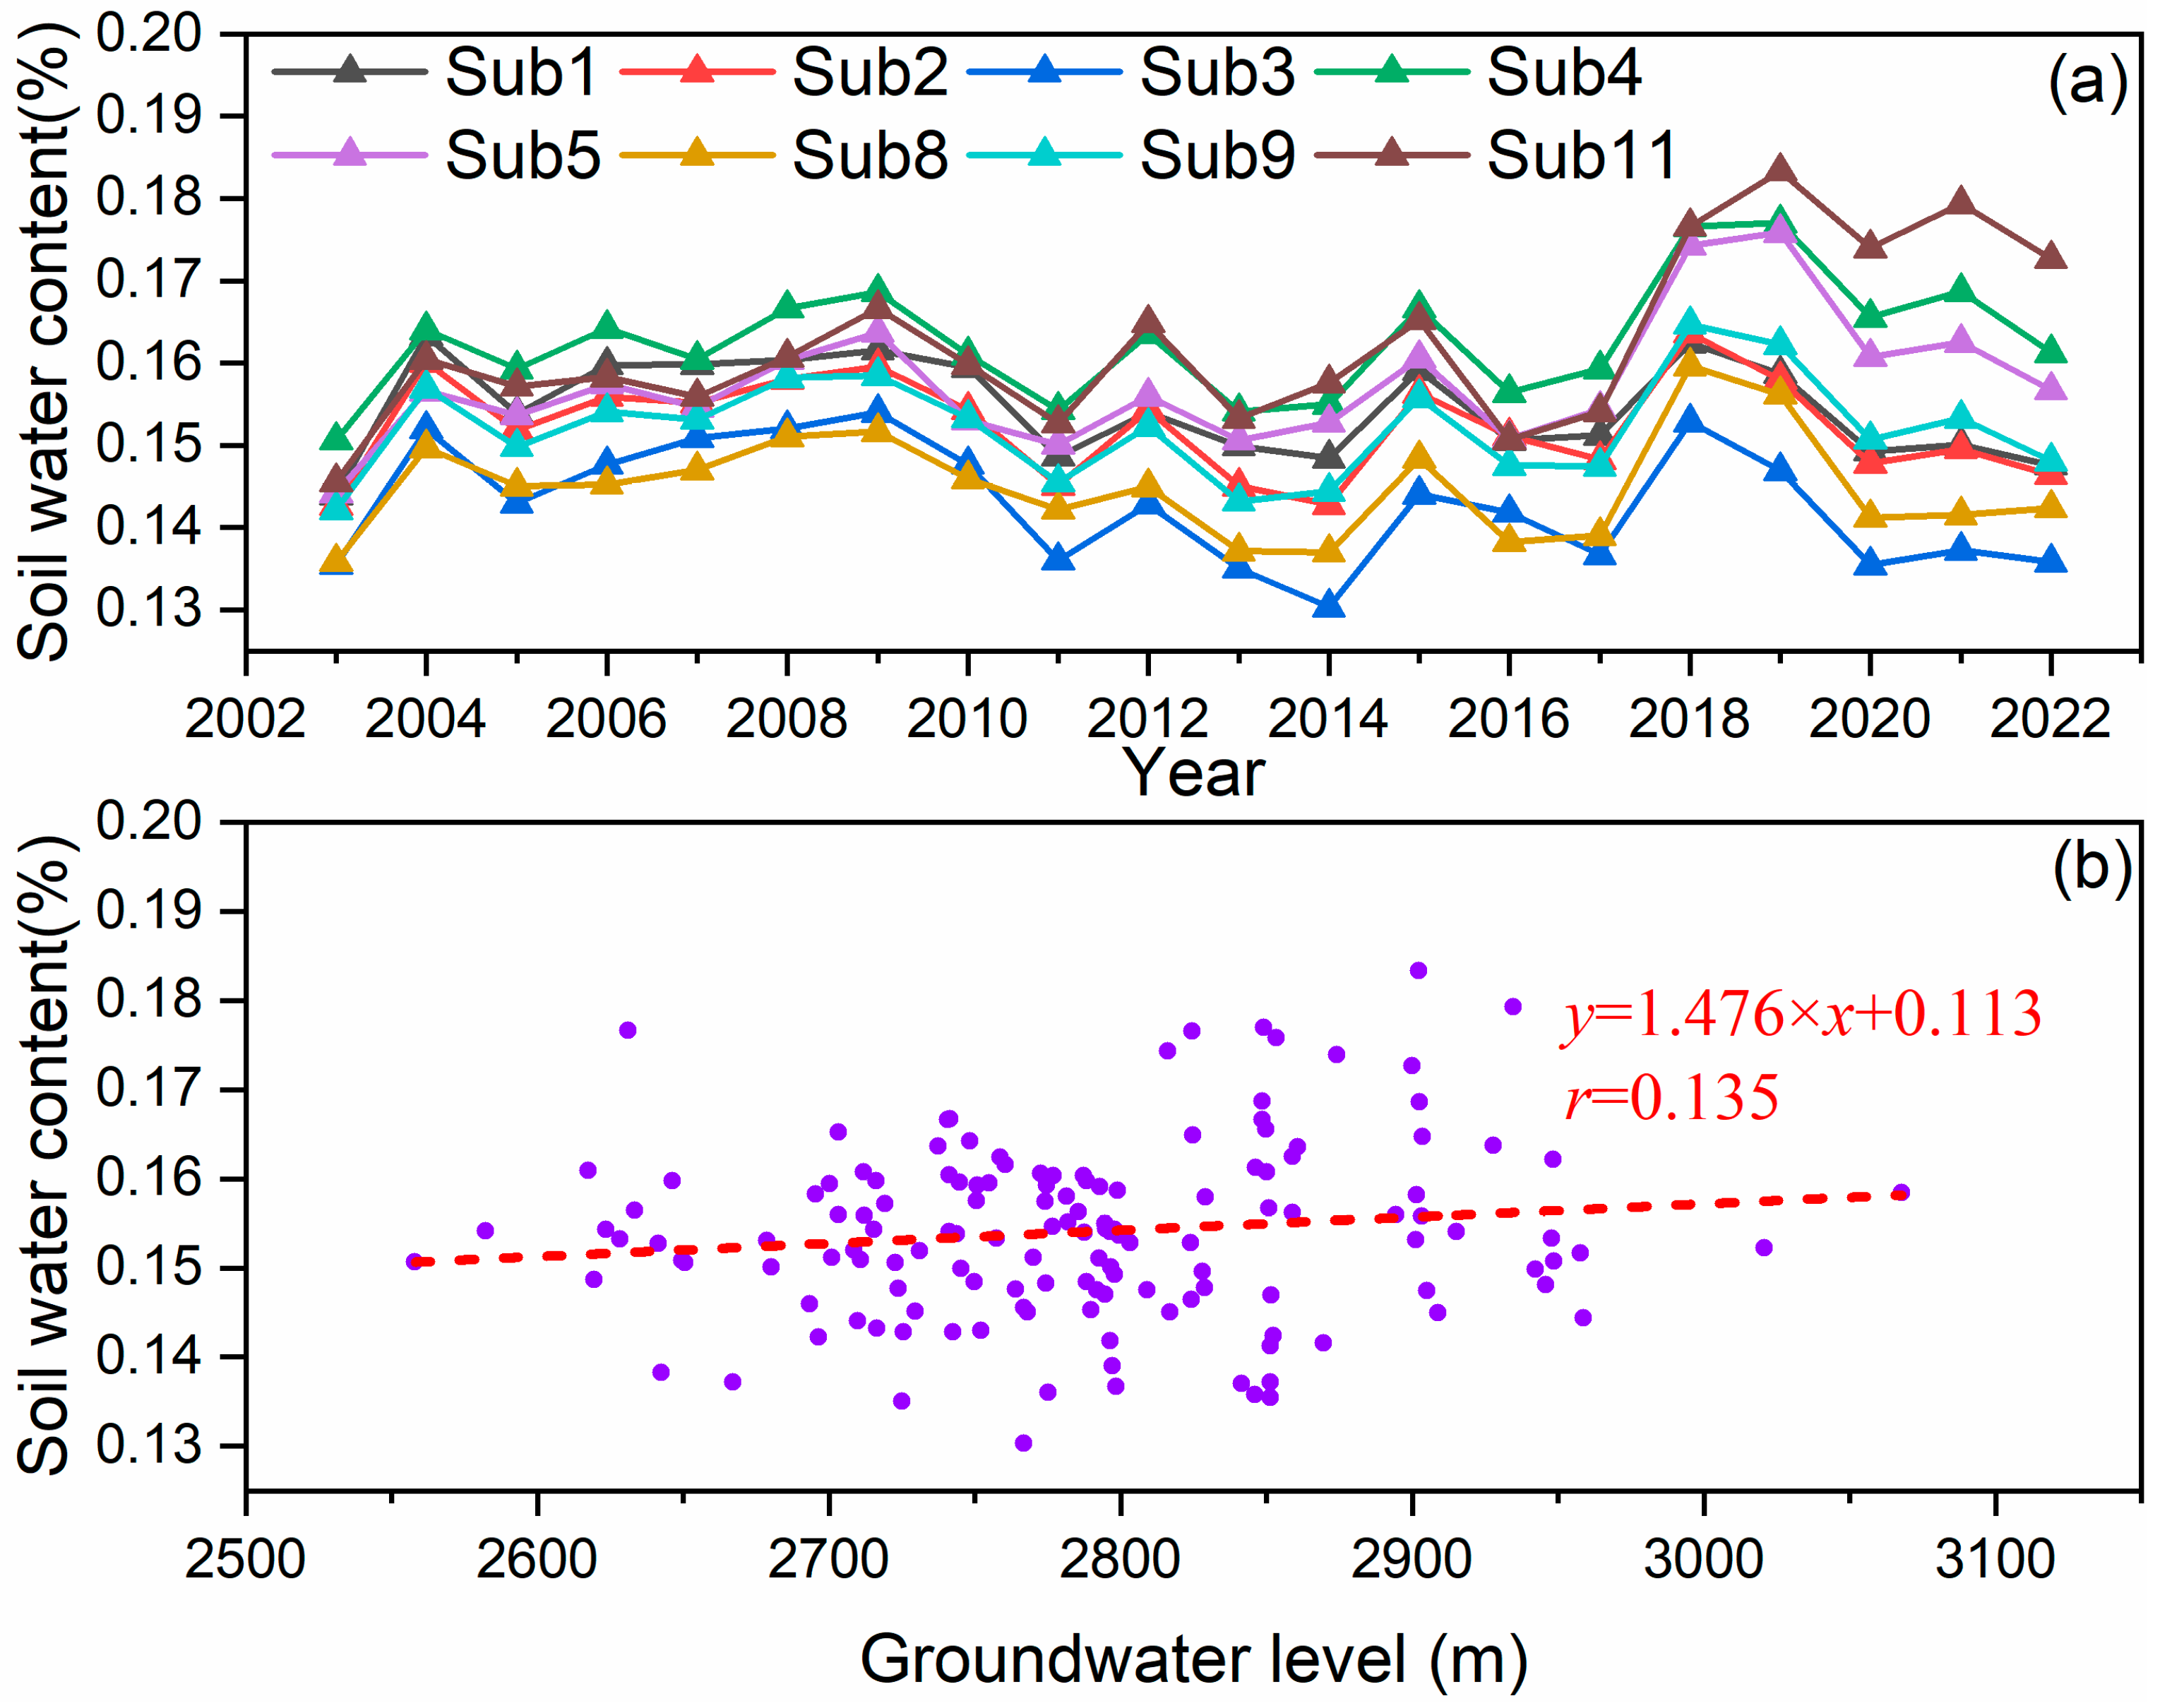
The soil moisture content exhibits a significant decreasing trend along the flow direction of the Bayin River from upstream to downstream and the topographic gradient from the piedmont alluvial fan area to the lacustrine plain area (Figure 6). There are three core zones, including the high water-bearing zone, medium water-bearing zone, and low water-bearing zone. The high water-bearing zone is primarily situated around the Zelingou Basin and the Heishishan Reservoir, where the exchange between surface water and groundwater is frequent, with shallow groundwater depth (<2 m), with an average water content of >20%. The medium water-bearing zone is located in the central part of the Delingha Plain and the forefront of the alluvial–proluvial fan, where the depth of groundwater is 2–5 m, with an average moisture content of 12–20%. A low water-bearing zone is primarily situated in the surrounding areas of Gahai-Tuosu Lake and the Gobi region, where strong evaporation leads to rapid loss of soil water, with an average water content of <12%. From the perspective of inter-annual variation, soil moisture content showed an insignificant downward trend before 2014 with the slope of −0.03%/yr. Then, it showed an insignificant upward trend after 2014, with the slope of 0.05%/yr (Figure 7a).
Figure 6.
Spatial variations in soil water content in 2005, 2010, 2015, and 2020.
Figure 7.
(a) Dynamic changes in soil water content of each sub-basin from 2003 to 2022. (b) The correlation between soil water content and groundwater level.
To some extent, changes in groundwater level have a certain impact on spatio-temporal variations in soil moisture (Figure 7b). As the area where surface water and groundwater exchange most frequently in the Bayin River Basin, the unique hydrological processes in the Zelingou Basin determine the spatial pattern of soil moisture in the middle and lower reaches. Approximately 70–80% of the runoff from the Bayin River after leaving the mountains seeps into the ground, forming groundwater runoff. In the Zelengou Basin, it overflows in the form of spring-fed rivers, replenishing soil moisture. This cycle pattern of surface water infiltration, groundwater storage, and surface water overflow makes the Zelingou Basin a key recharge area for soil moisture in the middle and lower reaches.
3.3. Mechanisms of Groundwater–Ecology Interactions
3.3.1. Hydrological Connectivity and Feedback Loops
Climate-induced runoff augmentation, driven primarily by intensified snowmelt and precipitation, together with agricultural irrigation practices, constitutes the principal driver of rising groundwater levels in the alluvial fan of Bayin River Basin [25]. As the groundwater levels rise, the water table gets closer to the soil surface. In the arid climate of the basin, high evaporation rates cause the water in the soil to evaporate rapidly. Since water contains dissolved salts, this evaporation process leaves behind the salts in the soil, leading to soil salinization [30]. The increase in soil salinity has a significant impact on the vegetation in the area. Native shrub species that are not adapted to high-salt environments face challenges in absorbing water and nutrients. As a result, their growth is inhibited, and their coverage and vitality decline. For example, the native Haloxylon ammodendron has seen a decrease in coverage. In contrast, salt-tolerant species like Suaeda salsa, which have physiological mechanisms to tolerate high-salt conditions [31], find the salinized environment more favorable for their growth and reproduction, and thus expand their distribution.
On the other hand, the degradation of vegetation, especially the decline in the coverage of native shrubs, leads to a reduction in evapotranspiration. Evapotranspiration is the process by which water is transferred from the land surface to the atmosphere through evaporation from the soil and transpiration from plants [32,33]. With less vegetation, there is less transpiration, and the overall evapotranspiration rate decreases. This reduction in evapotranspiration means that less water is being removed from the soil and the shallow groundwater system. As a result, the amount of water stored in the shallow groundwater increases, further raising the groundwater levels [34]. This, in turn, aggravates soil salinization and forms a positive feedback loop. Such a feedback cycle can drive the progressive degradation of the alluvial fan ecosystem, as the escalating salinization further impairs the survival of native vegetation, while the expansion of salt-tolerant species may disrupt the original ecological equilibrium.
3.3.2. Human-Induced Modifications to Water Cycling
In the upper basin of the Bayin River, river channel hardening and reservoir construction have had a profound impact on the natural groundwater recharge patterns [35]. River channel hardening, a practice commonly implemented to mitigate erosion and manage flood risks, entails lining the river channels with concrete or other impervious materials. This hardening significantly reduces the natural infiltration of surface water into the ground [36]. As a result, a large portion of the surface water that would have otherwise infiltrated into the aquifers and recharged the groundwater is instead directed downstream. This change in the flow of surface water leads to a decrease in groundwater recharge in the upper basin and an elevation of groundwater levels in the frontier areas.
Reservoir construction also exerts a pivotal influence on modifying the hydrological cycle. Reservoirs retain water during high-flow periods and discharge it during low-flow periods, and this hydrological regulation affects both the timing and magnitude of groundwater recharge. For instance, during the reservoir impoundment phase, water levels in the upstream river decline, which reduces water availability for infiltration and thus curtails groundwater recharge. Conversely, during the water release phase, the augmented river discharge in the downstream reach may enhance infiltration processes, thereby increasing groundwater recharge in downstream regions.
In the mid-basin, large-scale irrigation is a dominant water-use activity that acts as both a groundwater consumer and a recharge source, demonstrating the complex “dual” water-cycle dynamics in human-dominated basins [35]. When water is pumped from wells for irrigation, it directly reduces the amount of groundwater stored in the aquifers. However, a significant portion of the irrigated water, about 30% in the Bayin River Basin, returns to the groundwater system through infiltration. This irrigation return flow can recharge the aquifers and increase the groundwater levels. The amount of recharge depends on various factors, such as the irrigation method, soil type, and the amount of water applied [37]. For example, flood irrigation, which involves flooding the fields with water, may result in more infiltration and recharge compared to drip irrigation, which delivers water directly to the roots of plants in a more controlled manner. The complex interactions between these human-induced modifications to the water cycle and the natural hydrological processes in the Bayin River Basin highlight the need for a comprehensive understanding of the water-use patterns and their impacts on groundwater and the ecosystem [38,39]. This understanding is essential for developing effective water management strategies that can balance the needs of human activities with the preservation of the ecological integrity of the basin.
3.4. Uncertainties and Limitations
This study employs multi-source remote sensing data to analyze groundwater dynamics and their ecological effects in an alpine endorheic region, offering insights for sustainable water resource management, but several uncertainties and limitations should be noted. Firstly, the source and downscaling method of remote sensing data can affect the accuracy of the data. For instance, different sensors and data sources may have varying levels of accuracy and reliability, which can introduce uncertainty into the data acquisition process [16]. Secondly, the analysis of groundwater-induced ecological effects is limited by the focus on vegetation, wetlands, soil moisture, and soil salinization, which results in an insufficient exploration of coupling mechanisms with other ecological elements, and the inability to capture short-term ecological responses due to the temporal constraints of remote sensing data. Thirdly, the lack of long-term in situ observation data prevents full quantification and distinction of the independent contributions of human activities and climate change to groundwater and ecological processes. Overall, although the results have a degree of uncertainty, this study can provide a basic approach for assessing the dynamics of groundwater and its ecological effects in an alpine endorheic region systematically, and the combination of remote sensing and in situ observation needs to be further strengthened in the future.
4. Conclusions and Sustainable Management Strategies
Groundwater levels in the Bayin River Basin exhibited an increasing trend from 2895.35 m in 2005 to 2906.75 m in 2022, with a rate of 6.7 m/decade due to increased runoff and irrigation. In contrast, the urbanized areas near Delingha City presented a different scenario. These areas experienced a slight decline in groundwater levels, with a rate of about 0.3 m/decade. The spatial distribution of groundwater levels showed a west-to-east decreasing gradient. These changes have induced cascading ecological effects, including both positive and negative aspects. Overall, as the groundwater levels have risen in recent years, the vegetation index, wetland area, and soil moisture content have also increased accordingly. However, due to strong evapotranspiration in arid regions, soluble salts in the shallow groundwater migrate upward and accumulate continuously in the topsoil with increasing groundwater level, resulting in aggravated soil salinization. Due to the influence of human activities and geological conditions, the ecological effects induced by changes in groundwater levels exhibit regional differences. The urban area of Delingha and the southern alluvial–proluvial fan region have witnessed a reduction in vegetation coverage, desertification of land, and shrinkage of wetlands.
To address these adverse ecological effects, tailored solutions should be designed that target different areas while incorporating the identified spatial and temporal patterns. In the agricultural areas of the Bayin River Basin, the current situation of irrigation is often inefficient, with over-irrigation being a common problem. By implementing scientific irrigation scheduling, water can be applied to the fields at the most appropriate times, reducing unnecessary water application. In addition, groundwater recharge zones need to be designated in the alluvial fan to maintain ecological flow thresholds. The alluvial fan in the Bayin River Basin has unique hydrogeological conditions that make it suitable for groundwater recharge. By identifying and designating specific areas in the alluvial fan as groundwater recharge zones, surface water is directed to these areas for effective recharge. These recharge zones can be protected from activities that may impede recharge, such as construction or excessive extraction of surface water. For example, buffer zones can be established around the recharge areas to prevent human interference. Maintaining ecological flow thresholds in the river is crucial for the health of the entire ecosystem. Sufficient ecological flow ensures the availability of adequate water for riparian plant communities, aquatic biota, and the holistic stability of river basin ecosystems. By regulating groundwater recharge and discharge processes in recharge zones, this approach helps sustain the threshold values of ecological flow, thereby safeguarding the long-term ecological sustainability of rivers and their associated ecosystems.
Author Contributions
Z.Z. and X.C. collected and analyzed the data and drafted the paper; Y.Z. and W.L. supervised this study; G.Q. and K.K. edited and revised the paper and the figures. All authors have read and agreed to the published version of the manuscript.
Funding
This work was funded by the Basic Research Plan Project of Qinghai Province (grant no. 2024-KJ-02), the Cooperation Project between the Ministry of Natural Resources and Qinghai Province (grant no. 2024ZRBSHZ020), and the Xinjiang Uygur Autonomous Region Water Conservancy Special Development Fund Project (2022.B-004).
Data Availability Statement
No new data were created in the article.
Conflicts of Interest
Authors Zhen Zhao and Guangxiong Qin were employed by the company Qinghai 906 Engineering Survey and Design Institute Co., Ltd. The remaining authors declare that the research was conducted in the absence of any commercial or financial relationships that could be construed as a potential conflict of interest.
References
- Condon, L.E.; Kollet, S.; Bierkens, M.F.P.; Fogg, G.E.; Maxwell, R.M.; Hill, M.C.; Fransen, H.H.; Verhoef, A.; Van Loon, A.F.; Sulis, M.; et al. Global Groundwater Modeling and Monitoring: Opportunities and Challenges. Water Resour. Res. 2021, 57, e2020WR029500. [Google Scholar] [CrossRef] [Scilit]
- Kløve, B.; Ala-Aho, P.; Bertrand, G.; Gurdak, J.J.; Kupfersberger, H.; Kværner, J.; Muotka, T.; Mykrä, H.; Preda, E.; Rossi, P.; et al. Climate Change Impacts on Groundwater and Dependent Ecosystems. J. Hydrol. 2014, 518, 250–266. [Google Scholar] [CrossRef] [Scilit]
- Rohde, M.M.; Stella, J.C.; Singer, M.B.; Roberts, D.A.; Caylor, K.K.; Albano, C.M. Establishing Ecological Thresholds and Targets for Groundwater Management. Nat. Water 2024, 2, 312–323. [Google Scholar] [CrossRef] [Scilit]
- Li, H.; Si, B.; Li, M. Rooting Depth Controls Potential Groundwater Recharge on Hillslopes. J. Hydrol. 2018, 564, 164–174. [Google Scholar] [CrossRef] [Scilit]
- Feng, H.B.; Duan, Y.; Zhou, J.; Su, D.; Li, R.; Xiong, R. Effects of Groundwater Level Decline on Soil-Vegetation System in Semi-arid Grassland Influenced by Coal Mining. Land Degrad. Dev. 2024, 35, 2297–2312. [Google Scholar] [CrossRef] [Scilit]
- Pettit, N.E.; Froend, R.H. How Important Is Groundwater Availability and Stream Perenniality to Riparian and Floodplain Tree Growth? Hydrol. Process. 2018, 32, 1502–1514. [Google Scholar]
- Dong, S.G.; Liu, B.W.; Ma, M.Y.; Xia, M.H.; Wang, C. Effects of Groundwater Level Decline to Soil and Vegetation in Arid Grassland: A Case Study of Hulunbuir Open Pit Coal Mine. Environ. Geochem. Health 2023, 45, 1793–1806. [Google Scholar] [CrossRef] [Scilit]
- Pierret, A.; Lacombe, G. Hydrologic Regulation of Plant Rooting Depth: Breakthrough or Observational Conundrum? Proc. Natl. Acad. Sci. USA 2018, 115, E2669–E2670. [Google Scholar] [CrossRef] [Scilit]
- Su, Y.H.; Feng, Q.; Zhu, G.F.; Wang, Y.Q.; Zhang, Q. A New Method of Estimating Groundwater Evapotranspiration at Sub-Daily Scale Using Water Table Fluctuations. Water 2022, 14, 876. [Google Scholar] [CrossRef] [Scilit]
- Wang, T.Y.; Wang, P.; Wu, Z.N.; Yu, J.J.; Pozdniakov, S.P.; Guan, X.; Wang, H.; Xu, H.S.; Yan, D.H. Modeling Revealed the Effect of Root Dynamics on the Water Adaptability of Phreatophytes. Agric. For. Meteorol. 2022, 320, 108959. [Google Scholar] [CrossRef] [Scilit]
- Feng, Y.; Sun, T.; Zhu, M.S.; Qi, M.; Yang, W.; Shao, D.D. Salt Marsh Vegetation Distribution Patterns along Groundwater Table and Salinity Gradients in Yellow River Estuary under the Influence of Land Reclamation. Ecol. Indic. 2018, 92, 82–90. [Google Scholar] [CrossRef] [Scilit]
- Qi, Z.W.; Xiao, C.L.; Wang, G.; Liang, X.J. Study on Ecological Threshold of Groundwater in Typical Salinization Area of Qian’an County. Water 2021, 13, 856. [Google Scholar] [CrossRef] [Scilit]
- Kanwar, N.; Kuniyal, J.C.; Rautela, K.S.; Singh, L.; Pandey, D.C. Longitudinal Assessment of Extreme Climate Events in Kinnaur district, Himachal Pradesh, North-Western Himalaya, India. Environ. Monit. Assess. 2024, 196, 557. [Google Scholar] [CrossRef] [Scilit] [PubMed]
- Rautela, K.S.; Kuniyal, J.C.; Goyal, M.K.; Kanwar, N.; Bhoj, A.S. Assessment and Modelling of Hydro-sedimentological Flows of the Eastern River Dhauliganga, North-Western Himalaya, India. Nat. Hazards 2024, 120, 5385–5409. [Google Scholar] [CrossRef] [Scilit]
- Jin, X.; Jin, Y.X.; Mao, X.F. Ecological Risk Assessment of Cities on the Tibetan Plateau Based on Land Use/Land Cover Changes—Case Study of Delingha City. Ecol. Indic. 2019, 101, 185–191. [Google Scholar] [CrossRef] [Scilit]
- Wang, M.R.; Yao, J.Q.; Chang, H.Y.; Liu, R.; Xu, N.; Liu, Z.H.; Gong, H.Y.; Zheng, H.L.; Wang, J.K.; Guo, X.E.; et al. Underground Well Water Level Observation Grid Dataset from 2005 to 2022. Sci. Data 2025, 12, 728. [Google Scholar] [CrossRef] [Scilit]
- Cao, X.H.; Zhao, Z.; Zheng, Y.J.; Su, C.; Lei, Q.L.; Li, W.P.; Li, C.Y. Climate Change Threatens Water Resources Over the Qinghai-Tibetan Plateau. Sci. Rep. 2025, 15, 21996. [Google Scholar] [CrossRef] [Scilit]
- Khan, N.M.; Sato, Y. Monitoring Hydro-salinity Status and Its Impact in Irrigated Semi-Arid Areas Using IRS-1B LISS-II Data. Asian J. Geoinform. 2001, 1, 63–73. [Google Scholar]
- Abdelgadir, A.; Rubab, A. Mapping Soil Salinity in Arid and Semi-Arid Regions Using Landsat 8 OLI satellite Data. Remote Sens. Appl. Soc. Environ. 2019, 13, 415–425. [Google Scholar]
- Zhao, Z.; Cao, X.H.; Qin, G.X.; Zheng, Y.J.; Song, S.; Li, W.P. Coupled SWAT–MODFLOW Model for the Interaction Between Groundwater and Surface Water in an Alpine Inland River Basin. Water 2026, 18, 85. [Google Scholar] [CrossRef] [Scilit]
- Zhao, Z.; Chen, H.J.; Duan, L.C. Disaster Characteristics and Influencing Factors of Groundwater Level Rise in Front Edge of the Bayin River Alluvial Fan. Water Resour. Prot. 2023, 39, 142–169. [Google Scholar]
- Wang, W.H.; Chen, Y.N.; Wang, W.R.; Zhu, C.G.; Chen, Y.P.; Liu, X.G.; Zhang, T.J. Water Quality and Interaction Between Groundwater and Surface Water Impacted by Agricultural Activities in an Oasis-Desert Region. J. Hydrol. 2023, 617, 128937. [Google Scholar] [CrossRef] [Scilit]
- Yang, Y.; Li, Z.; Wang, L. Climate Change Impacts on Runoff in the Qaidam Basin, Northwest China: A Multi-Model Approach. J. Hydrol. 2021, 598, 126289. [Google Scholar]
- Wang, Y.J.; Qin, D.H. Influence of Climate Change and Human Activity on Water Resources in Arid Region of Northwest China: An Overview. Adv. Clim. Change Res. 2017, 8, 268–278. [Google Scholar] [CrossRef] [Scilit]
- Zhao, W.; Lin, Y.Z.; Zhou, P.P.; Wang, G.C.; Dang, X.Y.; Gu, X.F. Characteristics of Groundwater in Northeast Qinghai-Tibet Plateau and Its Response to Climate Change and Human Activities: A Case Study of Delingha, Qaidam Basin. China Geol. 2021, 4, 377–388. [Google Scholar] [CrossRef] [Scilit]
- Song, D.Y.; Pei, X.L.; Mao, L.; Wang, J.Y.L.; Tian, Y.; An, X.Y.; An, H.Y. Study on the Spatial-Temporal Variation of Groundwater Depth and Its Impact on Vegetation Coverage in Ejina Oasis. Forests 2024, 15, 2034. [Google Scholar] [CrossRef] [Scilit]
- Zhu, L.; Gong, H.L.; Dai, Z.X.; Xu, T.B.; Su, X.S. An Integrated Assessment of the Impact of Precipitation and Groundwater on Vegetation Growth in Arid and Semiarid Areas. Environ. Earth Sci. 2015, 74, 5009–5021. [Google Scholar] [CrossRef] [Scilit]
- Song, G.; Huang, J.T.; Ning, B.H.; Wang, J.W.; Zeng, L. Effects of Groundwater Level on Vegetation in the Arid Area of Western China. China Geol. 2021, 4, 527–535. [Google Scholar] [CrossRef] [Scilit]
- Schot, P.; Winter, T. Groundwater-Surface Water Interactions in Wetlands for Integrated Water Resources Management. J. Hydrol. 2006, 320, 261–263. [Google Scholar] [CrossRef] [Scilit]
- Singh, A. Soil Salinization Management for Sustainable Development: A Review. J. Environ. Manag. 2021, 277, 111383. [Google Scholar] [CrossRef] [Scilit]
- Liang, W.J.; Ma, X.L.; Wan, P.; Liu, L.Y. Plant Salt-Tolerance Mechanism: A Review. Biochem. Biophys. Res. Commun. 2018, 495, 286–291. [Google Scholar] [CrossRef] [Scilit]
- Cao, X.H.; Zheng, Y.J.; Lei, Q.L.; Li, W.P.; Song, S.; Wang, C.C.; Liu, Y.; Khan, K. Increasing Actual Evapotranspiration on the Loess Plateau of China: An Insight from Anthropologic Activities and Climate Change. Ecol. Indic. 2023, 157, 111235. [Google Scholar] [CrossRef] [Scilit]
- Hu, S.; Mo, X.G. Diversified Evapotranspiration Responses to Climatic Change and Vegetation Greening in Eight Global Great River Basins. J. Hydrol. 2022, 613, 128411. [Google Scholar] [CrossRef] [Scilit]
- Yang, L.S.; Feng, Q.; Zhu, M.; Wang, L.M.; Alizadeh, M.R.; Adamowski, J.F.; Wen, X.H.; Yin, Z.L. Variation in Actual Evapotranspiration and Its Ties to Climate Change and Vegetation Dynamics in Northwest China. J. Hydrol. 2022, 607, 127533. [Google Scholar] [CrossRef] [Scilit]
- Zhao, Y.; Zhang, M.L.; Liu, Z.Q.; Ma, J.B.; Yang, F.; Guo, H.M.; Fu, Q. How Human Activities Affect Groundwater Storage. Research 2024, 29, 0369. [Google Scholar] [CrossRef] [Scilit]
- Qin, R.J.; Song, Q.Y.; Hao, Y.H.; Wu, G.H. Groundwater Level Declines in Tianjin, North China: Climatic Variations and Human Activities. Environ. Dev. Sustain. 2023, 25, 1899–1913. [Google Scholar] [CrossRef] [Scilit]
- Dai, F.C.; Guo, Q.H. Groundwater Response of Loess Tableland in Northwest China under Irrigation Conditions. Water 2020, 12, 2546. [Google Scholar] [CrossRef] [Scilit]
- Guo, W.X.; Wang, G.Z.; Hong, F.T.; Huang, L.T.; Bai, X.Y.; Wang, B.; Li, Y.H.; Wang, H.X. Evaluation of River Ecological Flow Based on Baseflow Separation in Xiangjiang River, China. J. Water Clim. Change 2025, 16, 1529–1550. [Google Scholar] [CrossRef] [Scilit]
- Li, M.Y.; Li, C.Z.; Dong, F.; Jiang, P.; Li, Y.Q. Groundwater Level Thresholds for Maintaining Groundwater-Dependent Ecosystems in Northwest China: Current Developments and Future Challenges. J. Groundw. Sci. Eng. 2024, 12, 453–462. [Google Scholar] [CrossRef] [Scilit]

Disclaimer/Publisher’s Note: The statements, opinions and data contained in all publications are solely those of the individual author(s) and contributor(s) and not of MDPI and/or the editor(s). MDPI and/or the editor(s) disclaim responsibility for any injury to people or property resulting from any ideas, methods, instructions or products referred to in the content. |
© 2026 by the authors. Licensee MDPI, Basel, Switzerland. This article is an open access article distributed under the terms and conditions of the Creative Commons Attribution (CC BY) license.