


Abstract
Selecting an appropriate demand response (DR) strategy for individual loads requires balancing network operating constraints, customer flexibility, and economic cost. This combinatorial decision problem becomes computationally expensive when it must be solved online for every operating condition. This paper proposes an optimization-labelled machine learning framework in which a constraint-aware Genetic Algorithm first solves the problem offline for a large set of simulated hourly operating scenarios on the IEEE 69-bus, 12.66 kV medium-voltage radial distribution test system. A Random Forest classifier is then trained to reproduce the resulting decisions almost instantaneously. In addition to standard electrical, network, economic, and customer-related descriptors, the framework introduces a chromatic feature-encoding scheme that maps each load’s active power, reactive power, and voltage stress onto Hue–Lightness–Saturation–Chroma components, analogous to combining channels in a colour image. This scheme provides the classifier with a compact, alternative representation of the load’s operating state, and a dedicated ablation study examines whether it adds predictive value beyond the raw electrical variables. The framework is validated through cross-validation, temporal (leave-future-days-out) testing, SHAP-based explainability, and a comparison against weighted-sum (PSO and MILP) and Pareto-based (NSGA-II and MOPSO) alternative optimizers. Its technical, economic, environmental, and illustrative reliability impacts are assessed after the decisions of the trained model are re-simulated on the network. The trained surrogate reproduces the optimizer’s decisions with a macro-F1 of about 0.50 while running roughly three orders of magnitude faster. The chromatic features yield a small improvement over the raw electrical feature set alone; however, the statistical significance of this improvement does not persist after correcting for the non-independence of repeated cross-validation folds and for testing multiple feature subsets against the same baseline. Overall, the results suggest that optimization-labelled surrogate learning may offer a practical route toward near-real-time, constraint-aware demand response decision support in medium-voltage distribution networks equipped with adequate metering infrastructure.
1. Introduction
The rapid development of the modern electricity grid has driven a transition from conventional passive distribution networks to active, highly interactive smart grids. The growing deployment of distributed energy resources, electric vehicles, demand response loads, and smart metering technology has introduced challenges related to demand fluctuations, network congestion, voltage control, and overall system reliability. Consequently, distribution system operators are seeking flexible and cost-effective means of maintaining network stability without relying exclusively on costly infrastructure upgrades and additional generation. One such means is demand response (DR), which allows end users to interact with the system by adjusting their own electricity consumption patterns [1,2].
Demand response programs offer diverse benefits, including reductions in peak demand, losses, and congestion, greater integration of renewable energy, and improved system efficiency. Depending on the customer type and the utility’s objectives, different forms of DR can be implemented, such as direct load control, time-of-use rates, critical peak pricing, load shifting, and peak clipping. Selecting the appropriate approach is a complex decision problem, since it must account for network constraints, customer flexibility, economics, service criticality, and the varying operating conditions of the distribution network [3].
The selection of suitable DR mechanisms has therefore received considerable attention from both researchers and industry. Conventional approaches rely on optimization algorithms, such as mixed-integer programming, dynamic programming, evolutionary algorithms, and swarm intelligence. These approaches can accommodate many technical and economic aspects and can account for network operating constraints when solving the optimization problem. However, the computational complexity increases with the number of controlled loads and the length of the problem horizon. It increases further when nonlinear AC power flow calculations and the behavioural characteristics of individual consumers are incorporated [4,5,6].
To overcome these limitations, interest has recently grown in combining machine learning with optimization in power system applications. Rather than replacing optimization entirely, several studies have adopted learning-to-optimize approaches, in which an optimization technique first generates high-quality decisions offline, and a machine learning model then learns from the resulting policy. This strategy has shown promise in applications such as optimal power flow, network reconfiguration, renewable energy scheduling, and energy management systems. Because the optimization knowledge is transferred into the machine learning model, near-instantaneous decisions become possible during online operation. However, relatively little work has addressed optimization-based machine learning for load-level DR strategy selection in distribution networks [7,8,9,10,11].
One of the difficulties in developing effective machine learning models for DR is the characterization of the system’s operating state. Most existing studies rely on raw electrical variables, such as active and reactive power, current and voltage magnitudes, and power factor, and occasionally add topology-based and customer-based features. Although these features help to characterize the system, they may not always expose the relationships that support the learning process. As a result, feature engineering techniques that transform electrical signals into alternative representations have gained popularity in power system analytics. However, while colour space transformations are widely used in image processing and visualization, their application to DR in power systems has received limited attention [12,13,14].
To address this gap, the present study proposes a chromatic feature augmentation framework in which electrical attributes are encoded using the Hue, Lightness, Saturation, and Chroma attributes of the HLS colour model. In contrast to traditional electrical attributes, the chromatic attributes are intended to capture the interplay between active power, reactive power, and voltage stress within a single feature space. The framework further extends this idea through dynamic chromatic attributes that capture the evolution of these characteristics over successive operating intervals. Rather than assuming that such transformations improve predictive performance, the present study examines their contribution through explainability analysis and ablation [15,16,17].
Another important issue in current DR research is how competing objectives are handled. Utilities seek to minimize losses and peak demand, customers seek to minimize inconvenience, and network operators seek to maintain voltage quality and feeder security. These objectives conflict with one another, so DR strategy selection is inherently a multi-objective problem. Nevertheless, many applications still use a weighted-sum approach that aggregates the objectives into a single fitness function, which may unintentionally bias the solutions toward the extremes. Pareto-based optimization approaches, such as NSGA-II and MOPSO, provide an alternative [18,19,20].
Considering the foregoing, this paper develops a machine learning-based approach to DR strategy selection that incorporates chromatic feature engineering within an optimization-labelling process. The framework brings together AC power flow, constrained optimization, machine learning-based policy approximation, explainable artificial intelligence, temporal validation, and multi-objective benchmarking. The aim is not only to assess the predictive accuracy of the resulting machine learning surrogate model but also to evaluate the practical contribution of chromatic feature engineering and to compare the behaviour of weighted-sum and true Pareto-based optimization approaches [10,21,22,23].
To this end, the framework comprises an optimization-based decision generator, a machine learning policy approximator, explainable artificial intelligence, and benchmarking in a DR setting. In the first stage, decision labels are generated by a constraint-aware optimization algorithm that accounts for network operating limits, customer flexibility, service criticality, and economic factors. In the second stage, the outputs of this algorithm are used to train a machine learning model that replicates them at a considerably lower computational cost. This integration of optimization and machine learning is intended to address the main computational challenge in the DR management of distribution systems [24].
The key contributions of this work are as follows:
- A chromatic feature augmentation technique that converts electrical operating states into static and dynamic chromatic features and quantifies their influence through explainability analysis and ablation tests [25].
- A constraint-aware, optimization-based labelling methodology that integrates network feasibility constraints through a dedicated repair operator and generates DR strategy labels under realistic AC power flow constraints [26].
- An optimization-labelled machine learning surrogate model that can emulate the computationally expensive DR optimization process, substantially reducing execution time while retaining useful predictive accuracy [27].
- A comparison of weighted-sum and true Pareto-based optimization methods, examining their influence on strategy diversity and on the composition of the DR portfolio [28].
- A validation procedure comprising cross-validation, out-of-sample testing, adjacency-based evaluation, and explainable AI assessment, together with technical, economic, environmental, and reliability assessment [29].
The remainder of this paper is organized as follows. Section 2 reviews the related literature on DR optimization, machine learning-based decision support, explainable AI, and feature engineering in power systems. Section 3 describes the proposed methodology, including scenario generation, chromatic feature generation, optimization-based labelling, and the development of the machine learning models. Section 4 presents and discusses the experimental results. Section 5 interprets the results, and Section 6 outlines the limitations of the present study.
2. Related Work
Extensive research has been devoted to developing and analysing DR programs as an effective means of improving the operational efficiency of modern power networks while reducing peak loads, operating costs, and transmission congestion. In the early stages, most studies focused on price-based and incentive-based DR, examining how consumer behaviour could be influenced through different electricity tariffs, load control measures, and market participation schemes. As DR programs matured, greater emphasis was placed on distribution-level applications, where customer heterogeneity, feeder limits, and operating conditions are critical to the effectiveness of control [1].
Several mathematical optimization techniques have been used to address the optimal allocation of DR actions. Mathematical programming techniques, such as linear programming, mixed-integer linear programming (MILP), mixed-integer nonlinear programming (MINLP), and dynamic programming, have been widely used for scheduling and resource allocation under different operating conditions. Although these techniques yield mathematically rigorous solutions, their implementation often becomes computationally demanding when many controlled loads, extensive network configurations, and nonlinear AC power flow constraints must be handled simultaneously. Consequently, many researchers have turned to metaheuristic techniques because of their greater flexibility in handling complex DR problems [4,30].
2.1. Metaheuristic Optimization for Demand Response Strategy Allocation
Genetic Algorithms (GA) and Particle Swarm Optimization (PSO) are among the most popular metaheuristic methods for DR and energy management optimization. Their popularity stems from their ability to handle nonlinear objectives, mixed-variable decision spaces, and complicated operating constraints without requiring gradient information or convexity. GA-based techniques have been applied to DR scheduling, residential energy management, coordination of distributed energy resources, and peak demand reduction, where they have shown potential for global search. Likewise, PSO-based methods have been successfully applied in power system optimization owing to their simplicity and fast convergence [5,6].
Despite their widespread use, conventional single-objective metaheuristics often require several competing objectives to be combined into a weighted-sum fitness function. Although such aggregation simplifies the optimization task, it obscures the inherent trade-offs among technical, economic, and consumer-oriented objectives. To address this limitation, multi-objective evolutionary algorithms that provide solution diversity and Pareto-optimal fronts have been developed. Among the most popular are the Non-Dominated Sorting Genetic Algorithm II (NSGA-II) and Multi-Objective Particle Swarm Optimization (MOPSO), which have been applied effectively to energy management, distributed generation, network reconfiguration, and smart grid problems. Such algorithms allow a range of trade-offs to be explored instead of a single solution predetermined by the objective weights. However, few studies have examined how the choice of optimization paradigm affects the distribution of DR policies among heterogeneous customer groups [18,19,20,31].
2.2. Machine Learning and Optimization-Based Surrogate Models
In parallel with these advances in optimization, machine learning algorithms have found numerous applications in power system research. The algorithms used include decision trees, Random Forest, Support Vector Machines, Gradient Boosting machines, and neural networks, and they address applications such as load prediction, fault detection, voltage stability analysis, state estimation, and energy management decisions [7,32].
A recent trend in the literature is the growing interest in surrogate learning methods that combine optimization and machine learning. In this approach, optimization algorithms are run offline to find high-quality solutions across a wide range of operating conditions, and machine learning algorithms are trained offline to imitate the resulting policy. Such frameworks have been studied for optimal power flow, distribution system reconfiguration, unit commitment, renewable energy production scheduling, and energy management. Their main benefit is that the computational cost of optimization is shifted from the online to the offline stage, enabling real-time decisions without repeatedly solving expensive optimization problems. Nevertheless, optimization-based machine learning for load-level DR strategy selection remains insufficiently addressed, particularly with regard to AC network constraints, consumer heterogeneity, model explainability, and temporal features [8,10]. Related surrogate-style approaches have also been explored for other flexible-load control problems. For instance, Shang et al. combine distributed edge computing with an attention-based LSTM to dispatch vehicle-to-grid (V2G) charging and discharging in real time [33]. That work targets continuous power dispatch control specifically for electric vehicle (EV) charging and learns directly from operating data rather than from the labels of an explicit constraint-aware optimizer. It does not address the discrete strategy-selection problem, the network-wide AC constraints, or the heterogeneous customer classes considered in the present framework, which include EV-charger loads as one of five customer types. Nonetheless, it illustrates how attention-based sequence models handle temporal charging and discharging patterns and could inform future extensions of the temporal (chromatic) feature set used here.
2.3. Explainable Artificial Intelligence in Power System Applications
As machine learning algorithms are increasingly used in critical power system applications, their interpretability and transparency have become considerable concerns. Although complex predictive models can achieve high accuracy, utilities and system operators may not adopt them if the rationale behind their decisions is difficult to understand and verify. This has led to the development of Explainable Artificial Intelligence (XAI), which aims to provide human-understandable explanations of machine learning predictions and to improve the trustworthiness of data-driven decision support systems [22].
XAI has already been applied in power system areas, such as fault detection, load forecasting, stability analysis, renewable energy forecasting, and intelligent control. Among the available explainability methods, SHAP (SHapley Additive exPlanations) has received particular attention because it provides both global and local explanations and rests on a strong theoretical foundation in cooperative game theory. Recent studies have shown that SHAP can reveal the variables driving model predictions, hidden correlations among features, and operational insights beyond conventional performance metrics. Despite these benefits, explainability has received insufficient attention in optimization-based DR applications, where the relationship between the optimization objectives and the machine learning predictions needs to be explained [22,34,35].
2.4. Feature Engineering and Representation Learning for Power System Analytics
Feature engineering is important for the performance of machine learning models, especially in engineering applications where simple measurements cannot reveal the underlying structure of the problem. For instance, power system analytics employs a variety of features, including active and reactive power, voltage magnitude, power factor, current loading, weather factors, temporal indicators, and network topology descriptors. Several researchers have noted that appropriate feature transformation can improve classification and prediction performance by increasing the separability of operating regimes and reducing the complexity of decision boundaries [12,25].
More recently, graph-based representations, embeddings, temporal representations, and feature generation approaches that combine them have also been examined for power system analytics. Nonetheless, colour space-based representations remain under-explored, despite their numerous successes in image analysis, computer vision, and pattern recognition. The RGB, HSL, HSV, and HLS colour spaces were specifically developed to transform multi-dimensional data into representations that highlight structural patterns and relationships. Although these transformations are widely used in image processing and visual analytics, few studies have examined their potential usefulness as engineered features for machine learning-based decision-making in electrical power systems. Therefore, a gap remains in the research on the utility of colour space-based representations for power system learning and on the circumstances under which this utility becomes apparent [13,14,15,25].
2.5. Research Gap and Motivation
The above survey points to several findings. First, despite the well-developed state of DR optimization, most related studies concentrate on optimization quality or computational efficiency rather than on integrating optimization and learning within a joint decision-making framework. Second, although surrogate learning methods have become popular in power system optimization, their application to load-level decision-making for DR strategy selection under AC network constraints remains rare. Third, explainability has become an acknowledged requirement in operational contexts, yet it has rarely been treated as an integral part of optimization-labelled DR frameworks. Finally, feature engineering has been studied extensively, yet colour space-inspired representations and the value of their use have not been systematically evaluated through ablation studies in smart grid machine learning applications.
To address these gaps, this paper proposes a decision support framework for DR strategy selection that consists of: (i) AC power flow-based feature extraction, (ii) constraint-based optimization-derived labelling, (iii) supervised surrogate learning, (iv) SHAP-based explainability analysis, (v) temporal and statistical validation of performance and results, and (vi) a comparative study against other optimization techniques, including weighted-sum optimization and true Pareto-based optimization. The proposed work differs from previous studies in its explicit evaluation of the value of chromatic features within a statistical ablation framework [21,23,36].
The above literature review shows substantial progress in DR optimization, machine learning-based decision support, explainable artificial intelligence, and feature engineering. However, the current state of research remains fragmented. Most studies focus on either optimization quality or prediction performance, and few combine optimization-driven policy generation, machine learning-based surrogate modelling, explainable decision-making, and multi-objective benchmarking in a single methodology. Moreover, although alternative feature representations have become more popular in recent years, the application of colour space-based features to power system decision-making remains under-explored, and empirical evidence of their utility is scarce [21,36].
Motivated by these issues, the proposed methodology combines AC power flow analysis, constraint-aware optimization, chromatic feature augmentation, optimization-labelled machine learning, explainable artificial intelligence, and multi-objective benchmarking for DR strategy selection. The study is deliberately scoped to medium-voltage (12.66 kV) radial distribution networks, as represented by the IEEE 69-bus test system; low-voltage and high-voltage networks raise different switching-granularity and metering considerations that are outside the present scope. Unlike previous work that focuses mainly on accuracy, this study additionally addresses three research questions: (i) Does chromatic feature augmentation add predictive value to the raw electrical variables? (ii) Can optimization-derived policies be replicated through surrogate learning in an operationally efficient manner? (iii) How do different optimization approaches (weighted-sum and Pareto-based) affect the DR strategy portfolio? The methodology used to address these questions is described in the following section.
3. Methodology
3.1. Test System and Data Preparation
The performance of the proposed methodological framework was tested on the well-known benchmark IEEE 69-bus radial distribution system, one of the most widely used systems in distribution network research. It comprises 69 buses, 68 distribution lines, and 48 load buses operating at a base voltage of 12.7 kV and a base apparent power of 10 MVA. The network model was reproduced in the pandapower software environment (version 3.5.6) using the original branch impedance and load data of the Baran and Wu feeder. An AC power flow problem was solved for each case to obtain realistic values of voltage magnitudes, line loading, and network losses.
To generate a sufficient number of diverse operating states, a representative one-week dataset was created, comprising seven days with an hourly operating state of the system for each day (thus 168 snapshots). In each snapshot, the active and reactive power consumption of every load was varied according to a customer-specific consumption profile. Small stochastic variations were applied using Gaussian perturbations to simulate the natural variability of demand and to avoid overfitting of the machine learning model to a perfectly repeating pattern. In total, 8064 load-level observations (168 snapshots × 48 loads) were obtained for subsequent feature extraction, optimization-based labelling, and machine learning modelling.
3.2. Customer Classification and Demand Characterization
Because the IEEE 69-bus test feeder does not contain any information on customer type, an illustrative customer classification approach was applied to model the heterogeneity of DR program participants. Five customer groups were considered (Residential, Commercial, Industrial, Hospital, and EV Charger), and each load was assigned to one of these customer types by a deterministic size-based heuristic based on the base active power demand of the load. Although this classification does not represent actual customer records, it allows the framework to model different customer demand characteristics. Because residential customers predominate, commercial, industrial, hospital, and electric vehicle charging customers were added to create a diverse customer set and to analyse DR decisions for customers with different priorities.
Two behavioural characteristics were introduced to represent differences in customer demand: the Flexibility Index (F) and the Value-of-Service (VoS). The Flexibility Index characterizes the willingness or ability of customers to respond to demand-side management programs by reducing load, whereas the Value-of-Service represents the perceived cost or inconvenience to a customer of supply interruption or load curtailment. For each variable, class ranges were defined such that flexible loads were characterized by high F and low VoS, and critical loads by very low F and high VoS. Random values were then sampled from the corresponding class range for each individual load.
3.3. Scenario Generation and Temporal Load Modelling
In contrast to random scaling of static demand snapshots, the proposed approach employs time-dependent scenario generation based on representative daily load shapes. These load shapes are specific to each customer type and describe its load during different hours of the day. In particular, residential loads peak in the evening, whereas commercial loads follow business operating hours. Industrial loads vary little over the day, and Hospital loads remain consistently high because healthcare facilities must operate continuously. Most electric vehicle charging occurs at night.
The active and reactive power loads for each hour of the simulation horizon were generated by multiplying the base load values by the corresponding hourly profile multiplier of each load. To avoid perfectly repetitive patterns in the generated scenarios, Gaussian noise was added independently for each hour and load. The resulting hourly demand vectors were then used for the AC power flow calculation, optimization label construction, and machine learning dataset generation. This procedure produces a chronological sequence of operating states and captures dynamics that static demand models cannot represent.
3.4. Feature Extraction
For each hourly operating scenario, an AC power flow analysis was conducted to derive the electrical condition of the distribution network. A set of features was then constructed from electrical, network, economic, temporal, and customer information. The electrical features include active power demand (P), reactive power demand (Q), bus voltage magnitude (V), voltage angle, power factor, and a current loading proxy computed from apparent power and voltage magnitude. These features describe the instantaneous operating condition of each load and serve as the basis for both optimization and machine learning.
The network and context features were used to encode the network topology and other operating conditions. The network features include the electrical distance from the substation and the feeder section loading level for each load. The economic and temporal features include time-of-use (ToU) pricing, together with sine and cosine encodings of the hour of the day. Finally, customer class indicators were added through one-hot encoding, together with the Flexibility Index and Value-of-Service parameters. Thus, the feature space reflects not only the instantaneous electrical condition of a load but also the network topology and customer behaviour associated with it.
3.5. Chromatic Feature Encoding
To provide an alternative representation of the operating state of a load, the framework uses a chromatic feature encoding approach inspired by the Hue–Lightness–Saturation (HLS) colour model. In this approach, the active power, reactive power, and voltage stress are encoded as three pseudo-chromatic components, analogous to the red, green, and blue components of a conventional colour space. The voltage stress component is derived from the normalized voltage deviation (1 V), such that a more stressed state corresponds to a higher colour intensity. The encoded colours are then converted into four characteristics: Hue, Lightness, Saturation, and Chroma.
In addition to the static chromatic features described above, dynamic chromatic features were introduced to capture the temporal structure of the generated hourly scenarios. Chromatic Entropy quantifies the diversity of the chromatic states of all loads in a given hour using Shannon entropy. Chromatic Distance is the distance travelled by a load in chromatic space between two consecutive hours, and Chromatic Angle Velocity is the rate of change in the hue component of a load. Finally, the Chromatic Stability Index is based on the inverse of the rolling standard deviation of the hue component. Together, these dynamic chromatic features allow the machine learning model to consider both the current operating state and the recent temporal evolution of a load when selecting the most appropriate DR strategy. Formally, for each hourly snapshot, the three pseudo-chromatic channels are R = norm(P), G = norm(Q), and B = norm(1 − V) (min-max normalized across the loads active that hour), where norm(x) = (x − min(x))/(max(x) − min(x)). Writing M = max(R,G,B) and m = min(R,G,B): Chroma = M − m; Lightness L = (M + m)/2; Saturation S = 0 if M = m, else (M − m)/(M + m) for L ≤ 0.5 and (M − m)/(2 − M − m) for L > 0.5; and Hue is obtained from the standard piecewise RGB-to-Hue formula (60[(G − B)/Chroma] mod 360 when R is the largest channel, with the analogous 120°- and 240°-offset expressions when G or B is largest), so Hue is a circular variable in [0°, 360°). The four dynamic features are then computed per load across the hourly sequence. Chromatic Entropy is the system-wide Shannon entropy (in bits, 12 bins over [0°,360°)) of that hour’s Hue distribution across all loads, broadcast as the same value to every load. Chromatic Distance is the Euclidean distance √[(Ht/360 − Ht−1/360)2 + (Lt − Lt−1)2 + (St − St−1)2] between one hour’s (Hue, Lightness, Saturation) and the previous hour’s, with Hue rescaled to [0, 1] so that the three terms are commensurable. Chromatic Angle Velocity is Ht − Ht−1 wrapped to [−180°, 180°] to respect the circularity of Hue. Chromatic Stability Index is 1/(1 + σ), where σ is the standard deviation of Hue over a trailing window of up to 3 h (the current hour plus the two preceding it). All three dynamic difference/velocity features are set to zero (and the Stability Index to 1) at the first hour of the series, where no preceding hour exists.
3.6. Optimization-Based Demand Response Strategy Labelling
The proposed machine learning scheme is based on supervised learning and therefore requires labelled data samples indicating the desired DR strategy for each load under the given operating conditions. Instead of manual labelling or heuristics, the labels were obtained through an optimization-based approach. The Genetic Algorithm (GA) was used to search for the strategy assignment with the lowest fitness value among four DR strategies, namely Direct Control, Time-of-Use Pricing, Load Shifting, and Peak Clipping, for each hourly scenario. Because a single GA run is a stochastic search and is not guaranteed to reach the global optimum, each hourly scenario was solved independently three times, and the per-load majority vote across the three runs was retained as the final label. This does not turn the GA into an exact solver, but it suppresses single-run noise that would otherwise be embedded in the training labels. A dedicated check of how much noise this majority vote suppresses was performed in response to peer review. The full week’s 168 h were run with the individual per-load solutions of the three runs retained (rather than only the final vote). On average, all three runs agreed for only 39.6 ± 5.2% of the 48 loads per hour, and the pairwise agreement between any two of the three runs averaged 59.7 ± 3.5%. Put differently, roughly 29 of the 48 loads per hour (about 60%) had at least one dissenting run. This disagreement never took the form of a genuine three-way split across the 168 h: whenever the three runs did not agree unanimously, exactly two of them agreed with each other, so the majority vote never had to break a tie arbitrarily. These results indicate that a single GA run is considerably noisier at the individual-load level than the final majority-voted label suggests, and that the majority-of-three procedure plays a substantial role in label stability. They also imply that the stability of the resulting labels against a different draw of three runs (or a different nruns) has not itself been established, which is noted as an additional limitation in Section 6. Each strategy has a predefined curtailment level, which makes the problem a discrete combinatorial optimization problem in which a strategy must be selected for each controllable load while accounting for network- and customer-oriented objectives. Specifically, each strategy s is modelled by a single curtailment-intensity parameter Is = 1 − rs, applied as a uniform fractional reduction in the affected load’s active (and, where relevant, reactive) power for the duration of the hourly scenario. The retained-load fractions rs are 0.50 (Direct Control), 0.60 (Peak Clipping), 0.75 (Load Shifting), and 0.95 (ToU Pricing), i.e., intensities of 0.50, 0.40, 0.25, and 0.05, respectively. This shared single-parameter representation is a simplification. Direct Control is modelled as an actual power cut, whereas Load Shifting (a temporal relocation of consumption) and ToU Pricing (a price-elasticity response) are physically different mechanisms that are approximated here by the same fractional-reduction formalism for tractability, rather than being represented with their own rebound or relocation dynamics.
The objective function was defined as a sum of several technical, economic, and customer-oriented criteria. It included normalized feeder losses, system peak demand, violations of voltage and thermal constraints, the economic cost of energy, and a customer inconvenience cost. The latter depended directly on the actual curtailed energy and was multiplied by the Flexibility Index and Value-of-Service factors of the load. This discouraged the most critical and inflexible loads from participating in aggressive curtailment while encouraging flexible loads to do so. Formally, the scalar fitness to be minimized was F = wloss·Lnorm + wpeak·Pnorm + wvpen·(voltage- and loading-violation penalty) + wecon·Cecon,norm + wcustomer·Ccust,norm, with the five weights set to 1.0, 1.0, 5.0, 1.0 and 3.0, respectively. The loss, peak, and economic terms are each normalized by their pre-strategy reference value, and the customer-inconvenience term is normalized by the maximum curtailment achievable under Direct Control, so that all five terms operate on a comparable [0, 1] scale. These weights were determined through iterative manual calibration against the resulting strategy distribution rather than through a formal multi-criteria weighting procedure. This scalarized formulation is itself contrasted with the Pareto-based NSGA-II/MOPSO alternative in Section 3.7 and Section 4.2. The optimization procedure thus generated the labels required for the subsequent supervised learning.
3.7. Constraint Handling and Baseline Optimization Methods
An important element in the design of the proposed labelling scheme is the use of a repair operator to handle constraint violations. Solutions produced by the Genetic Algorithm were not evaluated through penalty functions alone. Any solution that violated a network operating constraint was automatically subjected to a repair procedure, in which the curtailment values of loads in the highly stressed section of the feeder were increased step by step until the constraint(s) were satisfied or a given repair budget was exhausted. This approach is expected to improve the quality of the generated solutions and to reduce the likelihood of erroneous labels in the training dataset.
To evaluate the robustness of the strategy assignments produced by the optimization, a number of alternative optimizers were developed and applied to the problem. A Particle Swarm Optimization (PSO) algorithm was developed as a single-objective metaheuristic using the same fitness function as the GA. A simple economic mixed-integer linear programming relaxation was also developed as a benchmark. In addition, two multi-objective approaches, NSGA-II and Multi-Objective PSO (MOPSO), were developed with three objectives: network losses, system peak load, and economic-customer cost. Unlike the scalarized methods (GA and PSO), the Pareto-based approaches preserve trade-offs and allow a direct comparison of single- and multi-objective solutions. Because no single point on a Pareto front is simultaneously best in every objective, one representative solution had to be selected from each of the NSGA-II and MOPSO fronts for the comparison in Table 1. The standard compromise (“knee-point”) rule was used, which selects the front member closest, in Euclidean distance, to the ideal point in normalized objective space (equal weight on loss, peak, and economic-customer cost). This is one defensible compromise rule among several possible ones, and a utility adopting the Pareto-based approach in practice would still need to choose its own priority ordering among network capacity, voltage deviation, and loss objectives, or negotiate a different trade-off point on the same front.
Table 1.
DR strategy label distribution by method (evening-peak scenario, 48 loads; GA results cover the full week, n = 8064).
3.8. Machine Learning Model Development and Explainability
Using the optimization-based labelling approach described above, the resulting dataset was used to train a supervised machine learning model capable of approximating the behaviour of the optimizer. A Random Forest classifier was chosen as the main model because of its robustness, its ability to capture nonlinear feature interactions, its relatively low tendency to overfit, and its compatibility with both numerical and categorical data. The dataset was split into training and test subsets using stratified sampling to preserve the class proportions. In addition, class-balanced weighting was applied to reduce the influence of the imbalanced label distribution on model performance. The model was supplied with electrical, network, economic, chromatic, and customer-related features and produced one of the four DR strategies as its output.
To increase transparency and gain insight into the decision process of the model, an XAI approach was adopted in the proposed framework, and two techniques were applied. First, impurity-based feature importance was extracted directly from the Random Forest model to obtain a quick overview of the role of the features in the decision process. Second, SHAP analysis was applied to estimate the contribution of each feature to the model’s predictions.
3.9. Model Validation and Evaluation Framework
The predictive performance of the proposed classifier was assessed using several complementary criteria. Overall performance was evaluated using accuracy, precision, recall, and macro-averaged F1 score. Because the dataset contains imbalanced classes with unequal frequencies, particular attention was paid to the macro-F1 score, which treats all classes equally irrespective of their frequency. In addition to standard testing on a held-out dataset, the classifier was evaluated using five-fold cross-validation.
In addition to these standard metrics, an adjacency-aware criterion was used to reflect the ordinal nature of DR strategies. The strategies are ordered by curtailment intensity, from the least to the most aggressive load reduction (ToU Pricing < Load Shifting < Peak Clipping < Direct Control). From this perspective, assigning a load to the nearest neighbouring class is less critical than assigning it to a distant class. Accordingly, both exact accuracy and adjacent-or-exact classification accuracy were calculated. The latter is the percentage of predictions that are either exactly correct or fall in the neighbouring level of curtailment intensity.
3.10. Technical, Economic, Environmental, and Reliability Assessment
To evaluate the impact of the implemented framework, the predicted DR strategies were simulated on the IEEE 69-bus network, and a new AC power flow solution was obtained. Technical performance was analysed using system-level measures such as total feeder losses, minimum bus voltage magnitude, voltage deviation index (VDI), average line loading, and system peak demand. Together, these measures reflect efficiency, voltage performance, network congestion, and the capacity of the system to reduce peak load. Technical performance was assessed by comparing the system states before and after implementation of the predicted DR strategies.
In addition to technical performance, the economic and environmental impacts of the predicted strategies were estimated. Economic performance was estimated by calculating the curtailed energy, the cost savings from avoided energy purchases, the incentive payments to participating customers, and the corresponding utility benefit. Environmental performance was calculated from the carbon emission savings resulting from demand reduction, using an illustrative grid emission factor. Moreover, a reliability assessment module was developed to calculate indices such as SAIFI, SAIDI, ENS, and a proxy for LOLP. Because the IEEE 69-bus feeder does not provide reliability data, these calculations are based on hypothetical failure rate and repair time values and are therefore intended for comparative purposes only.
3.11. Ablation Analysis, Temporal Generalization, and Computational Assessment
To determine the value that the introduced chromatic encoding can add, experiments with multiple feature subsets were conducted. Specifically, repeated stratified cross-validation was performed with different configurations, starting from electrical features alone and adding network, static chromatic, and dynamic chromatic features step by step, and finally all features. Each feature set configuration was evaluated using the macro-F1 score. Statistical testing was also performed to determine whether the differences between configurations were statistically significant.
Two additional analyses were performed to examine the applicability of the proposed approach. First, a temporal generalization analysis was performed, in which the model was trained on the earlier days of the simulated week and tested on the later, unseen days, in order to obtain a more realistic estimate than a random data split would provide. Second, a computational efficiency analysis was conducted by comparing the time required for optimization-based strategy generation with the prediction time of the trained machine learning model. The purpose of this experiment was to assess whether the proposed approach is fast enough to support decisions in future DR applications without losing the behavioural properties of the optimization policy.
4. Results
The proposed approach was evaluated on the IEEE 69-bus distribution network over one week of operation, comprising 168 hourly scenarios and 8064 load-point measurements. The dataset was first labeled using the optimization process, and the machine learning surrogate was subsequently trained. The analysis addresses four main aspects: (i) the pattern and distribution of the optimization-generated demand response labels, (ii) the predictive performance of the machine learning surrogate, (iii) the role of the proposed chromatic feature representation, and (iv) the technical, economic, environmental, and computational consequences of the demand response actions.
The numerical results make it possible to examine not only the predictive potential of the proposed approach but also the behavior of different optimization approaches. For example, the comparison between weighted-sum and Pareto-based multi-objective optimization reveals clear differences in the distribution of demand response strategies. Furthermore, cross-validation, temporal validation, and model explainability analysis support an assessment of the predictive performance of the model and its reliability.
4.1. Customer Classification and Dataset Characteristics
The customer classification produced a heterogeneous population of 48 loads divided into five classes, as shown in Table 2. Residential customers formed the largest group, accounting for about two-thirds of the controllable loads in the feeder. The remaining loads were classified into the EV Charger, Commercial, Industrial, and Hospital categories using the method described in Section 3.2. This composition provides a diverse demand response environment that includes both highly flexible and highly critical customers.
Table 2.
Customer class distribution (48 loads, IEEE 69-bus).
The scenario generation process and optimization-based labeling yielded 8064 labeled load–hour observations. The label analysis shows that Direct Control was the most frequently assigned strategy (53.6%), followed by Time-of-Use Pricing (19.9%), Peak Clipping (17.8%), and Load Shifting (8.8%). This distribution suggests that the weighted objective function frequently favored aggressive load curtailment as a cost-effective solution, whereas the customer-inconvenience and network-performance terms prevented convergence to a single strategy class.
4.2. Comparison of Optimization-Based Strategy Assignment Methods
To examine the robustness of the demand response policies generated by the optimization algorithm, the results were compared with those of four alternative methods: continuous-relaxation PSO, economic MILP relaxation, NSGA-II, and MOPSO. The results are shown in Table 1. Although all methods aim to reduce demand and improve system performance, the resulting distributions of demand response strategies differ markedly. These differences illustrate the influence of the optimization formulation on demand response decision-making and offer insight into the characteristics of the different solution frameworks.
The economic MILP relaxation showed the most aggressive tendency toward load reduction, assigning Direct Control to 85.4% of the loads. This outcome was expected because the MILP formulation considers only economic and customer-related costs and excludes network performance aspects such as voltage regulation, feeder losses, and congestion. Consequently, the optimizer converges toward the strategy that yields the maximum instantaneous demand reduction. The weighted-sum Genetic Algorithm produced a more balanced solution, with only 53.6% of Direct Control assignments, owing to the network-related objectives and the penalty function reflecting customer inconvenience costs. The PSO baseline, whose formulation uses the same scalarization of the objectives as the Genetic Algorithm, also yields a different distribution, in which Peak Clipping prevails.
The multi-objective approaches behave differently. NSGA-II and MOPSO yield considerably more balanced distributions, with assignments spread more evenly across the four demand response actions. For NSGA-II, for example, Direct Control accounts for 33.3% of the assignments, and the other three actions share the remainder. Similarly, all four strategies appear within a narrow frequency range in the MOPSO distribution. This is consistent with theoretical expectations, since Pareto-based approaches preserve the diversity of trade-offs by retaining multiple competing objectives throughout the optimization process.
These differences may have practical implications. Utilities that rely solely on weighted-sum optimization could unintentionally apply overly aggressive demand response measures, since such measures usually yield the largest immediate reductions in peak demand and energy. In contrast, the Pareto-based approach explicitly exposes a range of trade-off solutions, which could support the design of demand response programs that are favorable to consumers while remaining efficient. Thus, from a policy-making viewpoint, the results indicate that the choice of optimization approach may influence both system efficiency and the diversity of measures applied to customers.
It should be emphasized that this comparison is not on a fully equal footing. The GA row in Table 1 reflects the full week (n = 8064 load-hours), whereas PSO, MILP, NSGA-II, and MOPSO were run only on the single evening-peak hour (n = 48 loads) reported in the same table, for computational reasons. The qualitative conclusion that Pareto-based methods spread assignments more evenly than scalarized ones is based on portfolio shares (percentages) rather than raw counts and is therefore expected to be less sensitive to sample size. Nevertheless, the two rows are not a like-for-like comparison in terms of sample size, and a full-week NSGA-II/MOPSO run is left for future work. The fronts of non-dominated solutions for the NSGA-II and MOPSO rows of Table 1 are shown in Figure 1 and Figure 2, respectively. Each solution represents a distinct trade-off that is not dominated by any other solution in terms of network loss, system peak, and combined economic and customer cost.
Figure 1.
NSGA-II Pareto fronts for the three objectives: power loss, peak demand, and economic plus customer cost. Blue dots represent non-dominated solutions, while the red dot indicates the selected knee solution.
Figure 2.
MOPSO Pareto fronts for the three objectives: power loss, peak demand, and economic plus customer cost. Orange dots represent non-dominated solutions, while the red dot indicates the selected knee solution.
4.3. Machine Learning Classification Performance
Subsequently, the dataset with optimization-generated labels was used to train a Random Forest classifier intended to mimic the behavior of the optimization engine while considerably reducing decision time. Evaluation on the test set yielded an overall classification accuracy of 62.9% and a macro-averaged F1-score of 0.501. To assess stability, five-fold cross-validation was performed, yielding a macro-F1-score of 0.498 ± 0.007. Since the test and cross-validation results are very similar, the model appears to perform consistently across data subsets, with no indication of overfitting.
A closer examination of the class-level performance reveals several notable features. The model performed best for the Time-of-Use Pricing (F1 = 0.82) and Direct Control (F1 = 0.73) strategies, which suggests that these strategies form relatively distinct regions in the feature space and can therefore be classified with comparatively high reliability. In contrast, Load Shifting and Peak Clipping showed low performance, with F1-scores of 0.23 for both. This suggests that the intermediate-intensity demand response actions arise under similar operating conditions and are therefore harder to separate, since they lie close to each other in the feature space. It should be noted that the present analysis quantifies these confusions only in label space (Section 4.3, Figure 3). It does not separately evaluate whether a Load Shifting/Peak Clipping misclassification translates into an actual voltage or loading constraint violation once the predicted strategy is applied. This operational-consequence analysis is left for future work and is noted as a limitation in Section 6.
Figure 3.
Confusion matrix; held-out test set.
Table 3 presents the complete per-class breakdown of these metrics, including precision, recall, F1-score, and support for each of the four strategies, as well as the overall accuracy and the macro and weighted averages used throughout this paper. To gain further insight, an adjacency-aware evaluation was also conducted. In this evaluation, the four demand response strategies were ordered by increasing level of curtailment, and a prediction was considered acceptable if it either matched the optimization-generated label exactly or differed from it by one strategy level. This ordering is not an arbitrary ranking of “similar-sounding” actions. It follows directly from the curtailment-intensity parameter Is defined in Section 3.6 (0.05 for TOU Pricing, 0.25 for Load Shifting, 0.40 for Peak Clipping, and 0.50 for Direct Control), so adjacent strategies are, by construction, those with the closest modeled intensity. As expected, this evaluation yielded a higher adjacent-or-exact accuracy of 87.7%, compared with the exact accuracy of 62.9%. This indicates that most prediction errors involve operationally similar strategies rather than strategies with very different intervention levels. From a practical standpoint, this is encouraging, since neighboring demand response strategies tend to produce similar technical and economic outcomes. It suggests that, although exact class prediction is difficult, the machine learning surrogate captures the structure of the optimization policy better than exact-match metrics alone indicate. Nevertheless, it should be reported alongside this adjacency result that the balanced accuracy, defined as the simple average of the four per-class recalls in Table 3, is 0.50, identical to the macro-averaged recall shown there, and that Load Shifting and Peak Clipping individually remain at F1 = 0.23. The adjacency-aware figure characterizes the structure of the errors and should not be interpreted as superseding these weaker class-level results. To quantify the sampling uncertainty of the class-level figures, a bootstrap of the held-out test set (2000 resamples) was applied to the exact Table 3 model. The 95% confidence intervals for F1 are 0.227 [0.157, 0.292] for Load Shifting and 0.229 [0.177, 0.279] for Peak Clipping, compared with 0.730 [0.706, 0.752] for Direct Control and 0.818 [0.783, 0.848] for TOU Pricing. For Load Shifting and Peak Clipping, respectively, recall is 0.211 [0.143, 0.276] and 0.199 [0.152, 0.246], and precision is 0.246 [0.168, 0.322] and 0.268 [0.210, 0.329]. The macro-F1 is 0.501 [0.475, 0.526], and the balanced accuracy is 0.500 [0.475, 0.524]. Because the upper bounds of the F1 intervals of the two lower-performing classes lie far below the lower bounds of those of the two higher-performing classes, the performance gap between the two groups of strategies is unlikely to be attributable to sampling variability.
Table 3.
Random Forest classification performance (held-out 20% test set, n = 1613).
The confusion matrix in Figure 3 is consistent with these observations. Misclassifications occurred mostly between Load Shifting and Peak Clipping and were comparatively infrequent for Time-of-Use Pricing and Direct Control. This behavior is consistent with the optimization landscape, in which neighboring strategies usually lead to similar objective-function values. Accordingly, the classification performance is better interpreted as that of an ordinal decision problem than as that of a conventional nominal multi-class classification.
4.4. Feature Importance and Model Explainability
To support the interpretation of the results and to identify the factors that drive strategy selection for individual loads, feature importance was analyzed using the impurity-based importance of the Random Forest model and the SHAP method. The results are presented in Table 4. In both analyses, Value-of-Service and Flexibility were ranked among the most important input variables. This result is physically plausible, since these variables contribute directly to the customer-inconvenience component of the optimization problem. Loads with high Value-of-Service and low Flexibility incur considerably higher customer costs when curtailed and are, therefore, key factors in determining the selected demand response strategy.
Table 4.
Top-10 feature importances (impurity-based) and mean |SHAP| values.
Among the electrical variables, reactive power demand, active power demand, and the current-loading index were the most important features for the model decision. These variables are directly related to feeder loading level, network losses, and voltage performance, which are explicitly included in the cost function. In addition, several chromatic features, namely Hue, Saturation, Lightness, and Chroma, were also among the highest-ranked predictors. Although these features are deterministic transformations of the corresponding electrical parameters, their high ranking indicates that the tree-based classifier makes use of the chromatic representation. However, the ablation study (Section 4.5) suggests that this representation adds little predictive value beyond the raw electrical features.
Impurity-based importances are shown in Figure 4 as a horizontal bar plot, whereas Figure 5 presents SHAP beeswarm plots, which, in addition to feature importance, show the direction and variability of each feature’s effect on individual predictions.
Figure 4.
Feature importance (impurity-based).
Figure 5.
SHAP summary plot.
Overall, the explainability results suggest that the machine learning model does not rely on obviously irrelevant associations but rather on features that are directly linked to the optimization framework. Customer-related variables are the most influential in the decision-making process, followed by electrical and loading-related features, which is consistent with the optimization objective used to generate the labels.
4.5. Ablation Study of Chromatic Feature Contributions
One of the main aims of this study was to determine whether the proposed chromatic representation provides predictive value beyond that of the conventional electrical features. To this end, an ablation study was performed using repeated stratified cross-validation across six feature-set configurations. In the baseline configuration, the model used only the raw electrical features. This feature set was then progressively extended with network features, static chromatic features, dynamic chromatic features, and finally all features.
The model trained on the raw electrical features achieved a macro-F1 of 0.485. Adding network features produced only a marginal improvement (0.486), and adding static chromatic features yielded 0.487. A larger improvement was obtained with the dynamic chromatic features, for which the macro-F1 increased to 0.489. Combining static and dynamic chromatic features increased the macro-F1 to 0.491 (significant at the 5% level in the uncorrected test). The configuration with all features performed best, with a macro-F1 of 0.494 and the lowest p-value among the configurations. A subsequent re-analysis re-ran the same ablation design with a fixed cross-validation object and exported the raw per-fold scores. Two corrections that a plain paired t-test across repeated cross-validation folds does not include were then applied: the corrected variance estimate of [37], which accounts for the overlapping training and test partitions of the folds, and a Holm–Bonferroni adjustment across the five comparisons against the same baseline. Under this corrected test, none of the five feature-subset comparisons remain significant at the 0.05 level (corrected p-values of 0.74, 0.66, 0.51, 0.37, and 0.21 for Cases B to F, respectively, all ≥1.0 after the Holm adjustment). This includes the full-feature-set case (F), for which the uncorrected test reports p = 0.002. The low p-value of the uncorrected test is best interpreted as an artifact of treating 25 non-independent repeated cross-validation folds as 25 independent samples, which understates the true sampling variance. The uncorrected values are retained in Table 5 for completeness; however, the corrected result should be used when interpreting the statistical significance of the chromatic features (see also Section 6). Table 5 lists all six ablation cases with their macro-F1 mean ± std, the difference relative to the raw-electrical baseline, and the paired t-test p-value. In the uncorrected test, the significance column shows a progression from non-significant results (Cases B–D individually) to significant results once the static and dynamic chromatic features are combined (Cases E–F). Figure 6 plots the six macro-F1 values from Table 5 as bars with error bars (±1 std across the 25 repeated folds), which makes the small but monotonically increasing trend from Case A to Case F visually apparent.
Table 5.
Ablation study: 5 × 5 repeated stratified CV macro-F1 by feature subset (p-values from the uncorrected paired t-test).
Figure 6.
Ablation study: Macro-F1 by feature subset.
Although the uncorrected test indicates statistically significant differences for Cases E and F, the magnitude of the improvement is small. Relative to the raw-electrical feature set, the full feature set increased the macro-F1 by 0.009. Accordingly, chromatic encoding should not be regarded as a means of introducing additional information into the learning process. Rather, chromatic information may be viewed as an alternative representation of the electrical data that tree-based learners may find easier to exploit. Chromatic features are therefore better regarded as a supplementary representation associated with a small improvement in predictive performance.
4.6. Temporal Generalization Performance
A potential drawback of supervised learning models trained on simulated data is that the reported performance may reflect unintended similarities between the training and test sets rather than genuine generalization ability. To address this issue, an additional temporal validation experiment was conducted, in which the model was trained using only the first four days of the generated week and tested on the following three unseen days. Unlike random-split validation, this scheme better mimics a realistic situation in which future operating conditions must be predicted from historical data.
The temporal validation achieved an accuracy of 65.0% and a macro-F1 of 0.493, whereas random-split validation yielded an accuracy of 62.9% and a macro-F1 of 0.501. These similar values suggest that the performance of the model did not degrade noticeably when evaluated on chronologically different data. Moreover, since the difference between the two validation results was small, it is plausible that the model did not rely on day-specific patterns in the simulated examples and instead captured more general relationships between network operating conditions, customer characteristics, and the strategy assignments obtained through optimization. This is consistent with, although it does not by itself prove, the model relying on generalizable operating-condition relationships rather than day-specific artifacts. Ruling out day-specific memorization more conclusively would require testing on scenarios drawn from genuinely different weeks or seasons, which the present single-week dataset (Section 6) does not provide. Table 6 places both evaluation protocols side by side; the similar accuracy and macro-F1 values in the two rows provide no indication of meaningful temporal overfitting.
Table 6.
Random split vs. temporal split (train days 1–4, test days 5–7) performance.
In addition, the temporal validation results suggest that the optimization-generated labels follow a reasonably stable policy over the operating horizon. Had the optimization procedure shifted markedly from day to day, some degradation would be expected in the temporal validation. As no such degradation was observed, the optimization procedure appears to generate fairly stable policies that can be learned by the machine learning framework. This provides further support for the view that the reported predictive performance is not attributable to a favorable train–test split.
4.7. Technical Impact of the Predicted Demand Response Strategy
The technical effectiveness of the machine learning surrogate as a generator of demand response actions was evaluated by applying the strategy portfolio predicted by the trained classifier to the IEEE 69-bus feeder under representative evening-peak conditions. The modified network was then re-evaluated using AC power flow. The results indicate improvements in the network performance indicators under the predicted portfolio.
Feeder losses decreased from 0.2250 MW to 0.1794 MW (a reduction of 20.3%), which is consistent with the demand response actions relieving load in heavily loaded areas of the feeder. At the same time, the minimum bus voltage rose from 0.9092 p.u. to 0.9203 p.u., and the voltage deviation index decreased by 26.1%.
Network congestion metrics also improved. The average line loading fell from 10.80% to 9.47%, and the total system demand decreased from 3.802 MW to 3.109 MW, corresponding to an 18.2% reduction in peak demand. The peak-reduction objective of the demand response program was therefore met for the evaluated hour. Taken together, the results indicate that the machine learning surrogate retained the essential characteristics of the optimization policy and generated demand response actions that yielded operational network benefits. These benefits were obtained without further optimization, which suggests the potential value of the surrogate for demand response decision-making. Table 7 summarizes the five technical indicators before and after the application of the predicted strategy. Figure 7 shows the voltage magnitude at each of the 69 buses before and after the predicted strategy is applied, indicating that the improvement is distributed across the feeder rather than confined to a single bus, while Figure 8 summarizes losses, peak demand, and minimum voltage as paired before/after bars.
Table 7.
Technical impact of the predicted DR strategy (evening peak hour).
Figure 7.
Bus voltage profile, before/after DR.
Figure 8.
Technical impact summary, before/after DR.
4.8. Economic and Environmental Impact Assessment
In addition to the technical gains, applying the predicted strategy portfolio yielded economic and environmental benefits under the assumed parameters. The portfolio resulted in energy savings of 693.22 kWh during the studied peak period. Under the time-of-use tariff structure, these savings correspond to an avoided electricity purchase cost of approximately $124.78. After subtracting the incentive payments to the participating loads ($28.14), the net utility benefit is estimated at $96.64. Under the assumed tariff and incentive parameters, the proposed demand response measures therefore appear economically viable after accounting for customer compensation. It should be emphasized that all technical, economic, and environmental figures reported in this subsection describe a single evaluated evening-peak hour, re-simulated once with the predicted portfolio applied; they do not represent a net daily or seasonal energy balance. In particular, Load Shifting and TOU Pricing are modeled here purely as an instantaneous fractional reduction within that hour (Section 3.6) and do not represent where the shifted consumption reappears later in the day. A full accounting of the net energy and cost impact of these two strategies would require tracking the rebound or relocated demand in subsequent hours, which is left for future multi-period analysis.
From an environmental perspective, the reduction in energy consumption translates into lower carbon emissions. Using the adopted grid emission factor, the carbon reduction is estimated at 346.61 kg of CO2. Although the absolute value depends on the carbon intensity of the regional generation mix, this estimate is consistent with the potential of well-managed demand response measures to contribute to emission-reduction targets, subject to the illustrative emission factor used. Table 8 summarizes the economic and environmental quantities discussed above.
Table 8.
Economic and environmental impact.
The economic and environmental outcomes of the combined optimization are consistent with the importance of including a customer-oriented component in the optimization procedure. The optimization objective balances utility benefit against customer inconvenience, which prevents the selection of solutions that are economically attractive solely because of high load reduction. The resulting demand response program may therefore be regarded as a compromise among the stakeholders involved.
4.9. Reliability Indicators
To provide a broader view of system performance, reliability indices were calculated after applying the portfolio of predicted demand response strategies. The resulting values were a SAIFI of 2.60 interruptions/customer-year, a SAIDI of 10.39 h/customer-year, an Energy Not Supplied (ENS) of 32.30 MWh/year, and an LOLP proxy of 0.0016. These values rely entirely on assumed (not measured) failure-rate, repair-time, and customer-equivalency parameters, since the IEEE 69-bus benchmark carries no reliability data of its own. They are therefore reported as an illustrative demonstration of the calculation rather than as an assessment of whether the reliability of this network is acceptable. Table 9 reports the four reliability indices computed from the assumed failure-rate and repair-time parameters.
Table 9.
Illustrative reliability indices.
4.10. Computational Efficiency and Practical Deployment Potential
One motivation for developing a machine learning surrogate is the computational burden of optimization-driven decision-making. The Genetic Algorithm used for label generation required approximately 102.7 s to generate strategies for each operating condition, including the repair operator and the voting procedure. In contrast, the trained Random Forest required 112.3 ms to generate decisions for the same operating condition, corresponding to a speedup of approximately 915×. Table 10 provides a runtime comparison between GA labeling and trained-model inference.
Table 10.
Runtime comparison, GA labeling vs. trained-model inference (single scenario). The runtimes were measured on a single machine (Windows 10, 8 logical CPUs, Intel64 Family 6 Model 126 Stepping 5, 7.7 GB RAM), with the GA labeling stage parallelized across 8 worker processes as noted in Section 3.6. The 112.3 ms figure for the trained Random Forest corresponds to single-threaded inference time on the same machine. No GPU was used for either method.
The speedup is substantial; however, it should be interpreted together with the agreement between the surrogate and the optimization-generated labels reported in Section 4.3. Instead of repeatedly solving a computationally expensive combinatorial optimization problem whenever new conditions arise, the trained model can generate decisions almost instantaneously from the selected feature set alone. This property is promising for near-real-time demand response applications, whose operational time scales are often incompatible with metaheuristic optimization, although its practical realization also depends on the metering and communications infrastructure discussed in Section 5. Figure 9 shows the best-fitness value of the GA decreasing across generations for a representative scenario, indicating that the algorithm converges rather than simply terminating at the generation budget, while Figure 10 plots the runtimes from Table 10 on a logarithmic scale so that the large runtime gap is visually apparent.
Figure 9.
GA convergence curve.
Figure 10.
Runtime comparison (log scale).
These results are consistent with the core assumption of the proposed framework, namely that optimization can be applied offline to learn expert decision behavior from a labeled dataset, while machine learning replicates this behavior with much lower computational effort. The framework therefore combines optimization-based decision generation with the speed required for online implementation and may be a suitable candidate for future smart-grid applications.
4.11. Additional Robustness Checks
To address possible data leakage across grouped observations, the absence of confidence intervals, and the use of a single classifier family, the checkpointed feature/label matrix underlying Table 3 was re-analyzed using four additional checks. For transparency, these checks use a freshly fitted Random Forest (500 trees, classweight = “balanced”) and, where noted, a Gradient Boosting model, rather than the exact classifier instance used for Table 3. The resulting accuracy and F1 values therefore differ slightly from those in Table 3 (e.g., 0.645 vs. 0.629 accuracy) and should be read as an independent corroborating analysis rather than a recomputation of the main result.
First, to rule out the information leakage that a naive random split could introduce when multiple loads share the same hourly scenario, a GroupShuffleSplit (5 repeats, 20% held out) was used with the hour-of-week (day × 24 + hour) as the group key, so that no scenario appears in both the training and test folds. This grouped evaluation gave a macro-F1 of 0.484 ± 0.010 and a balanced accuracy of 0.481 ± 0.008, closely matching the non-grouped macro-F1 of 0.474 of the same re-fit (see below). This indicates that the reported performance does not appear to be an artifact of shared-scenario leakage. A complementary leave-one-day-out evaluation (Figure 11), in which the model was trained on six days and tested on the seventh, gave a macro-F1 ranging from 0.476 to 0.505 across the seven held-out days. This spread is similar to that of the grouped split and consistent with the temporal-split result reported in Table 6.
Figure 11.
Leave-one-day-out macro-F1 by held-out day (additional robustness check).
Second, a paired bootstrap (1000 resamples of the held-out test set) around the macro-F1 score gives a 95% confidence interval of [0.450, 0.498] around the point estimate of this re-fit (0.474). This interval lies slightly below the macro-F1 of 0.501 in Table 3, consistent with the small difference in settings noted above, and should be read as quantifying the sampling uncertainty of this re-fit rather than as a formal interval around the Table 3 value. For the exact Table 3 model, the corresponding bootstrap interval is [0.475, 0.526] (Section 4.3).
Third, a Gradient Boosting classifier was trained on the same random 80/20 split as an alternative model family (Figure 12). It achieved a macro-F1 of 0.469 and a balanced accuracy of 0.477, very similar to the 0.474 and 0.477 obtained by the Random Forest in this re-fit. This suggests that the moderate macro-F1 ceiling reflects the difficulty of the underlying labels rather than a limitation specific to the Random Forest algorithm. The confusion matrix of the same re-fit (Figure 13) confirms the pattern already reported in Table 3, in that Load Shifting and Peak Clipping remain the two classes most difficult to separate from Direct Control. Its class-level recall values differ somewhat from those in Table 3 because of the class-balanced training weights used here, which trade some Direct Control precision for improved recall on the minority classes.
Figure 12.
Random Forest vs. Gradient Boosting; Macro-F1 (additional check, same random split).
Figure 13.
Confusion matrix, class-balanced Random Forest re-fit (additional check; class supports match Table 3).
Finally, an XGBoost classifier was trained on the same 80/20 split used for the Random Forest of Table 3 (the original model with nestimators = 500, min_samples_leaf = 2, and classweight = “balanced”, not the re-fit used in the preceding checks). XGBoost reached a higher raw accuracy (0.661 vs. 0.629) but a lower macro-F1 (0.487 vs. 0.501) and a lower balanced accuracy (0.488 vs. 0.500) than this Random Forest. This trade-off differs from that observed in the Gradient Boosting comparison above. The default, unweighted XGBoost training objective is likely to favor the majority Direct Control class more strongly, which is consistent with higher overall accuracy at the expense of the minority-class recall that the class-balanced Random Forest of Table 3 was configured to protect. Taken together, neither alternative model appears to raise the macro-F1 ceiling for the two hardest classes (Load Shifting and Peak Clipping); the preferred model depends on whether raw accuracy or class-balanced performance is prioritized.
5. Discussion
The results indicate that the proposed framework can learn and replicate an optimization-based demand response strategy in a computationally efficient manner. The experiments provide insights into three main issues: (i) the effectiveness of optimization-labelled machine learning as a surrogate framework for decision-making, (ii) the contribution of chromatic feature representation, and (iii) the influence of the optimization paradigm on demand response strategy allocation.
5.1. Effectiveness of Optimization-Labelled Machine Learning
The machine learning model achieved a macro-F1 score of 0.501, which remained stable across both cross-validation and temporal evaluations. Although this value may appear low relative to the accuracy expected of traditional classifiers, it should be interpreted in the context of the optimization problem. Here, the classifier is not required to distinguish between fundamentally different states; rather, it attempts to reproduce the outputs of a multi-objective optimization algorithm in which several strategies have similar objective function values. Consequently, a considerable proportion of misclassifications occur among similar strategies.
The adjacency-aware evaluation shows that 87.7% of predictions are either exact or differ by only one neighboring strategy level. This suggests that, although class boundaries are difficult to define, the model captures much of the structure of the optimization policy. The surrogate should therefore be regarded as an approximation of the optimization process that provides rapid decision-making while preserving its main structure, albeit with limited accuracy for intermediate-intensity strategies.
5.2. Practical Significance of Chromatic Encoding
A further aim of the study was to determine whether chromatic encoding of features adds value to the prediction of demand response strategies. The ablation study (Section 4.5) shows a modest improvement when chromatic features are combined with other feature sets: the full feature set provides an additional 0.009 in macro-F1 score relative to the raw-electrical baseline. This improvement is statistically significant under the paired t-test but not under the corrected test described in Section 4.5, and it should therefore be interpreted with caution.
This outcome is not surprising, since the chromatic descriptors are deterministic functions of the electrical variables and therefore cannot, strictly speaking, add new information. Their advantage appears to lie in providing an alternative representation of the electrical state that is easier for the tree-based classification model to learn. Accordingly, the findings do not support the hypothesis that chromatic encoding is the main source of predictive performance. Instead, they suggest that chromatic representations act as supplementary descriptors that yield small improvements when combined with the electrical, network, economic, and customer-related features.
However, the repeated appearance of Hue, Lightness, Saturation, and Chroma among the top-ranked features suggests that the transformed representation still carries some useful information. Therefore, although chromatic encoding should not be regarded as a replacement for the electrical variables, it may serve as a complementary feature-engineering technique in smart grid machine learning.
5.3. Weighted-Sum Versus Multi-Objective Optimization
One important implication of this analysis is the marked discrepancy between weighted-sum optimization techniques and true Pareto-based multi-objective optimization techniques. Weighted-sum techniques, and specifically the economic-only formulation in MILP, showed a bias toward aggressive curtailment strategies. In contrast, NSGA-II and MOPSO generated more evenly distributed demand response portfolios that included all available strategies in substantial proportions.
This difference may be explained by the nature of Pareto-based optimization compared with scalarization. Scalarized techniques collapse several objectives into a single numerical value, which increases the likelihood that a solution strongly biased toward one objective dominates the search space, especially when the weighting or scaling favors aggressive peak demand reduction. Pareto-based optimization mitigates this drawback because it retains competing objectives in the search and therefore allows multiple trade-offs to coexist.
With regard to demand response program implementation, these results have important implications. Utilities seeking maximum peak demand reduction may favor weighted-sum formulations because they yield highly aggressive control actions. However, such formulations also make utility programs heavily dependent on direct load control measures, which may lead to customer rejection. Pareto-based formulations therefore appear advantageous in providing a wider range of solutions and may consequently improve the social acceptance of demand response. Future research should examine whether the same holds for larger networks or longer operational periods.
5.4. Implications for Real-Time Demand Response Operation
The most important practical implication of the study is the computational speedup achieved through surrogate learning. The optimization took over one hundred seconds to produce a strategy allocation for each operating situation, whereas the machine learning model produced its predictions within about one-tenth of a second. This speedup suggests that demand response decisions could be generated on time scales acceptable in practice. However, it addresses only the online decision step and does not by itself make the framework deployable. The P/Q/V-level observability assumed by the model requires smart meters at every participating load and a communications and control layer capable of delivering commands to individual customers. The capital cost of this infrastructure lies outside the scope of the economic assessment in Section 4.8 and would need to be weighed against the projected operational savings before any real deployment.
In modern smart grids with a growing share of distributed energy resources, electric vehicles, and flexible demand, network operating conditions may change rapidly, and repeatedly solving computationally expensive optimization problems may be impractical. The proposed approach can be regarded as a compromise between the two methods: optimization is run offline to generate high-quality decision labels, while machine learning provides fast online computation. This allows much of the intelligence embedded in the optimization process to be preserved while providing substantial computational efficiency.
Thus, the present study provides evidence for the potential of optimization-labelled machine learning in future demand response systems. Rather than treating optimization and machine learning as competing methodologies, the present framework combines them to construct a decision-making system that shows favorable technical, economic, and computational performance within the simulated setting. It should be stressed that this evidence is entirely simulation-based, using a synthetic benchmark network with synthetic customer classes and profiles (Section 6); it demonstrates the feasibility of the methodology, not its real-time applicability under field conditions. Studies validated experimentally or through hardware-in-the-loop testing, such as the multi-mode photovoltaic–storage monitoring and energy-management system of Benavides et al., which was tested against real operating conditions rather than simulation alone [38], provide a stronger standard of evidence for real-time applicability than the present study. Extending the present framework to a comparable experimental or utility-data setting is left for future work.
Further research is needed to validate the proposed approach using utility data, AMI data, empirical customer flexibility models, and utility economics and reliability parameters. Further work is also required to explore the applicability of the approach to larger distribution networks, longer seasonal operating periods, and other machine learning models, as well as to develop a multi-objective optimization framework.
6. Limitations
This study has several limitations. First, customer classification was performed using a deterministic size-driven heuristic, because the IEEE 69-bus benchmark contains no customer-type information. The assigned categories (Residential, Commercial, Industrial, Hospital, and EV Charger) are therefore scenario-analysis constructs and should not be interpreted as representative of any real customer population. In addition, the Flexibility and Value-of-Service parameters were generated from predefined class-specific ranges rather than from empirical data such as customer surveys or utility records. Although this approach provides a structured and reproducible experimental environment, future studies should use real customer data where possible.
A further limitation of practical importance concerns the assumed controllability and observability of individual loads. The framework treats each load as if it could be curtailed to an arbitrary degree. However, 11–12.66 kV feeders such as the IEEE 69-bus system typically provide only a single switching device per customer. Partial (rather than all-or-nothing) curtailment would require customers to have already invested in internal switchgear that separates critical from non-critical circuits, which represents a cost and adoption barrier that is not modeled here. Similarly, the electrical features (P, Q, V, and current loading) that the framework assumes to be available for every load in real time presuppose smart meters at the boundary of every participating customer. In networks with limited advanced metering penetration, the approach could be applied only to the subset of metered loads. Finally, the Hospital and Industrial classes are modeled solely by their power profiles and Value-of-Service parameters. In practice, such critical loads often require a second, independent supply (including on-site backup generation) for reliability reasons. This was not represented and would reduce their actual exposure to demand response curtailment relative to what the model assumes.
The second limitation relates to load modeling. The load profiles used are illustrative and were not derived from advanced metering infrastructure or utility load research programs. Although temporal variability was introduced through stochastic disturbances, the generated scenarios cannot fully reflect the diversity of real customer behavior. The results should therefore be regarded as a demonstration of methodological feasibility rather than as operational recommendations for a particular utility network. Relatedly, the dataset spans a single representative week (168 hourly snapshots, 8064 load-level observations), in which the same seven per-class daily curves are reused across days and only independent Gaussian noise distinguishes one day from the next. Although this sample size is adequate for training the classifier, the dataset does not capture genuine weekday–weekend or seasonal variability, and the reported performance should not be taken as evidence of generalization along these dimensions.
The next limitation concerns the optimization stage. The machine learning model was trained to reproduce the behavior of the optimization framework used for label generation, not a mathematically proven global optimum. The optimization problem is complex, as it involves discrete strategy selection, nonlinear AC power flow calculations, and multiple objectives. Consequently, the generated labels should be regarded as high-quality optimization decisions rather than globally optimal solutions. This is reinforced by the direct measurement of inter-run agreement (Section 3.6): across the full week, all three GA runs of the majority vote agreed for only about 40% of the individual load-hours, so most labels rest on a 2–1 split among the three runs rather than on unanimous agreement. The stability of the labels under a different random draw of GA runs has not been established. The same consideration applies to the continuous-relaxation PSO benchmark and the economic-only MILP relaxation, which were included in the comparison for illustrative purposes. Additionally, the low per-class F1-scores for Load Shifting and Peak Clipping (Section 4.3) were diagnosed only at the level of label confusion. Whether these misclassifications would produce voltage or thermal constraint violations if actually dispatched was not evaluated and is left for future work.
Moreover, the reliability evaluation relied on assumed failure rates, repair times, and customer equivalency factors, since such data are not available for the IEEE 69-bus test system. The resulting SAIFI, SAIDI, ENS, and LOLP values therefore cannot be taken as realistic reliability estimates. Likewise, the electricity tariffs, customer incentives, and carbon emission factor used in this study are generic and would require further calibration before practical implementation.
Finally, although the chromatic feature approach showed a nominally significant improvement in predictive performance under a naive paired t-test across repeated cross-validation folds, this significance did not survive a variance correction for the non-independence of the folds and an adjustment for testing multiple feature subsets against the same baseline (Section 4.5). The improvements should therefore be regarded as limited and not clearly statistically significant. In particular, the ablation results show that the full chromatic feature set improved the macro-F1 score by only 0.009 relative to the raw electrical feature set. Hence, despite their potential usefulness as supplementary features, chromatic descriptors cannot be considered key drivers of model performance. Further research is needed to examine whether larger gains can be achieved using different color spaces, temporal information, or other scenarios.
7. Conclusions
In summary, this paper presented an optimization-labeled machine learning approach for demand response strategy selection in distribution systems, using a diverse set of electrical, network, economic, customer-oriented, and chromatic features. In the IEEE 69-bus distribution system case study, a dataset of 8064 load-level observations was generated through AC power-flow simulations and optimization labeling. A Random Forest model was trained on this dataset to approximate the decision-making policy produced by the optimization method.
The results indicate that the surrogate model achieved a macro-F1 score of 0.501 and remained stable under both cross-validation and temporal generalization testing. Although the exact classification accuracy was modest, the adjacency-aware evaluation showed that 87.7% of predictions were either correct or differed from the optimization label by only one strategy level. Furthermore, the explainability analysis identified the customer-oriented variables, namely Value-of-Service and Flexibility, as the main drivers of the decision-making process.
From an operational perspective, the predicted demand response actions were associated with a 20.3% reduction in feeder losses and an 18.2% reduction in peak demand, together with improved voltage regulation and positive economic and environmental impacts. In addition, the trained machine learning model reduced the computation time by a factor of nearly 915 compared with the Genetic Algorithm that served as the label generator. Therefore, optimization-labeled surrogate learning appears promising as a technique for near-real-time decision support, subject to the metering, communications, and experimental-validation considerations discussed in Section 5 and Section 6.
The comparative optimization analysis showed a marked difference between weighted-sum methods and true Pareto-based multi-objective methods. The former tended to favor more aggressive curtailment actions, whereas Pareto-based methods such as NSGA-II and MOPSO produced more diverse demand response actions. This indicates that the choice of optimization paradigm may influence not only performance metrics but also portfolio composition and customer acceptability.
In addition, the ablation study indicated that the proposed chromatic encoding provides a slight improvement in predictive performance; however, its statistical significance did not persist after correcting for the non-independence of repeated cross-validation folds and for testing multiple feature subsets against the same baseline (Section 4.5). Its main advantage appears to lie in providing an alternative representation of the electrical operating state rather than adding new information. Hence, chromatic features are best regarded as supplementary features within the broader optimization-labeled machine learning framework.
Funding
This research did not receive any specific grant from funding agencies in the public, commercial, or not-for-profit sectors. The APC was funded by Mutah University.
Data Availability Statement
The data presented in this study are available on request from the corresponding author.
Conflicts of Interest
The author declares no conflicts of interest.
References
- Bakare, M.S.; Abdulkarim, A.; Zeeshan, M.; Shuaibu, A.N. A comprehensive overview on demand side energy management towards smart grids: Challenges, solutions, and future direction. Energy Inform. 2023, 6, 4. [Google Scholar] [CrossRef] [Scilit]
- Lee, H.P. Integrating distributed energy resources in power distribution systems: A comprehensive review of impacts, challenges, and opportunities from a distribution system operator’s perspective. Appl. Energy 2026, 403, 127052. [Google Scholar] [CrossRef] [Scilit]
- Mohagheghi, S.; Yang, F.; Falahati, B. Impact of demand response on distribution system reliability. In Proceedings of the 2011 IEEE Power and Energy Society General Meeting, Detroit, MI, USA, 24–28 July 2011; pp. 1–7. [Google Scholar] [CrossRef] [Scilit]
- Shaterabadi, M.; Jirdehi, M.A.; Tabar, V.S.; Galvani, S. Advanced dynamic programming for optimal microgrid energy management under RER intermittency. Renew. Energy 2026, 256, 124077. [Google Scholar] [CrossRef] [Scilit]
- Holland, J.H. Adaptation in Natural and Artificial Systems: An Introductory Analysis with Applications to Biology, Control, and Artificial Intelligence; The University of Michigan Press: Ann Arbor, MI, USA, 1975. [Google Scholar]
- Freitas, D.; Lopes, L.G.; Morgado-Dias, F. Particle swarm optimisation: A historical review up to the current developments. Entropy 2020, 22, 362. [Google Scholar] [CrossRef] [Scilit] [PubMed]
- Banad, Y.M.; Sharif, S.S.; Rezaei, Z. Artificial intelligence and machine learning for smart grids: From foundational paradigms to emerging technologies with digital twin and large language model-driven intelligence. Energy Convers. Manag. X 2025, 28, 101329. [Google Scholar] [CrossRef] [Scilit]
- Mukhtar, A.; Md Yasir, A.S.H.; Mohamed Nasir, M.F. A machine learning-based comparative analysis of surrogate models for design optimisation in computational fluid dynamics. Heliyon 2023, 9, e18674. [Google Scholar] [CrossRef] [Scilit] [PubMed]
- Asiamah, R.; Zhou, Y.; Zamzam, A.S. Machine learning-assisted distribution system network reconfiguration problem. In Proceedings of the 2025 IEEE PES Grid Edge Technologies Conference & Exposition (Grid Edge), San Diego, CA, USA, 21–23 January 2025; pp. 1–5. [Google Scholar] [CrossRef] [Scilit]
- Razmjoo, A.; Asef, P.; Javadi, M.; Marzband, M.; Refaat, S.S.; Rawa, M. A comprehensive review of AI-powered energy systems. Energy Sci. Eng. 2026, 14, 3554–3580. [Google Scholar] [CrossRef] [Scilit]
- Karpenko, D.; Yevtukhova, T.; Novoseltsev, O. A review of machine learning models and algorithms for short-term forecasting of multi-energy consumption in buildings. e-Prime 2026, 17, 201184. [Google Scholar] [CrossRef] [Scilit]
- Zaidi, A.; Ajibade, S.-S.M.; Adediran, A.O.; Jasser, M.B. Unveiling trends in machine learning for smart grids: A comprehensive bibliometric and science mapping approach. Energies 2026, 19, 3007. [Google Scholar] [CrossRef] [Scilit]
- Rees Jones, G.; Spencer, J.W. Advanced Chromatic Monitoring; CRC Press: Boca Raton, FL, USA, 2020. [Google Scholar]
- Shaik, N.; Shaik, A.S.; Priya, C.K. Elevating machine learning performance: The power of feature engineering. J. Novel. Res. Innov. Dev. 2024, 2, a57–a85. [Google Scholar]
- Foley, J.D.; van Dam, A.; Feiner, S.K.; Hughes, J.F. Computer Graphics: Principles and Practice in C; Addison-Wesley Professional: Boston, MA, USA, 1996. [Google Scholar]
- Wang, P.; Wu, X.; Song, Y.; Tian, D.; Wang, X. A comprehensive review of time series classification: Traditional, deep learning, and few-shot learning methods. Comput. Sci. Rev. 2026, 61, 100953. [Google Scholar] [CrossRef] [Scilit]
- Mohamed, A.; Abdelqader, K.; Shaalan, K. Explainable artificial intelligence: A systematic review of progress and challenges. Intell. Syst. Appl. 2025, 28, 200595. [Google Scholar] [CrossRef] [Scilit]
- Wu, X.; Cao, W.; Wang, D.; Ding, M.; Yu, L.; Nakanishi, Y. Demand response model based on improved Pareto optimum considering seasonal electricity prices for Dongfushan Island. Renew. Energy 2021, 164, 926–936. [Google Scholar] [CrossRef] [Scilit]
- Deb, K.; Pratap, A.; Agarwal, S.; Meyarivan, T. A fast and elitist multiobjective genetic algorithm: NSGA-II. IEEE Trans. Evol. Comput. 2002, 6, 182–197. [Google Scholar] [CrossRef] [Scilit]
- Coello, C.A.C.; Pulido, G.T.; Lechuga, M.S. Handling multiple objectives with particle swarm optimization. IEEE Trans. Evol. Comput. 2004, 8, 256–279. [Google Scholar] [CrossRef] [Scilit]
- Alabi, T.M.; Aghimien, E.I.; Agbajor, F.D.; Yang, Z.; Lu, L.; Adeoye, A.R.; Gopaluni, B. A review on the integrated optimization techniques and machine learning approaches for modeling, prediction, and decision making on integrated energy systems. Renew. Energy 2022, 194, 822–849. [Google Scholar] [CrossRef] [Scilit]
- Machlev, R.; Heistrene, L.; Perl, M.; Levy, K.Y.; Belikov, J.; Mannor, S.; Levron, Y. Explainable Artificial Intelligence (XAI) techniques for energy and power systems: Review, challenges and opportunities. Energy AI 2022, 9, 100169. [Google Scholar] [CrossRef] [Scilit]
- Nagappan, B.; Chaudhary, C.; Doda, D.K.; Kumar, S. Review on smart grids and renewable integration: An artificial intelligence-powered perspective. Multidiscip. Rev. 2023, 6, ss070. [Google Scholar] [CrossRef] [Scilit]
- Wang, Q.; Chen, Z.; Zhou, Y.; Liu, Z.; Peng, Z. Real-time monitoring and optimization of machine learning intelligent control system in power data modeling technology. Mach. Learn. Appl. 2024, 18, 100584. [Google Scholar] [CrossRef] [Scilit]
- Sarikaya, F. Representation Learning: A Fundamental Shift in Machine Learning. Zenodo 2024. [Google Scholar] [CrossRef]
- Coello Coello, C.A. Theoretical and numerical constraint-handling techniques used with evolutionary algorithms: A survey of the state of the art. Comput. Methods Appl. Mech. Eng. 2002, 191, 1245–1287. [Google Scholar] [CrossRef] [Scilit]
- Zhang, B.; Ishii, S.; Aoji, S.; Wakui, T. Surrogate model-assisted optimization for multi-objective design of energy supply and storage systems considering one-year operational planning. Energy Convers. Manag. X 2026, 31, 102041. [Google Scholar] [CrossRef] [Scilit]
- Akbari, F.; Khorram, E.; Ghaznavi, M. A comparative study of different algorithms and scalarization techniques for constructing the Pareto front of multiobjective optimization problems. Optimization 2025, 74, 3237–3274. [Google Scholar] [CrossRef] [Scilit]
- Ben Said, L.; Zghal, W.; Hentati, H.; Bouaziz, M.; Chabir, A.; Alharbi, S.; Turki, M. Integrated machine learning and design-based methodology for technical sizing and performance optimization of photovoltaic systems. J. Eng. Res. 2026, 14, 2469–2478. [Google Scholar] [CrossRef] [Scilit]
- Motalleb, M.; Thornton, M.; Reihani, E.; Ghorbani, R. Providing frequency regulation reserve services using demand response scheduling. Energy Convers. Manag. 2016, 124, 439–452. [Google Scholar] [CrossRef] [Scilit]
- Pombo, A.V.; Pires, V.F.; Pina, J.M. Application of NSGA-II algorithm to multiobjective optimization of switching devices placement in electric power distribution systems. In Technological Innovation for Collective Awareness Systems (DoCEIS 2014); Camarinha-Matos, L.M., Barrento, N.S., Mendonça, R., Eds.; IFIP Advances in Information and Communication Technology; Springer: Berlin/Heidelberg, Germany, 2014; Volume 423. [Google Scholar] [CrossRef] [Scilit]
- Chakraborty, D.; Sur, U.; Banerjee, P.K. Random forest based fault classification technique for active power system networks. In Proceedings of the 2019 IEEE International WIE Conference on Electrical and Computer Engineering (WIECON-ECE), Bangalore, India, 15–16 November 2019; pp. 1–4. [Google Scholar] [CrossRef] [Scilit]
- Shang, Y.; Shang, Y.; Yu, H.; Shao, Z.; Jian, L. Achieving efficient and adaptable dispatching for vehicle-to-grid using distributed edge computing and attention-based LSTM. IEEE Trans. Ind. Inform. 2022, 18, 6915–6926. [Google Scholar] [CrossRef] [Scilit]
- Lundberg, S.M.; Lee, S.-I. A unified approach to interpreting model predictions. In Proceedings of the 31st International Conference on Neural Information Processing Systems (NIPS’17), Long Beach, CA, USA, 4–9 December 2017; pp. 4768–4777. [Google Scholar]
- Abdellatif, A.; Mubarak, H.; Ramiah, H.; Mokhlis, H.; Mekhilef, S.; Gheni, H.M.; Kanesan, J. SHapley Additive exPlanations-guided rule-based energy management: Bridging machine learning interpretability and adaptive control strategies. Renew. Energy Focus 2026, 56, 100779. [Google Scholar] [CrossRef] [Scilit]
- Ahmadi, M.; Aly, H.; Gu, J. A comprehensive review of AI-driven approaches for smart grid stability and reliability. Renew. Sustain. Energy Rev. 2026, 226, 116424. [Google Scholar] [CrossRef] [Scilit]
- Nadeau, C.; Bengio, Y. Inference for the Generalization Error. Mach. Learn. 2003, 52, 239–281. [Google Scholar] [CrossRef] [Scilit]
- Benavides, D.; Arévalo, P.; Criollo, A.; Tostado-Véliz, M.; Jurado, F. Multi-mode monitoring and energy management for photovoltaic-storage systems. Renew. Energy 2024, 230, 120820. [Google Scholar] [CrossRef] [Scilit]
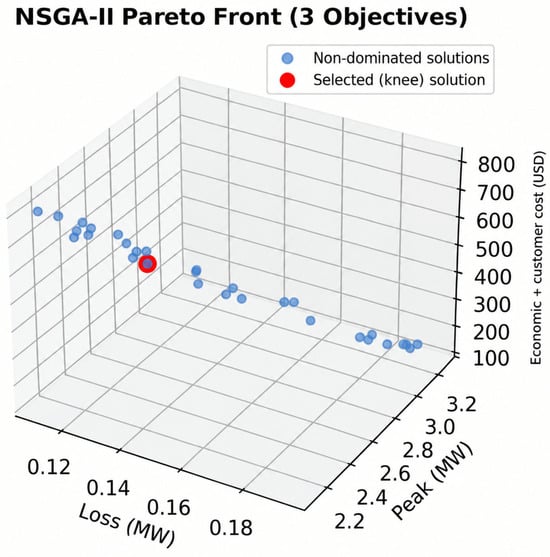
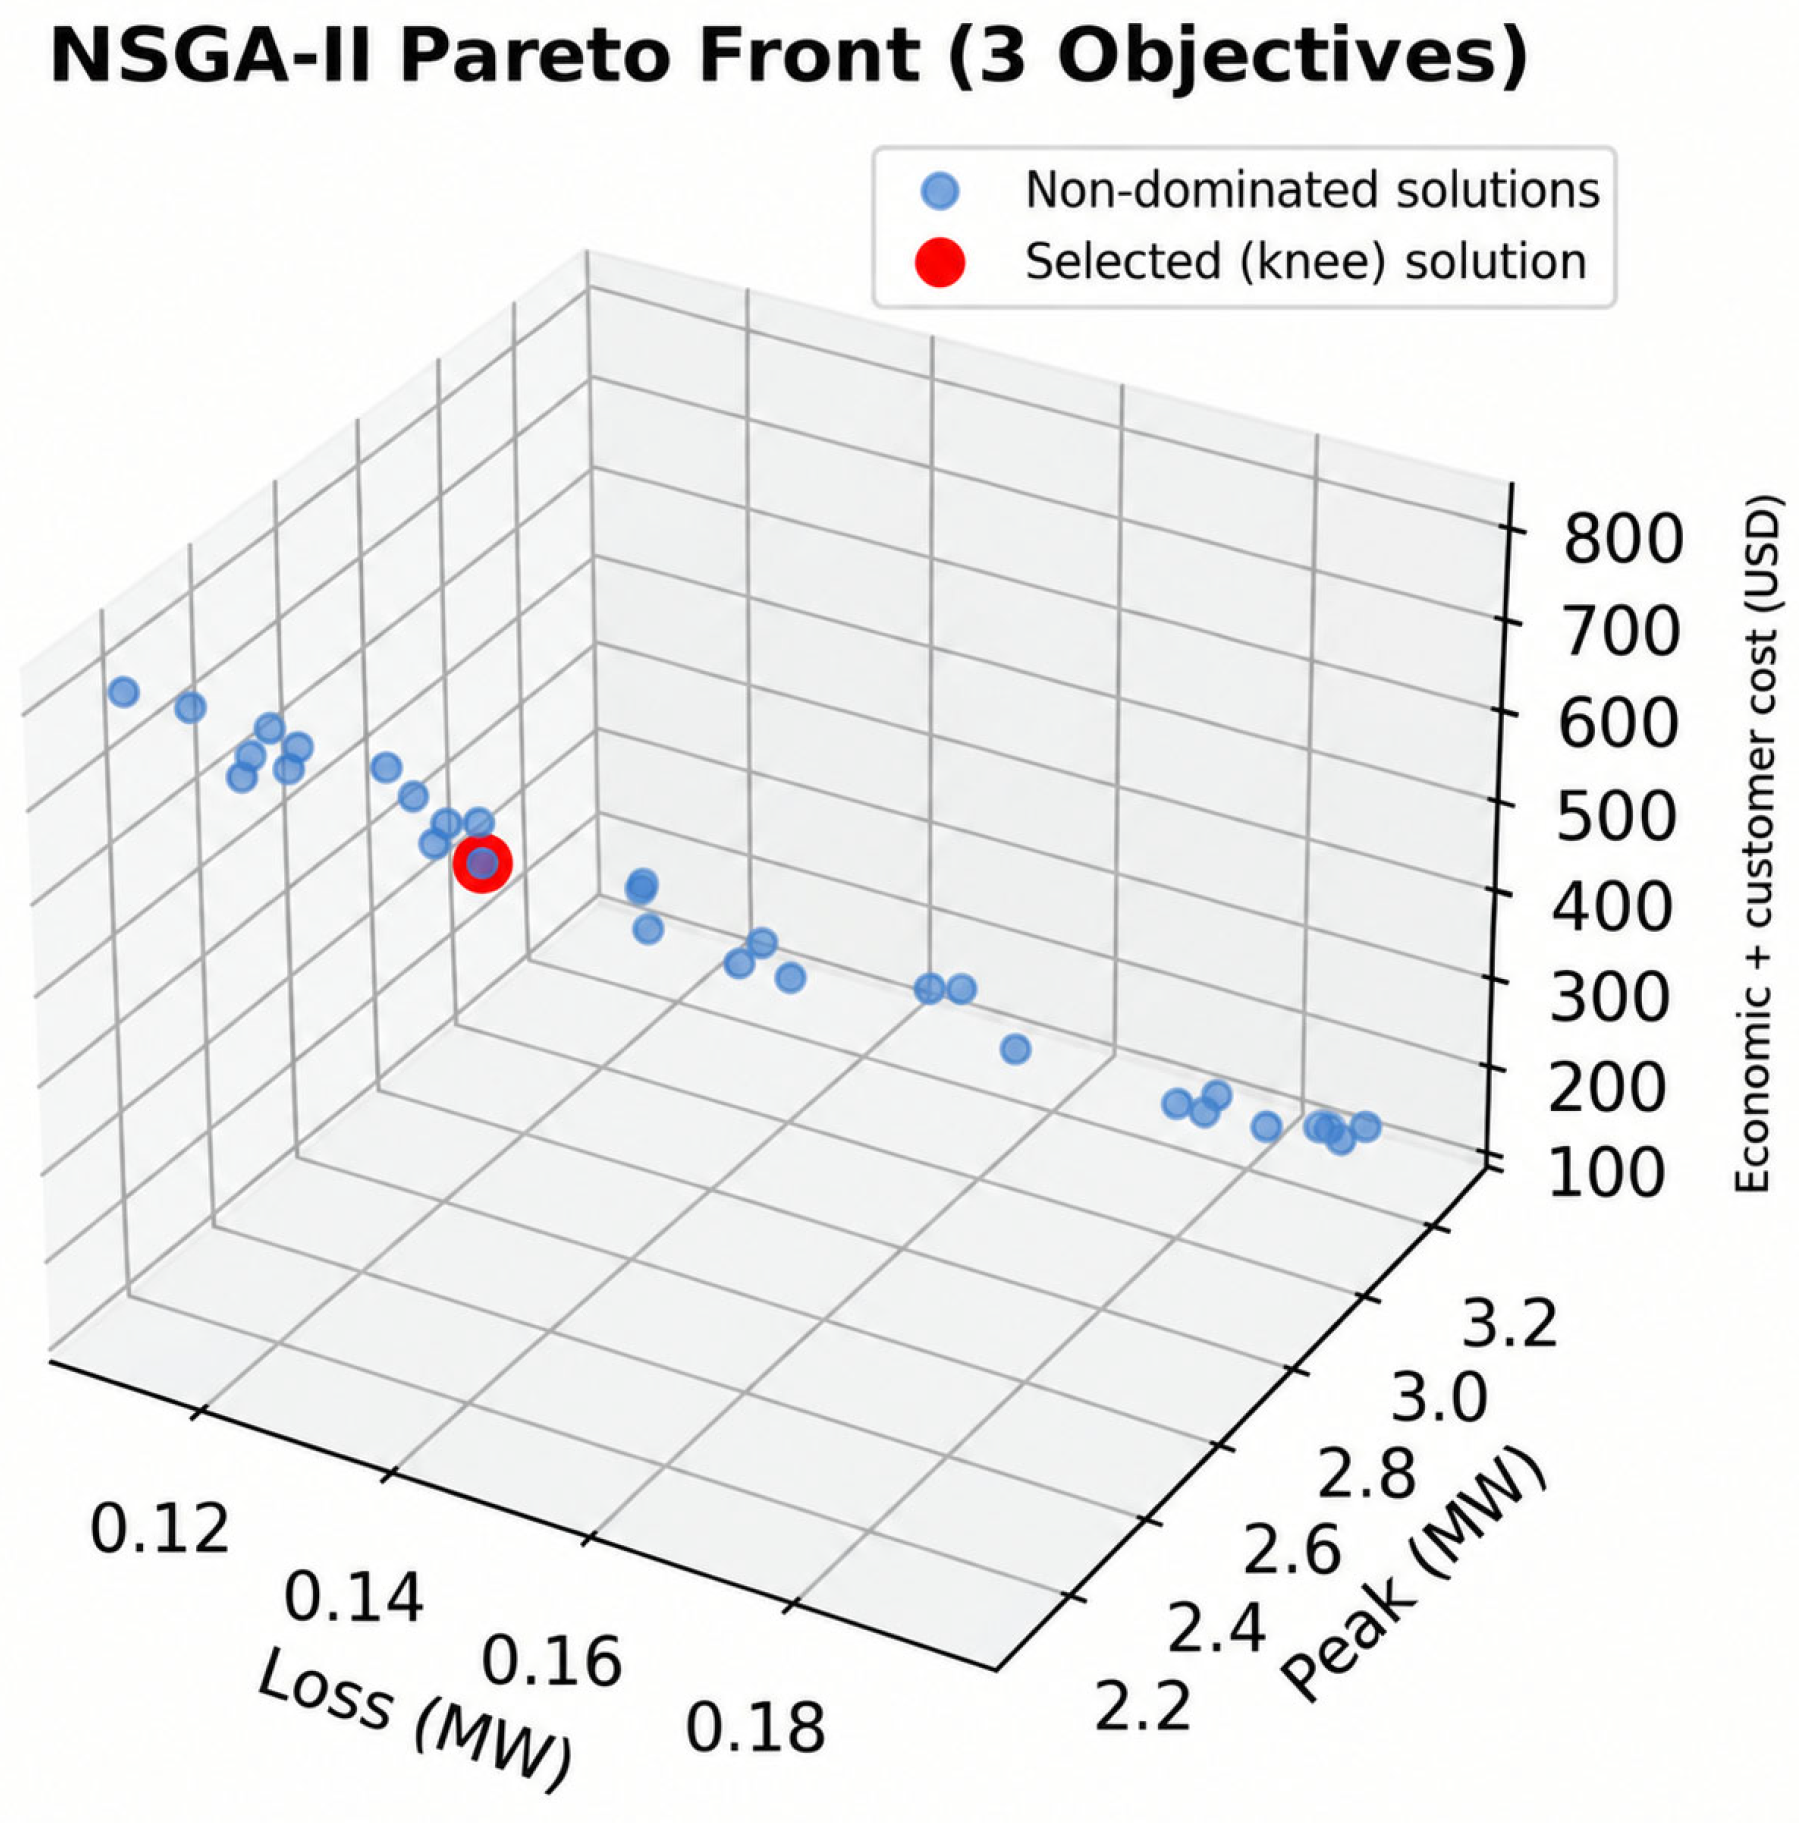
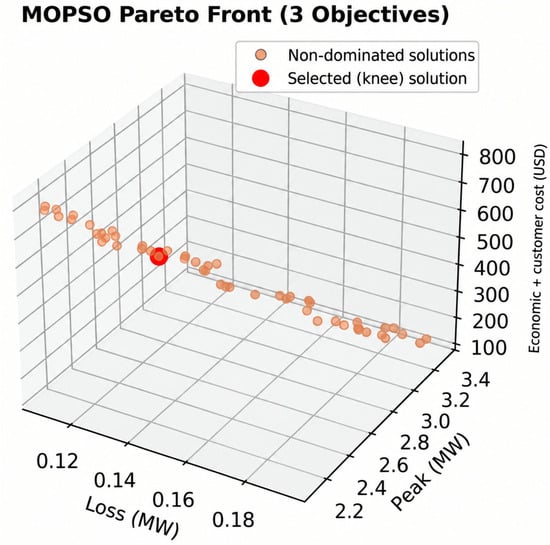
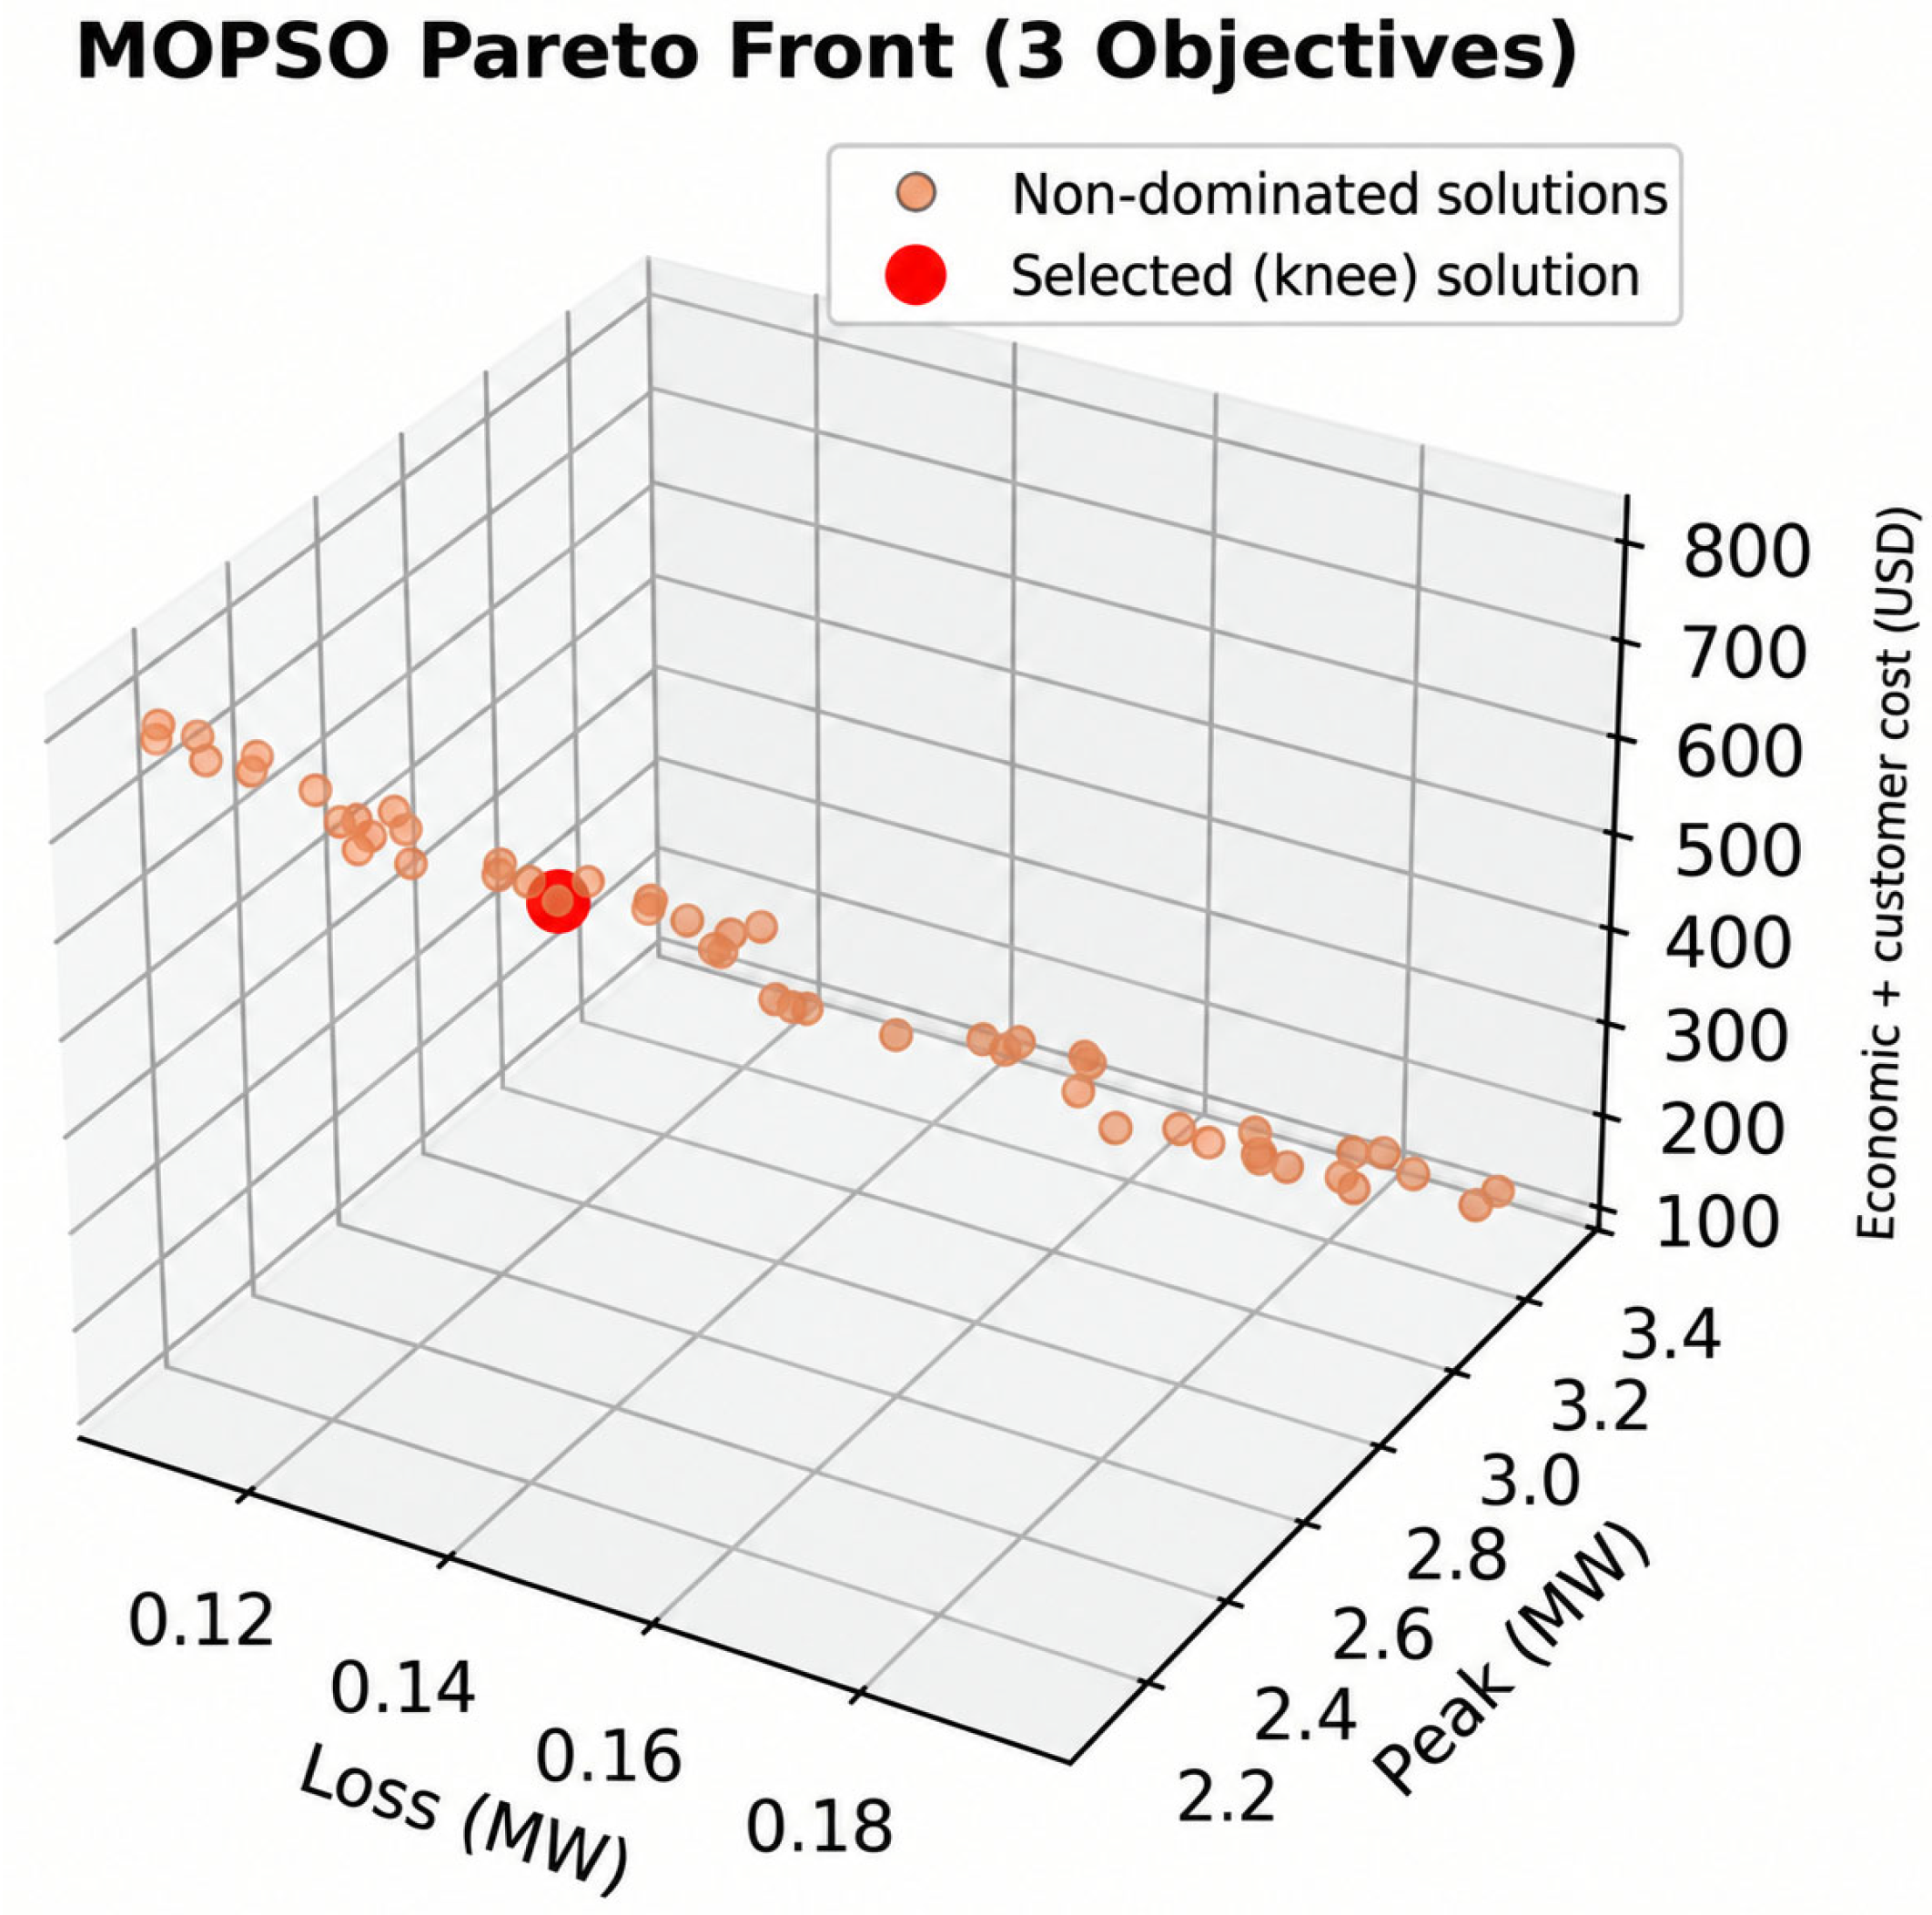
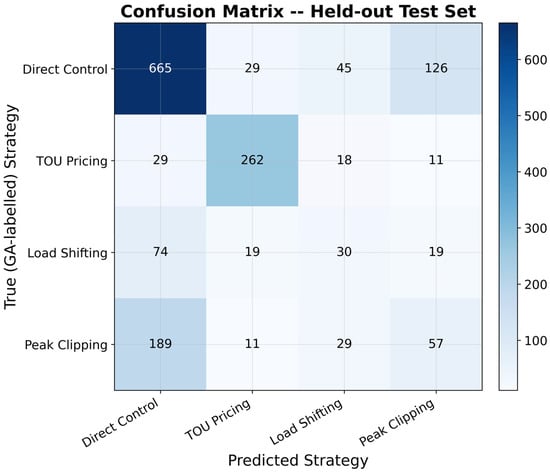
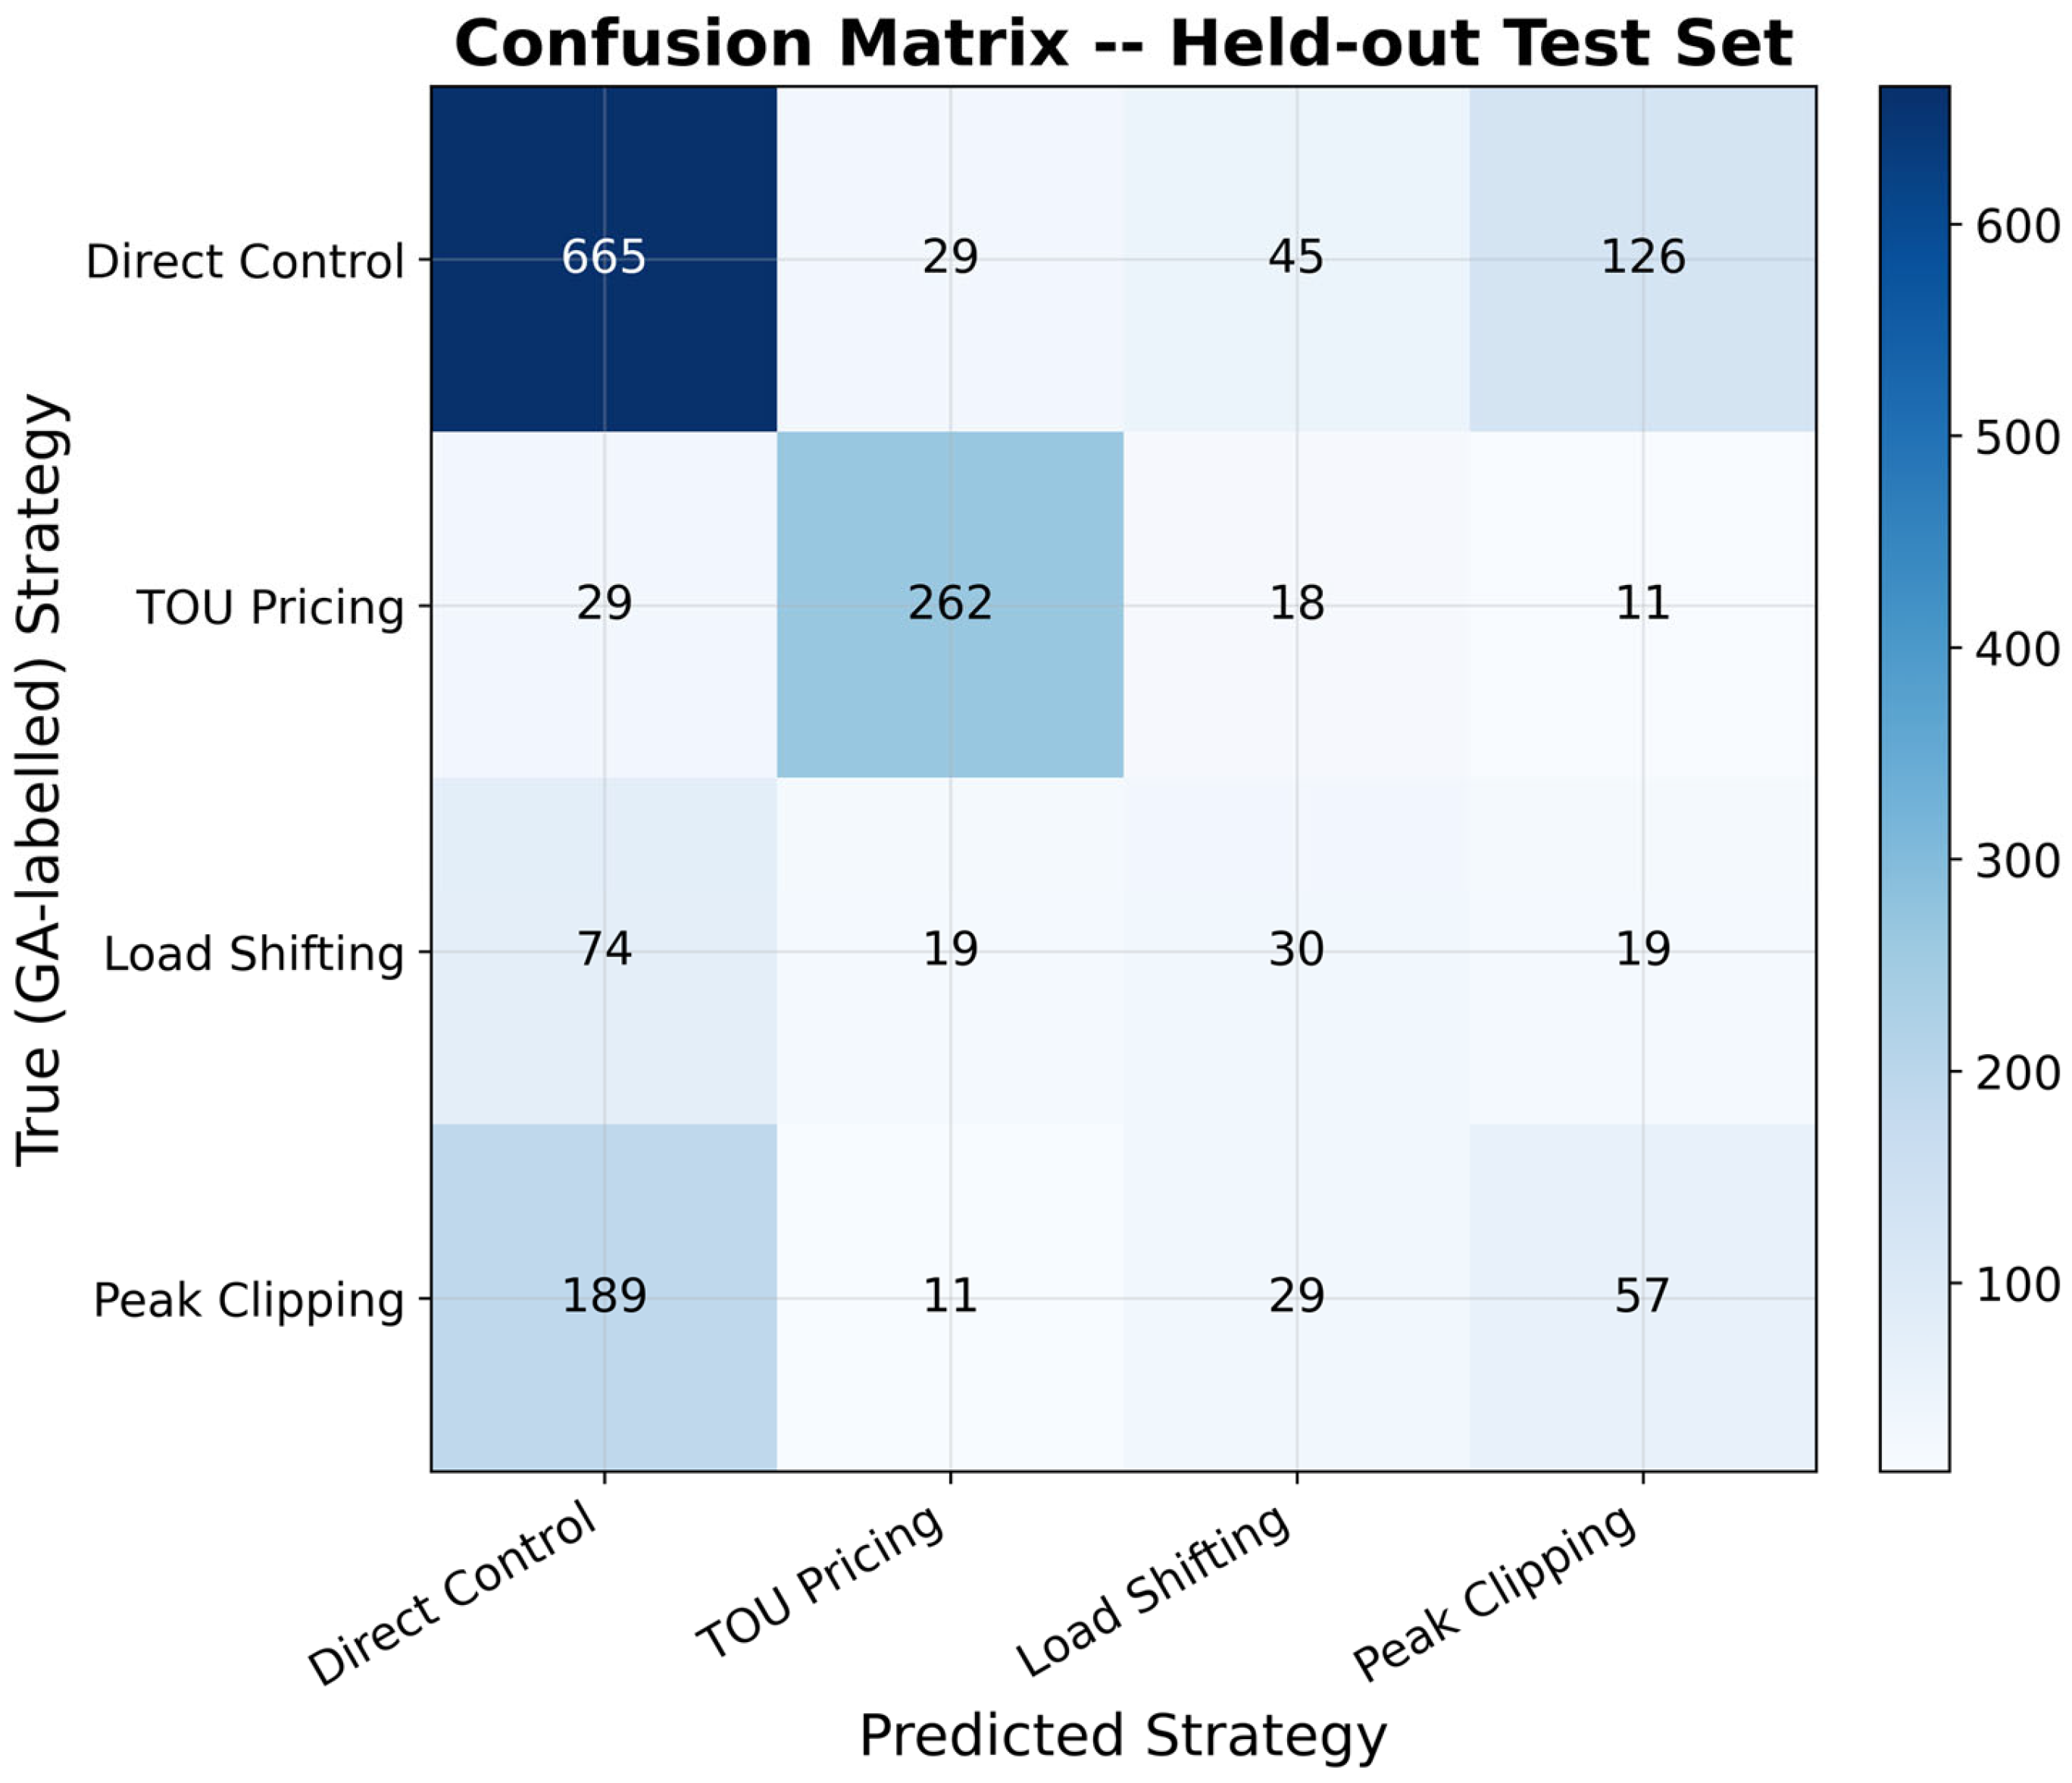
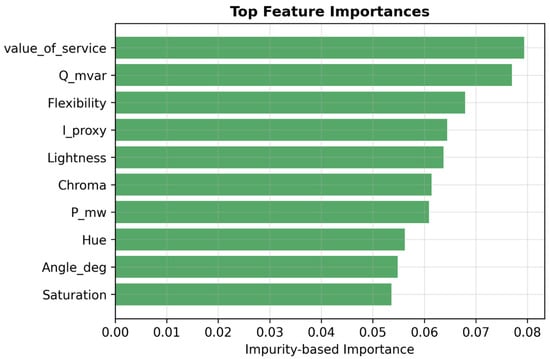
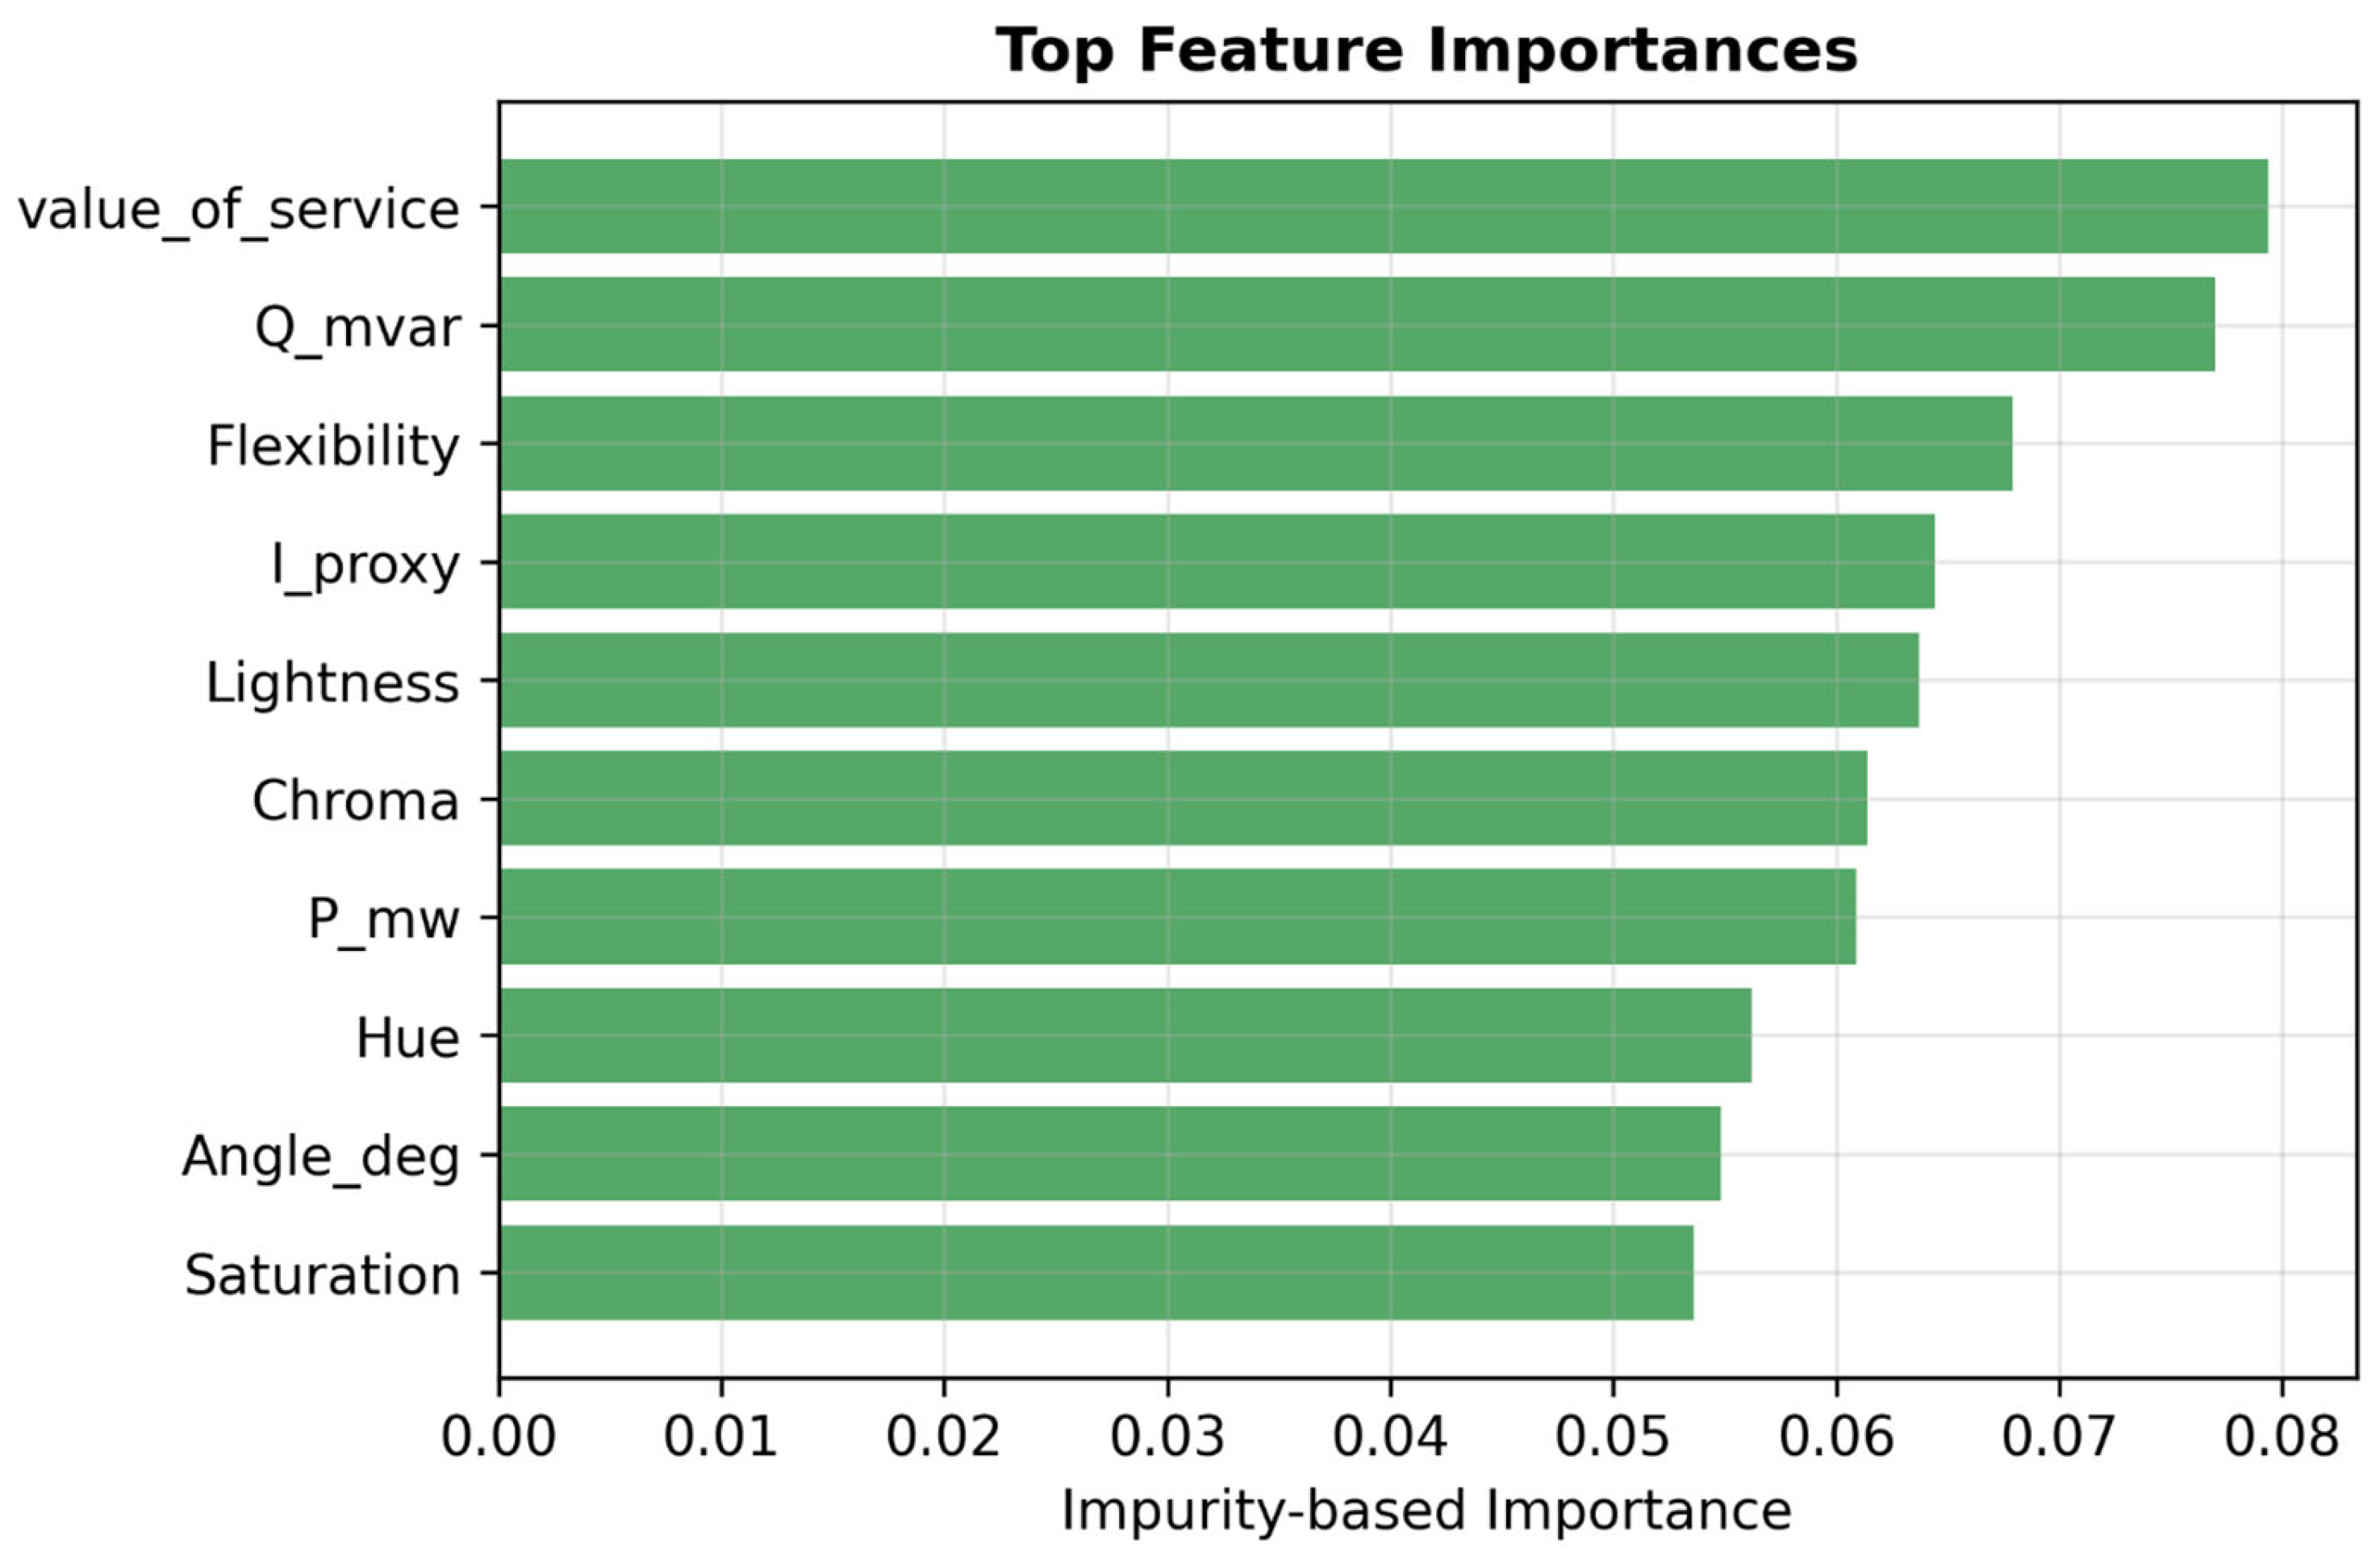
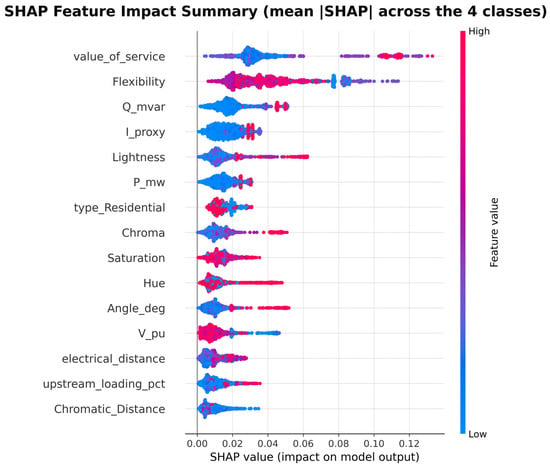
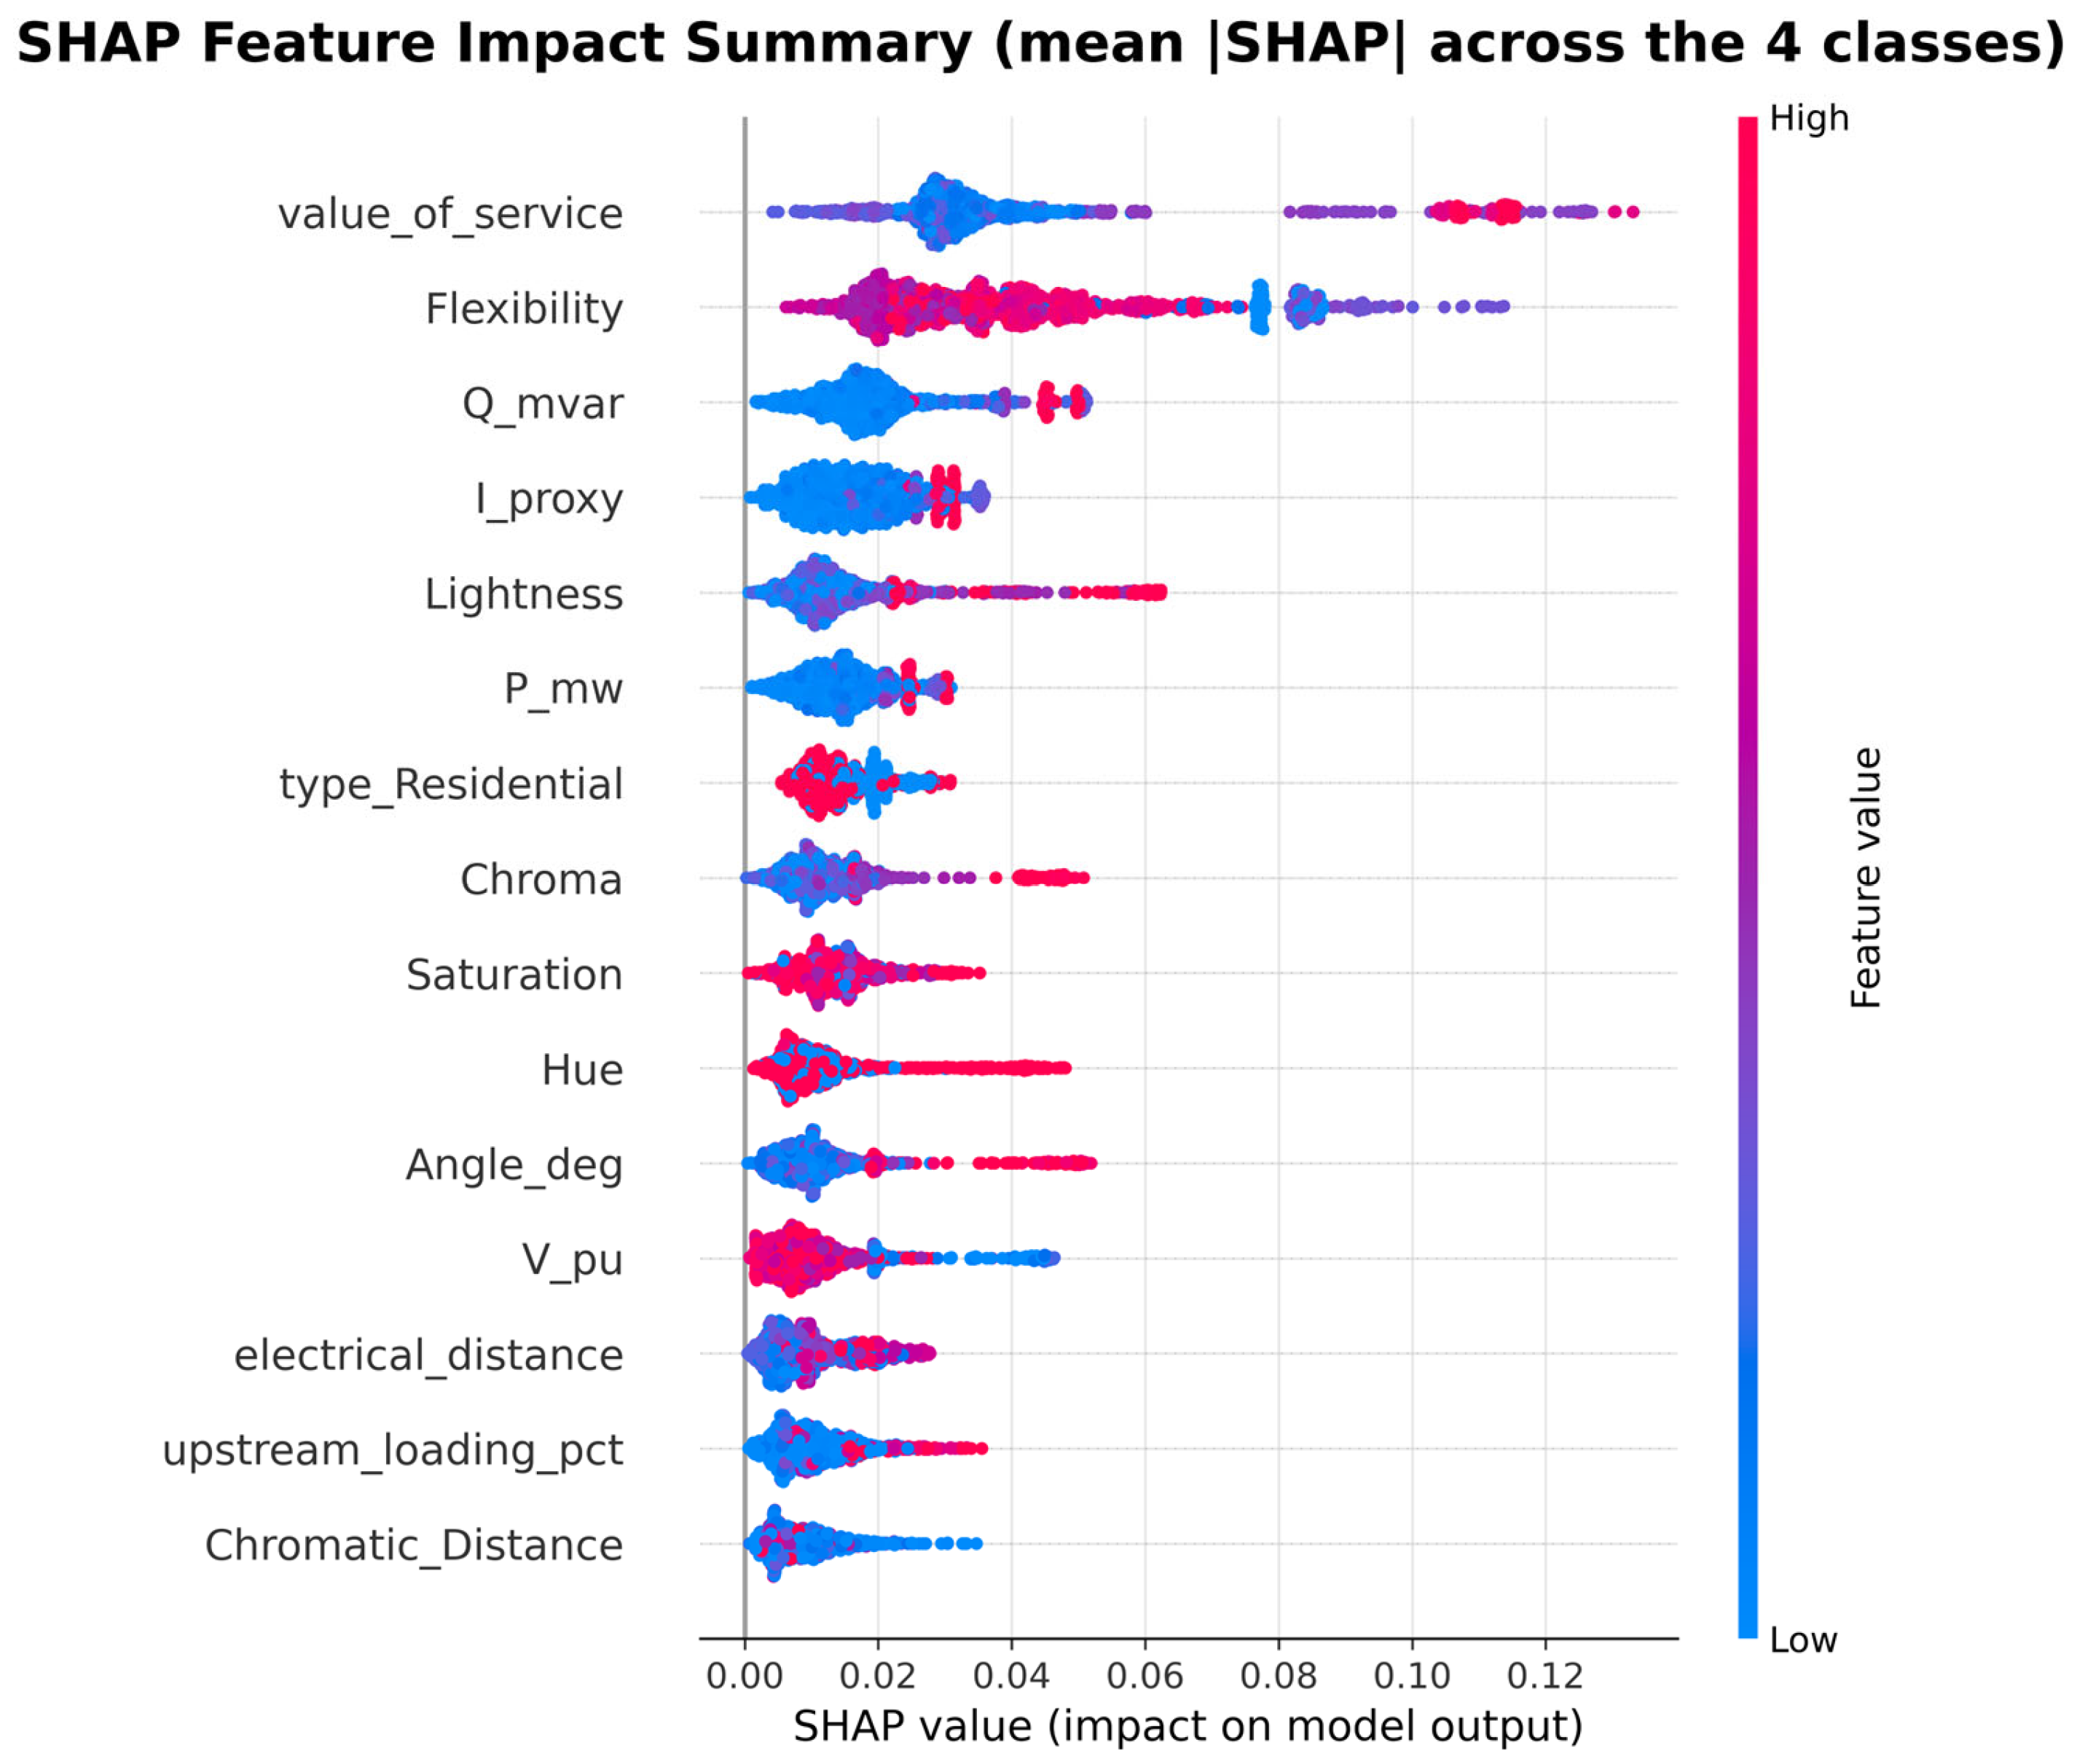
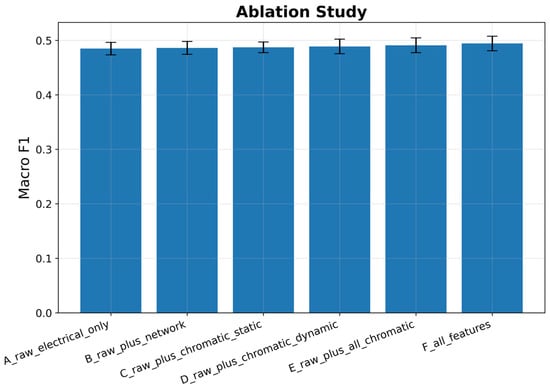
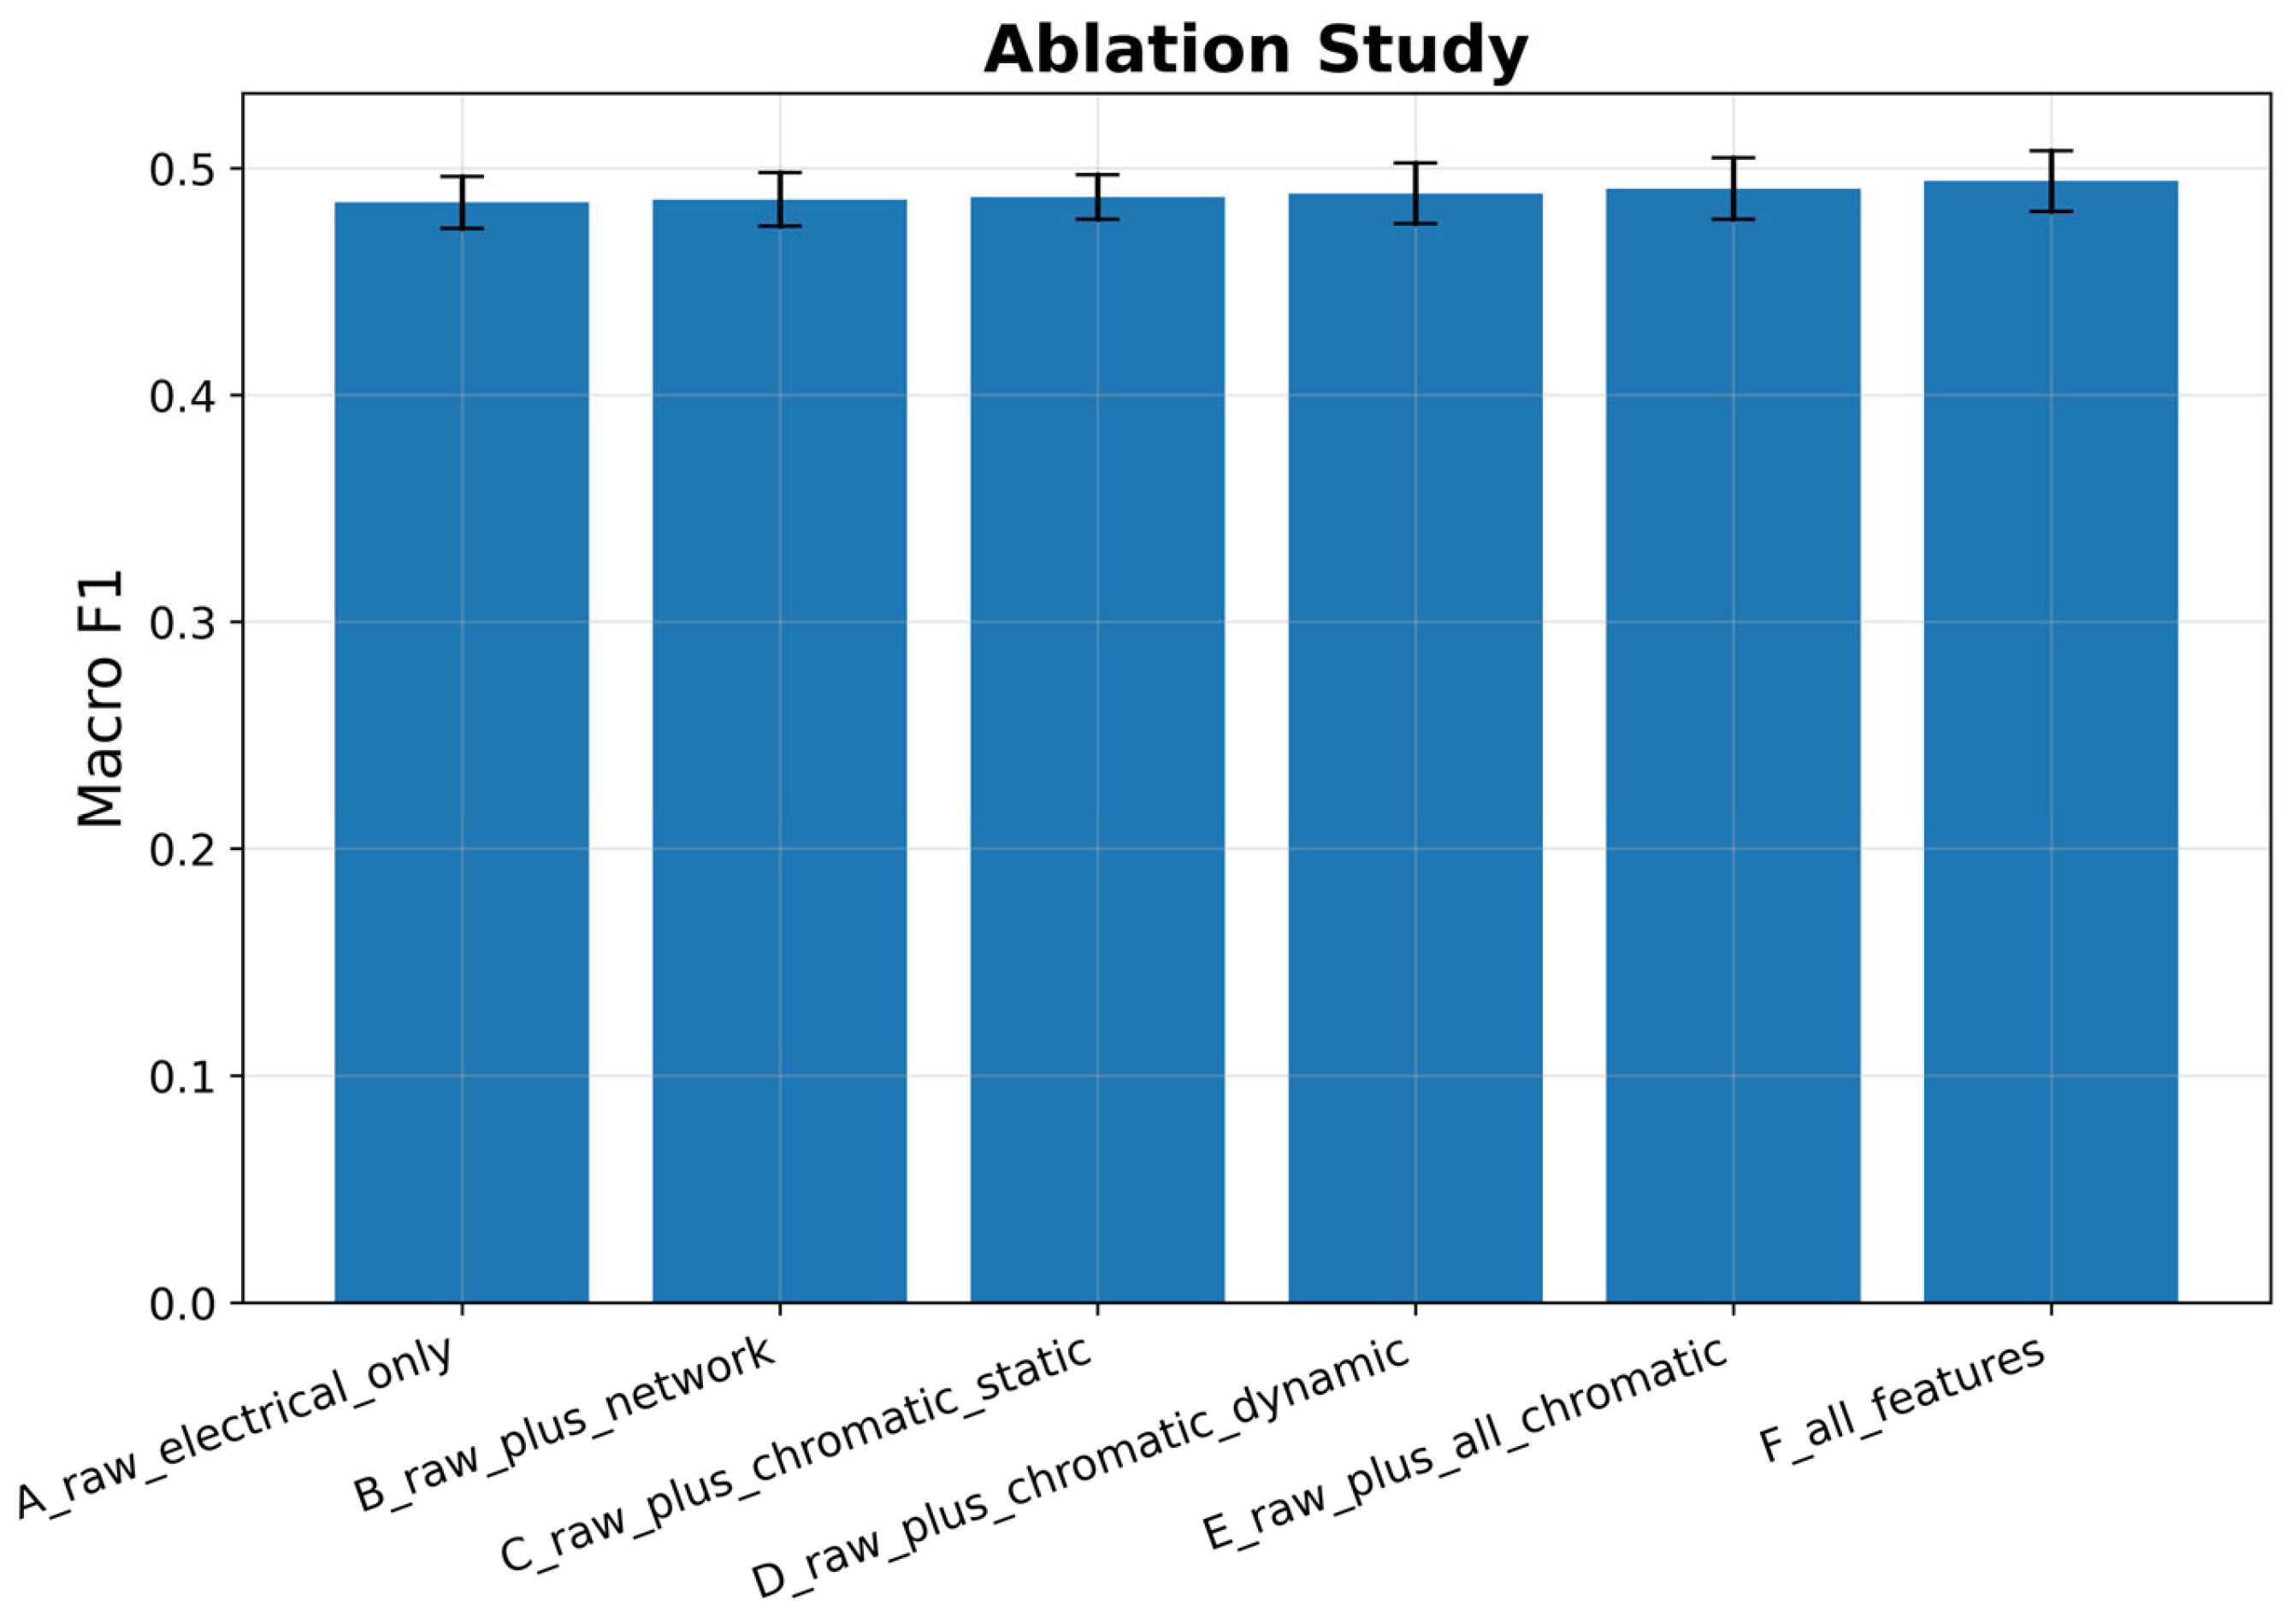
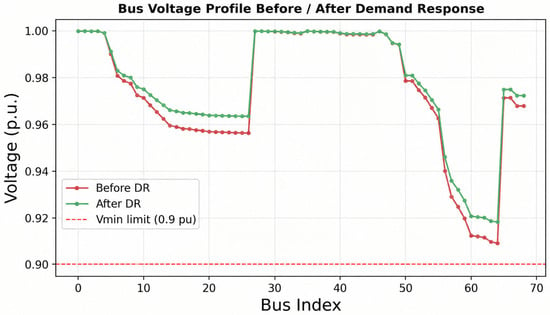
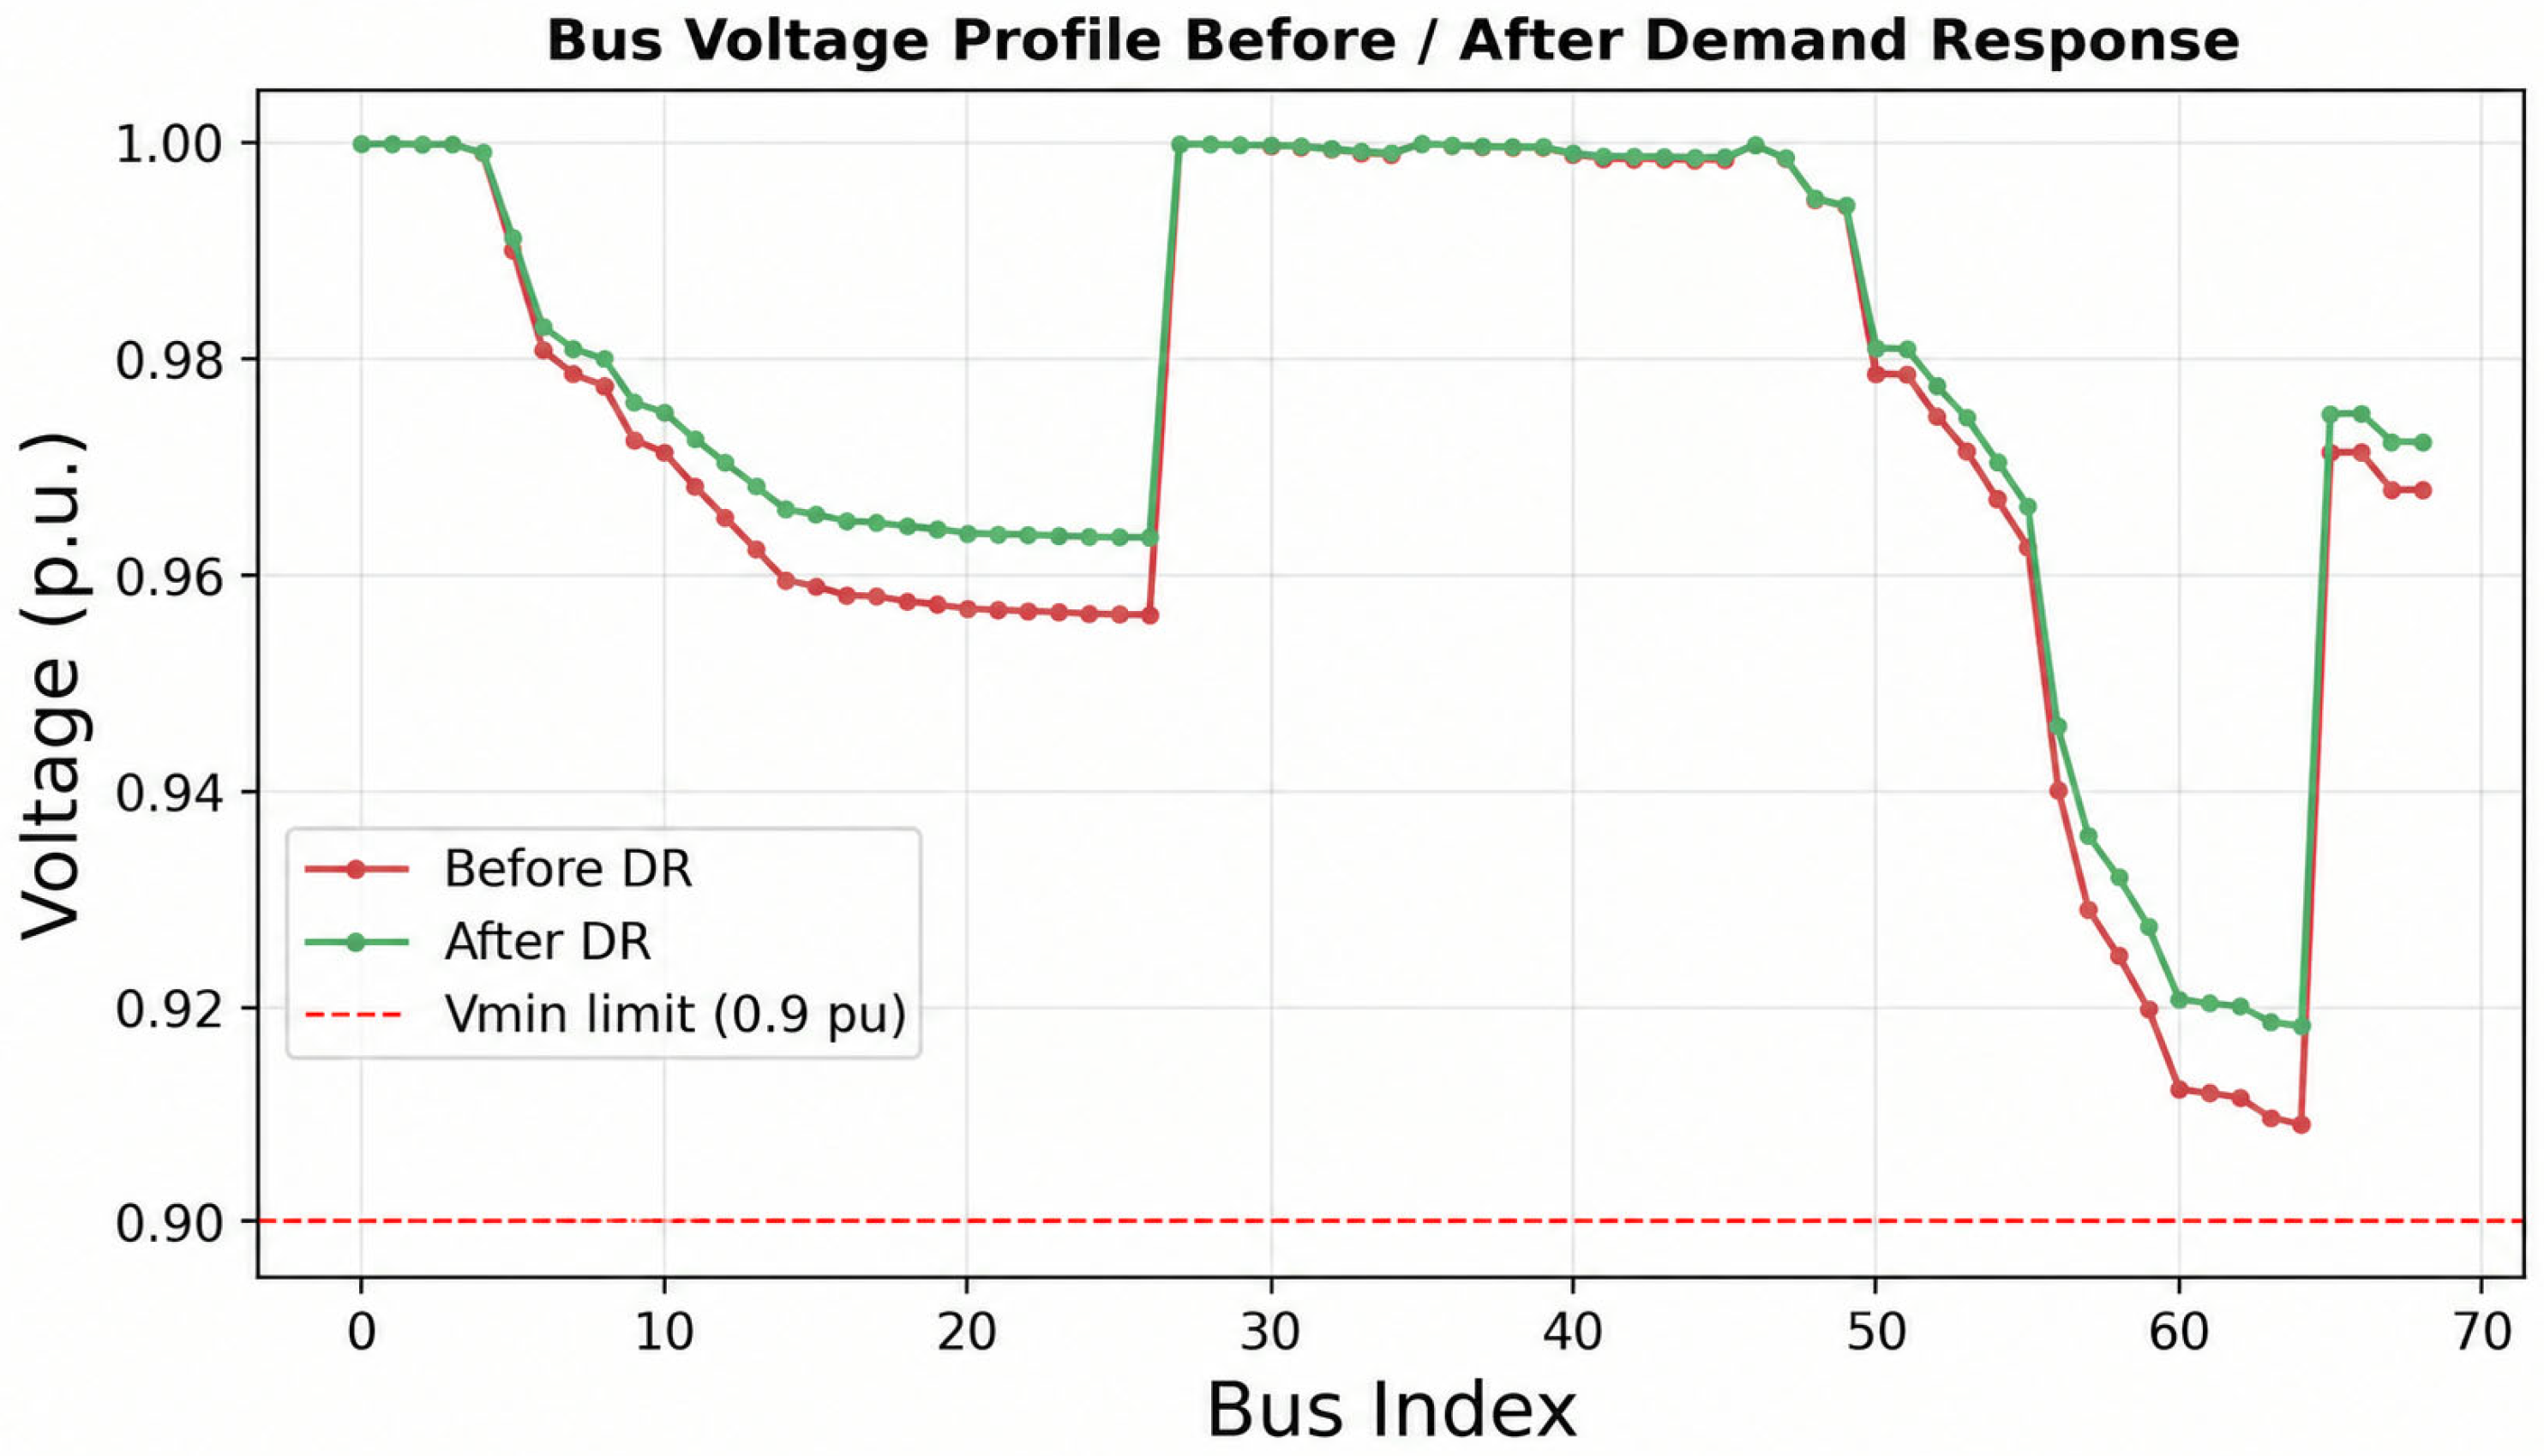
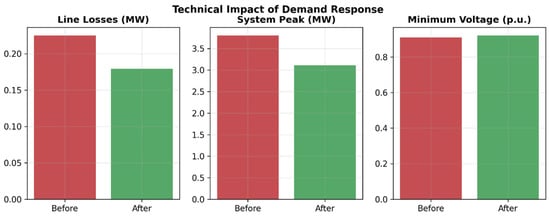
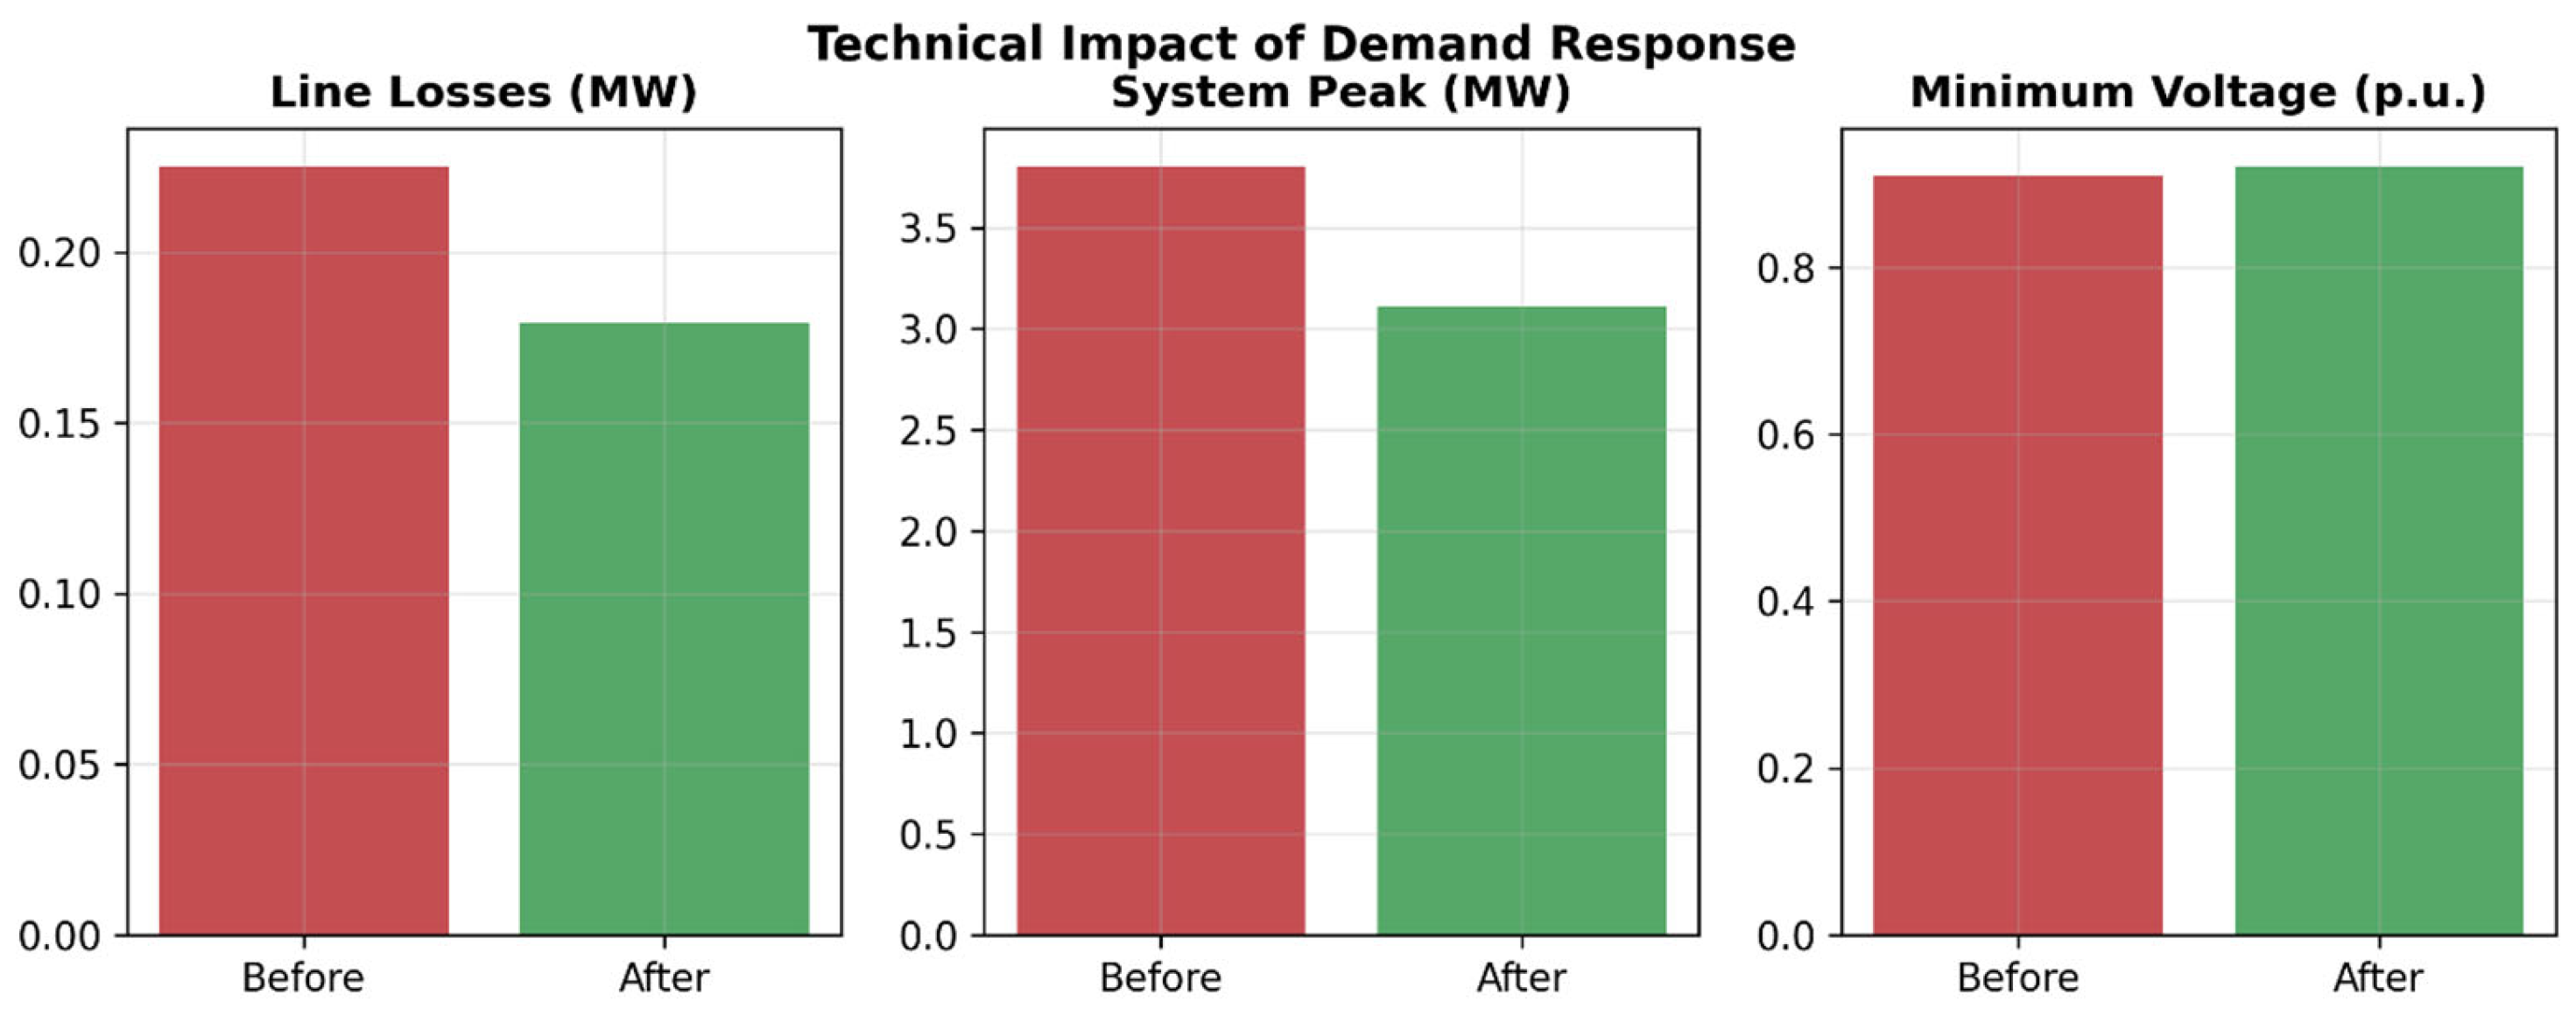
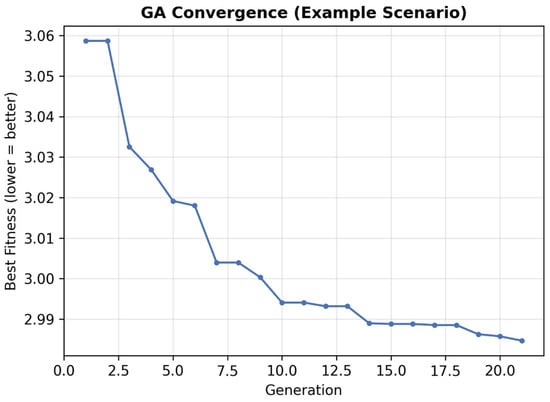
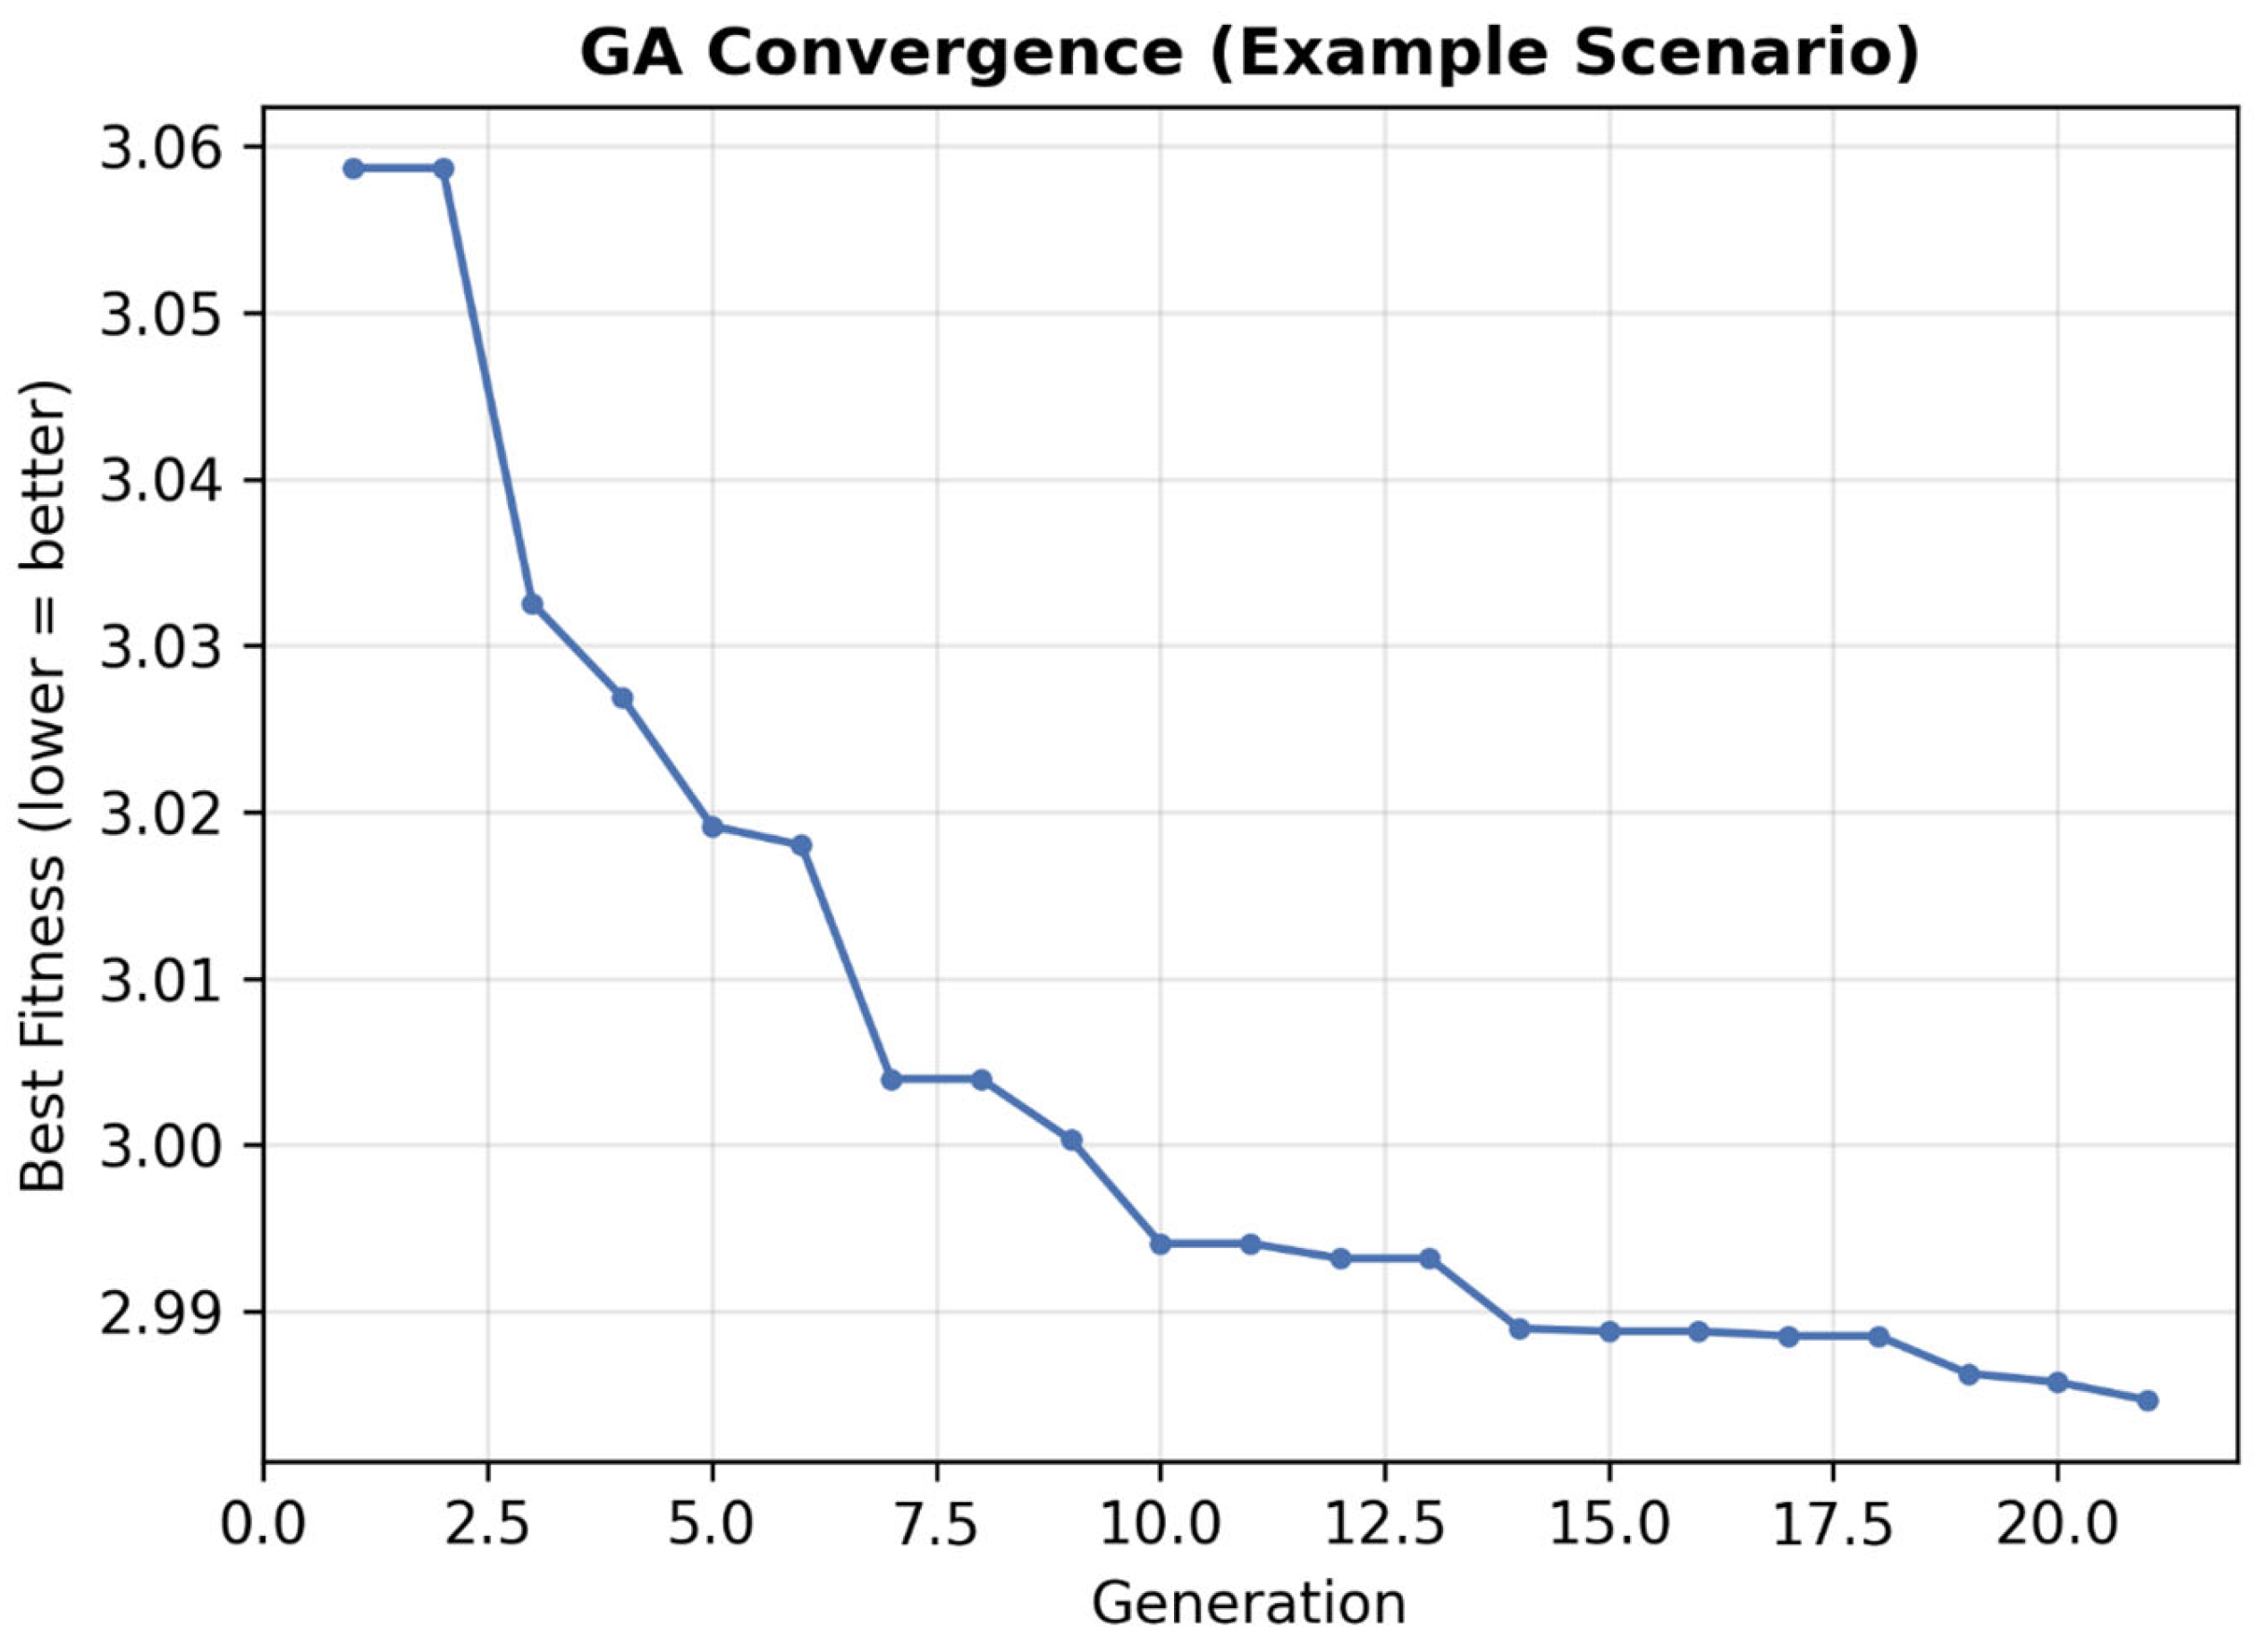
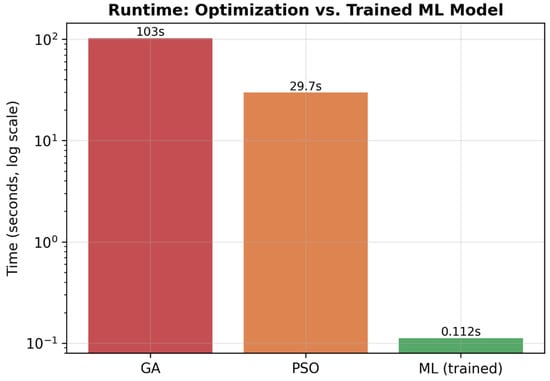
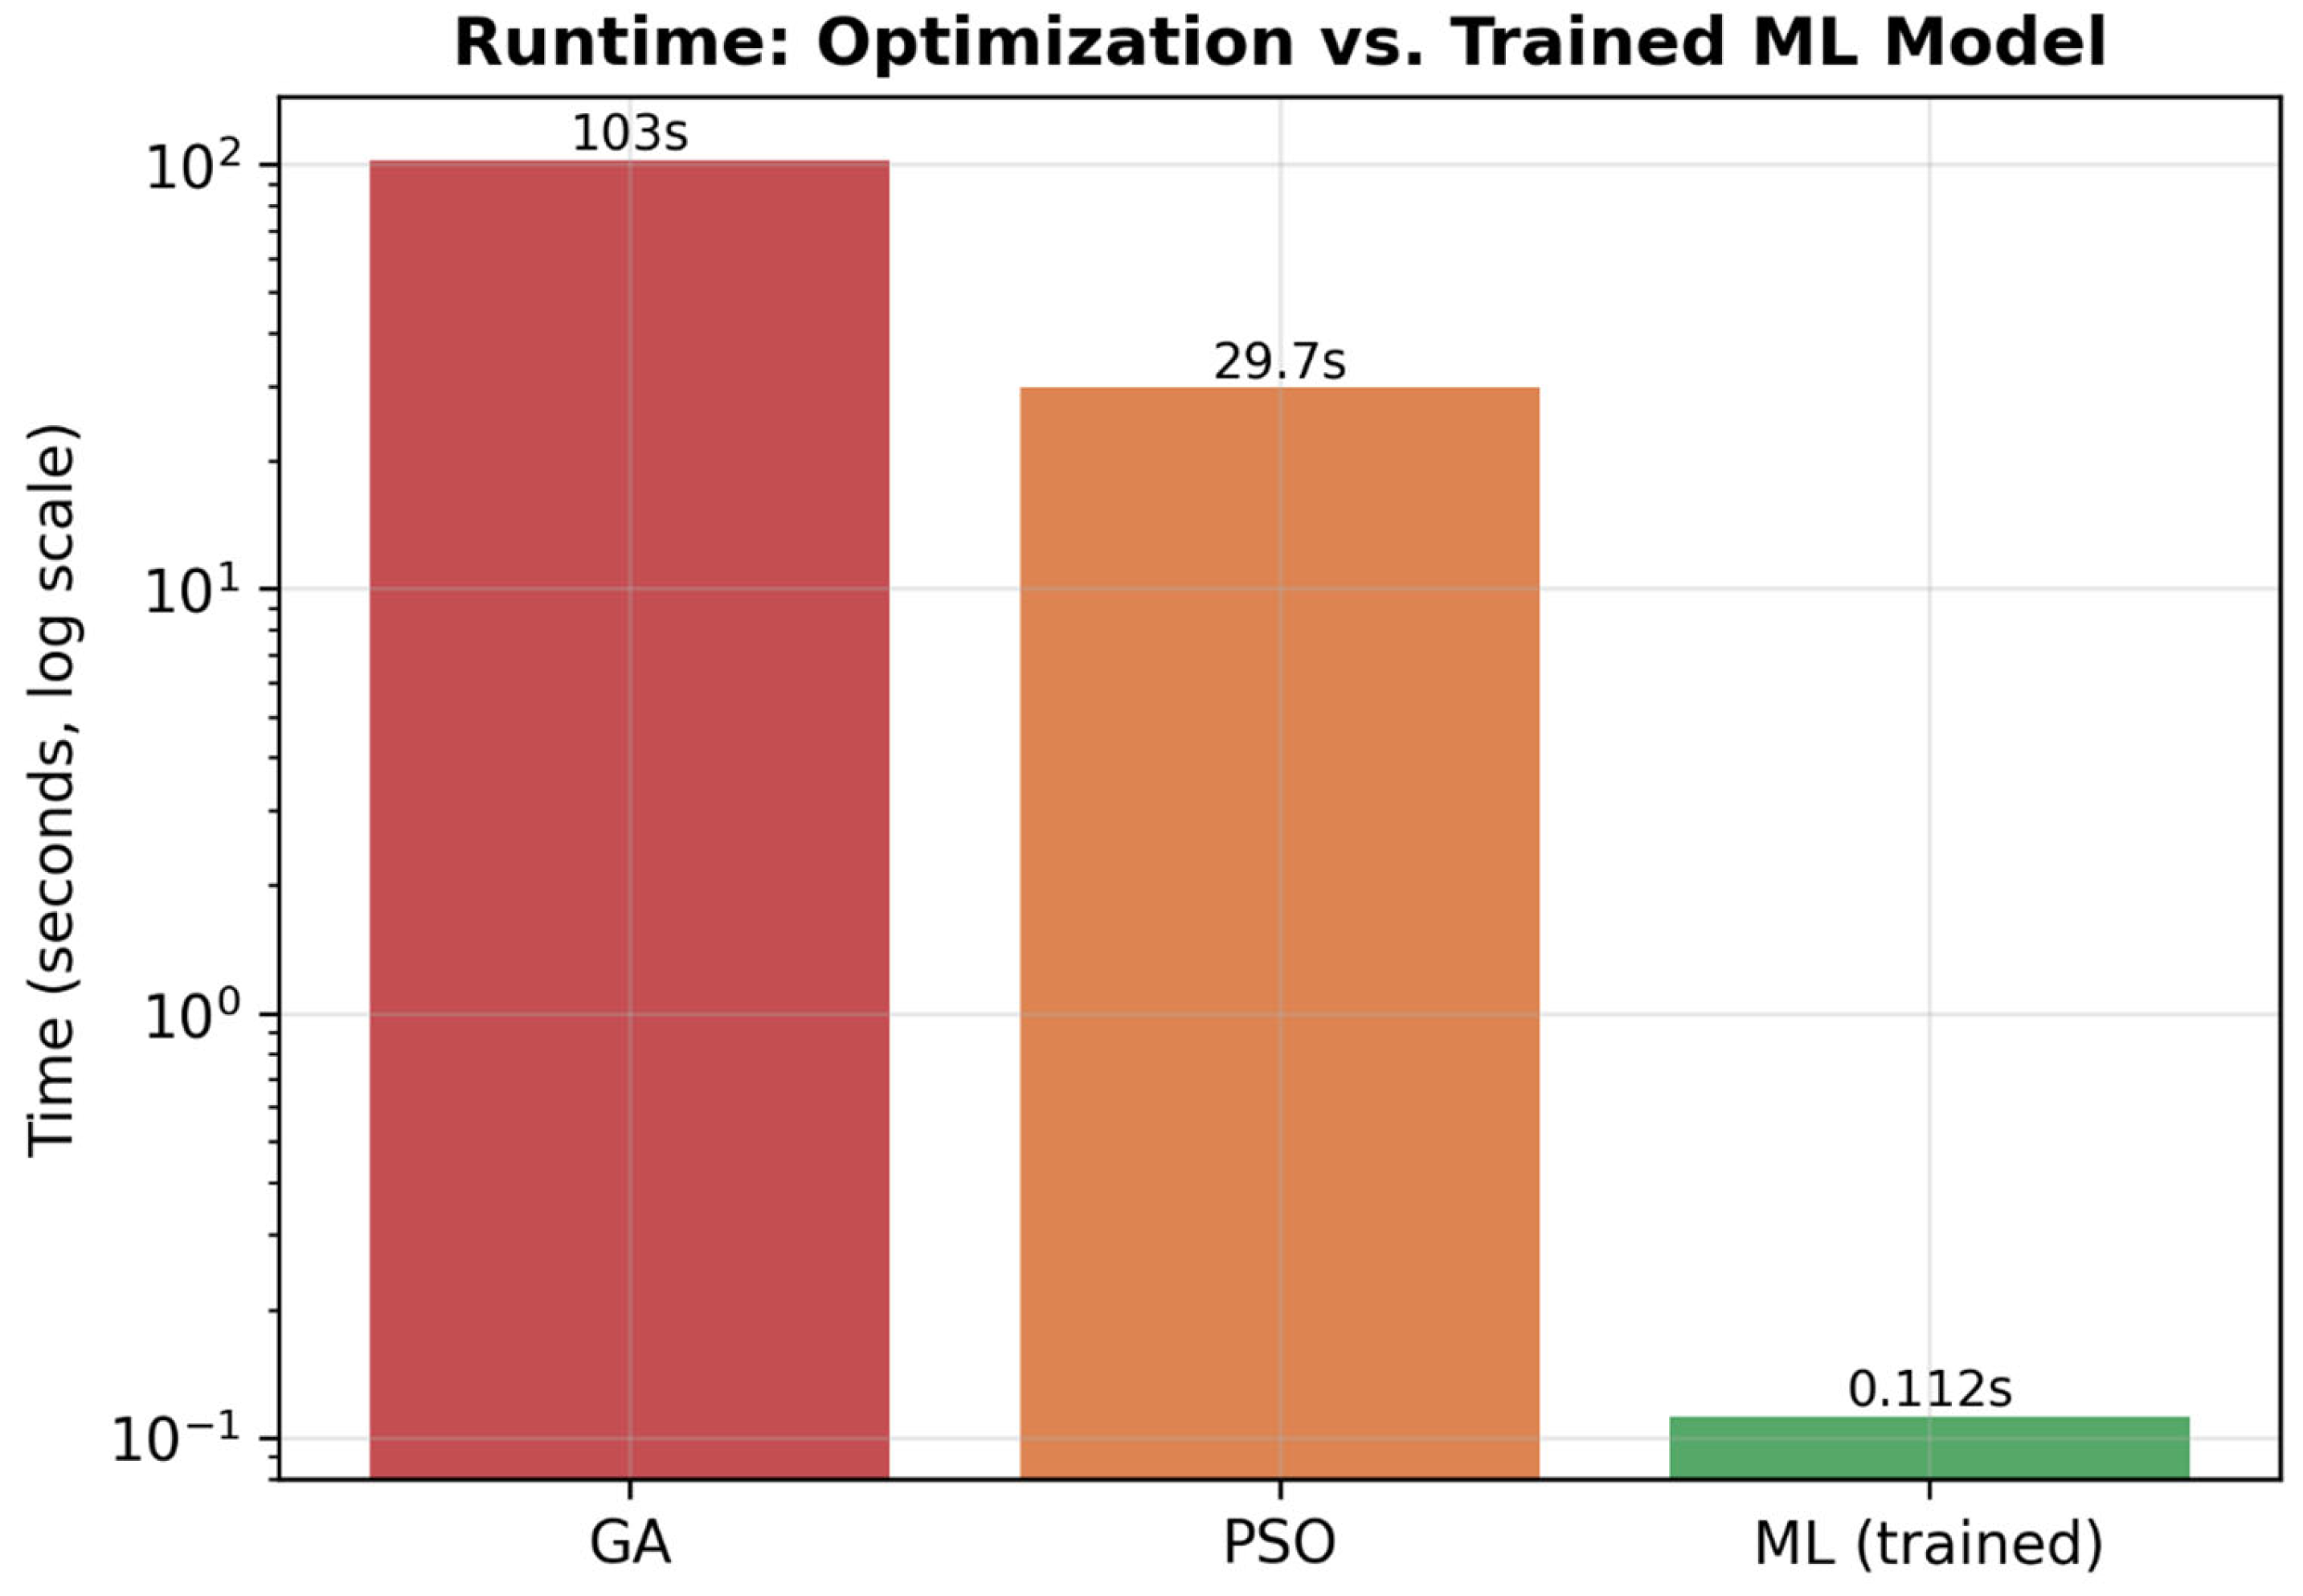
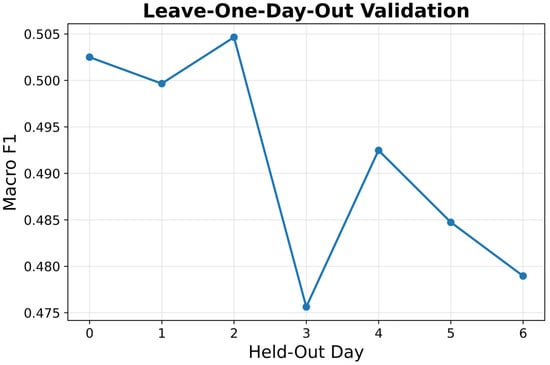
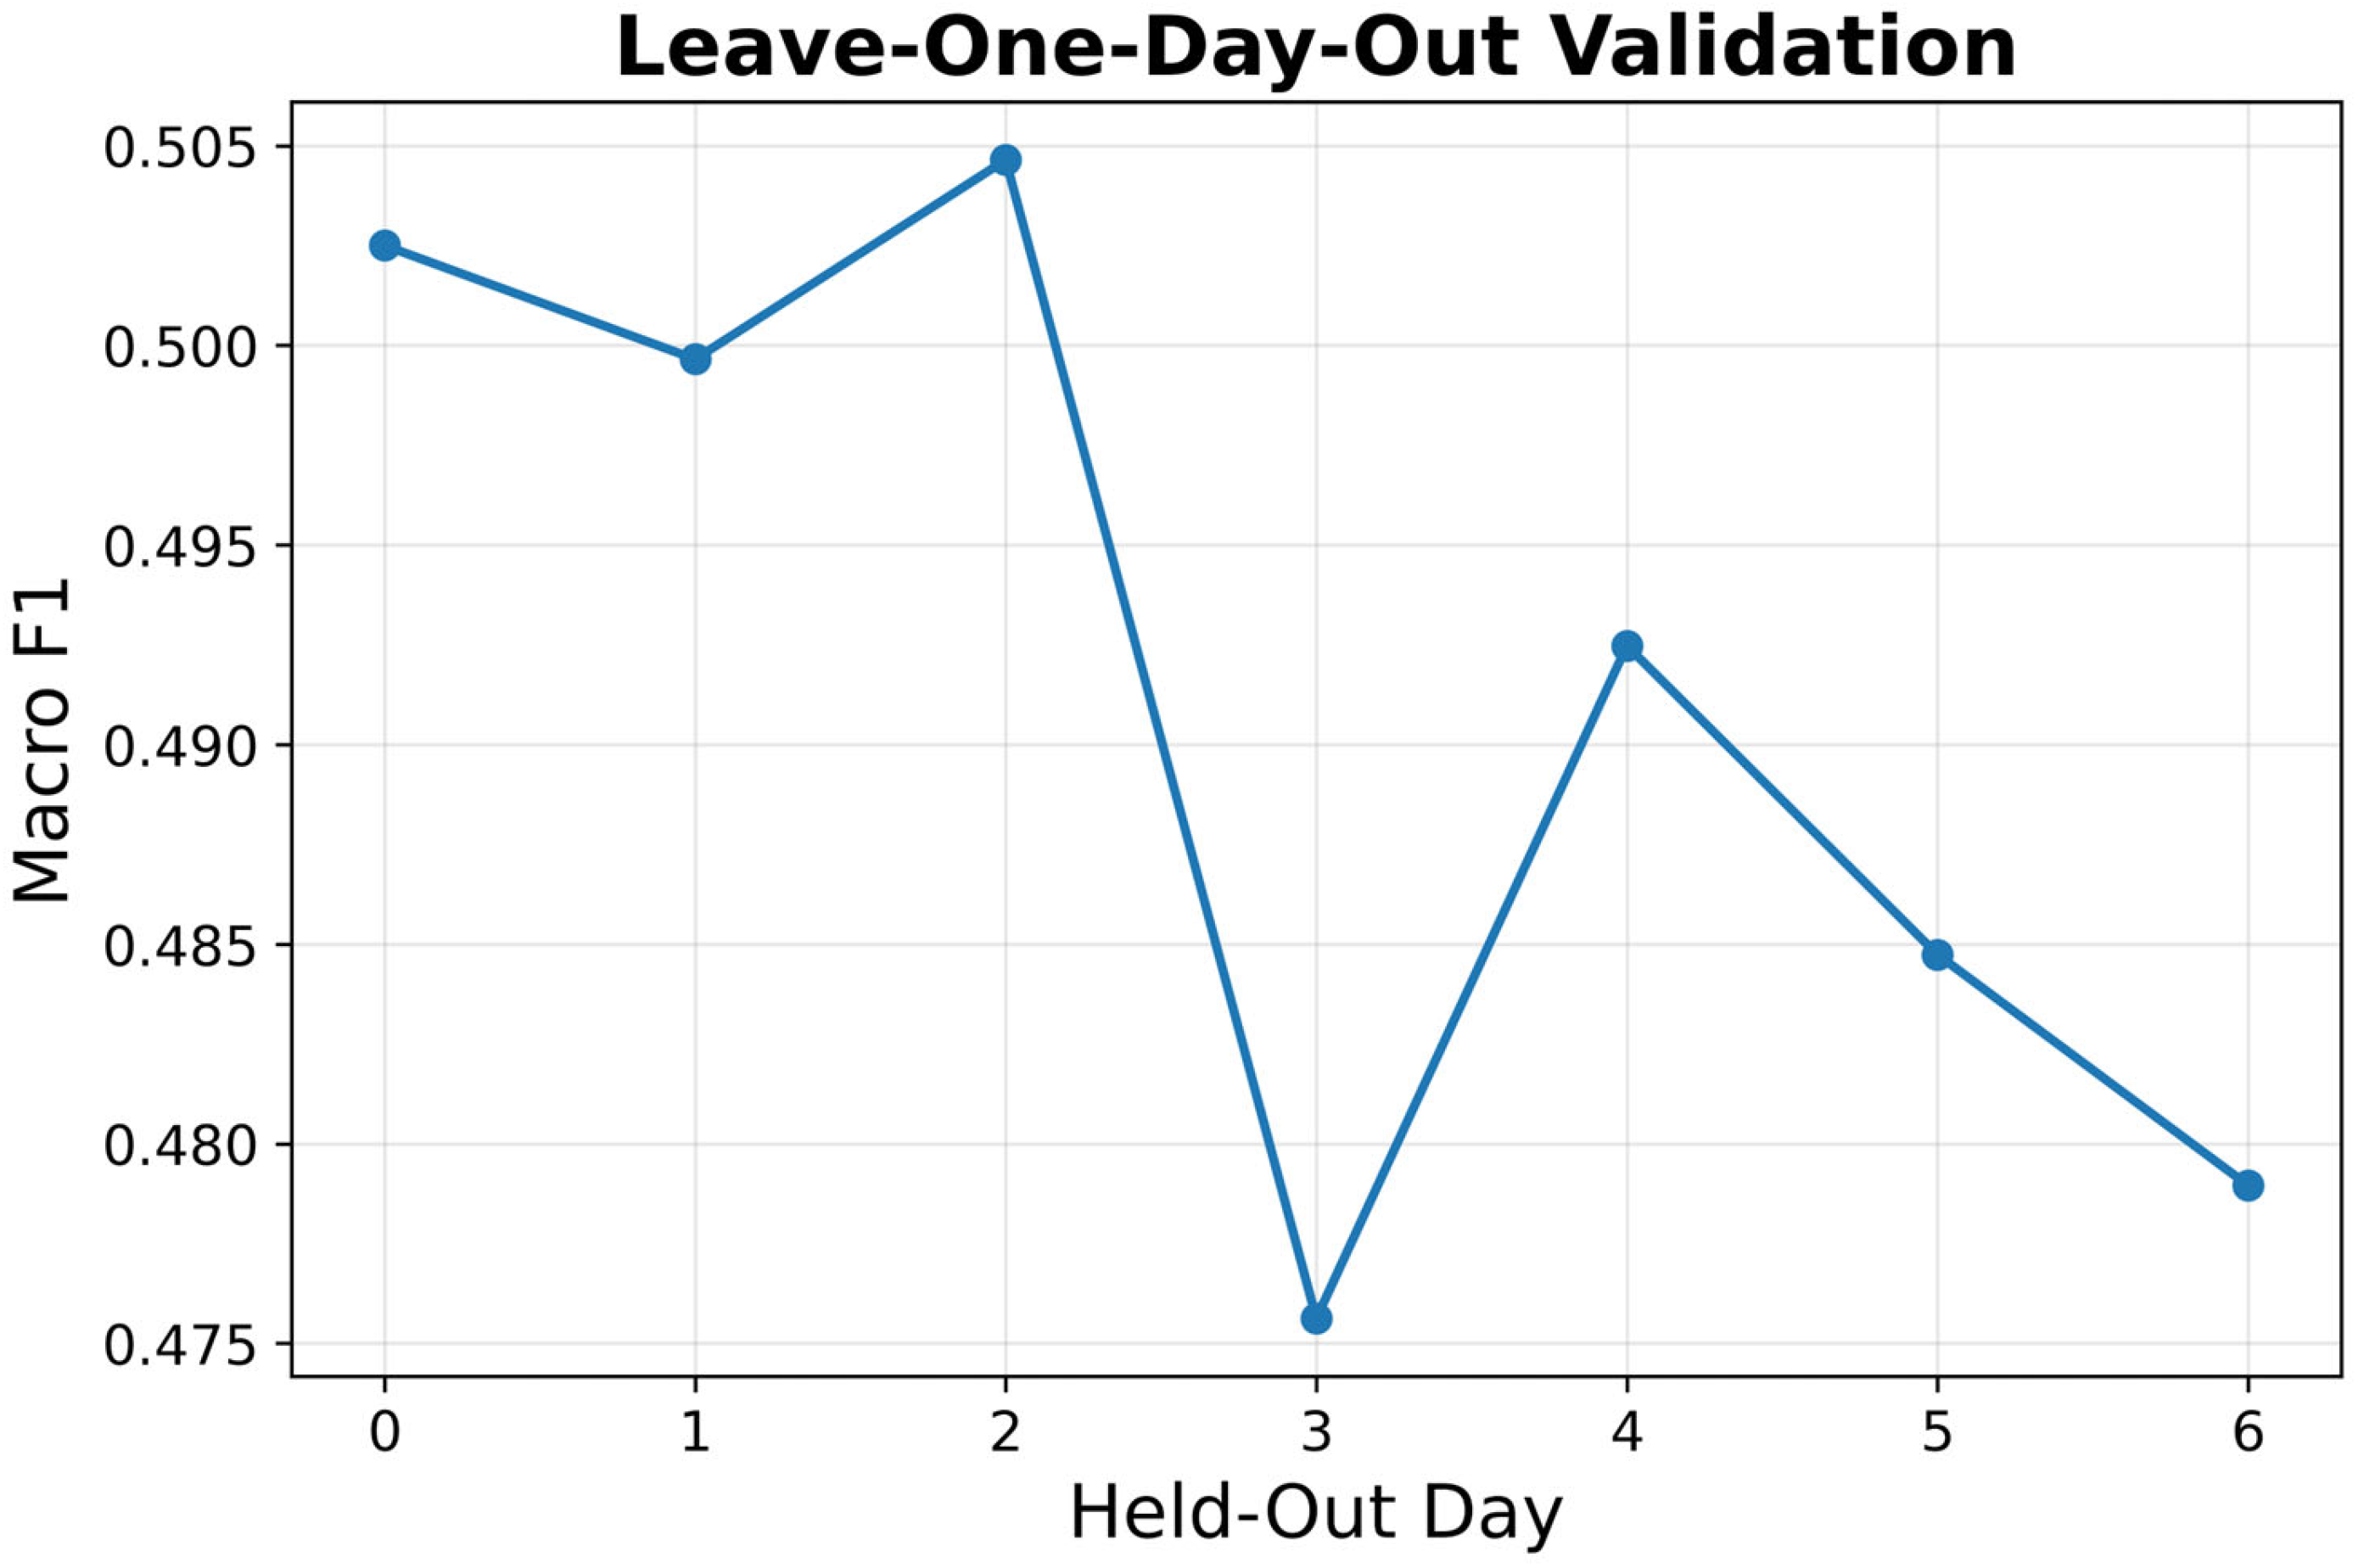
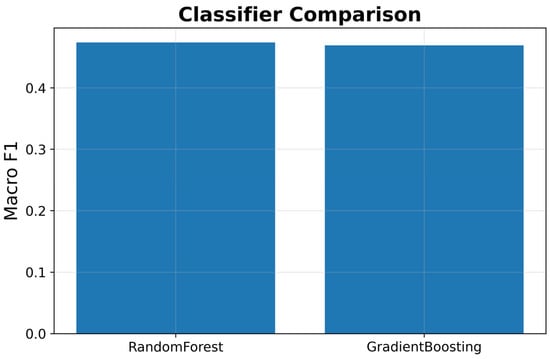
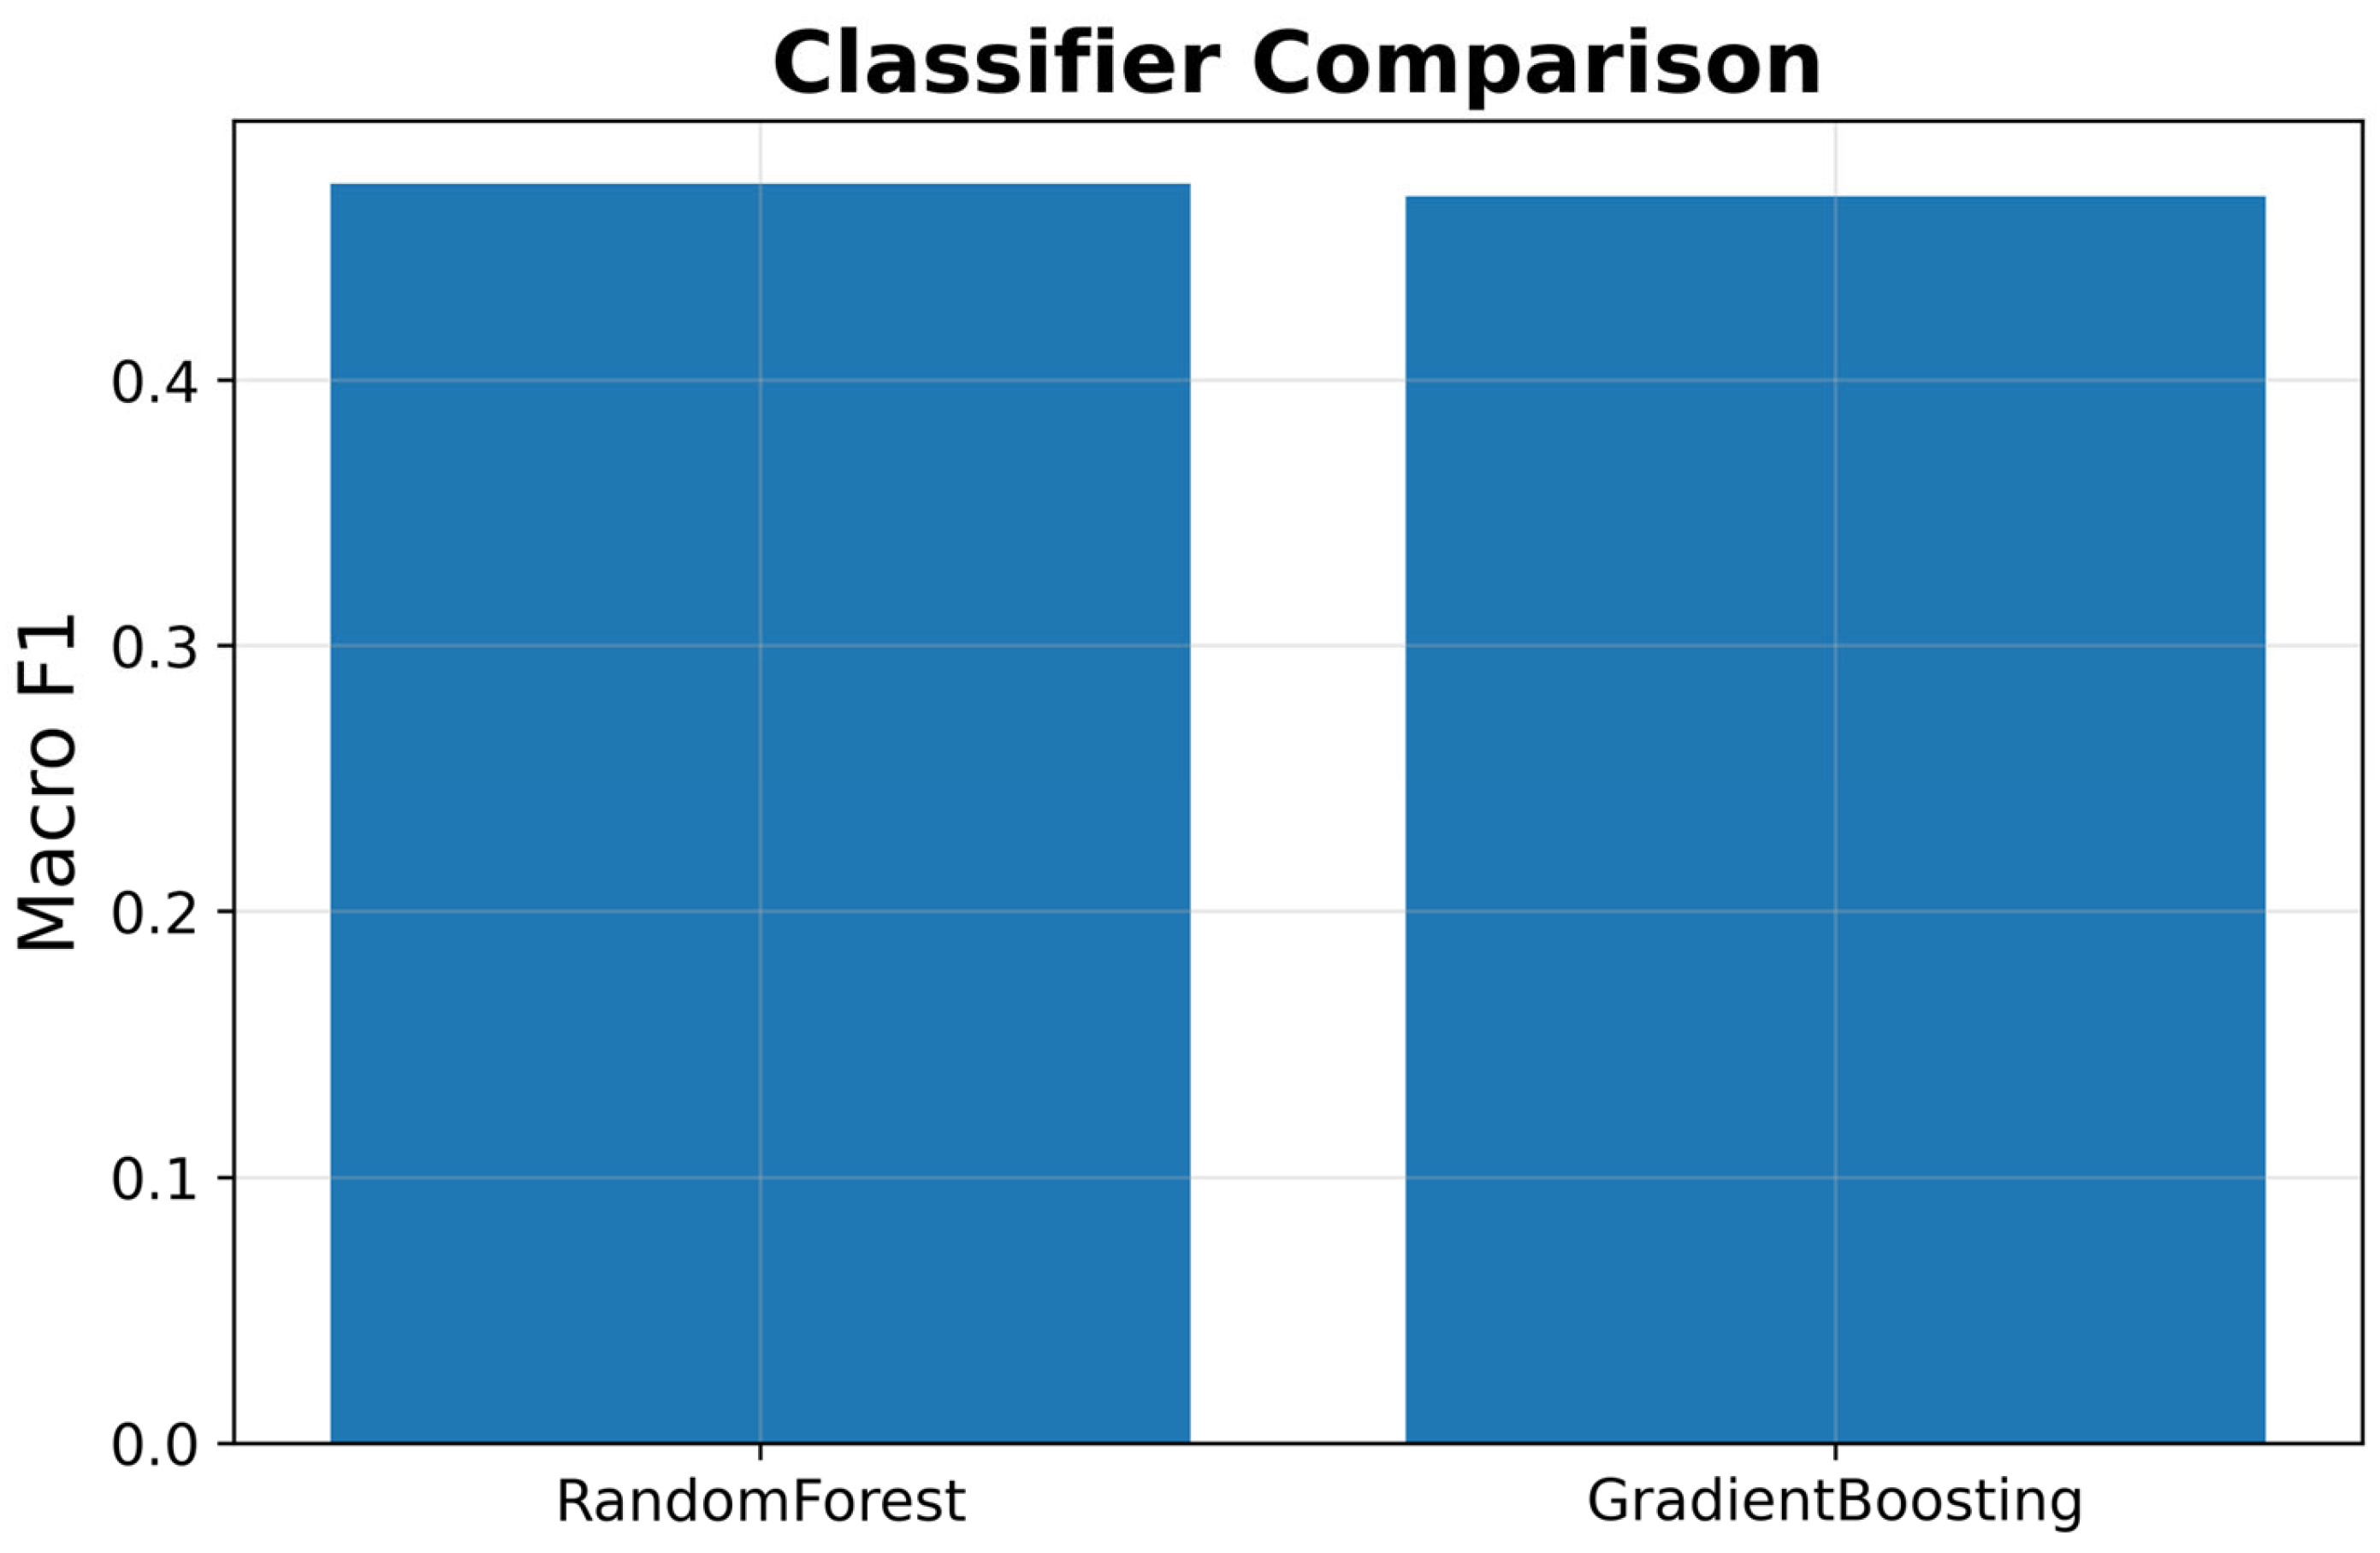
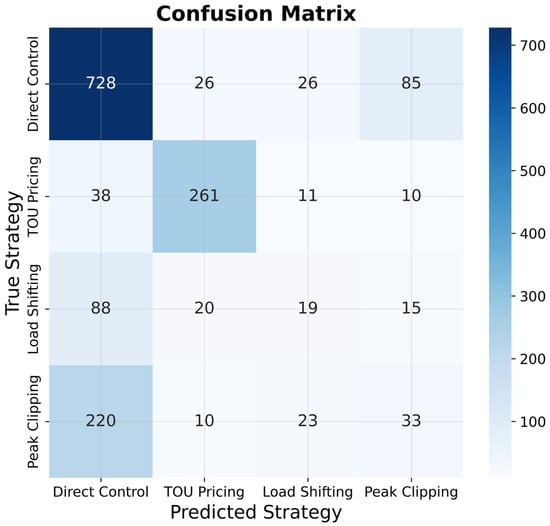
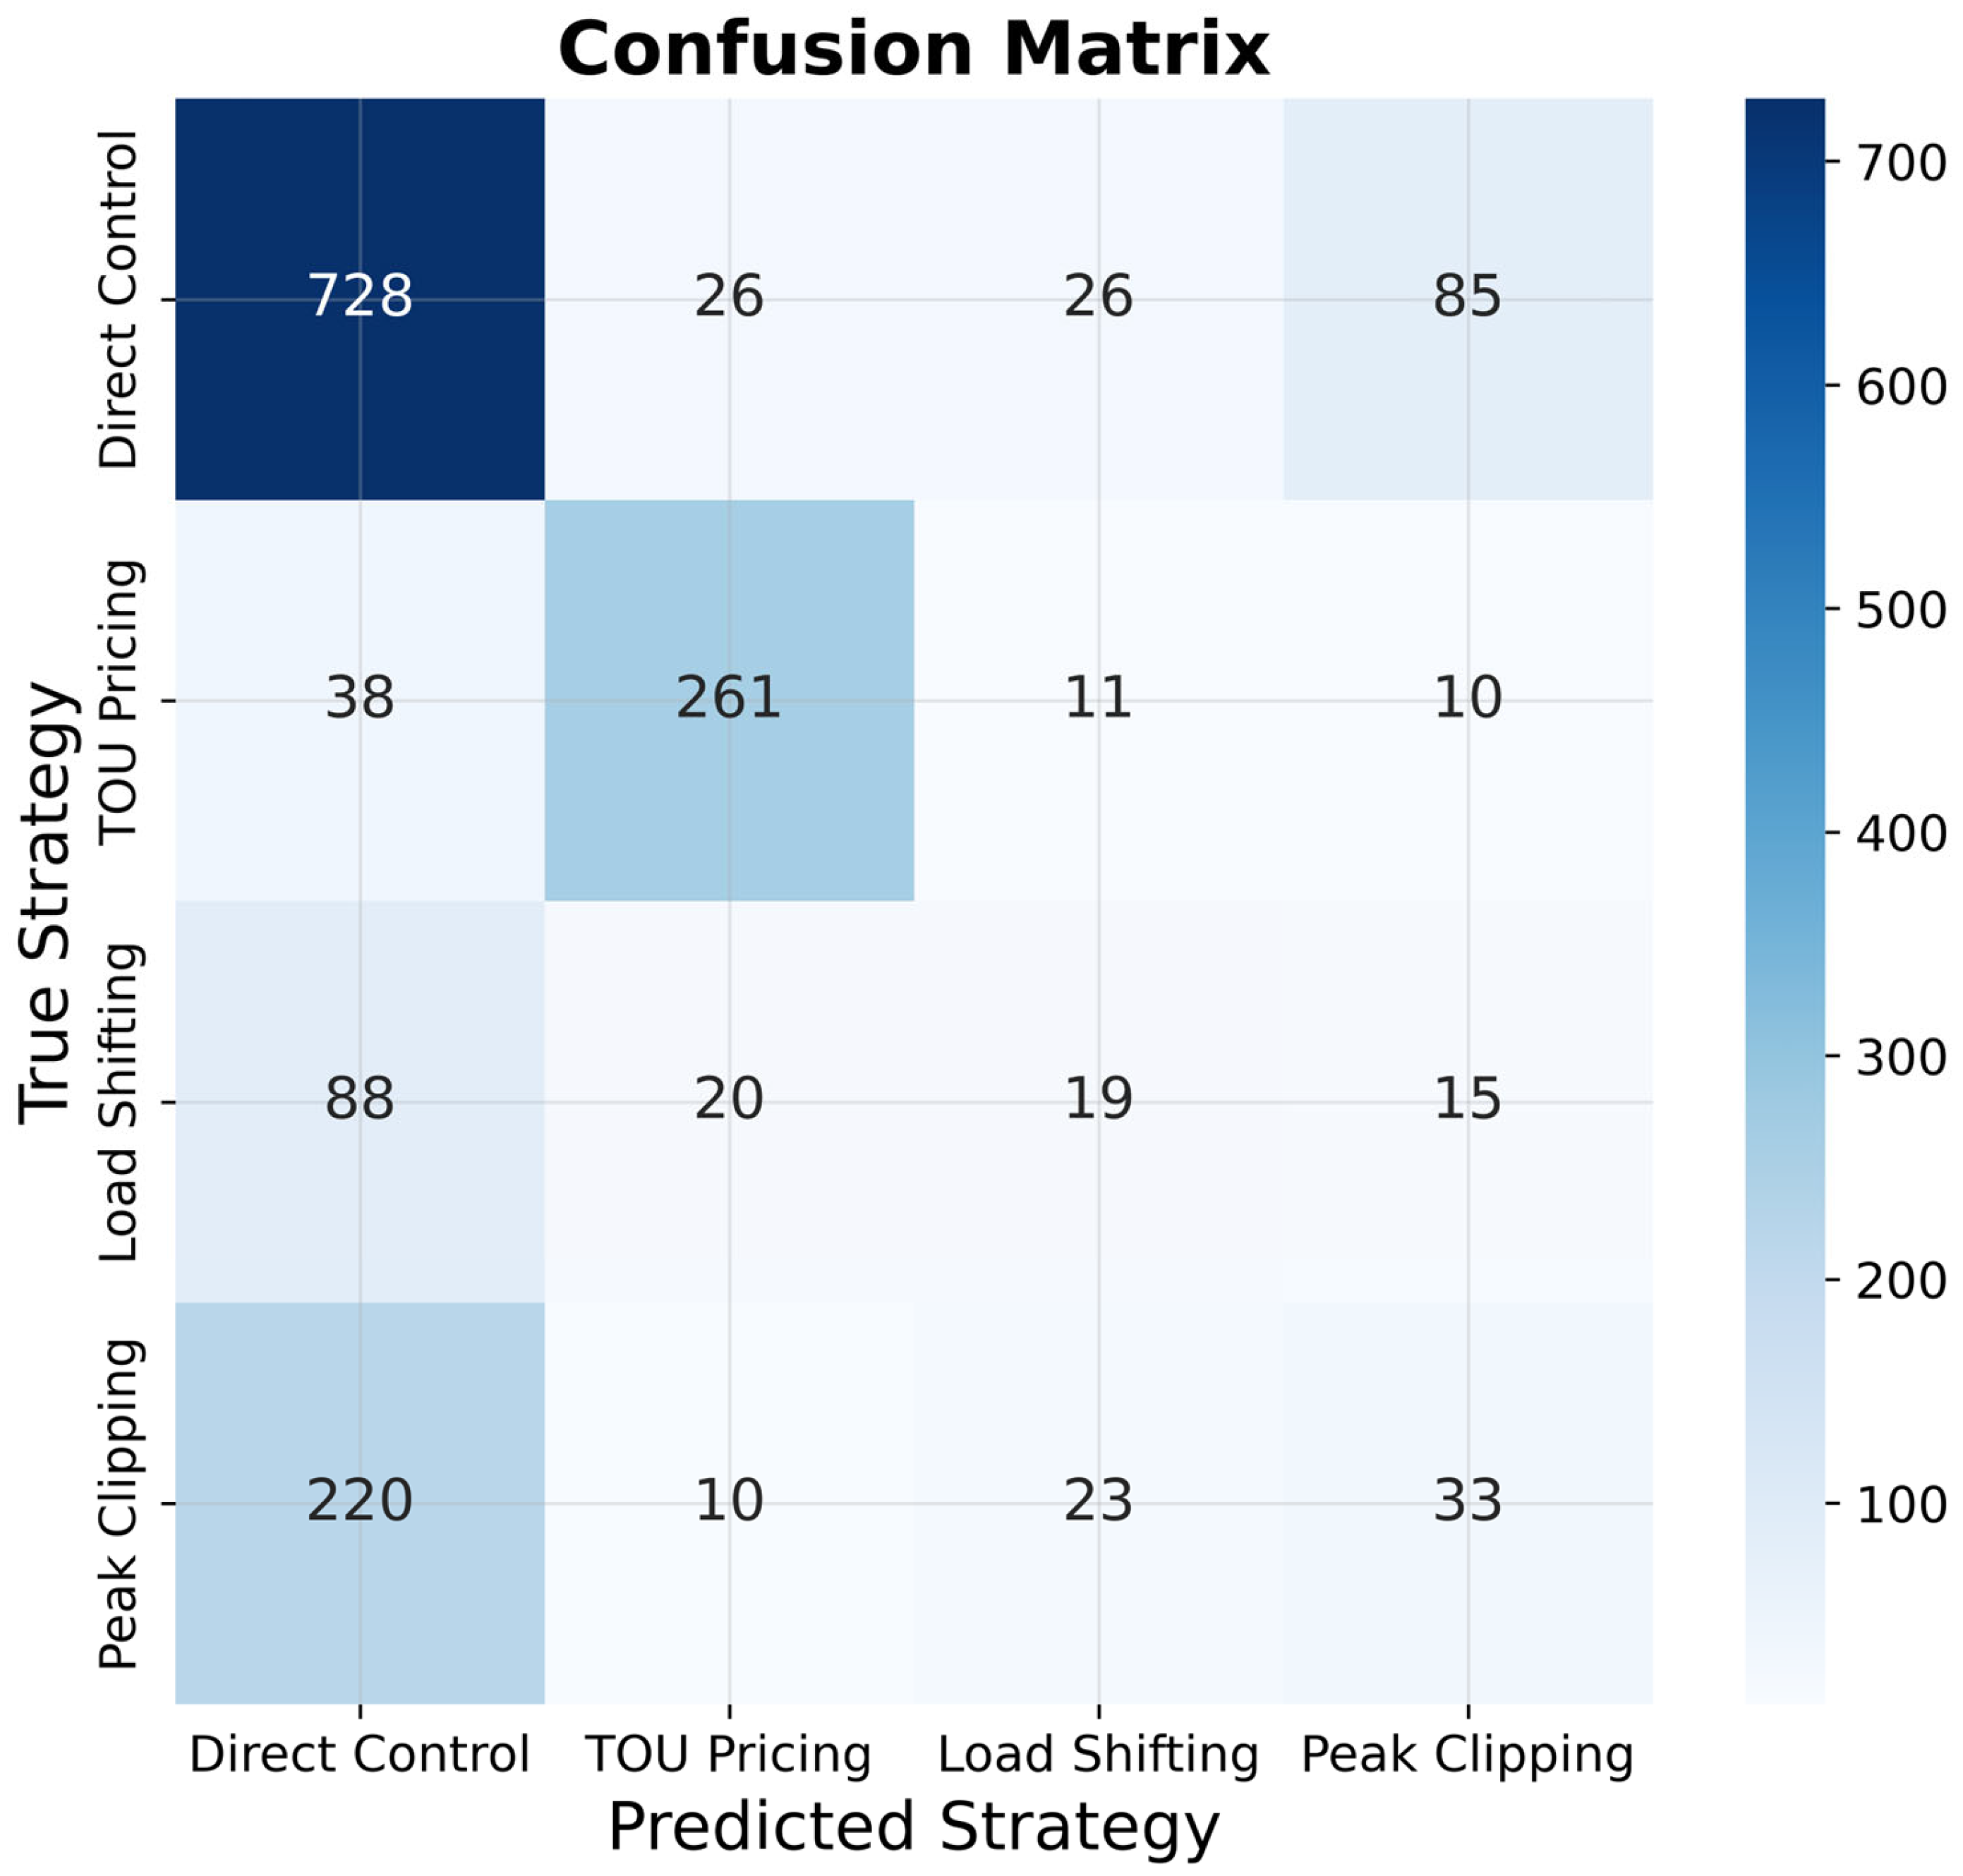

Disclaimer/Publisher’s Note: The statements, opinions and data contained in all publications are solely those of the individual author(s) and contributor(s) and not of MDPI and/or the editor(s). MDPI and/or the editor(s) disclaim responsibility for any injury to people or property resulting from any ideas, methods, instructions or products referred to in the content. |
© 2026 by the author. Licensee MDPI, Basel, Switzerland. This article is an open access article distributed under the terms and conditions of the Creative Commons Attribution (CC BY) license.