


Abstract
Most knowledge of polar corrosion comes from atmospheric exposure trials; in situ immersion data for Antarctic infrastructure are nearly absent, and immersion in glacier meltwater has, to our knowledge, not been previously reported. During the XXIX Ecuadorian Antarctic Expedition, ASTM A36 carbon steel coupons were immersed for up to three weeks at Pedro Vicente Maldonado Station (Greenwich Island) in two chemically contrasting waters, namely coastal seawater (34.3 PSU, 48.5 mS cm−1) and glacier meltwater (0.04 PSU, 79.3 µS cm−1; conductivities measured at 18–20 °C), which have an approximately 600-fold conductivity difference. Corrosion rates were determined gravimetrically (ASTM G1/G31) and cross-checked with open-circuit potential, linear polarization resistance (LPR), electrochemical impedance spectroscopy (EIS), and potentiodynamic polarization (PDP). Gravimetric rates showed no statistically significant difference between environments (47 ± 4 µm yr−1 in seawater versus 51 ± 9 µm yr−1 in glacier meltwater; Welch’s t-test, p = 0.28), directly contradicting the expectation that higher conductivity and chloride content would accelerate attack. Raw LPR suggested an apparent five- to ten-fold higher polarization resistance in glacier meltwater, but EIS showed that this was almost entirely uncompensated solution resistance (median Ru·A ≈ 14 kΩ cm2), whereas the EIS-derived polarization resistance was of the same order in both waters (median Rp·A ≈ 2.4 kΩ cm2 in seawater and 1.3 kΩ cm2 in glacier meltwater). PDP consequently underestimated the glacier corrosion rate (≈7 µm yr−1) due to IR-drop distortion of the Tafel slopes in the low-conductivity electrolyte. Scanning electron microscopy and energy-dispersive X-ray spectroscopy showed Fe- and O-rich corrosion products in both waters, but seawater forms a dense, continuous, and chloride- and sodium-bearing crust, while glacier meltwater forms sparse, isolated florets incorporating silicon from glacial rock flour and no detectable chlorine. The results show that, over a single Antarctic summer, glacier meltwater is not a benign environment for carbon steel and that gravimetric measurement, rather than uncorrected electrochemical techniques, is required to obtain reliable corrosion rates in low-conductivity polar waters.
1. Introduction
Steel infrastructure in Antarctica—piers, oceanographic moorings, and scientific-station structures—is routinely exposed to two very different types of water: coastal seawater and glacier meltwater draining directly from ice and exposed bedrock. Despite this dual exposure, almost all published polar corrosion data describe atmospheric exposure [1,2,3,4]; in situ immersion measurements remain scarce, and immersion specifically in glacier meltwater has, to the authors’ knowledge, not been previously documented. Foundational work under the Ibero-American Map of Atmospheric Corrosivity (MICAT) established baseline atmospheric corrosion rates for carbon steel and other reference metals at three Antarctic coastal sites, noting that the formation of ice over the metal surface for much of the year complicates the relationship between local climate and corrosion rate [1]. A related polar study at the Artigas Antarctic Scientific Base linked the atmospheric corrosion rate of carbon steel to airborne chloride deposition and wind-driven salinity transport [2], and a more recent 45-month exposure trial reported a first-year uncoated-steel corrosion rate of 85.64 µm yr−1, corresponding to a C5 (very high) ISO 9223 corrosivity category [3,5]. Mössbauer spectroscopy and X-ray diffraction studies of Antarctic atmospheric rust have shown it to be dominated by goethite (α-FeOOH) with substantial lepidocrocite (γ-FeOOH) [4]. Immersion data for carbon steel in fresh and low-conductivity waters come mainly from temperate rivers, estuaries, and industrial circuits: analysis of such field data indicates that salinity by itself does not clearly separate fresh-, brackish-, and seawater immersion corrosion, with temperature, pH, and water hardness being more influential [6], and studies in low-conductivity media have shown that electrochemical corrosion-rate estimates agree with gravimetry only when ohmic drop is explicitly treated [7,8]. No comparable data exist for polar meltwater. The present study addresses the immersion-data gap using one of the first in situ immersion corrosion campaigns on Antarctic infrastructure materials.
Field access in Antarctica is constrained to a single short window each year, the austral summer, during which both deployment and recovery of test coupons and electrochemical cells must take place. The two candidate waters differ enormously in ionic strength: seawater at Greenwich Island carries a salinity of 34.3 PSU and a conductivity of 48.5 mS cm−1, while adjacent glacier meltwater measures only 0.04 PSU and 79.3 µS cm−1, roughly 600 times less conductive. Classical corrosion theory predicts that the higher conductivity and abundant chloride content of seawater should drive a substantially faster attack of carbon steel than the comparatively dilute, chloride-poor meltwater. This study tests that expectation directly, using ASTM A36 carbon steel—a structural-grade representative of station and mooring hardware—immersed simultaneously in both waters under identical austral summer conditions.
2. Materials and Methods
2.1. Material and Site
ASTM A36 carbon steel coupons were used throughout (nominal composition, wt%, supplier datasheet: C 0.25–0.29, Mn 1.03, Si 0.28, Cu 0.20, P 0.040, S 0.050, Fe balance). Coupons were tested in the as-received, hot-rolled condition with the mill scale intact, without grinding, to represent structural steel as installed in the field; before exposure, they were cleaned with ethanol, dried, and weighed. Exposure was carried out at Pedro Vicente Maldonado Scientific Station, Greenwich Island, South Shetland Islands, during the austral summer campaign of the XXIX Ecuadorian Antarctic Expedition. Two immersion cells were deployed in parallel: one in coastal seawater and one in glacier meltwater draining from the adjacent ice field. The cells were static; the electrolyte was manually mixed four times per day, and the daily electrochemical measurements were performed after mixing. Water temperature in both cells ranged from −1 to 4 °C during exposure. Dissolved oxygen was not measured; for reference, air-saturation concentrations at these temperatures are approximately 13–15 mg L−1 for the meltwater and 10–12 mg L−1 for seawater [9]. Salinity and conductivity were measured on water samples at the station laboratory at 18–20 °C (seawater: 34.3 PSU, 48.5 mS cm−1; glacier meltwater: 0.04 PSU, 79.3 µS cm−1). As both waters were measured under the same conditions, their conductivity ratio (≈600×) is representative, although absolute in situ conductivities at −1 to 4 °C are lower.
2.2. Gravimetric Measurements
Mass-loss corrosion rates were obtained following ASTM G1 [10] (cleaning of corrosion products) and ASTM G31 [11] (rate calculation, K = 8.76 × 10⁴). Nine coupons per water were deployed, with triplicate coupons retrieved after 8, 16, and 25 days, allowing both an end-point rate and a time-resolved mass-loss trend to be obtained for each environment. Gravimetric coupons (35 cm2 exposed area) were immersed unmasked. Differences between environments were assessed with Welch’s t-test, and outliers were tested with Grubbs’ test (all nine coupons per water) and Dixon’s Q-test (within each triplicate) at α = 0.05.
2.3. Electrochemical Measurements
Four three-electrode cells (two per water, designated SW-1/SW-2 for seawater and GL-1/GL-2 for glacier meltwater) were instrumented with a PalmSens4 potentiostat (PalmSens BV, Houten, The Netherlands) using an A36 coupon as the working electrode (exposed area 14.4–18.9 cm2, edges and non-test areas masked with lacquer), a platinum counter electrode, and a Ag/AgCl reference electrode placed directly in the electrolyte without a Luggin capillary. At each measurement time point, the open-circuit potential (OCP) was recorded until stable, followed by linear polarization resistance (LPR) and electrochemical impedance spectroscopy (EIS); potentiodynamic polarization (PDP) was recorded once, at the end of the exposure. All measurements were referenced to the OCP. LPR was recorded from −10 to +10 mV vs. OCP at 0.16 mV s−1 (1 mV step), in line with ASTM G59 [12]; EIS was measured at OCP with a 10 mV sinusoidal perturbation from 10 kHz to 10 mHz (56 frequencies, ≈9 per decade); and PDP was recorded from −300 to +300 mV vs. OCP at 0.16 mV s−1. EIS spectra were fitted to a Ru + (Rp ‖ CPE) equivalent circuit (CPE, constant phase element) by complex nonlinear least squares with modulus weighting (Python/SciPy (3.13/SciPy 1.18) [13] to separate the uncompensated solution resistance (Ru) from the EIS-derived polarization resistance (Rp). In this single-time-constant model, Rp lumps the charge-transfer resistance and any contribution from the corrosion-product layer. Ru was not compensated during measurement; it was quantified from the high-frequency limit of each spectrum and treated in the analysis. Resistances are reported normalized to the exposed area (Ω cm2).
2.4. Surface and Corrosion-Product Characterization
Recovered coupons were examined by scanning electron microscopy (SEM) on a Phenom desktop system (Thermo Fisher Scientific, Eindhoven, The Netherlands), with energy-dispersive X-ray spectroscopy (EDX) used to map elemental distribution across corrosion-product morphologies. Imaging was performed at matched magnifications across both environments to allow for a direct visual comparison of crust coverage and morphology. EDX quantification was carried out over 55 maps spanning both environments (including 18 glacier-side maps), recording at minimum the Fe, O, Cl, Na, and Si content of each corrosion-product region. As-received coupons were also imaged as a reference for the initial, mill-scaled surface.
3. Results
3.1. Gravimetric Corrosion Rates
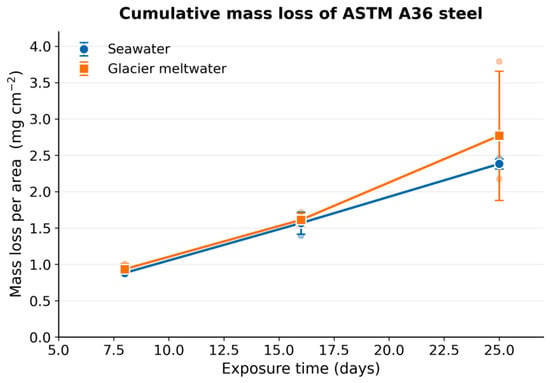
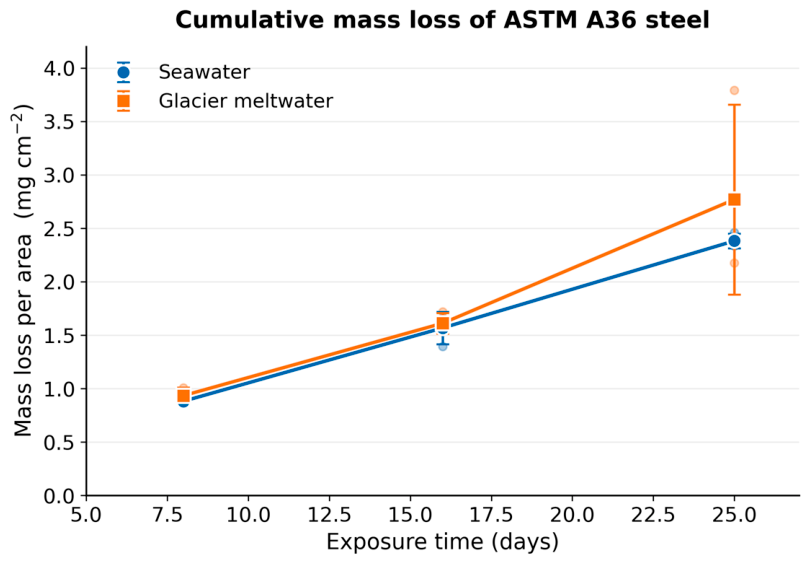
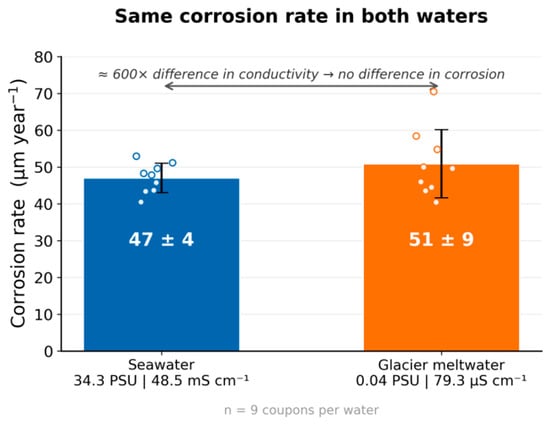
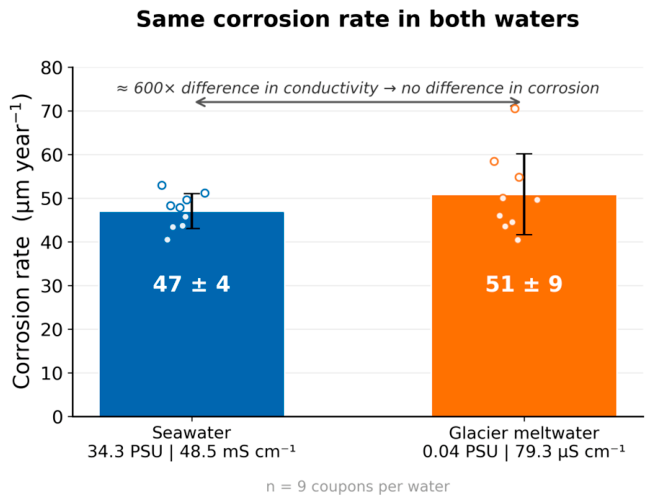
Cumulative mass loss increased in close step in both waters over the three-week exposure (Figure 1), and the resulting corrosion rates (mean ± SD, n = 9 per water) did not differ significantly: 47 ± 4 µm yr−1 in seawater versus 51 ± 9 µm yr−1 in glacier meltwater (Welch’s t-test, p = 0.28; Figure 2). This result runs counter to the original hypothesis that the ~600-fold higher conductivity of seawater would produce a measurably faster attack. One glacier coupon (MG8, 25 days) lost about 1.7 times more mass than the other two coupons of its triplicate. It was not identified as an outlier by Grubbs’ test (G = 2.12 < Gcrit = 2.22, n = 9) or by Dixon’s Q-test within its triplicate (Q = 0.90 < Qcrit = 0.97, n = 3), and it is therefore retained in all reported values. Excluding it would give 48 ± 6 µm yr−1 for glacier meltwater (n = 8; p = 0.59 versus seawater), so the conclusion is unaffected. Its higher loss most plausibly reflects the local variability of the as-received, mill-scaled surface, where breaks in the scale concentrate attack; this was not verified directly.
Figure 1.
Cumulative mass loss of ASTM A36 coupons versus exposure time in seawater and glacier meltwater.
Figure 2.
End-point gravimetric corrosion rate (ASTM G1/G31) in seawater and glacier meltwater, n = 9 coupons per water (three per retrieval time); bars show mean ± SD and symbols show individual coupons.
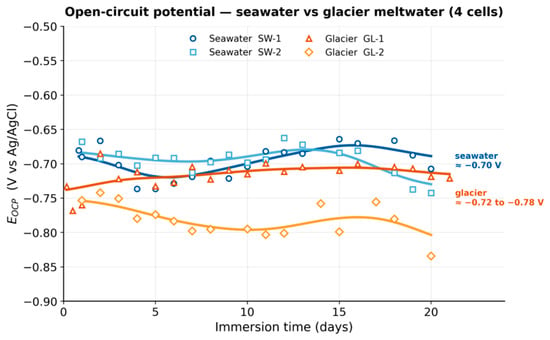
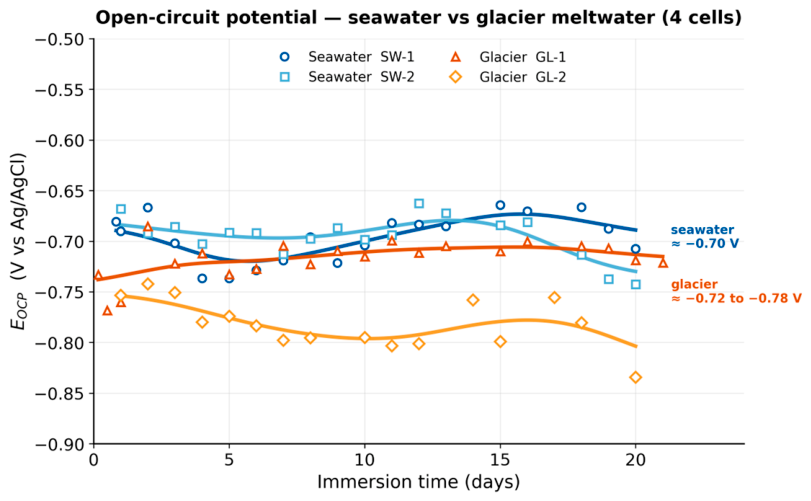
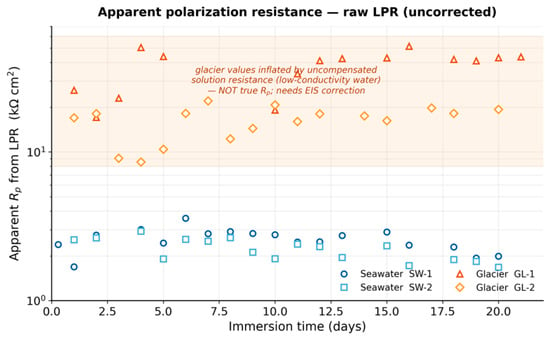
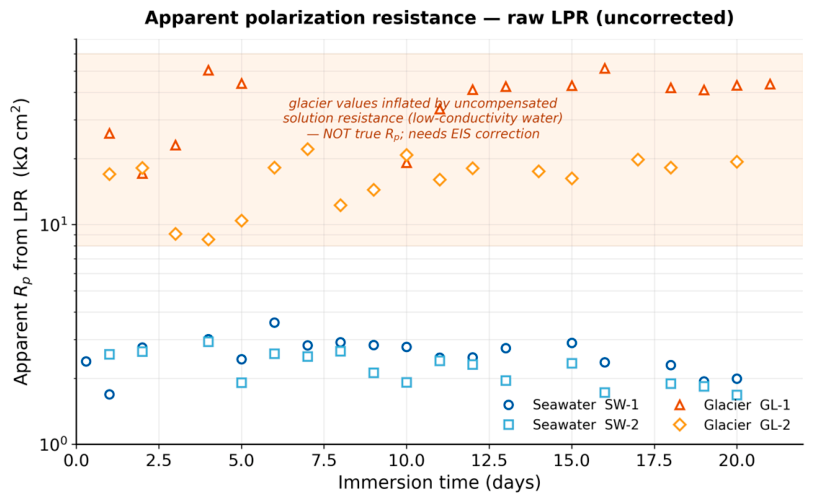
All four cells showed open-circuit potentials consistent with active, uninhibited corrosion, settling in a narrow, stable band over the full immersion period for each water (Figure 3). Raw LPR data, however, told an apparently contradictory story: the apparent polarization resistance in glacier meltwater tracked roughly five-to-ten times higher than in seawater throughout the exposure (Figure 4), a result that, taken at face value, would imply substantially slower corrosion in the meltwater, directly contradicting the comparable gravimetric rates reported above. Table 1 summarizes the OCP and raw apparent LPR ranges recorded for each cell.
Figure 3.
Open-circuit potential (OCP) versus immersion time for the two seawater cells (SW-1, SW-2) and two glacier meltwater cells (GL-1, GL-2).
Table 1.
Summary of open-circuit potential and raw apparent LPR by cell.
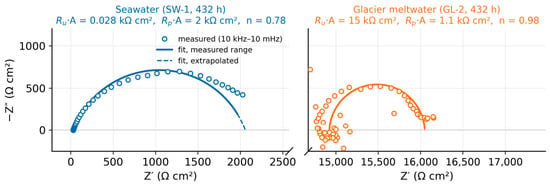
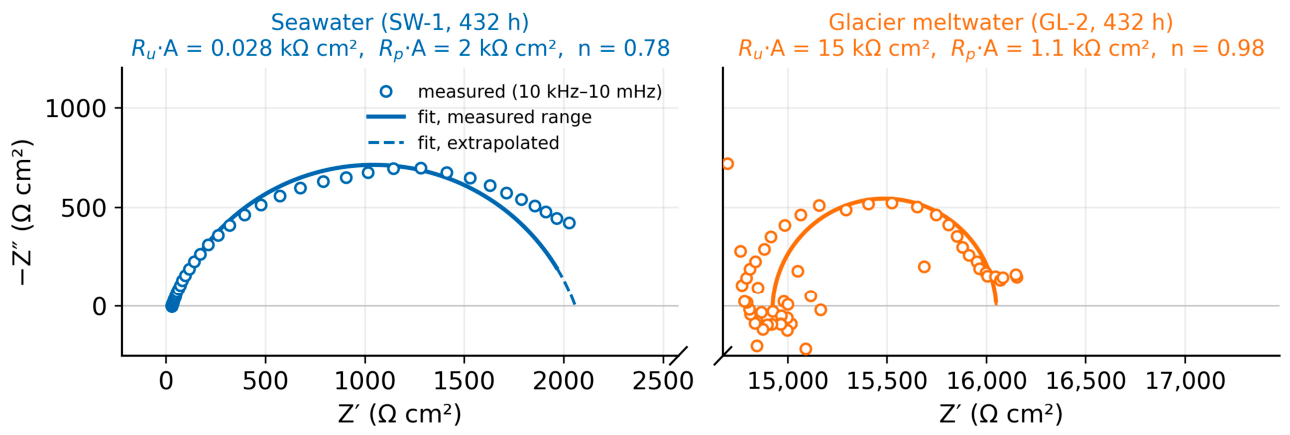
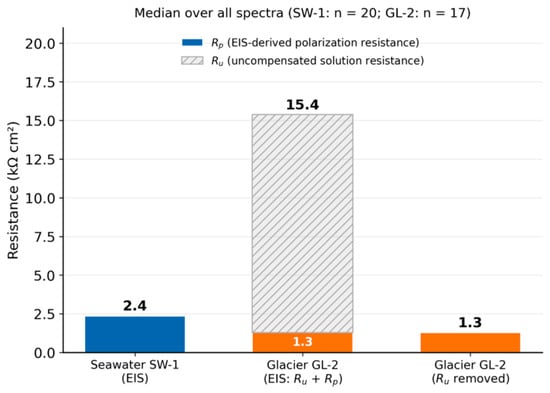
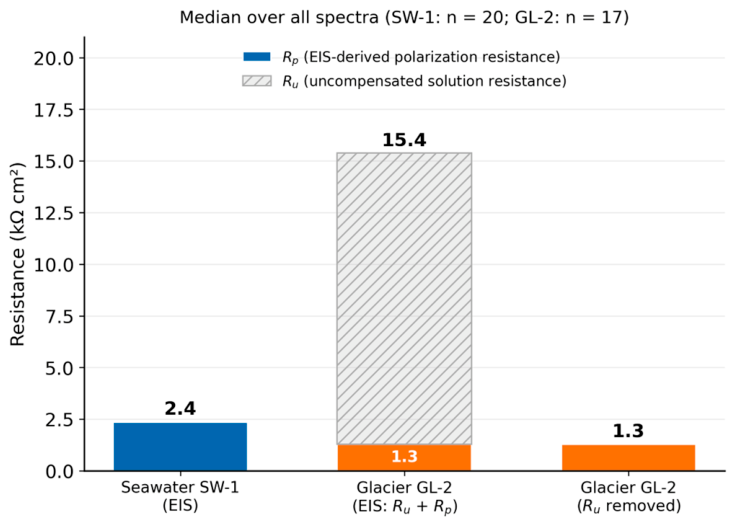
EIS resolved this apparent contradiction. Fitting all spectra (SW-1: n = 20; GL-2: n = 17) to a Ru + (Rp ‖ CPE) circuit (Figure 5, Table 2) showed that the inflated raw LPR signal in glacier meltwater was almost entirely attributable to uncompensated solution resistance (median Ru·A ≈ 14 kΩ cm2 versus ≈0.03 kΩ cm2 in seawater, a ratio of ≈500, consistent with the ≈600-fold conductivity difference), whereas the EIS-derived polarization resistance was of the same order in both waters (median Rp·A ≈ 2.4 kΩ cm2 in seawater versus 1.3 kΩ cm2 in glacier meltwater). Once Ru is removed, the glacier polarization resistance is, if anything, lower than in seawater, consistent with the comparable gravimetric rates (Figure 6). A two-time-constant model, Ru + CPEf ‖ [Rf + (Rct ‖ CPEdl)], lowered χ2 in most spectra (F-test, p < 0.05 in 19 of 20 SW-1 and 16 of 17 GL-2 spectra), indicating a contribution from the corrosion-product layer, particularly in seawater. However, its additional parameters were strongly correlated (|r| > 0.98) and poorly determined (relative standard errors up to ≈100%), whereas Ru changed little (median ≈ 3%) and, for SW-1, Rf + Rct matched the single-time-constant Rp (median ratio 1.05). The simpler model was therefore retained; the conclusions above do not depend on this choice. The large CPE parameters (Table 2) include pseudo-capacitive contributions from the corrosion products and were not interpreted as double-layer capacitance; in GL-2, they were also poorly constrained, because the capacitive response is small relative to Ru.
Figure 5.
Area-normalized Nyquist plots of time-matched EIS spectra (432 h) for seawater (SW-1) and glacier meltwater (GL-2), with Ru + (Rp ‖ CPE) fits. Both panels use identical, equal (1:1) scales for Z′ and −Z″; the Z′ axis is interrupted between panels because the glacier arc is shifted by the uncompensated solution resistance (Ru). High-frequency scatter in GL-2 reflects the small imaginary signal superimposed on the large Ru.
Table 2.
EIS fitting parameters for the Ru + (Rp ‖ CPE) model over all spectra (area-normalized). χ2 is the modulus-weighted sum of squared residuals per degree of freedom; its lower values for GL-2 partly reflect the large Ru in the weighting.
Figure 6.
Median EIS-derived resistances over all spectra. In glacier meltwater (GL-2), the total resistance is dominated by the uncompensated solution resistance (Ru); once Ru is removed, the polarization resistance (Rp) is of the same order as in seawater (SW-1).
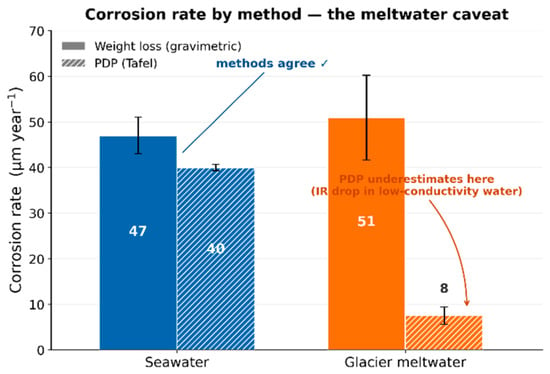
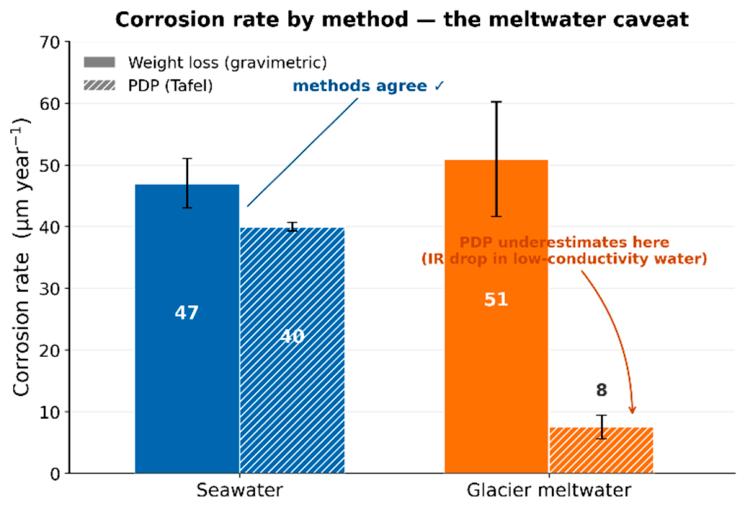
Potentiodynamic polarization (PDP) was internally consistent with gravimetry in seawater (40 µm yr−1 from PDP versus 47 µm yr−1 from weight loss) but substantially underestimated the glacier meltwater rate (≈7 µm yr−1 from PDP; 5.6 and 9.3 µm yr−1 for GL-1 and GL-2 versus 51 µm yr−1 from weight loss; Figure 7). This discrepancy is attributed to the IR-drop distortion of the Tafel slopes in the low-conductivity electrolyte, reflected in an anomalously high anodic Tafel slope in glacier meltwater (βa = 128 mV dec−1) compared with seawater (βa = 68 mV dec−1), consistent with the well-documented tendency of uncompensated ohmic drop to bias Tafel-derived corrosion rates in poorly conductive media [8,14]. Table 3 summarizes the rate estimates obtained by each method.
Figure 7.
Corrosion rate of ASTM A36 in seawater and glacier meltwater as determined by gravimetric weight loss versus potentiodynamic polarization (Tafel), illustrating the meltwater-specific divergence between methods.
Table 3.
Corrosion rate of ASTM A36 by measurement method.
3.3. Corrosion-Product Morphology and Chemistry
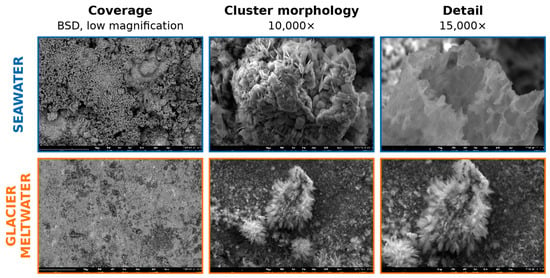
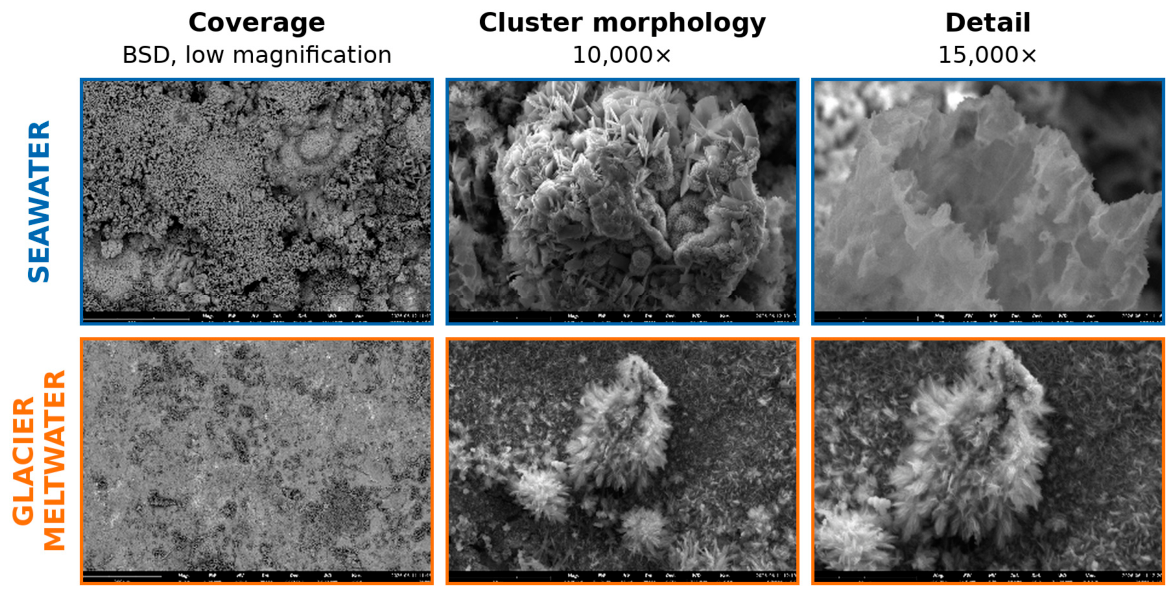
SEM imaging at matched magnifications (Figure 8) showed markedly different corrosion-product morphologies despite the comparable metal-loss rates. Seawater coupons developed a dense, continuous, nodular rust crust covering the great majority of the exposed surface. Glacier meltwater coupons, in contrast, developed sparse, isolated radiating florets of corrosion product over a largely exposed substrate (bare metal or residual mill scale).
Figure 8.
SEM comparison of corrosion-product morphology at matched magnifications: dense continuous crust in seawater (top row) versus sparse isolated florets in glacier meltwater (bottom row).
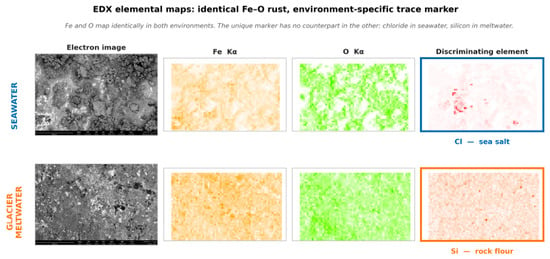
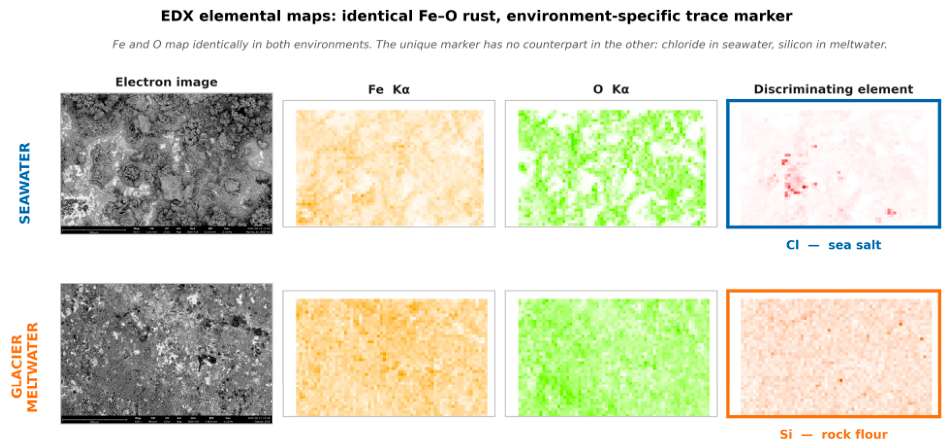
EDX elemental mapping (Figure 9) showed that the corrosion products in both environments are rich in Fe and O but differ in trace chemistry in a way that mirrors the source water. Seawater corrosion products incorporated chlorine (≈2.3 at%) and sodium (≈4.7 at%), consistent with sea-salt entrainment; these elements were absent across all 18 glacier-side maps. Glacier corrosion products instead carried detectable silicon, consistent with the incorporation of glacial rock flour, and no measurable chlorine in any map. Akaganeite (β-FeOOH), the chloride-stabilized iron oxyhydroxide phase typically associated with chloride-rich marine and salt-laden atmospheric corrosion environments [15], is therefore ruled out as the glacier-side phase on compositional grounds; however, elemental EDX data cannot discriminate between goethite, lepidocrocite, magnetite, and amorphous ferric oxyhydroxides, and the Fe–O signal may include contributions from residual mill scale. Phase identification of the chloride-free, silicon-bearing glacier product therefore requires micro-Raman spectroscopy and X-ray diffraction (XRD) on the retained coupons, which is planned as follow-up work; for reference, goethite and lepidocrocite dominate Antarctic atmospheric rust on carbon steel [4].
Figure 9.
EDX elemental maps (electron image, Fe Kα, O Kα, and the discriminating trace element) for seawater (top, Cl) and glacier meltwater (bottom, Si) corrosion products.
4. Discussion
The central finding of this study is a paradox: despite an approximately 600-fold difference in conductivity, and despite seawater carrying abundant chloride—classically the most aggressive species for carbon steel corrosion—ASTM A36 lost metal at rates that did not differ significantly between the two waters over a single Antarctic summer immersion. The electrochemical and materials data together explain how two chemically distinct environments converge on comparable metal loss by different routes. Both systems are actively corroding, as shown by comparable OCP values and, once uncompensated solution resistance is removed via EIS, comparable EIS-derived polarization resistance. The apparent electrochemical divergence seen in raw LPR and PDP data is a measurement artifact specific to low-conductivity electrolytes: uncompensated solution resistance is known to bias polarization-resistance-derived corrosion rates even in moderately conductive media [14,16], and monitoring studies in low-conductivity waters have likewise found LPR-derived rates unreliable and relied on impedance-based or direct methods [8], underlining that gravimetric measurement, cross-checked with IR-corrected EIS, is the more reliable method in such environments.
Although the present data cannot establish the mechanism, several factors plausibly explain why chloride-free meltwater is as aggressive as seawater. First, uniform corrosion of carbon steel in near-neutral aerated water is under cathodic control by dissolved-oxygen reduction, while chloride mainly influences corrosion-product morphology and localization rather than the short-term uniform rate; consistent with this, field data show that salinity by itself does not clearly distinguish the immersion corrosion of structural steels in fresh, brackish, and marine waters [6]. Second, at −1 to 4 °C, air-saturated fresh water holds roughly 25–30% more dissolved oxygen than seawater of 34 PSU [9], so the cathodic reactant is at least as available in the meltwater. Third, the meltwater is soft and poorly buffered, which precludes the carbonate deposits that can slow corrosion in harder waters; lower hardness is associated with higher aerobic corrosion rates [6]. Finally, the dense, continuous seawater crust (Figure 8) is expected to impede oxygen transport to the metal, whereas the sparse glacier florets leave most of the surface directly exposed. Higher electrolyte aggressiveness in seawater and freer oxygen access in meltwater may therefore offset each other. Testing this hypothesis requires dissolved-oxygen monitoring and phase identification of the corrosion products, which are planned for future campaigns.
Materially, the two environments reach comparable mass loss by different corrosion-product pathways. Seawater’s higher ionic strength and chloride content support a thick, continuous, chloride-bearing crust. Glacier meltwater, despite its very low ionic strength, was not passivating: it supported an equally aggressive, though morphologically very different, corrosion process, producing a sparse, silicon-bearing, chloride-free film rather than a protective layer. The cell-to-cell variability observed within the glacier replicates (GL-1 versus GL-2) further suggests that corrosion behavior in poorly buffered, low-ionic-strength polar meltwater may be more sensitive to local microenvironmental variation than in seawater, warranting larger replicate counts in future campaigns.
These results carry a practical implication for Antarctic infrastructure: glacier meltwater contact should not be assumed to be less corrosive than seawater contact when specifying or inspecting carbon steel structures over summer-season immersion timescales. They also carry a methodological implication for polar corrosion research more broadly: single-technique electrochemical corrosion-rate estimates in low-conductivity natural waters should be treated with caution unless solution resistance is explicitly resolved and removed. The results apply to the as-received, mill-scaled surface condition typical of installed structural steel, to static exposure with periodic mixing, and to a single summer season; dissolved oxygen was not measured, and ground surfaces, flowing water, or longer exposures may behave differently.
5. Conclusions
- ASTM A36 carbon steel corroded at rates that did not differ significantly between Antarctic seawater (47 ± 4 µm yr−1) and glacier meltwater (51 ± 9 µm yr−1) despite an approximately 600-fold difference in solution conductivity, contradicting the expectation that marine exposure is intrinsically more aggressive.
- Raw LPR and PDP measurements in glacier meltwater substantially misrepresent the true corrosion rate because of uncompensated solution resistance and IR-drop distortion of Tafel slopes; EIS-derived polarization resistance is of the same order in both waters, consistent with the gravimetric result.
- Both environments produce Fe- and O-rich corrosion products, but seawater forms a dense chloride- and sodium-bearing crust while glacier meltwater forms a sparse, chloride-free, silicon-bearing film—distinct pathways to comparable metal loss.
- Glacier meltwater should be considered as aggressive as coastal seawater to ASTM A36 over an Antarctic summer immersion, with implications for the inspection and material selection of station and mooring infrastructure.
- Phase identification of the chloride-free glacier corrosion product by XRD and Raman spectroscopy, dissolved-oxygen monitoring, and a more comprehensive mechanistic study of corrosion-product evolution over multiple seasons are identified as the next steps of this research.
Author Contributions
Conceptualization, R.D.M.; methodology, R.D.M.; software, R.D.M.; validation, R.D.M.; formal analysis, R.D.M.; investigation, R.D.M., C.N., C.L., G.R., I.R. and J.C.-T.; resources, R.D.M. and J.C.-T.; data curation, R.D.M.; writing—original draft preparation, R.D.M.; writing—review and editing, R.D.M., C.N., C.L., G.R., I.R. and J.C.-T.; visualization, R.D.M.; supervision, R.D.M.; project administration, R.D.M.; funding acquisition, R.D.M. All authors have read and agreed to the published version of the manuscript.
Funding
This research was funded by the Instituto Oceanográfico y Antártico de la Armada (INOCAR) and Yachay Tech University, project number CIDi25002, within the framework of the XXIX Ecuadorian Antarctic Expedition.
Institutional Review Board Statement
Not applicable.
Informed Consent Statement
Not applicable.
Data Availability Statement
The data presented in this study are available on request from the corresponding author.
Acknowledgments
The authors acknowledge the support of INOCAR (Instituto Oceanográfico y Antártico de la Armada) and the XXIX Ecuadorian Antarctic Expedition for making this project possible. The authors also thank the ANTON research group at Yachay Tech University for the support provided to this research project.
Conflicts of Interest
The authors declare no conflicts of interest.
References
- Morcillo, M.; Chico, B.; de la Fuente, D.; Almeida, E.; Joseph, G.; Rivero, S.; Rosales, B. Atmospheric corrosion of reference metals in Antarctic sites. Cold Reg. Sci. Technol. 2004, 40, 165–178. [Google Scholar] [CrossRef] [Scilit]
- Rivero, S.; Chico, B.; de la Fuente, D.; Morcillo, M. Atmospheric corrosion of low carbon steel in a polar marine environment. Study of the effect of wind regime. Rev. Metal. 2007, 43, 370–383. [Google Scholar] [CrossRef] [Scilit][Green Version]
- Vera, R.; Bagnara, M.; Henríquez, R.; Muñoz, L.; Rojas, P.; Díaz-Gómez, A. Performance of anticorrosive paint systems for carbon steel in the Antarctic marine environment. Materials 2023, 16, 5713. [Google Scholar] [CrossRef] [Scilit] [PubMed]
- Marco, J.F.; Gracia, M.; Gancedo, J.R.; Martín-Luengo, M.A.; Joseph, G. Characterization of the corrosion products formed on carbon steel after exposure to the open atmosphere in the Antarctic and Easter Island. Corros. Sci. 2000, 42, 753–771. [Google Scholar] [CrossRef] [Scilit]
- ISO 9223:2012; Corrosion of Metals and Alloys—Corrosivity of Atmospheres—Classification, Determination and Estimation. International Organization for Standardization: Geneva, Switzerland, 2012.
- Melchers, R.E. Modelling immersion corrosion of structural steels in natural fresh and brackish waters. Corros. Sci. 2006, 48, 4174–4201. [Google Scholar] [CrossRef] [Scilit]
- Duprat, M.; Lafont, M.-C.; Dabosi, F.; Moran, F. Study of the corrosion and inhibition processes of a carbon steel in a low conductivity medium by electrochemical methods. Electrochim. Acta 1985, 30, 353–365. [Google Scholar] [CrossRef] [Scilit]
- Hilbert, L.R. Monitoring corrosion rates and localised corrosion in low conductivity water. Corros. Sci. 2006, 48, 3907–3923. [Google Scholar] [CrossRef] [Scilit]
- Garcia, H.E.; Gordon, L.I. Oxygen solubility in seawater: Better fitting equations. Limnol. Oceanogr. 1992, 37, 1307–1312. [Google Scholar] [CrossRef] [Scilit]
- ASTM G1-03; Standard Practice for Preparing, Cleaning, and Evaluating Corrosion Test Specimens. ASTM International: West Conshohocken, PA, USA, 2017.
- ASTM G31-21; Standard Guide for Laboratory Immersion Corrosion Testing of Metals. ASTM International: West Conshohocken, PA, USA, 2025.
- ASTM G59-97; Standard Test Method for Conducting Potentiodynamic Polarization Resistance Measurements. ASTM International: West Conshohocken, PA, USA, 2020.
- Orazem, M.E.; Tribollet, B. Electrochemical Impedance Spectroscopy, 2nd ed.; Wiley: Hoboken, NJ, USA, 2017. [Google Scholar]
- Walter, G.W. The effect of IR-drop on corrosion rates calculated from low polarization data. Corros. Sci. 1978, 18, 927–945. [Google Scholar] [CrossRef] [Scilit]
- Li, S.; Hihara, L.H. A micro-Raman spectroscopic study of marine atmospheric corrosion of carbon steel: The effect of akaganeite. J. Electrochem. Soc. 2015, 162, C495–C502. [Google Scholar] [CrossRef] [Scilit]
- Oelßner, W.; Berthold, F.; Guth, U. The iR drop—Well-known but often underestimated in electrochemical polarization measurements and corrosion testing. Mater. Corros. 2006, 57, 455–466. [Google Scholar] [CrossRef] [Scilit]

Disclaimer/Publisher’s Note: The statements, opinions and data contained in all publications are solely those of the individual author(s) and contributor(s) and not of MDPI and/or the editor(s). MDPI and/or the editor(s) disclaim responsibility for any injury to people or property resulting from any ideas, methods, instructions or products referred to in the content. |
© 2026 by the authors. Licensee MDPI, Basel, Switzerland. This article is an open access article distributed under the terms and conditions of the Creative Commons Attribution (CC BY) license.