


Abstract
In a competitive oil market, the efficiency of tubular repair shops is crucial for meeting demanding deadlines and controlling costs. This study analyzes the repair process of premium production tubing connections at Sertecpet, Ecuador, using Value Stream Mapping, direct observation, SIPOC analysis, and a stopwatch-based time study. The parameters considered include cycle time, takt time, productive capacity, standard time, value-added (VA), necessary but non-value-added (NNVA), non-value-added (NVA) time, work in process (WIP), transport distance, lead time, operator utilization, and bottleneck capacity. The results show that only 53% of the 48.07 min/pipe production flow adds value, while the machining stage (P5) is the main bottleneck, with a cycle time of 22.62 min/pipe versus a takt time of 7.25 min/pipe. A conceptual future-state VSM is proposed through layout redesign, workload redistribution, assisted P5 handling, rack automation, 5S, Kanban control, and SMED. The projected scenario estimates a P5 cycle time of 18.10 min/pipe and a capacity of 24.0 pipes per 435-min equivalent shift. In actual daily operation, the plant uses three rotating 8-h shifts. The future state was not implemented during the study period.
1. Introduction
The oil industry operates in a highly competitive and cost-sensitive environment, where the efficiency of maintenance and repair operations is essential to reduce lead times, control operational costs, and maintain service quality. Within this context, the repair of production tubing with premium connections represents a specialized and high-value process. These connections are designed to ensure mechanical integrity and sealing performance under demanding operating conditions; therefore, their repair requires strict technical specifications, specialized equipment, quality control, and traceability [1].
Premium connection repair commonly involves cutting damaged connections, cold forming, stress relief, precision machining, inspection, and final traceability. Although these operations are technically necessary to restore the functional condition of the pipe, they are often performed in workshops characterized by variable demand, high-mix and low-volume production, manual handling of heavy components, semi-automated operations, and strict inspection requirements. These characteristics make the process vulnerable to operational inefficiencies such as excessive transportation, unnecessary motion, waiting times, work-in-process accumulation, and unbalanced workloads.
Lean Manufacturing provides a systematic framework for identifying and eliminating activities that consume resources but do not add value from the customer’s perspective. Originating from the Toyota Production System, Lean thinking focuses on waste reduction, flow improvement, and value creation through continuous improvement [2,3,4]. These wastes are commonly classified into seven categories: overproduction, waiting, transportation, overprocessing, inventory, motion, and defects [2,3,4,5]. Among Lean tools, Value Stream Mapping (VSM) is particularly useful because it enables the visualization of material and information flows across the entire process, including cycle times, inventories, waiting points, and process interactions [6,7]. Therefore, VSM is an appropriate diagnostic tool for identifying bottlenecks, quantifying waste, and designing an improved future state.
Although Lean tools and VSM have been widely applied in manufacturing sectors such as automotive and process industries [5,6,7,8], their use in specialized repair processes within the oil industry remains limited, particularly in Latin American contexts [9,10]. Oilfield repair workshops combine technical complexity, variable batches, manual intervention, heavy material handling, external quality requirements, and strict traceability. These features make the environment closer to high-mix, low-volume and maintenance-service systems than to conventional mass production. Recent studies have shown that VSM can support lead-time reduction, waste visibility, and future-state design in manufacturing and service environments, while systematic reviews also warn that the tool requires contextual adaptation when demand, product mix, and data availability are unstable [11,12,13,14,15].
The research gap addressed in this study is the limited empirical evidence on how VSM and complementary Lean tools can be adapted to authorized oilfield tubular repair workshops where the process is not fully repetitive, material handling is physically demanding, and future-state changes may remain at the proposal stage because of contractual, safety, and licensing constraints. The problem addressed in this study is the operational inefficiency observed in the repair process of TSH Blue premium connections in an authorized tubular repair workshop in Ecuador. These inefficiencies are reflected in long cycle times, excessive material handling, fragmented layout, unnecessary motion, workload imbalance, and bottlenecks that limit the workshop’s response capacity. In this context, improving the repair process requires a structured diagnosis of the current state and the definition of feasible improvement actions based on operational data.
Accordingly, the present study extends recent VSM applications by examining a premium oil-tubular repair process in which current-state measurement, operator utilization, and future-state scenario design must be integrated carefully. This positioning is important because projected Lean improvements can support decision-making, but they must be distinguished from post-implementation evidence.
The objective of this research is to improve the premium connection repair process in the oil industry through Value Stream Mapping and selected Lean tools. Specifically, this study aims to map and quantify the current value stream of the repair process; classify activities into value-added, necessary but non-value-added, and non-value-added categories; determine the takt time, cycle times, production capacity, and main bottleneck; identify the dominant wastes according to the Toyota Production System; and propose a future-state improvement plan focused on layout redesign, workload redistribution, standardization, 5S, simple automation, and SMED.
This study contributes to both academic literature and industrial practice. From an academic perspective, it provides empirical evidence on the application of VSM and Lean tools in a specialized oilfield repair process, a context that has received limited attention. From a methodological perspective, it presents a replicable framework that combines process mapping, time study, activity classification, waste analysis, and qualitative validation. From a practical perspective, it offers feasible improvement actions for authorized repair workshops seeking to increase operational efficiency, reduce waste, and improve flow continuity.
The remainder of this paper is organized as follows: Section 2 describes the materials and methods used in the case study. Section 3 presents the current-state diagnosis and the main quantitative results. Section 4 discusses the implications of the findings and the proposed improvement actions. Section 5 presents the conclusions, limitations, and recommendations for future research.
2. Materials and Methods
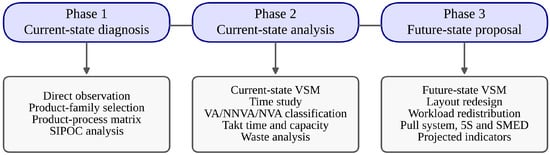
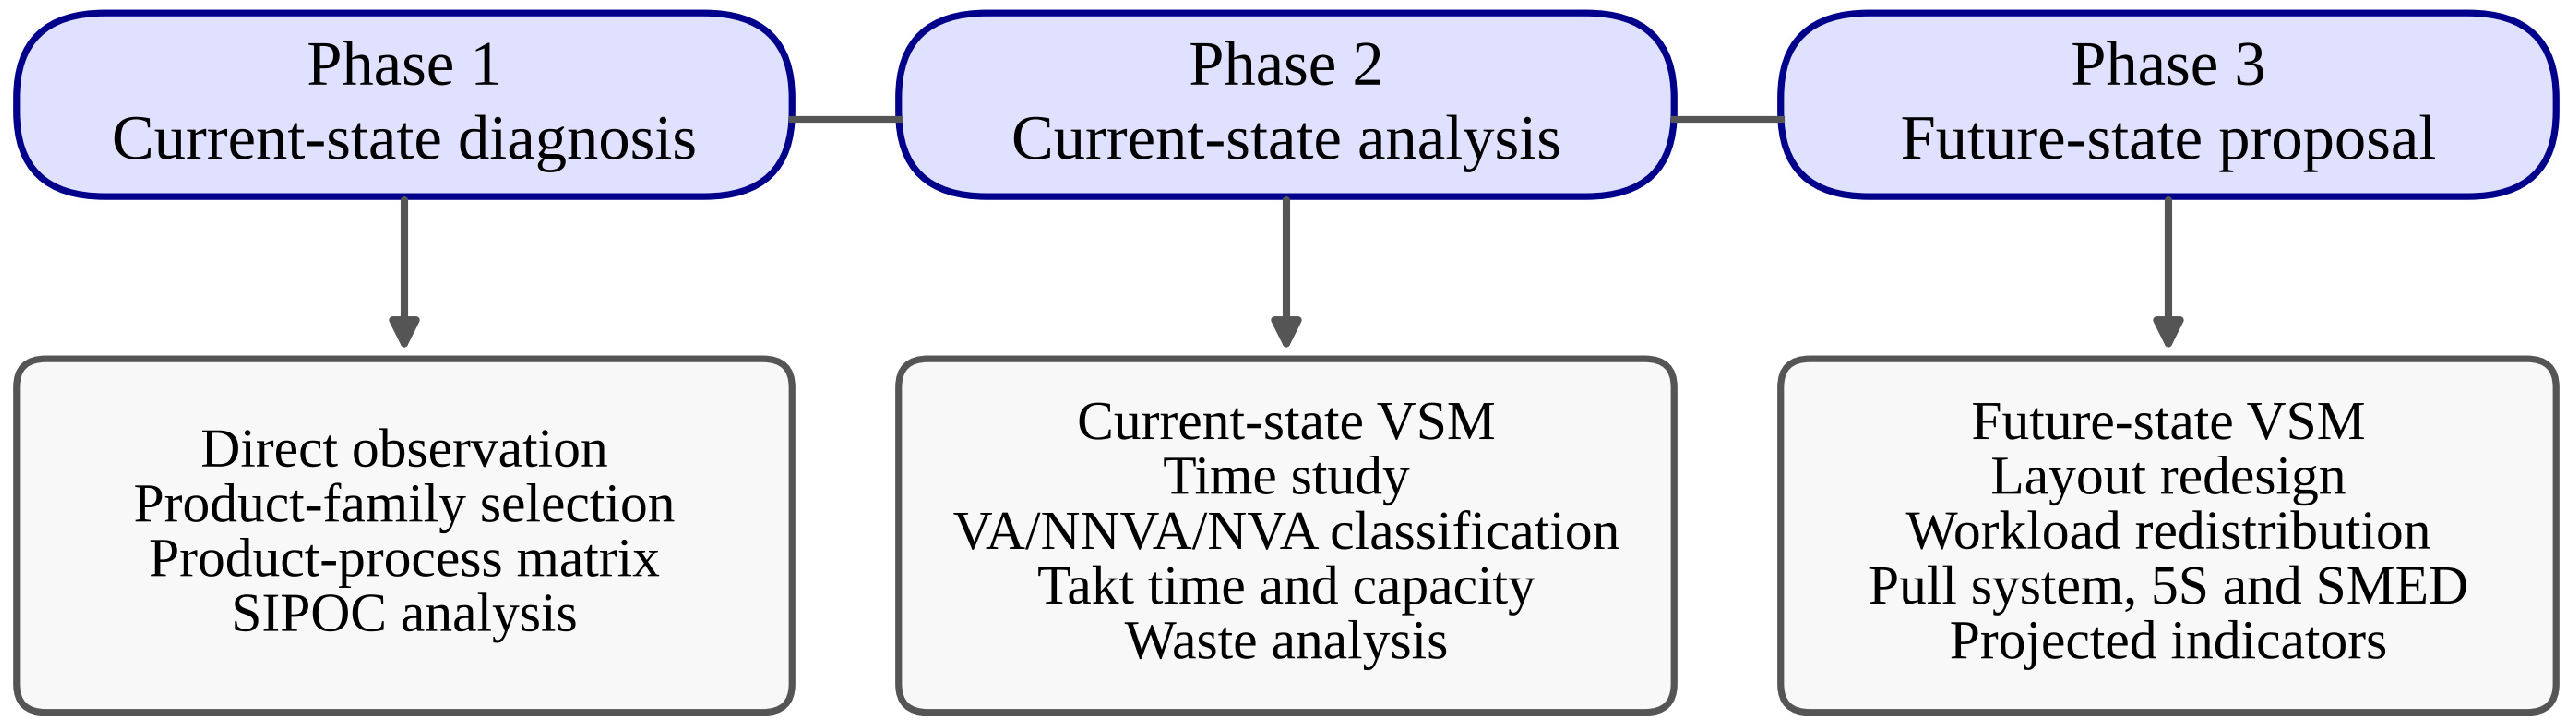
This study adopts an applied research approach with a mixed-methods design, integrating qualitative and quantitative techniques within an intrinsic single-case study [7]. The case study was conducted at the Sertecpet machining plant in Ecuador, a facility specialized in the repair of premium connections for oil production tubing. The research was developed in three sequential phases, aligned with the methodology proposed by Rother and Shook [4] for the implementation of Value Stream Mapping (VSM), and complemented with classical work-study techniques [8]. Figure 1 illustrates the overall methodological workflow.
Figure 1.
Methodological workflow of the applied research process.
2.1. Phase 1: Current-State Diagnosis
The first phase consisted of direct, non-participant observation of the overall repair process, from pipe reception to final release. This stage allowed the researchers to become familiar with the operations, resources, workstation sequence, physical flow, information flow, and main operational constraints of the machining plant. The observation also made it possible to identify preliminary sources of waiting, transportation, rehandling, work-in-process accumulation, and interruptions in the flow.
To focus the analysis, a product family was selected according to business impact and production volume, following the criteria recommended for Value Stream Mapping implementation [4]. A product–process matrix was developed, and historical production data from 2017 to 2018 were reviewed. This analysis identified the repair of TSH Blue premium connections as the most representative product family, since it accounted for the highest repair demand and passed through all the main process stages. Therefore, this product family was selected as the object of study for the current-state VSM.
Subsequently, a SIPOC diagram was developed to define the suppliers, inputs, process stages, outputs, and customers associated with the repair flow. The SIPOC analysis was applied to the main workstations, identified as P1 to P6, in order to delimit the system boundaries and clarify the interfaces between processes. This tool provided a systemic understanding of the repair process before the detailed construction of the value stream map [9].
2.2. Phase 2: Current-State Mapping
The second phase focused on collecting and analysing quantitative and qualitative data from the current process. This phase included current-state Value Stream Mapping, time study, activity classification, waste analysis, and the calculation of key operational indicators.
2.2.1. Current-State Value Stream Mapping
The current-state Value Stream Map was constructed using standard VSM notation [4]. The map represented the material flow from pipe reception to final release, as well as the information flow associated with work orders, production planning, quality control, and external technical requirements. Data boxes were added for each process stage, including cycle time, number of operators, batch size, availability, changeover-related information, and work-in-process observations collected directly on the shop floor.
The VSM also allowed the identification of push and pull relationships between stations, intermediate inventories, waiting points, and material transportation paths. This provided a visual and quantitative basis for detecting discontinuities in the flow and identifying processes with potential restrictions.
2.2.2. Time Study and Work Sampling
To quantify process performance, a stopwatch-based time study was carried out using a standard digital stopwatch and classical work-study procedures [8]. Each process, from P1 to P6, was divided into observable and measurable work elements. For each element, five observations were recorded. This sample size followed the General Electric Company guideline reported by Niebel and Freivalds for operations with cycle times between 20 and 40 min, where five cycles are recommended. Because several activities were batch-based, one-per-shift, or performed in parallel, the observations were used to estimate standard times for process diagnosis rather than to make a statistical inference about all future production days.
A performance rating of 100% was applied, since the operators were considered trained and working at a normal pace under regular operating conditions. The normal time was calculated as the average observed time for each work element. Then, allowances were added for personal needs and fatigue. A 5% allowance was considered for personal needs, while fatigue allowances ranged from 4% to 9%, depending on the physical and operational demands of each workstation. The standard time was calculated using Equation (1):
where ST is the standard time, NT is the normal time, and ΣA represents the total allowance factor.
ST = NT × (1 + ΣA),
The resulting times were classified into three categories. Value-added (VA) activities were those that directly transformed the pipe or restored the functional condition of the premium connection. Necessary but non-value-added (NNVA) activities were required by the current system, such as inspections, handling, or traceability tasks, but did not directly transform the product. Non-value-added (NVA) activities were considered pure waste, including waiting, unnecessary movement, excessive transportation, and rework.
2.2.3. Waste Analysis and Semi-Structured Interview
Waste analysis was conducted by comparing direct observations with the seven classical waste categories of the Toyota Production System: overproduction, waiting, transportation, overprocessing, inventory, motion, and defects [3]. This analysis allowed the identification and classification of operational inefficiencies observed throughout the repair flow.
To triangulate the information, a semi-structured interview was conducted with the quality supervisor of the machining plant. The interview focused on identifying how each type of waste appeared in the process, as well as its perceived operational causes. This qualitative input provided contextual validation for the quantitative observations and helped explain waste sources related to inspection practices, external approvals, workstation layout, material handling, and rework.
2.2.4. Calculation of Operational Metrics
Using the data collected during the time study and VSM development, several operational indicators were calculated in Microsoft Excel (v2016, Microsoft Corporation, Redmond, WA, USA). First, takt time was determined as the production rhythm required to satisfy customer demand, as shown in Equation (2):
Takt Time = Net available production time/Customer demand.
Second, production capacity was calculated for each workstation based on the available production time and the cycle time per pipe, as shown in Equation (3):
Production Capacity = Available production time/Cycle time per pipe.
Third, the theoretical number of operators was estimated by comparing the cycle time of each workstation with takt time. Finally, the value-added ratio was calculated using Equation (4):
VA Ratio (%) = (Σ VA time/Total production flow time) × 100.
These indicators allowed the identification of the main bottleneck, the evaluation of line balance, and the quantification of value-added and non-value-added time within the repair process.
2.3. Phase 3: Future-State Proposal Design
Based on the current-state diagnosis, a future-state Value Stream Map was designed. Improvement proposals were generated through brainstorming sessions informed by Lean principles and the evidence obtained from the VSM, time study, waste analysis, and operator-related observations. The proposed actions were prioritized according to feasibility, expected impact, implementation effort, and their potential contribution to reducing total production flow time.
The improvement proposal included four main actions. First, the layout was redesigned to promote a more continuous flow and reduce excessive transportation between stations. Second, workload balancing was proposed through the redistribution of selected activities among workstations with different utilization levels. Third, simple automation alternatives, such as improved or motorized racks, were considered to reduce unnecessary manual handling and operator movement. Fourth, specific Lean tools, including 5S and Single-Minute Exchange of Die (SMED), were proposed to improve workplace organization and reduce setup-related losses.
Finally, a conceptual future-state VSM was developed to synthesize the improved process configuration. The map showed the expected reduction in work in process, transportation, non-value-added time, and total lead time. The future-state proposal was not implemented during the study period; therefore, the expected improvements were estimated from scenario calculations based on the current-state data.
2.4. Methodological Limitations
The study was limited to a single company and one specific product family, which may restrict the generalization of the findings to other oilfield repair workshops, connection types, or production contexts. In addition, the time study reflects the operating conditions observed during the data collection period. Variations in demand, workforce availability, equipment condition, inspection availability, transport resources, or external approvals may affect the behaviour of the process over time. Since the number of observations followed an industrial work-study guideline rather than a statistical sampling plan, confidence intervals were not reported; instead, the measured values were triangulated with process observation, activity classification, labor-machine analysis, and supervisor interview evidence. Despite these limitations, the proposed methodological framework provides a structured and replicable approach for diagnosing and improving specialized repair processes in the oil industry.
3. Results
This section presents the results obtained from the application of the methodological framework described above. The findings are organized according to the current-state diagnosis, time and capacity analysis, waste quantification, labor–machine utilization, and future-state improvement proposal.
3.1. Current-State Diagnosis: Product Family Selection and SIPOC
The analysis of the product–process matrix (Table 1) and the historical production records from January 2017 to June 2018 (Table 2) showed that the repair of the TSH Blue connection accounts for 53.8% of the total repaired units (9331 out of 17,311 pipes). This volume, significantly higher than that of other connections such as SEC (33.2%) and Wedge 500 (13.0%), together with its recurrence through all six production processes, justified its selection as the representative product family for the value stream mapping.
Table 1.
Product–process matrix for the machining plant.
Table 2.
Repair volume by connection type from January 2017 to June 2018.
Table 1 summarizes the product–process matrix for the machining plant, indicating which processes are traversed by each connection type. Table 2 presents the repair volume and percentage share by connection type for the reference period.
The SIPOC diagram developed for the six main stations of the line (P1 to P6) helped delimit the scope of the study and standardize the nomenclature of the processes. The main processes were identified as: P1: Reception and work assignment; P2: Cutting of damaged connections; P3: Cold forming (swaging); P4: Stress relief; P5: Machining of the new connection; and P6: Traceability and release. The SIPOC analysis also highlighted the dependence of P4 on external approvals (temperature parameters provided by Tenaris) and the outsourcing of coupling change activities in P6, both of which introduce variability into the flow.
3.2. Time Study and Productive Capacity
The stopwatch-based time study was conducted across the six workstations. Five observations were taken for each work element, and the resulting standard times were classified into value-added (VA), necessary but non-value-added (NNVA), and non-value-added (NVA) activities. Table 3 summarizes the cycle time, time per pipe, number of operators, and activity classification for each process.
Table 3.
Cycle time and activity classification by process.
The total standard time per pipe obtained from the sum of process times is 55.57 min, while the measured production lead time (flow time) is 48.07 min, considering overlaps and parallel activities. Of this total lead time, 25.65 min correspond to value-added activities, resulting in a value-added ratio of approximately 53%. The remaining 47% is distributed between NNVA activities (around 24%) and NVA activities (around 23%).
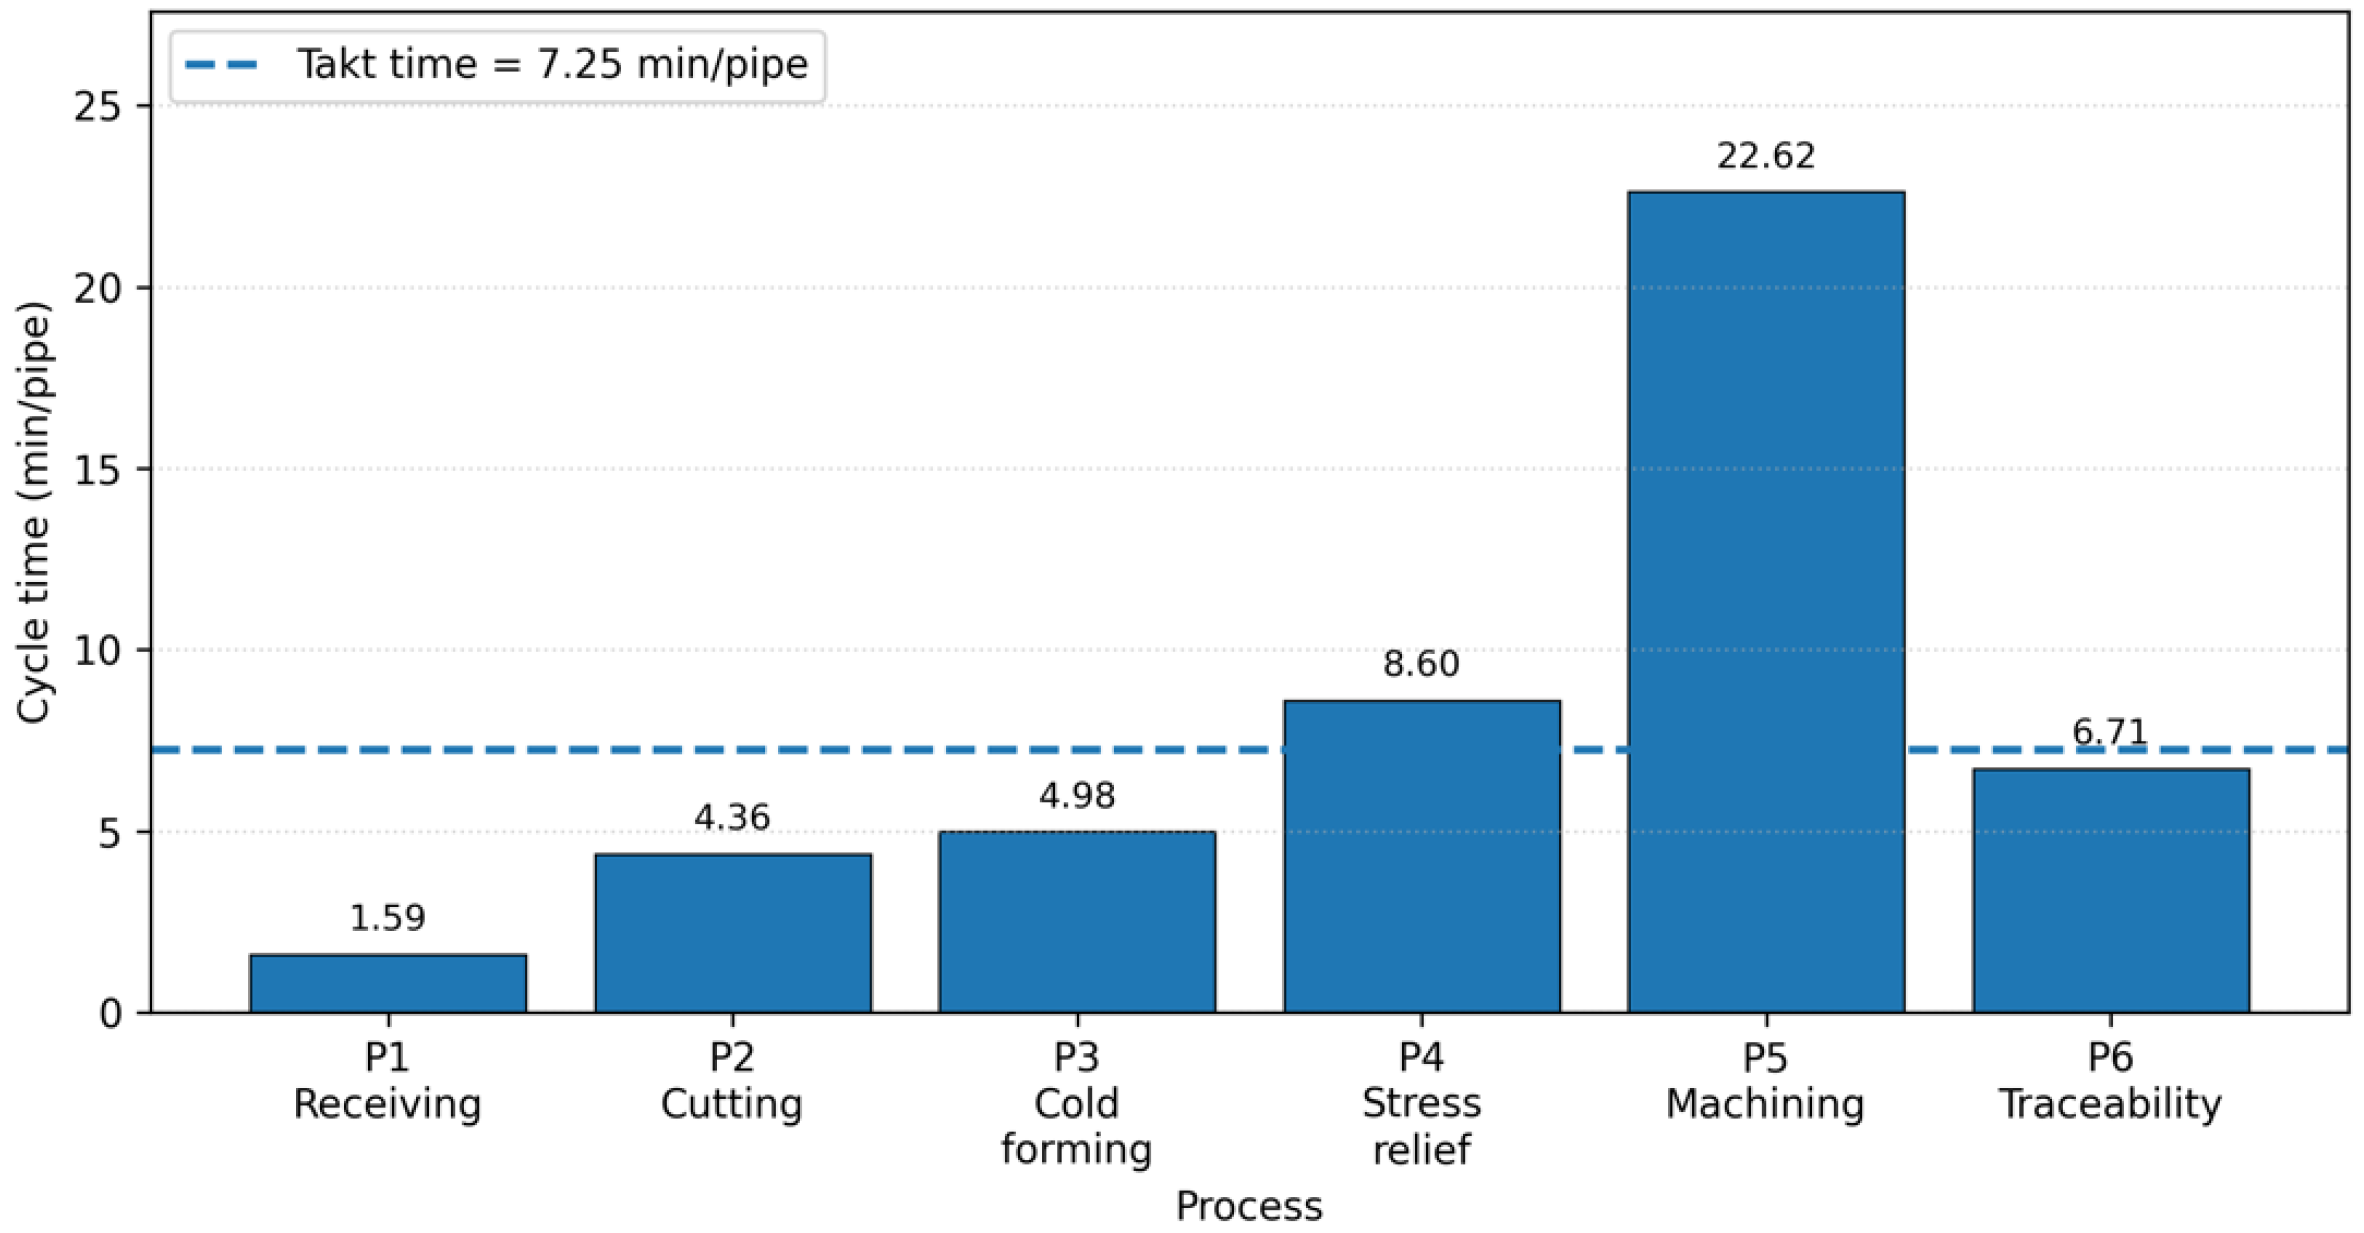
A key result is that the machining process (P5) has the highest cycle time (22.62 min/pipe), followed by stress relief (P4) with 8.60 min/pipe, while the other processes exhibit cycle times below 7 min/pipe. These differences strongly influence the line’s capacity and the formation of work-in-process inventories between stations.
3.3. Demand, Takt Time, and Bottleneck
The contractual demand considered in the case study is 360 pipes per week, equivalent to 60 pipes/day over six working days. For the diagnostic comparison of cycle times, a 435-min equivalent shift was used, corresponding to one 8-h shift minus 45 min allocated to meetings, work permits, and station cleaning. Based on these data, the following indicators were calculated:
- Daily demand: 360 pipes/6 days = 60 pipes/day;
- Net available production time: 8 h × 60 min − 45 min = 435 min/day;
- Takt time: 435 min/60 pipes = 7.25 min/pipe.
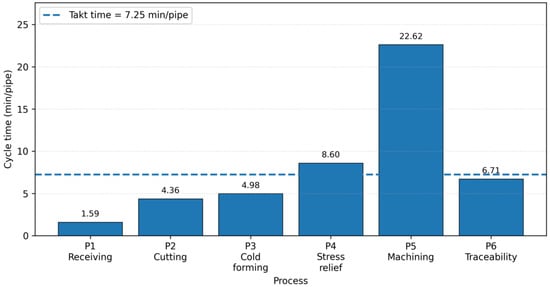
Figure 2 compares the cycle time of each process with the diagnostic takt time of one 435-min equivalent shift. The results show that P4 (8.60 min/pipe) and P5 (22.62 min/pipe) exceed the 7.25 min/pipe single-shift reference, while P1, P2, P3, and P6 operate with cycle times lower than this value. For actual daily fulfillment, the plant operates with three rotating 8-h shifts, which gives an operational takt time of 24.0 min/pipe for the 60 pipes/day demand. Under this daily schedule, P5 remains the bottleneck but its measured capacity is sufficient to meet the contractual demand.
Figure 2.
Comparison of process cycle times against takt time.
Using the 435-min equivalent shift, the theoretical capacity of P5 is 435 min/22.62 min/pipe = 19.2 pipes/shift. With the actual three rotating 8-h shifts used by the plant, the available daily machining time is 1440 min/day, and the corresponding P5 capacity is 1440/22.62 = 63.7 pipes/day. This capacity covers the contractual demand of 60 pipes/day, although with a narrow margin. Table 4 presents the capacity calculations per equivalent shift, confirming that P5 remains the capacity-controlling station.
Table 4.
Production capacity by process.
The proposed P5 improvement increases the same equivalent-shift capacity to 435/18.10 = 24.0 pipes/shift. Under the actual three-shift rotating schedule, this corresponds to 1440/18.10 = 79.6 pipes/day. Therefore, the future-state proposal is interpreted as a bottleneck-reduction and flow-improvement scenario that increases the operating margin above the required 60 pipes/day.
For P6, Table 4 reports an effective capacity cycle time of 6.71 min/pipe because two operators perform complementary release activities in parallel. The measured work content of the P6 station remains 13.42 min/pipe, as reported in Table 3.
These results confirm that the line is constrained by the machining process. While P1, P2, P3, and P6 operate below takt time, P5 limits the throughput of the system and generates accumulation before and after the bottleneck.
3.4. Waste Classification and Quantification
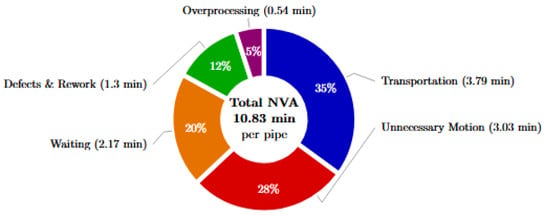
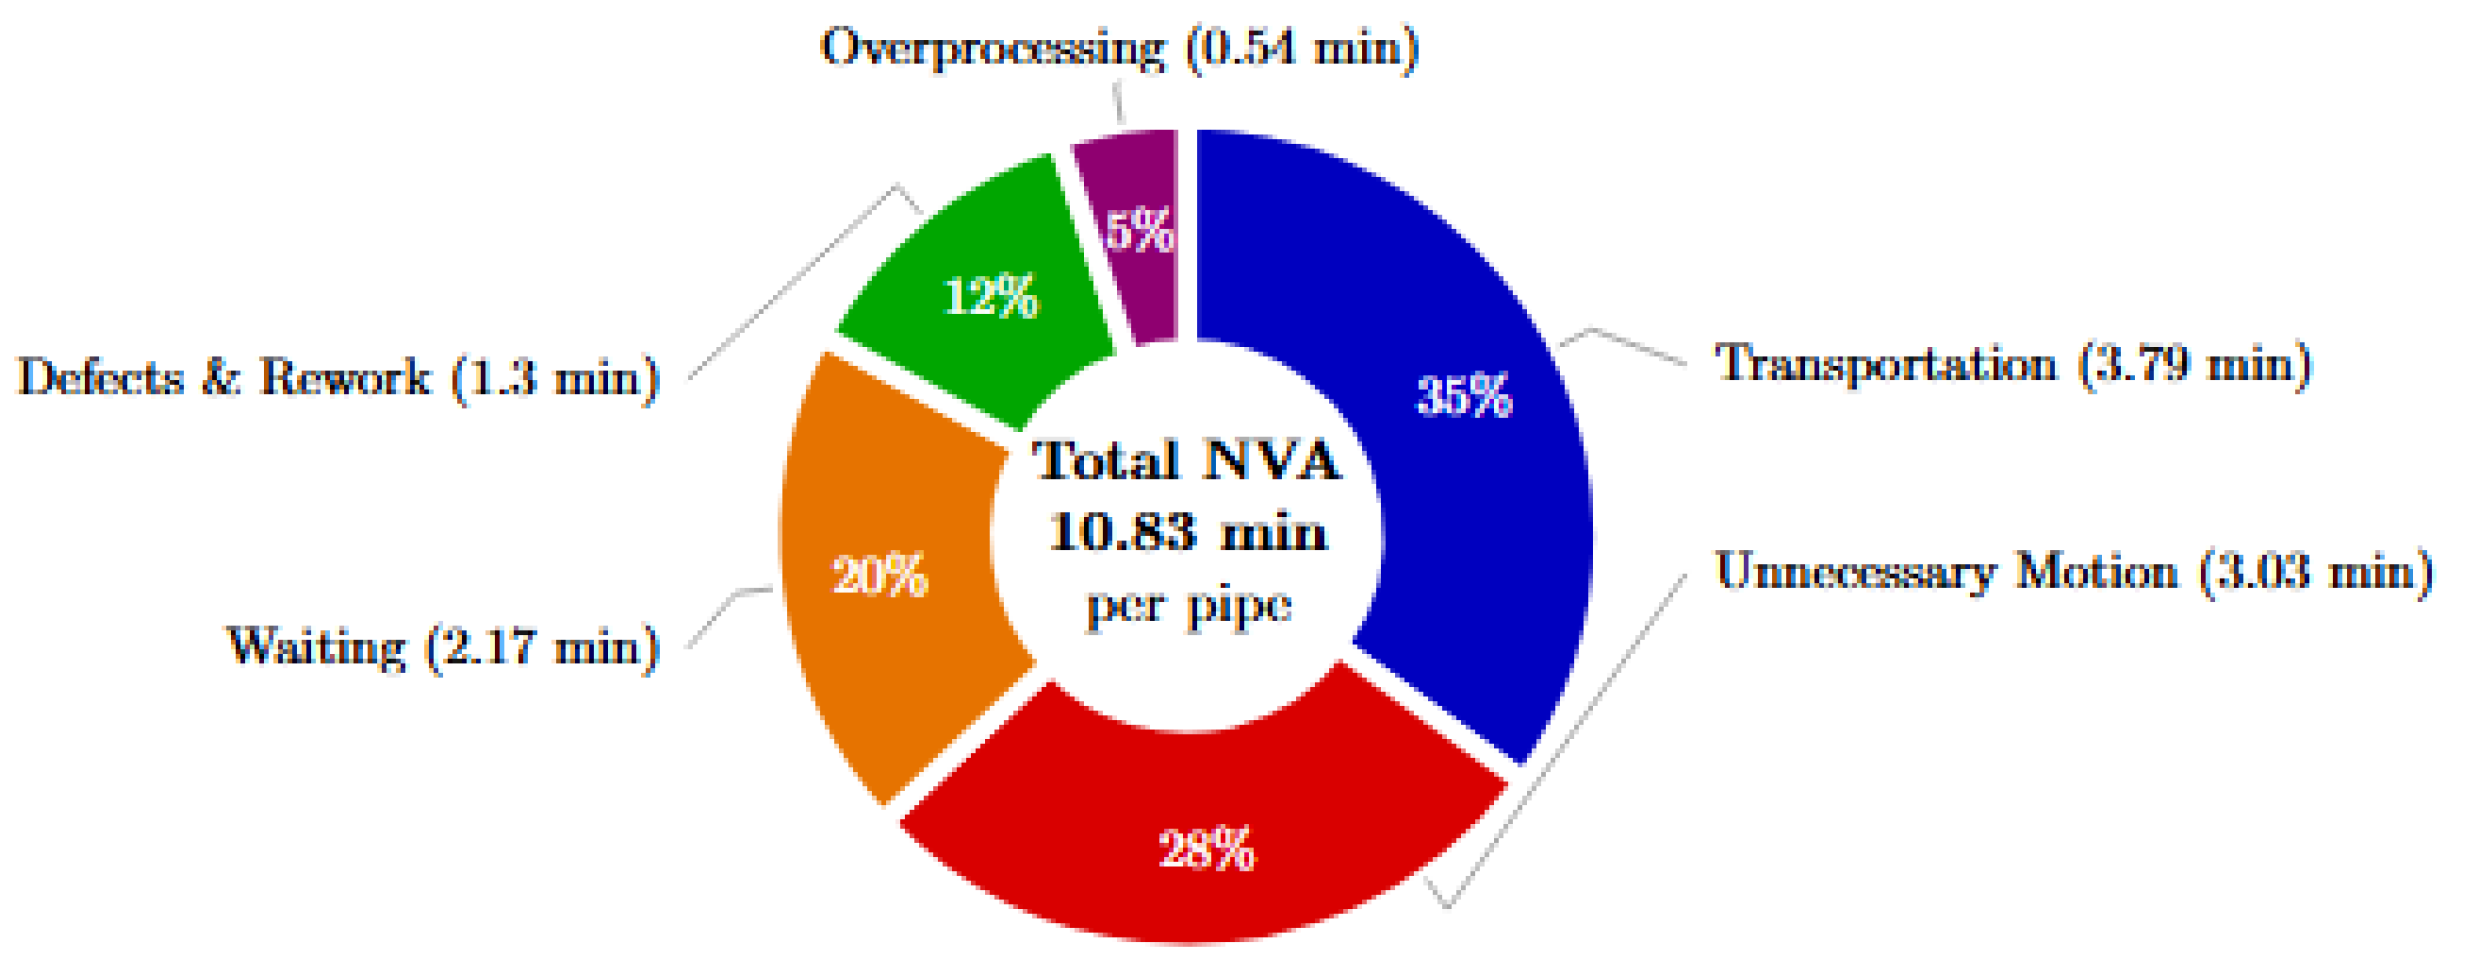
The NVA time identified in the process was classified according to the waste categories observed in the repair flow. Figure 3 shows the distribution of pure waste time. Transportation represented the largest share of NVA time, with 35%, followed by unnecessary motion, with 28%. Waiting accounted for 20%, defects and rework for 12%, and overprocessing for 5%.
Figure 3.
Distribution of non-value-added time by waste category.
The results show that transportation and unnecessary motion accounted for 63% of pure waste. This finding indicates that the main structural causes of inefficiency were related to the layout configuration, material handling, and workstation organization rather than only to machining time.
The qualitative and quantitative analysis of waste is summarized in Table 5.
Table 5.
Waste analysis in the premium connection repair process.
3.5. Labor and Machine Utilization
A labor–machine analysis was conducted for P2, P3, and P4 to evaluate the possibility of redistributing tasks and reducing idle time. Table 6 presents the utilization levels of operators and machines in these stations.
Table 6.
Labor–machine utilization for P2, P3, and P4.
The analysis revealed a strong imbalance in resource utilization. The P4 operator had a utilization of only 13.0%, while the P2 operator had 43.8% idle time. In contrast, the P3 operator reached 100% utilization. These results indicate an opportunity to redistribute activities between P2 and P4 and evaluate the operation of P2–P3–P4 with two operators instead of three, provided that safety, quality, and operational continuity are maintained.
3.6. Current-State VSM
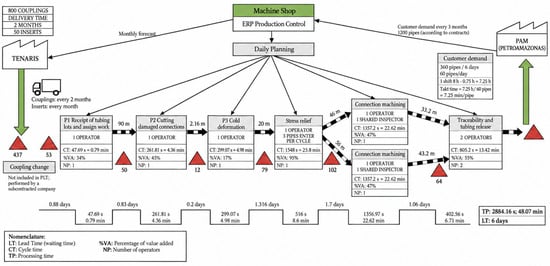
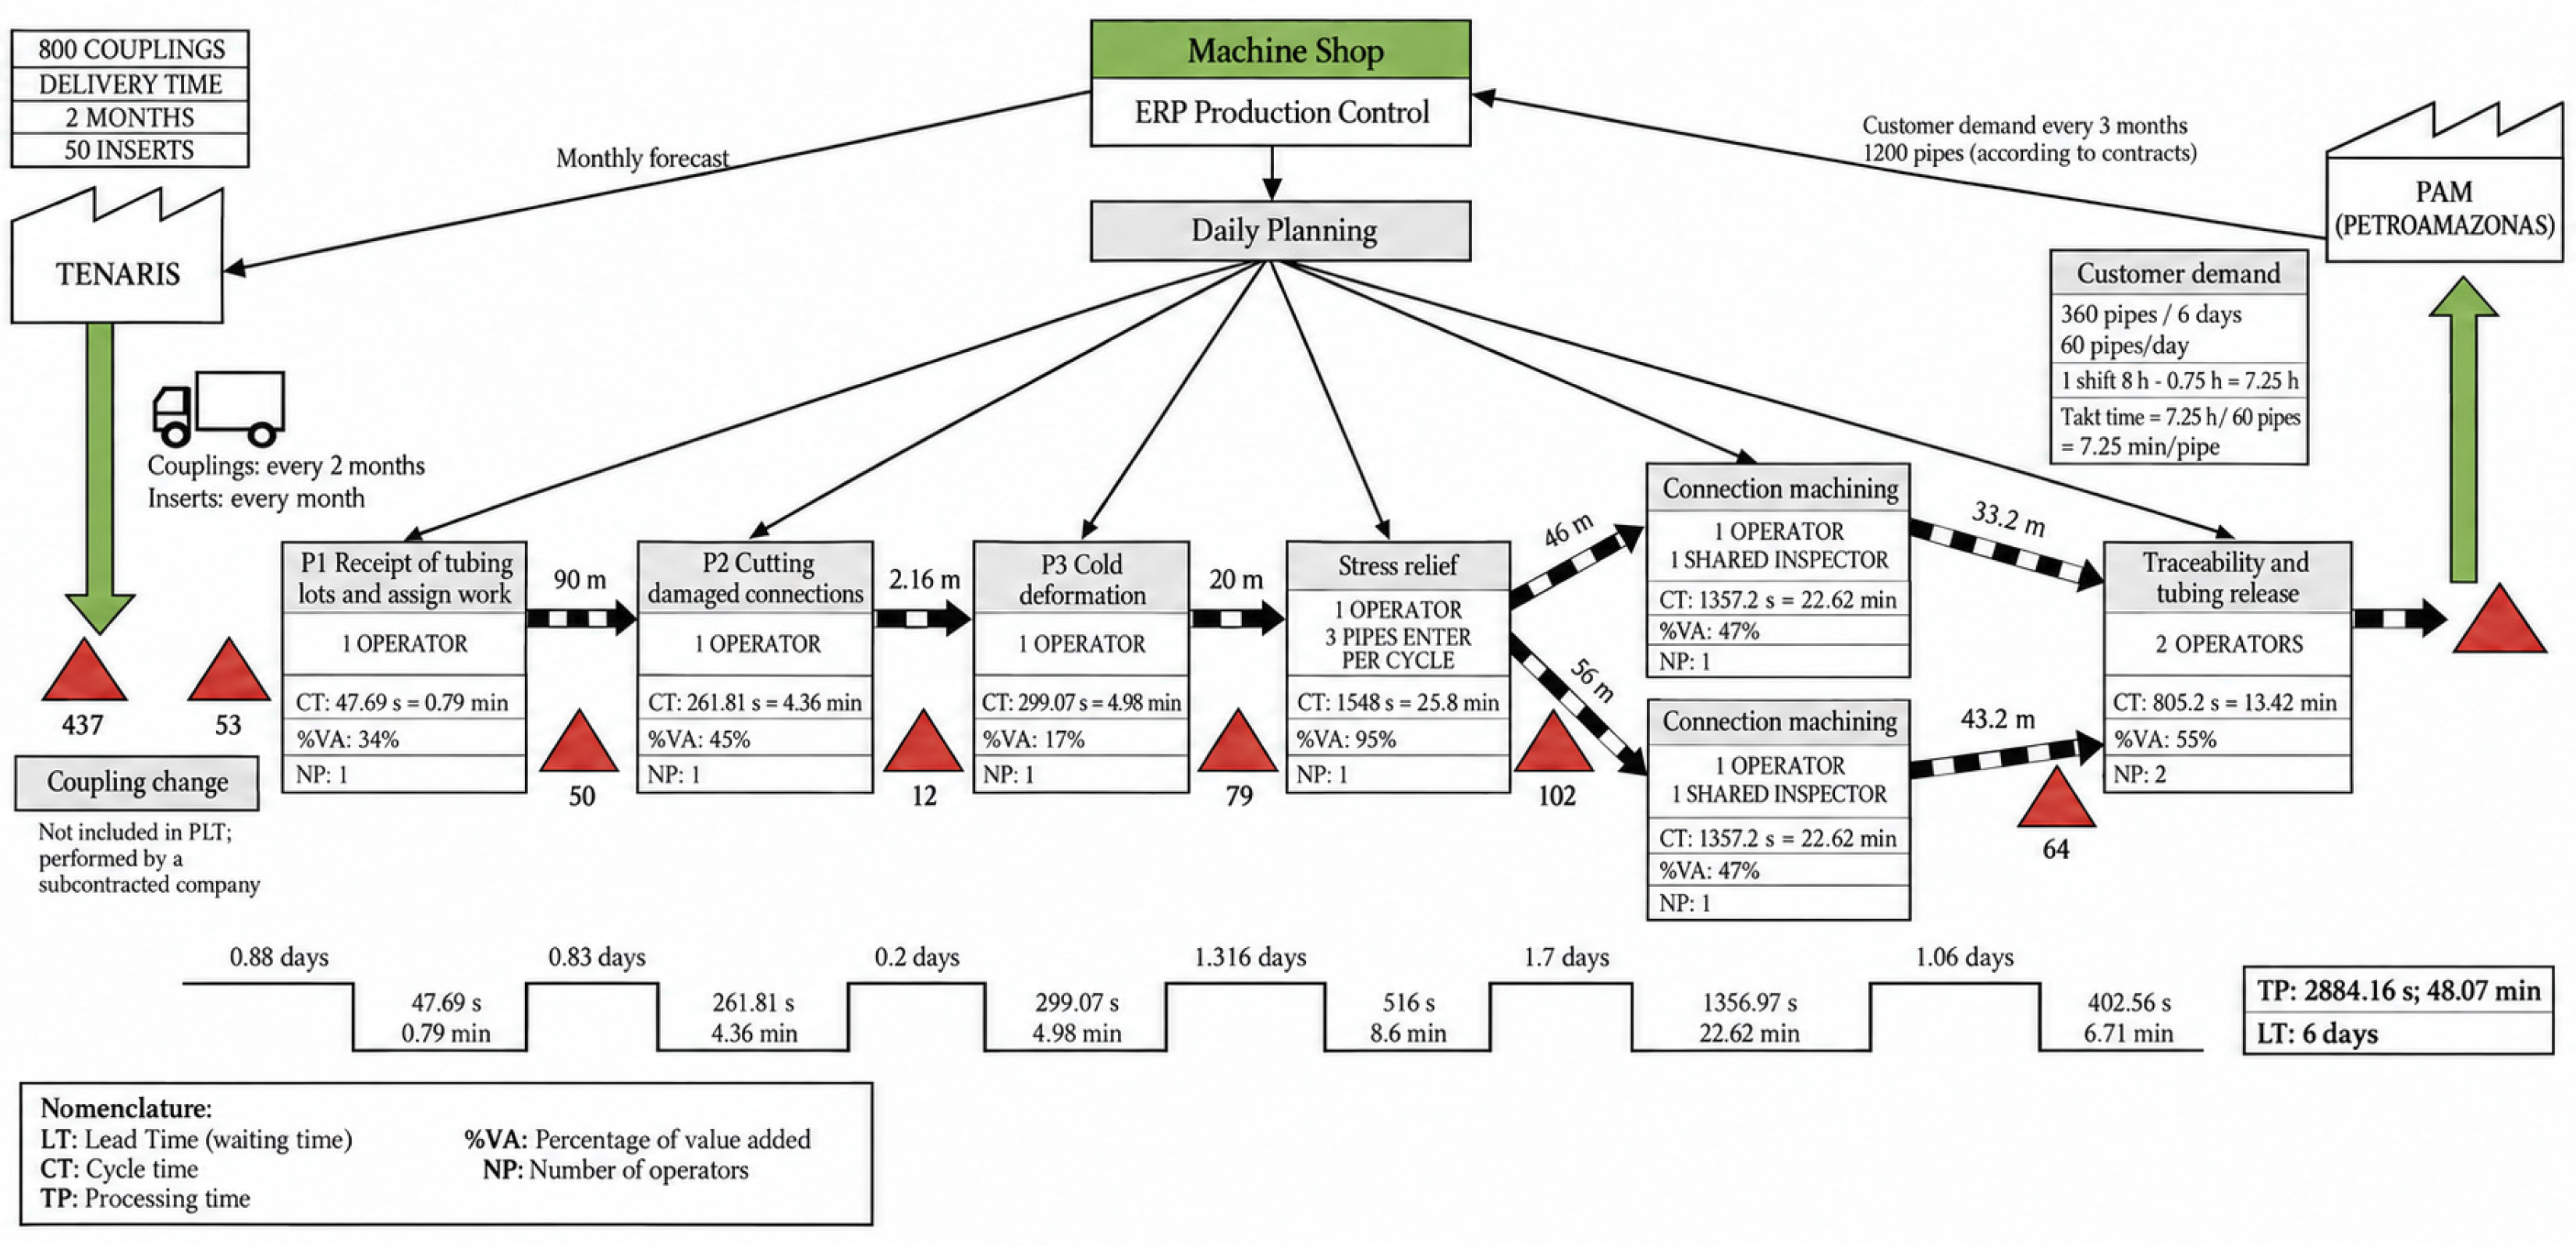
Figure 4 presents the current-state Value Stream Map, developed using the information collected during the study. The map integrates the material flow from the supplier, represented by the customer sending the tubing, to the final customer; the information flow, including production orders, Tenaris authorizations, and weekly planning; data boxes with CT (cycle time), CO (changeover time), number of operators, and availability; WIP inventories observed between processes; and the lower timeline, which shows the breakdown of value-added time and waiting time.
Figure 4.
Current-state Value Stream Map (VSM). CT = cycle time; CO = changeover time; NP = number of operators; WIP = work in process; LT = lead time.
The current-state metrics are as follows: (i) total lead time: 48.07 min, corresponding to the production flow time; (ii) total value-added time: 25.65 min; (iii) value-added ratio: 53.4%; (iv) estimated total WIP: 75–100 pipes; and (v) bottleneck: P5, corresponding to machining, with a cycle time of 22.62 min/pipe.
The transport-distance estimate was obtained from the principal inter-station movements documented in the plant layout: P1–P2 = 51 m, P3–P4 = 20 m, P4–P5 = 46 m, and the external P6 coupling route = 91 m, giving a minimum mapped distance of 208 m before considering additional local handling. The future-state value below 100 m is a layout-scenario target based on co-locating P2–P3–P4 and reducing temporary storage movements.
3.7. Future-State VSM (Conceptual Proposal)
Based on the diagnosis, the future-state VSM was designed, as shown in Figure 5. This map represents a projected improvement scenario, not an implemented state. This proposed map incorporates the following structural improvements:
Figure 5.
Conceptual future-state Value Stream Map (VSM). The map represents a proposed scenario and was not implemented during the study period.
- Relocation of workstations: Development of a U-shaped cell for P2–P3–P4 to shorten the main inter-station transport links identified in the current layout.
- Integration of operations: Unification of P2 and P4 under the responsibility of the same operator, taking advantage of the low utilization observed in P4.
- Pull system with supermarket: Implementation of a Kanban-controlled supermarket between P4 and P5, limiting WIP to 20 pipes.
- Cycle time reduction in P5: Incorporation of an assistant for loading, unloading, and cleaning, and support activities, The projected 20% reduction was calculated as a scenario estimate by applying a 0.80 factor to the measured P5 cycle time: 22.62 min/pipe × 0.80 = 18.10 min/pipe. In addition, SMED is proposed to reduce changeover time from 180 min to less than 60 min.
- Standardization and 5S: Implementation of standardized work and 5S practices across all workstations, with emphasis on P5 and P6.
- Simple automation: Use of motorized racks in P2 and P5 to reduce unnecessary operator movements.
The projected future-state metrics are as follows: (i) P5 cycle time reduced from 22.62 to 18.10 min/pipe; (ii) P5 capacity increased from 19.2 to 24.0 pipes per 435-min equivalent shift; (iii) daily P5 capacity increased from 63.7 to 79.6 pipes/day when the three rotating 8-h shifts are considered; (iv) projected total production flow time below 35 min/pipe, based on the removal or reduction in selected transport, waiting, motion, and assist-ed-handling losses; (v) projected value-added ratio above 65%; and (vi) WIP reduced from the observed 75–100 pipes to fewer than 40 pipes through a Kanban-controlled supermarket. Thus, the demand of 60 pipes/day is covered operationally by the three-shift schedule, while the proposed improvements provide additional capacity margin and reduce waste.
3.8. Summary of Results
Table 7 summarizes the key indicators for the measured current state and the projected future state, including bottleneck cycle time, capacity, lead time, value-added ratio, transport distance, WIP, and the number of operators required in the P2–P3–P4 segment. The comparison should be interpreted as a scenario analysis derived from the current-state VSM and the proposed Lean actions, not as an experimentally validated before-and-after implementation.
Table 7.
Comparison of current-state and proposed future-state indicators.
4. Discussion
The results support the applicability of Value Stream Mapping (VSM) and Lean tools as a diagnostic and future-state design approach in a specialized industrial context that has received limited attention in the literature: the repair of premium oil tubing connections. The following subsections interpret the main findings, contrast them with existing literature, and discuss methodological contributions and limitations.
4.1. Theoretical and Methodological Implications
The findings indicate that VSM can be transferred from high-volume repetitive manufacturing to high-mix, low-volume and repair-service environments when the analysis is adapted to batch flow, shared resources, manual transport, inspection requirements, and contractual demand. This interpretation is consistent with recent VSM studies in manufacturing, maintenance-service, and sustainability-oriented contexts [11,12,13,14,15]. The integration of SIPOC as a preliminary stage proved critical for capturing external interfaces and sources of waiting, despite its limited reported industrial adoption. The VA-NNVA-NVA activity classification enabled effective prioritization: elimination of NVA activities through 5S and optimization of NNVA activities, for example, through statistical process control or Jidoka.
4.2. Waste Profile and Contrast with the Literature
Transportation and motion wastes were dominant, accounting for 63% of NVA time. This result is consistent with findings reported in Latin American SMEs and with recent VSM literature that highlights transport, waiting, inventory, and motion as frequent sources of operational loss in non-continuous flows [11,12,13,14,15]. In this case, these wastes are amplified by the geometry and weight of the pipes. The VA ratio of 53.4% is higher than the 1–5% commonly reported in broad value-stream analyses, mainly because this study used production flow time within the workshop as the scope of analysis. Nevertheless, the remaining 46.6% of NNVA and NVA time reveals a clear improvement opportunity. The bottleneck identified in P5 is consistent with the Theory of Constraints. Although the plant covers 60 pipes/day through three rotating shifts, P5 remains the capacity-controlling operation and leaves little margin in the measured state.
4.3. Impact of the Proposed Improvements
The addition of an assistant in P5 is projected to reduce the cycle time by 20%, from 22.62 to 18.10 min/pipe, by reallocating loading, unloading, cleaning, and handling support activities that do not require direct CNC operation. For the 435-min equivalent shift used in the time-study diagnosis, this raises the estimated P5 capacity from 19.2 to 24.0 pipes/shift. For the actual three-shift rotating schedule, the corresponding daily capacity changes from 63.7 to 79.6 pipes/day, so the demand of 60 pipes/day is covered with a larger operating margin. The U-shaped cell is expected to reduce transport by shortening the observed P1–P2, P3–P4, P4–P5, and P6 movement routes, which together account for at least 208 m in the current layout.
4.4. Limitations
The study is limited to a single case, a short observation horizon of six weeks, the absence of full implementation, and a possible underestimation of defects, which represented 12% of NVA time. These factors restrict the external validity of the findings.
4.5. Contributions
This study provides novel evidence in a restricted industrial sector, a replicable integrative methodological approach, and low-cost solutions relevant to SMEs in emerging economies.
4.6. Key Lessons
VSM is a gemba-based diagnostic tool; data require contextualization; and optimization must focus on the global flow, or throughput, rather than on local efficiencies.
5. Conclusions
This study addressed the diagnosis and improvement design of the premium connection repair process in an Ecuadorian oilfield workshop through the application of Value Stream Mapping and Lean tools. The main findings and contributions are summarized as follows:
- A quantitative and qualitative diagnosis of the current process state was achieved. The VSM revealed a total production flow time of 48.07 min/pipe, of which only 53.4% corresponded to value-added activities. Although this ratio is higher than that reported in extensive production systems, it still shows a significant improvement opportunity, with 10.83 min of pure waste per unit.
- The machining process, identified as P5, was determined to be the system bottleneck, with a cycle time of 22.62 min/pipe, which is significantly higher than the diagnostic single-shift takt Time of 7.25 min/pipe. This restriction limits the equivalent-shift capacity to 19.2 pipes, In daily operation, however, the plant uses three rotating 8-h shifts, increasing the available machining time and allowing a measured P5 capacity of 63.7 pipes/day, which covers the 60 pipes/day demand with a narrow margin.
- The waste analysis showed that transportation and unnecessary motion represent 63% of pure waste, mainly caused by an inadequate layout and the absence of continuous flow. Excessive distances between stations, reaching up to 91 m, and the push production system generate intermediate inventories and waiting times that increase lead time.
- A conceptual future-state VSM was designed by integrating low-investment and high-feasibility improvements: relocation of workstations to enable a U-shaped P2–P3–P4 cell, incorporation of an assistant in P5, application of SMED to reduce changeover times, simple rack automation, and establishment of a pull system with a supermarket. The projections estimate a 20% reduction in P5 cycle time, a 25% increase in P5 capacity, a production flow-time reduction greater than 27%, and an improvement of the value-added ratio to above 65%. These values are scenario estimates and were not experimentally validated during the study period.
- From an academic perspective, this study contributes to the literature gap on Lean applications in oilfield tubular repair workshops by showing how VSM can be adapted to a high-mix, low-volume repair context. Methodologically, it highlights the value of integrating time study, labor-machine analysis, SIPOC, and qualitative supervisor input as preparatory phases for robust value stream mapping.
- For industrial practice, the proposed actions provide a concrete roadmap for licensed repair workshops seeking to increase competitiveness without requiring significant capital investment. The approach prioritizes the reorganization of existing resources and the elimination of waste. This is particularly relevant in emerging economies, where operational efficiency is critical for competitiveness in volatile markets.
In summary, this research provides an evidence-based diagnosis and a structured improvement proposal for a specialized repair process in the oil industry. The findings suggest that VSM, when combined with work-study data and Lean tools, can guide the identification of bottlenecks, waste sources, and feasible improvement scenarios. Future research should implement the proposed changes, measure post-implementation performance, and evaluate how the added capacity margin from the three-shift schedule can be sustained under changes in demand, product mix, and inspection availability.
Author Contributions
Conceptualization, V.M.-R. and C.C.; methodology, M.S.C.; software, J.A.-V.; validation, C.P.-S., V.M.-R. and M.S.C.; formal analysis, C.C.; investigation, V.M.-R.; resources, J.A.-V.; data curation, C.P.-S.; writing—original draft preparation, C.P.-S. and J.A.-V.; writing—review and editing, V.M.-R.; visualization, C.C.; supervision, M.S.C.; project administration, C.P.-S.; funding acquisition, V.M.-R. All authors have read and agreed to the published version of the manuscript.
Funding
This research received no external funding.
Institutional Review Board Statement
Not applicable. This study did not involve biomedical research with humans or animals. The research was conducted in an industrial process context and was based on operational data, process observation, and technical interviews.
Informed Consent Statement
Informed consent was obtained from the personnel who participated in the interviews and process observations. No personal, sensitive, or identifiable information from participants is reported in this study.
Data Availability Statement
The data supporting the findings of this study are available from the corresponding author upon reasonable request. Due to industrial confidentiality restrictions, raw operational data and detailed process records are not publicly available.
Acknowledgments
The authors express their sincere gratitude to the Universidad Técnica de Ambato through its Directorate of Research and Development (DIDE) for the institutional support and funding that made this research possible. Special recognition is extended to the research group in Industrial Engineering for their continuous encouragement and academic guidance throughout this study. The authors also gratefully acknowledge Sertecpet S.A. and the personnel of the machining plant for facilitating access to the facilities and supporting the development of the fieldwork. Special thanks are extended to the technical staff and operators of workstations P1 to P6 for their collaboration during process observation and data collection. During the preparation of this manuscript, the authors used ChatGPT (GPT-6 Luna, OpenAI, San Francisco, CA, USA, https://openai.com/chatgpt, accessed on 11 November 2026) for language editing, translation support, and assistance in redrawing the Value Stream Mapping figures. The authors reviewed, verified, and edited all AI-assisted outputs and take full responsibility for the scientific content, data, calculations, interpretations, and final version of the manuscript.
Conflicts of Interest
The authors declare no conflicts of interest.
Abbreviations
The following abbreviations are used in this manuscript:
| API | American Petroleum Institute |
| CNC | Computer Numerical Control |
| JIT | Just in Time |
| LQR | License Quality Representative |
| MES | Manufacturing Execution System |
| MTR | Material Testing Report |
| NVA | Non-Value Added |
| NNVA | Necessary but Non-Value Added |
| P1 | Process 1, reception and work assignment |
| P2 | Process 2, cutting of damaged connections |
| P3 | Process 3, cold forming |
| P4 | Process 4, stress relief |
| P5 | Process 5, machining of the new connection |
| P6 | Process 6, traceability and release |
| SIPOC | Suppliers, Inputs, Process, Outputs, Customers |
| SMED | Single-Minute Exchange of Die |
| TOC | Theory of Constraints |
| TPS | Toyota Production System |
| TSH Blue | TenarisHydril Blue connection |
| VA | Value Added |
| VSM | Value Stream Mapping |
| WIP | Work in Process |
References
- Tenaris. TenarisHydril Blue® Connection; Tenaris S.A.: Buenos Aires, Argentina, 2022; Available online: https://www.tenaris.com/umbraco/surface/downloads/pdf?url=%2Fmedia%2Fn0pe0ouv%2Frg-blue-r6.pdf (accessed on 11 November 2026).
- Womack, J.P.; Jones, D.T. Lean Thinking: Banish Waste and Create Wealth in Your Corporation; Simon & Schuster: New York, NY, USA, 1996; ISBN 978-0-684-81035-5. [Google Scholar]
- Ohno, T. Toyota Production System: Beyond Large-Scale Production; Productivity Press: Cambridge, MA, USA, 1988; ISBN 978-0-915299-14-0. [Google Scholar]
- Rother, M.; Shook, J. Learning to See: Value Stream Mapping to Add Value and Eliminate Muda; Lean Enterprise Institute: Cambridge, MA, USA, 1999; ISBN 978-0-9667843-0-5. [Google Scholar]
- Shah, R.; Ward, P.T. Lean manufacturing: Context, practice bundles, and performance. J. Oper. Manag. 2003, 21, 129–149. [Google Scholar] [CrossRef] [Scilit]
- Liker, J.K. The Toyota Way: 14 Management Principles from the World’s Greatest Manufacturer; McGraw-Hill: New York, NY, USA, 2004; ISBN 978-0-07-139231-0. [Google Scholar]
- Yin, R.K. Case Study Research: Design and Methods, 5th ed.; SAGE Publications: Thousand Oaks, CA, USA, 2014; ISBN 978-1-4522-4256-9. [Google Scholar]
- Niebel, B.W.; Freivalds, A. Ingeniería Industrial: Métodos, Estándares y Diseño del Trabajo, 12th ed.; McGraw-Hill: México D.F., México, 2009; ISBN 978-970-10-6962-5. [Google Scholar]
- Pyzdek, T.; Keller, P.A. The Six Sigma Handbook, 4th ed.; McGraw-Hill: New York, NY, USA, 2014; ISBN 978-0-07-184053-8. [Google Scholar]
- Abdulmalek, F.A.; Rajgopal, J. Analyzing the benefits of lean manufacturing and value stream mapping via simulation: A process sector case study. Int. J. Prod. Econ. 2007, 107, 223–236. [Google Scholar] [CrossRef] [Scilit]
- Patil, A.; Pisal, M.; Suryavanshi, C. Application of value stream mapping to enhance productivity by reducing manufacturing lead time in a manufacturing company: A case study. J. Appl. Res. Technol. 2021, 19, 11–22. [Google Scholar] [CrossRef] [Scilit]
- Lobo, C.; Calado, R.; Conceição, R. Evaluation of value stream mapping (VSM) applicability to the oil and gas chain processes. Int. J. Lean Six Sigma 2020, 11, 309–330. [Google Scholar] [CrossRef] [Scilit]
- Salwin, M.; Pszczółkowska, K.; Pałęga, M.; Kraslawski, A. Value-stream mapping as a tool to improve production and energy consumption: A case study of a manufacturer of industrial hand tools. Energies 2023, 16, 7292. [Google Scholar] [CrossRef] [Scilit]
- Batwara, A.; Sharma, V.; Makkar, M.; Giallanza, A. Towards smart sustainable development through value stream mapping: A systematic literature review. Heliyon 2023, 9, e15852. [Google Scholar] [CrossRef] [Scilit] [PubMed]
- Sinatrya, Y.; Diah Ekawati, A. Implementing lean manufacturing using value stream mapping for automotive maintenance efficiency. Adv. Sustain. Sci. Eng. Technol. 2025, 7, 0250404. [Google Scholar] [CrossRef] [Scilit]

Disclaimer/Publisher’s Note: The statements, opinions and data contained in all publications are solely those of the individual author(s) and contributor(s) and not of MDPI and/or the editor(s). MDPI and/or the editor(s) disclaim responsibility for any injury to people or property resulting from any ideas, methods, instructions or products referred to in the content. |
© 2026 by the authors. Licensee MDPI, Basel, Switzerland. This article is an open access article distributed under the terms and conditions of the Creative Commons Attribution (CC BY) license.