


Abstract
Methane (CH4) is a high-impact greenhouse gas with significant implications for near-term climate warming and has emerged as a critical target of global climate mitigation efforts such as the Paris Agreement and the Global Methane Pledge. Despite increasing international attention, methane emission trends vary considerably across countries due to differences in economic structure, energy systems and agricultural activities, leading to a significant gap between current emission trends and global mitigation targets. This research presents a data-driven approach to analyze long-term methane emission dynamics, country profiling and future projections across five representative countries using data from the Emissions Database for Global Atmospheric Research (EDGAR). The assessment results indicate considerable divergence in both emissions magnitude and growth trajectories. China remains the largest emitter in absolute terms, while Pakistan exhibits the fastest growth and highest methane share within its national greenhouse gas profile. In contrast, the United States shows near-stabilization, whereas Australia and Vietnam show relatively low emissions with modest variability. Methane forecasts indicate persistence in historical patterns with no country demonstrating a meaningful decline. A policy-oriented evaluation shows that none of the selected countries are on track to achieve the Global Methane Pledge target of a 30% reduction in methane emissions by 2030 relative to the 2020 baseline. These findings highlight the need for country-specific mitigation strategies focused on dominant emission sectors and national methane emission characteristics.
1. Introduction
Methane (CH4) is the second most significant anthropogenic greenhouse gas after carbon dioxide and plays a critical role in near-term climate warming. Despite its relatively short atmospheric lifetime, methane exhibits a substantially higher global warming potential than CO2, making it a key target for rapid climate mitigation [1,2,3]. Recent global assessments indicate that methane contributes approximately 17.9% of total greenhouse gas emissions and has increased by nearly 30% since 1990 [4]. Consequently, reducing methane emissions is widely recognized as one of the most effective strategies towards the net zero transition in the coming decades [5]. In response, international frameworks such as the Paris Agreement and Global Methane Pledge (GMP) have established ambitious mitigation targets. In particular, the GMP aims to reduce global methane emissions by at least 30% below 2020 levels by 2030 [6]. Despite widespread participation in the Global Methane Pledge, recent assessments indicate that projected emission trajectories remain misaligned with the 2030 reduction target and show a persistent gap between national commitments and actual outcomes [7].
Global emission inventories provide the primary basis for quantifying methane emissions across countries and sectors. Among these, the EDGAR (Emissions Database for Global Atmospheric Research) Community GHG database offers a globally consistent, long-term dataset suitable for comparative analysis [4,8]. In addition to enabling cross-country comparability, EDGAR provides standardized and independently derived emission estimates that serve as a benchmark for tracking global and national emission trends. Evidence from recent global assessments further indicates that methane emissions are highly concentrated, with a substantial share originating from a limited number of countries and key sectors such as agriculture, fossil fuels and wastes [7]. While such inventories enable detailed assessments, they do not inherently provide predictive insights into future emission trajectories and therefore limit their utility for forward-looking policy evaluation. Traditional inventory-based methods, while essential, often suffer from uncertainties, reporting delays and limited temporal resolution, especially in rapidly developing regions [1,9,10]. Moreover, observational approaches based on in-situ measurements and satellite retrievals face inherent limitations such as restricted spatial coverage, retrieval uncertainties and sensitivity to atmospheric conditions, which hinder large-scale methane monitoring [11]. In contrast, data-driven and machine learning approaches have emerged as powerful tools for improving estimation and prediction of emissions concentrations by leveraging large-scale observational datasets and advanced computational techniques [12,13]. However, the existing studies remain fragmented across several key dimensions [14]. First, many approaches rely on single-source data streams, such as satellite-only, climate-only, or local scale-only [15] datasets, limiting their ability to capture the complex interactions between environmental and anthropogenic drivers of methane emissions [11]. Second, predictive models often depend on low-dimensional or region-specific inputs, restricting their generalizability across diverse spatial and temporal contexts. Third, there is a lack of integrated frameworks that combine multi-decadal emission inventories with interpretable forecasting approaches to evaluate future emission trajectories in relation to policy-relevant targets, such as the Global Methane Pledge [7].
To address these gaps, this research presents a comprehensive data-driven framework for analyzing long-term methane emission dynamics, country-level profiling and future projections across five representative countries using data from EDGAR inventories. The framework integrates an assessment module for historical trend analysis (1970–2024) with a predictive module based on Autoregressive Integrated Moving Average (ARIMA) modeling to forecast emissions up to 2030. The contributions of this study are threefold. First, it provides a detailed long-term assessment of methane emission dynamics and country-level profiles. Second, it establishes a consistent and interpretable framework for projecting future emissions pathways to 2030, enabling robust cross-country comparisons over extended temporal horizons. Finally, it enables policy-relevant evaluation through explicit assessment of alignment with the Global Methane Pledge reduction target, thereby bridging the gap between historical emissions trends and forward-looking climate policy assessment. While explainable artificial intelligence approaches such as SHAP analysis can provide additional insights into sector-specific emission drivers in multi-factor environmental systems, the present study focuses on long-term national methane emission trajectories using globally consistent inventory-based time-series data. In this context, ARIMA-based forecasting provides an interpretable and suitable framework for comparative long-term policy-oriented assessment.
2. Materials and Methods
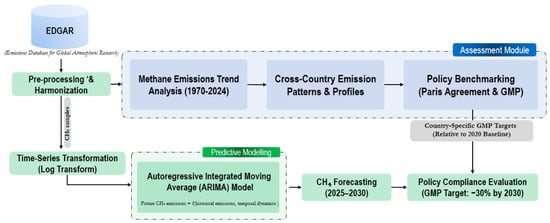
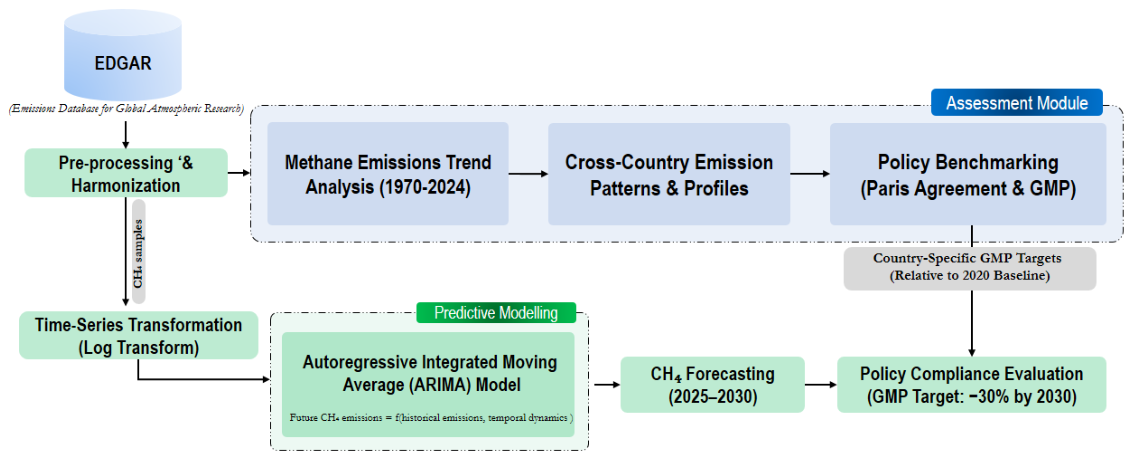
This study adopts a data-driven framework for methane (CH4) emissions assessment and forecasting using global inventory data. The proposed methodology comprises two main components: an assessment module for analyzing long-term emission trends and cross-country patterns, and a predictive module for forecasting future emissions as shown in Figure 1. Historical data from the EDGAR database (1970–2024) are preprocessed and log-transformed to ensure numerical stability. An autoregressive integrated moving average (ARIMA) model is then employed to project methane emissions for the period 2025–2030. The resulting forecasts are subsequently evaluated against Global Methane Pledge (GMP) targets relative to the 2020 baseline to assess policy compliance.
Figure 1.
Proposed framework for methane emissions assessment and predictive modeling.
2.1. Data Source and Research Design
This study utilizes the EDGAR Community GHG database (EDGAR_2025_GHG), which provides a multipurpose, independent and globally consistent dataset of anthropogenic emissions of greenhouse gases and air pollutants [4,8]. Developed by the Joint Research Centre (European Commission), EDGAR generates emission estimates using international statistics and a harmonized methodology based on Intergovernmental Panel on Climate Change (IPCC) guidelines. In contrast to self-reported national inventories submitted under the United Nations Framework Convention on Climate Change (UNFCCC), EDGAR provides independent and methodologically consistent estimates enabling robust cross-country comparisons over long time periods. In this study, methane (CH4) emissions data for the period of 1970–2024 were extracted and harmonized, with emissions converted from gigagrams (Gg) to megatonnes (Mt) for consistency and interpretability.
The selection of case-study countries was designed to capture diverse methane emission systems across both developed and developing economies. Globally, methane emissions primarily originate from three major sectors: energy production, agriculture, and waste management [16]. China and the United States were selected as major emitters representing large industrialized economies, where methane emissions are strongly associated with the energy sector, particularly coal mining and oil and gas systems. Australia represents a developed economy where emissions are predominantly driven by livestock agriculture. In contrast, Vietnam and Pakistan represent rapidly developing economies, where agricultural activities such as rice cultivation and livestock production contribute significantly to methane emissions. This selection also highlights differences in the relative contribution of methane within national emission structures. In 2024, methane accounted for approximately 47.7% of total greenhouse gas emissions in Pakistan, compared to 24.4% in Australia, 19.9% in Vietnam, 14.3% in the United States, and 9.6% in China [4]. Overall, this selection provides a representative cross-section of emission structures across diverse economic systems and sectors enabling a structured comparative analysis of long-term trends and their implications within the context of international climate frameworks, including the Paris Agreement and the Global Methane Pledge. This sectoral composition further reinforces the classification of China and the United States as energy-dominated systems, Australia as livestock-driven, and Pakistan and Vietnam as agriculture-intensive methane systems [4].
2.2. Data Preprocessing and Transformation
The methane (CH4) emissions data obtained from the EDGAR database were initially organized in a wide format, with emissions reported annually for each country. The dataset was transformed into a long time-series format, where each observation corresponds to a country-year pair, enabling temporal analysis and modeling. A subset of five countries (China, United States, Australia, Vietnam, and Pakistan) was selected for analysis. To improve numerical stability and ensure physically meaningful forecasts. A logarithmic transformation was applied to the emission time series:
where denotes methane emissions at time t. This transformation reduces variance, mitigates the influence of extreme values, and prevents the generation of non-physical negative predictions during forecasting. The processed time series data were then used as input for both the assessment module and the predictive modeling framework.
2.3. Assessment Module
The assessment module focuses on the analysis of historical CH4 emission patterns using EDGAR data for the period of 1970–2024. Temporal trends for each country were examined to characterize long-term emission trajectories. A comparative analysis was conducted to evaluate differences in emission levels and growth patterns across the selected countries. Emissions were further contextualized with respect to major climate policy frameworks, including the Paris Agreement and the Global Methane Pledge (GMP), to enable policy-relevant comparison of historical trends.
2.4. Predictive Modeling Framework
The predictive module employs a univariate time-series modeling approach based on the Autoregressive Integrated Moving Average (ARIMA) model to forecast methane (CH4) emissions [17,18]. ARIMA is well suited for long-term temporal data and provides an interpretable framework for modeling emission dynamics without requiring external explanatory variables [19]. Unlike data-intensive machine learning approaches, ARIMA is particularly suitable for long-term univariate inventory-based datasets where the primary objective is temporal forecasting and comparative trend assessment rather than multi-factor attribution analysis. The model is applied to the log-transformed series described in Section 2.2 and represents future emissions as a function of past observations, underlying temporal trends, and past prediction errors. Accordingly, the emissions dynamics can be expressed as:
where denotes the log-transformed methane emissions at time t, c is a constant term representing the long-term drift, are autoregressive coefficients capturing dependence on past emissions of p lagged data points, are moving average coefficients representing the influence of moving-average order q for past prediction errors, and is a white noise error term. Differencing of order d is applied to the non-stationary time-series of emissions to make it trend stationary with data points.
In this framework, the model parameters provide interpretable insights into the underlying emission dynamics. The constant term (c) represents the long-term direction of the emission trajectory, where positive values () indicate a systematic increasing trend, values close to zero () suggest stability, and negative values () reflect a declining trend in methane emissions. The autoregressive coefficients () capture persistence in the time series, quantifying the extent to which current emissions depend on past values. Higher values of indicate strong inertia and sustained emission patterns, whereas lower values imply greater variability and weaker dependence on historical emissions. The moving average coefficients () account for short-term fluctuations by incorporating the influence of past prediction errors. Higher values of reflect stronger correction of previous shocks, while lower values indicate smoother continuation of emission trajectories with limited short-term adjustments. Model parameters were selected using the Akaike Information Criterion (AIC) within a constrained search space to ensure model parsimony and avoid overfitting. The ARIMA model was calibrated independently for each country using the full historical dataset (1970–2024), enabling the capture of country-specific temporal dynamics and persistence patterns in methane emissions. Finally, forecasts were generated for the period 2025–2030 using the fitted models. Since the model operates in the transformed domain, forecasts were exponentiated to return to the original emission scale for interpretation and policy evaluation.
2.5. Policy Evaluation Framework
To assess the policy relevance of the projected methane (CH4) emission trajectories, the forecast emissions for 2030 were evaluated against the Global Methane Pledge (GMP) target. The GMP aims to achieve a reduction of at least 30% in methane emissions relative to 2020 levels by 2030. Let denote the methane emissions in the baseline year 2020, and denote the ARIMA forecast in the logarithmically transformed domain. The projected emissions in the original scale are obtained as:
The target emission level corresponding to the GMP can then be expressed as:
In order to provide a more detailed assessment of policy performance, the degree of alignment with the GMP target was classified into three levels based on the relationship between projected emissions and the target threshold. A country is considered
- aligned, if , indicating that the GMP reduction goal is achieved.
- partially aligned, if , reflecting a reduction relative to baseline levels but insufficient to meet the GMP target.
- not aligned, if , indicating continued growth in methane emissions.
This classification framework enables a comparative evaluation of mitigation progress across countries with differing emission trajectories.
3. Results
This section presents a comparative analysis of methane emissions across the selected countries, integrating historical trends, forecasts, and policy alignment. The results highlight clear differences in emission magnitude, growth patterns, and progress toward methane mitigation targets.
3.1. Methane Emission Dynamics, Country Profiles, and Projected Trends
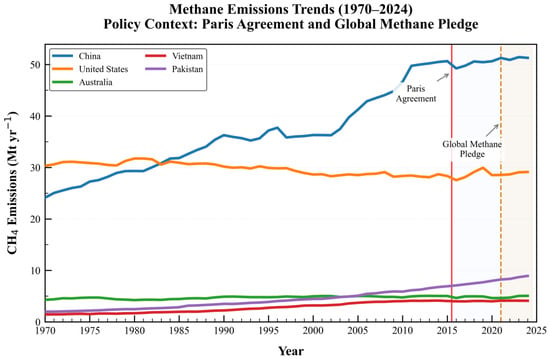
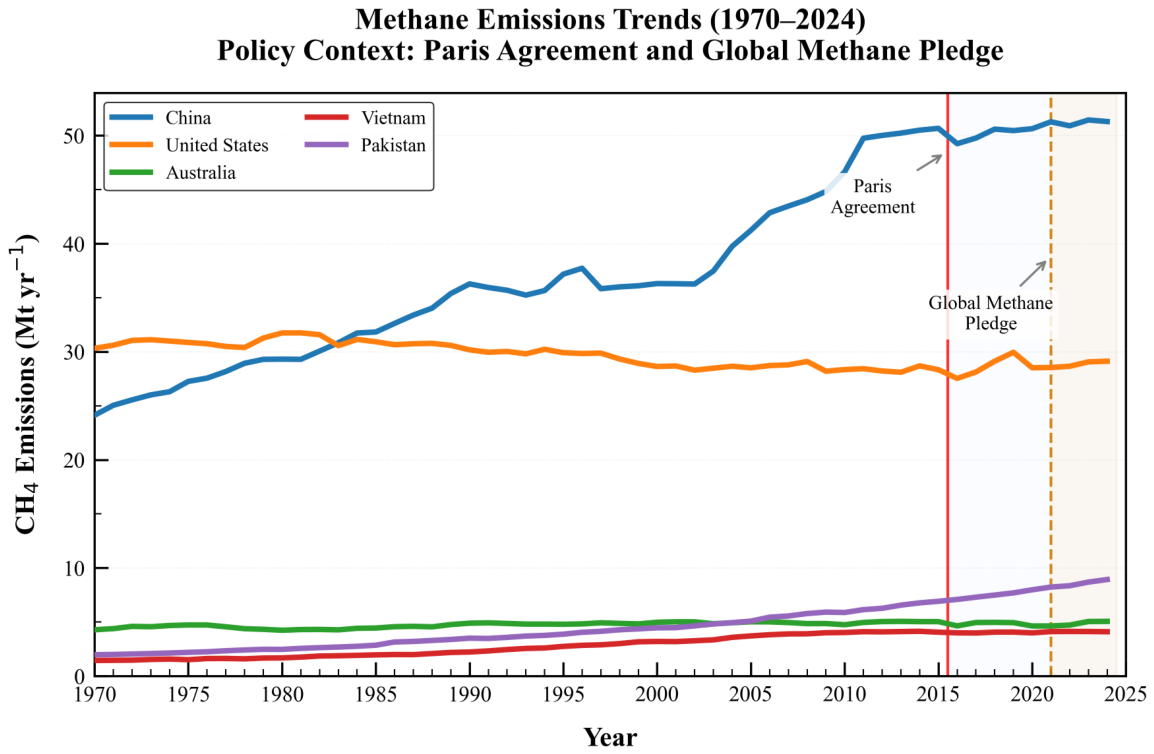
The long-term evolution of CH4 emissions from 1970 to 2024 across the selected countries is presented in Figure 2. The trajectories demonstrate significant heterogeneity in both emission magnitude and growth dynamics. China remains the dominant emitter, exhibiting a sustained upward trajectory, with emissions reaching approximately 51.3 Mt in 2024, whereas the United States shows relatively stable emissions with a slight overall decline. In contrast, Pakistan demonstrates the fastest growth rate despite lower absolute emissions, indicating strong upward dynamics. Australia and Vietnam maintain comparatively lower emission levels, with moderate variability and gradual changes. This behavior is consistent with the ARIMA-based characterization, where positive drift () and persistence () drive continued growth, while near-zero drift () reflects stabilization.
Figure 2.
Long-term methane emissions trends (1970–2024) for selected countries.
To contextualize these trends, the 2024 GHG composition highlights substantial variation in CH4 share across countries [4,7], with Pakistan exhibiting the highest contribution (47.7%), followed by Australia (24.4%), Vietnam (19.9%), the United States (14.3%), and China (9.6%). This indicates that differences are driven not only by absolute emissions but also by methane’s structural importance within national profiles. Pakistan thus emerges as a methane-intensive economy. China, despite its dominance in absolute emissions, shows a lower methane share, as methane emissions are mainly associated with fuel exploitation (49.6%), followed by agriculture (33.6%) and wastes (13.2%) [4]. Australia and Vietnam occupy intermediate positions, with emissions primarily driven by livestock and rice-based agriculture, respectively.
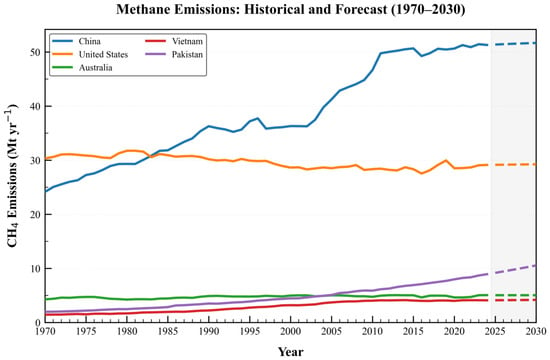
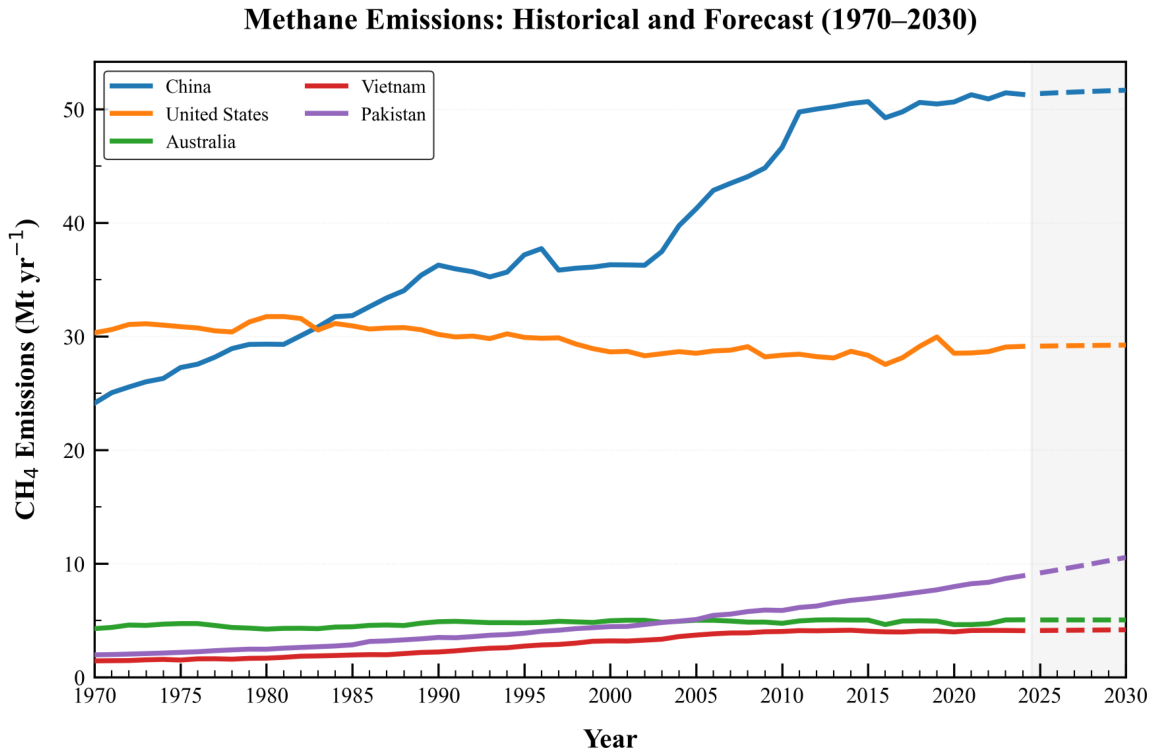
Figure 3 presents the historical and projected CH4 emissions trajectories for the selected countries, while Table 1 summarizes the observed values for 2020–2024 and the corresponding projections for 2025–2030. The projections indicate strong persistence in country-specific emission dynamics, with no evidence of convergence across trajectories. From the observations, China exhibits continued growth with partial stabilization but remains above the reduction pathways required for meaningful mitigation, increasing from 51.294 to 53.558 Mt between 2024 and 2030. Pakistan demonstrates an accelerating growth, rising from 8.931 to 10.574 Mt, indicating increasing divergence from mitigation targets. In contrast, the United States exhibits near-stabilization, with emissions remaining largely unchanged over the forecast period, yet still above levels consistent with reduction trajectories. Australia and Vietnam show slight projected declines after 2024; however, these reductions are modest and do not constitute a structural downward shift. Instead, both countries stabilize around current emission levels rather than transitioning toward sustained reductions, indicating that future changes are likely to be incremental rather than transformative. Overall, the forecasts indicate that methane emission trajectories are dominated by structural inertia, with limited deviation from historical patterns. Importantly, no country exhibits a projected decline of sufficient magnitude to align with the reduction pathway implied by the Global Methane Pledge. This highlights a persistent gap between projected emissions pathways and internationally agreed methane reduction targets.
Figure 3.
Historical and forecast CH4 emissions (1970–2030). Solid lines: observed data. Dashed lines: ARIMA-based projections for 2025–2030; shaded region: forecast period.
Table 1.
Methane emissions in megatonnes (Mt) for the selected countries, including observed values for 2020–2024 and ARIMA-based projections for 2025–2030.
The projected methane trajectories should also be interpreted in the context of country-specific emission structures. Methane emissions in Pakistan and Vietnam are predominantly associated with agricultural activities, particularly livestock production and rice cultivation, while Australia is largely livestock-driven. In contrast, methane emissions in China and the United States are more strongly linked to energy-intensive sectors, including coal mining, oil and gas systems, industrial activities, and waste management. These structural differences imply that methane mitigation strategies should be sector-specific rather than uniformly applied across countries. For agriculture-dominated economies, mitigation efforts must balance emission reduction with food security and agricultural productivity, whereas interventions targeting fossil fuel extraction, energy production, and waste management may provide greater mitigation potential in industrialized economies.
3.2. Policy Alignment with Global Methane Pledge Targets
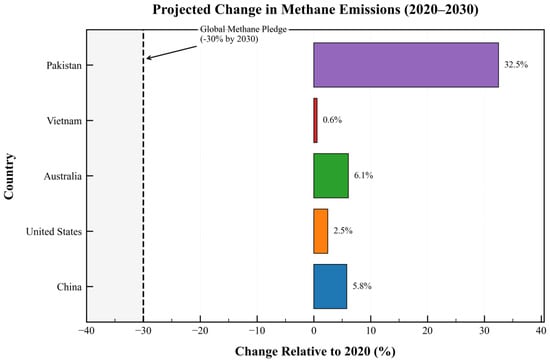
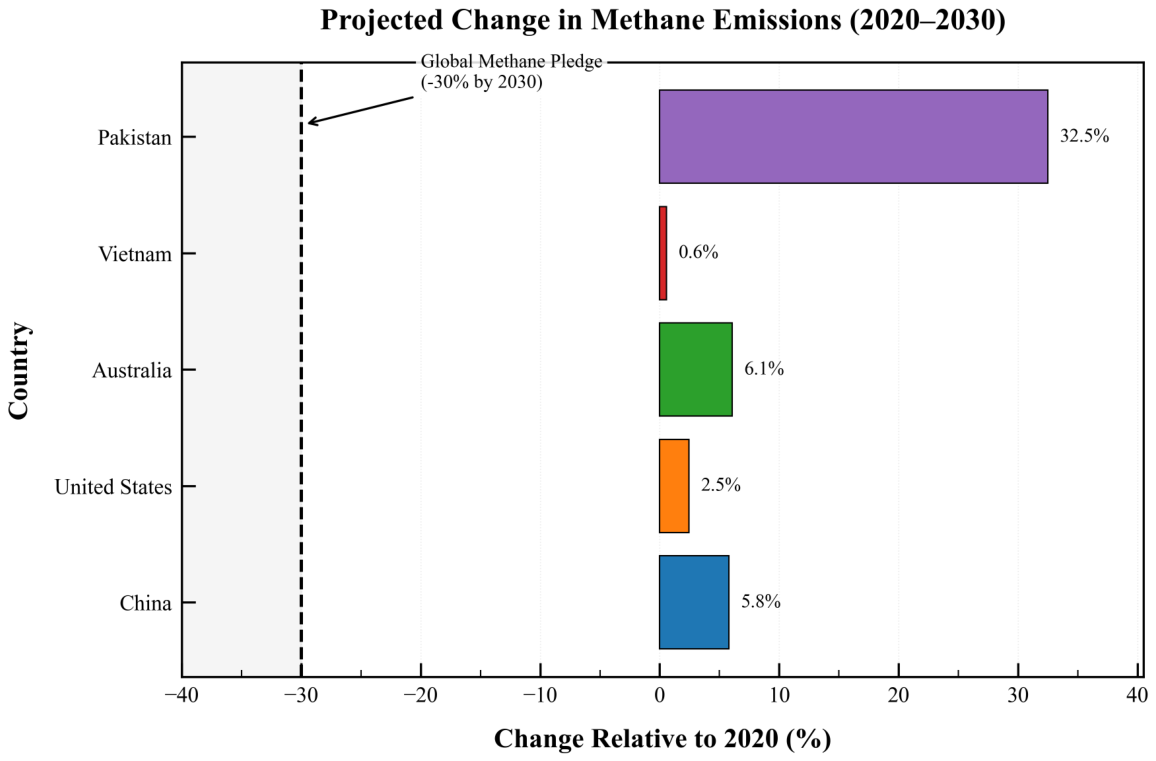
Projected methane emissions for 2030 were evaluated against the Global Methane Pledge (GMP) target of a 30% reduction relative to 2020 levels. The projections are derived from ARIMA forecasts and converted to the original scale as in Equation (3). Figure 4 and Table 2 present the projected changes relative to the 2020 baseline. None of the selected countries meet the GMP target and all projected emissions remain above baseline levels. It shows a lack of alignment with the required reduction target. Pakistan exhibits the largest increase (+32.5%), indicating the strongest divergence from the target and reflecting rapidly expanding emission sources. China also shows continued growth (+5.8%), suggesting persistent structural dependence on emission-intensive sectors. The United States exhibits near-stabilization (+2.5%), yet fails to achieve the reductions required for compliance. Australia and Vietnam show comparatively smaller increases (+6.1% and +0.6%, respectively) and partial stabilization after 2024; however, these changes remain insufficient to meet the 30% reduction target, indicating only partial alignment in trajectory but not in outcome.
Figure 4.
Projected percentage change in methane emissions (2020–2030).
Table 2.
Projected methane emissions in 2030 relative to the 2020 baseline.
Overall, the results show a substantial gap between projected emission trajectories and GMP targets, indicating that current mitigation efforts are insufficient to induce the scale of reductions required by 2030. This finding is consistent with global assessments suggesting that existing policy frameworks remain inadequate to achieve meaningful methane mitigation in the near term [7].
4. Conclusions and Future Work
This study has presented a comprehensive framework for analyzing methane emissions over time, integrating historical assessment, ARIMA-based forecasting, and policy alignment evaluation across five representative countries. The results demonstrate clear divergence in emission trajectories, reflecting strong heterogeneity in both magnitude and growth patterns. China remains the largest emitter in absolute terms, while Pakistan exhibits the most rapid growth and highest methane intensity. In contrast, the United States shows near-stabilization, whereas Australia and Vietnam maintain relatively low emission levels with modest variability. Forecasts indicate strong temporal persistence, with projected trajectories largely extending historical patterns. Critically, none of the countries achieve reductions consistent with the Global Methane Pledge target of a 30% decrease by 2030. This highlights a structural gap between current emissions pathways and policy objectives, indicating that existing mitigation efforts are insufficient to induce a transition toward low-methane trajectories. These findings highlight the need for targeted, country-specific mitigation strategies that address underlying sectoral drivers, particularly in energy-intensive and agriculture-dominated systems. Future work should focus on integrating sectoral disaggregation, policy scenario analysis, and hybrid modeling approaches to capture structural shifts and improve long-term predictive capability. Expanding the framework to include additional countries and higher-resolution data can further support evidence-based methane mitigation planning at national and global scales.
Author Contributions
Conceptualization, A.H. and Q.P.H.; methodology, A.H. and Q.P.H.; software, A.H.; validation, A.H. and M.A.; formal analysis, A.H.; investigation, A.H.; data curation, A.H.; writing—original draft preparation, A.H.; writing—review and editing, A.H., M.A., Q.P.H. and R.B.M.; visualization, A.H.; supervision, Q.P.H. and R.B.M. All authors have read and agreed to the published version of the manuscript.
Funding
This research was supported by the Research Seed Grant Fund 2024–2025 of Benazir Bhutto Shaheed University of Technology and Skill Development, Pakistan.
Institutional Review Board Statement
Not applicable.
Informed Consent Statement
Not applicable.
Data Availability Statement
The methane emissions data analyzed in this study were obtained from the Emissions Database for Global Atmospheric Research (EDGAR), release EDGAR_2025_GHG (1970–2024), developed by the European Commission’s Joint Research Centre (JRC). The dataset is publicly available at https://edgar.jrc.ec.europa.eu/dataset_ghg2025 (accessed on 28 October 2026). The results derived from these data are presented in this article.
Acknowledgments
During the preparation of this manuscript, the authors used ChatGPT (GPT-6) (OpenAI) to support the writing process, including language refinement and text organization, thereby improving the clarity and readability of the manuscript. The authors have reviewed and edited the AI-assisted text as appropriate and take full responsibility for the content of the published article.
Conflicts of Interest
The authors declare no conflicts of interest.
References
- IPCC. Climate Change 2021: The Physical Science Basis. Contribution of Working Group I to the Sixth Assessment Report of the Intergovernmental Panel on Climate Change; Cambridge University Press: Cambridge, UK, 2021. [Google Scholar] [CrossRef] [Scilit]
- IPCC. Climate Change 2023: Synthesis Report. Contribution of Working Groups I, II and III to the Sixth Assessment Report of the Intergovernmental Panel on Climate Change; IPCC: Geneva, Switzerland, 2023; Available online: https://www.ipcc.ch/report/ar6/syr/ (accessed on 5 June 2026).
- Saunois, M.; Martinez, A.; Poulter, B.; Zhang, Z.; Raymond, P.A.; Regnier, P.; Canadell, J.G.; Jackson, R.B.; Patra, P.K.; Bousquet, P.; et al. Global methane budget 2000–2020. Earth Syst. Sci. Data 2025, 17, 1873–1958. [Google Scholar] [CrossRef] [Scilit]
- Crippa, M.; Guizzardi, D.; Pagani, F.; Banja, M.; Muntean, M.; Schaaf, E.; Quadrelli, R.; Risquez Martin, A.; Taghavi-Moharamli, P.; Köykkä, J.; et al. GHG Emissions of All World Countries–2025 Report; European Commission, Joint Research Centre: Luxembourg, 2025. [Google Scholar] [CrossRef]
- United Nations Environment Programme; Climate and Clean Air Coalition. Global Methane Assessment: Benefits and Costs of Mitigating Methane Emissions; United Nations Environment Programme: Nairobi, Kenya, 2021; Available online: https://wedocs.unep.org/handle/20.500.11822/35913 (accessed on 5 June 2026).
- European Commission; United States. Global Methane Pledge. 2021. Available online: https://www.globalmethanepledge.org (accessed on 6 June 2026).
- United Nations Environment Programme. Global Methane Status Report 2025; United Nations Environment Programme: Nairobi, Kenya, 2025. [Google Scholar] [CrossRef] [Scilit]
- EDGAR Community GHG Database. EDGAR_2025_GHG (1970–2024); European Commission, Joint Research Centre: Brussels, Belgiu, 2025; Available online: https://edgar.jrc.ec.europa.eu/dataset_ghg2025 (accessed on 1 June 2026).
- Crippa, M.; Guizzardi, D.; Muntean, M.; Schaaf, E.; Solazzo, E.; Olivier, J.G.J.; Vignati, E. High resolution temporal profiles in the Emissions Database for Global Atmospheric Research. Sci. Data 2020, 7, 121. [Google Scholar] [CrossRef] [Scilit] [PubMed]
- Wu, X.; Zhang, Y.; Han, Y.; Zhang, Y.; Zhang, Y.; Cheng, X.; Zhong, P.; Yuan, X.; Zhang, Y.; Li, Z. Advances in methane emissions from agricultural sources: Part I. Accounting and mitigation. J. Environ. Sci. 2024, 140, 279–291. [Google Scholar] [CrossRef] [Scilit] [PubMed]
- Yazdinejad, A.; Wang, H.; Kong, J. Advanced AI-driven methane emission detection, quantification, and localization in Canada: A hybrid multi-source fusion framework. Sci. Total Environ. 2025, 998, 180142. [Google Scholar] [CrossRef] [Scilit] [PubMed]
- Jin, Y.; Sharifi, A. Machine learning for predicting urban greenhouse gas emissions: A systematic literature review. Renew. Sustain. Energy Rev. 2025, 215, 115625. [Google Scholar] [CrossRef] [Scilit]
- Rolnick, D.; Donti, P.L.; Kaack, L.H.; Kochanski, K.; Lacoste, A.; Sankaran, K.; Ross, A.S.; Milojevic-Dupont, N.; Jaques, N.; Waldman-Brown, A.; et al. Tackling climate change with machine learning. ACM Comput. Surv. 2022, 55, 1–96. [Google Scholar] [CrossRef] [Scilit]
- Reichstein, M.; Camps-Valls, G.; Stevens, B.; Jung, M.; Denzler, J.; Carvalhais, N.; Prabhat. Deep learning and process understanding for data-driven Earth system science. Nature 2019, 566, 195–204. [Google Scholar] [CrossRef] [Scilit] [PubMed]
- Nguyen, H.A.D.; Le, T.H.; Azzi, M.; Ha, Q.P. Monitoring and estimation of urban emissions with low-cost sensor networks and deep learning. Ecol. Inform. 2024, 82, 102750. [Google Scholar] [CrossRef] [Scilit]
- International Energy Agency. Global Methane Tracker 2023; IEA: Paris, France, 2023; Available online: https://www.iea.org/reports/global-methane-tracker-2023 (accessed on 30 June 2026).
- Box, G.E.P.; Jenkins, G.M.; Reinsel, G.C.; Ljung, G.M. Time Series Analysis: Forecasting and Control, 5th ed.; Wiley: Hoboken, NJ, USA, 2016. [Google Scholar]
- Hyndman, R.J.; Athanasopoulos, G. Forecasting: Principles and Practice, 3rd ed.; OTexts: Melbourne, Australia, 2021; Available online: https://otexts.com/fpp3/ (accessed on 30 June 2026).
- Dayoub, W.; Ahmad, S.; Riaz, M.; Sajid, M.S.; Bilal, G.; Hussain, K. Forecasting enteric methane emission using autoregressive integrated moving average and Holt–Winters time series models in South Asian countries. Int. J. Environ. Sci. Technol. 2024, 21, 4837–4846. [Google Scholar] [CrossRef] [Scilit]

Disclaimer/Publisher’s Note: The statements, opinions and data contained in all publications are solely those of the individual author(s) and contributor(s) and not of MDPI and/or the editor(s). MDPI and/or the editor(s) disclaim responsibility for any injury to people or property resulting from any ideas, methods, instructions or products referred to in the content. |
© 2026 by the authors. Licensee MDPI, Basel, Switzerland. This article is an open access article distributed under the terms and conditions of the Creative Commons Attribution (CC BY) license.