


Abstract
Gas bubble evolution at electrified electrode–electrolyte interfaces and concurrent Faradaic processes change the electroactive area and the local current-density distribution and thereby the measured electrical impedance. This study investigated interfacial changes via electrical impedance spectroscopy (EIS) in a transparent parallel-plate chamber with physiological saline (0.9% NaCl) under direct-current (DC) excitation (2 V, 4 V and 8 V, 5 s, 10 s and 20 s, ). Paired EIS measurements from 40 Hz to 1 MHz revealed a dual-mechanism spectral signature: at 40 Hz, the estimated interfacial impedance contribution () decreased from to , while phase shifted toward less negative values ( from to , from to ), consistent with electrode-surface Faradaic activation and increased interfacial conductance. At high frequencies (>), solution resistance increased on average ( to ), without resolved dose dependence (), placing the volumetric gas fraction between 0.4% and 3.2% by Bruggeman’s effective medium theory as an order-of-magnitude estimate. These estimates were compared with the 2D projected optical coverage (8.25% to 27.12% at 20 s) from a Python computer-vision algorithm. The spectral transition was consistent with a zero-crossing band () and with the absence of magnitude sensitivity at 1 kHz (). Together, the EIS, optical, and numerical results indicate that post-DC impedance shifts reflect low-frequency interfacial Faradaic activation coupled with high-frequency geometric screening by bubbles.
1. Introduction
Gas bubbles nucleate at electrified electrode–electrolyte interfaces during electrolysis. Their growth reduces the effective wetted area, redistributes the local current-density distribution, and introduces additional electrical impedance contributions that are absent from the undisturbed cell [1,2,3,4]. In electrical impedance spectroscopy (EIS), these interfacial effects concentrate at low frequencies, where electrical double-layer charging, interfacial polarization, and charge-transfer mechanisms dominate the measured response [5,6,7,8]. In physiological saline media this creates an attribution problem: interfacial gas accumulation may be read as a bulk solution change if boundary phenomena are not isolated and analyzed explicitly.
Electrical impedance is a complex, frequency-dependent quantity whose interpretation in conductive electrolyte fluids and electrochemical systems requires separating bulk conductivity contributions from electrochemical surface phenomena and dielectric dispersions [5,9,10,11,12,13,14]. In electrochemical and biomedical applications involving electrical stimulation and electroporation, dielectric dispersion modulation, finite-element field modeling, and boundary reactions affect impedance-based monitoring [12,15,16,17,18]. The present study addresses that separation directly. It isolates the electrode–electrolyte interface in a transparent parallel-plate chamber filled with physiological saline solution (0.9% NaCl) subjected to DC excitation and evaluates the resulting impedance modifications over a multi-voltage (2 V to 8 V) and multi-duration (5 s to 20 s) experimental matrix. By coupling paired Before/After broadband EIS sweeps with optical documentation and 3D finite-element modeling in COMSOL Multiphysics, this work presents an experimental and numerical analysis of bubble-associated interfacial electrical impedance changes.
2. Materials and Methods
2.1. Experimental Setup and Electrical Protocol
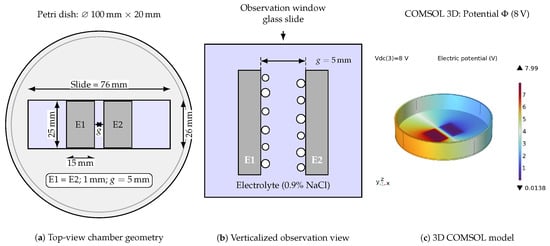
The experimental apparatus consisted of a transparent parallel-plate chamber assembled inside a 100 mm × 20 mm borosilicate glass Petri dish, as schematically shown in Figure 1a. Two planar metallic electrodes (E1 and E2, each 15 mm × 25 mm × 1 mm) were mounted onto a 26 mm × 76 mm glass slide with a nominal interelectrode gap . The upper electrode surfaces were electrically insulated so that only the internal vertical faces bounding the gap remained electrochemically active within the 5 mm electrolyte layer. The electrolyte was commercial 0.9% NaCl physiological saline solution (Equiplex Medicamentos dos Sertões Ltda., Aparecida de Goiânia, GO, Brazil; nominal conductivity ) at room temperature (20.8 °C), replaced with a fresh aliquot for each test condition.
Figure 1.
Experimental apparatus and numerical model: (a) top view of the chamber assembled in a Petri dish with slide carrier and planar parallel electrodes (); (b) verticalized optical observation configuration for inspecting interfacial bubbles, where white circles represent adhered gas bubbles; and (c) 3D finite-element model in COMSOL Multiphysics showing the electric potential distribution () in the chamber under DC excitation.
An adjustable regulated direct-current (DC) power supply (Minipa do Brasil Ltda., São Paulo, SP, Brazil) applied continuous excitation across a factorial matrix of three voltages (2 V, 4 V and 8 V, nominal fields of 0.4 V/mm, 0.8 V/mm and 1.6 V/mm) and three exposure times (5 s, 10 s and 20 s) in triplicate (, yielding 27 paired tests with post-DC latency below 5 s). The electrodes comprised planar AISI 304 stainless-steel plates with an active wetted geometric area of 15 mm × 5 mm (). Electrical impedance spectroscopy (EIS) sweeps were acquired before and immediately after DC application () using a 4294A Precision Impedance Analyzer (Keysight Technologies, Santa Rosa, CA, USA; , 801 logarithmic points from 40 Hz to 1 MHz) [6,19]. Electrolyte temperature was continuously tracked using a 10 kΩ negative temperature coefficient (NTC) thermistor (Epcos/TDK Electronics AG, Munich, Germany).
2.2. Optical Documentation and Python Bubble Detection Pipeline
Optical video recordings were acquired normal to the transparent chamber bottom (Figure 1b) over background graph paper (2.5 mm grid). Final frames were extracted at 20 s for 2 V, 4 V and 8 V using OpenCV 5.0.0.93 (cv2.VideoCapture). Morphometric quantification was implemented in Python 3.12/Streamlit 1.39.0 (Bubble ROI Tool) across three steps: (1) Scale-Invariant Spatial Calibration, with pixel-to-millimeter conversion calibrated against the physical gap (, ); (2) Native-Resolution Invariance, inversely remapping vector annotations to native camera resolution; and (3) Boolean Matrix Rasterization, converting regions of interest (ROI) and gas masks into boolean arrays to compute the projected 2D bubble coverage fraction () via Equation (1):
where and are the pixel counts of bubble and ROI masks, and and are the projected bubble area and total ROI area (), respectively. This formulation quantifies projected 2D occlusion over the active faces, overcoming stochastic 3D counting limitations caused by microbubble coalescence. Qualitative thermal imaging with an infrared FLIR camera (FLIR Systems, Inc., Wilsonville, OR, USA) was used to inspect potential surface films and redox deposits.
2.3. Numerical Modeling, Effective Medium Theory, and Post-Processing
A 3D finite-element model was implemented in COMSOL Multiphysics v5.1 (COMSOL AB, Stockholm, Sweden; AC/DC Module) (Figure 1c) representing the chamber, bulk electrolyte, and 14 discrete spherical bubbles attached laterally to electrode edges (radii 0.35 mm to 0.90 mm). The geometric core impedance was computed in the frequency domain across excitation frequency f. To reproduce instrumental and interfacial dispersion, the measurement-equivalent lumped formulation expressed in Equation (2) was coupled [5]:
where is effective series resistance, is residual wiring inductance, is parallel parasitic capacitance, is the imaginary unit, and () represent low-frequency interfacial polarization branches.
Interfacial impedance was isolated via (with measured in the resistive plateau at 200 kHz to 800 kHz). The volumetric gas fraction () in the high-frequency conductive path was estimated using Bruggeman’s effective medium theory in Equation (3):
where and represent high-frequency bulk electrolyte resistance before and after DC excitation. Relative variations were expressed as and . Simulation agreement was quantified by the logarithmic coefficient of determination (), symmetric mean absolute percentage error (sMAPE), and phase root mean square error (RMSE).
3. Results
3.1. Broadband Impedance Response and Numerical Model Validation
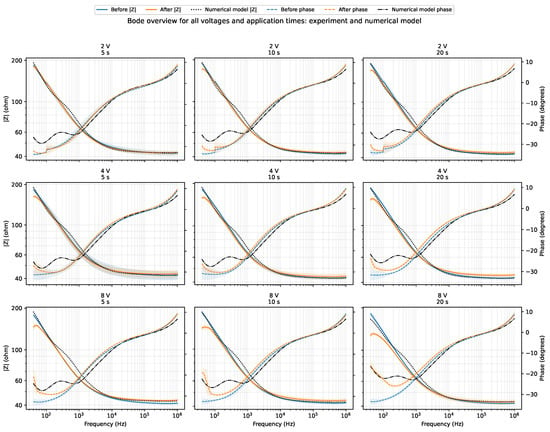
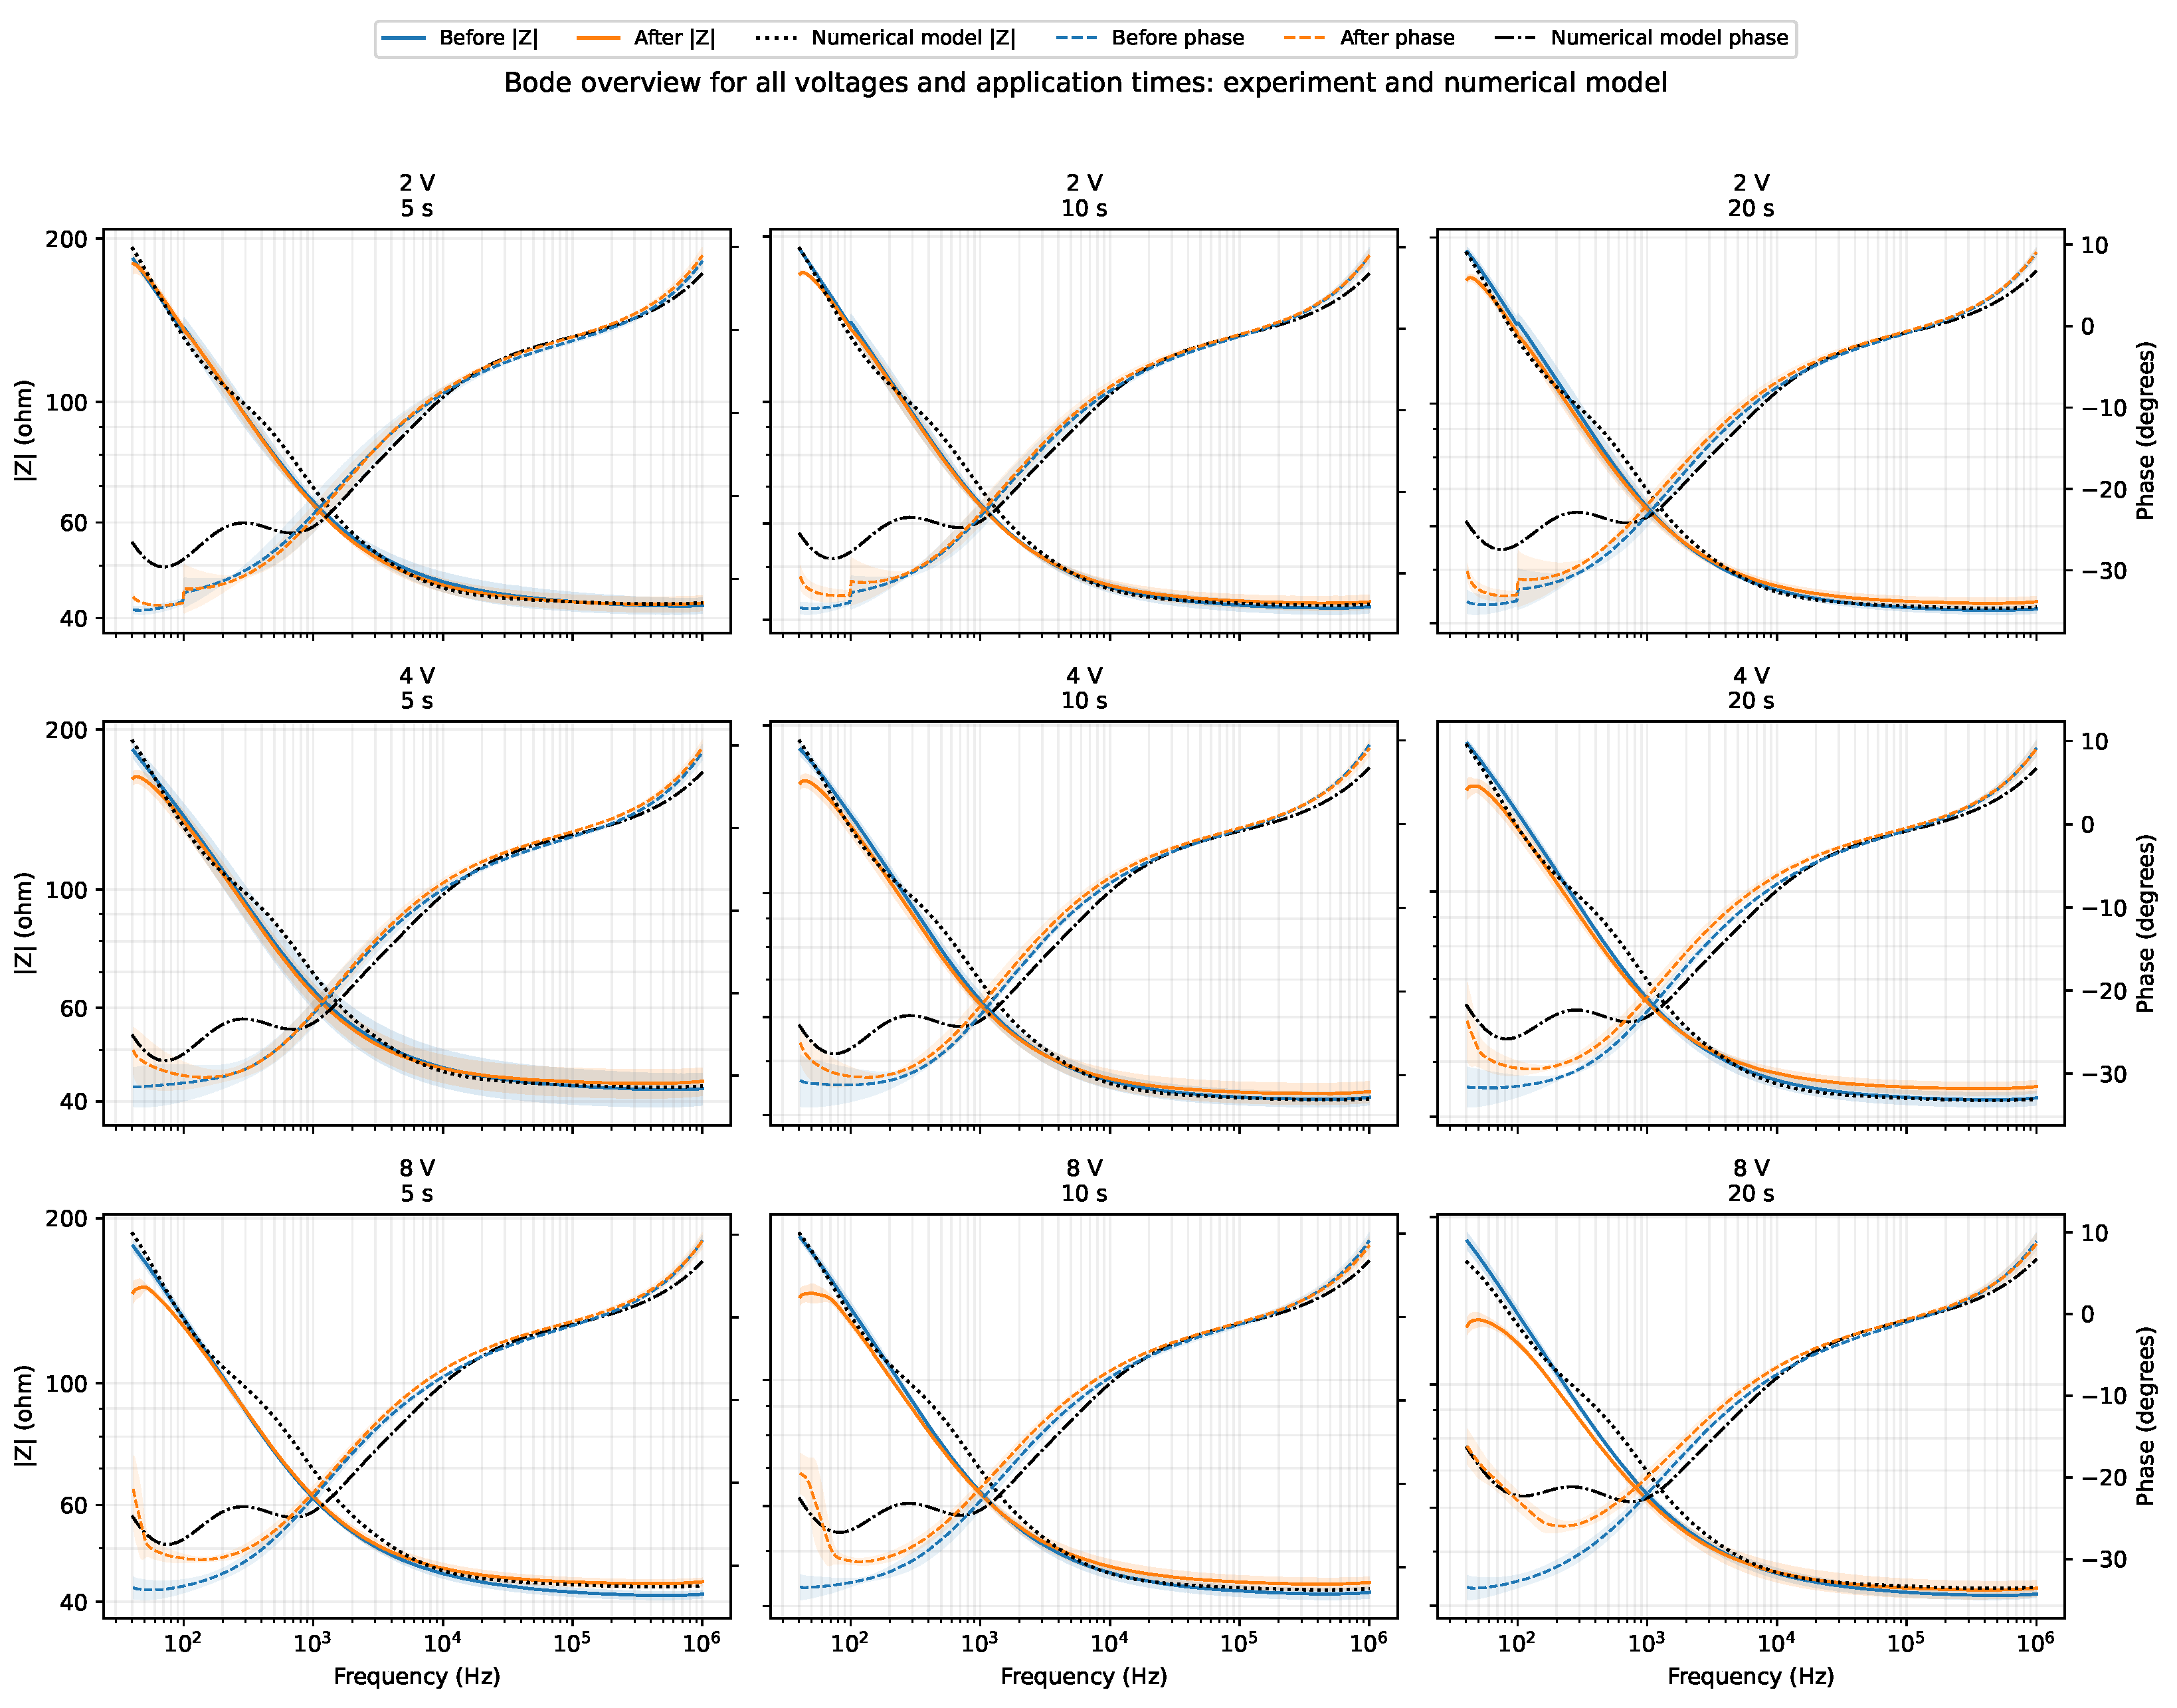
Figure 2 presents the complete overview of experimental Bode magnitude and phase spectra measured before and after DC excitation across all combinations of voltage (2 V, 4 V and 8 V) and exposure time (5 s, 10 s and 20 s) (, mean ± standard deviation), overlaid with the simulated numerical model responses from COMSOL Multiphysics. Post-DC modifications concentrated predominantly in the low-frequency range (40 Hz to 100 Hz), where impedance magnitude decreased systematically and phase angle shifted toward less negative values (toward zero, ). At frequencies above 100 kHz, all curves converged to the predominantly resistive bulk electrolyte response (≈), exhibiting an average positive shift ( to , condition means) associated with the physical presence of insulating gas bubbles.
Figure 2.
Overview of broadband Bode magnitude (left axis) and phase (right axis) spectra for all combinations of voltage (2 V, 4 V and 8 V) and DC excitation time (5 s, 10 s and 20 s). Experimental curves show replicate means () with shaded bands (Before in blue, After in orange); black dotted/dash-dotted lines represent the measurement-equivalent COMSOL Multiphysics numerical model.
The numerical model reproduced the experimental spectral dispersion across all nine tested conditions, achieving an overall mean , a mean magnitude sMAPE of 3.94%, and a mean phase RMSE of 2.67° (Table 1). This semi-quantitative agreement indicates that a 3D conductive electrolyte core with attached bubbles and lumped polarization terms can reproduce the instrument-observed response.
Table 1.
Consolidated experimental variations at 40 Hz (mean ± SD, ), numerical model agreement metrics, and optical projected bubble coverage at 20 s.
3.2. Low-Frequency Interfacial Dynamics (40 Hz) and Factorial Summary
At 40 Hz, raw relative impedance magnitude variation () exhibited dependence on both voltage and exposure duration, reaching at 8 V/ 20 s, accompanied by a phase shift toward less negative values (, from to ), reflecting reduced capacitive phase lag and enhanced interfacial Faradaic conductance. Estimating the interfacial impedance contribution () showed a progressive reduction with dose, spanning from (2 V/ 5 s) to (8 V/ 20 s). A two-way analysis of variance (ANOVA) on at 40 Hz confirmed statistically significant main effects for voltage (, ) and exposure time (, ). Voltage dependence for at 40 Hz was also statistically significant (, ). In contrast, at intermediate frequencies such as 1 kHz, magnitude variation was small (between and ) and not statistically significant (, for voltage; , for time), whereas the low-frequency response retained dose sensitivity. For , by contrast, neither voltage (, ) nor time (, ) was significant. Table 1 summarizes the factorial response across the matrix at 40 Hz alongside model agreement metrics and optical bubble coverage.
3.3. Optical Evidence of Interfacial Gas Evolution
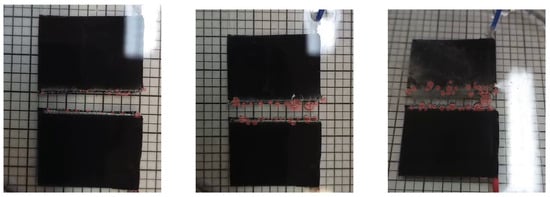
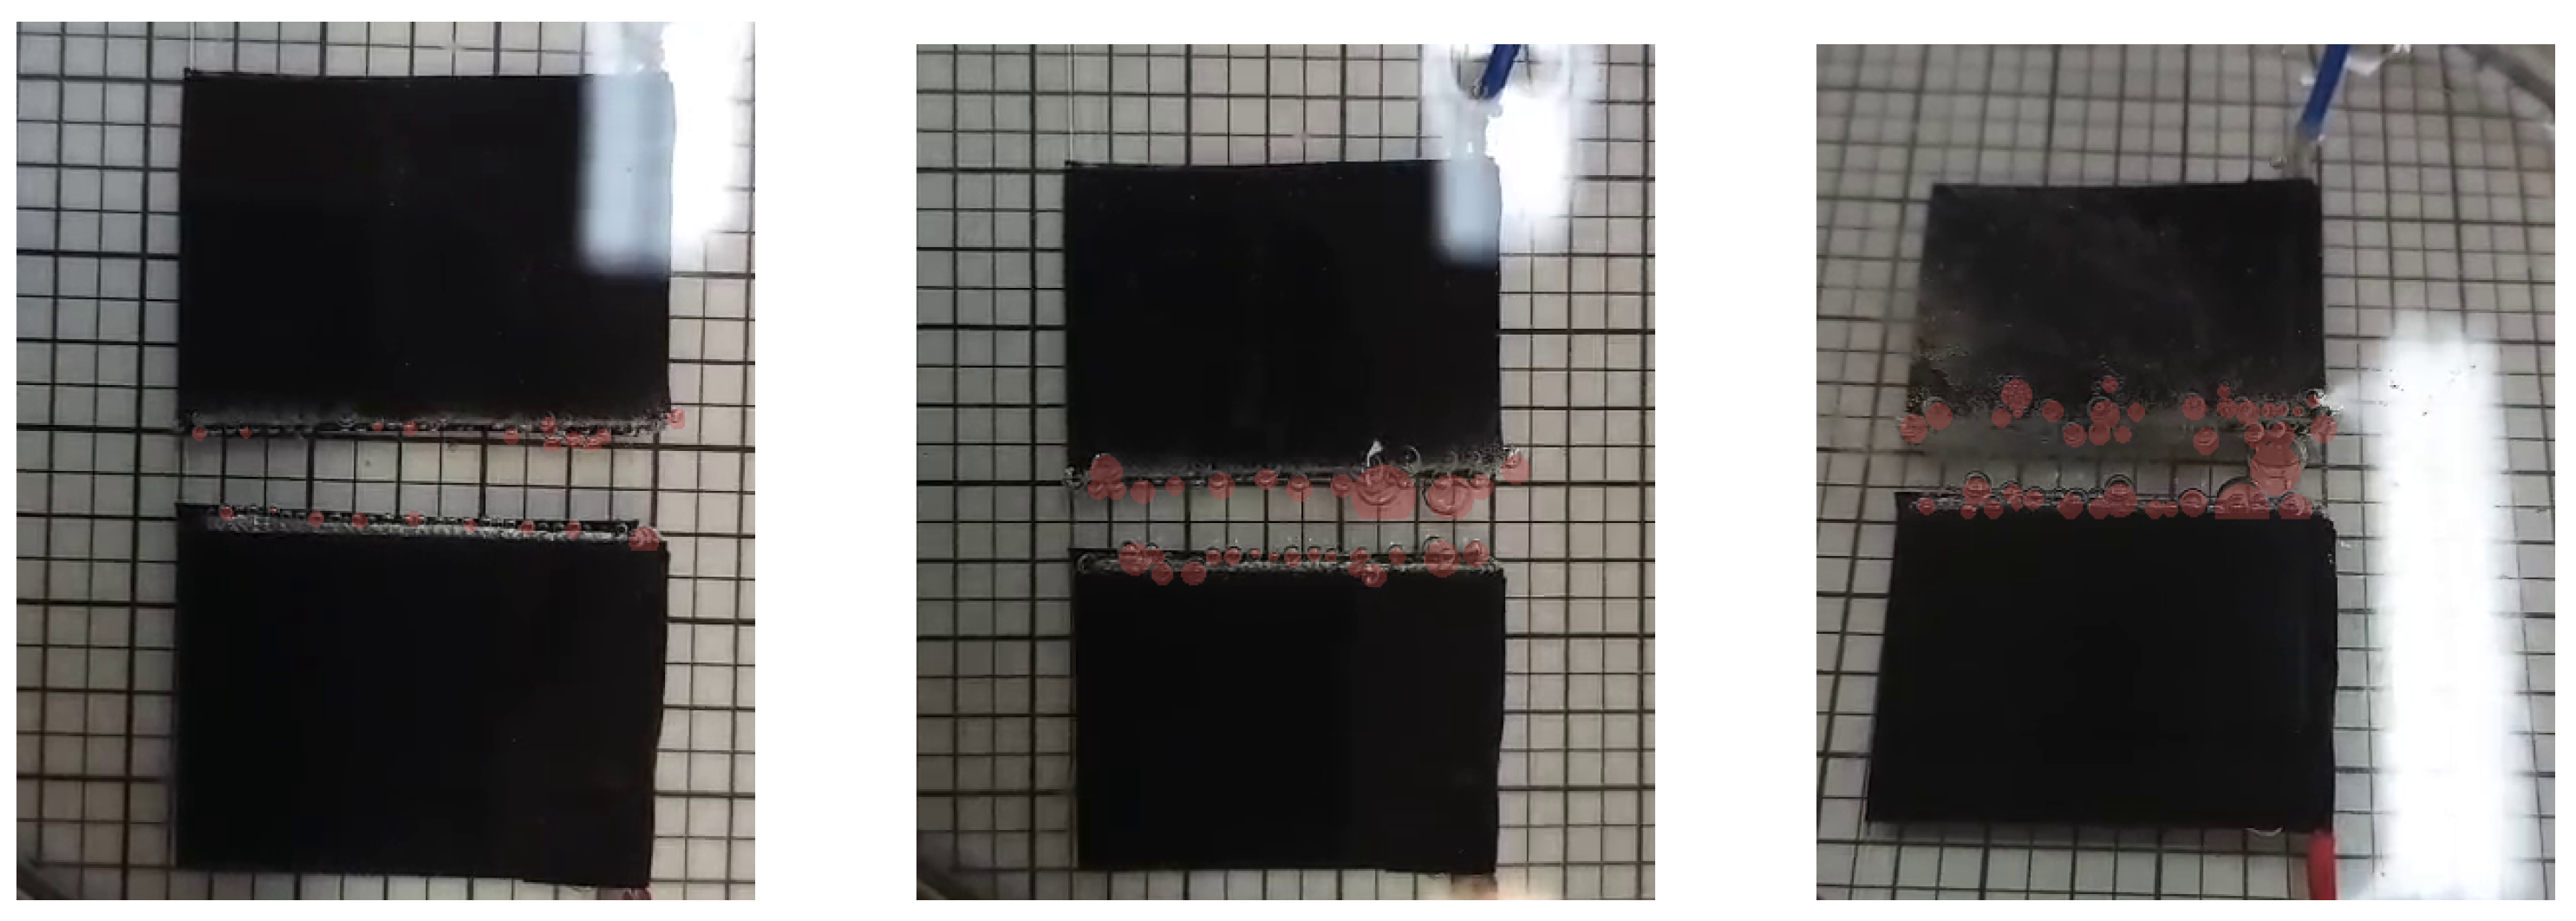
Figure 3 displays representative optical frames captured after 20 s of excitation at 2 V, 4 V, and 8 V, with curated bubble masks highlighted in red. The visual records show accumulation of gas bubbles adhering preferentially to the active lateral edges of the electrodes. The projected bubble coverage within the near-electrode ROI increased progressively with applied voltage, from 8.25% at 2 V to 25.39% at 4 V and 27.12% at 8 V (Table 1).
Figure 3.
Representative optical video frames after 20 s DC exposure at 2 V (left), 4 V (middle), and 8 V (right). Red overlays represent curated bubble-associated coverage masks near the active lateral electrode faces ().
4. Discussion
4.1. Physicochemical Mechanisms and Temporal Dispersion Dynamics
The broadband electrical impedance behavior following DC excitation (Figure 2) indicates that interfacial perturbations in conductive saline decouple two opposing physical regimes: at low frequencies (40 Hz to 100 Hz), electrochemical activation of the metallic interface dominates (), whereas at high frequencies (>), bulk geometric gas blockage emerges () [5,6]. Evolution across 5 s, 10 s and 20 s is consistent with increasing cumulative Faradaic charge transfer (); however, because was not recorded, exposure time is only a nominal dose proxy rather than a direct measurement of q.
At 40 Hz, the reduction in magnitude (, with isolated dropping up to ) and phase advance toward less negative values (, from to ) stem from concurrent Faradaic water electrolysis and chloride oxidation () in 0.9% NaCl [17,18]. These processes generate pH gradients and oxychlorinated species that promote depassivation and surface roughening of the AISI 304 electrodes (Figure 1), elevating double-layer capacitance () and decreasing charge-transfer resistance () [7,9,10]. Although adherent microbubbles act as dielectric insulators () occluding 8.25% to 27.12% of the projected area (Figure 3), increased interfacial Faradaic conductance exceeds geometric gas constriction at low frequencies.
Conversely, above 100 kHz, the double layer acts as a capacitive short-circuit (), and impedance reflects solution resistance. Here, gas bubbles manifest as an average increase in bulk electrolyte resistance ( to , condition means). Applying Bruggeman’s effective medium theory (), this shift places between 0.4% and 3.2%, as an order-of-magnitude estimate: shows no resolved dose dependence, and at 8 V falls from 3.2% to 1.5% between 5 s and 20 s while optical coverage rises. Comparing it with projected 2D optical coverage (8.25% to 27.12%) indicates that edge-concentrated bubble clusters alter 2D visual projection without fully constricting the 3D current volume [1,2,8,20,21]. The coexistence of these two opposing mechanisms causes the differential spectrum to cross zero within a transition band , explaining the magnitude null at 1 kHz (), while phase preserves continuous dose sensitivity ( from to ) [4].
4.2. Implications for Electroporation and Biomedical Sensing
This dual mechanism has direct implications for pulsed electric field (PEF) protocols, including irreversible electroporation (IRE), electrochemotherapy and gene electrotransfer [17,18]. Under high-voltage pulses, microbubbles along electrode edges distort the local field and generate current-density concentrations (edge effects) that compromise permeabilization homogeneity [17]. While clinical PEF protocols deliver energy in microsecond-to-millisecond pulses at field levels [18], the continuous DC regime investigated here ( for ) isolates steady-state bubble nucleation and Faradaic interface alterations without high-voltage transients. At the conductivity of the present medium, a standard electrochemotherapy train of eight 100 μs pulses near 1 kV/cm [22] deposits about 12 J mL−1 at a peak power density of 15 kW mL−1. The corresponding values here are 1.2 J mL−1 to 77 J mL−1 and 0.24 W mL−1 to 3.8 W mL−1. Thus, the cumulative energy density is comparable, but the peak power density is three to four orders of magnitude lower here, neglecting electrode overpotential. In real-time impedance-based monitoring [9,12], the low-frequency interfacial impedance drop from electrode Faradaic activation may be misattributed to cell membrane permeabilization, while high-frequency resistive bubble screening obscures intracellular ion release.
4.3. Limitations and Future Work
Limitations include the fixed-electrode geometry in a static chamber and triplicate testing (, in 0.9% NaCl). Optical analysis assessed 2D projected coverage at 20 s without resolving millisecond-scale coalescence dynamics or 3D tomographic volumes. DC current and electrolyte temperature were not logged per condition, precluding direct calculation of ; as conductivity rises about 2% per °C, Joule heating lowers , so the reported is a lower bound on geometric screening. Future work should incorporate real-time current and temperature logging, synchronized high-speed imaging, and distributed constant phase element (CPE) fitting to decouple charge-transfer kinetics from the stochastic evolution of the bubble layer.
5. Conclusions
This study established a coupled methodology integrating broadband electrical impedance spectroscopy, optical image analysis, and numerical modeling to evaluate interfacial gas bubble phenomena in physiological saline solution under DC excitation. Broadband EIS measurements showed that post-DC electrical modifications decouple two opposing physical regimes: low-frequency interfacial electrochemical activation (40 Hz to 100 Hz, where estimated interfacial dropped up to with phase advancing toward zero, ) and high-frequency bulk resistive gas screening (>, to , without resolved dose dependence, giving an order-of-magnitude volumetric gas fraction of 0.4% to 3.2% via Bruggeman’s theory). The Python morphometric algorithm quantified gas accumulation along active electrode edges (2D projected coverage of 8.25% to 27.12% at 20 s), and 3D COMSOL Multiphysics modeling captured the experimental dispersion (). Identifying the mechanism-inversion crossover band () and decoupling interfacial impedance from bulk electrolyte resistance provide analytical guidelines to prevent misattributing electrode bubble artifacts to cellular permeabilization in electroporation procedures and electrical impedance sensing within conductive physiological media.
Author Contributions
Conceptualization: J.A. and D.O.H.S.; methodology: J.A., D.M.F., J.A.G.C., and J.C.d.S.; finite-element modeling and numerical simulations: G.F.N.; data processing and visualization: J.A.; technical discussion: G.B.P. and D.O.H.S.; original draft preparation: J.A.; and review: all authors. All authors have read and agreed to the published version of the manuscript.
Funding
This research was funded in part by the National Council for Scientific and Technological Development (CNPq), grant number 311610/2025-0; Coordenação de Aperfeiçoamento de Pessoal de Nível Superior—Brasil (CAPES), Finance Code 001; and Fundação de Amparo à Pesquisa e Inovação do Estado de Santa Catarina (FAPESC), grant numbers TO 2024TR002224 and TO 2024TR002638.
Institutional Review Board Statement
Not applicable.
Informed Consent Statement
Not applicable.
Data Availability Statement
The processed data supporting the findings of this study are available from the corresponding author upon reasonable request.
Acknowledgments
The authors acknowledge the support the support of the Institute of Biomedical Engineering at the Federal University of Santa Catarina (IEB-UFSC).
Conflicts of Interest
The authors declare no conflicts of interest.
Use of Artificial Intelligence
During the preparation of this manuscript, the authors used AI-assisted tools (Google Antigravity with Gemini 3.7 Flash, Claude Code with Claude Opus 5, and OpenAI Codex with GPT-5.6) for language refinement, code assistance, and formatting checks. The authors reviewed and edited the output and take full responsibility for the integrity and scientific content of this publication.
References
- Zhao, X.; Ren, H.; Luo, L. Gas Bubbles in Electrochemical Gas Evolution Reactions. Langmuir 2019, 35, 5392–5408. [Google Scholar] [CrossRef] [Scilit] [PubMed]
- Angulo, A.; van der Linde, P.; Gardeniers, H.; Modestino, M.; Fernandez Rivas, D. Influence of Bubbles on the Energy Conversion Efficiency of Electrochemical Reactors. Joule 2020, 4, 555–579. [Google Scholar] [CrossRef] [Scilit]
- Kempler, P.A.; Coridan, R.H.; Lewis, N.S. Effects of Bubbles on the Electrochemical Behavior of Hydrogen-Evolving Si Microwire Arrays Oriented against Gravity. Energy Environ. Sci. 2020, 13, 1808–1817. [Google Scholar] [CrossRef] [Scilit]
- Dastafkan, K.; Wang, S.; Song, S.; Meyer, Q.; Zhang, Q.; Shen, Y.; Zhao, C. Operando Monitoring of Gas Bubble Evolution in Water Electrolysis by Single High-Frequency Impedance. EES Catal. 2023, 1, 998–1008. [Google Scholar] [CrossRef] [Scilit]
- Lasia, A. Electrochemical Impedance Spectroscopy and Its Applications; Springer: New York, NY, USA, 2014. [Google Scholar] [CrossRef] [Scilit]
- Barsoukov, E.; Macdonald, J.R. Impedance Spectroscopy: Theory, Experiment, and Applications, 3rd ed.; John Wiley & Sons: Hoboken, NJ, USA, 2018. [Google Scholar]
- Martinsen, Ø.G.; Heiskanen, A. Bioimpedance and Bioelectricity Basics, 4th ed.; Academic Press: London, UK, 2023. [Google Scholar]
- Vogt, H.; Balzer, R.J. The Bubble Coverage of Gas-Evolving Electrodes in Stagnant Electrolytes. Electrochim. Acta 2005, 50, 2073–2079. [Google Scholar] [CrossRef] [Scilit]
- Kassanos, P. Bioimpedance Sensors: A Tutorial. IEEE Sens. J. 2021, 21, 22190–22219. [Google Scholar] [CrossRef] [Scilit]
- Stupin, D.D.; Kuzina, E.A.; Abelit, A.A.; Emelyanov, A.K.; Nikolaev, D.M.; Ryazantsev, M.N.; Koniakhin, S.V.; Dubina, M.V. Bioimpedance Spectroscopy: Basics and Applications. ACS Biomater. Sci. Eng. 2021, 7, 1962–1986. [Google Scholar] [CrossRef] [Scilit] [PubMed]
- Kalvøy, H.; Johnsen, G.K.; Martinsen, Ø.G.; Grimnes, S. New Method for Separation of Electrode Polarization Impedance from Measured Tissue Impedance. Open Biomed. Eng. J. 2011, 5, 8–13. [Google Scholar] [CrossRef] [Scilit] [PubMed]
- Pintarelli, G.B.; da Silva, J.R.; Yang, W.; Suzuki, D.O.H. Dielectric Dispersion Modulated Sensing of Yeast Suspension Electroporation. Sensors 2022, 22, 1811. [Google Scholar] [CrossRef] [Scilit] [PubMed]
- Guedert, R.; Andrade, D.L.L.S.; Pintarelli, G.B.; Suzuki, D.O.H. Biological Dispersion in the Time Domain Using Finite Element Method Software. Sci. Rep. 2023, 13, 22868. [Google Scholar] [CrossRef] [Scilit] [PubMed]
- Ramos, A.; Schneider, A.L.S.; Suzuki, D.O.H.; Marques, J.L.B. Sinusoidal Signal Analysis of Electroporation in Biological Cells. IEEE Trans. Biomed. Eng. 2012, 59, 2965–2973. [Google Scholar] [CrossRef] [Scilit] [PubMed]
- Guedert, R.; Andrade, D.L.L.S.; Silva, J.R.; Pintarelli, G.B.; Suzuki, D.O.H. Dynamic Model of Tissue Electroporation on the Basis of Biological Dispersion and Joule Heating. J. Appl. Phys. 2024, 135, 095109. [Google Scholar] [CrossRef] [Scilit]
- Ramos, A.; Suzuki, D.O.H.; Marques, J.L.B. Numerical Study of the Electrical Conductivity and Polarization in a Suspension of Spherical Cells. Bioelectrochemistry 2006, 68, 213–217. [Google Scholar] [CrossRef] [Scilit] [PubMed]
- Rodriguez Osuna, I.A.; Cobelli, P.; Olaiz, N. Bubble Formation in Pulsed Electric Field Technology May Pose Limitations. Micromachines 2022, 13, 1234. [Google Scholar] [CrossRef] [Scilit] [PubMed]
- Chafai, D.E.; Mehle, A.; Tilma, L.R.; Lebar, A.M.; Miklavcic, D. Assessment of the Electrochemical Effects of Pulsed Electric Fields in a Biological Cell Suspension. Bioelectrochemistry 2015, 106, 249–257. [Google Scholar] [CrossRef] [Scilit] [PubMed]
- Keysight Technologies. Impedance Measurement Handbook: A Guide to Measurement Technology and Techniques, 6th ed.; Application Note 5950-3000; Keysight Technologies: Santa Rosa, CA, USA, 2016. [Google Scholar]
- Kempler, P.A.; Coridan, R.H.; Luo, L. Gas Evolution in Water Electrolysis. Chem. Rev. 2024, 124, 10964–11007. [Google Scholar] [CrossRef] [Scilit] [PubMed]
- Logar, A.; Kozlica, D.K.; Vodeb, O.; Gaberšček, M.; Hodnik, N.; Strmčnik, D. Bubble Trouble: Quantifying the Effects of Bubbles on the Electrochemical Interface. ACS Catal. 2025, 15, 6380–6385. [Google Scholar] [CrossRef] [Scilit] [PubMed]
- Miklavcic, D.; Mali, B.; Kos, B.; Heller, R.; Sersa, G. Electrochemotherapy: From the Drawing Board into Medical Practice. Biomed. Eng. Online 2014, 13, 29. [Google Scholar] [CrossRef] [Scilit] [PubMed]

Disclaimer/Publisher’s Note: The statements, opinions and data contained in all publications are solely those of the individual author(s) and contributor(s) and not of MDPI and/or the editor(s). MDPI and/or the editor(s) disclaim responsibility for any injury to people or property resulting from any ideas, methods, instructions or products referred to in the content. |
© 2026 by the authors. Licensee MDPI, Basel, Switzerland. This article is an open access article distributed under the terms and conditions of the Creative Commons Attribution (CC BY) license.