


Abstract
Large volumes of clinical ECG data remain locked in paper formats, yet how digitization artifacts propagate to multi-class diagnosis remains poorly quantified. We pair a training-free image-processing pipeline (Hough-transform baseline localization, color-channel grid suppression, median-pixel extraction) with a 12-lead 1D ResNet trained on 21,481 PTB-XL records across five diagnostic superclasses (72.0% accuracy, macro F1 0.618). In a matched 50-record evaluation, classification accuracy dropped from 78.0% on native waveforms to 64.0% on clean-digitized and 28.0% on red-grid images, with hypertrophy showing the sharpest drop. A lead-availability sweep showed accuracy increasing from 15.6% with Lead II alone to 71.3% with all 12 leads. Results reflect controlled synthetic renderings and an unheld-out validation split.
1. Introduction
Electrocardiography (ECG) is a fundamental diagnostic tool, yet vast quantities of clinically valuable records remain locked in paper or scanned formats, a digitization gap especially acute in resource-constrained regions such as South Asia. While deep learning models such as 1D ResNets have advanced automated ECG interpretation on benchmarks like PTB-XL [1,2,3], models trained on pristine digital waveforms often suffer from domain shift when deployed on digitized paper strips [4,5]. Existing digitization methods span rule-based pipelines to deep segmentation [5,6,7,8], but reconstruction artifacts can distort diagnostic hallmarks such as the QRS complex and ST segment [9,10]. This study addresses the under-characterized propagation of digitization error to downstream multi-class diagnosis, including the challenging hypertrophy (HYP) superclass [1,11]. Because paper-ECG digitization is well established [3,9,10,12,13,14,15], we do not claim the digitization algorithm itself as the novelty. Our primary contributions are as follows: (i) a matched end-to-end evaluation comparing native, clean-digitized, and red-grid-digitized records across five diagnostic superclasses; (ii) an empirical lead-availability sweep from 1 to 12 leads; and (iii) an open platform pairing training-free digitization with a 12-lead 1D ResNet baseline.
2. Materials and Methods
2.1. System Overview and Problem Formulation
The proposed pipeline processes scanned ECG strips through four modular stages: (I) isoelectric baseline localization, (II) grid artifact and header removal, (III) waveform digitization and calibration to clinical units (mV, ms), and (IV) multi-class abnormality classification via a 12-lead 1D ResNet. Missing leads are accommodated at inference time by zero-padding to maintain the fixed 12 × 1000 input tensor. The classifier is trained on native PTB-XL waveforms to establish an upper-bound baseline, while digitization is evaluated on synthetically rendered images.
2.2. Dataset and Preprocessing
The classifier was trained on PTB-XL v1.0.3 [1], a public database of 21,799 cardiologist-annotated 12-lead ECG records. Records whose SCP codes did not map to any of the five diagnostic superclasses (NORM, MI, STTC, CD, HYP) were discarded (318 records), leaving 21,481. Each remaining record received a single label, that of its highest-confidence mapped SCP code. The records were split 80/20 into training and validation sets by stratified random sampling at record level (seed 42); the split is not patient-wise, the official PTB-XL folds were not used, and no separate test set was held out (Table 1). Signals were resampled to 1000 samples (100 Hz) over 10 s, and each lead was standardized to zero mean and unit variance. Missing leads, when studied, were zero-padded to keep a fixed 12 × 1000 input.
Table 1.
PTB-XL dataset statistics and class distribution.
2.3. ECG Digitization Pipeline
2.3.1. Baseline Localization and Grid Removal
The isoelectric baseline is detected based on image type. For color ECGs printed on red grids, the Hough Transform is applied to a binarized image to identify the dominant horizontal line [3]. For grayscale ECGs, an argmin trace identifies the darkest pixel per column, and the mode of this trace gives the baseline row. Vertical crop boundaries are then set with a 40% height margin centered on the baseline.
Header regions (fully black rows at the top) are removed first, followed by grid removal in an image-type-specific manner: for color ECGs printed on red grids, the green-channel intensity is extracted, which naturally suppresses the red grid lines relative to the black ink trace (Figure 1), and the result is thresholded (intensity < 110) to isolate the dark trace; for grayscale ECGs, a brightness cutoff retains the darkest ~30% of pixels, separating the trace from lighter gridlines.
Figure 1.
Grid removal on a scanned paper ECG strip: (a) raw scan with red grid, (b) green-channel intensity with the red gridlines suppressed, (c) binarized trace after thresholding.
2.3.2. Waveform Digitization and Digitization Fidelity Validation
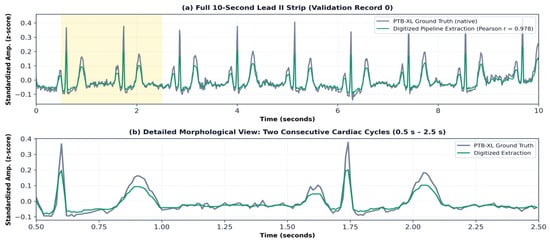
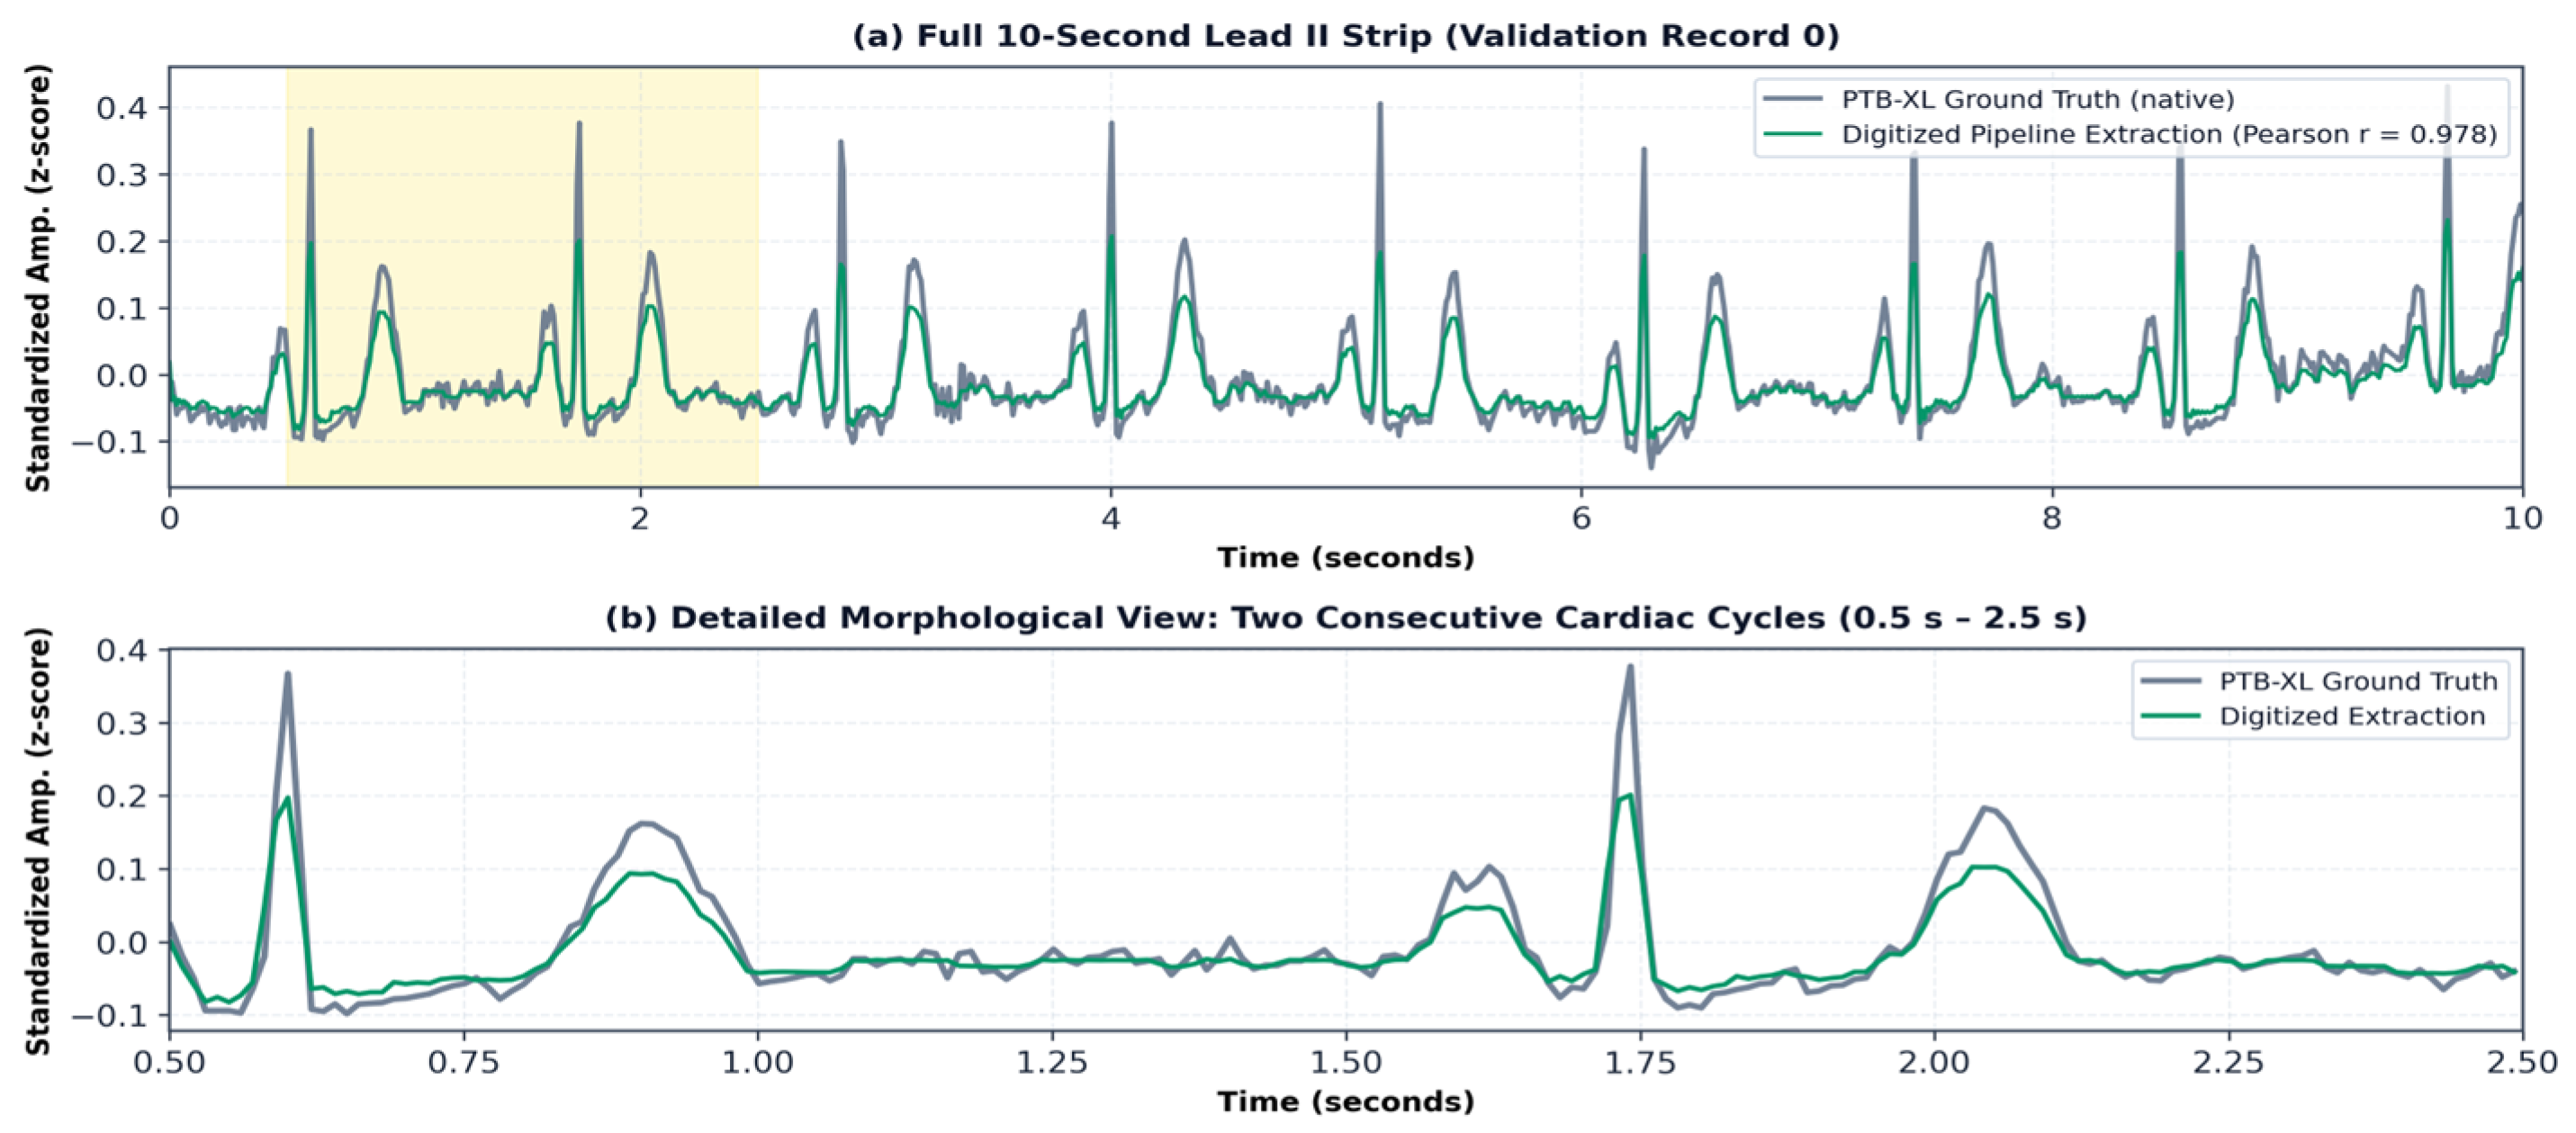
The binary trace undergoes morphological dilation to correct steep QRS discontinuities, connected-component labeling, and noise removal. The median y-coordinate per x-column is computed, with linear interpolation for missing columns, and pixel coordinates converted to clinical units (ms, mV) using a 200 DPI calibration. Fidelity was evaluated on Lead II of the first 50 validation records (indices 0–49), rendered as synthetic printed ECGs on clean and red-grid backgrounds, then resampled to 1000 steps and compared via Pearson correlation, normalized MSE, and SNR (Table 2, example in Figure 2).
Table 2.
Digitization fidelity by paper type.
Figure 2.
Digitized pipeline extraction (green) overlaid on the PTB-XL ground-truth waveform (gray) for Lead II of validation record 0 (clean grayscale rendering). (a) Full 10 s strip; the yellow band marks the 0.5–2.5 s window enlarged in (b). (b) Two consecutive cardiac cycles. Timing and overall waveform shape agree (Pearson r = 0.978 for this record; mean over 50 records: 0.966, Table 2), but the digitized R- and T-wave peaks are visibly lower than the ground truth.
Morphologically, clean grayscale extraction achieves near-perfect correlation (r = 0.966), indicating high reconstruction fidelity of the median-pixel approach under clean synthetic conditions. In contrast, red-grid extraction exhibits lower correlation (r = 0.661) and reduced SNR (2.21 dB) due to residual grid interference, highlighting amplitude distortion in colored paper formats.
2.4. Classifier Architecture and Training
The classifier, ECGResNet1D (8,721,989 parameters), adapts the standard residual architecture [16] and processes 12 × 1000 input tensors via an initial stem (Conv1d 12→32, kernel 15, stride 2; batch normalization; ReLU; max pooling 3, stride 2) and four stages of two residual blocks with 64, 128, 256, and 512 channels. Blocks contain two Conv1d layers (kernel 7), batch normalization, ReLU, and 0.2 dropout; downsampling blocks employ stride-2 1 × 1 convolution shortcuts, while second blocks use identity skips. Global average pooling, 0.5 dropout, and a linear head (512→5) output class logits. A 1D ResNet was selected because (i) multi-scale kernels (stem 150 ms, blocks 70 ms) capture both narrow QRS complexes and broad ST/T-waves; (ii) skip connections prevent gradient degradation; (iii) 1D convolutions process 12 synchronous channels in parallel without recurrent latency; and (iv) 1D ResNets lead PTB-XL benchmarks [11].
Training used AdamW (lr 3 × 10⁻⁴, weight decay 5 × 10⁻⁴, batch size 64), gradient clipping (1.0), label smoothing (0.1), balanced sampling, cosine warm-restarts (T0 = 10, T_mult = 2), and extensive augmentations (scaling, noise, baseline wander, shifts, masking, inversion). Early stopping (patience 25, max 80 epochs) halted at epoch 66, retaining the best checkpoint from epoch 41 (validation accuracy 71.96%).
2.5. Experimental Design and Evaluation Metrics
The evaluation comprises four parts: digitization fidelity against PTB-XL ground truth (Table 2); per-class classifier performance, with macro-averaged F1 as the primary summary metric given class imbalance (Table 3); lead availability, with missing leads set to zero at test time on an unstratified 10% random subsample of the validation set (n = 429, random seed = 42) (Table 4); and a matched end-to-end comparison of native, clean-digitized and red-grid-digitized signals on 50 randomly drawn validation records (Table 5). The best checkpoint was selected by the highest validation accuracy on the same validation set used for reporting; no separate test set was held out.
Table 3.
Per-class classification performance on PTB-XL validation set (N = 4297).
Table 4.
Classification performance vs. available leads.
Table 5.
End-to-end diagnostic performance across input modalities.
All experiments were implemented in Python 3.10.11 using PyTorch 2.12.0, NumPy 2.2.6, OpenCV 4.13.0.92 and scikit-learn 1.7.2; training and evaluation were run on an Intel Core i5-1135G7 CPU @ 2.40 GHz (Intel Corporation, Santa Clara, CA, USA).
3. Results
3.1. Classifier Performance
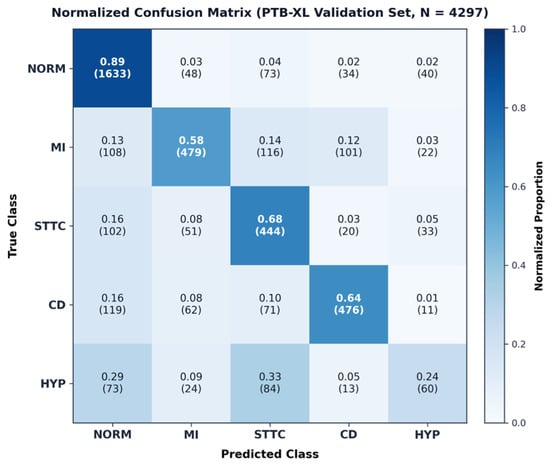
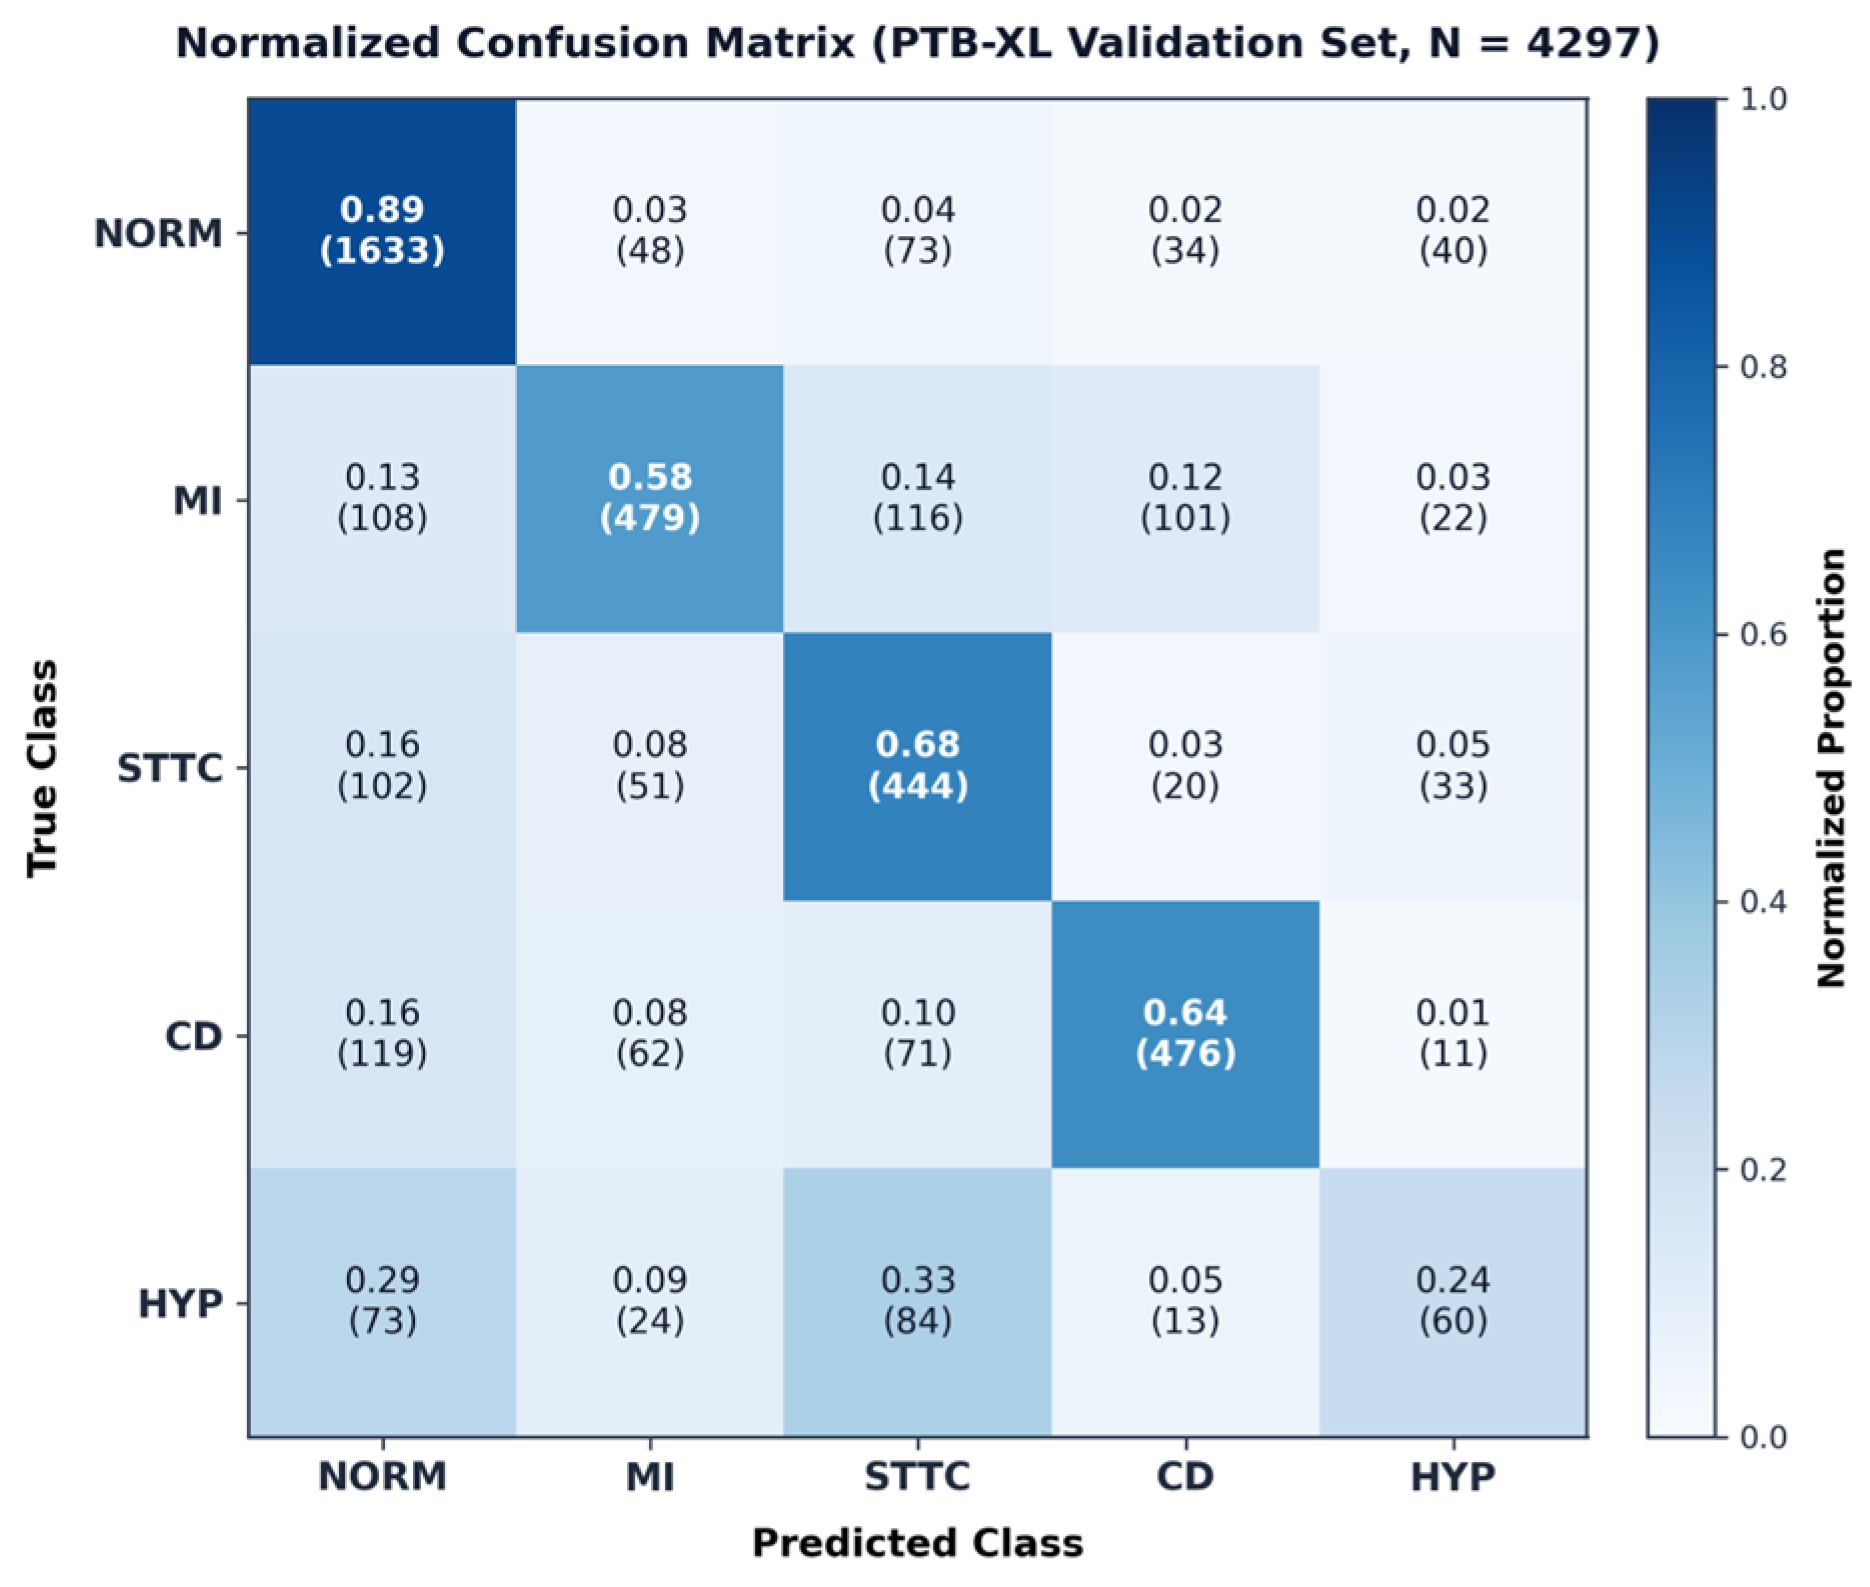
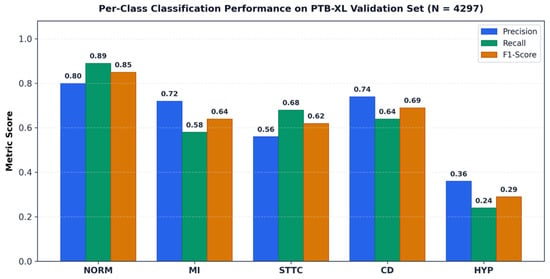
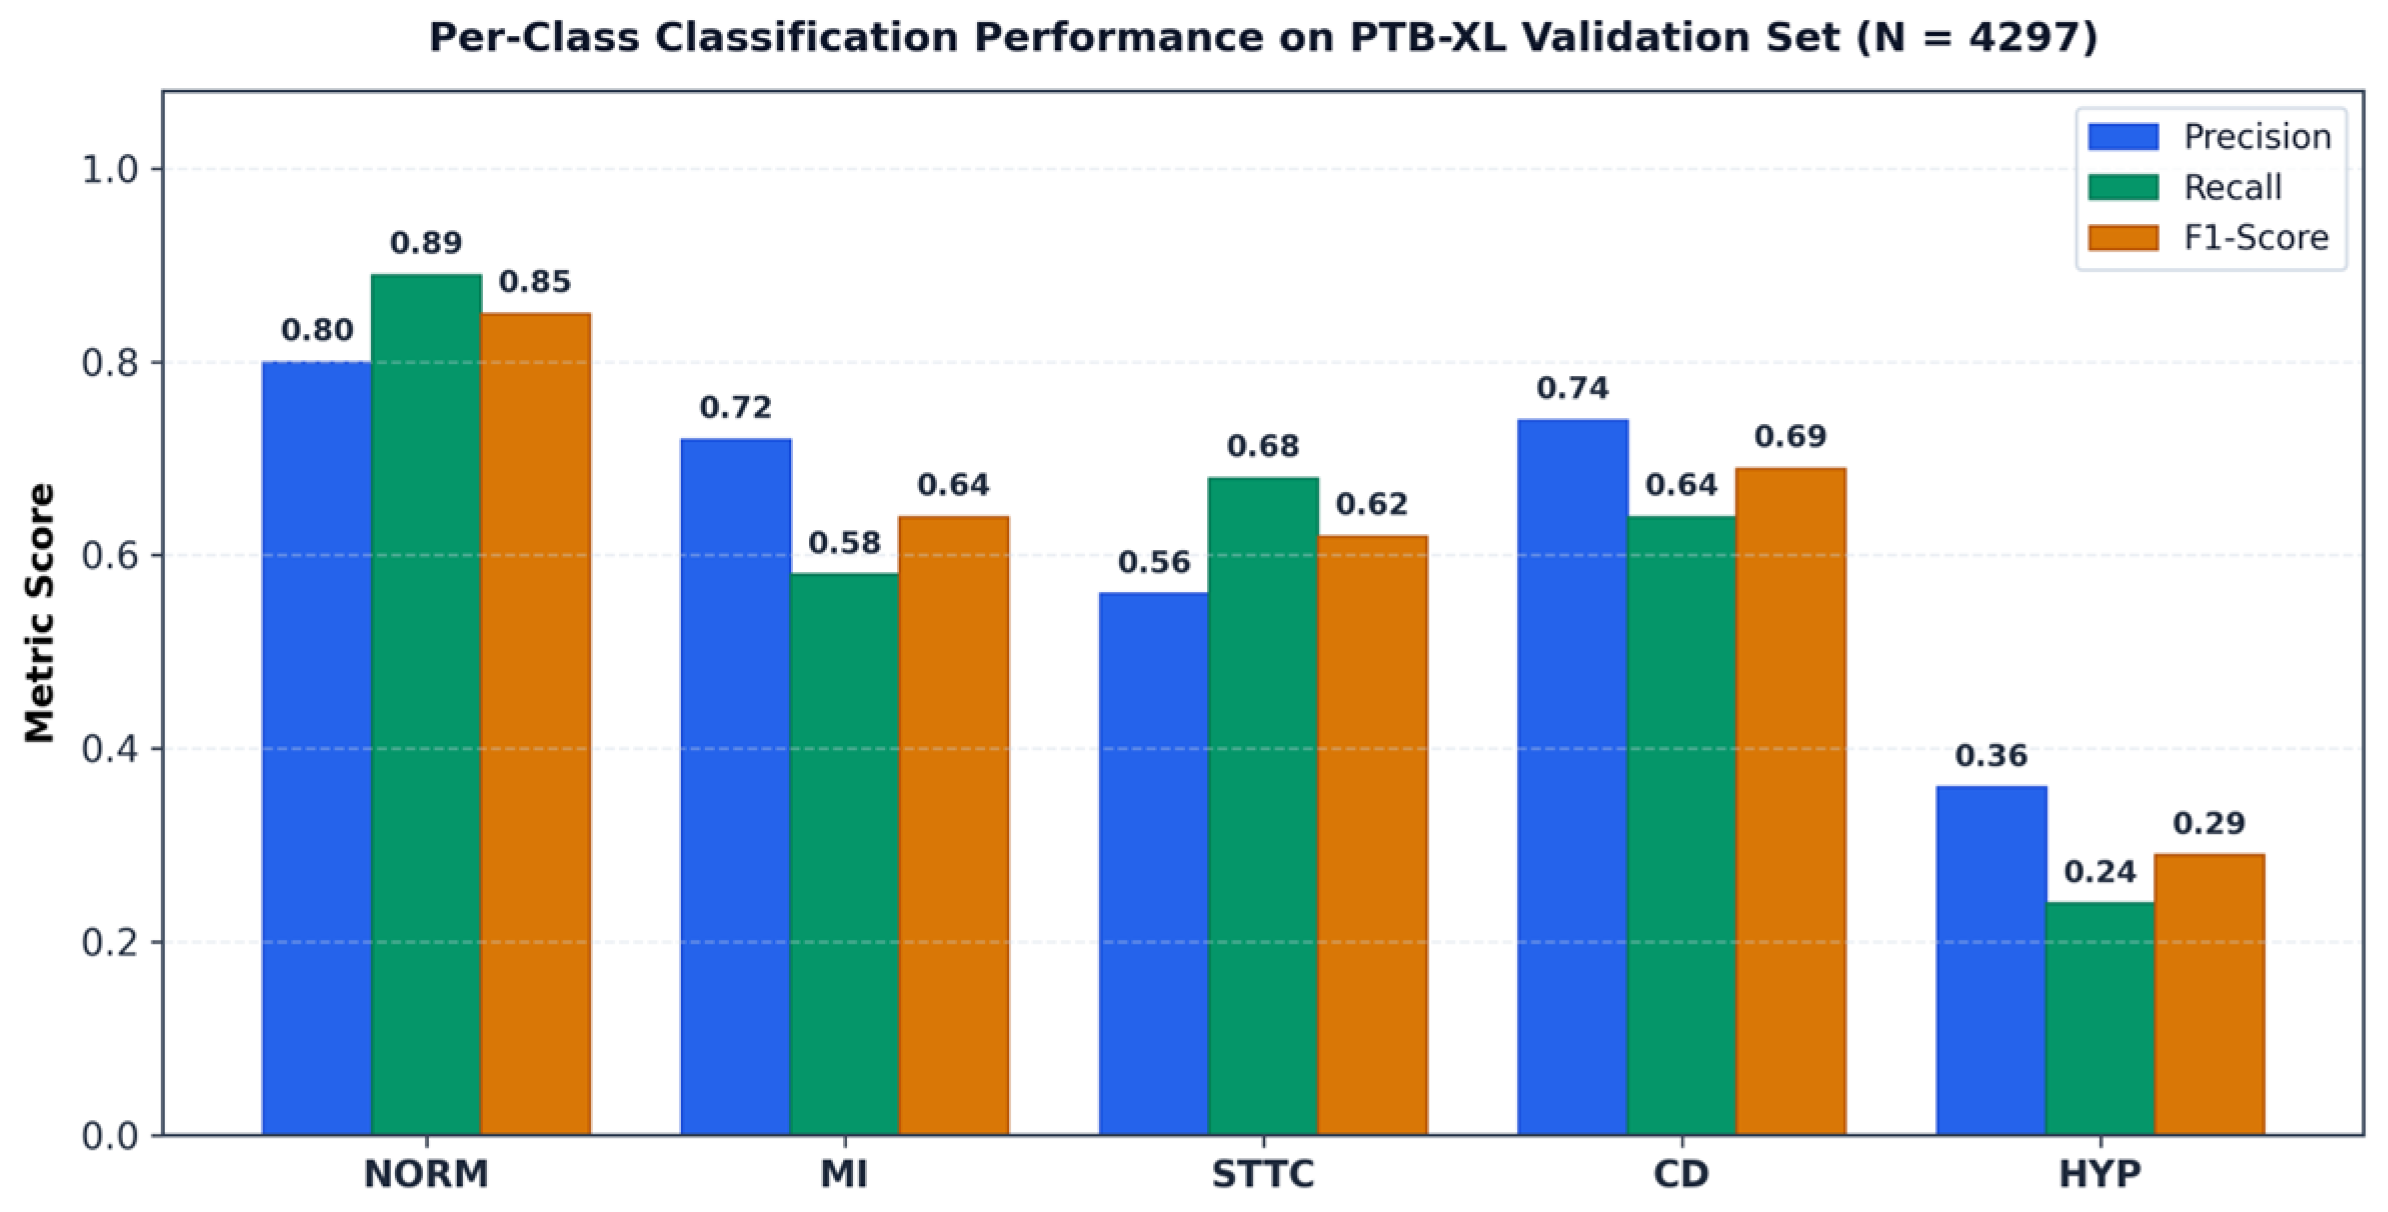
The ECGResNet1D classifier achieves a validation accuracy of 72.0% and a one-vs-rest macro AUC of 0.877 (ranging from 0.939 for NORM to 0.751 for HYP). As shown in the confusion matrix (Figure 3), NORM achieves the highest recall (0.89), whereas HYP misclassifications primarily overlap with STTC (33%) and NORM (29%). Detailed per-class precision, recall, and F1-scores are reported in Table 3 and Figure 4.
Figure 3.
Normalized confusion matrix on the validation set (fractions, counts in parentheses), showing highest recall for NORM and notable HYP–STTC confusion.
Figure 4.
Per-class precision, recall, and F1-score on the PTB-XL validation set.
3.2. Lead Degradation Performance
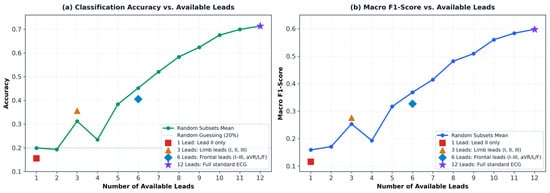
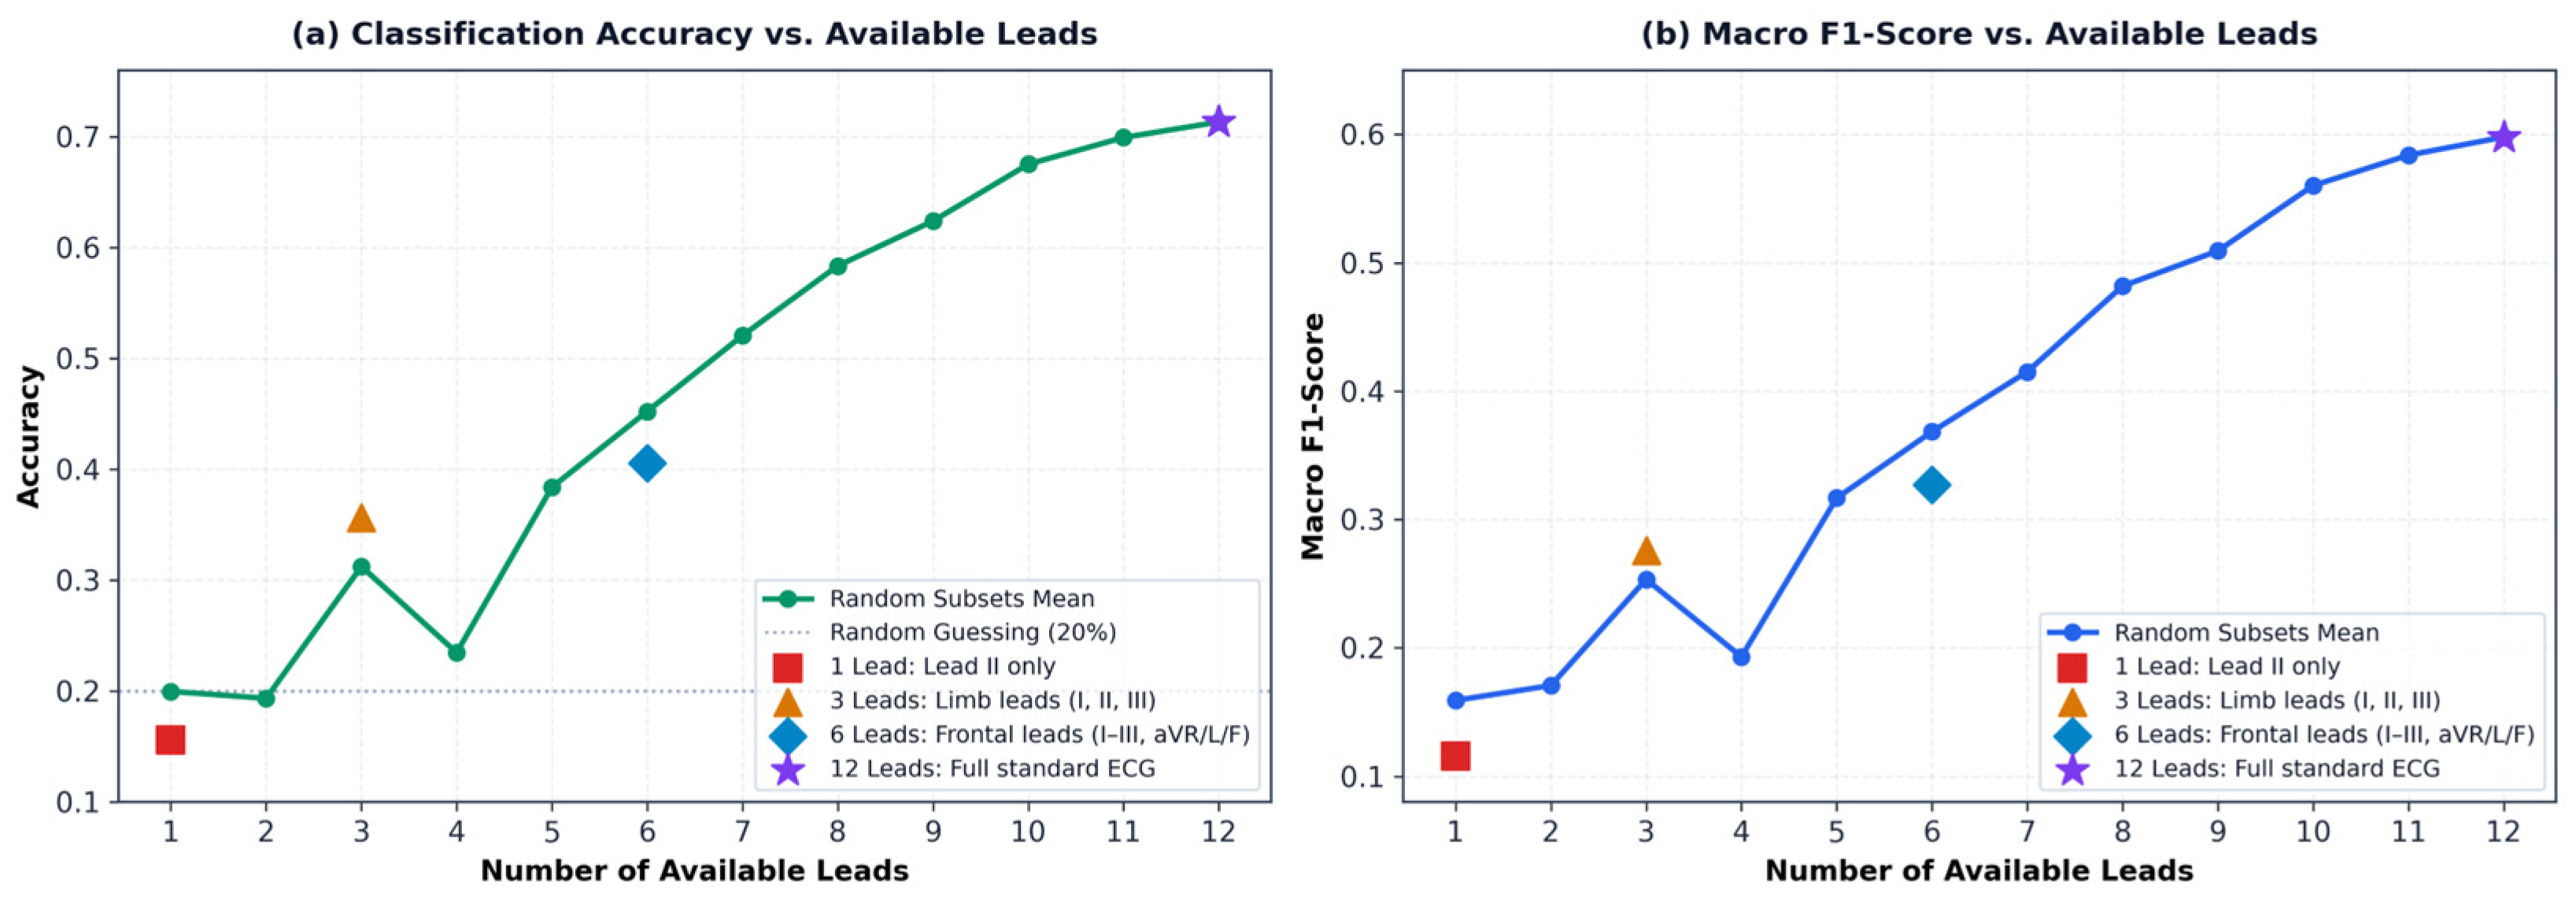
Table 4 reports classifier performance under four standard clinical lead configurations on a 10% subsample of the validation set (n ≈ 430), with the unavailable leads set to zero at test time; the model was trained on complete 12-lead input only. Accuracy and macro F1 rise with the number of available leads (Figure 5). With Lead II alone, accuracy (15.6%) is below the 20% expected from guessing among five classes, and with all 12 leads, it reaches 71.3%. The six frontal leads (40.6%) score below the mean of random six-lead subsets (45.2%).
Figure 5.
Classification performance versus number of available leads (missing leads zero-padded; model trained on 12 leads). Solid curves represent the mean over three random lead subsets; clinical configurations are marked individually.
3.3. End-to-End Image-to-Diagnosis Evaluation
The complete pipeline was evaluated end-to-end on a random sample of 50 validation records (distinct from Table 2) across three input modalities: native waveforms, clean digitized images, and red-grid digitized images (Table 5). Diagnostic accuracy fell progressively from 78.0% (native) to 64.0% (clean) and 28.0% (red-grid), reflecting the cumulative “digitization tax” introduced by pixel discretization, heuristic extraction, and grid interference. STTC retained moderate performance (F1 = 0.67), whereas the apparent drop in HYP (F1 = 0.00) reflects a sample-size limitation (N = 1 record, discussed in Section 4.1).
4. Discussion
4.1. Overall Performance and Digitization Impact
The ECGResNet1D classifier reaches 72.0% accuracy, a macro F1 of 0.618 and a one-vs-rest macro AUC of 0.877 on the validation set. Published PTB-XL models report macro AUC of 0.908–0.942 (Table 6) [11,17,18], but the comparison is indicative only: they solve a multi-label task on the official patient-aware folds with a held-out test fold, whereas ours is single-label five-class classification on a random record-wise split, evaluated on the set used for checkpoint selection. The last two differences would, if anything, favor our figures. Our classifier is a baseline for the digitization experiments, neither tuned nor compared with other architectures, so the gap is not an architectural finding.
Table 6.
Representative PTB-XL results from the literature and this work. Values are not directly comparable (see text).
Digitization was examined separately on 50 randomly drawn validation records with the same classifier (Table 5): macro F1 fell from 0.722 (native) to 0.496 (clean digitized) and 0.212 (red-grid), a substantial loss beyond the classifier’s baseline limitations. STTC maintained an F1 of 0.67 after clean digitization (0.74 native), whereas HYP dropped from 0.67 to 0.00. Crucially, because each lead is z-score standardized to zero mean and unit variance before classification in both training and inference pipelines, the network never receives absolute voltage in millivolts; classic voltage-threshold criteria, such as the Sokolow–Lyon index (SV1 + RV5 > 3.5 mV), cannot operate directly. Instead, the classifier relies on standardized waveform morphology and relative signal patterns rather than absolute millivolt thresholds. Furthermore, because this 50-record evaluation sample contained only a single true HYP record, the observed F1 drop to 0.00 is based on a single HYP record and is therefore not statistically generalizable.
4.2. Per-Class and Lead Availability Analysis
Diagnostic performance reflects both class prevalence and electrophysiological overlap. The pronounced confusion of HYP with STTC (33%) and NORM (29%) likely stems from secondary ST-T repolarization changes characteristic of ventricular hypertrophy, compounded by severe class imbalance (5.9% prevalence). In the lead-availability analysis, the marked performance gap between the six frontal leads (40.6%) and the full 12-lead set (71.3%) underscores the critical diagnostic value of precordial leads (V1–V6) for localized ischemia and chamber enlargement. Furthermore, the sharp performance drop under partial lead configurations (e.g., 15.6% for Lead II) demonstrates that zero-padding at test time introduces domain shift for networks trained exclusively on complete 12-lead tensors, highlighting the need for lead-dropout data augmentation during training.
4.3. Implications and Limitations
Several limitations qualify our findings. First, digitization was evaluated on synthetic renders rather than real clinical archives with physical paper artifacts. Second, the end-to-end evaluation cohort (N = 50) contained only one HYP record, making class-level collapse an ungeneralizable sample artifact. Third, using a random record-wise split without a held-out patient-wise test fold may yield optimistic classifier metrics. Finally, records were assigned single labels, and no alternative architectures were evaluated. Future work will benchmark on the official PTB-XL patient-aware splits, validate on scanned historical records, and explore multi-lead reconstruction frameworks such as ECGMiner [15].
5. Conclusions
This work quantified how paper-ECG digitization quality propagates to downstream multi-class abnormality classification. Using a training-free classical extraction pipeline and a 12-lead 1D ResNet baseline on PTB-XL, we demonstrated a substantial “digitization tax”, where diagnostic accuracy dropped from 78.0% on native waveforms to 64.0% on clean-digitized and 28.0% on red-grid images. Furthermore, classification degraded sharply with partial lead subsets, emphasizing the necessity of complete 12-lead acquisition or specialized missing-lead training. These findings indicate that while classical digitization enables legacy data recovery, preserving subtle morphological features and developing noise-robust classifiers remain critical for reliable clinical deployment.
Author Contributions
Conceptualization, K.H. and L.M.B.; methodology, K.H.; software, K.H.; validation, K.H. and L.M.B.; formal analysis, K.H.; investigation, K.H.; data curation, K.H.; writing—original draft preparation, K.H.; writing—review and editing, L.M.B.; supervision, L.M.B. All authors have read and agreed to the published version of the manuscript.
Funding
This research received no external funding.
Institutional Review Board Statement
Not applicable.
Informed Consent Statement
Not applicable.
Data Availability Statement
This study used the publicly available PTB-XL dataset [1]. No new primary clinical data were collected.
Acknowledgments
During the preparation of this manuscript, the authors used Claude Sonnet 5.5 for language editing and manuscript restructuring assistance. The authors have reviewed and edited the output and take full responsibility for the content of this publication.
Conflicts of Interest
The authors declare no conflict of interest.
Abbreviations
The following abbreviations are used in this manuscript:
| 1D | One-Dimensional |
| CD | Conduction Disturbances |
| dB | Decibel |
| DPI | Dots Per Inch |
| ECG | Electrocardiogram |
| HYP | Hypertrophy |
| Hz | Hertz |
| MI | Myocardial Infarction |
| ms | Millisecond |
| MSE | Mean Squared Error |
| mV | Millivolt |
| NORM | Normal |
| PTB-XL | PTB Diagnostic ECG Database, Extra Large |
| QRS | QRS Complex |
| ResNet | Residual Network |
| SNR | Signal-to-Noise Ratio |
| STTC | ST/T-Wave Changes |
References
- Wagner, P.; Strodthoff, N.; Bousseljot, R.-D.; Kreiseler, D.; Lunze, F.I.; Samek, W.; Schaeffter, T. PTB-XL, a large publicly available electrocardiography dataset. Sci. Data 2020, 7, 154. [Google Scholar] [CrossRef] [Scilit] [PubMed]
- Xiong, P.; Lee, S.M.-Y.; Chan, G. Deep Learning for Detecting and Locating Myocardial Infarction by Electrocardiogram: A Literature Review. Front. Cardiovasc. Med. 2022, 9, 860032. [Google Scholar] [CrossRef] [Scilit] [PubMed]
- Wu, H.; Patel, K.H.K.; Li, X.; Zhang, B.; Galazis, C.; Bajaj, N.; Sau, A.; Shi, X.; Sun, L.; Tao, Y.; et al. A fully-automated paper ECG digitization algorithm using deep learning. Sci. Rep. 2022, 12, 20963. [Google Scholar] [CrossRef] [Scilit] [PubMed]
- Mishra, S.; Khatwani, G.; Patil, R.; Sapariya, D.; Shah, V.; Parmar, D.; Dinesh, S.; Daphal, P.; Mehendale, N. ECG Paper Record Digitization and Diagnosis Using Deep Learning. J. Med. Biol. Eng. 2021, 41, 422–432. [Google Scholar] [CrossRef] [Scilit] [PubMed]
- Guan, H.; Liu, M. Domain Adaptation for Medical Image Analysis: A Survey. IEEE Trans. Biomed. Eng. 2021, 69, 1173–1185. [Google Scholar] [CrossRef] [Scilit] [PubMed]
- Sarafraz, G.; Behnamnia, A.; Hosseinzadeh, M.; Balapour, A.; Meghrazi, A.; Rabiee, H.R. Domain Adaptation and Generalization of Functional Medical Data: A Systematic Survey of Brain Data. ACM Comput. Surv. 2024, 56, 255. [Google Scholar] [CrossRef] [Scilit]
- Soni, S.K. Automated ECG-Based Heart Disease Prediction Using Self-Supervised Learning. J. Inf. Syst. Eng. Manag. 2025, 10, 1088–1095. [Google Scholar] [CrossRef] [Scilit]
- Digital Imaging and Communications in Medicine (DICOM) Supplement 30: Waveform Interchange. Available online: https://dicom.nema.org/dicom/supps/sup30_lb.pdf (accessed on 3 March 2026).
- Lence, A.; Fall, A.; Cohen, S.D.; Granese, F.; Zucker, J.-D.; Salem, J.-E.; Prifti, E. ECGtizer: An open-source, fully automated pipeline for digitization and signal recovery from paper electrocardiograms. Biomed. Signal Process. Control 2026, 112, 108710. [Google Scholar] [CrossRef] [Scilit]
- Fortune, J.D.; Coppa, N.E.; Haq, K.T.; Patel, H.; Tereshchenko, L.G. Digitizing ECG image: A new method and open-source software code. Comput. Methods Programs Biomed. 2022, 221, 106890. [Google Scholar] [CrossRef] [Scilit] [PubMed]
- Strodthoff, N.; Wagner, P.; Schaeffter, T.; Samek, W. Deep Learning for ECG Analysis: Benchmarks and Insights from PTB-XL. arXiv 2020, arXiv:2004.13701. [Google Scholar]
- Badilini, F.; Erdem, T.; Zareba, W.; Moss, A.J. ECGScan: A method for conversion of paper electrocardiographic printouts to digital electrocardiographic files. J. Electrocardiol. 2005, 38, 310–318. [Google Scholar] [CrossRef] [Scilit] [PubMed]
- Randazzo, V.; Puleo, E.; Paviglianiti, A.; Vallan, A.; Pasero, E. Development and Validation of an Algorithm for the Digitization of ECG Paper Images. Sensors 2022, 22, 7138. [Google Scholar] [CrossRef] [Scilit] [PubMed]
- Baydoun, M.; Safatly, L.; Abou Hassan, O.K.; Ghaziri, H.; El Hajj, A.; Isma’eel, H. High Precision Digitization of Paper-Based ECG Records: A Step Toward Machine Learning. IEEE J. Transl. Eng. Health Med. 2019, 7, 1–8. [Google Scholar] [CrossRef] [Scilit] [PubMed]
- Santamónica, A.F.; Carratalá-Sáez, R.; Larriba, Y.; Pérez-Castellanos, A.; Rueda, C. ECGMiner: A flexible software for accurately digitizing ECG. Comput. Methods Programs Biomed. 2024, 246, 108053. [Google Scholar] [CrossRef] [Scilit] [PubMed]
- He, K.; Zhang, X.; Ren, S.; Sun, J. Deep Residual Learning for Image Recognition. In Proceedings of the 2016 IEEE Conference on Computer Vision and Pattern Recognition (CVPR), Las Vegas, NV, USA, 27–30 June 2016; pp. 770–778. [Google Scholar]
- Mehari, T.; Strodthoff, N. Advancing the State-of-the-Art for ECG Analysis through Structured State Space Models. arXiv 2022, arXiv:2211.07579. [Google Scholar]
- Tassaddiq, A.; Albarakati, A.; Alharbi, R.; Cattani, C.; Almutairi, D.K.; Kasmani, R.M. AI-Assisted Multilabel Diagnosis of 12-Lead Electrocardiograms Using an Interpretable Stacked Deep Learning Model with External Validation. Diagnostics 2026, 16, 2781. [Google Scholar] [CrossRef] [Scilit] [PubMed]



Disclaimer/Publisher’s Note: The statements, opinions and data contained in all publications are solely those of the individual author(s) and contributor(s) and not of MDPI and/or the editor(s). MDPI and/or the editor(s) disclaim responsibility for any injury to people or property resulting from any ideas, methods, instructions or products referred to in the content. |
© 2026 by the authors. Licensee MDPI, Basel, Switzerland. This article is an open access article distributed under the terms and conditions of the Creative Commons Attribution (CC BY) license.