


Abstract
This paper evaluates the field reliability and environmental performance of mobile-terminal remanufacturing based on board-level microelectronics and qualified donor components. A complete 2025 population of 3297 workshop records from Ambato, Ecuador, was examined through digital fault coding, electrical and thermal diagnosis, microsoldering, functional validation, and warranty-return monitoring. Of the 3297 records, 3151 devices were released after repair (95.57%); 102 of these released devices later returned for warranty rework. Warranty returns were stratified by intervention route: 84 devices (82.4%) from direct repair operations and 18 devices (17.6%) from donor-component interventions. The direct repair warranty-return rate was 3.22% (84/2606); the donor-component warranty-return rate was 4.06% (18/443). The difference was not statistically significant (χ2 = 0.41, p > 0.05), suggesting similar post-repair reliability between pathways for this dataset. This left 3049 effective no-return interventions (92.48% of incoming records). Among the effective interventions, 443 (14.53%) used donor components, mainly charging and connectivity integrated circuits. The no-return reliability proxy was 96.76% (95% CI: 96.09–97.33%). Manufacturer and documented returns were associated (chi-square = 50.73, p < 0.001) with elevated relative risk for Samsung and Xiaomi versus Apple. Under the baseline assumption that each released device displaces one new-device purchase, the screening model estimated that 215.5 t CO2-eq of emissions were avoided and 548.3 kg of device mass was retained in service. The results provide a reproducible applied-electronics basis for circular repair, digital traceability, and future intelligent diagnostic systems.
1. Introduction
Global e-waste reached 62 Mt in 2022 and continues to grow faster than formally documented collection and recycling [1]. Mobile phones are a critical stream because of short replacement cycles, hardware failure, rapid technological change, and uncertain end-of-life behavior can keep devices and valuable components outside controlled recovery systems [2,3]. Extending service life through diagnosis, repair, refurbishment, and remanufacturing can preserve embodied materials and reduce demand for newly manufactured devices.
Empirical research shows that mobile-phone remanufacturing depends on technical competence, spare-part access, reverse logistics, customer confidence, and viable business models [4,5]. Studies across Austria, the Netherlands, Poland, China, Japan, Indonesia, and Mexico further show that repair, reuse, and refurbished-device decisions are shaped by service availability, product value, consumer behavior, and the surrounding circular-economy ecosystem [6,7,8,9,10].
Smartphone durability and repairability are strongly affected by product architecture, joining methods, component integration, documentation, and access to repair information [11,12]. Repair studies also identify recurring technical barriers and the need for more reproducible service practices [13]. At the component level, reversible assembly and controlled part harvesting can strengthen circularity when compatibility and technical condition are verified [14].
Environmental assessments consistently identify material extraction, component production, and manufacturing as major contributors to smartphone impacts [15,16,17]. Reuse, refurbishment, repair, and circular end-of-use strategies can therefore reduce climate burdens when they provide sufficient additional service life and displace new production [18,19,20]. Environmental claims must consequently disclose assumptions on substitution, repair energy, transport, and lifetime extension.
This study converts one year of workshop records into a technical reliability assessment for applied electronics. Its contributions are a traceable microelectronics protocol; quantitative repair, donor-use, and rework indicators; manufacturer-level risk comparison; transparent environmental screening with substitution sensitivity; and a roadmap connecting digital diagnostics, intelligent systems, telecommunications hardware, and sustainable production.
2. Materials and Methods
2.1. Dataset and Technical Classification
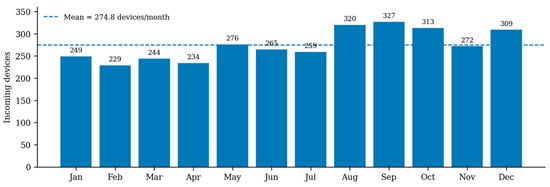
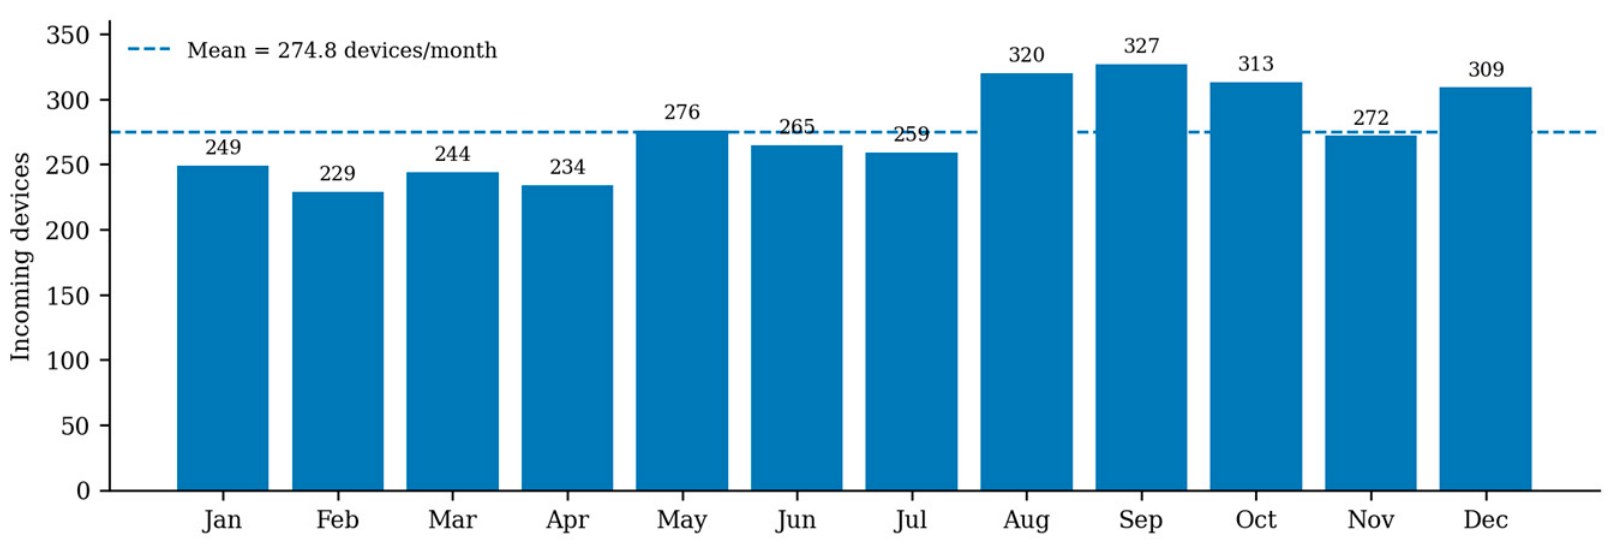
The dataset comprised all 3297 mobile terminals registered from January through December 2025 at a specialized board-repair workshop in Ambato, Ecuador, as shown in Figure 1. No statistical sample was drawn because the complete accessible population was used. Each anonymized record contained the brand, model, reported symptom, diagnostic class, intervention route, donor-component use, final status, and warranty-return information; customer-identifying fields were excluded.
Figure 1.
Monthly workload of the complete 2025 field population. The largest intake occurred from August to October, while the annual mean was 274.8 devices per month.
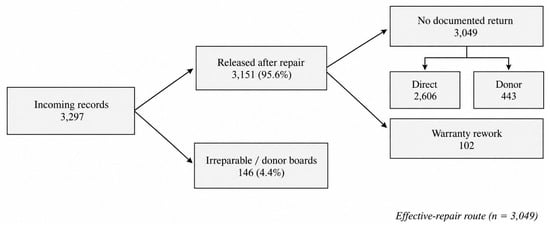
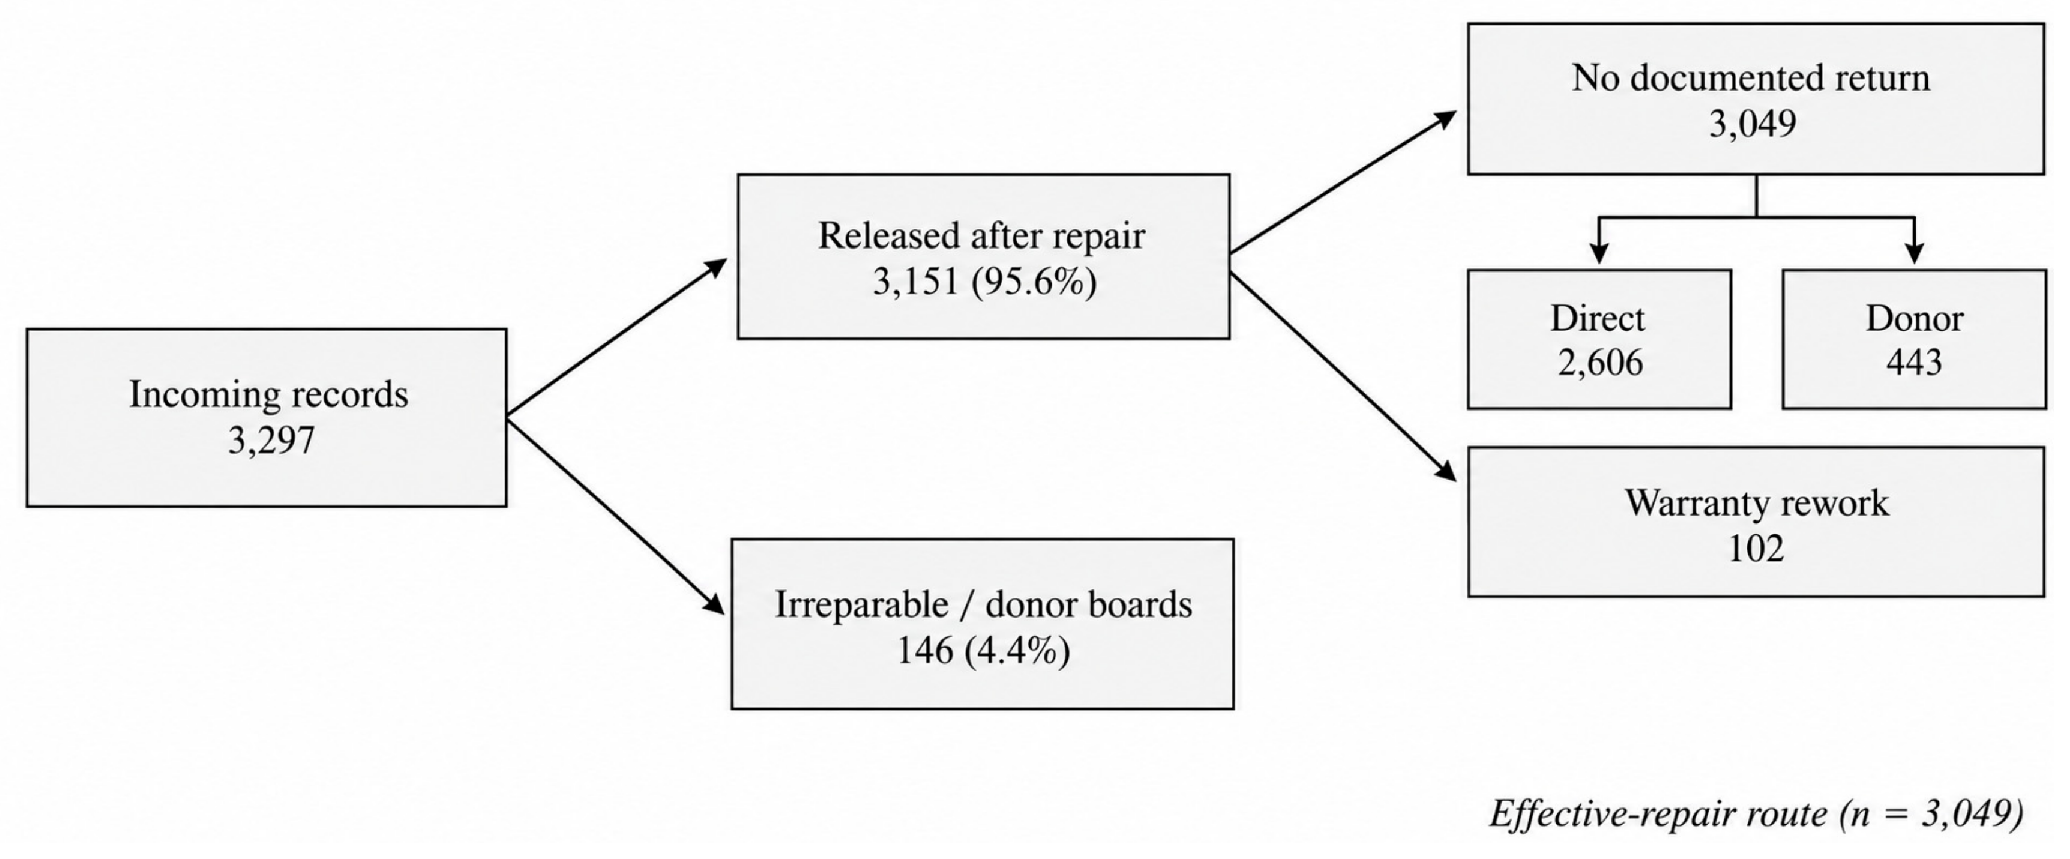
Records were classified as released after repair (3151) or irreparable/donor boards (146). The 102 warranty-return cases are a subset of the 3151 released devices. Accordingly, 3049 = 3151 − 102 denotes released devices with no documented warranty return during the monitoring period; this effective no-return population comprised 2606 direct microelectronics interventions and 443 donor-component interventions. This definition separates initial release, warranty outcome, and effective no-return status without counting a warranty return as a new device.
2.2. Traceable Remanufacturing Protocol
Figure 2 presents the traceable workflow integrating digital records with electrical, thermal, optical, and functional evidence. A regulated DC supply identified abnormal current signatures and short circuits; a thermal camera localized heat-generating defects; a trinocular microscope RF7050-TVP v.2024 supported SMD/BGA inspection; and multimeters Fluke 17B+, oscilloscopes Rigol DS1102Z-E, USB power meters FNIRSI FNB58, memory programmers RT809H, schematic viewers ZXW Tools v.4.0, and layout tools supported fault isolation. Donor components were obtained only from boards classified as non-recoverable, then visually inspected, cleaned, electrically screened, matched for compatibility, and reballed when required.
Figure 2.
Traceable field protocol for diagnosis, intervention, post-repair validation, and warranty monitoring.
Post-intervention validation covered boot behavior, current consumption, charging, cellular service, Wi-Fi, Bluetooth, display, audio, microphones, cameras, and thermal stability. The protocol applies reused-part qualification and reliability principles through documented component screening, compatibility checks, functional verification, and warranty monitoring.
2.3. Reliability and Statistical Analysis
The effective no-return repair yield and warranty-based reliability proxy were calculated using Equations (1) and (2)
where Ntotal = 3297, Nreleased = 3151, Nrework = 102, and Neff = Nreleased − Nrework = 3049. Thus, the initial release yield is 95.57%, the effective no-return yield is 92.48% (95% CI: 91.53–93.33%), and the no-return reliability proxy is 96.76% (95% CI: 96.09–97.33%). Wilson 95% confidence intervals were used for proportions. A 2 × 4 Pearson chi-square test evaluated association between manufacturer group and documented warranty return in the full attended population. Relative risk (RR) with log-scale 95% confidence intervals compared Samsung and Xiaomi against Apple. The warranty proxy measures documented early field recurrence; it is not a complete time-to-failure reliability function.
Yeff = Neff/Ntotal × 100,
Rw = (1 − Nrework/Nreleased) × 100,
Route-stratified warranty analysis: warranty-return rates by intervention route were calculated using Equations (3) and (4)
where Nreleased,direct = 2606, Nreturn,direct = 84; Nreleased,donor = 443, and Nreturn,donor = 18. Route-stratified comparison used a 2 × 2 Pearson χ2 test with continuity correction. This analysis determines whether direct microelectronics repair (reballing, circuit reconstruction) and donor-component reuse (selective high-integration IC recovery) show statistically different post-repair reliability outcomes.
Rdirect = (Nreturn,direct/Nreleased,direct) × 100,
Rdonor = (Nreturn,donor/Nreleased,donor) × 100,
2.4. Environmental Screening
The screening model followed the scenario logic of ISO 14040/14044 [21,22]. The baseline replacement scenario assigned 70 kg CO2-eq to each released device, consistent with representative smartphone life-cycle studies [15,16,17] and assumed that one released device displaces one new-device purchase. Because actual replacement behavior was not observed, this one-to-one substitution is treated explicitly as an assumption. The repair scenario assigned screening factors of 1.5 kg CO2-eq to direct repair, 2.2 kg CO2-eq to donor-component repair, and 1.5 kg CO2-eq to warranty rework; these are scenario parameters rather than measured product carbon inventories. Emissions avoided were calculated with Equation (5).
Eavoided(f) = f Nreleased Enew − Σi Ni Ei
In Equation (3), f is the assumed displacement fraction (0.50, 0.75, or 1.00). Device mass retained in service was estimated to use an average terminal mass of 0.174 kg. Because transport, electricity mix, product-specific declarations, actual added lifetime, subsequent replacement behavior, and end-of-life fate were unavailable, the environmental results are reported as screening estimates rather than a certified comparative LCA. Non-harvestable residues should be transferred to authorized end-of-life managers.
3. Results
3.1. Repair Yield and Intervention Routes
Of 3297 incoming devices, 3151 were initially released after repair (95.57%; 95% CI: 94.81–96.22%), and 146 were retained as irreparable donor boards. Among the released devices, 102 later returned for warranty rework; therefore, 3049 remained without a documented warranty return, corresponding to an effective no-return yield of 92.48% of all incoming records. Within this 3049-device effective population, 2606 interventions were completed by direct microelectronics and 443 (14.53%; 95% CI: 13.32–15.82%) required qualified donor components. Figure 3 shows the relationship among these populations, and Table 1 summarizes the principal indicators.
Figure 3.
Disposition and analytical structure of the 3297 field records. Warranty rework is a monitored outcome of released repairs, whereas direct and donor routes describe the effective intervention method.
Table 1.
Warranty-return rates disaggregated by intervention route.
3.2. Fault Concentration and Donor Use
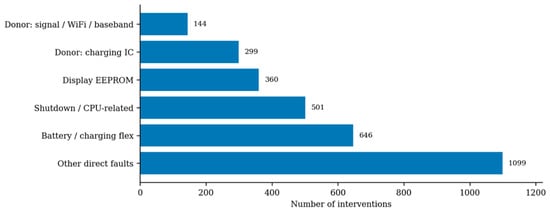
Figure 4 shows that direct interventions were dominated by battery or charging-flex faults (646), unexpected shutdown/CPU-related faults (501), and display EEPROM transfer or reprogramming (360). The remaining 1099 direct repairs included audio, backlight, peripheral, charging, and other board-level categories. Donor-component interventions were concentrated in charging circuits (299 cases; 67.5%) and signal, Wi-Fi, or baseband circuits (144; 32.5%), indicating selective use of recovered high-integration components rather than indiscriminate substitution.
Figure 4.
Distribution of principal categories of direct interventions and donor-components.
3.3. Warranty Reliability and Manufacturer Effect
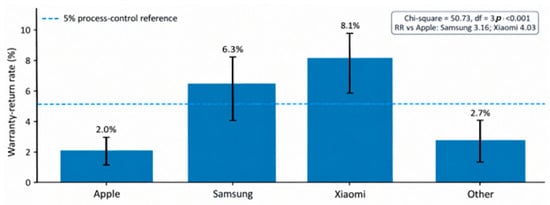
Among the 3151 released devices, 102 warranty returns corresponded to a 3.24% return rate and a 96.76% no-return reliability proxy (95% CI: 96.09–97.33%). Figure 5 reports manufacturer-specific return incidence using the full attended population: Apple 50/2492 (2.0%), Samsung 18/284 (6.3%), Xiaomi 30/371 (8.1%), and other brands 4/150 (2.7%). Manufacturer and documented return were significantly associated (chi-square = 50.73, df = 3, p < 0.001). Relative to Apple, the rework risk was 3.16 for Samsung (95% CI: 1.87–5.34) and 4.03 for Xiaomi (95% CI: 2.60–6.25%). The disaggregated warranty data reveals comparable post-repair reliability between direct microelectronics repair (3.22% return rate) and donor-component reuse (4.06% return rate). The 0.84 percentage-point difference was not statistically significant (χ2 = 0.41, p > 0.05), suggesting that for this field population, neither intervention route showed detectably superior reliability. This finding is notable because it indicates that controlled donor-component qualification—visual inspection, electrical screening, compatibility verification, and reballing—can yield equivalent functional outcomes to direct repair in a high-volume workshop setting.
Figure 5.
Manufacturer-specific warranty-return rates with Wilson 95% confidence intervals. Differences support platform-specific acceptance testing rather than a single uniform release criterion.
3.4. Environmental Performance and Sensitivity
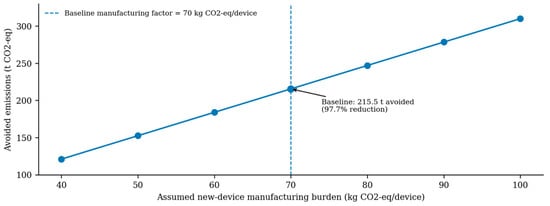
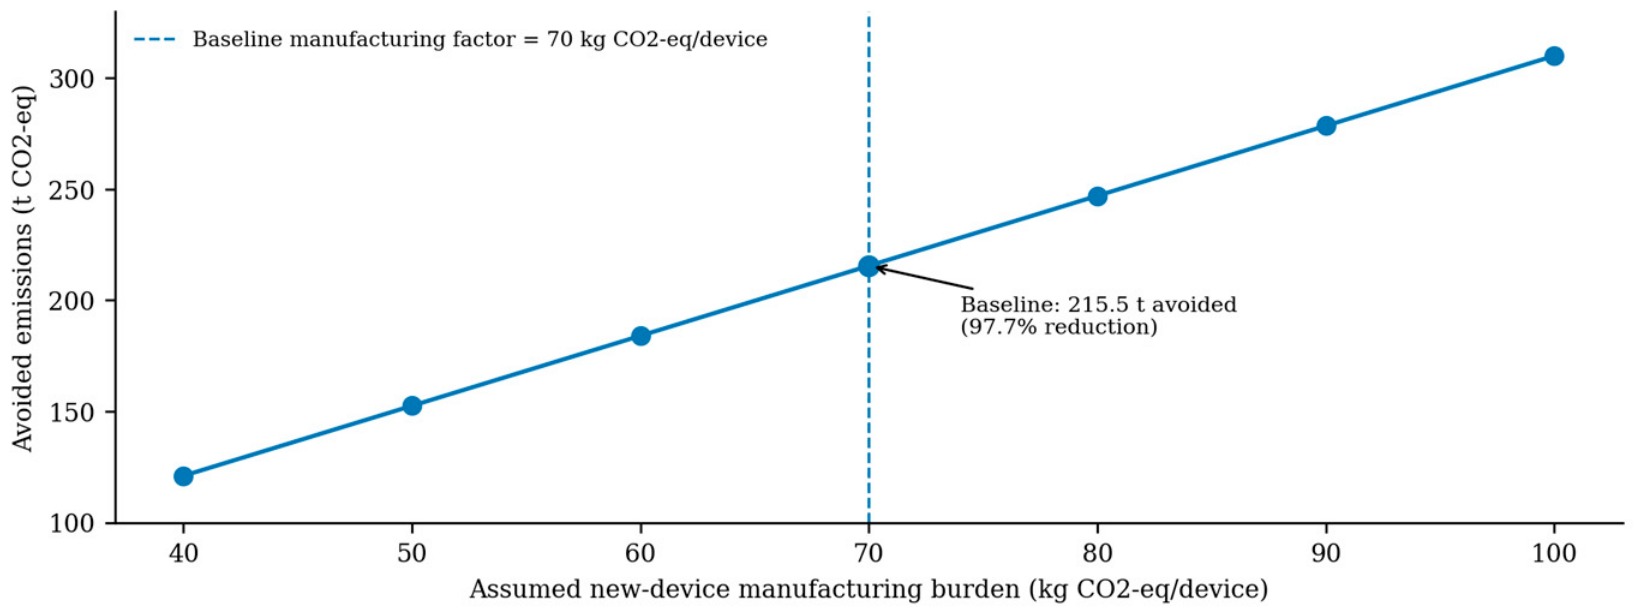
Under baseline assumptions (100% displacement, 70 kg CO2-eq per new device), estimated avoided emissions were 215.5 t CO2-eq for the 3151 released devices. Sensitivity analysis for displacement fraction f: at f = 0.50 (50% displacement), 105.2 t; at f = 0.75 (75% displacement), 160.4 t; at f = 1.00 (100% displacement), 215.5 t. Estimated device mass retained in service: 548.3 kg (3151 × 0.174 kg average device mass) at assessment time. These results are screening estimates; permanent e-waste prevention cannot be claimed without tracking post-repair device lifespan and end-of-life fate as shown in Figure 6.
Figure 6.
Sensitivity of avoided emissions to the assumed manufacturing burden of a replacement smartphone. The marked point is the 70 kg CO2-eq baseline used in this study.
4. Discussion
The disaggregated warranty data reveals comparable post-repair reliability between direct microelectronics repair (3.22% return rate) and donor-component reuse (4.06% return rate). The 0.84 percentage-point difference was not statistically significant, suggesting that for this field population, neither intervention route showed detectably superior reliability. This finding is notable because it indicates that controlled donor-component qualification—visual inspection, electrical screening, compatibility verification, and reballing—can yield equivalent functional outcomes to direct repair in a high-volume workshop setting.
The concentration of donor components in charging and connectivity subsystems (99.8% of 443 interventions) demonstrates selective, high-value component recovery rather than indiscriminate reuse. This selective strategy has likely contributed to the observed warranty performance; complex high-integration circuits (power-management ICs, RF transceivers) are candidates for donor reuse only after rigorous qualification. Manufacturer-level differences (Apple 2.0% vs. Xiaomi 8.1% return rates) exceed route-specific variation, suggesting that platform-specific design robustness and repair complexity are larger drivers of field reliability than intervention pathway. This motivates platform-specific validation protocols: tiered testing by device category rather than uniform release criteria.
Environmental screening is consistent with literature showing that manufacturing dominates much of the smartphone life-cycle burden and that repair, refurbishment, and reuse can provide benefits when they extend useful life and displace new production [15,16,17,18,19,20]. The 215.5 t CO2-eq value is therefore reported only as estimated emissions avoided under the 100% displacement baseline; the 50% and 75% scenarios show how strongly the magnitude depends on replacement behavior. Likewise, 548.3 kg is device mass retained in service at assessment, not e-waste permanently prevented. The study is limited by one workshop, local brand distribution, possible non-return of faulty devices, generic emission factors, and unavailable operating-time and end-of-life data.
Repair extends service life only finitely. At final end of life, remaining printed circuit boards (PCBs) and non-harvestable components should enter authorized recycling and material-recovery systems to recover secondary resources and control hazardous fractions [19,20]. Integrating this pathway with traceable repair and donor management closes the circular loop beyond service-life extension.
5. Conclusions
A one-year population of 3297 records was evaluated through a traceable diagnosis and component-qualification workflow with disaggregated warranty tracking. Release yield was 95.57%; no-return yield 92.48%. Warranty returns were stratified by intervention route: direct repair 3.22% (84/2606) and donor-component reuse 4.06% (18/443). The difference was not statistically significant (χ2 = 0.41, p > 0.05), indicating no detected reliability disadvantage to controlled donor-component recovery in this dataset. Donor interventions were concentrated on high-value charging and connectivity subsystems. Manufacturer-level differences were substantial and statistically significant, suggesting design complexity and platform robustness are primary drivers of field reliability. Environmental screening under baseline assumptions (100% displacement) estimated 215.5 t CO2-eq avoided; sensitivity analysis (50–75% displacement scenarios) showed 105–160 t. Estimates are screening-level, pending validation of actual device displacement, post-repair lifespan, and end-of-life outcomes as future work. The findings establish a reproducible technical protocol with disaggregated reliability comparison and provide a framework for multi-center validation of repair vs. donor-component recovery strategies in circular electronics systems.
Author Contributions
Conceptualization, L.A.F.A. and L.O.F.; methodology, L.A.F.A. and L.O.F.; software, L.A.F.A.; validation, L.O.F. and C.V.T.V.; formal analysis, L.A.F.A. and C.V.T.V.; investigation, L.A.F.A.; resources, M.X.L.F.; data curation, L.O.F.; writing—original draft preparation, M.X.L.F. and L.A.F.A.; writing—review and editing, M.X.L.F.; visualization, M.X.L.F.; supervision, M.X.L.F. and L.A.F.A.; project administration, L.A.F.A. and M.X.L.F. All authors have read and agreed to the published version of the manuscript.
Funding
This research received no external funding.
Institutional Review Board Statement
Not applicable.
Informed Consent Statement
Not applicable.
Data Availability Statement
The original contributions presented in this study are included in the article. Further inquiries can be directed to the corresponding author.
Acknowledgments
The authors acknowledge the support of the Universidad Técnica de Ambato. Google Gemini 3.8 was used only for code optimization, language correction, and organization of ideas; all outputs were reviewed by the authors, who take full responsibility for the manuscript.
Conflicts of Interest
The authors declare no conflicts of interest.
Abbreviations
| CO2-eq | Carbon-dioxide equivalent |
| EEPROM | Electrically erasable programmable read-only memory |
| LCA | Life-cycle assessment |
| PMIC | Power-management integrated circuit |
| WEEE | Waste electrical and electronic equipment. |
References
- International Telecommunication Union. The Global E-Waste Monitor 2024; ITU: Geneva, Switzerland, 2024; Available online: https://www.itu.int/en/ITU-D/Environment/Pages/Publications/The-Global-E-waste-Monitor-2024.aspx (accessed on 14 October 2026).
- Prabhu, N.S.; Majhi, R. Disposal of obsolete mobile phones: A review on replacement, disposal methods, in-use lifespan, reuse and recycling. Waste Manag. Res. 2023, 41, 18–36. [Google Scholar] [CrossRef] [Scilit] [PubMed]
- Ongondo, F.O.; Williams, I.D. Mobile phone collection, reuse and recycling in the UK. Waste Manag. 2011, 31, 1307–1315. [Google Scholar] [CrossRef] [Scilit] [PubMed]
- Wahjudi, D.; Gan, S.-S.; Tanoto, Y.Y.; Winata, J.; Tjahjono, B. Drivers and barriers of mobile phone remanufacturing business in Indonesia: Perspectives of retailers. E3S Web Conf. 2019, 130, 01006. [Google Scholar] [CrossRef] [Scilit]
- Santana, J.C.C.; Guerhardt, F.; Franzini, C.E.; Ho, L.L.; Júnior, S.E.R.R.; Cânovas, G.; Yamamura, C.L.K.; Vanalle, R.M.; Berssaneti, F.T. Refurbishing and recycling of cell phones as a sustainable process of reverse logistics: A case study in Brazil. J. Clean. Prod. 2021, 283, 124585. [Google Scholar] [CrossRef] [Scilit]
- Wieser, H.; Tröger, N. Exploring the inner loops of the circular economy: Replacement, repair, and reuse of mobile phones in Austria. J. Clean. Prod. 2018, 172, 3042–3055. [Google Scholar] [CrossRef] [Scilit]
- Türkeli, S.; Huang, B.; Stasik, A.; Kemp, R. Circular economy as a glocal business activity: Mobile phone repair in the Netherlands, Poland and China. Energies 2019, 12, 498. [Google Scholar] [CrossRef] [Scilit]
- Chun, Y.-Y.; Matsumoto, M.; Chinen, K.; Endo, H.; Gan, S.-S.; Tahara, K. What will lead Asian consumers into circular consumption? An empirical study of purchasing refurbished smartphones in Japan and Indonesia. Sustain. Prod. Consum. 2022, 33, 158–167. [Google Scholar] [CrossRef] [Scilit]
- Cordova-Pizarro, D.; Aguilar-Barajas, I.; Rodriguez, C.A.; Romero, D. Circular economy in Mexico’s electronic and cell phone industry: Recent evidence of consumer behavior. Appl. Sci. 2020, 10, 7744. [Google Scholar] [CrossRef] [Scilit]
- Ali, S.; Shirazi, F. The paradigm of circular economy and an effective electronic waste management. Sustainability 2023, 15, 1998. [Google Scholar] [CrossRef] [Scilit]
- Cordella, M.; Alfieri, F.; Clemm, C.; Berwald, A. Durability of smartphones: A technical analysis of reliability and repairability aspects. J. Clean. Prod. 2021, 286, 125388. [Google Scholar] [CrossRef] [Scilit] [PubMed]
- Barros, M.; Dimla, E. Smartphone repairability indexes in practice: Linking repair scores to industrial design features. J. Ind. Ecol. 2023, 27, 923–936. [Google Scholar] [CrossRef] [Scilit]
- Rudolf, S.; Blömeke, S.; Niemeyer, J.F.; Lawrenz, S.; Sharma, P.; Hemminghaus, S.; Mennenga, M.; Schmidt, K.; Rausch, A.; Spengler, T.S.; et al. Extending the life cycle of EEE-Findings from a repair study in Germany: Repair challenges and recommendations for action. Sustainability 2022, 14, 2993. [Google Scholar] [CrossRef] [Scilit]
- Parchomenko, A.; De Smet, S.; Pals, E.; Vanderreydt, I.; Van Opstal, W. The circular economy potential of reversible bonding in smartphones. Sustain. Prod. Consum. 2023, 41, 362–378. [Google Scholar] [CrossRef] [Scilit]
- Suckling, J.; Lee, J. Redefining scope: The true environmental impact of smartphones? Int. J. Life Cycle Assess. 2015, 20, 1181–1196. [Google Scholar] [CrossRef] [Scilit]
- Ercan, M.; Malmodin, J.; Bergmark, P.; Kimfalk, E.; Nilsson, E. Life cycle assessment of a smartphone. In Proceedings of the ICT for Sustainability 2016, Amsterdam, The Netherlands, 30 August–1 September 2016; pp. 124–133. [Google Scholar] [CrossRef] [Scilit]
- Cordella, M.; Alfieri, F.; Sanfelix, J. Reducing the carbon footprint of ICT products through material efficiency strategies: A life cycle analysis of smartphones. J. Ind. Ecol. 2021, 25, 448–464. [Google Scholar] [CrossRef] [Scilit]
- Zink, T.; Maker, F.; Geyer, R.; Amirtharajah, R.; Akella, V. Comparative life cycle assessment of smartphone reuse: Repurposing vs. refurbishment. Int. J. Life Cycle Assess. 2014, 19, 1099–1109. [Google Scholar] [CrossRef] [Scilit]
- Pamminger, R.; Glaser, S.; Wimmer, W. Modelling of different circular end-of-use scenarios for smartphones. Int. J. Life Cycle Assess. 2021, 26, 470–482. [Google Scholar] [CrossRef] [Scilit]
- Kouloumpis, V.; Konstantzos, G.E.; Chroni, C.; Abeliotis, K.; Lasaridi, K. Does the circularity end justify the means? A life cycle assessment of preparing WEEE for reuse. Sustain. Prod. Consum. 2023, 41, 291–304. [Google Scholar] [CrossRef] [Scilit]
- ISO 14040:2006; Environmental Management—Life Cycle Assessment—Principles and Framework. ISO: Geneva, Switzerland, 2006.
- ISO 14044:2006; Environmental Management—Life Cycle Assessment—Requirements and Guidelines. ISO: Geneva, Switzerland, 2006.



Disclaimer/Publisher’s Note: The statements, opinions and data contained in all publications are solely those of the individual author(s) and contributor(s) and not of MDPI and/or the editor(s). MDPI and/or the editor(s) disclaim responsibility for any injury to people or property resulting from any ideas, methods, instructions or products referred to in the content. |
© 2026 by the authors. Licensee MDPI, Basel, Switzerland. This article is an open access article distributed under the terms and conditions of the Creative Commons Attribution (CC BY) license.