


Abstract
This paper presents a ROS 2-based method for generating occupancy grid maps from high-resolution orthophotos, complemented by a PyQt-based graphical editing interface. The goal is to provide a simple and robust pipeline, capable of automatically generating occupancy grid maps from TIFF orthophoto images, suitable for autonomous mobile robot navigation. The proposed method can be split into two main components, each handled by a separate ROS 2 node. First, the generator algorithm classifies the orthophoto frames according to HSV color spaces, then creates grid cells based on a configurable resolution. Each cell is assigned a value of free, occupied, or unknown according to the proportions of the pixels they contain. The created map undergoes a post-processing filter that removes isolated cells based on neighborhood information. Second, a PyQt-based GUI enables intuitive manual refinement of the generated occupancy grid map. Experimental results indicate that even automatically generated maps are suitable for navigation tasks, and the editor GUI allows quick manual corrections, further improving the map’s usability. The proposed system provides a fast, flexible, and practical solution for generating occupancy grid maps from orthophotos in real-world applications.
1. Introduction
A fundamental requirement for the navigation of modern autonomous mobile robots is an accurate understanding of the environment. In connection with the multi-purpose mobile robot platform developed at the Mobile Robotics Laboratory of Széchenyi István University, the need arose for an automatic mapping method capable of generating an occupancy grid map of sufficient quality for outdoor navigation tasks. While LiDAR-based SLAM (Simultaneous Localization and Mapping) algorithms are extremely effective for indoor navigation, their application in outdoor or large-scale environments poses significant challenges. Large outdoor areas often lack the distinctive geometric features that would enable accurate navigation. Furthermore, mapping an entire test facility using only onboard sensors is a time-consuming process that requires enormous computational and storage resources.
In contrast, high precision orthophotos generated from drone aerial surveys can provide an excellent basis for global route planning. These images offer a detailed, top-down perspective of the environment, free from the perspective errors typical of conventional camera images. However, standard robot navigation systems cannot directly interpret standard image formats for path planning; they require standardized nav_msgs/OccupancyGrid messages, which represent the environment as a 2D grid of free, occupied, and unknown spaces.
The goal of this work is to develop a ROS 2 (Robot Operating System 2) [1] software package that bridges this gap. The system not only automates the conversion of orthophotos into occupancy grid maps but also provides a dedicated graphical user interface (GUI). This editor allows users to seamlessly correct errors in the generated map, filter out temporary obstacles, or manually designate restricted areas, thereby ensuring maximum safety during autonomous operations.
Related Work and Standard ROS Solutions
Converting remote sensing data or images into ROS occupancy grids is a well-known challenge, but standard tools have significant limitations when applied to raw, high-resolution outdoor orthophotos.
The most common ROS 2 approach uses the nav2_map_server package [1] to load static images. However, nav2_map_server only supports basic thresholding based on grayscale intensity. In a raw, color (RGB) drone orthophoto, grass (green), asphalt roads (gray), and shadows can be assigned very similar grayscale intensity values. Consequently, standard thresholding merges these different semantic classes, leading to classification errors—for example, it may classify a grassy lawn as a drivable road.
Another popular framework is the grid_map library, which offers converters (grid_map_cv) for importing images into multi-layer grid representations. Although extremely versatile, grid_map functions solely as a data structure storage system; it does not have built-in classification or filtering algorithms. To implement such classification, the user must develop custom filter plugins. Furthermore, its custom message formats (grid_map_msgs/GridMap) require additional conversion overhead to integrate with standard 2D navigation visualizers.
The proposed methodology overcomes these limitations as follows:
- It performs semantic, pixel-level classification directly in the HSV color space, ensuring robust separation of grass, asphalt, and road markings regardless of slight changes in lighting.
- It automates coordinate alignment by extracting georeference metadata directly from the GeoTIFF format using rasterio [2], eliminating the need to manually create metadata, which is prone to errors.
- Integrate a PyQt5 user interface, enabling operators to immediately correct classification errors using active ROS 2 topics.
2. Methodology
The proposed solution consists of two main components that run as separate ROS 2 nodes: the automated map-generation algorithm and the interactive graphical user interface.
2.1. Orthophoto-Based Generator
The generator node relies heavily on the rasterio [2] library for spatial data handling and the OpenCV [3] library for high-performance image processing. The node can be configured using ROS 2 parameters, primarily tif_path (the absolute path to the orthophoto) and grid_resolution (the desired size of individual map cells, e.g., 0.3 m). The automated generation process is divided into four main stages:
- Import and transformation: The algorithm begins by loading the RGB channels of the TIFF-format orthophoto. It is essential that it extracts the image metadata, from which it calculates the image’s exact spatial resolution (meters/pixel). By comparing the desired grid_resolution with the native image resolution, the algorithm determines the number of pixels corresponding to each grid cell. This ensures that the physical scaling remains accurate when the image is fed into the ROS 2 tf (transform) tree.
- HSV-based [4] color filtering: Since roads, grass, and obstacles (such as buildings or benches) have distinctive color characteristics in standard orthophotos, the system performs pixel-level classification. To achieve resistance to varying lighting conditions and shadows, the RGB image is converted to the HSV (Hue, Saturation, Value) color space. Special masks are created using predefined threshold values. This method allows for excellent separation of road surfaces and even certain road markings (white and yellow lines). The threshold values proven to be effective during the experiments are listed in Table 1.Table 1. HSV Thresholds.
- Cell-based classification: Based on the calculated pixel/cell ratio, the masked image is divided into a uniform grid. The occupancy value of each grid cell is determined by analyzing the ratio of classified pixels within the given block. The decision logic was developed empirically and is implemented as follows:
- Open area (0, color: white): If the proportion of asphalt pixels exceeds 50%, or if white/yellow road marking pixels cover a significant portion (20% and 10%, respectively), the cell is marked as passable.
- Occupied (100, color: black): If no path-related pixels are detected, the cell is considered an obstacle (e.g., grass, buildings).
- Unknown (−1, color: gray): If the pixel ratios do not meet the criteria of any category, the cell remains in an unknown state.
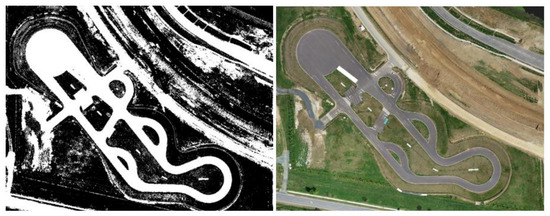
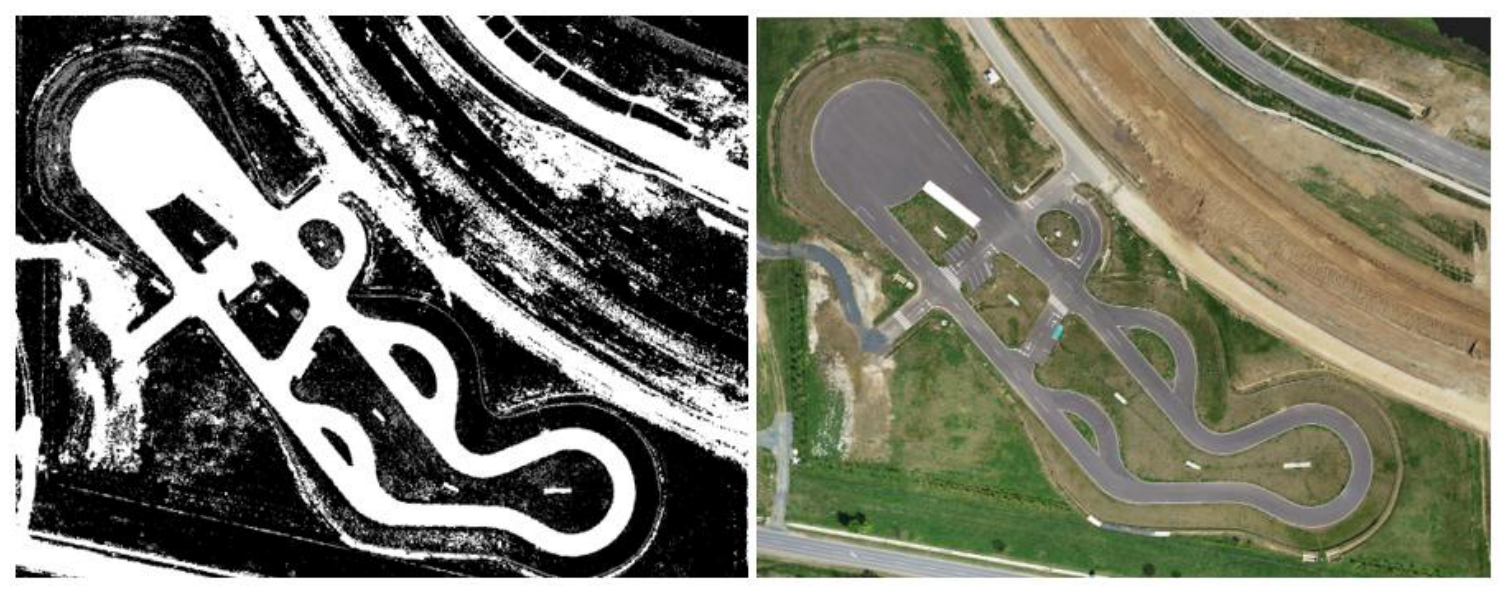
Figure 1 shows an example of the generated occupancy grid map and the original image.
Figure 1.
ZalaZONE test track grid map and orthophoto.
- 4.
- Noise filtering: To eliminate isolated disturbances caused by tire tracks, mud splashes, debris, or shadows, we apply a spatial noise filter to the generated grid. In traditional image processing, morphological operations (such as opening, closing, or median filtering) are typically used for noise reduction. However, these standard filters are unsuitable for presence grid maps generated from outdoor orthophotos for several important reasons:
- Three-state representation: Conventional filters operate on binary (0 and 1) or continuous grayscale images. The presence grid, however, is represented in a discrete, three-state space: Free (0), Occupied (100), and Unknown (−1). Standard algorithms treat these states as continuous numerical gradients, which leads to mathematically incorrect interpolation.
- Preservation of thin geometric features: Standard morphological opening or closing would blur or obscure thin, high-contrast features (which, at a resolution of 0.3 m, are often only 1–2 pixels wide).
- Prevention of distortion of obstacle boundaries: Conventional dilation or erosion would shift the boundaries of large obstacles (such as buildings and curbs), artificially inflating or shrinking them, which degrades geometric accuracy and creates collision hazards.
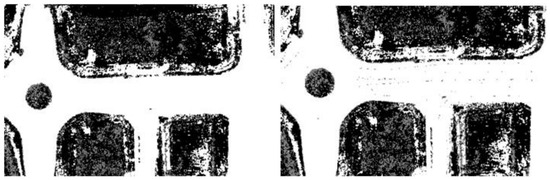
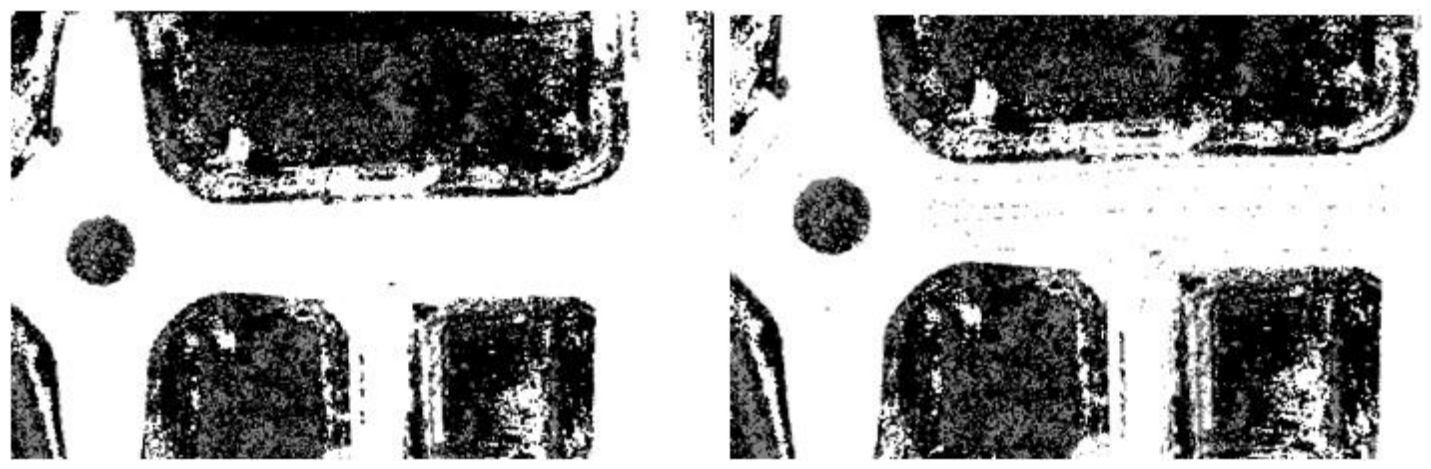
To address these limitations, we designed a custom neighborhood consensus filter. The filter scans the grid using a 3 × 3 sliding window, specifically targeting only the Unknown cells, while leaving the definitively classified Free and Occupied cells untouched. If there are at least three Free cells and at most one Occupied cell in the neighborhood, the central Unknown cell is overwritten with Free. This morphological operation results in significantly smoother boundaries and a cleaner map for the route planner. The node publishes the resulting map as a ROS 2 topic. Figure 2 shows examples of a filtered and an unfiltered occupancy grid map.
Figure 2.
Filtered and Unfiltered grid map.
2.2. Map Editor Interface
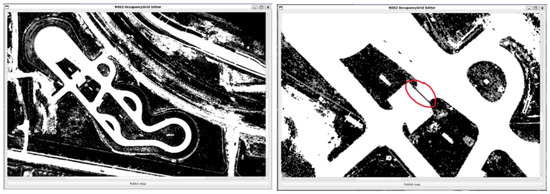
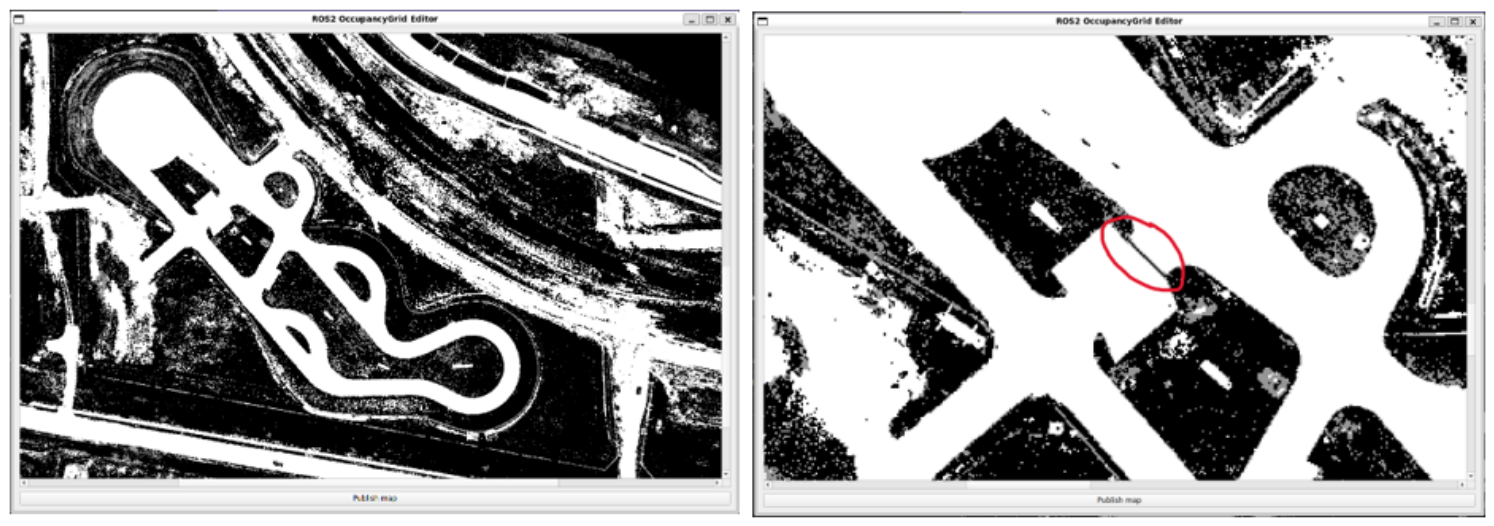
Experience shows that strictly color-based classification is not always perfect. Shadows cast by tall buildings or trees, as well as road repairs that share color characteristics with asphalt can cause false positive or negative results. Therefore, the generator node is supplemented by a PyQt5-based [5] GUI. The GUI uses the QGraphicsView and QGraphicsScene frameworks [6] to efficiently display large occupancy grids. Cells are assigned colors based on their occupancy: white represents free space (0), black represents occupied space (100), and gray represents unknown space (−1). The editor supports smooth zooming and panning with the scroll wheel, allowing users to navigate and zoom in on the map seamlessly. The user can seamlessly “paint” over cells using standard mouse gestures. This is essential for safe navigation, as it allows operators to manually mark areas that appear open in the aerial imagery but are physically impassable (e.g., steep curbs, temporary obstacles). Figure 3 shows an example of the map editor GUI and a user-created obstacle. In the current implementation, the left mouse button marks a free area, the right mouse button marks an occupied area, and the mouse wheel (or Shift + left mouse button) marks an unknown area. The editor node subscribes to the raw/map topic. Once the operator has finished making corrections, clicking the “Publish Map” button forwards the updated array to the edited_map topic. To ensure compatibility with the ROS 2 navigation stack (Nav2) [1], the publisher uses specific Quality of Service (QoS) [1] profiles. Specifically, the value of DurabilityPolicy is set to TRANSIENT_LOCAL. This setting ensures that nodes joining later can immediately download the latest published map without the GUI having to continuously transmit the data.
Figure 3.
Map editor GUI and grid map modified to include obstacle (in the red circle).
3. Results
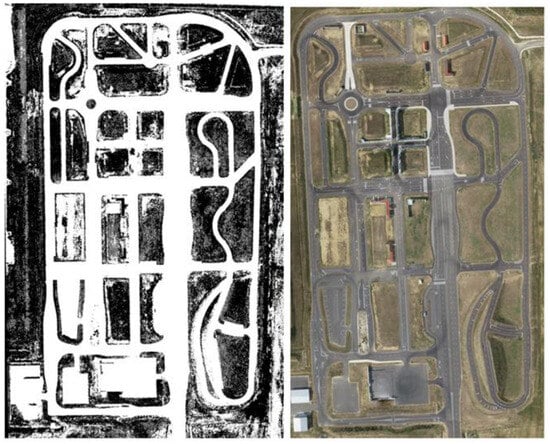
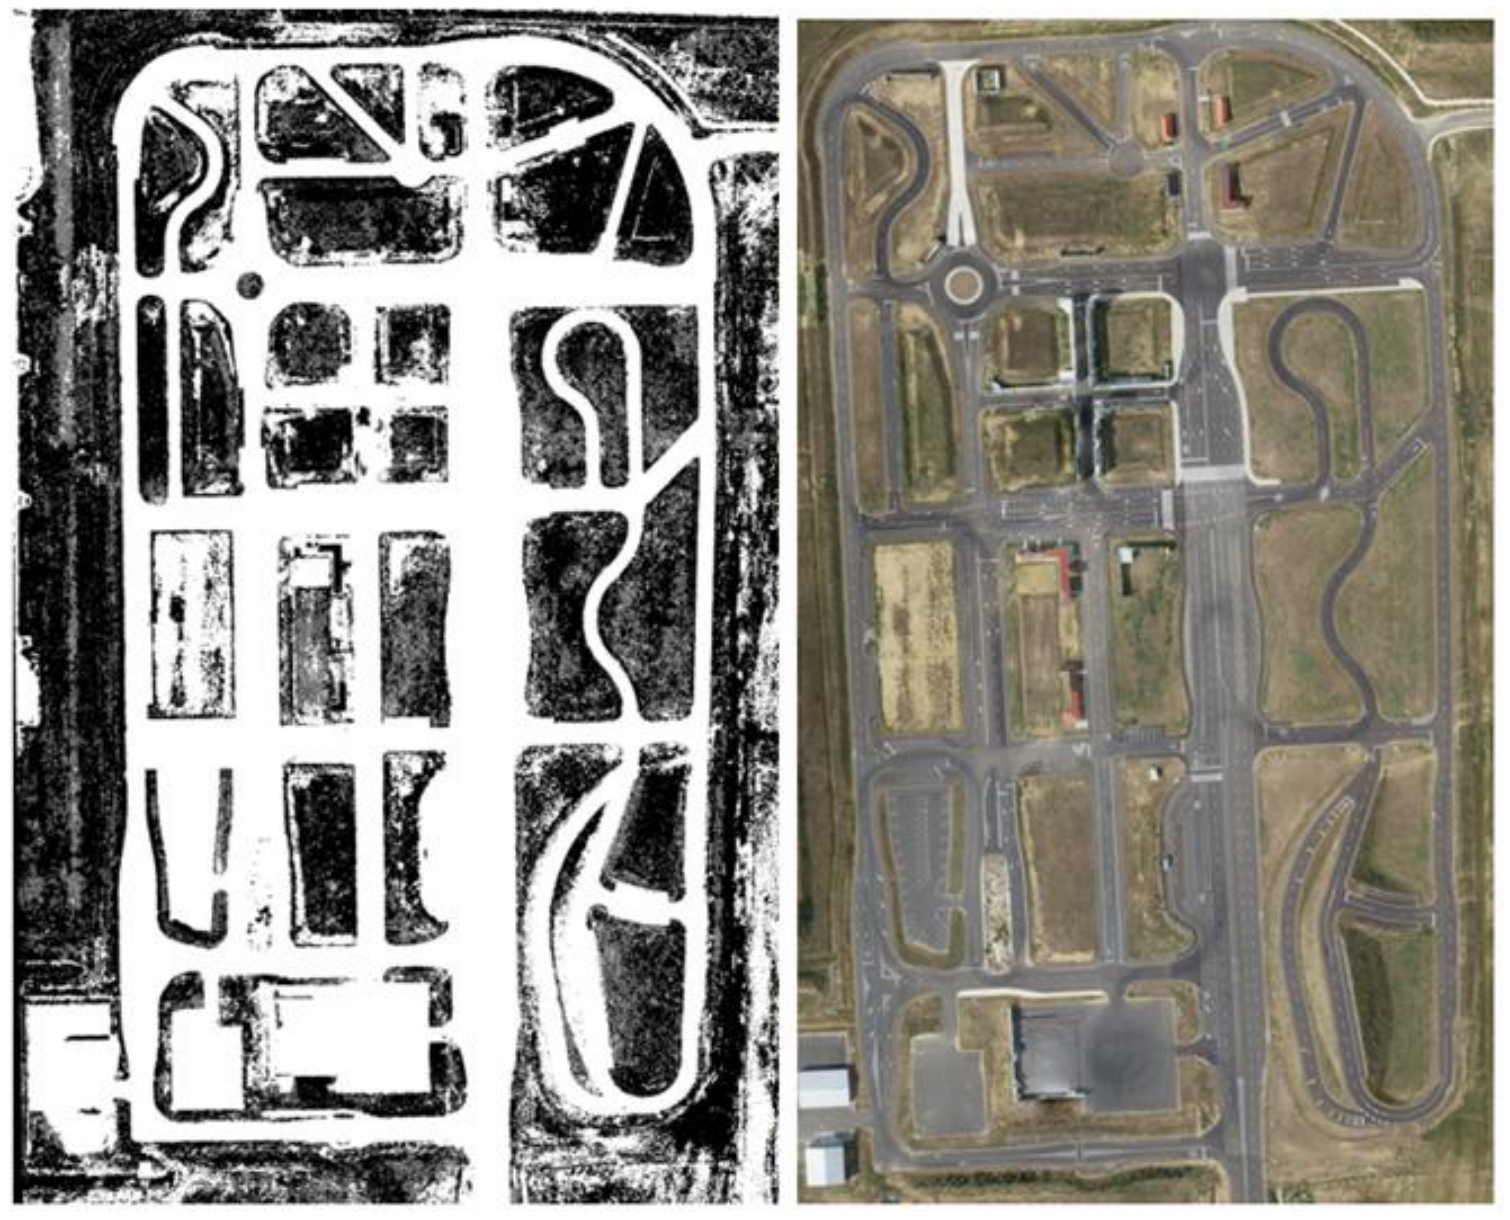
We tested the developed process using high-resolution drone orthophotos taken at the ZalaZONE [7] automotive test track, with a particular focus on the University test track and Smart City module. The Smart City module offers a complex mix of multi-lane roads, intersections, grassy islands, and built infrastructure, providing a basis for comprehensive testing. Figure 4 shows the Smart City module along with its associated occupancy grid map.
Figure 4.
ZalaZone Smart City grid map and ortophoto.
During testing, we found that HSV-based filtering is extremely effective at distinguishing between paved asphalt roads and grassy areas. Road markings can also be effectively filtered using yellow and white masks.
The computational efficiency of the automated process represents a huge step forward compared to traditional methods. Processing a high-resolution GeoTIFF image (up to 500 MB in file size) and generating a global land cover grid with 0.3-m resolution takes approximately 20–30 s on an average mid-range laptop. In contrast, manually tracing the boundaries of roads and obstacles on a test track of this scale using vector graphics tools can take several hours.
Although the raw output requires some human supervision—primarily to define artificial boundaries or correct noise caused by shadows at the edges of the track—the PyQt5 graphical user interface facilitates quick fixes. Refining temporary obstacles or adjusting road shoulders takes only a few minutes.
Furthermore, the method’s robustness is enhanced by its configurability. By fine-tuning HSV thresholds, filter sensitivity, and cell size, the system can be quickly adapted to orthophotos taken under different lighting conditions or in completely different geographic locations.
Dimensional Accuracy and Geometric Validation
To verify that the coordinate projection and the chosen grid resolution of delta = 0.3 m/pixel did not introduce scaling distortions during the parsing and rasterization pipeline, a dimensional validation was performed. Well-defined physical features within the ZalaZONE Smart City module were selected for manual measurement.
The physical length of a feature in the generated grid map, measured in pixels (), is computed as:
This calculated length was compared against the actual ground-truth distance () extracted directly from the BME HD vector map [8], calculating the absolute spatial error ():
Table 2 presents a comparison of three distinct test features: the road width of the main Smart City street, the inner diameter of the central roundabout island and a side road width.
Table 2.
Dimensional accuracy and geometric scaling verification on ZalaZONE features.
Since the map is constrained by a discrete cell resolution of 0.3 m (we apply this value to our 1 × 1 m mobile robot platform), the theoretical quantization error (discretization noise limit) is 0.15 m (half-cell) for a single measurement edge. The absolute errors measured are extremely small, with an average geometric error of 0.50 m and an average relative scaling error of 3.11%. While the absolute error for the larger main road width feature (31.40 m) reaches 1.00 m due to slight perspective distortion over long distances and manual pixel selection on the boundary, the overall relative error remains exceptionally low (under 4%). This proves that the generator node is highly robust and does not introduce shearing, stretching, or scaling distortions.
4. Summary
The ROS 2 node and the associated PyQt5 user interface presented in this article offer an efficient, reliable, and highly practical solution for creating navigation maps based on orthophotos for mobile robots. The method successfully combines the speed of automated computer image processing algorithms with the accuracy and safety guaranteed by human supervision.
Future development directions may include the integration of deep learning techniques into the processing workflow. Replacing the HSV color filter with a convolutional neural network (CNN) could significantly reduce initial classification errors caused by shadows or visually ambiguous surfaces. Furthermore, the introduction of an automatic coordinate transformation module that directly aligns the image’s geodetic data (GPS coordinates) with the robot’s local map frame would further simplify the deployment process for large-scale, outdoor autonomous missions, provided that the necessary GeoTIFF images, equipped with high-quality GPS coordinates, are available.
The finished system provides a fast, flexible framework that will be used in the educational and research activities of the Department of Automation and Robotics at Széchenyi István University.
Author Contributions
Conceptualization, software, validation and writing—original draft preparation, L.K.; project administration, supervision and writing—review and editing, Á.B. All authors have read and agreed to the published version of the manuscript.
Funding
Project no. 2022-2.1.1-NL-2022-00012 was implemented with the support provided by the Ministry of Culture and Innovation of Hungary from the National Research, Development and Innovation Fund, financed under the National Laboratories funding scheme.
Institutional Review Board Statement
Not applicable.
Informed Consent Statement
Not applicable.
Data Availability Statement
The source code supporting the results presented in this study is openly available in the following GitHub repository: https://github.com/robotlabor/Occupancy_Gridmap (accessed on 21 June 2026).
Acknowledgments
During the preparation of this manuscript/study, the authors used Gemini 3.1 Pro for the purposes of stylistic review. The authors have reviewed and edited the output and take full responsibility for the content of this publication.
Conflicts of Interest
The authors declare no conflicts of interest.
References
- Macenski, S.; Foote, T.; Gerkey, B.; Lalancette, C.; Woodall, W. Robot Operating System 2: Design, architecture, and uses in the wild. Sci. Robot. 2022, 7, eabm6074. [Google Scholar] [CrossRef] [Scilit]
- Gillies, S. Rasterio: Geospatial Raster I/O for Python Programmers. Mapbox. 2013. Available online: https://github.com/rasterio/rasterio (accessed on 15 May 2026).
- Bradski, G. The OpenCV Library. Dr. Dobb’s J. Softw. Tools 2000, 25, 120–125. [Google Scholar] [CrossRef] [Scilit]
- Gonzalez, R.C.; Woods, R.E. Digital Image Processing, 4th ed.; Pearson: New York, NY, USA, 2018; pp. 412–430. [Google Scholar]
- Summerfield, M. Rapid GUI Programming with Python and Qt: The Definitive Guide to PyQt Programming, 1st ed.; Prentice Hall: Upper Saddle River, NJ, USA, 2007; pp. 320–355. [Google Scholar]
- The Qt Company. Qt Graphics View Framework. Available online: https://doc.qt.io/qt-5/graphicsview.html (accessed on 1 June 2026).
- Széchenyi István University. ZalaZONE Automotive Proving Ground. Available online: https://zalazone.hu/ (accessed on 15 May 2026).
- BME Department of Automotive Technologies. Downloads-Models and the HD Map of the ZalaZONE Automotive Proving Ground. Available online: https://auto.bme.hu/en/downloads/ (accessed on 20 June 2026).

Disclaimer/Publisher’s Note: The statements, opinions and data contained in all publications are solely those of the individual author(s) and contributor(s) and not of MDPI and/or the editor(s). MDPI and/or the editor(s) disclaim responsibility for any injury to people or property resulting from any ideas, methods, instructions or products referred to in the content. |
© 2026 by the authors. Licensee MDPI, Basel, Switzerland. This article is an open access article distributed under the terms and conditions of the Creative Commons Attribution (CC BY) license.