


Abstract
A nondestructive approach for reconstructing surface nanotopography from the photoluminescence intensity of perovskite nanoparticles using a Graph Convolutional Network (GCN) is proposed. Correlation analysis revealed a statistically significant relationship between the measured luminescence intensity and the local surface height, providing a physical and statistical basis for subsequent machine learning-based reconstruction. The proposed approach achieved a coefficient of determination of 0.86–0.90 and a root mean squared error of 0.09–0.12 nm, corresponding to an approximately 50% reduction in prediction error compared with the point-wise linear regression model. These results demonstrate the potential of the proposed luminescence-based GCN approach for nondestructive, non-contact reconstruction and quantitative characterization of nanoscale surface topography across a range of applications.
1. Introduction
In the modern era, the rapid development of advanced materials, micro- and nanoscale systems, and functional surfaces necessitates the continued advancement of methods for detecting, measuring, and characterizing surface micro- and nanoreliefs, whose functional properties are often governed by nanoscale inhomogeneities. Such characterization enables the quantitative assessment of geometric, structural, optical, and functional surface properties, including roughness parameters, height profiles, the spatial distribution of surface features, correlation characteristics, and localized defects. These measurements are essential for establishing quantitative relationships between surface morphology and the resulting functional and operational properties of materials and devices.
Optical nanometrology methods have been widely applied across diverse fields of science and engineering, particularly in mechanical engineering and precision manufacturing, where they are used for surface quality control and dimensional characterization [1,2]. In micro- and nanoelectronics, these methods enable the analysis of semiconductor surface structures, photolithographic features, functional coatings, and thin-film architectures [3]. In modern optics and photonics [4], nanoscale characterization of optical components, diffractive structures, metasurfaces, waveguides, and integrated photonic elements is essential for assessing surface roughness, radiation scattering, optical losses, and wavefront quality, all of which directly influence the performance and reliability of photonic devices.
Optical methods are generally contactless and nondestructive, making them particularly attractive for surface characterization. In these techniques, information about surface roughness is encoded in the optical field generated by the interaction and scattering of probe radiation from the investigated surface [5]. The most widely used optical approaches include optical profilometry [6,7,8], interferometric [9,10,11,12], speckle-correlation methods [13,14], and methods based on light-scattering phenomena [15,16,17]. A major advantage of optical techniques is their ability to provide continuous, in-line monitoring of surface condition during technological processes. Nonlinear optical responses have also been considered, as they may impose limitations on the applicability of these systems for the analysis of nano- (micro-) structured surfaces [18].
An equally important area of application for nanometrology is biomedicine [19,20]. Non-contact, high-precision characterization of the nanorelief of biological surfaces, cell membranes, extracellular matrices, tissues, biomaterials, and medical implant surfaces offers new opportunities for the early detection of pathological changes, evaluation of material biocompatibility, and advancement of tissue engineering and regenerative medicine [21,22,23,24,25]. Nanoscale surface topography plays a critical role in regulating cellular processes such as adhesion, proliferation, and differentiation, while its quantitative characterization is essential for the development of biomedical sensors, functional coatings, and targeted drug-delivery systems. The increasing demand for non-destructive characterization of delicate biological specimens is therefore driving the development of advanced non-contact optical techniques capable of achieving high spatial resolution while preserving the morphology and functional integrity of the investigated surface.
A number of our studies are devoted to investigating surface states in the nanometer range, in particular the evaluation of statistical parameters and the reconstruction of surface nanotopography using non-destructive optical methods based on luminescent carbon nanoparticles [7,8,9,10,11]. In the present work, we focus on perovskite nanoparticles (perovskite nanomaterials, CsPbBr3) [26] with a thickness of 5 nm, owing to a simplified and more accurate procedure for luminescence measurement, as well as the possibility of spatially resolved detection of luminescence from isotopically distributed nanoparticles on the studied surface. Stabilized perovskite nanoparticles were uniformly applied to the studied surfaces with nano (micro) inhomogeneities in such a way that their spatial distribution repeated its relief. The sample size was about 45 × 45 μm2. About 120 samples with different surface types were analyzed. The synthesized nanoparticles retained their luminescent properties for up to 30 days [27,28,29,30,31,32,33]. Due to their nanometric dimensions, after application, a thin luminescent layer was formed, the thickness of which was proportional to the size of the nanoparticles. This achieves the condition of no formation of agglomerates and clusters of perovskite nanoparticles in the stabilized film. During the experiment, the relative positions of the sample, excitation source, and luminescence detection system were kept fixed, ensuring stable excitation and radiation-collection conditions throughout the measurements. Under these conditions, variations in the recorded luminescence intensity are primarily associated with changes in the spatial position and number of emitting nanoparticles within the effective excitation and detection volume of the optical system. Because the deposited nanoparticle layer conformally follows nanoscale surface topography, variations in local surface height result in corresponding changes in the spatial position of the luminescent centers relative to the excitation and collection regions. Consequently, the number of nanoparticles contributing to the detected signal and the efficiency of their excitation and emission collection vary with the local surface geometry, producing measurable changes in the luminescence intensity recorded by the Raman spectrometer. Thus, under fixed experimental conditions and a conformal nanoparticle layer, the measured photoluminescence intensity provides a monotonic response to local surface height. The resulting luminescence-intensity distribution therefore contains physically meaningful information about the surface topography and can be used as an input dataset for quantitative reconstruction of the nanoscale surface relief.
In this work, we develop a hybrid approach for reconstructing the height distribution and statistical characteristics of nanoscale rough surfaces by combining atomic force microscopy (AFM) measurements of surface topography, acquired before and after the deposition of perovskite nanoparticles, with photoluminescence measurements of the deposited nanoparticles and a dedicated machine learning algorithm. The experimentally acquired data were used to train and validate the proposed model. In particular, Graph Neural Networks (GNNs) provide a suitable framework for representing and analyzing the irregular spatial structure of nanoscale surface topography, as they can simultaneously exploit local measurement features and the spatial relationships between neighboring points.
The key validation metrics of the proposed algorithm were the coefficient of determination R2, which reached values of 0.86–0.90, and the root mean squared error (RMSE), which was in the range of 0.09–0.12 nm. The model architecture was based on a Graph Convolutional Network (GCN) implemented in PyTorch Geometric (ver. 2.9.0), where each height map was converted into a graph with a resolution of 64 × 64 nodes. As a result, the GCN-based prediction enables non-destructive investigation of the topology of nanoscale rough surfaces using only luminescence measurements. The accuracy of height reconstruction corresponds to an approximate level of ~90%.
2. Measurement and Validation of Results
2.1. AFM Measurement of Surface Heights
A non-transparent glass plate with a polished surface was selected as the test sample. The surface was characterized by a mean arithmetic roughness of Ra~2.896 nm and a root-mean-square roughness of Rq~3.737 nm. The autocorrelation length, Ral, was determined from the measured surface-height data using the corresponding autocorrelation function obtained from AFM (NT-206, LLC “Microtestmachines”, Gomel, Belarus) measurements. For the investigated surface, Ral = 440 nm. These statistical and geometrical surface-height parameters were subsequently used to characterize the reference topography and to construct the dataset for training and validation of the neural network.
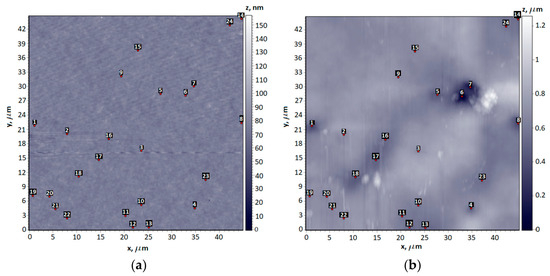
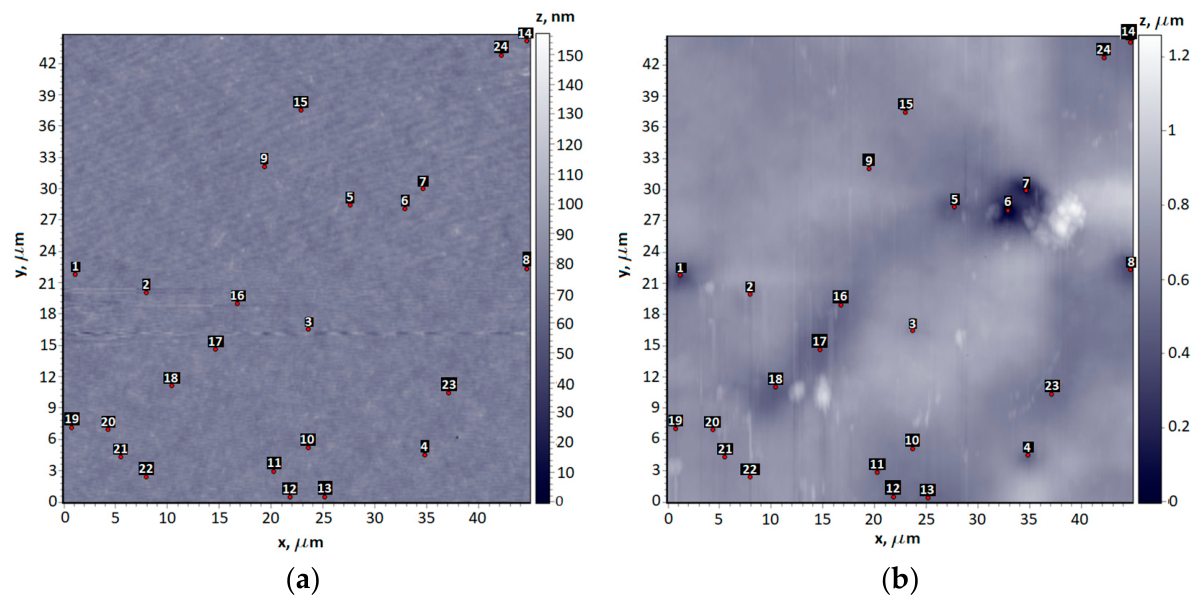
After deposition of the perovskite nanoparticles onto the investigated surface, the surface topography was re-measured using AFM. This enabled the characterization of changes in the surface height profile associated with nanoparticle deposition and provided a corresponding dataset for subsequent machine learning analysis. The AFM images of the sample surface before (Figure 1a) and after (Figure 1b) deposition of the perovskite nanoparticles are presented in Figure 1.
Figure 1.
AFM images of the sample: (a) surface without deposited nanoparticles; (b) surface with deposited nanoparticles. Random marker positions used for height measurements are indicated by red dots and their serial numbers are highlighted in black squares.
2.2. Luminescence Intensity Measurement
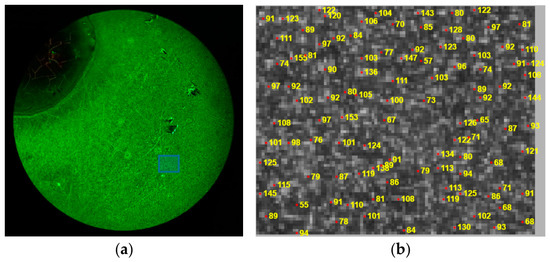
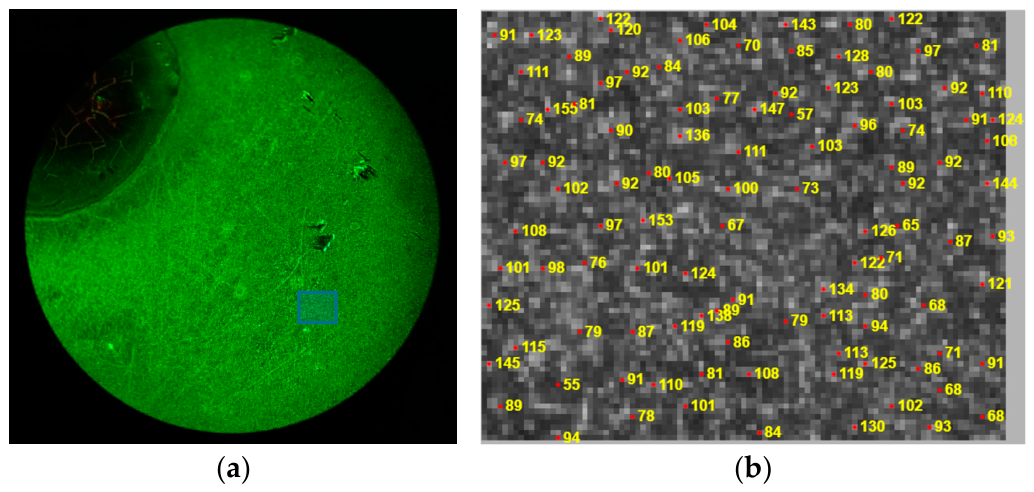
Luminescence imaging of the deposited nanoparticles (Figure 2a) was performed using a MICROmed Evolution LUM LS-8530 fluorescence microscope (LLC Trading House “Micromed”, Poltava, Ukraine) equipped with a WF16×/13 eyepiece, an Infiniti Plan 40×/0.65 (S) objective, and a 100 W/DC mercury lamp (all from Micromed production, Poltava, Ukraine) with a dual fluorescence filter system. The acquired images were subsequently processed in MATLAB R2025b through an automated workflow including region-of-interest selection, noise filtering, image binarization, segmentation, and nanoparticle localization by determining the centroid coordinates of individual particles. Transverse reconstruction, implemented in this work, relies on nanoparticle separation through deconvolution of the measured transverse intensity distribution in cases of particle overlap using the point spread function (PSF). The PSF describes the imaging response of a single fluorescent point source in the system and was estimated theoretically and refined through image-parameter optimization. Deconvolution was performed using the blind deconvolution function (deconvblind) in MATLAB.
Figure 2.
(a) Fluorescence microscopy image of the surface with deposited nanoparticles; (b) region enlarged indicated by blue square in (a), showing the identified marker nanoparticles (indicated by red stars) with measured luminescence intensity (indicated by yellow numbers).
The luminescence intensity of each nanoparticle was quantified from the grayscale pixel values corresponding to the segmented particle region (Figure 2b). The resulting dataset, comprising the spatial coordinates and luminescence intensity of each nanoparticle, served as the input feature set for training the machine learning model.
The luminescence intensity of the nanoparticles was measured by recording the photocurrent at the wavelength corresponding to the maximum of their emission spectrum using a Raman spectrometer (Renishaw RM Series/RM1000, Renishaw PLC, Wotton-under-Edge, UK). A dedicated optical filter integrated into the spectrometer was employed to isolate the luminescence spectral region, while spectral acquisition and analysis were performed using the GRAMS/32 software (ver. 1.3.18). This measurement configuration enabled the acquisition of the complete luminescence spectrum and the determination of the emission intensity at the selected spectral wavelength. A Leica, Wetzlar, Germany, 566,027 N Plan 50×/0.75 microscope objective was used for the measurements, and luminescence was excited with a 405 nm laser source.
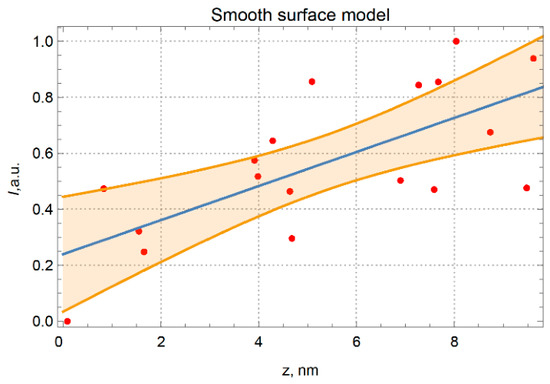
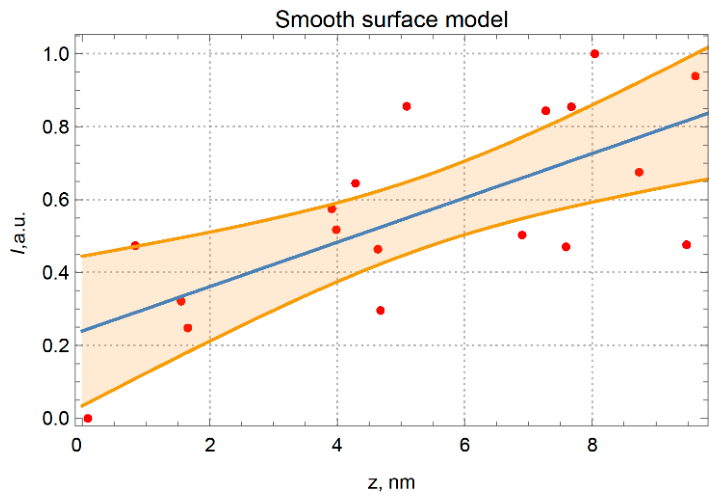
To investigate the relationship between the luminescence intensity of the perovskite nanoparticles and the local surface height, correlation and regression analyses were performed using the experimental data acquired at selected surface locations (Figure 3). The measured luminescence intensities were normalized using conventional min–max normalization, such that the minimum and maximum experimentally measured intensities correspond to 0 and 1, respectively. (The raw data of luminescence intensity measurements are presented at Supplementary Materials, Table S1). The zero-intensity value at z = 0 (starting point of measurement) represents the minimum normalized signal within the dataset and does not imply complete suppression of nanoparticle luminescence.
Figure 3.
Linear regression analysis of the relationship between luminescence intensity (a.u.) and the local height of the smooth surface profile. Red circles correspond to the experimental data, the blue line represents the fitted linear regression model, and the yellow shaded area denotes the 95% confidence interval for the mean intensity value.
The linear regression model (blue line) captures the relationship between the luminescence intensity and the surface-height-measured AFM. To ensure reliable correspondence between the experimental and reference datasets, the analysis was performed using identical surface coordinates determined before and after the deposition of the perovskite nanoparticles.
For the investigated surface, the linear regression model yielded a Pearson correlation coefficient of r = 0.71, indicating a strong positive linear relationship between the luminescence intensity and the local surface height. The goodness of fit was assessed using the coefficient of determination (R2 = 0.48), indicating that the regression model explains 48% of the variance in the surface height. The model accuracy was quantified by the root mean squared error (RMSE = 0.197 nm). In addition, a 95% confidence interval was calculated for the mean predicted surface height to evaluate the statistical uncertainty of the regression model.
The relatively moderate coefficient of determination obtained for the direct intensity–height relationship R2 = 0.48 does not indicate the absence of topographic information in the luminescence signal. Rather, it demonstrates that the local luminescence intensity is influenced by several experimental and optical factors and cannot be described adequately by a single linear relationship with surface height. In particular, the measured signal represents the contribution of nanoparticles within a finite effective optical volume, whereas the surface topography is spatially correlated and contains features extending beyond an individual measurement point. Consequently, a point-by-point linear regression captures only a fraction of the information encoded in the experimental luminescence distribution.
2.3. Neural Network-Based Surface Nanotopography Reconstruction
The correlation and regression analyses confirmed a statistically significant relationship between the luminescence intensity of the perovskite nanoparticles and the local surface height, thereby supporting the use of these data for subsequent machine learning model training. The GCN was introduced not simply to replace the linear regression with a more flexible statistical model, but to exploit the spatially distributed information contained in the measurements. The graph representation preserves the spatial relationships between neighboring sampling points, while the node features are derived from experimentally measured luminescence intensities. Through graph convolution and neighborhood aggregation, the model can account for nonlinear spatial dependencies between the luminescence signal and the underlying surface morphology that cannot be represented by an independent point-wise linear regression.
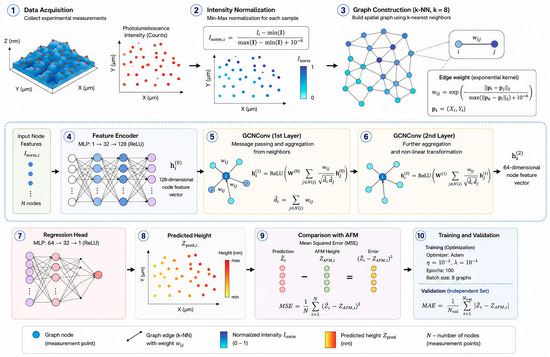
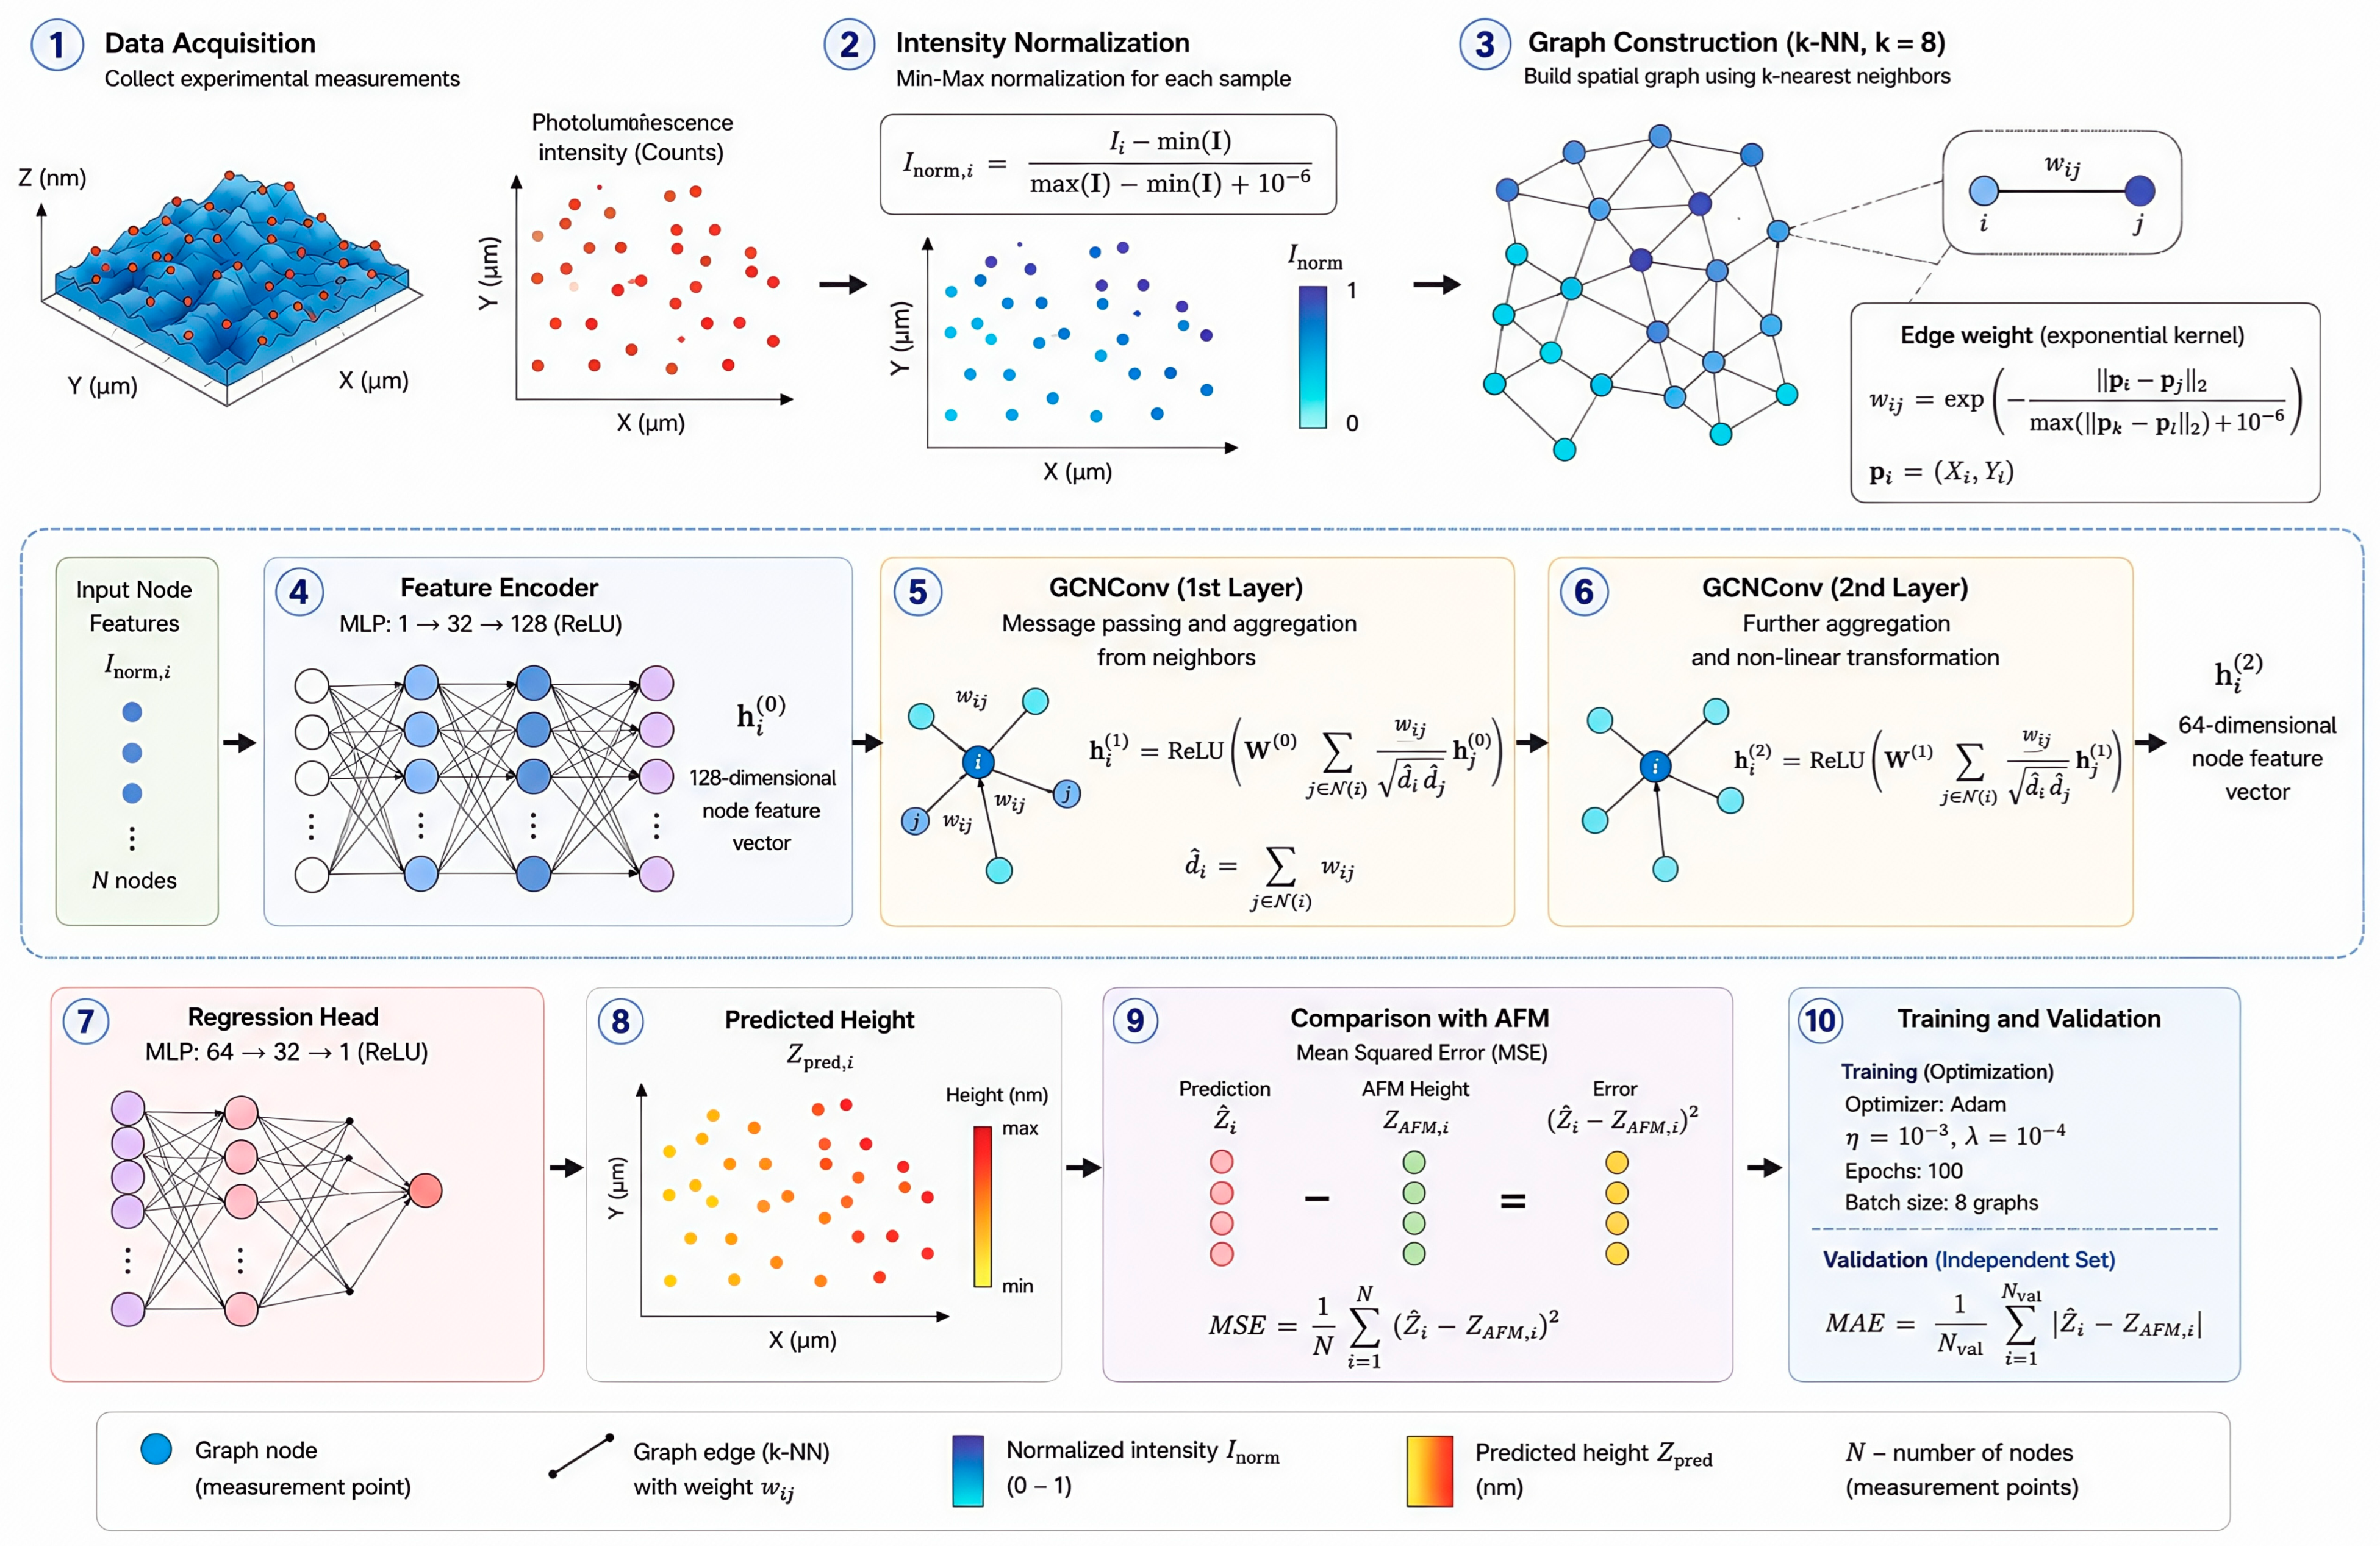
For the training dataset, experimentally measured photoluminescence intensities of the perovskite nanoparticles deposited on the surface were used as input features. The target values were the corresponding local surface heights obtained by AFM at identical spatial coordinates before nanoparticle deposition. Thus, the luminescence distribution provided the input information, whereas the AFM measurements of the nanoparticle-free surface served as an independent reference for the underlying surface topography. Consequently, the neural network (Figure 4) was trained to learn the mapping between the luminescence intensity and the local surface height, enabling subsequent reconstruction of the surface nanotopography.
Figure 4.
Visualization of GCN. Arrows between numbered blocks denote the direction of data flow through the processing pipeline, from raw measurement acquisition to trained/validated model output. Dashed leader lines in panel 3 connect a single highlighted edge of the spatial graph to its magnified callout view, which explicitly shows the edge weight wij between two neighboring nodes i and j; note, that they are not part of the graph topology itself. In panel 9, pink, green, and yellow circles denote the per-node predicted value , the corresponding AFM reference height ZAFM,i, and the resulting per-node error, respectively. Note that the yellow used here is unrelated to the yellow–red height scale in panel 8. The “−” and “=” symbols indicate that the subtraction producing the per-node error is performed independently at each measurement point (node-wise), prior to aggregation into the MSE and MAE metrics.
Each experimental measurement point within a sample is defined as a graph node , located at spatial coordinates . The primary input feature for node is the locally normalized intensity . To ensure robustness against baseline intensity shifts across independent experimental measurements, local dynamic Min–Max scaling is executed per sample: . Here, —normalized photoluminescence intensity value for the -th measurement point (graph node). A scalar value in the range , —initial (measured) photoluminescence intensity at the -th measurement location, —vector/array of all intensity values for a specific experimental sample, —minimum intensity value among all points within a single experimental sample, —maximum intensity value among all points within a single experimental sample, —small regularization constant () added to the denominator to prevent division by zero in case of identical intensity values. Spatial connectivity is established dynamically using a -Nearest Neighbors (-NN) algorithm in the spatial coordinate domain (), creating undirected graph edges between neighboring fluorescent markers. The relative spatial distance between adjacent nodes is embedded as a continuous edge weight using an exponential decay kernel: , where —weight of the direct (adjacent) edge between nodes and , representing spatial proximity, —2D spatial coordinate vectors of the -th and -th points, respectively: , —Euclidean distance (2-norm) in physical coordinates () between points and , —maximum Euclidean distance between any two connected points and within the sample (used for distance normalization), —exponential decay function that decreases edge weight as the physical distance between nodes increases. Spatial message passing aggregates non-linear topological feature representations from adjacent nodes weighted by : , where —hidden feature representation vector of the -th node at layer , at input (): after passing through the Feature Encoder, —updated feature vector of the -th node after passing through the -th convolution layer, —trainable weight matrix of the -th graph convolutional layer, —set of adjacent neighbors of the -th node, determined by the -Nearest Neighbors algorithm ( with ), —calculated edge weight between nodes and , —weighted degree of nodes and , respectively. Computed as the sum of adjacent edge weights: , —normalized connectivity weight used to balance contributions from nodes with varying local cluster densities (symmetric normalization). —non-linear activation function .
To guarantee independent model validation and completely prevent data leakage, the complete dataset of graph instances was partitioned into a training set (80%) and an independent held-out validation set (20%) prior to neural network optimization. The neural network was optimized using the Adam algorithm with an initial learning rate of and an weight decay regularization parameter of to prevent overfitting to local cluster densities. Optimization was performed over 100 training epochs using a batch size of eight graph instances. The network parameters were optimized by minimizing the mean squared error (MSE) loss function defined as ; here, —the surface height predicted by the GCN model, N—number of sampling points (graph nodes). During validation cycles, the model was executed strictly in evaluation mode (model.eval()) with gradient computation disabled (torch.no_grad()) on the isolated validation graphs.
Model performance was evaluated on an independent validation dataset using the coefficient of determination () ranging from 0.86 to 0.90 (—sample mean) and a Root Mean Squared Error () in the range of 0.09–0.12 nm, evaluated alongside dynamical Mean Absolute Error , which changes as 0.06–0.09 nm. These performance metrics were consistent with AFM-based height measurement precision on nanoparticle-free baseline surfaces. Metrics computed on the held-out validation set served exclusively for monitoring model generalization capabilities and hyperparameter tuning, ensuring that validation data never participated in gradient updates or parameter weight optimization.
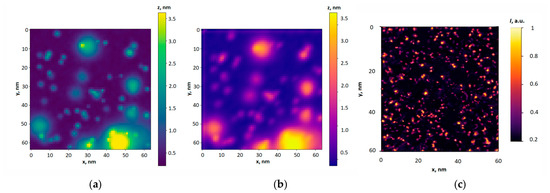
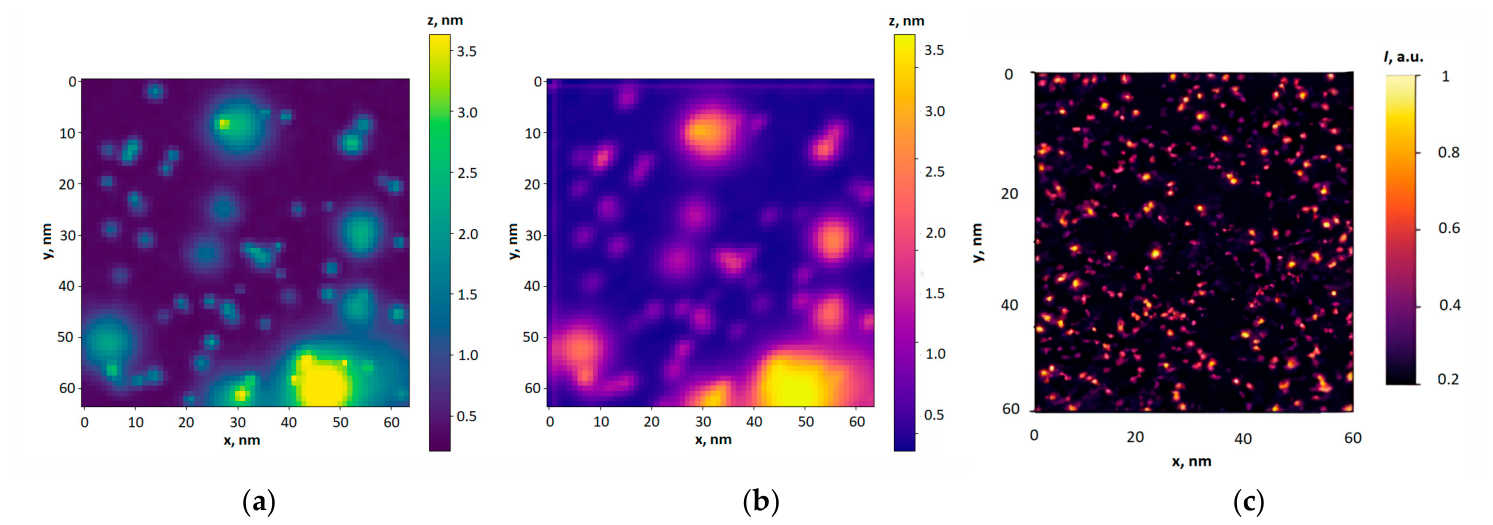
An example of surface height profile reconstruction using the developed graph convolutional neural network is presented in Figure 5a, which shows the height map predicted by GCN. For comparison, Figure 5b presents the reference height map of the smooth surface in the nanometer range obtained by AFM. The corresponding experimentally measured luminescence intensity distribution of the perovskite nanoparticles deposited on the investigated surface, which served as the input data for the neural network, is shown in Figure 5c.
Figure 5.
Reconstruction of the nanotopography of a smooth surface: (a) height map predicted by the graph convolutional neural network (GCN); (b) reference height map obtained by AFM; (c) experimentally measured luminescence intensity distribution of the perovskite nanoparticles used as the input data for the model.
Visual comparison of the reconstructed and reference height maps demonstrates that the developed GCN accurately reproduces the main spatial features of the investigated surface nanotopography. The model performance is further confirmed by the high coefficient of determination (R2 = 0.86–0.90) and the low root mean squared error (RMSE = 0.09–0.12 nm). Compared with the linear regression model, the proposed GCN improved the prediction accuracy by approximately 50%. Unlike linear regression, GCN uses not only the intensity values at a single point, but also the spatial relationship between neighboring measurement points, represented in the form of a graph. Through graph convolution and aggregation of features from neighboring nodes, the model accounts for nonlinear spatial relationships between the luminescence distribution and the surface topography. Thus, the increase in R2 from 0.48 for the point-wise linear model to 0.86–0.90 for the GCN does not imply an increase in the intrinsic physical information content of the experimental signal itself. Rather, it reflects the ability of the GCN to more effectively extract and integrate the spatially distributed information already encoded in the measured luminescence signal.
In contrast to conventional contact-based profilometry and AFM, the proposed approach enables surface topography to be reconstructed without direct mechanical interaction between the measuring system and the investigated surface, which makes it particularly promising for the characterization of delicate or mechanically sensitive nanostructures.
3. Conclusions
The paper presents a comprehensive approach for the non-contact reconstruction of the nanoscale height distribution of surfaces with nano- and microscale inhomogeneities using a GCN. The model was trained using experimentally measured luminescence intensity distributions of perovskite nanoparticles deposited on the investigated surfaces, while the corresponding surface height distributions measured by AFM prior to nanoparticle deposition were used as reference data. The measured luminescence intensity provides spatially distributed information related to local surface topography. By incorporating both the luminescence features and the spatial relationships between neighboring measurement points through a graph representation, the GCN enables reconstruction of the surface height distribution with R2 = 0.86–0.90 and RMSE of 0.09–0.12 nm. Compared with the point-wise linear regression model, the proposed GCN approach reduces the prediction error by approximately 50%, demonstrating the potential of the proposed luminescence-based method for non-contact nanoscale surface characterization.
Supplementary Materials
The following supporting information can be downloaded at: https://www.mdpi.com/article/10.3390/engproc2026156002/s1; Table S1: Raw particles luminescence intensity measurements used for smooth surface linear model fit.
Author Contributions
Conceptualization, C.Z. and D.I.; methodology, C.Z.; software, P.R. and A.K.; validation P.R. and A.K.; formal analysis, C.Z.; investigation, V.T. and D.I.; resources, V.T.; data curation, D.I.; writing—original draft preparation, C.Z.; writing—review and editing, C.Z.; visualization, D.I.; supervision, C.Z. All authors have read and agreed to the published version of the manuscript.
Funding
This research was funded by National Research Foundation of Ukraine (NRFU), grant number 2025.07/0069 ‘Recent applications of structured optical fields in polarization-interference methods for solving problems in telecommunications and biomedicine’.
Institutional Review Board Statement
Not applicable.
Informed Consent Statement
Not applicable.
Data Availability Statement
The raw data supporting the conclusions of this article will be made available by the authors on request.
Acknowledgments
The authors are grateful to Yuriy Khalavka (vice-rector of Chernivtsi National University, Ukraine) and his colleagues from the Department of Chemistry and Food Expertise (Chernivtsi National University, Ukraine) for fruitful discussion regarding the evaluation of the optical properties of perovskite nanoparticles and for assistance in organizing the experimental part of the research.
Conflicts of Interest
The authors declare no conflicts of interest.
Abbreviations
The following abbreviations are used in this manuscript:
| AFM | Atomic force microscopy |
| GCN | Graph convolutional network |
| RMSE | Root mean squared error |
References
- James, T. Understanding Tribology: The Science of Friction, Wear and Lubrication. Int. J. Adv. Technol. 2024, 15, 300. [Google Scholar]
- Tribonet. Friction Meets Precision: How Tribology Enhances the Performance of Servo Drive Systems. Available online: https://www.tribonet.org/news/friction-meets-precision-how-tribology-enhances-the-performance-of-servo-drive-systems/ (accessed on 20 June 2026).
- Dai, Z.-X.; Ono, T.; Dai, C.-L. Editorial for the Special Issue on MEMS/NEMS Devices and Applications, 3rd Edition. Micromachines 2026, 17, 205. [Google Scholar] [CrossRef] [Scilit] [PubMed]
- Daniyal, W.M.E.M.M.; Fen, Y.W.; Abdullah, J.; Sadrolhosseini, A.R.; Mahdi, M.A. Design and Optimization of Surface Plasmon Resonance Spectroscopy for Optical Constant Characterization and Potential Sensing Application: Theoretical and Experimental Approaches. Photonics 2021, 8, 361. [Google Scholar] [CrossRef] [Scilit]
- HUATEC Group Corporation. Roughness Measuring Instrument Handheld Surface Roughness Tester Roughness Tester Machine. Available online: http://www.huatecgroup.com/sale-12243301-roughness-measuring-instrument-handheld-surface-roughness-tester-roughness-tester-machine.html (accessed on 18 August 2021).
- Gao, F.; Leach, R.K.; Petzing, J.; Coupland, J.M. Surface measurement errors using commercial scanning white light interferometers. Meas. Sci. Technol. 2008, 19, 015303. [Google Scholar] [CrossRef] [Scilit]
- Aulbach, L.; Bloise, F.S.; Lu, M.; Koch, A.W. Non-contact surface roughness measurement by implementation of a spatial light modulator. Sensors 2017, 17, 596. [Google Scholar] [CrossRef] [Scilit] [PubMed]
- Wyant, J.C.; Koliopoulos, C.L.; Bhushan, B.; George, O.E. An optical profilometer for surface characterization of magnetic media. ASLE Trans. 1984, 27, 101–113. [Google Scholar] [CrossRef] [Scilit]
- Wyant, J.C.; Koliopoulos, C.L.; Bhushan, B.; Basila, D. Development of a three-dimensional noncontact digital optical profiler. J. Tribol. 1986, 108, 1–8. [Google Scholar] [CrossRef] [Scilit]
- Angelsky, O.V.; Zenkova, C.Y.; Hanson, S.G.; Ivansky, D.I.; Tkachuk, V.M.; Zheng, J. Random object optical field diagnostics by using carbon nanoparticles. Opt. Express 2021, 29, 916–928. [Google Scholar] [CrossRef] [Scilit] [PubMed]
- Angelsky, O.V.; Zenkova, C.Y.; Ivansky, D.I.; Tkachuk, V.M.; Zheng, J. Carbon nanoparticles for study complex optical fields. J. Optoelectron. Adv. Mater. 2021, 23, 209–215. [Google Scholar]
- Angelsky, O.; Bekshaev, A.; Zenkova, C.; Ivanskyi, D.; Maksymyak, P.; Kryvetsky, V.; Chen, Z. Application of the Luminescent Carbon Nanoparticles for Optical Diagnostics of Structure-Inhomogeneous Objects at the Micro- and Nanoscales. Opt. Mem. Neural Netw. 2023, 32, 258–274. [Google Scholar] [CrossRef] [Scilit]
- Ruffing, B. Application of speckle-correlation methods to surface-roughness measurement: A theoretical study. J. Opt. Soc. Am. A 1986, 3, 1297–1304. [Google Scholar] [CrossRef] [Scilit]
- Muramatsu, M.; Eiju, T.; Shirai, T.; Matsuda, K. Application of a liquid crystal spatial light modulator on optical roughness measurements by a speckle correlation method using two refractive indices. Opt. Laser Technol. 1997, 29, 271–273. [Google Scholar] [CrossRef] [Scilit]
- Brodmann, R.; Thurn, G. Roughness measurement of ground, turned and shot-peened surfaces by the lightscattering method. Wear 1986, 109, 1–13. [Google Scholar] [CrossRef] [Scilit]
- Zenkova, C.Y.; Yermolenko, S.B.; Angelskaya, A.O.; Soltys, I.V. The polarization peculiarities of the correlation (Intrinsic Coherence) of optical fields. Opt. Mem. Neural Networks. 2011, 20, 247–254. [Google Scholar] [CrossRef] [Scilit]
- Zenkova, C.Y.; Gorsky, M.P.; Soltys, I.V.; Angelsky, P.O. Influence of the Brownian movement on the motion of nano and micro-particles in the inhomogeneous optical field. Opto-Electron. Rev. 2012, 20, 247–254. [Google Scholar] [CrossRef] [Scilit]
- Nitsowich, B.M.; Zenkova, C.Y. Theory of optical bistability in the region of exciton resonances. Opt. Eng. 1995, 34, 1072–1078. [Google Scholar] [CrossRef] [Scilit]
- Jamakhani, M.A.; Jadhav, M.R.; Kamble, G.S.; Gambhire, V.R. Nanometrology in biological and medical sciences. Int. J. Adv. Biotechnol. Res. 2011, 2, 213–223. [Google Scholar]
- Gangadhar, L.; Subburaj, S. Nanotechnology advances for biomedical applications. Front. Nanotechnol. 2025, 7, 1639506. [Google Scholar] [CrossRef] [Scilit]
- Bathomarco, R.V.; Solorzano, G.; Elias, C.N.; Prioli, R. Atomic force microscopy analysis of different surface treatments of Ti dental implant surfaces. Appl. Surf. Sci. 2004, 233, 29–34. [Google Scholar] [CrossRef] [Scilit]
- Hsu, S.-H.; Liao, H.-T.; Chen, R.-S.; Chiu, S.-C.; Tsai, F.-Y.; Lee, M.-S.; Hu, C.-Y.; Tseng, W.-Y. The influence on surface characteristic and biocompatibility of nano-SnO2-modified titanium implant material using atomic layer deposition technique. J. Formos. Med. Assoc. 2023, 122, 230–238. [Google Scholar] [CrossRef] [Scilit] [PubMed]
- Ipaz, L.; Esguerra-Arce, W.; Aperador, W.; Espinoza, F.; Ruiz, H. Nanofriction study using atomic force microscopy (AFM) of multilayers based in titanium, chromium and aluminum. In Current Microscopy Contributions to Advances in Science and Technology; Méndez-Vilas, A., Ed.; Formatex Research Center: Badajoz, Spain, 2012; pp. 1–9. [Google Scholar]
- Zhang, W.-S.; Liu, Y.; Shao, S.-Y.; Shu, C.-Q.; Zhou, Y.-H.; Zhang, S.-M.; Qiu, J. Surface characteristics and in vitro biocompatibility of titanium preserved in a vitamin C-containing saline storage solution. J. Mater. Sci. Mater. Med. 2024, 35, 112. [Google Scholar] [CrossRef] [Scilit] [PubMed]
- Zhang, Y.; Cheng, X.; Jansen, J.A.; Yang, F.; van den Beucken, J.J.J.P. Titanium surfaces characteristics modulate macrophage polarization. Mater. Sci. Eng. C 2019, 95, 143–151. [Google Scholar] [CrossRef] [Scilit] [PubMed]
- Pylypko, V.G.; Ivanitska, V.G.; Khalavka, Y.B.; Krupko, O.V. Effect of oleylamine content on the optical properties of CsPbBr3 nanoparticles synthesized in the presence of various antisolvents. Proc. SPIE 2025, 13813, 138132Z. [Google Scholar] [CrossRef] [Scilit]
- Nedelcu, G.; Protesescu, L.; Yakunin, S.; Bodnarchuk, M.I.; Grotevent, M.J.; Kovalenko, M.V. Fast Anion-Exchange in Highly Luminescent Nanocrystals of Cesium Lead Halide Perovskites (CsPbX3, X = Cl, Br, I). Nano Lett. 2015, 15, 5635–5640. [Google Scholar] [CrossRef] [Scilit] [PubMed]
- Protesescu, L.; Yakunin, S.; Bodnarchuk, M.I.; Krieg, F.; Caputo, R.; Hendon, C.H.; Yang, R.X.; Walsh, A.; Kovalenko, M.V. Nanocrystals of Cesium Lead Halide Perovskites (CsPbX3, X = Cl, Br, and I): Novel Optoelectronic Materials Showing Bright Emission with Wide Color Gamut. Nano Lett. 2015, 15, 3692–3696. [Google Scholar] [CrossRef] [Scilit] [PubMed]
- Soosaimanickam, A.; Saura, A.; Farinos, N.; Abargues, R. Influence of Binary Ligands in Designing Cesium Lead Halide (CsPbX3, X = Cl, Br, I) Perovskite Nanocrystals-Oleic Acid and Oleylamine. Nanoenergy Adv. 2023, 3, 376–400. [Google Scholar] [CrossRef] [Scilit]
- Kirakosyan, A.; Kim, Y.; Sihn, M.R.; Jeon, M.-G.; Jeong, J.-R.; Choi, J. Solubility-controlled room-temperature synthesis of cesium lead halide perovskite nanocrystals. ChemNanoMat 2020, 6, 1863–1869. [Google Scholar] [CrossRef] [Scilit]
- Wei, S.; Yang, Y.; Kang, X.; Wang, L.; Huang, L.; Pan, D. Room temperature and gram-scale synthesis of CsPbX3 (X = Cl, Br, I) perovskite nanocrystals with 50-85% photoluminescence quantum yields. Chem. Commun. 2016, 52, 7265–7268. [Google Scholar] [CrossRef] [Scilit] [PubMed]
- Yu, W.; Wei, M.; Tang, Z.; Zou, H.; Li, L.; Zou, Y.; Yang, S.; Wang, Y.; Zhang, Y.; Li, X.; et al. Separating crystal growth from nucleation enables the in situ controllable synthesis of nanocrystals for efficient perovskite light-emitting diodes. Adv. Mater. 2023, 35, e2301114. [Google Scholar] [CrossRef] [Scilit] [PubMed]
- Kanak, A.; Kopach, O.; Kanak, L.; Levchuk, I.; Isaiev, M.; Brabec, C.J.; Fochuk, P.; Khalavka, Y. Melting and Crystallization Features of CsPbBr3 Perovskite. Cryst. Growth Des. 2022, 22, 4115–4121. [Google Scholar] [CrossRef] [Scilit]
Disclaimer/Publisher’s Note: The statements, opinions and data contained in all publications are solely those of the individual author(s) and contributor(s) and not of MDPI and/or the editor(s). MDPI and/or the editor(s) disclaim responsibility for any injury to people or property resulting from any ideas, methods, instructions or products referred to in the content. |
© 2026 by the authors. Licensee MDPI, Basel, Switzerland. This article is an open access article distributed under the terms and conditions of the Creative Commons Attribution (CC BY) license.