


Abstract
Deployable metallic structures offer a new design approach for overcoming the geometric limitations of laser powder bed fusion by enabling compact as-built configurations to be expanded after printing into larger, lightweight architectures suitable for efficient packing and aerospace applications. The formability of solution heat-treated, additively manufactured AlSi10Mg alloy was investigated using U-shaped specimens with controlled radius and thickness parameters, designed to evaluate bending-driven deployment. Across all configurations, the alloy exhibited substantial plastic deformation, reaching bending angles between 90.2° and 179.5°. Full deployment was achieved in the t2 r4 specimen, corresponding to an r/t ratio of 2.0, which straightened to 179.5° without failure while maintaining the lowest measured strain of 18.8%. Experimental observations and numerical analysis indicate that failure is governed not by a single critical strain, but by strain localization at the inner radius, followed by surface slip, crack initiation and crack propagation. These findings demonstrate that heat-treated AlSi10Mg provides a promising route towards lightweight, additively manufactured deployable structures with tunable deformation capacity.
1. Introduction
This study builds on the concept of enabling the additively manufactured AlSi10Mg alloy to be used for deployable structures. AlSi10Mg is selected due to its well-known heat treatability [1,2,3,4], where the material can undergo a two-step heat treatment process T6: (i) solution heat treatment, which reduces the material strength while increasing its ductility, and (ii) artificial ageing, where the material is subjected to a second heat treatment at a lower temperature to enable precipitation strengthening. The material properties after step (i) are used to investigate the material’s formability under bending applications.
This work focuses on the bending properties of the solution heat-treated (SHT) alloy and evaluates how well suited it is for use in deployable structures. In this context, deployable structures refer to components that can be additively manufactured within the limited build volume of a laser powder bed fusion (LPBF) machine and subsequently heat-treated and formed into a larger final geometry. To investigate the deployment potential of AlSi10Mg alloy, U-shaped specimens were manufactured to illustrate the displacement capabilities under applied loads. The objective was to reverse-bend the specimens towards a straight configuration, where 180° represents a fully straightened geometry. Achieving this condition would indicate successful deformation and demonstrate strong potential for the material’s formability in applications involving deployable structures. To further understand the material capabilities, the U-shaped specimens were designed based on the parameter radius/thickness (r/t), evaluated at three different levels: 0.5, 1.0, and 2.0, in order to investigate the effect of geometry on bending behaviour.
2. Materials and Methods
2.1. Materials
In this study, specimens were manufactured with a laser powder bed fusion (LPBF) machine made by EOS, M 290-2 Custom LPBF system (AMCM GmbH, Starnberg, Germany). The M-290-2 uses a 250 × 250 × 325 build volume with two Yb-fibre lasers. The print uses EOS pre-set print parameters for AlSi10Mg; these include a laser power of 370 W, laser speed of 1300 , hatch distance of 0.13 , build plate temperature of 35 °C, and scanning pattern strategy of 67° rotation every n layers with alternating scan lines. Specimens were manufactured with AlSi10Mg powder with a powder particle size distribution of 25–70 supplied by EOS Aluminium AlSi10Mg (EOS GmbH Electro Optical Systems, Krailling, Germany). The full elemental composition of the alloy is shown in Table 1.
Table 1.
Elemental composition of tested material.
2.2. Heat Treatment
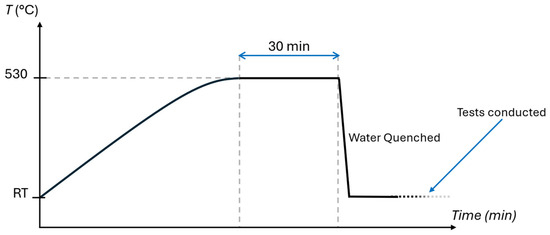
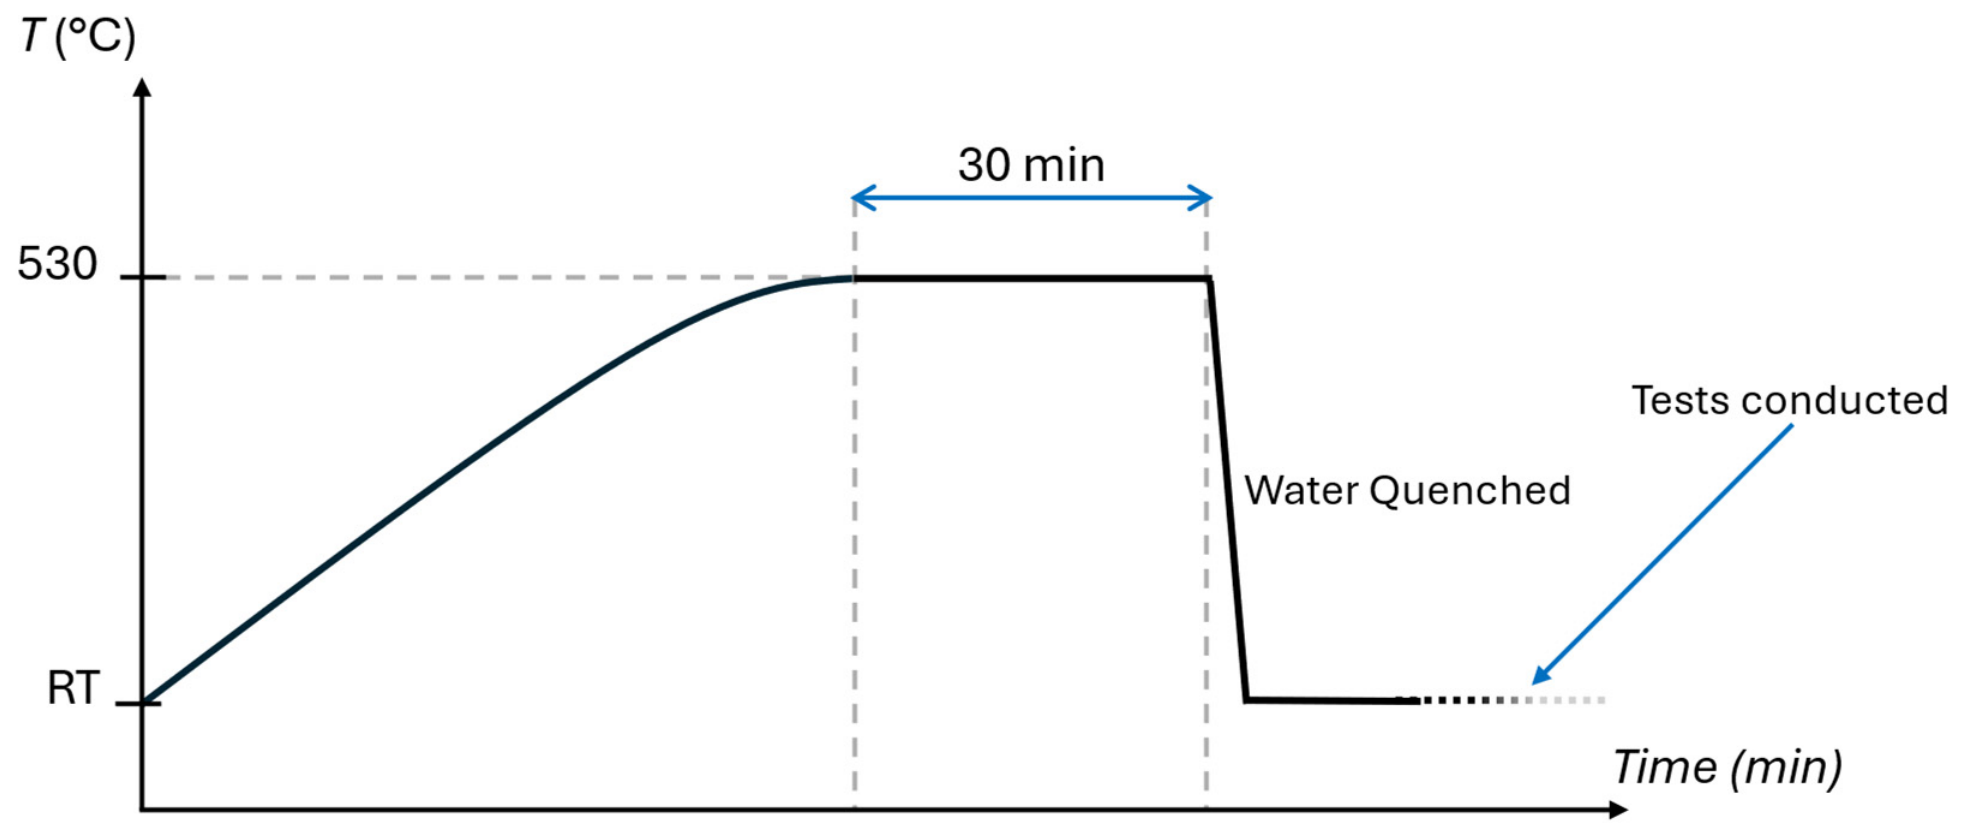
Heat treatment was conducted using an electrical chamber furnace N 41/H furnace (Nabertherm GmbH, Lilienthal, Germany) The chamber temperature was calibrated using an external thermocouple to ensure accurate temperature control. The material was subjected to solution heat treatment (SHT) followed by water quenching immediately after. The heat treatment cycle is shown in Figure 1. The specimens were subjected to a temperature of 530 °C for 30 min, with a ramp-up temperature of approximately 10 °C/min, followed by water quenching. The specific heat treatment process is chosen based on the EOS material datasheet [5]. The specimens were subjected to testing shortly after heat treatment, within the first 3 h after water quenching.
Figure 1.
The heat treatment cycle used in this study. The oven is heated up to the target temperature of 530 °C before the specimens are inserted into the oven. Heat treatment timing is taken from when the oven reaches back to target temperature for 30 min.
2.3. Specimens
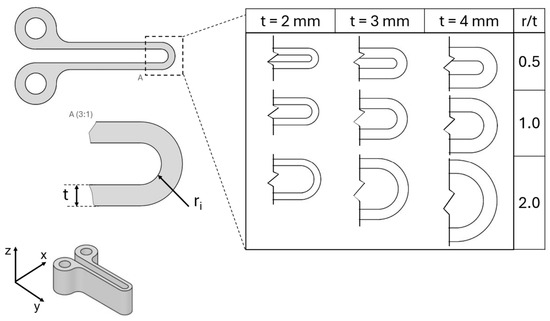
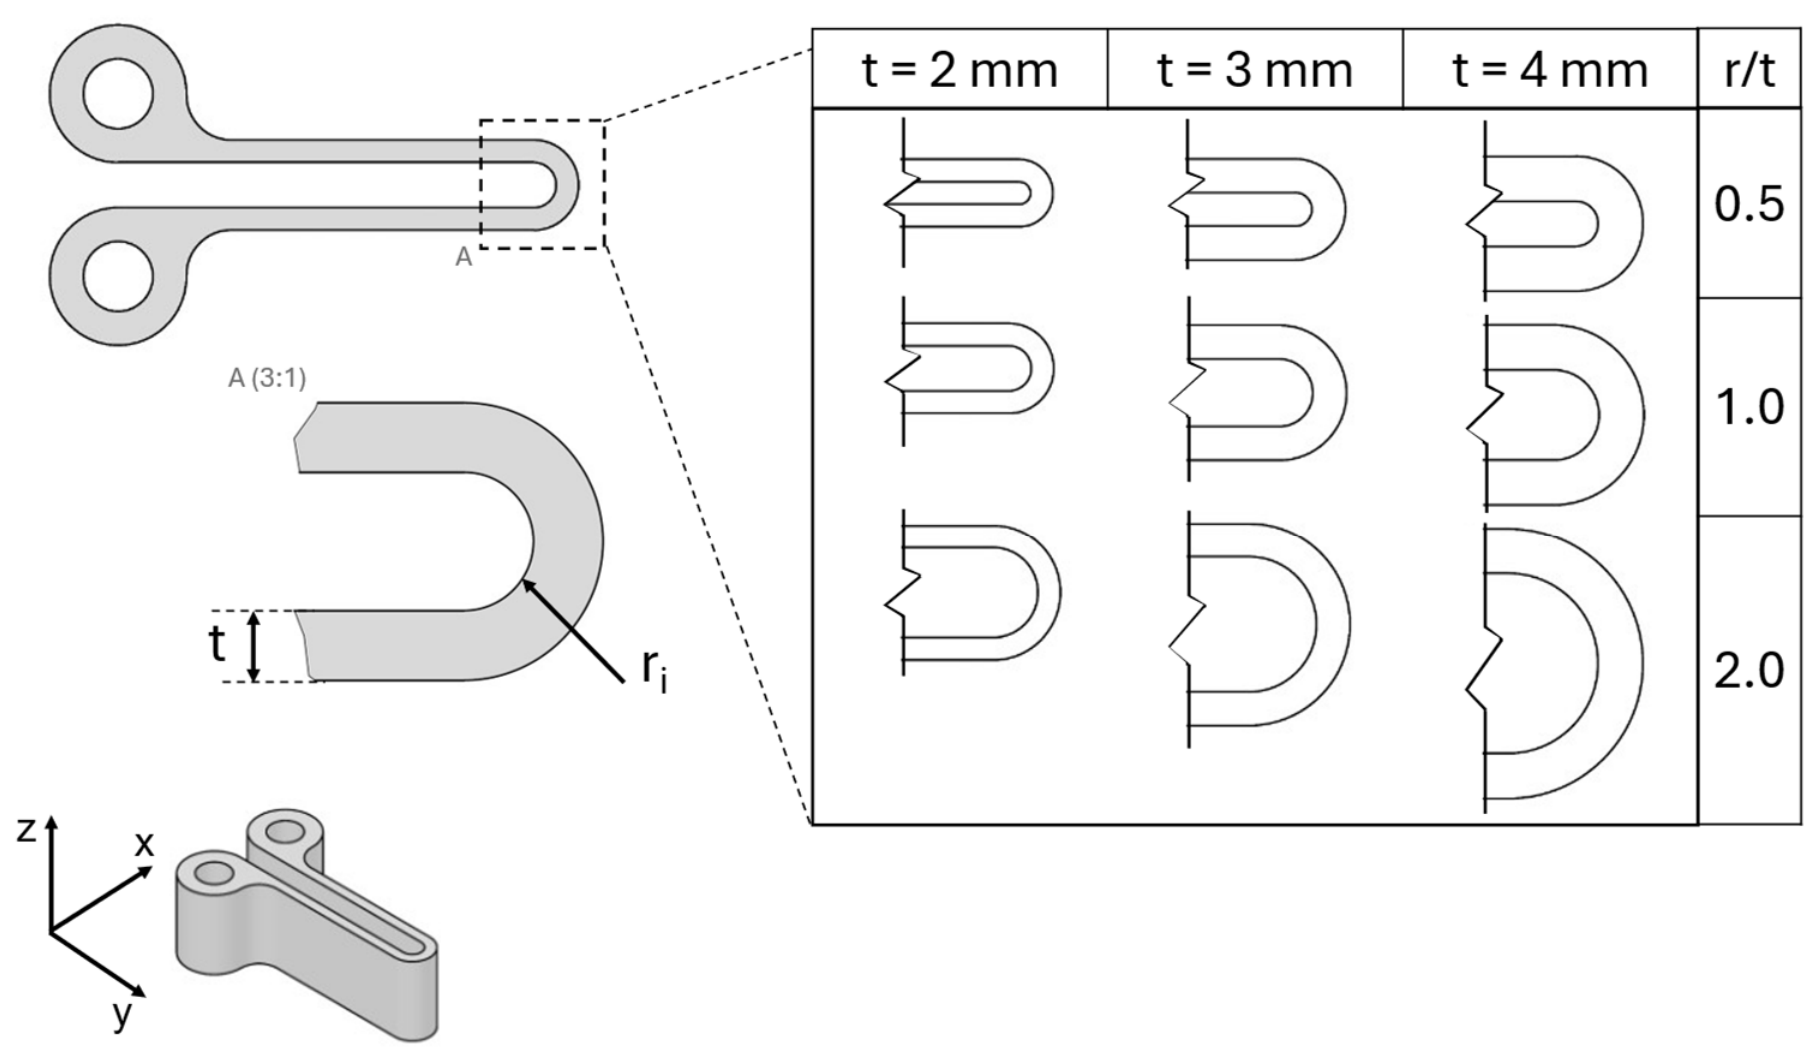
The specimen geometry was developed to evaluate material flexibility. A U-Shaped design was selected to allow continuous bending from 0° to 180°. The specimen dimensions follow a design parameter of r/t for three different thicknesses and radii. r/t is ranging from 0.5, 1.0 and 2.0. The full specimen variation with its relative parameters is shown in Table 2. The complete specimen set is illustrated in Figure 2. For each condition, three specimens were manufactured and tested to ensure repeatability and to obtain representative average values, resulting in a total set of 45 specimens. All specimens were removed from the build plate using electrical discharge machining (EDM, Makino Milling Machine Co., Ltd., Tokyo, Japan). The specimens were then processed using an abrasive method to achieve a consistent width of 14.5 ± 0.1 mm.
Table 2.
Specimen’s dimensions and quantities.
Figure 2.
The complete set of specimens tested in this study with their respective parameters.
2.4. Experimental Setup
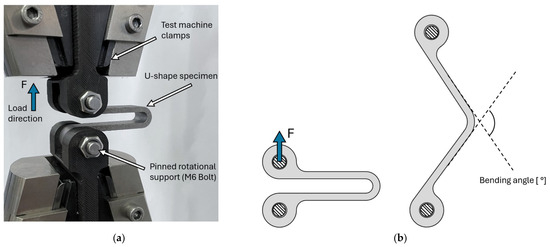
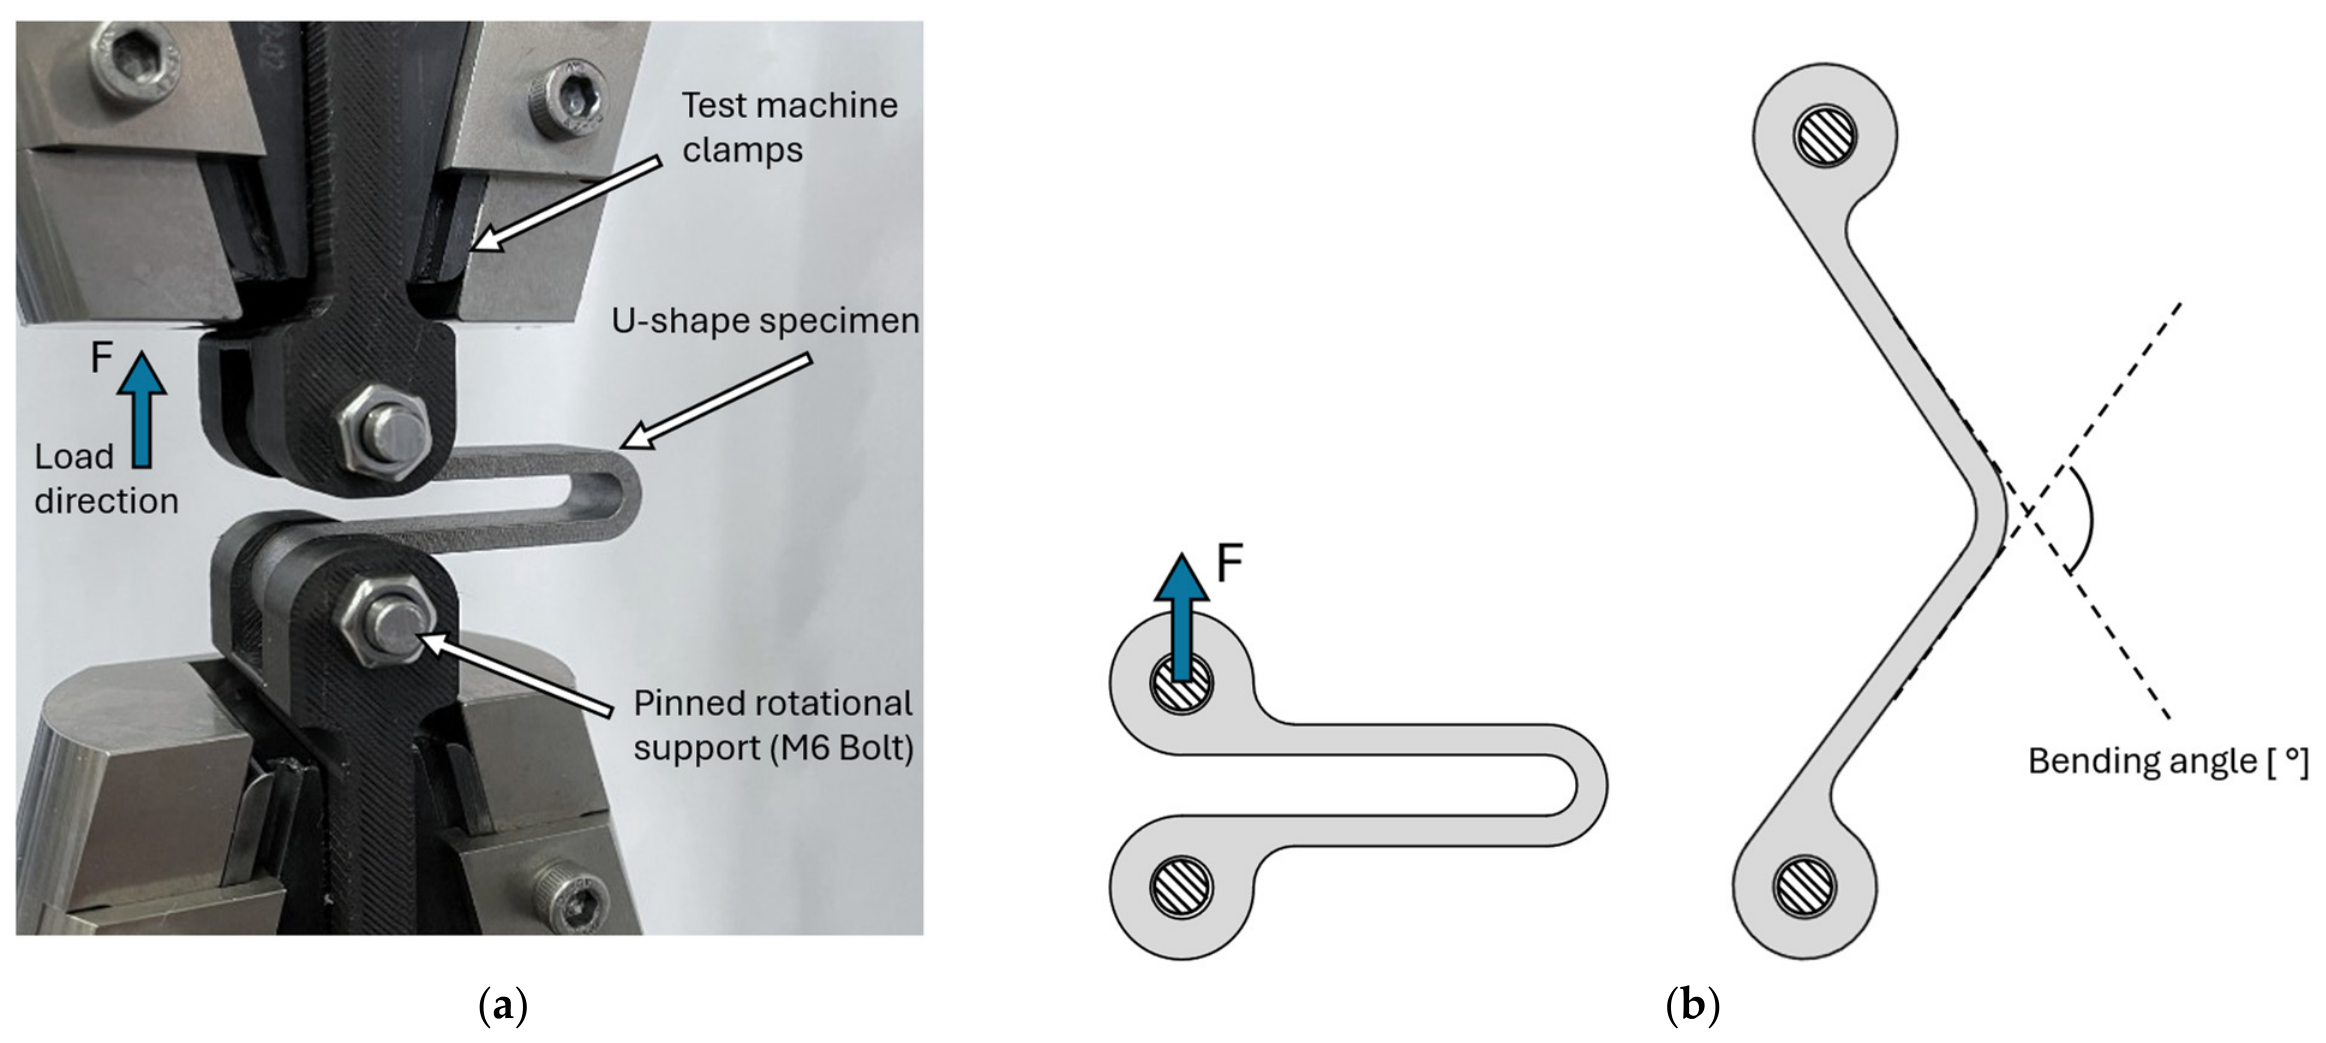
All tests were carried out at room temperature using an MTS Criterion Model 42 universal testing machine (MTS Systems Corporation, Eden Prairie, MN, USA) tensile test machine, with a maximum load capacity of 5 kN. The test machine was operated at a velocity of 0.1mm/s, with break detection defined at a 10% drop in peak load. To achieve the required loading direction and degrees of freedom necessary for reverse bending, fixed clamp blocks were manufactured in polylactide (PLA) material using a Creality K1 Max 3D printer (Shenzhen Creality 3D Technology Co., Ltd., Shenzhen, China) printer. M6 bolts were inserted through pre-designed holes in the PLA blocks, functioning as pinned supports under testing. The full testing setup is illustrated in Figure 3a.
Figure 3.
Experimental test setup: (a) tensile test machine configuration with reverse bending of U-shaped specimen, (b) schematic of U-shaped specimen the applied loading direction and bending angle [°].
Limitations of Experimental Setup
The combined limitations of machine load capacity, displacement range, and specimen geometry resulted in three possible outcomes for the tested specimens: (i) fracture before reaching machine limits, (ii) reaching maximum load without failure, or (iii) full deployment of the specimen (≈180°) before failure. Therefore, not all specimens could be tested to failure. A system with greater lead and displacement capacity would enable complete failure characterization of all specimens. However, the present setup represented a practical compromise, as it was sufficient for the majority of specimen sets, with limitations primarily observed for the thickest specimens within the highest r/t ratio.
The number of specimens tested for each configuration varied. This was mainly due to specimen loss during post-processing and handling, as well as occasional slippage in the test machine grips, which resulted in invalid tests. These specimens were excluded from the study.
2.5. Optical Measurement and Observation System
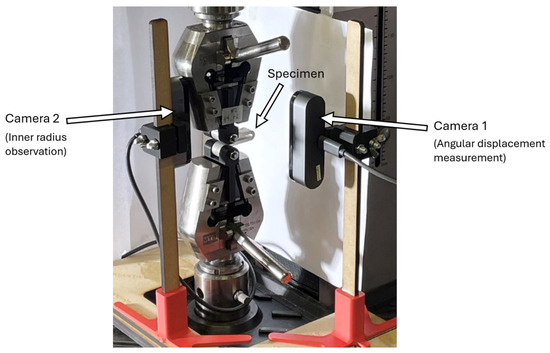
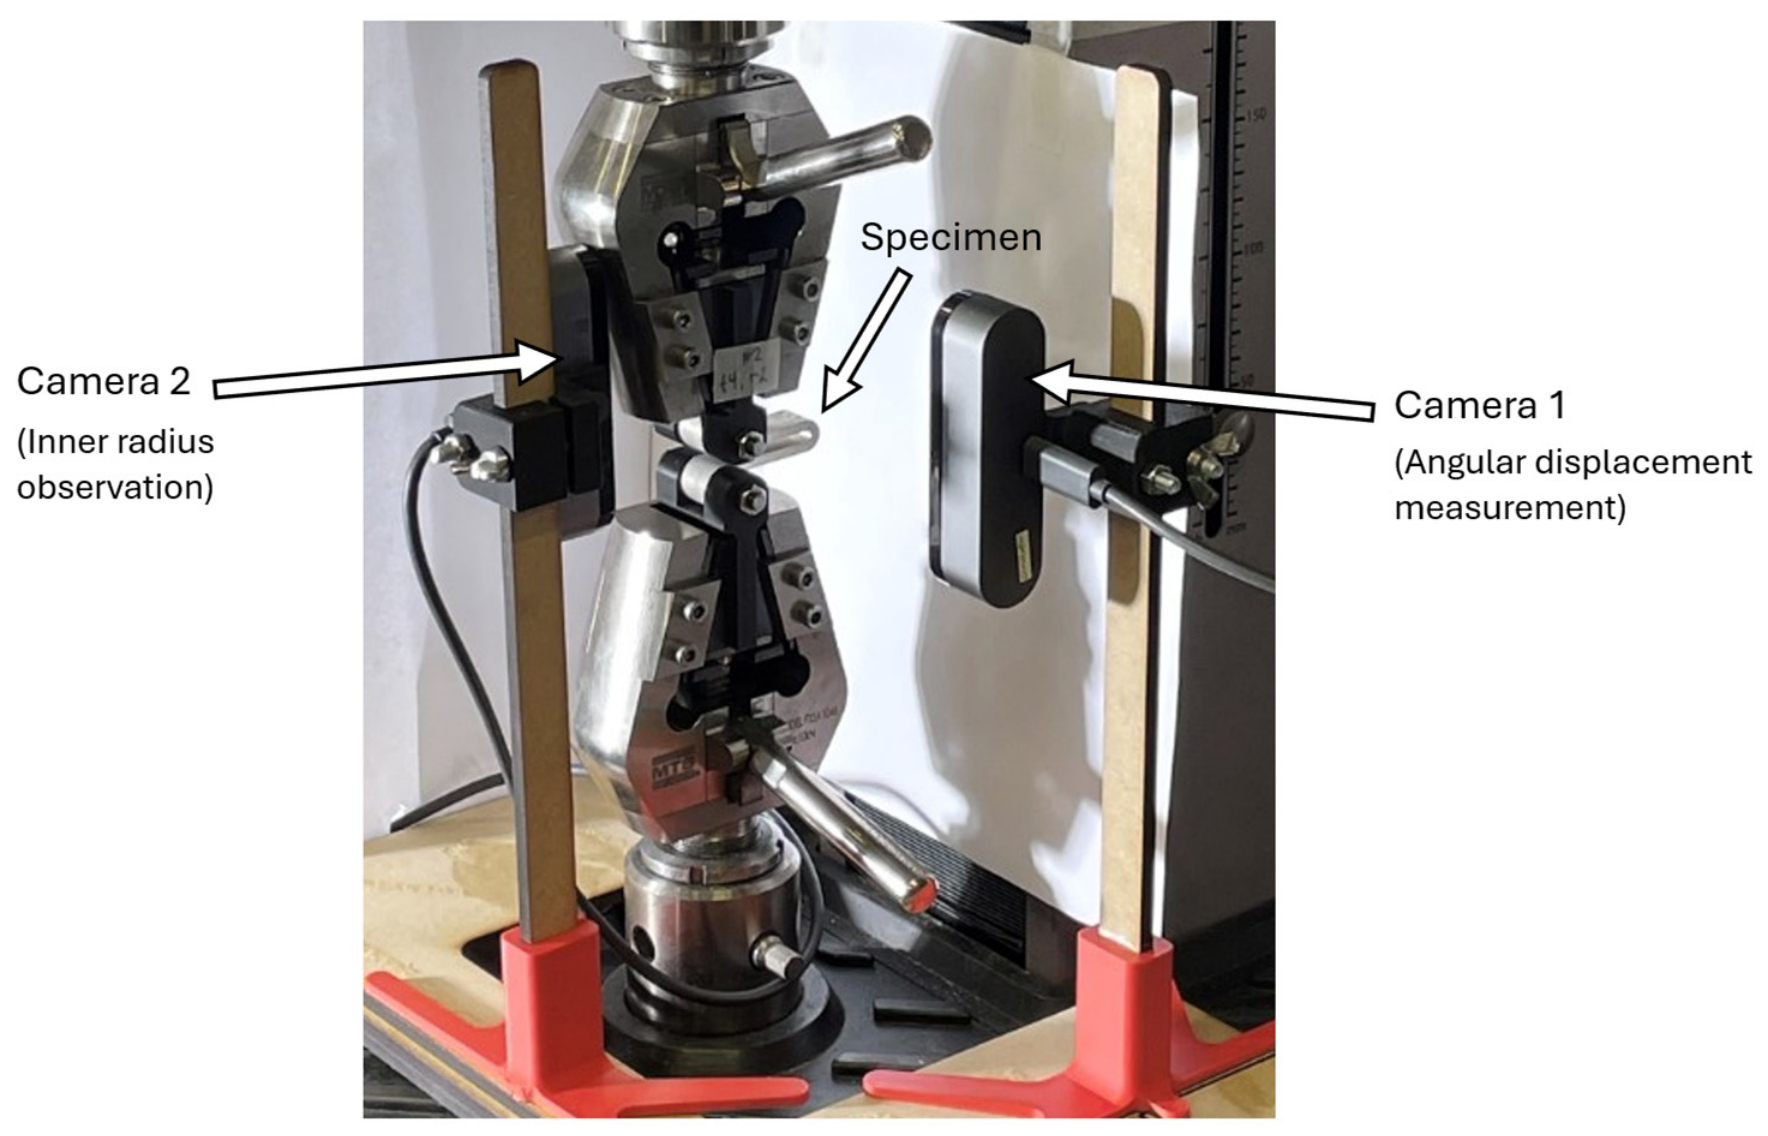
Two Brio 4K digital cameras (Logitech Europe S.A., Lausanne, Switzerland) were used for optical observation and video acquisition during testing. Images were recorded at a resolution of 1080p at 30 fps. Video acquisition was performed using OBS Studio, version 32.0.4 (OBS Project), an open-source platform for real-time video capturing and recording. The software was used to synchronously record image data from two cameras during testing. The two cameras were positioned to observe two sides of the specimens during testing, as shown in Figure 4. Camera 1 was oriented to capture the angle measurement along the side of the specimen, while Camera 2 was oriented perpendicular to the first to observe the inner radius surface. Camera settings, including focus, field of view, exposure, and brightness, were manually adjusted to ensure clear imaging of the expected fracture region throughout the test. The dual-camera setup enabled correlation between fracture and the corresponding maximum bending angle.
Figure 4.
Camera test setup with dual-camera system for angular displacement measurement (Camera 1) and inner radius observation (Camera 2).
ImageJ, version 1.54g (National Institutes of Health, Bethesda, MD, USA) was used for post-processing analysis to determine the displacement angle for all specimens, as shown in Figure 3b. Images were captured after material failure, while for specimens that did not fail, images were taken at maximum displacement. The images were imported into ImageJ for analysis. The imaging system based on the Logitech Brio camera was evaluated by comparison with reference images of specimens obtained from a standard flatbed scanner. Angles measured from the camera images were compared with those obtained from the scanned images, resulting in an estimated angular measurement uncertainty of approximately ±0.5° over the measurement range of 0–180°.
2.6. Numerical Modelling Method
Finite element method (FEM) analysis was performed using Abaqus/CAE 2022 (Dassault Systèmes Simulia Corp., Johnston, RI, USA). All specimens’ geometries were imported as STEP (STP) files. The models were partitioned to enable appropriate mesh control, with particular refinement applied in the bending region. A fine mesh with an element size of approximately 0.40 mm was used, along with a maximum deviation factor of 0.15 and a minimum size factor of 0.40. The specimens were modelled using 8-node linear brick elements with reduced integration (C3D8R). The analysis was performed using a static, general step with geometric nonlinearity enabled (NLGEOM) to account for large deformation effects during bending. Each specimen was constrained using pinned boundary conditions at the holes located at the ends of the specimen. Rigid body constraints were applied at the pin locations to represent the loading fixtures. The lower pin was fully constrained, except for rotational freedom about the axis perpendicular to the specimen, while the upper pin was similarly constrained and subjected to an applied displacement corresponding to the total length of the specimen.
The material model was defined based on experimental tensile data obtained from an ongoing, unpublished study on LPBF AlSi10Mg specimens subjected to the same heat treatment cycle as those used in the present study. The elastic properties defined by Young’s modulus of 70 GPa and a Poisson’s ratio of 0.3. The plastic behaviour was defined using the unpublished experimentally obtained stress–strain curve from the onset of plastic deformation up to necking.
Strain data were extracted from the inner radius of the specimens using nodal values of equivalent plastic strain (PEEQ). Nodes along a centre line of the finely meshed bending region were evaluated, and the maximum strain value was identified for each of the specimens. The strain distribution along the centre line node path was examined for irregular gradients or localized peaks. No irregular gradients or localized strain peaks were observed, indicating that the applied mesh was appropriate and provided stable and reliable strain results.
Angular displacement was determined from the parallel arms connected to the bend. Node sets with negligible deformation were selected to ensure accurate calculation of the angular change throughout each analysis step.
3. Results
3.1. Bending Tests
The results from all bending tests are summarized in Table 3, including individual test outcomes, numerical equivalent plastic strain (PEEQ), calculated mean bending angle, and min and max bending angles. Among all specimens, only specimen t2 r4 within the parameter r/t = 2.0 reached the maximum angular displacement of 179.5° (≈180° full displacement).
Table 3.
Summary of experimental results for all specimens, including geometric parameters r/t, r, t, measured bending angles, and corresponding FEM equivalent plastic strain (PEEQ) from Abaqus/CAE. Reported values include bending angles, min and max for each specimen category, and PEEQ strain at failure. Test results for each test are marked with symbols representing specimen failure, run-out, and successful/fully deployed. The table provides the underlying data for the strain-bending curves in Figure 5.
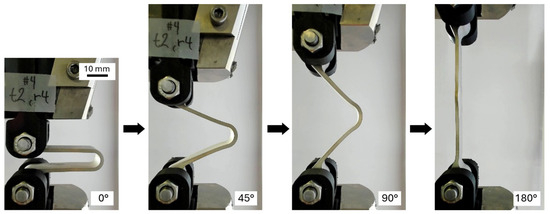
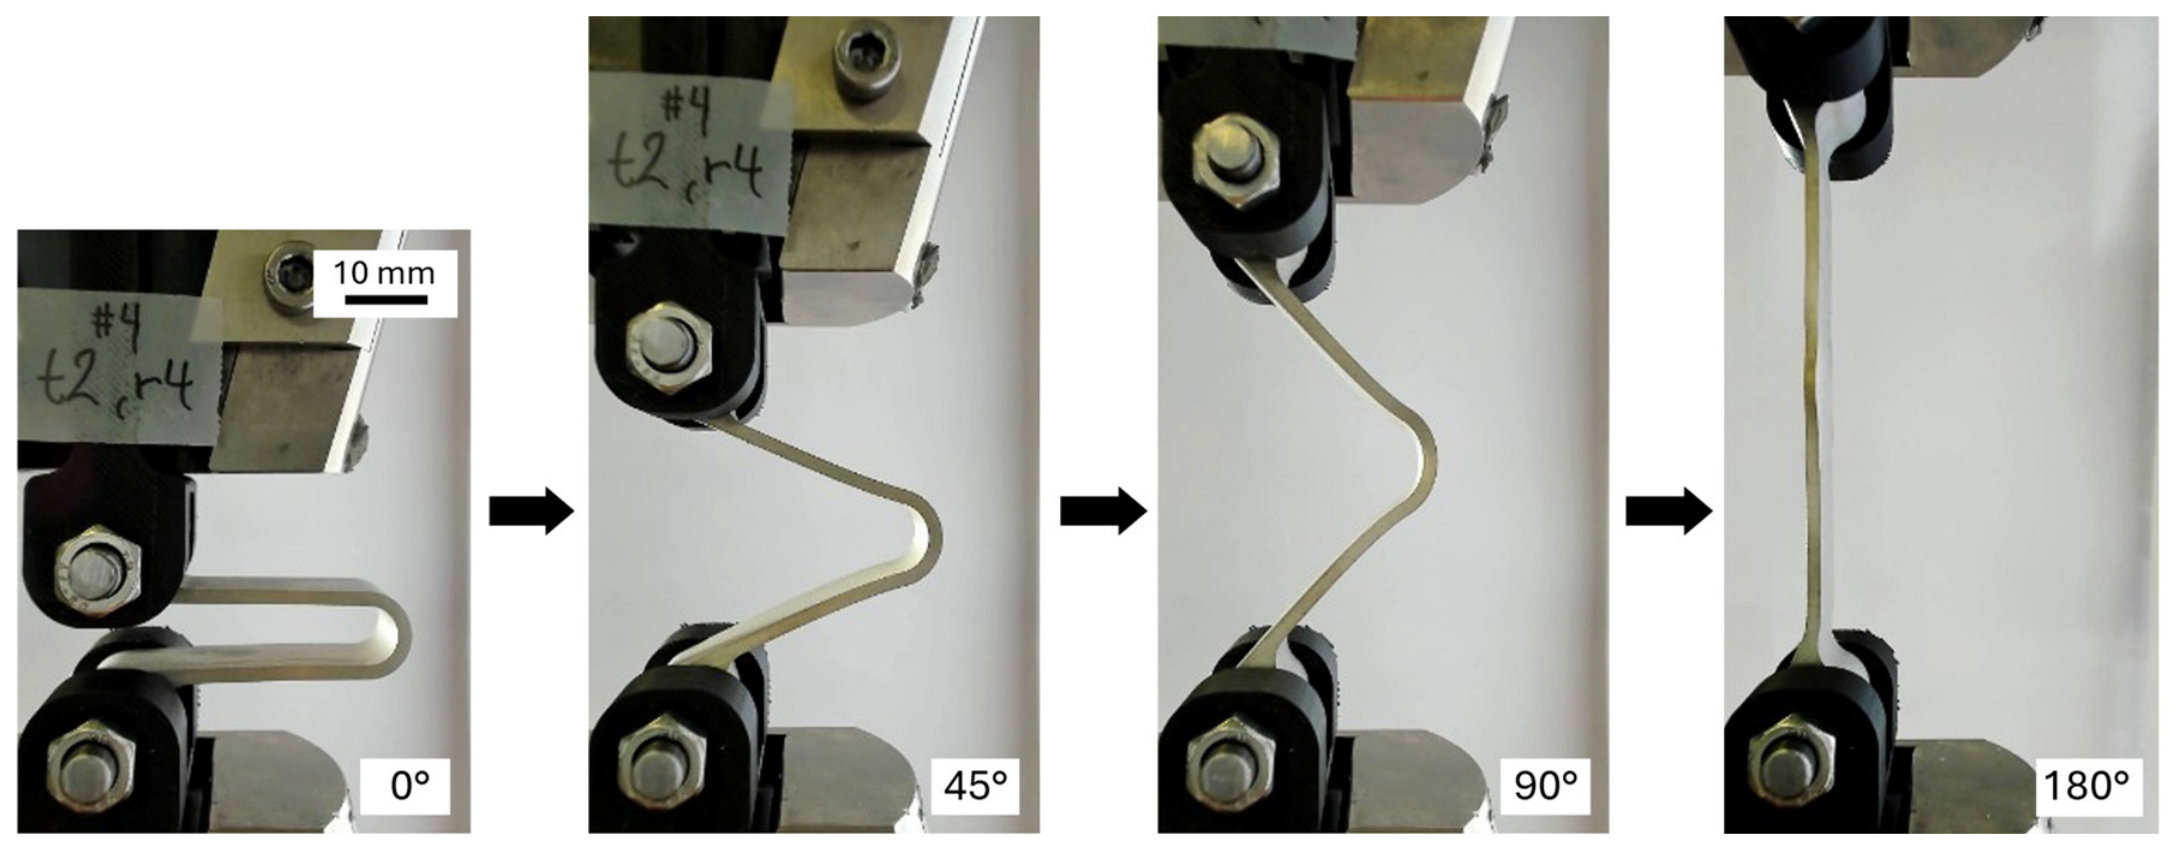
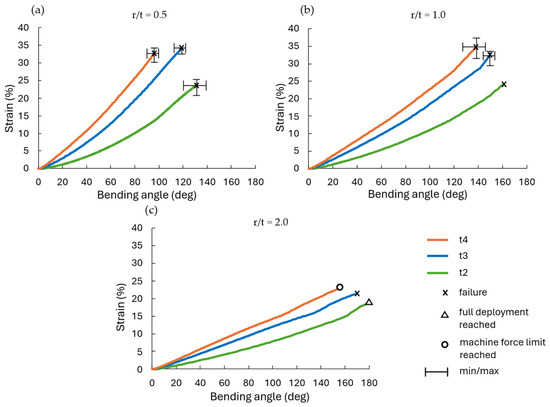
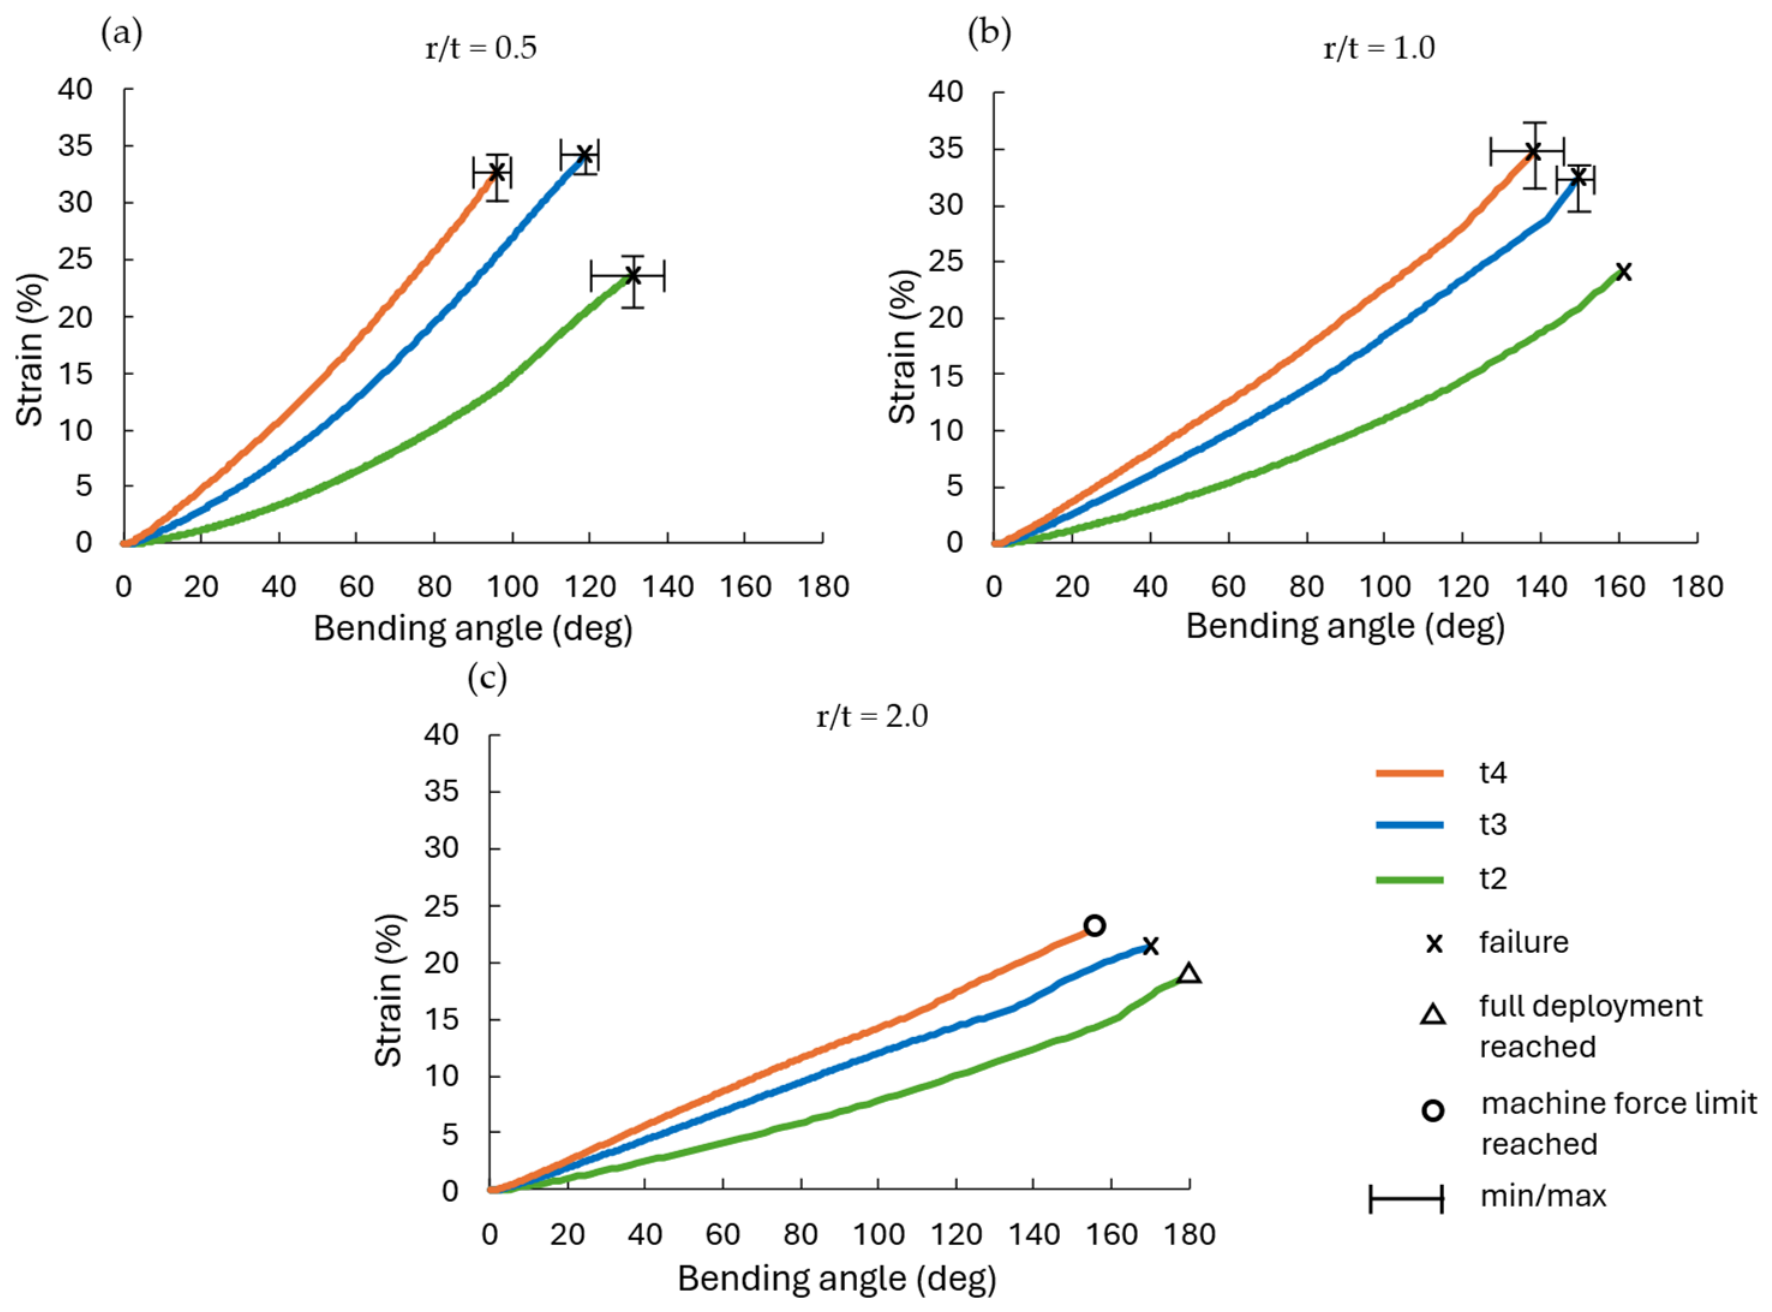
The successfully deployed specimens are illustrated in Figure 5. Overall, the bending angle for this study ranged from a minimum of 90.2° (t4 r2) to a maximum of 179.5° (t2 r4). Illustrated in Figure 6, the strain-bending angle curve for each specimen category. This illustration combines experimental and numerical data. Each graph is derived from strain–angle data obtained from Abaqus/CAE, which the experimentally measured final displacement angle is plotted onto. This enables direct correlation between the numerical strain evolution and the experimentally observed failure or bending end point. An orange-shaded region is included in each plot to indicate the PEEQ strain range associated with failure for each parameter set.
Figure 5.
Bending angle sequence for specimen t2 r4, r/t = 2.0, showing successful specimen deployment reaching a final angle of 179.5° (≈180°). Illustrated at four intervals captured at 0°, 45°, 90°, and 180°.
Figure 6.
Strain-bending response curves grouped by the geometric parameter r/t: (a) 0.5, (b) 1.0, and (c) 2.0. The curves show the evolution of equivalent plastic strain (PEEQ) at the inner radius obtained from FEM simulations in Abaqus/CAE. The x markers indicate experimentally observed failure points overlaid onto the numerical strain–angle curves. The orange field highlights the PEEQ strain range associated with failure.
For r/t = 0.5 (Figure 6a), all experimentally tested specimens failed. Angle displacement between specimens ranges from 90.2° to 137.3°, representing the lowest angular displacement parameter. The corresponding strain range was 23.5% to 34.1%.
For r/t = 1.0 (Figure 6b), all specimens also failed. The bending angle ranged from 129.9° to 160.0°, with a corresponding strain range from 24.0% to 34.6%.
For r/t = 2.0 (Figure 6c), only one specimen (t3) exhibited failure.
The thicker specimen (t4) reached the machine limit, and the test was discontinued at 153.6°. Notably, specimen t2 did not fail and instead reached the maximum displacement angle of 179.5° (≈180°). For this parameter set, the bending angle ranged from 153.1° to 179.5°, while the strain ranged from 18.8% to 22.7%.
3.2. Failure Behavior
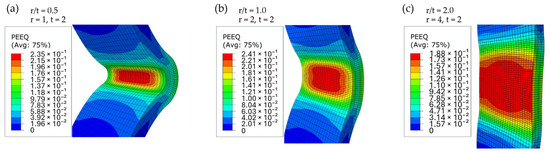
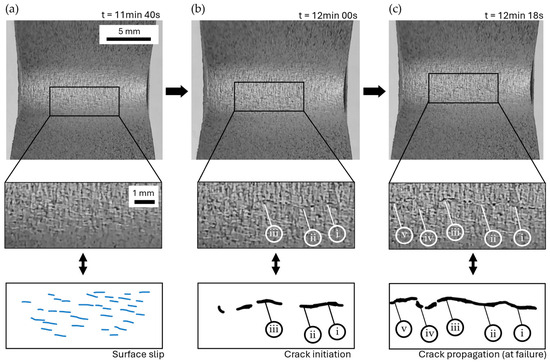
Specimen failure was consistently observed to initiate at the inner radius, specifically at the centre of the specimen, corresponding to the region subjected to the maximum equivalent plastic strain (PEEQ) during bending, as indicated by FEA in Figure 7a–c. This was identified experimentally using the camera setup, where Camera 2, focused on the inner radius, captured the deformation sequence. Prior to crack initiation, surface slip was observed to develop at the inner radius, as illustrated in the time-lapse sequence in Figure 8a, followed by crack initiation and propagation as shown in Figure 8b,c.
Figure 7.
FEA results showing PEEQ distribution for specimens with different r/t ratios at a constant thickness of t = 2 mm. The contour plots for (a) r/t = 0.5 and (b) r/t = 1.0 are shown at fracture, corresponding to displacement angles of 130.3° and 160.0°, respectively. For (c) r/t = 2.0, the specimen did not fracture, and the contour plot is shown at the full deployment range, corresponding to a displacement angle of 179.5°. The maximum PEEQ values are 23.5%, 24.1%, and 18.8% for (a), (b), and (c), respectively.
Figure 8.
Time-lapse sequence of deformation and crack evolution at the inner radius of the specimen during bending (representative specimen t3 r1.5). The top row shows a global view of the specimen with the highlighted region of interest. The middle row shows magnified views of the observed area. The bottom row shows a schematic representation of the observed area. (a) Surface slip formation, (b) crack initiation, and (c) crack propagation, corresponding to final failure. Numbered markers indicate corresponding crack features and illustrate the progression of crack propagation over time.
Crack propagation in the majority of specimens occurred gradually, resulting in visible surface cracks. In contrast, specimen t2 r4 exhibited no macroscale surface cracks. For specimens with a thickness of 4 mm, different behaviour was observed. Although surface slip was present, these specimens did not exhibit gradual crack propagation; instead, failure occurred abruptly without the formation of visible surface cracks. These observations are further discussed in the Discussion Section.
4. Discussion
4.1. Bending Performance
The bending results demonstrate that all specimens exhibit a high degree of deformation capability, achieving bending angles ranging from 90.2° to 179.5°, despite failure occurring prior to full 180° displacement in most cases. Notably, specimen t2 r4 reached a bending angle of 179.5°, effectively achieving full deployment without failure. This performance can be attributed to its balanced radius-to-thickness ratio, which allows large angular displacement while maintaining relatively lower strain concentrations. This parameter combination therefore represents the most favourable configuration in terms of achievable displacement and a reduced risk of premature failure.
The strain–angle curves further reveal that failure does not occur at a single critical strain value, but rather within a range of equivalent plastic strain (PEEQ), as indicated by the orange-shaded regions in Figure 6. The results demonstrate that failure is not governed by a unique material threshold but instead depends on the distribution and localization of strain within the specimen. Variations in geometry, particularly the r/t parameter, influence the strain gradient and localization behaviour, leading to differences in the failure strain across specimens.
4.2. Failure Mechanics
Experimental observations show that crack propagation in the majority of specimens occurred gradually, resulting in a visible surface crack at the inner radius. This behaviour indicated that failure originates from localized deformation in this region, consistent with the strain localization illustrated in FEA. Surface slip is first observed at the inner radius, followed by crack initiation and subsequent propagation.
The observed difference in failure behaviour and strain levels at failure between thin and thicker specimens can be linked to the stress state during bending. For thinner specimens, a plane stress condition can be assumed, in which deformation primarily occurs in the plane of the specimen during bending. For thicker specimens, deformation in the through-thickness direction becomes more constrained, and strain in this direction becomes increasingly restricted. At larger bending angles, where plastic deformation increases, the deformation becomes non-uniform, leading to the development of hydrostatic tension. It is well known that hydrostatic tension accelerates void growth and promotes damage accumulation, leading to rapid fracture [6], as observed in the thicker specimens. In contrast, thinner specimens experience lower strain levels and reduced constraint, resulting in lower triaxiality and a more gradual failure process characterized by crack initiation and propagation prior to final failure.
Furthermore, specimen t2 r4 exhibited no macroscale surface cracks, illustrating that full deployment without failure is achievable at the higher geometrical parameter of r/t = 2.0. This suggests that strain localization is reduced or more evenly distributed in this specimen, delaying crack initiation and allowing for greater deformation prior to failure.
5. Conclusions
Additively manufactured LPBF AlSi10Mg alloy was evaluated under bending-driven deployment to investigate its suitability for deployable structural applications. Specimens were evaluated using bending radius and thickness as key parameters to assess their capacity for undergoing large plastic deformation. The evaluation considered bending angle, surface crack formation, and strain development supported by numerical analysis, resulting in the following findings.
- All specimens exhibited a high degree of bending capability, achieving angles between 90.2° and 179.5°, demonstrating that heat-treated AlSi10Mg can undergo large plastic deformation under bending and thus is suitable for deployable structure applications.
- The parameter r/t = 2.0 for specimen t2 r4 achieved the highest bending angle of 179.5° without failure, with the lowest recorded strain of 18.8%, indicating that full deployment is feasible by controlling the r/t parameter.
- Failure was governed by strain localization at the inner radius rather than by a single critical strain value, with crack initiation consistently occurring in this region. The failure mechanism followed a sequence of surface slip, crack initiation, and crack propagation.
- Thicker specimens exhibit more abrupt fracture due to increased through-thickness constraint, which promotes hydrostatic tension and higher triaxiality during bending. In contrast, thinner specimens remain closer to plane stress conditions, resulting in lower triaxiality and a more gradual failure process governed by crack initiation and propagation.
Author Contributions
Conceptualization, C.N.H. and S.A.T.; validation, C.N.H. and S.A.T.; data curation, C.N.H.; writing—original draft preparation, C.N.H.; writing—review and editing, C.N.H. and S.A.T.; supervision, S.A.T.; project administration, S.A.T. All authors have read and agreed to the published version of the manuscript.
Funding
This research received no external funding.
Institutional Review Board Statement
Not applicable.
Informed Consent Statement
Not applicable.
Data Availability Statement
The raw data generated in this experimental study supporting conclusions of this article can be made available by the authors upon request.
Acknowledgments
The Authors would like to thank the technical staff at the laboratories of the Department of Mechanical and Industrial Engineering (MTP), NTNU, for their dedicated time and extensive technical assistance throughout the experimental work, particularly with operation of the LPBF system and the associated specimen manufacturing and post-processing. During the preparation of this manuscript, the authors used the AI language model OpenAI ChatGPT 5.5 to improve the readability and language of author-written text. The authors have reviewed and edited all text in this manuscript and take full responsibility for the content of this publication.
Conflicts of Interest
The authors declare no conflicts of interest.
References
- Zhao, L.; Song, L.; Santos Macías, J.G.; Zhu, Y.; Huang, M.; Simar, A.; Li, Z. Review on the correlation between microstructure and mechanical performance for laser powder bed fusion AlSi10Mg. Addit. Manuf. 2022, 56, 102914. [Google Scholar] [CrossRef] [Scilit]
- Megahed, S.; Bühring, J.; Duffe, T.; Bach, A.; Schröder, K.-U.; Schleifenbaum, J.H. Effect of Heat Treatment on Ductility and Precipitation Size of Additively Manufactured AlSi10Mg. Metals 2022, 12, 1311. [Google Scholar] [CrossRef] [Scilit]
- Aboulkhair, N.T.; Maskery, I.; Tuck, C.; Ashcroft, I.; Everitt, N.M. The microstructure and mechanical properties of selectively laser melted AlSi10Mg: The effect of a conventional T6-like heat treatment. Mater. Sci. Eng. A 2016, 667, 139–146. [Google Scholar] [CrossRef] [Scilit]
- Limbasiya, N.; Jain, A.; Soni, H.; Wankhede, V.; Krolczyk, G.; Sahlot, P. A comprehensive review on the effect of process parameters and post-process treatments on microstructure and mechanical properties of selective laser melting of AlSi10Mg. J. Mater. Res. Technol. 2022, 21, 1141–1176. [Google Scholar] [CrossRef] [Scilit]
- EOS GmbH. EOS Aluminium AlSi10Mg Material Data Sheet; Material Data Sheet CR774; EOS GmbH: Munich, Germany, 2022. [Google Scholar]
- Tvergaard, V.; Needleman, A. Analysis of the cup-cone fracture in a round tensile bar. Acta Metall. 1984, 32, 157–169. [Google Scholar] [CrossRef] [Scilit]

Disclaimer/Publisher’s Note: The statements, opinions and data contained in all publications are solely those of the individual author(s) and contributor(s) and not of MDPI and/or the editor(s). MDPI and/or the editor(s) disclaim responsibility for any injury to people or property resulting from any ideas, methods, instructions or products referred to in the content. |
© 2026 by the authors. Licensee MDPI, Basel, Switzerland. This article is an open access article distributed under the terms and conditions of the Creative Commons Attribution (CC BY) license.