


Abstract
The paper examines the possibility of compensating one of the significant systematic factors in turning that affects the quality of machined surfaces—namely, the dimensional wear of cutting inserts during finish turning. Predictive wear models are developed in which the process is approximated using either a linear or an exponential function. The wear prediction error is determined. Based on data from the authors’ experimental studies and other published sources, the duration and intensity of the initial and steady-state wear stages are established. A corrected predictive function is presented, consisting of a nonlinear initial segment and a linear steady-state segment. A design variant of a measuring probe for monitoring the current wear of the insert cutting edge, applicable under production conditions, is also proposed.
1. Introduction
The wear process develops under the action of numerous factors that manifest specifically under different operating conditions as a result of the combined influence of several wear mechanisms formed by tribological, physical, and chemical phenomena. For this reason, deriving a specific relationship cannot be achieved through a purely physical model; therefore, an experimental approach is applied. However, this is not an acceptable solution for real production, as it requires preliminary investigations under different machining conditions to determine the constant and the exponential coefficients , , and in the mathematical model for determining flank wear [1]:
where is radial wear, is the clearance angle, and the functions represent interrelated quantities: .
The above-mentioned investigations, however, are associated with significant economic cost. To overcome this problem in accuracy control through prediction of current wear, a study was conducted considering solely as a function of cutting time (where denotes wear in the radial direction). The relationship was examined under specific conditions—constant cutting regime, given workpiece material, and defined insert grade: , where is a constant formed by the fixed factors. In [2,3,4], the application of empirical models was investigated; however, an analysis of their accuracy is lacking.
2. Materials and Methods
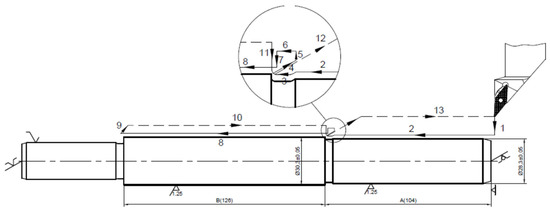
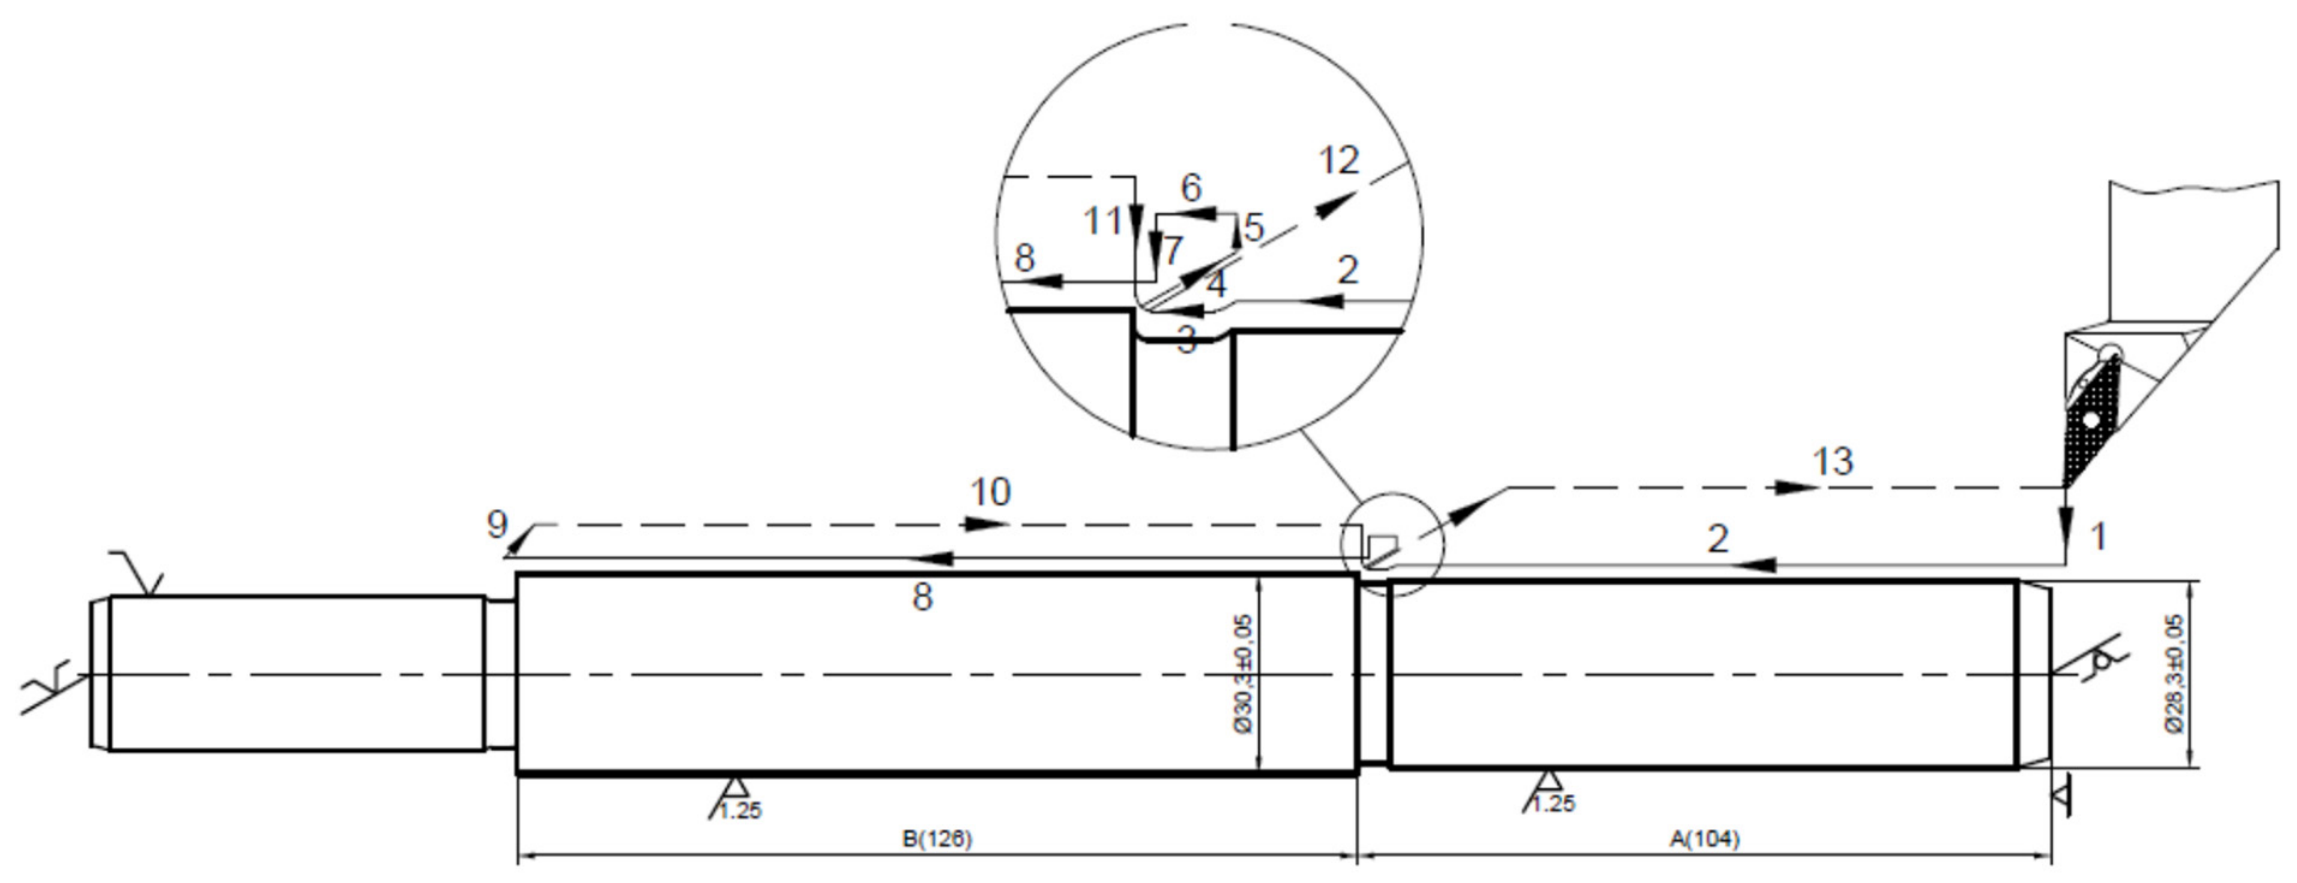
An experiment was conducted to obtain natural results for the wear process under real production conditions. The workpiece shown in Figure 1 was machined.
Figure 1.
Machining scheme of the “Piston” component (Lines numbered 1 to 13 illustrate the sequential tool path).
The two cylindrical surfaces, Ø28.3 and Ø30.3, were finish-machined using a VBMT 160408 MF 4425 cutting insert under the following cutting conditions: , , ; workpiece material: alloy steel 1.2344 (Table 1). The cutting time of the investigated tool during finish machining was 30 s.
Table 1.
Chemical composition of steel 1.2344.
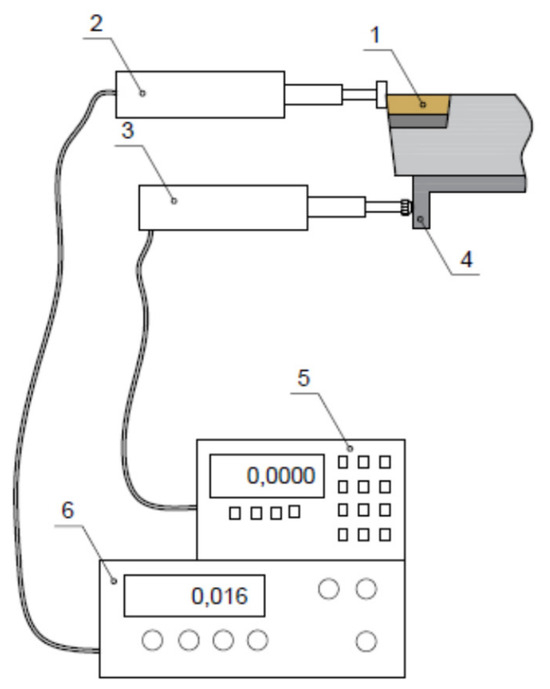
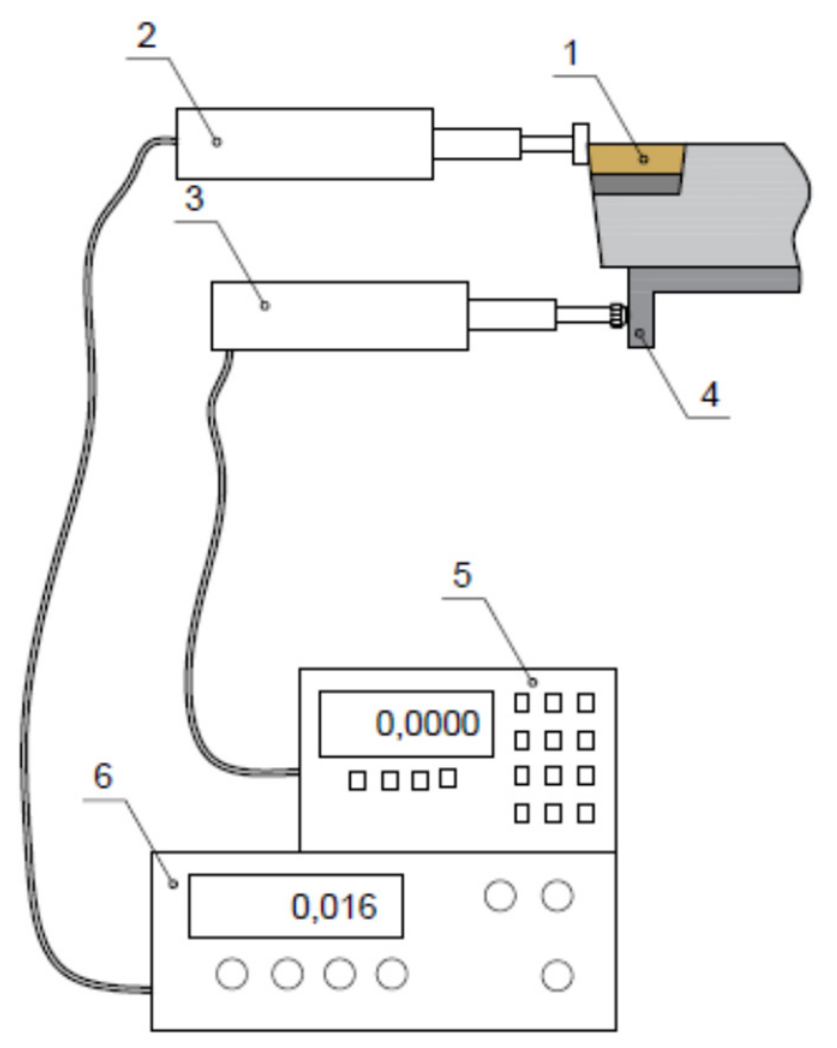
The study included the measurement of tool wear after machining each workpiece (Figure 2). The cutting tool (pos. 1) was programmatically positioned toward a measuring system performing relative wear measurement. This was realized by rigidly fixing an L-shaped bracket (pos. 4) beneath the tool. The wear value was determined as the difference between the readings of two linear measuring devices (pos. 2 and 3). The reading devices (pos. 5 and 6) were connected to a computer for data storage and processing.
Figure 2.
Tool wear measurement scheme: 1—cutting tool; 2 and 3—linear measuring devices; 4—L-shaped bracket; 5 and 6—reading devices.
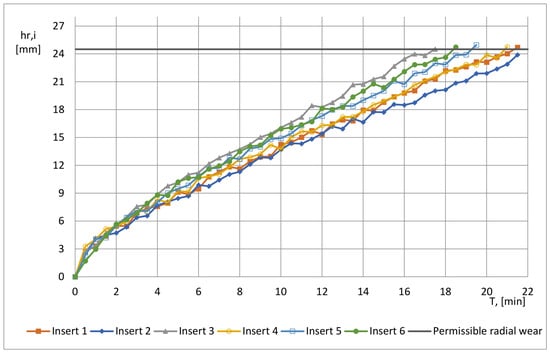
The wear of the cutting inserts was measured after each workpiece until the allowable flank wear was reached. For the given machining conditions, the allowable value was set to , corresponding to allowable radial wear [5]. In order to account for the influence of structural inhomogeneity of the tool material, coating thickness, and other factors affecting wear resistance, one cutting edge from each of six inserts was used. The wear curves obtained from the experiment are presented in Figure 3.
Figure 3.
Wear curves of six cutting edges from six inserts.
Tool life, until reaching the allowable wear varied from , indicating dispersion in wear intensity due to inhomogeneity in the properties of both the workpiece and tool materials. During the initial wear period, insignificant dispersion in wear intensity was observed among the six inserts. This stage concluded within approximately at . Based on the conducted investigations, it is essential to apply an approach enabling accuracy control through the combined implementation of tool life modeling and periodic workpiece measurement.
The classical method for compensating systematic errors is active control [6], referred to as dimensional offset adjustment. Compared to other approaches, it provides high accuracy because the compensating action is determined based on measurement of the current dimensional deviation [7]. Achieving effectiveness in all offset-adjustment algorithms requires information about the intensity of the systematic factors and their variation over time. The evaluation of effectiveness is associated with the following indicators:
- Adaptation time of the algorithms to the specific process parameters;
- Accuracy of the offset adjustment;
- Frequency (productivity) of introducing the compensating action.
The concept of this integrated approach is to improve all three indicators—by using the tool life model to obtain preliminary and sufficiently accurate information about wear intensity. For this purpose, the power-law models presented earlier (Relations 1 and 2) may also be used; however, their derivation requires extensive experimental studies, which, as mentioned, are not always feasible in industrial production.
The use of tool life models as an information source is consistent with the extensive contemporary research aimed at their improvement [8,9,10,11]. It is driven by the need for accurate determination and program-based specification of tool change time, which is a current issue in automated manufacturing systems. Moreover, the manufacturer data for cutting speed provided in catalogs or obtained via electronic calculators are based on such models.
The tool life determined by the model
is always defined at an allowable wear level [], which in finish machining is measured on the flank surface in the tool nose region. This level is practically established within the range of , at which no significant influence on the achieved surface roughness is observed. Deterioration of surface finish is associated either with micro-chipping of the cutting edge or with vibration occurrence in less stable technological systems. The justified determination of the time after which the tool becomes unserviceable proceeds in two stages:
- Establishing the relationship between surface roughness and allowable wear, ;
- Calculating tool life at the obtained allowable wear value.
The specific objective of the first stage is to determine the wear value above which the specified surface roughness changes unacceptably. The stochastic nature of cutting-edge deterioration and blunting does not allow the establishment of a generalized functional relationship. Research on determining is directed toward obtaining empirical relationships for specific conditions [12,13,14,15].
In [13], for two materials with similar machinability, AISI 1040 and AISI 1045, different relationships between roughness and wear were obtained:
and
Due to these modeling results, the preferred industrial solution is to set , since it has been practically proven that, up to this wear level, no substantial change in surface roughness occurs. Inaccuracy in defining the allowable wear leads to incomplete utilization of the insert’s service life but does not affect the accuracy of wear intensity evaluation. This conclusion follows from Relation (6), defining wear intensity:
Under constant conditions, a change in leads to a proportional change in tool life ; thus, the same wear intensity is obtained.
The intensity calculated by this relationship implies a linear variation in wear with until the tool resource is exhausted. The relationship holds under the assumption that is a linear function of time, an assumption widely adopted in the scientific literature to simplify machining error models.
It is well known that the initial period, associated with the bedding of the contacting surfaces, exhibits nonlinear behavior. The assumption of linear tool wear is justified by reducing the magnitude of this initial region due to contour-ground flank surfaces of the inserts and the application of coatings, resulting in a lower friction coefficient. In reality, this region of intensified wear is influenced not only by the factors acting during the steady-state wear phase but also by the additional higher pressure generated on the flank surface of the tool (Figure 4).
Figure 4.
Approximation of wear intensity using linear and exponential functions.
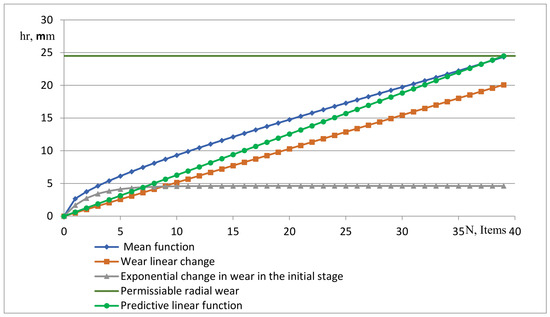
As the contact area increases, the influence of pressure decreases according to a power (exponential) law. Consequently, due to the presence of the initial region in the wear curve, . To analyze the error arising between the predicted wear intensity determined by Relation (3) and its actual value, the experimental results shown in Figure 3 are considered. The arithmetic mean value of the family of wear curves is assumed to be used for determining the tool life model (Relation 3) at a specified allowable flank wear [, corresponding to allowable radial wear [. From the same experimental results, an average tool life of T = 19.5 min was obtained, equivalent to 39 machined parts. On this basis, the predicted wear intensity is calculated as: or .
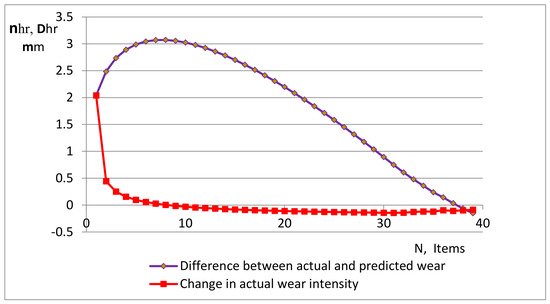
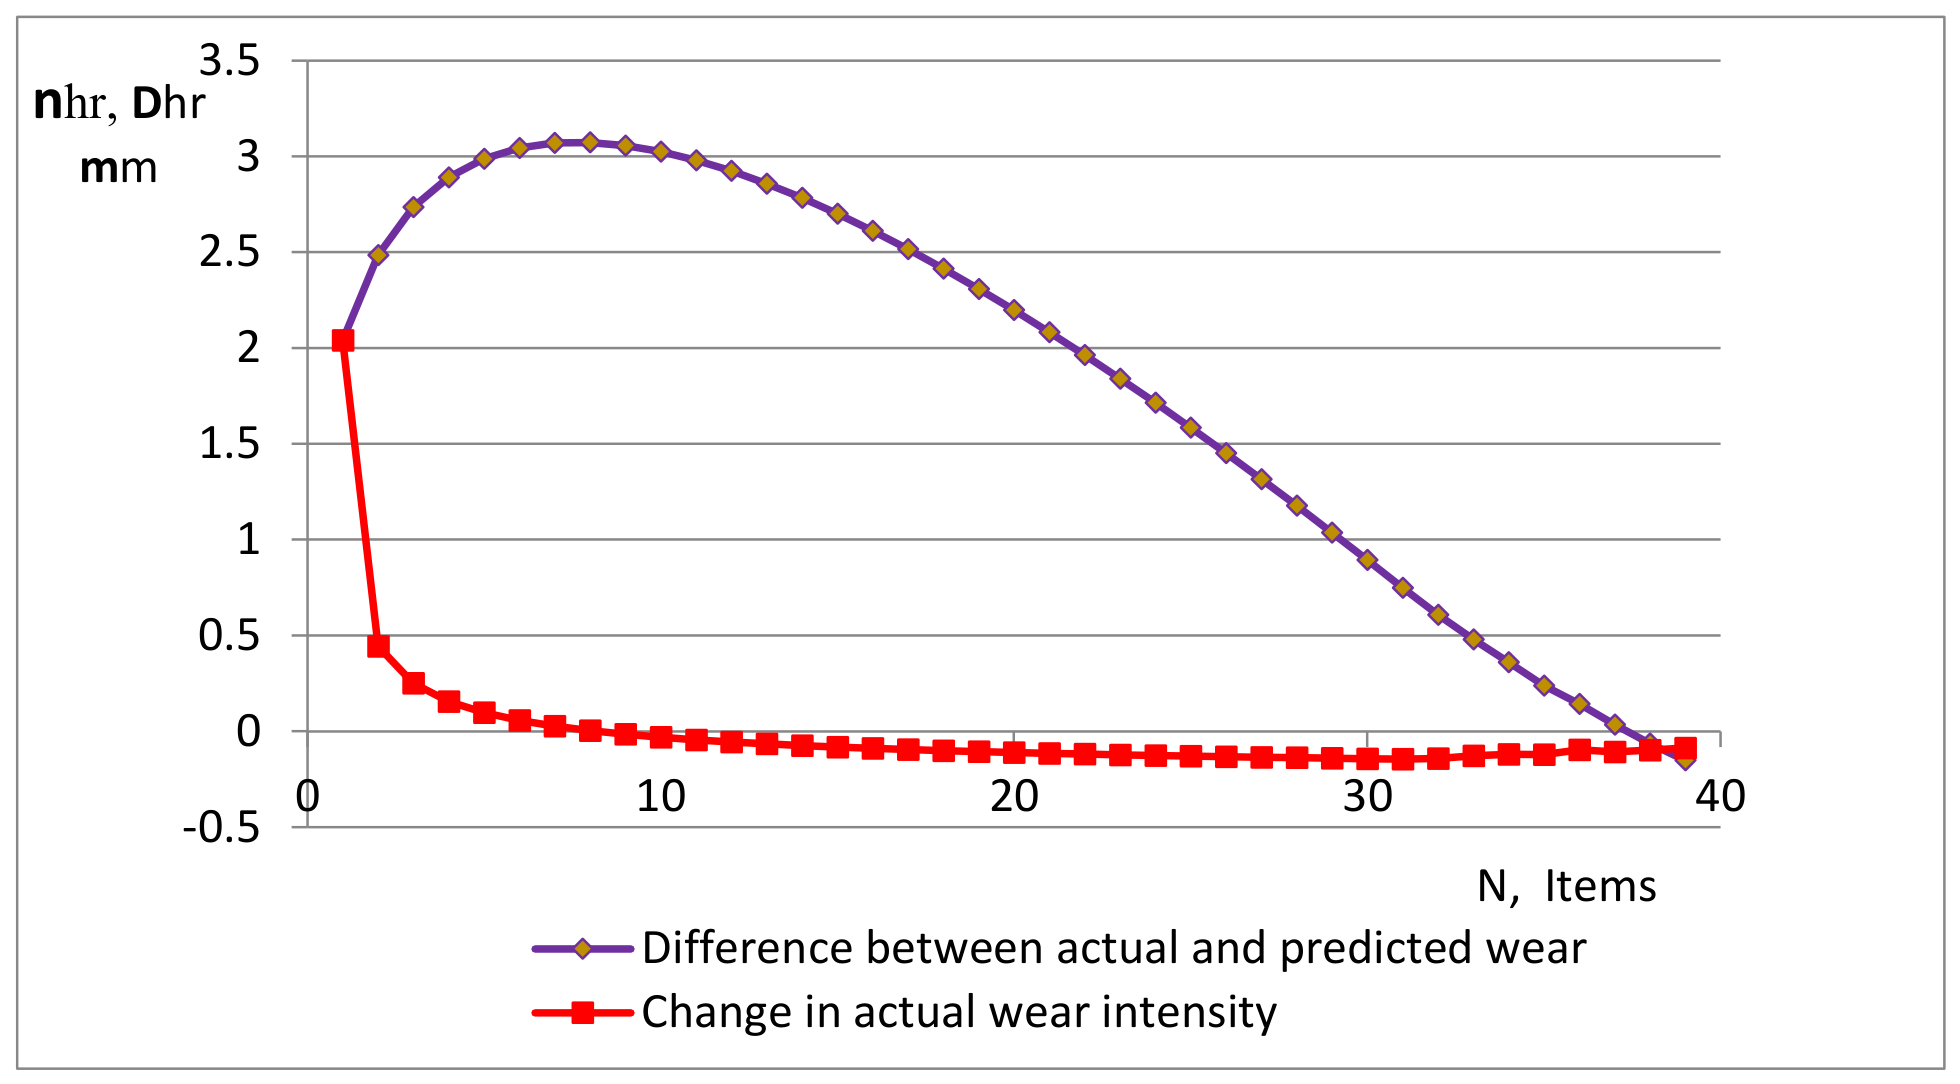
Figure 5 presents the variation in the actual wear intensity as a function of the number of machined parts.
Figure 5.
Variation in the actual wear intensity.
The same figure also shows the difference in wear intensity between the arithmetic mean wear curve and the predicted linear function derived from it. The difference between these two functions defines the uncompensated wear value over time. These deviations occur between two related functions, since the predicted function is obtained from the arithmetic mean wear curve. A clear pattern is observed: higher wear intensity and accumulation of deviation in the initial region—up to the 3rd–4th part, corresponding to approximately 1.5–2 min of cutting time.
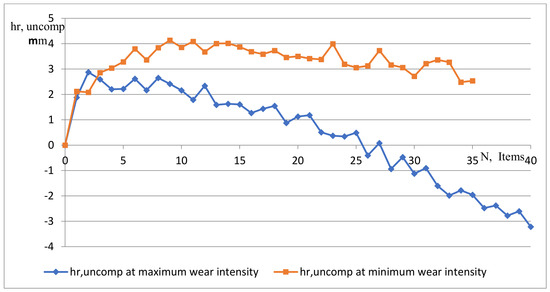
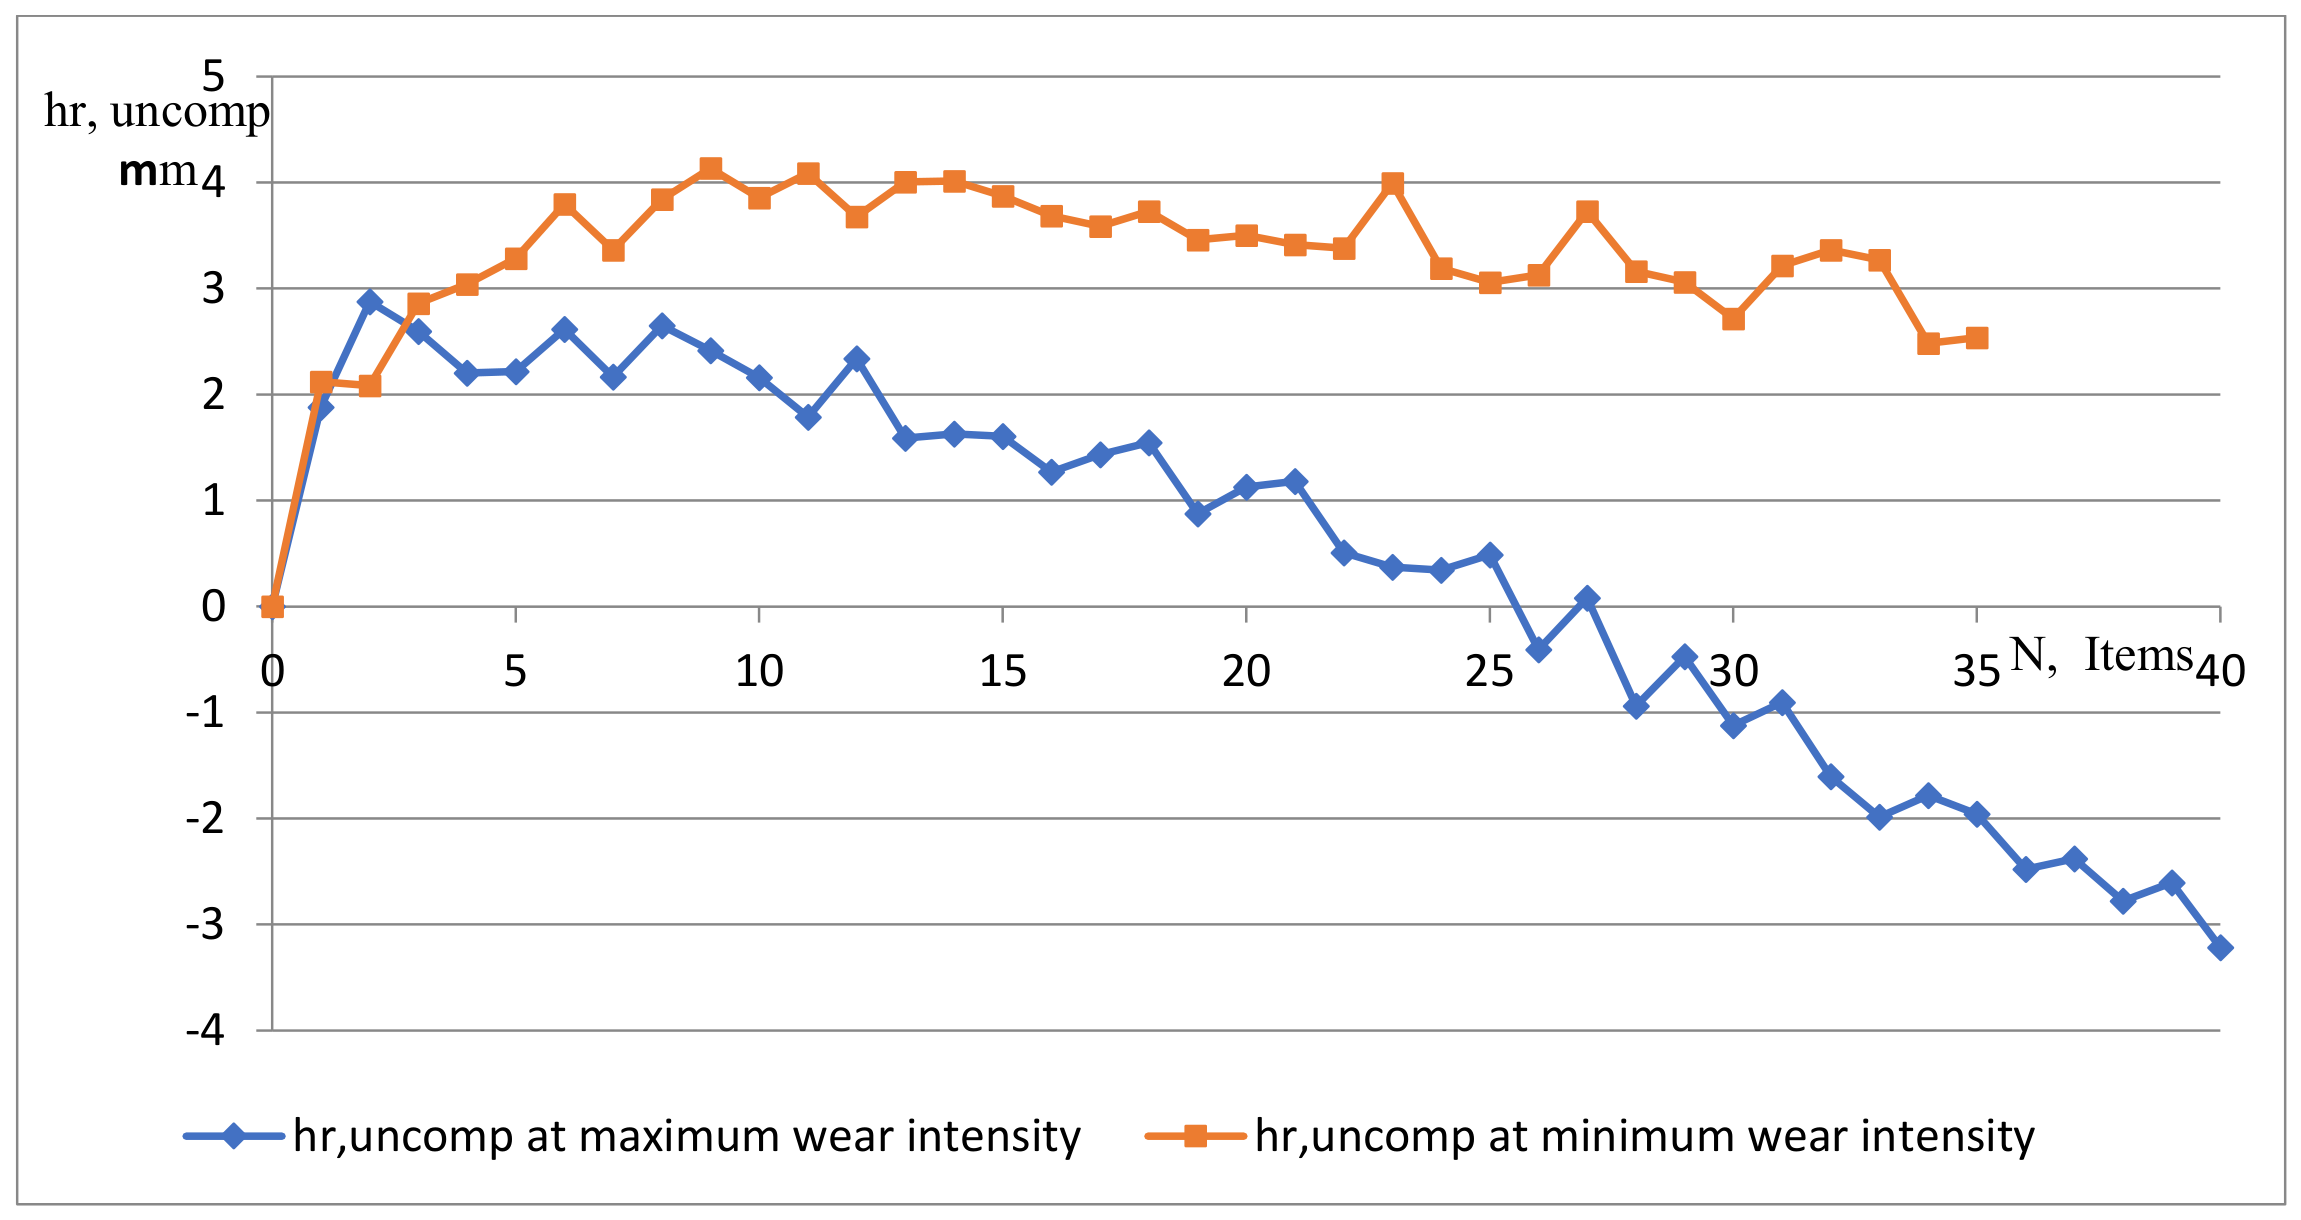
The accuracy of compensation through the introduction of predicted deviations is not the primary limitation of the adopted approach; rather, it is influenced by the manifestation of wear as a stochastic process. Figure 6 shows the variation in uncompensated wear values for the two boundary wear curves—corresponding to minimum and maximum wear intensity.
Figure 6.
Uncompensated wear values for the two boundary curves.
The results of program-based compensation of the current predicted wear values demonstrate a significant reduction in the influence of this primary systematic factor during machining. In one boundary case, the maximum uncompensated value is , and, in the other, it is .
The analysis of wear intensity variation aims to account for the nature of its influence on the accuracy of offset-adjustment algorithms used to achieve machining accuracy. The higher wear intensity at the beginning, together with dimensional offset deviation after insert replacement, creates a probability of unacceptable dimensional deviation in the produced part.
In this regard, the following parameters must be evaluated:
- wear intensity during the initial period ;
- wear intensity during even wear ;
- duration of the initial period ;
- duration of even wear .
To accumulate sufficient information for evaluating these parameters, appropriate data from published studies [8,9,16,17,18,19] were used and are summarized in Table 2. The data refer to turning with coolant.
Table 2.
Summary of cutting tool wear data.
For the effective functioning of offset-adjustment algorithms, the following information is important:
- Ratio between tool life and initial wear time: (average 10);
- Ratio between wear intensities: (average 3.1).
3. Results
Wear prediction can be improved by adding to the predicted linear function the actually existing power-law variation in the initial region, caused by the decaying influence of pressure on the flank surface. To define it, data for and are sufficient.
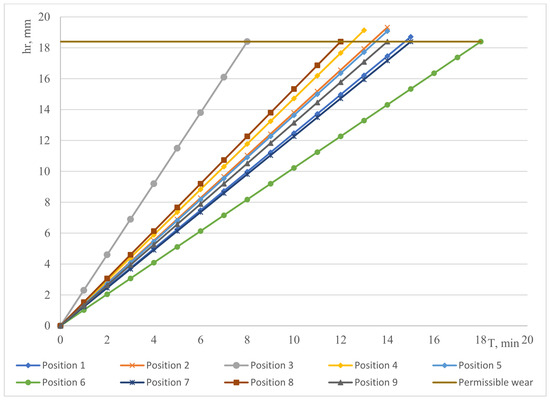
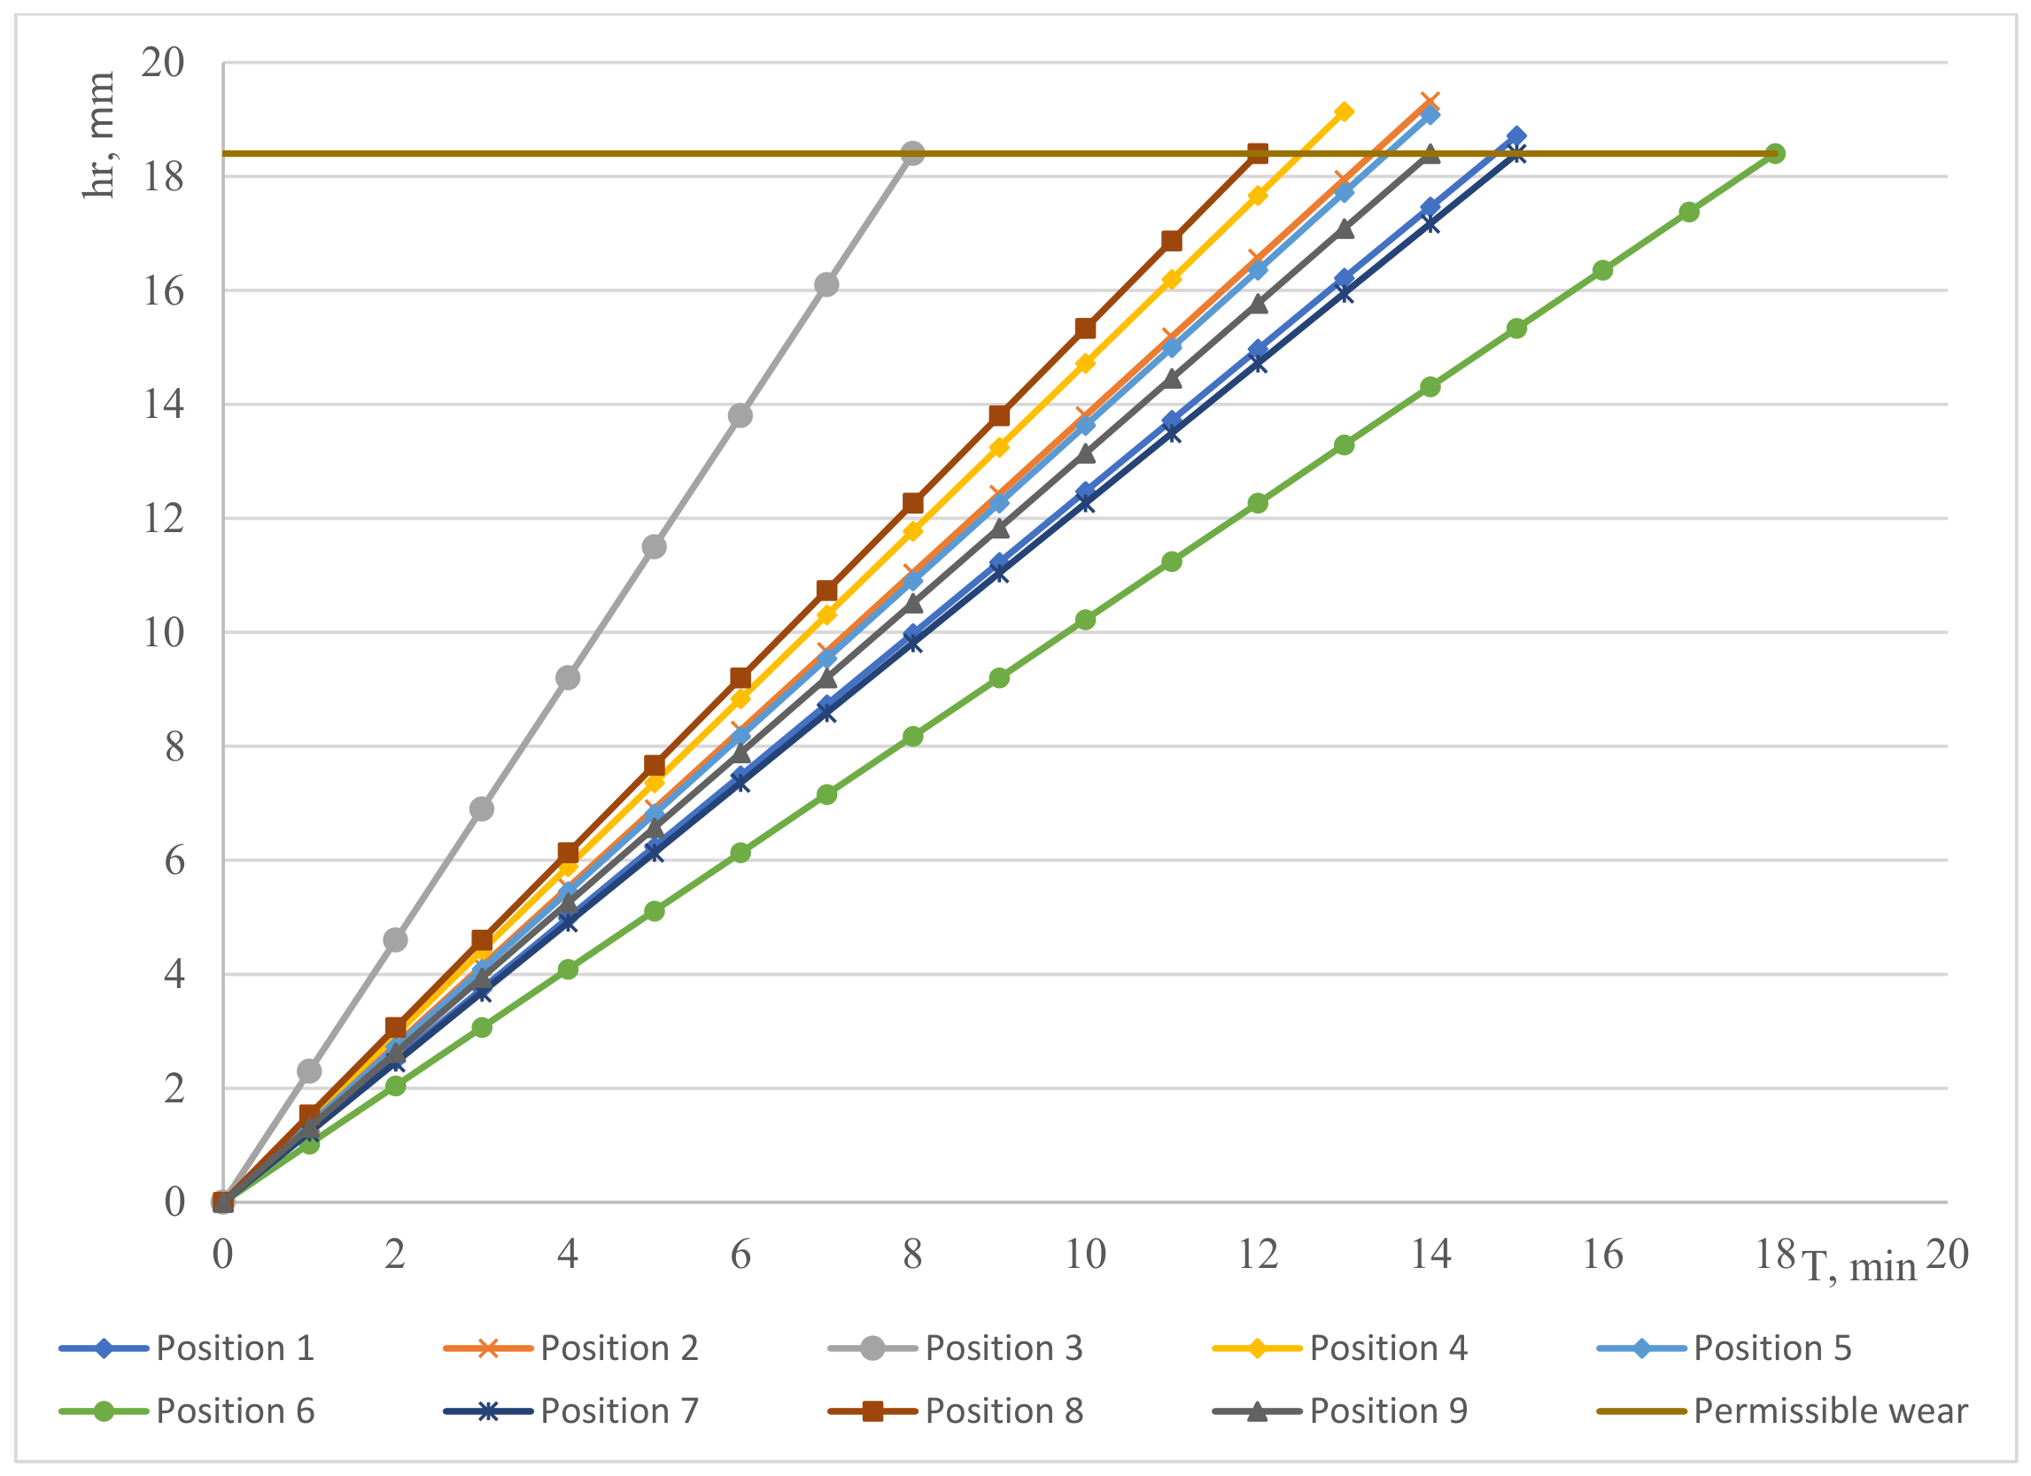
Figure 7 presents the predicted wear functions obtained from the data in Table 2. They were constructed assuming linear wear variation with intensity calculated from .
Figure 7.
Predicted wear functions.
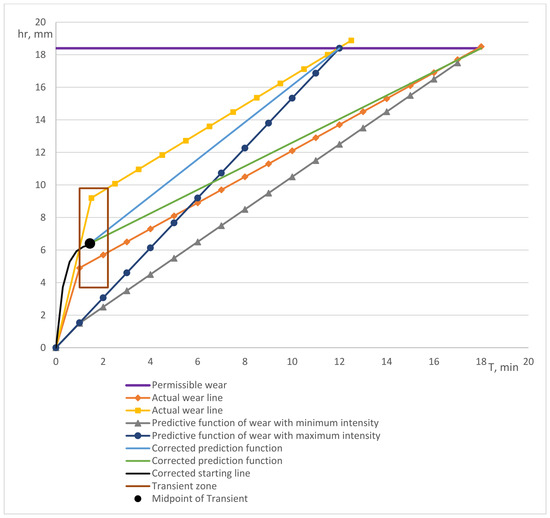
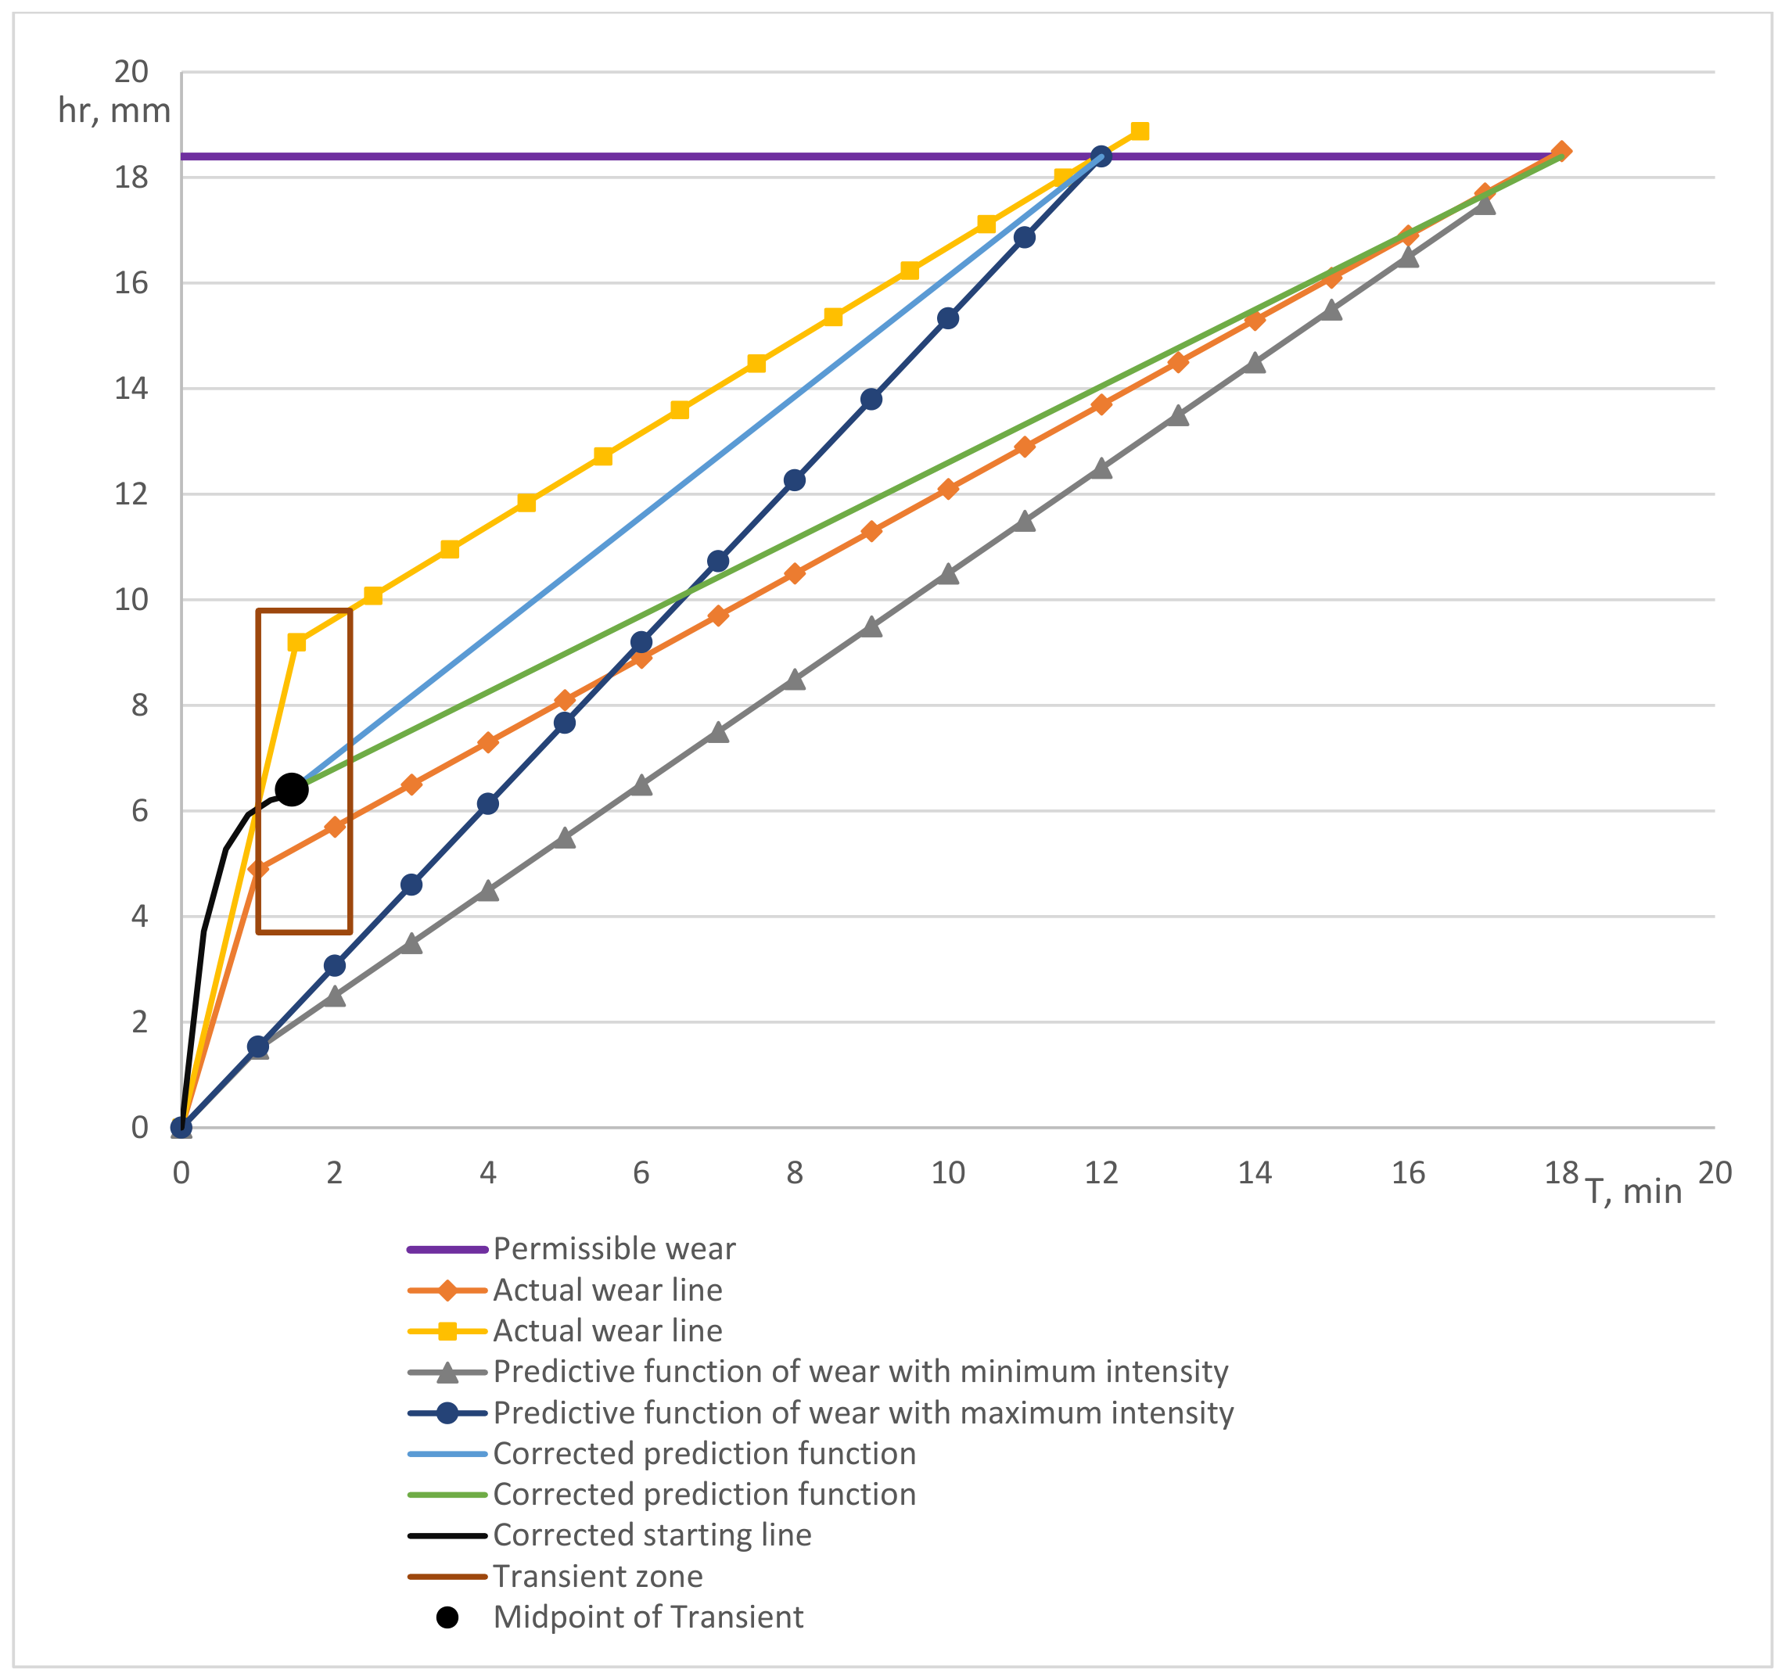
The positions indicated in the figure correspond to the sequential numbers in the table. It is evident that position 3 significantly differs from the others, due to the selected high cutting speed (60 m/min) for the titanium alloy, which caused unacceptably accelerated wear. For this reason, it was excluded from the subsequent analysis presented in Figure 8, where correction (improvement) of the predicted function is considered by introducing the initial wear region.
Figure 8.
Correction of the predicted function by introducing an initial wear region.
An analysis of the boundary predicted values from Figure 7—positions 6 and 8—was performed. For this purpose, it was necessary to determine the transition point at which the initial (nonlinear) region changes into the linear (even wear) region. The rectangular area shown encloses the transition points of the realizations from Figure 7; it is constructed based on the boundary values of and . Since, when constructing the predicted function, only and are available, the transition point is assumed to have coordinates equal to the arithmetic mean values of and . This allows construction of a corrected predicted function that includes both nonlinear and linear regions. In Figure 8, the actual wear lines based on tabulated data are also plotted. The initial regions are represented linearly due to insufficient data points for modeling curvilinear wear.
The Figure shows that the corrected predicted wear functions are located closer to the actual wear lines compared to the initial predicted functions. This leads to improvement of the results presented in Figure 5 and Figure 6.
The conducted analysis demonstrates high accuracy of the predictive result for program-based compensation without the need for time-consuming experiments. It should be noted, however, that real accuracy is influenced by the stochastic nature of the wear process, meaning that uncompensated wear errors will remain and must be periodically corrected by workpiece measurement (offset adjustment).
The main problem of predictive wear compensation is modeling accuracy, which requires implementation under specific conditions. This necessitates models covering narrow ranges of influencing factors. Such an approach requires extensive research, which is impractical given the vast diversity of machining conditions.
To avoid this problem, tool life models are developed by systematizing conditions. This is the approach of tooling companies, which are the primary providers of tool life data. Prediction is performed using generalized models for groups of materials and cutting regimes associated with the type of machining (roughing or finishing), considering the corresponding allowable wear. Naturally, generalized models provide less accurate estimation of tool life and the predicted wear function but eliminate the need for preliminary experimental investigations.
4. Discussion
To improve the efficiency of the considered combined approach, the following solution is proposed:
- Calculate the predicted wear intensity using generalized predictive models;
- Perform two levels of updating of the predicted value introduced as program compensation.
The proposed updating levels are appropriate only for:
- Processes where wear is the dominant systematic factor;
- Finishing tools, where wear significantly affects dimensional accuracy.
The objective is to improve wear intensity estimation and to obtain data for effective wear compensation in subsequent production batches.
4.1. First Level of Updating
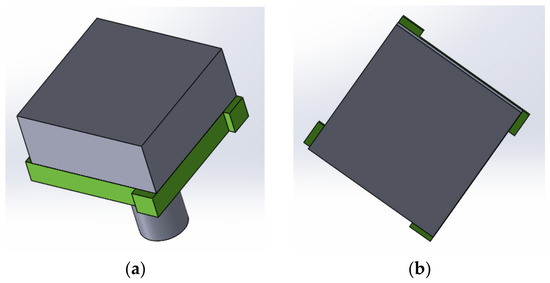
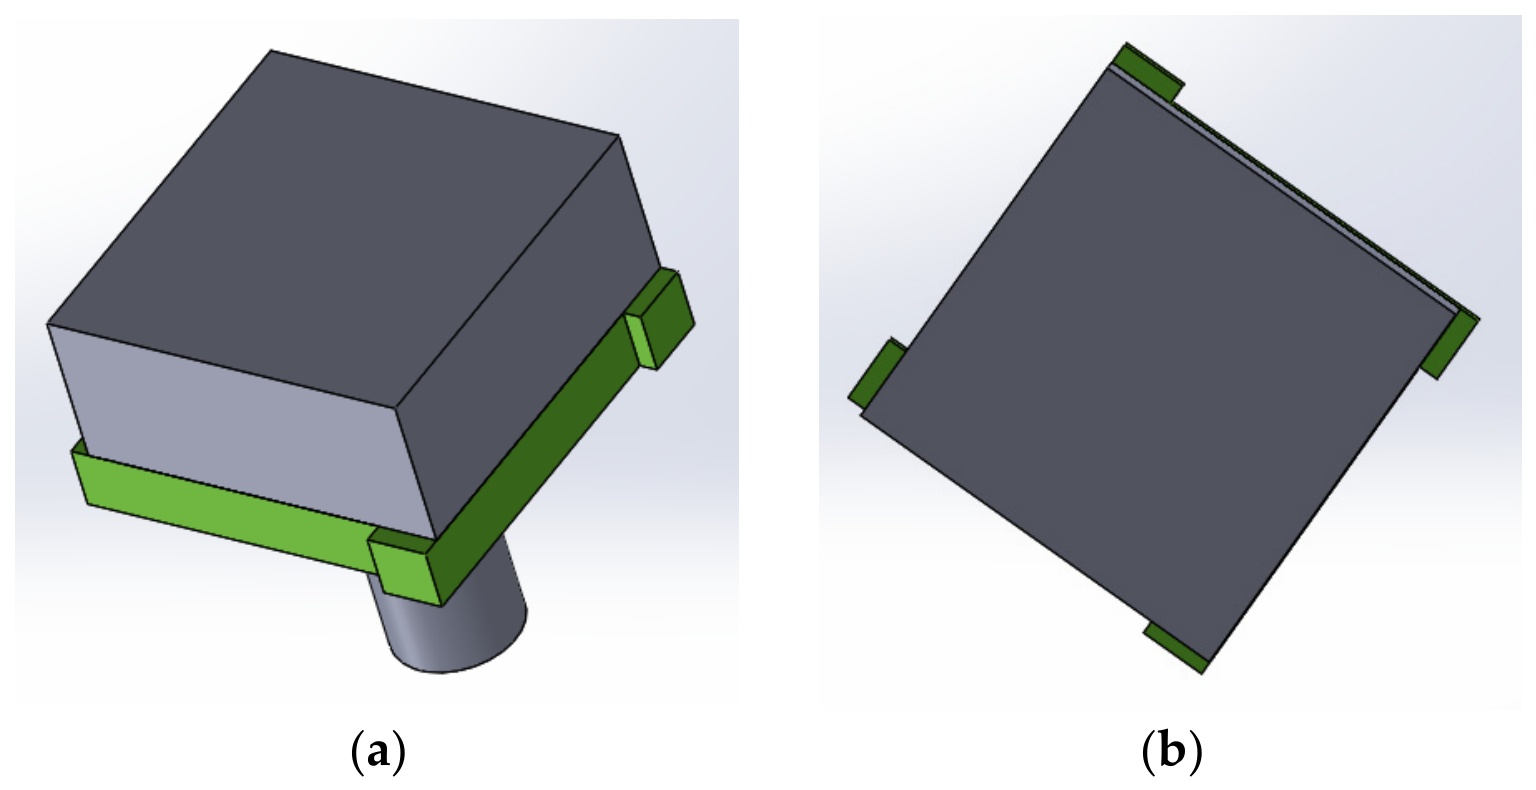
The first level of updating is carried out during process commissioning and covers the entire wear life of one cutting edge. During this period, program compensation is executed using the calculated predicted value. This updating can be performed accurately and automatically only on machines equipped with tool measurement (presetting) devices. To improve measurement accuracy, relative wear measurement is proposed. It is implemented through a specially designed measuring probe (Figure 9). A plate with four protruding pads (additional plank) is attached to the base prismatic probe.
Figure 9.
Design of the measuring probe: (a) side view; (b) top view.
This structural modification enables relative measurement of tool wear, eliminating typical measurement errors:
- Positioning error of the measuring device;
- Thermal deformation errors;
- Inaccuracy in determining the trigger position of the device.
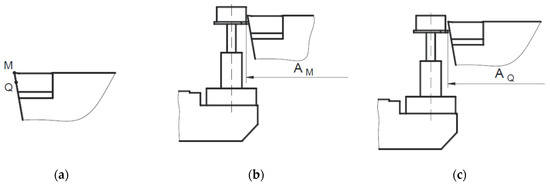
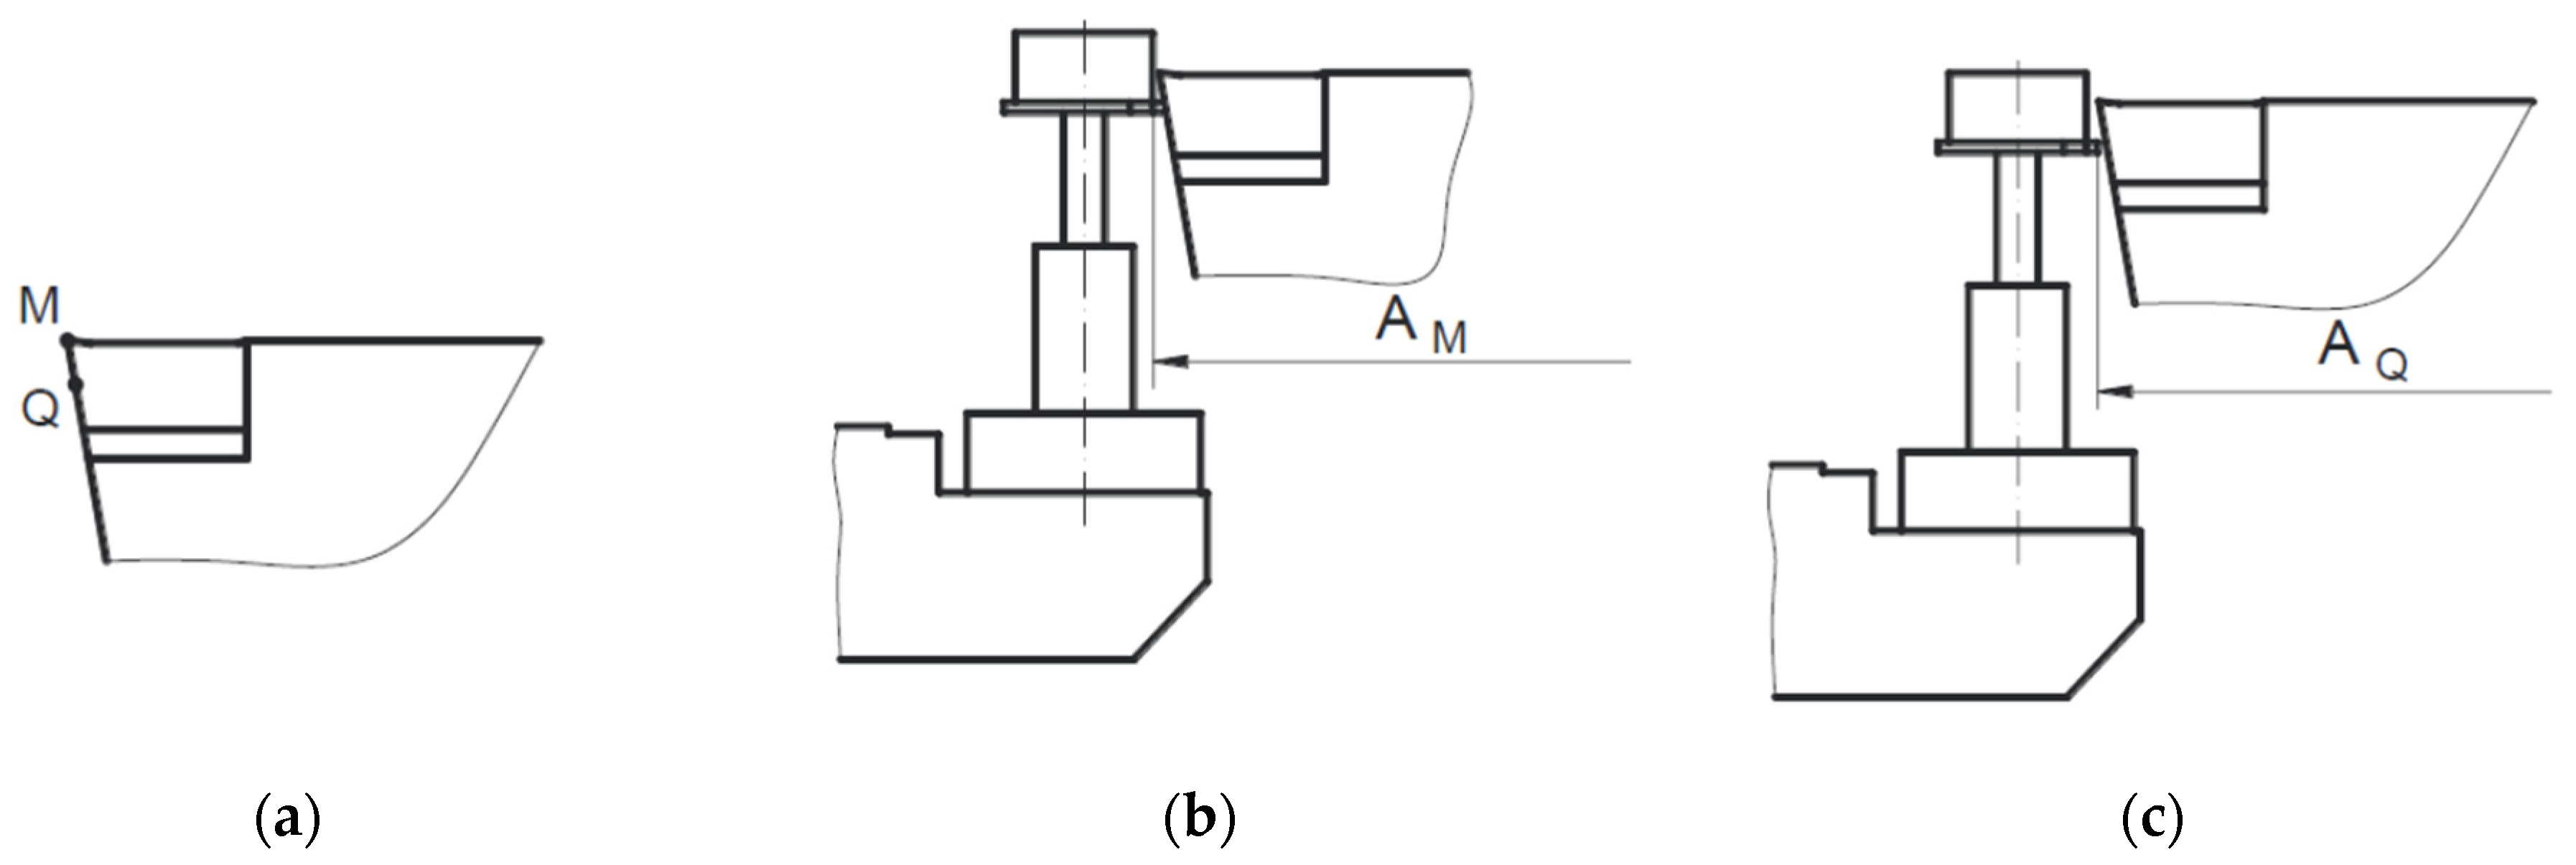
Relative measurement involves determining the position of point M (tool tip) relative to point Q, located on the edge between the main and auxiliary flank surfaces (Figure 10a). Point Q is located sufficiently far from the tool tip so that it is not affected by wear. Monitoring of point M relative to point Q is performed through two consecutive measurements. The first measurement determines dimension , corresponding to the sensor trigger position when the tool tip (point M) touches the base measuring probe (Figure 10b). The second measurement determines dimension after the flank edge contacts the protruding edge of the additional plank (Figure 10c).
Figure 10.
Measurement of tool wear: (a)—determining the position of point M relative to point Q; (b)—tool tip (point M) touches the base measuring probe; (c)—contact to the protruding edge of the additional plank.
The wear magnitude is:
where , —dimensions measured during initial tool setting; , —current measured dimensions.
Dimension changes only due to the characteristic measurement errors mentioned above.
The accuracy of this double measurement ( and ) is determined by:
where —range of random machine positioning error;
—range of random measuring device error;
—number of repeated measurements.
The measurement process continues until the adopted allowable wear is reached. The criterion for insert end-of-life is deterioration of surface roughness (an indicator of serviceability in finish machining). To calculate program compensation values, it is necessary to determine the relationship , where is the number of machined parts.
4.2. Second Level of Updating
The second level of updating is related to optimization of accuracy control—improving compensation accuracy and offset-adjustment frequency by obtaining more precise information about wear intensity.
This measure is appropriate when larger production volumes are anticipated. At the first level, data are obtained from a single wear realization; at the second level, a statistically averaged value from multiple realizations is determined.
It is carried out during machining of the first production batch, collecting information from the wear of cutting edges of several operating inserts.
The procedure for determining is identical to that described for the first level, but the function is obtained by averaging results from individual realizations.
5. Conclusions
One of the decisive factors for achieving accuracy in finish turning is the wear of the cutting insert.
The performed approximation of wear using separate linear and exponential functions enables prediction of both its magnitude and intensity. The difference between actual and predicted wear is greatest at the beginning of operation of each cutting edge (≈) and gradually decreases, indicating very effective compensation of this systematic factor.
Based on the results of conducted studies and published research, data were extracted regarding the duration and intensity of the initial and steady-state wear stages. The constructed corrected predictive function, incorporating a power-law variation in the initial wear region, significantly improves wear prediction accuracy.
The proposed structural design of the measuring probe, enabling monitoring of cutting-edge wear, represents an effective solution applicable under production conditions with minimal machine time consumption. The collected data can be recorded, statistically processed, and used for predicting wear in subsequent process realizations.
Through the two levels of updating, both the wear data of the specific cutting edge and the accumulated statistically averaged values are utilized, thereby reducing the influence of the stochastic nature of the wear process.
Funding
This study is supported by the project 2025–MTF–01 “Friction stir welding of high strength aluminum alloys”.
Institutional Review Board Statement
Not applicable.
Informed Consent Statement
Not applicable.
Data Availability Statement
Data are contained within the article.
Conflicts of Interest
The author declares no conflicts of interest.
References
- Velchev, S. Metal Cutting; Higher Technical School “A. Kanchev”, Ruse: Ruse, Bulgaria, 1993. [Google Scholar]
- El-Hossainy, T.M.; El-Zoghby, A.A.; Badr, M.A.; Maalawi, K.Y.; Nasr, M.F. Cutting Parameter Optimization when Machining Different Materials. Mater. Manuf. Process. 2010, 25, 1101–1114. [Google Scholar] [CrossRef] [Scilit]
- Nannapaneni, S.; Mahadevan, S.; Dubey, A.; Lee, Y.-T.T. Online monitoring and control of a cyber-physical manufacturing process under uncertainty. J. Intell. Manuf. 2020, 195, 1289–1304. [Google Scholar] [CrossRef] [Scilit] [PubMed] [PubMed Central]
- Wang, S.-M.; Chen, Y.-S.; Lee, C.-Y.; Yeh, C.-C.; Wang, C.-C. Methods of In-Process On-Machine Auto-Inspection of Dimensional Error and Auto-Compensation of Tool Wear for Precision Turning. Appl. Sci. 2016, 6, 107. [Google Scholar] [CrossRef] [Scilit]
- Koleva, S. Information Assurance of Accuracy in the Turning Process in Wide-Range Production; Mediatech: Pleven, Bulgaria, 2023. [Google Scholar]
- Chetrokov, I.; Georgiev, V.; Salapateva, S. Possibilities of Combined Adaptive Control Through Stabilization and Compensation of Force Deformations in CNC Machine Tools. In 9th International Congress «Machines, Technologies, Materials—MTM 2012», Proceedings; Scientific-Technical Union of Mechanical Engineering: Varna, Bulgaria, 2012; Volume 4, pp. 136–138. Available online: https://mtmcongress.com/proceedngs/2012/4/38.POTENTIALS%20OF%20THE%20COMBINED%20ADAPTIVE%20CONTROL%20THROUGH%20STABILIZING%20AND%20COMPENSATING%20THE%20ELASTIC%20DEFORMATION%20IN%20CNC%20MACHINE-TOOLS.pdf (accessed on 20 February 2023).
- Chetrokov, I. Simulation Model for Predicting the Effectiveness of Adaptive Control in Precision CNC Machine Tools. In Proceedings of the Union of Scientists, Varna, 2013. Available online: https://www1.tu-varna.bg/tu-varna/images/izdatelska_deinost/Spisanie_SU/Spisanie_SU_Tehn_nauki_2013.pdf (accessed on 20 February 2023).
- Aramesh, M.; Attia, M.H.; Kishawy, H.A.; Balazinski, M. Estimating the remaining useful tool life of worn tools under different cutting parameters: A survival life analysis during turning of titanium metal matrix composites (Ti-MMCs). CIRP J. Manuf. Sci. Technol. 2016, 12, 35–43. [Google Scholar] [CrossRef] [Scilit]
- Hosseinkhani, K.; Eu-Gene, N. A Unique Methodology for Tool Life Prediction in Machining; Department of Mechanical Engineering, McMaster University: Hamilton, ON, Canada, 2020. [Google Scholar]
- Qehaja, N.; Kyçyku, A. Tool Life Modeling Based on Cutting Parameters and Work Material Hardness in Turning Process; Faculty of Mechanical Engineering University of Prishtina: Prishtina, Kosovo, 2017; pp. 356–359. [Google Scholar]
- Zaloga, V.; Nagorny, V. Prediction of cutting tool life. J. Eng. Sci. 2014, 1, A1–A10. [Google Scholar]
- Ambhore, N.; Kamble, D.; Chinchanikar, S. Analysis of tool vibration and surface roughness with tool wear progression in hard turning: An experimental and statistical approach. J. Mech. Eng. Sci. 2020, 14, 6461–6472. [Google Scholar] [CrossRef] [Scilit]
- Amorim, H.J.; Neto, A.O.K. Study of the relationship between cutting speed, tool wear and machining forces in turning with carbide tool. Adv. Mater. Res. 2014, 902, 88–94. [Google Scholar] [CrossRef] [Scilit]
- Das, S.R.; Panda, A.; Dhupal, D. Experimental investigation of surface roughness, flank wear, chip morphology and cost estimation during machining of hardened AISI 4340 steel with coated carbide insert. Mech. Adv. Mater. Mod. Process. 2017, 3, 1–14. [Google Scholar] [CrossRef] [Scilit]
- Roslim, M.I.; Jamli, M.R.; Ismail, A.E.; Rahman, M.A. Experimental Analysis on Machining Properties in Turning of Nimonic C-263. Int. J. Eng. Trends Technol. (IJETT) 2022, 70, 144–153. [Google Scholar] [CrossRef] [Scilit]
- Souza, A.J.; Rosa, G.C. Tool-Life of Wiper and Standard Cutting Tool in Finish Turning of SAE 4140. In Advanced Materials Research; Trans Tech Publications: Zurich, Switzerland, 2014; Volume 845, pp. 760–764. [Google Scholar] [CrossRef] [Scilit]
- Salonitis, K.; Kolios, A. Reliability assessment of cutting tools life based on advanced approximation methods. In Procedia CIRP; Elsevier: Amsterdam, The Netherlands, 2013; Volume 8, pp. 397–402. [Google Scholar] [CrossRef] [Scilit]
- Biagiotti, R. The Time is Right for Cermets. 2023. Available online: https://www.ctemag.com/news/articles/time-right-cermets (accessed on 4 January 2023).
- Mitsubishi Catalog. 2024. Available online: https://view.publitas.com/mitsubishi-materials/catalog/page/1 (accessed on 31 March 2024).

Disclaimer/Publisher’s Note: The statements, opinions and data contained in all publications are solely those of the individual author(s) and contributor(s) and not of MDPI and/or the editor(s). MDPI and/or the editor(s) disclaim responsibility for any injury to people or property resulting from any ideas, methods, instructions or products referred to in the content. |
© 2026 by the author. Licensee MDPI, Basel, Switzerland. This article is an open access article distributed under the terms and conditions of the Creative Commons Attribution (CC BY) license.