


Abstract
This paper proposes a novel three-layered software architecture for processing and analyzing sequences, medical images, and patient-reported outcomes (PROs). The aim is to provide a comprehensive end-to-end solution for patient diagnosis by integrating all major types of bioinformatics data. This approach leverages advanced machine learning algorithms, including decision trees, support vector machines, neural networks, and quantum neural networks, to enhance the efficiency and effectiveness of precision medicine. A graphical user interface was constructed to validate the suggested approach and present the experimental results.
1. Introduction
This paper builds upon previous research in the field of bioinformatics, particularly in the context of precision medicine, whereby a diagnosis is based on the individual characteristics of each patient. To provide an accurate diagnosis or a lifetime risk assessment for a specific disease, precision medicine considers gene variability, the medical history of the family and of the patient, as well as lifestyle and medical examinations, which vary vastly in terms of the required specialized equipment and its output.
Combining all these requirements and data sources is expensive and time-consuming, requiring the expertise of multiple specialists. Therefore, developing algorithms and models that support the specialist’s decision-making is making precision medicine more accessible and affordable, allowing for better diagnosis, specialized lifestyle plans, improved rehabilitation and enhanced quality of life.
The three-layered architecture for the analysis and diagnosis of bioinformatics data proposed in this paper is a novel approach that encompasses the three main types of data for this purpose:
- Sequences: Obtained from DNA sequencing, this data type is crucial for predicting the lifetime risk of certain diseases and determining appropriate nutritional, lifestyle, and rehabilitation programs tailored to the patient.
- Medical Images: These are essential for visualizing the status of bones, organs, and neoplasms (both benign and malignant) within the body.
- Patient-Reported Outcomes (PROs): This data, provided by the patients themselves, typically in the form of questionnaires, offers insights into the patients’ health status from their perspective. There are different types of PROs, related to their quality of life, functional status, symptoms, health behaviors and feedback regarding medical care [1].
The proposed architecture leverages advanced machine learning algorithms, selected based on meta-studies to ensure the use of the most effective and flexible methods. For sequences, a new data preprocessing algorithm is introduced, which, based on experimental results, enhances the accuracy of the resulting models.
To demonstrate the efficacy of the proposed approach, a graphical user interface (GUI) from a previous study, called GRAY [2] is extended with new tools and algorithms, providing a comprehensive platform for bioinformatics data analysis and diagnosis.
2. Conceptual Model and Software Architecture
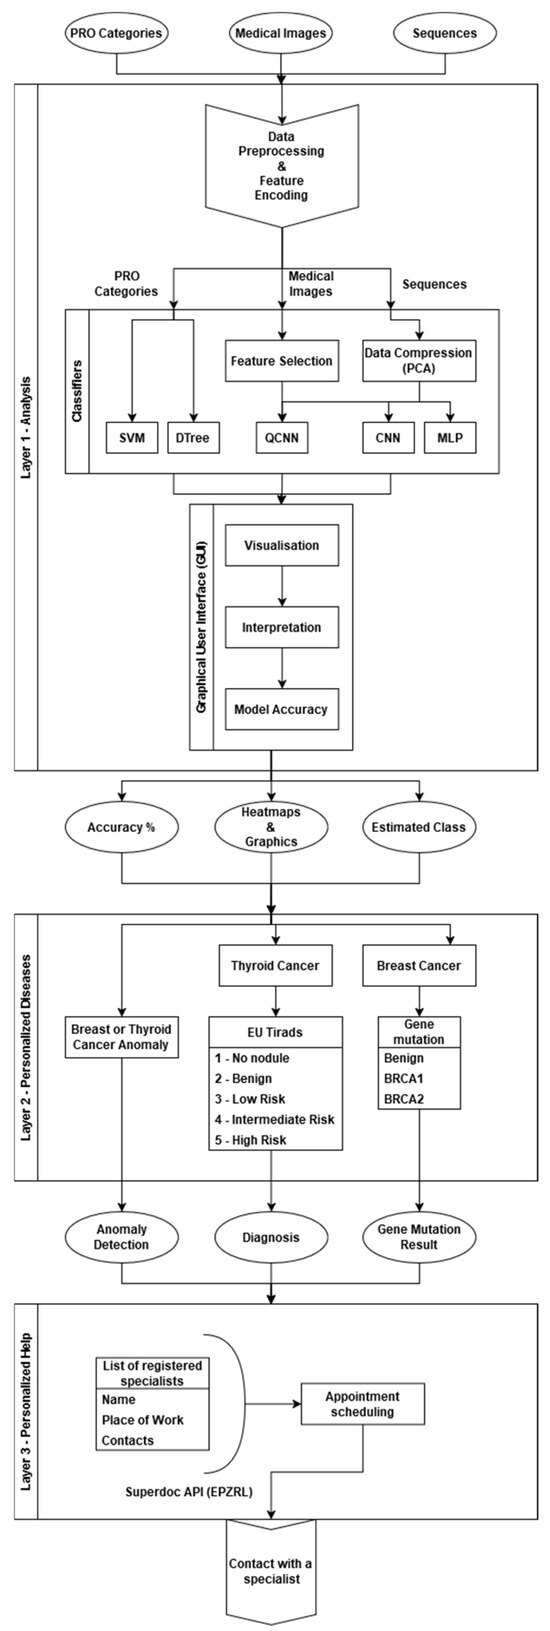
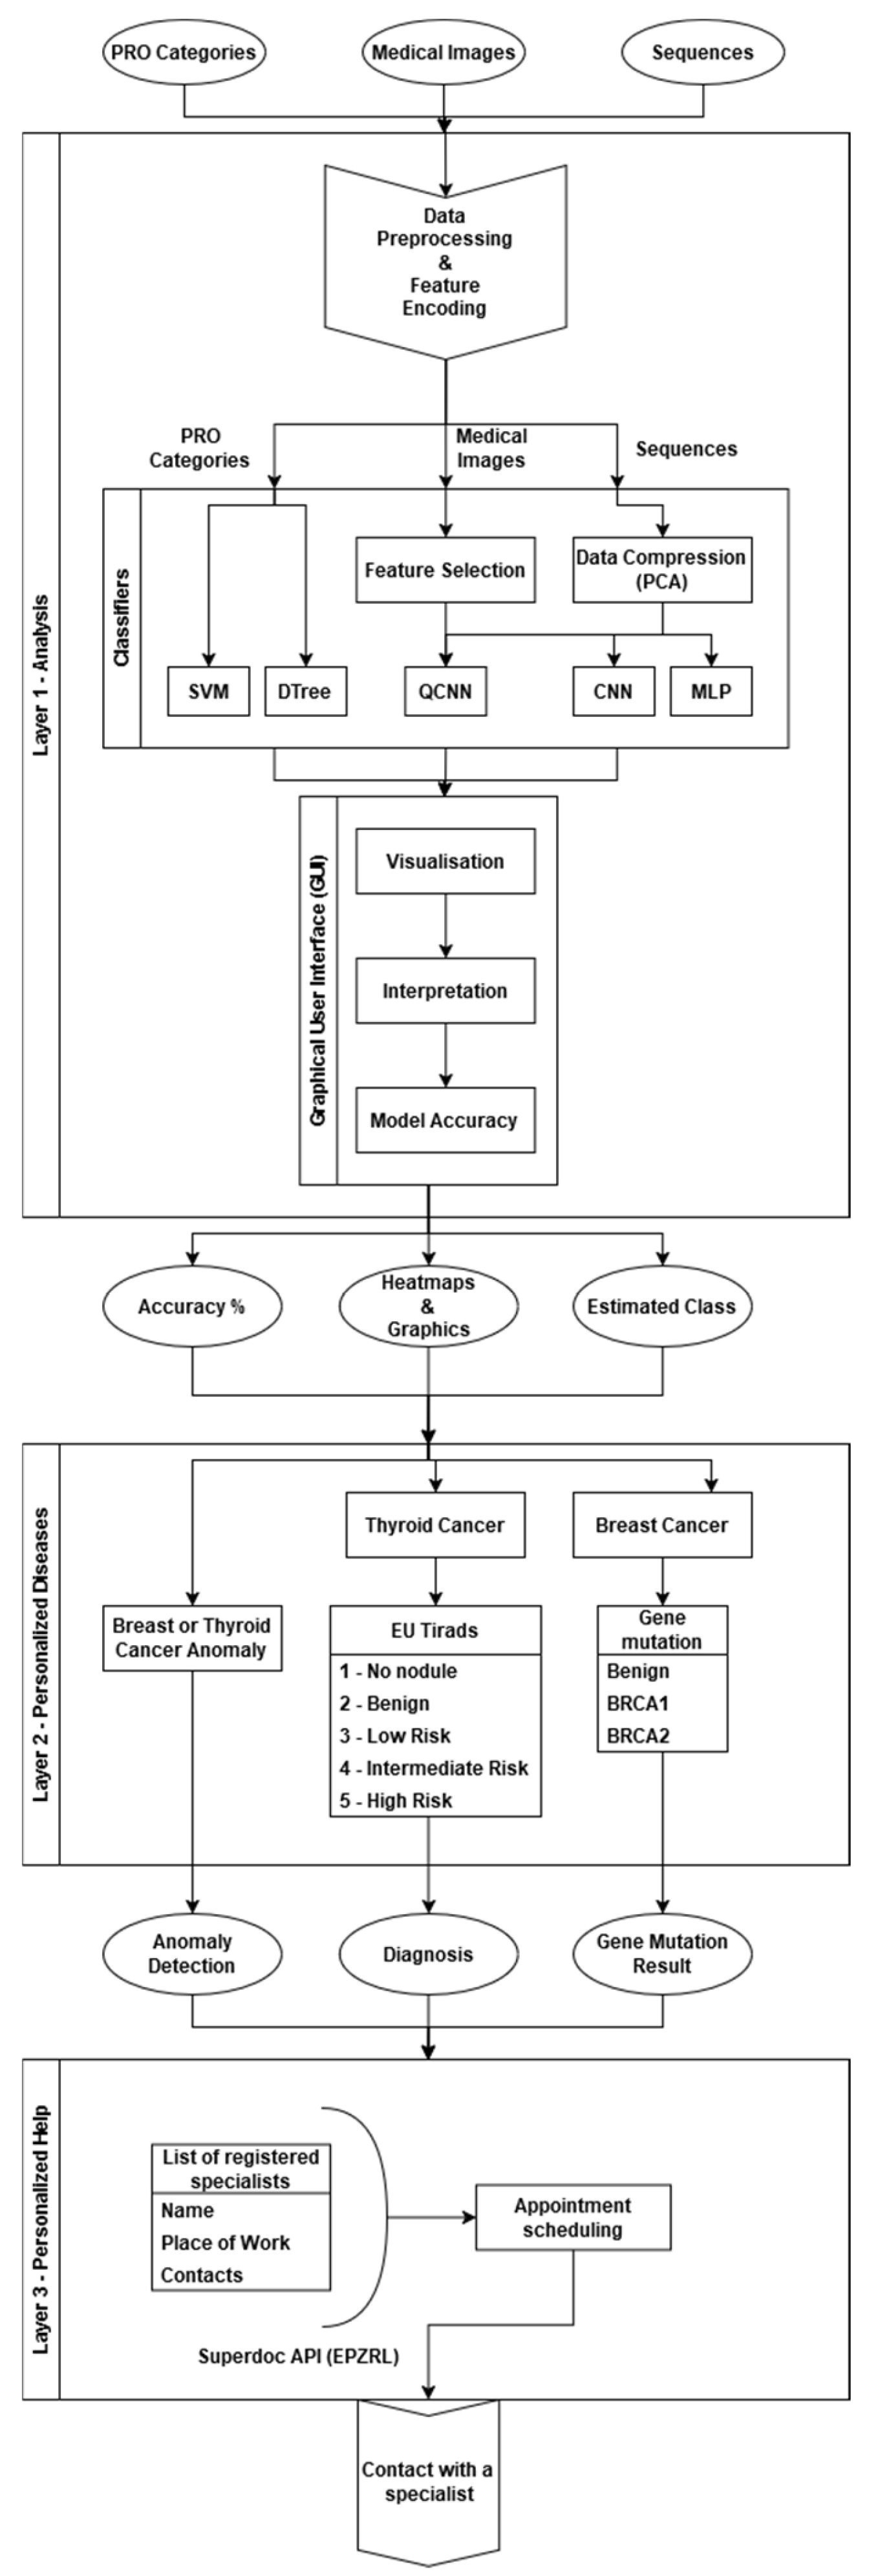
The proposed conceptual model is presented in Figure 1 below. The first layer of the architecture handles the three primary types of bioinformatics data—sequences, medical images, and patient-reported outcomes (PROs). This layer focuses on implementing the necessary algorithms and integrating them into a streamlined pipeline to optimize the accuracy of the trained models. Each data type is handled by its specific preprocessing and feature encoding algorithms before being processed by its best-performing classification algorithm. Optional steps, such as dimensionality reduction via PCA or manual and algorithmic feature selection, are also included.
Figure 1.
Three-layered architecture.
The selected algorithms—the Multilayered Perceptron (MLP), the Convolutional Neural Network (CNN), the Quantum Convolutional Neural Network (QCNN), the Decision Tree, and the Support Vector Machine (SVM)—were identified as the most effective for these types of data. In the graphical user interface (GRAY), each input can be assigned to any of these algorithms, although the optimal path is predetermined and set as a default. The details of this default path are explained further in this chapter.
When training a new model, the classifier block within the first layer generates a file containing the persisted trained model and utilizes the GRAY’s log window to provide feedback to the user. If the first layer is used as a classifier with either a pre-trained model or a user-created one, the output is the feedback on the analysis performed by the model. This final step of the pipeline in the first layer represents the three stages of user feedback:
- Visualization: Provides heatmaps, graphics, and images to visually represent the data.
- Interpretation: Delivers the classified result of the input data, which is used for diagnosis in the second layer.
- Model Accuracy: Displays the accuracy of the trained model both during training and classification, enabling the user to estimate the error margin of the given diagnosis.
The second layer focuses on specialized diseases with pre-trained models, utilizing the interpretation from the first layer to generate a diagnosis. The supported diseases include breast cancer, which covers lifetime risk assessment through PRO data, and the detection of gene mutations in the BRCA1 and BRCA2 genes to determine possible breast cancer predisposition. Additionally, for each of these diseases, the GUI will provide a diagnosis, which, in the case of thyroid cancer, specifies the exact stage of development.
The third layer is designed to connect patients with specialists based on the input data. For instance, if the input data is an image, the supported disease in layer two is thyroid nodule analysis according to the EU-TIRADS classification. If risk features are identified at this step, layer three will automatically select the necessary specialists for a second opinion, such as radiologists for image interpretation and endocrinologists for thyroid gland treatment. Specialist information is retrieved from a public API, which is limited to specific countries and requires adaptation for each location where the software is used.
For the software architecture and implementation of the conceptual model, Python 3.10 was chosen as the preferred language due to its robust support for state-of-the-art machine learning and statistical libraries, as well as lightweight, license-free GUI libraries built into Python, sharing the same version—3.10. This version was chosen due to compatibility concerns with the libraries described in the next paragraph. This choice ensures that the software remains cutting-edge and open source. The machine learning library of choice is TensorFlow, which offers several advantages, such as utilizing both CPU and GPU resources and enabling seamless operation across clusters of machines. This makes the experiments scalable and flexible for different sources of data.
The GUI from the referenced study [2] has been extended to incorporate the conceptual model presented in this paper. Additionally, the existing machine learning library has been upgraded from scikit-learn 1.9.0 to TensorFlow 2.7.0 as it offers access to the TensorFlow Quantum library 0.7.2. As noted in the study, the software architecture is modular. Each layer in Figure 1 represents a separate logical block functioning as an independent application. Communication between layers is managed through pre-defined input and output contracts. This modular design allows users to easily extend, upgrade, or replace individual layers, thereby enhancing the overall conceptual model.
Each logical block within the layers is implemented as a separate submodule of the main module (layer) it resides in. This modularity offers several benefits:
- Simplifies extension.
- Ensures the uninterrupted operation of each module and submodule.
- Provides the flexibility to alter the software architecture of individual modules, including the programming language and libraries used, while maintaining functionality.
Communication between modules adheres to a predetermined contract, ensuring consistent and reliable inter-module interactions. Data processing and classification according to the default pipeline path, which is the focus of the paper, is outlined per data type below.
- A.
- Sequences
For sequences, a novel algorithm for feature encoding is employed, utilizing a dictionary approach to map strings of five nucleotide bases to unique identifiers that remain consistent for all repeating strings. This innovative approach is detailed in a previous article, “Experimental Framework and Graphical User Interface for Research in Bioinformatics: GRAY—Gene Rapid Analysis” [2]. The cited article presents the initial version of the GUI, which focuses exclusively on sequences. The current version of the paper expands upon this by incorporating additional libraries and the conceptual model, whose results are presented in the next chapter.
The feature encoding algorithm is designed to be data-agnostic, which is its greatest advantage—its flexibility. Datasets are organized into folders with different classes or combined into a single file, allowing the user to specify to the GUI how many entries belong to each class from start to finish. The algorithm automatically splits and labels the data during feature encoding. For sequences of varying lengths, the algorithm’s first pass identifies the longest sequence, and all shorter sequences are padded with zeros at the end to ensure uniform length.
According to a meta-study on the effectiveness of various machine learning algorithms for the three main types of bioinformatics data—sequences, medical images, and PROs [3]—the most effective algorithms for sequences are deep learning models, particularly neural networks. Among these, the Multilayer Perceptron (MLP) and Convolutional Neural Network (CNN) provide the best average results in terms of accuracy. This forms the default sequence analysis pipeline. Additionally, before feeding the feature-encoded data into the MLP, the user has the choice to reduce dimensionality using Principal Component Analysis (PCA).
- B.
- Medical Images
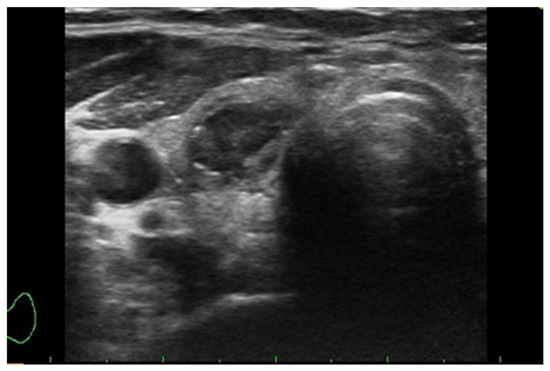
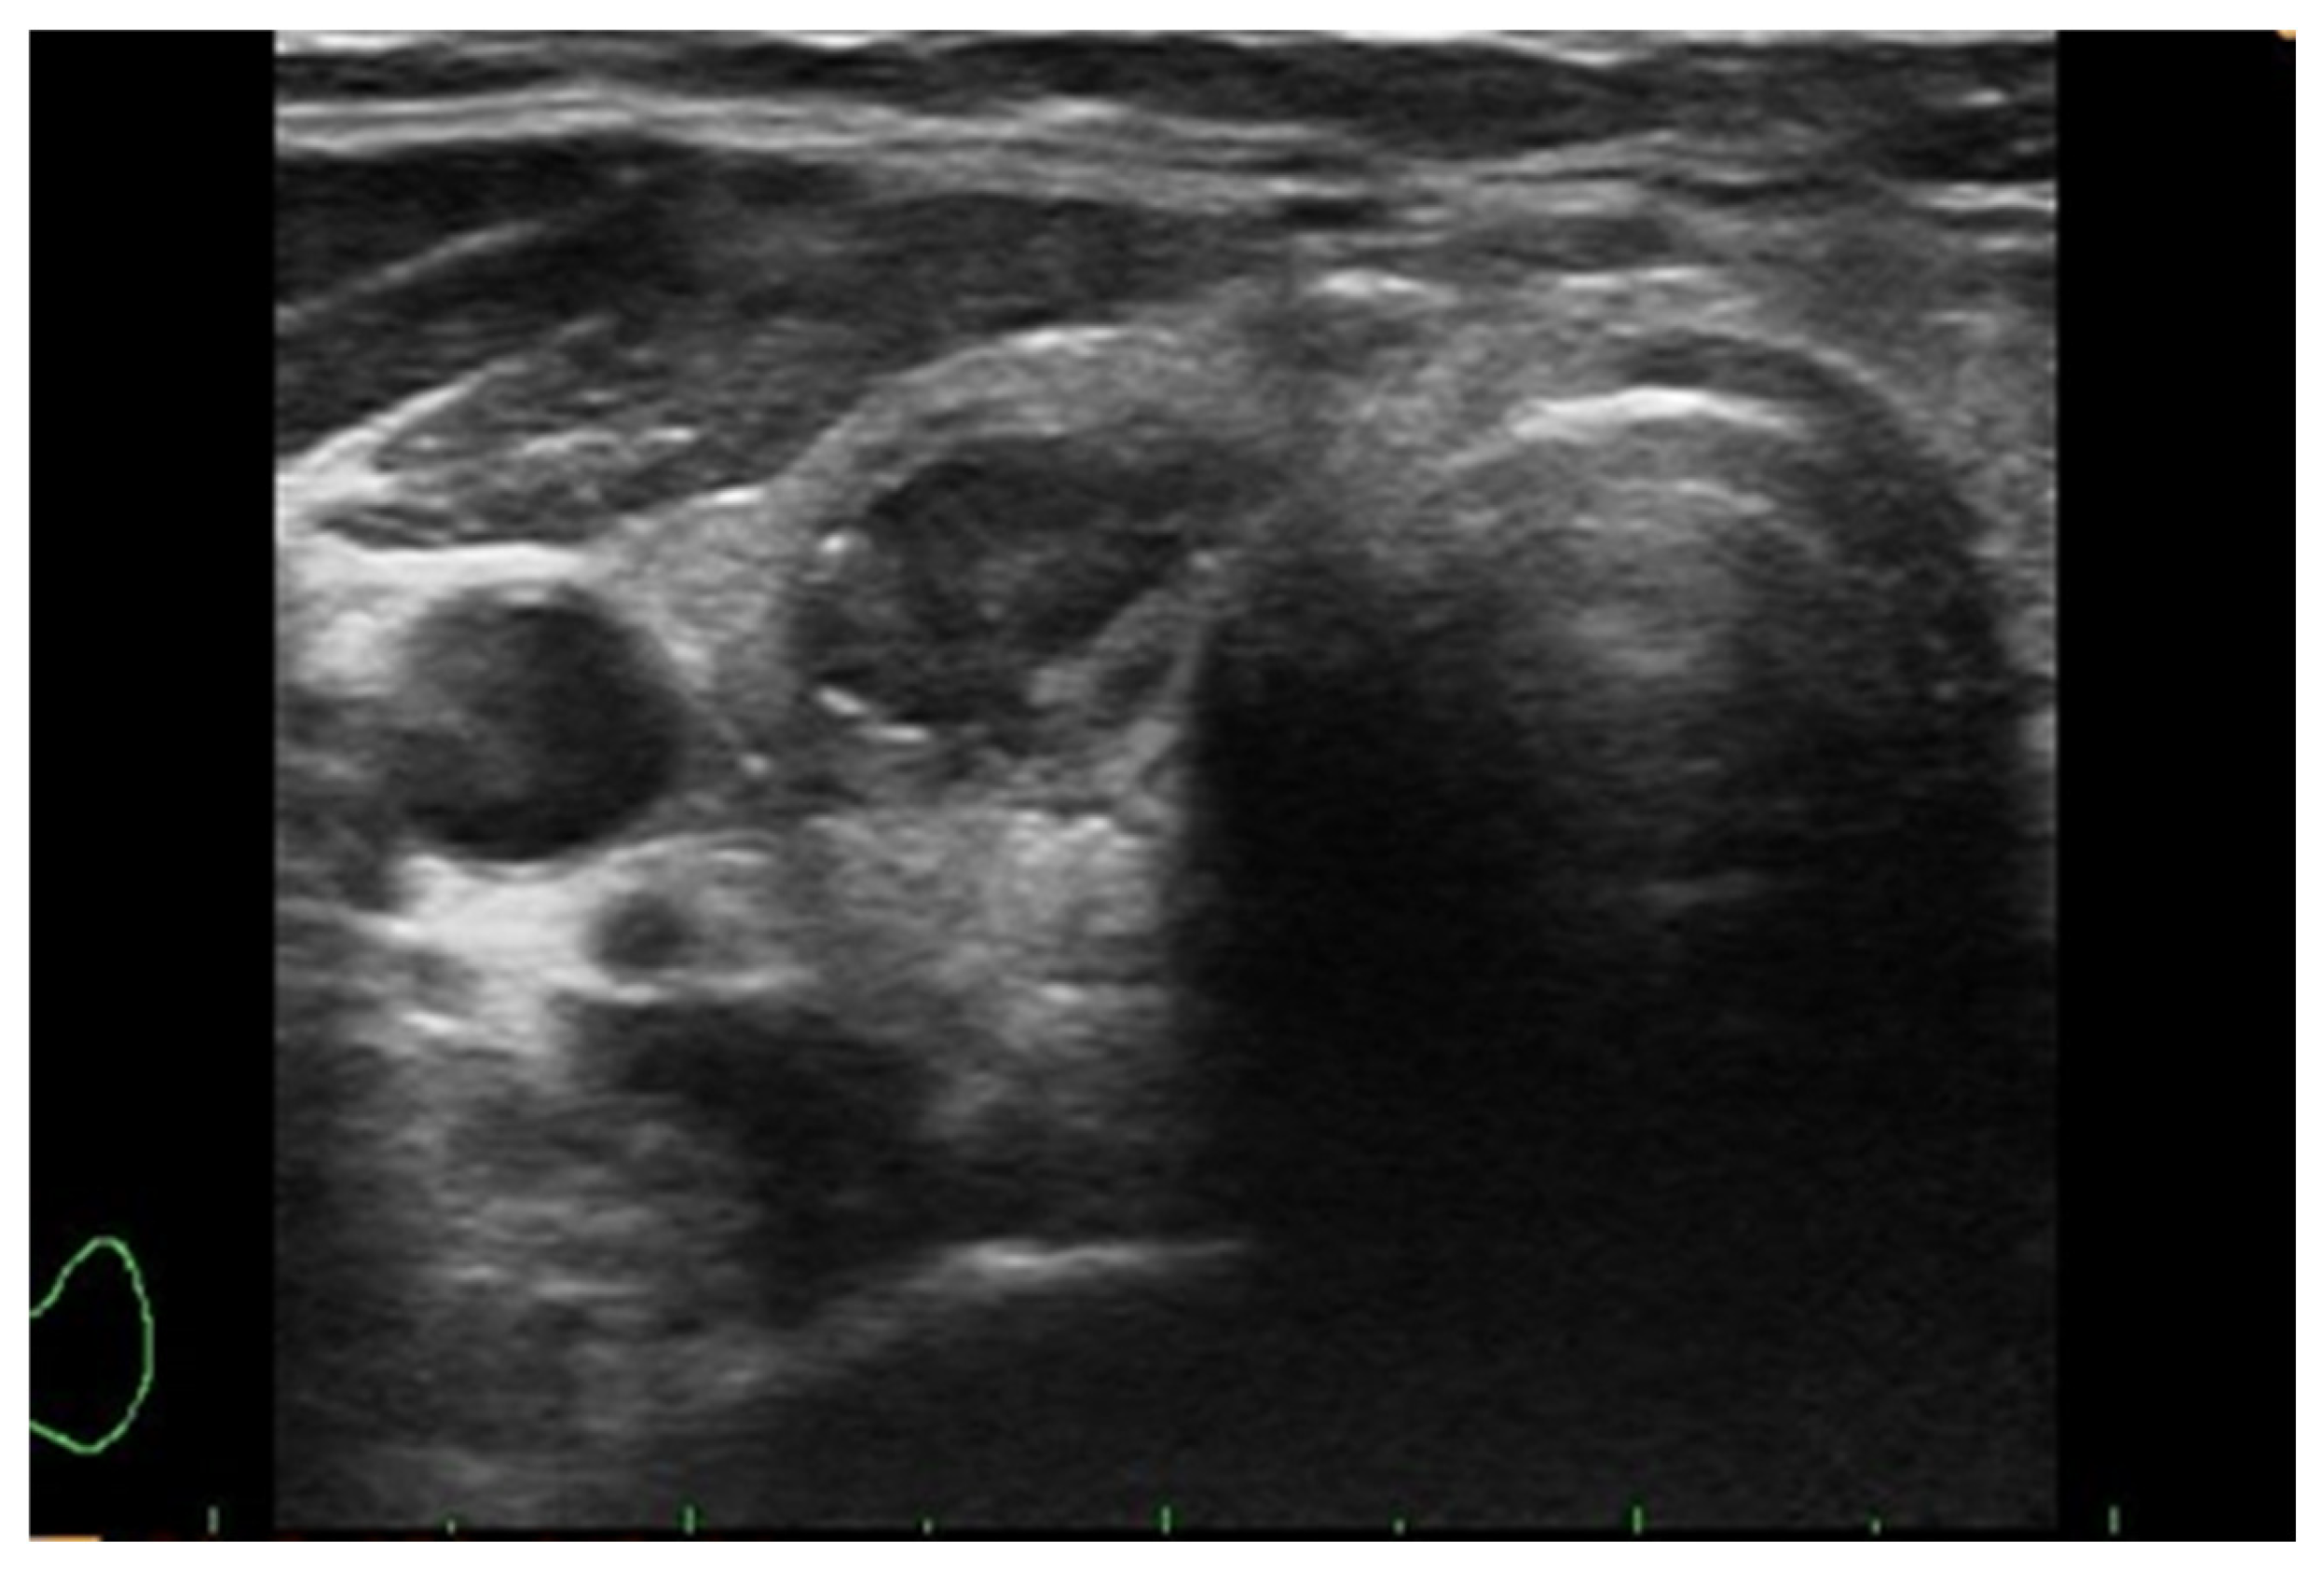
When it comes to medical images, this paper focuses on ultrasound images of the thyroid gland, split into the five EU-TIRADS classes. An example of a thyroid gland with a high-risk nodule is shown in Figure 2 below.
Figure 2.
Example ultrasound image for EU-TIRADS 5.
As is seen in the image, even after cropping the values from the ultrasound machine, there are artifacts in different colors. These training and test images for the purpose of the experiment were provided by actual patients. In the first step of the pipeline, the preprocessing algorithm normalizes and resizes the pixel values.
The input is an image with a size of 533 × 533 and 24-bit color depth. During preprocessing, the image is resized to 355 × 355, and the color depth is reduced to 8-bit grayscale. Afterward, the default and best-performing algorithm is CNN. An optional pipeline path uses the quantum variant of CNN—QCNN. This is an experimental approach, aiming to prove the future value of quantum algorithms in the field of bioinformatics and, more specifically, precision medicine. Medical images were chosen for this experiment since they have the highest dimensionality and require more neurons or in the case of QCNN, more qubits. To bypass this limitation, the conceptual model includes the neural networks utilized in the sequences as feature selection algorithms, forming a hybrid model with higher accuracy.
- C.
- Patient-Reported Outcomes (PROs)
Patient-reported outcomes have a straightforward feature encoding and preprocessing logic. PROs are obtained from questionnaires and contain multiple yes-or-no questions that are converted to Boolean values. For medical events of the patients themselves or their closely related family members, we have the choice of normalizing the year of the medical event or using those data within a range. In decision trees, which are among the best-performing algorithms for this data type, multiway splits are the standard for handling these types of data. The chosen way to deal with categorical data in the conceptual model is ordinal encoding.
3. Graphical User Interface and Experimental Results
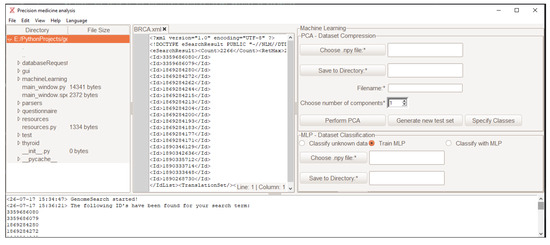
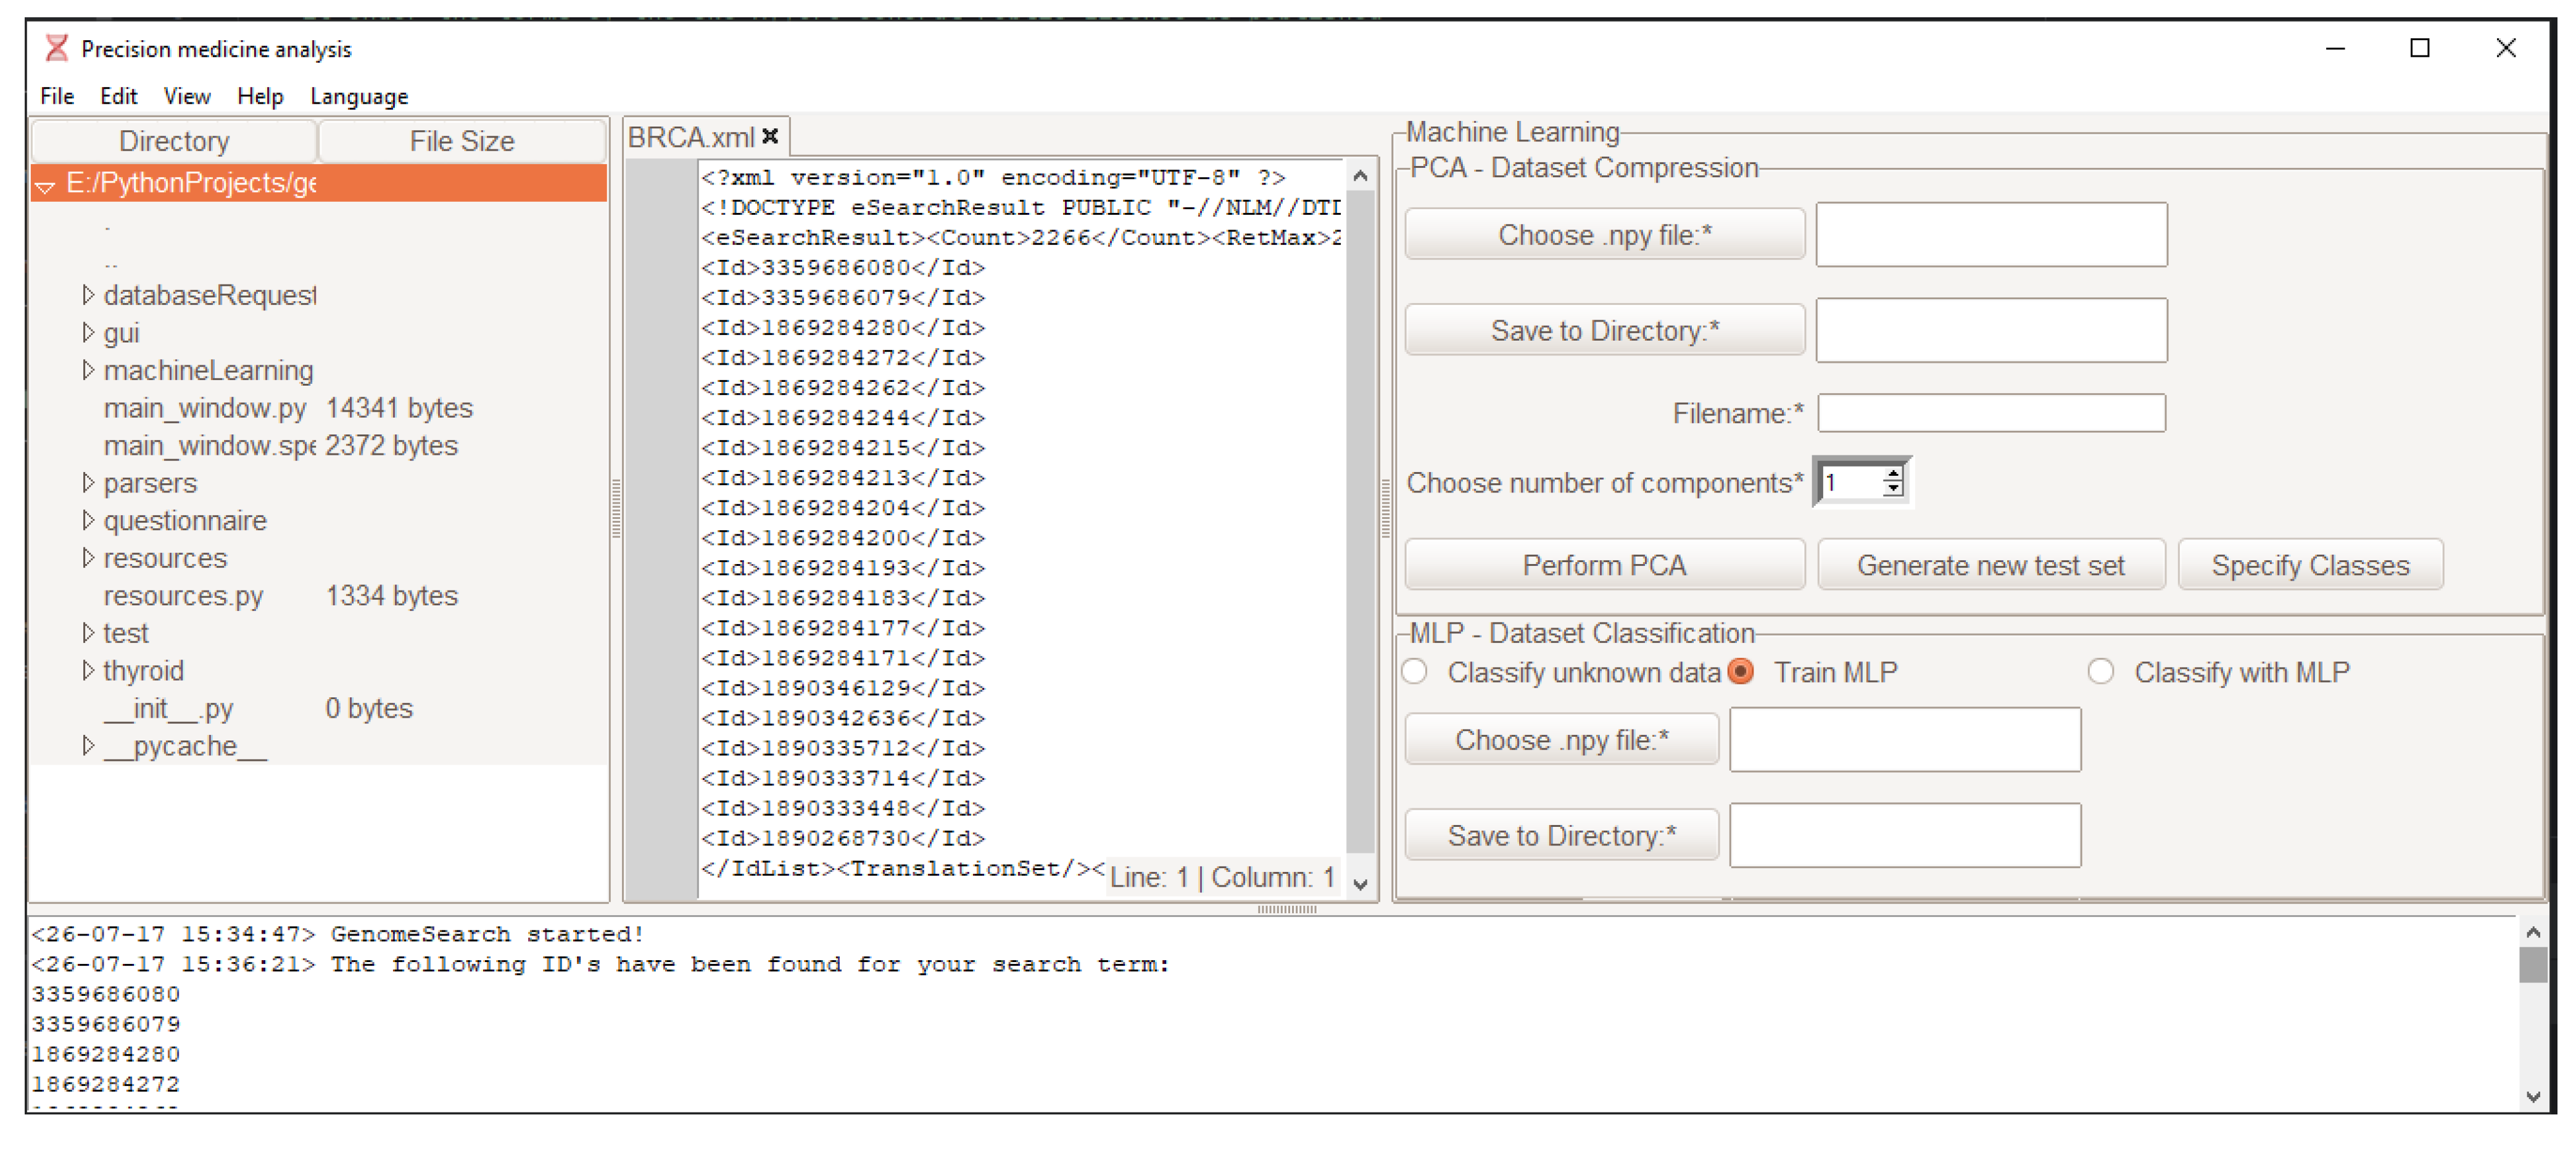
The resulting GUI for testing and providing a stable test environment, as well as a future product that will be utilized by specialists and patients, is shown in Figure 3, below.
Figure 3.
GUI—Main screen.
- A.
- GRAY
The main screen of the interface is divided into four sections. The top-left section features a folder explorer that allows users to select the necessary dataset files, which are then opened in the central section for aggregation and preparation. The third and final section on the right houses the machine learning algorithms, with pop-up menus for adjusting the default settings outlined in this paper, and options to switch between different algorithms. The software also includes pre-trained models from the experimental phase of the study.
The bottom section of the main screen serves as a feedback area for the user. This log section displays error messages, algorithm accuracy, and model settings, and it provides the diagnosis generated from the second layer of the conceptual model. Visualizations, such as heatmaps and diagrams, are accessible through pop-up menus after classification with the trained models.
Additional menus offer access to public databases via the public Entrez API, allowing users to search for and download datasets.
- B.
- Experimental Results
Sequences are the first target of research, utilizing the first version of GRAY. The experiments in the previous study [2] show that the conceptual model must use an MLP with the Adam optimization algorithm for backpropagation and the ReLU activation function to achieve high accuracy results. To avoid overfitting, GRAY offers the following options:
- Introduction of noise for regularization
- Early stopping
- Random dropout layers—used with medical images
Default settings include the overfitting protection mentioned above. With overfitting protection, when examining the BRCA1 and BRCA2 genes for mutations to predict breast cancer, the best accuracy is 98%, as was seen in the previous study. The addition from the experiments in this paper for sequences is the introduction of TensorFlow, which reduces the time for training and validation, as well as the determination of the default settings and algorithms for the conceptual model. These experiments are easy to verify with GRAY, because of the custom settings of the GUI that allow the user to choose from the different activation functions available, such as ReLU, Sigmoid and Tanh, change the backpropagation optimization algorithm from Adam to stochastic gradient descent or limited-memory BFGS, customize the overfitting values, and specify how many layers and neurons per layer are necessary.
For the ultrasound images, there have been two options—use a CNN or a hybrid version, combining both neural networks and a quantum neural network—QCNN. In the current state of quantum computing, especially with the limitations of the study, having no access to a real quantum computer, a hybrid approach serves a better purpose as a proof of concept, as hybrid models are more likely to outperform quantum-classical quantum neural networks [4]. For the standard approach, using random dropout layers, in addition to the other overfitting methods that the sequences use, the CNN gives an accuracy of 84%. As in the case of the sequences, the layers are customizable. In this case, the user chooses as many layers as necessary from the available—Convolutional, MaxPooling, Batch normalization, Gaussian Noise, Dropout and Dense. The trained model achieved the highest possible accuracy with the configuration mentioned in the cited study for classifying EU-TIRADS nodules [5].
Utilizing quantum algorithms without a quantum computer is done via simulation, available through TensorFlow Quantum 0.7.2 and libraries like Cirq 1.1.0, described in multiple papers [6]. In addition, quantum algorithms have the ability to improve the time, energy consumption, and costs for training and classifying data. Bioinformatics data has already been fed into quantum algorithms, showing significant potential [6]. Some of the already existing articles in the field of quantum computing were used in the creation of the framework [7,8]. For the quantum variant of the classification, the available qubits via TensorFlow and Cirq are 12. Utilizing more than 12 qubits leads to memory issues when using a single machine and the software limitation of those libraries is 16 qubits in total. This means that a total of 4096 pixels are processed or a 64 × 64 image. Since the image size from the preprocessing algorithm in the first layer is 355 × 355, different feature selection algorithms are used to further reduce the dimensionality. The best-performing feature selection algorithm was CNN, leading to the decision of using a hybrid model. Without the feature selection algorithm, the accuracy for the QCNN is as low as 18%. Feeding the custom images from the CNN with only the most interesting features led to an increase of 72% in accuracy, totaling 90% accuracy for the hybrid approach. Further tests need to be performed with machine clusters, utilizing TensorFlow’s resource management.
To prove that a QCNN algorithm has the ability to handle classification tasks, when the problem with the dimensionality is solved, QCNNs have the potential to reduce time, power consumption, and overall costs, which is the reason for exploring the value of such algorithms in the field of bioinformatics.
The PROs’ classification functions similarly to other breast cancer risk calculators, e.g., Claus and Gail. These already established calculators have been described and proven to be highly functional in several papers that have revisited this approach in recent years [9,10,11]. However, this study attempts to use the same layout of the dataset used in the aforementioned papers while utilizing the proposed algorithms from the architectural design. The upside to such an approach is one of the main goals of architecture: to create a solution that can be trained on different types of data and is flexible so that it can be extended to the prediction of other diseases or PRO-related data. The dataset is taken from the breast cancer surveillance consortium. Based on their documentation, the data is described in Table 1, below.
Table 1.
Description of the Breast Cancer Surveillance Consortium dataset.
After multiple tests using SVM and Decision Tree algorithms, where the configuration for each model was done on a trial-and-error basis, the best accuracy achieved was 87.7% for the Decision Tree and 84% for the SVM. Similar average results are noted from the cited studies in the referenced meta-study [3] proving the potential of these algorithms on PRO data, hence their inclusion in the architecture for this third type of data in the field of precision medicine.
4. Conclusions and Future Work
This paper presents a comprehensive three-layered architecture for analyzing and diagnosing bioinformatics data, leveraging both classical and quantum machine learning algorithms to enhance precision medicine. The proposed approach integrates sequences, medical images, and PROs, providing a flexible and effective solution for patient diagnosis. The incorporation of quantum algorithms, despite current limitations, shows significant potential for future advancements in bioinformatics. In general, quantum algorithms have the potential to significantly reduce the time, cost and energy needed to train a model and use it for classification. Energy and cost limitations are significant roadblocks to existing machine learning algorithms, especially when they are applied to the field of bioinformatics, where each data type has high dimensionality.
This paper proves that if a quantum algorithm has access to enough qubits or has the dimensionality of the data reduced far enough, in accordance with the qubits in use, the QCNN reaches similar accuracy results to its non-quantum alternatives. Outside of the field of precision medicine, protein folding is another example of a costly but critical task that benefits from the use of quantum algorithms.
The provided GUI, used in the experiments and as an alpha version of the product aimed at specialists and patients in the field of precision medicine, demonstrates the value of the proposed conceptual model. This model consists of three layers:
- The first layer handles feature encoding, data preprocessing, machine learning models, and visualization tools.
- The second layer focuses on specialized diseases as outlined in the research papers, providing a disease-specific diagnosis for breast and thyroid cancer, as well as lifetime risk calculation for breast cancer. This is done through the experimental part of the studies that provide a pre-trained classification model for the GRAY 2.0 software.
- The third layer connects the specific diagnosis from the second layer to a qualified specialist who can offer a second opinion, validate the diagnosis, and provide treatment.
The algorithms incorporated are based on meta-studies, selecting the best-performing algorithms for the given data types—sequences, medical images, and PROs. Further experiments were conducted to fine-tune these algorithms, allowing the GRAY 2.0 software to be bundled with pre-trained models. Additionally, the study introduces a novel feature encoding algorithm for sequences, which further enhances diagnostic accuracy.
Future work will focus on expanding the architecture to support more diseases and refining the quantum algorithms to improve accuracy and efficiency. Collaboration with other research and healthcare institutions, along with advancements in quantum computing hardware and software will further enhance the capabilities of this innovative approach, driving the evolution of precision medicine.
Given the open-source nature and modular software architecture of GRAY, with its contract-based inter-modular communication, the software is highly adaptable. Enhancements, add-ons, and new features can be developed using different languages and technologies, and the platform can be easily adapted for either desktop or web applications.
Author Contributions
Conceptualization, D.I. and B.N.; methodology, D.I.; software, B.N.; validation, D.I. and B.N.; formal analysis, D.I. and B.N.; investigation, B.N.; resources, D.I.; data curation, D.I. and B.N. (publicly available data); writing—original draft preparation, B.N.; writing—review and editing, D.I. and B.N.; visualization, B.N.; supervision, D.I.; project administration, D.I.; funding acquisition, D.I. (no external funding). All authors have read and agreed to the published version of the manuscript.
Funding
This research received no external funding.
Institutional Review Board Statement
Not applicable.
Informed Consent Statement
Not applicable.
Data Availability Statement
All datasets, including the open source code for all versions of GRAY are available under: https://gitlab.com/BorisNen/bioquant/ (accessed on 25 November 2025) and https://gitlab.com/BorisNen/genomesearch (accessed on 25 November 2025).
Conflicts of Interest
The authors declare no conflict of interest.
References
- Cella, D.; Hahn, E.A.; Jensen, S.E.; Butt, Z.; Nowinski, C.J.; Rothrock, N.; Lohr, K.N. Patient-Reported Outcomes in Performance Measurement; Types of Patient-Reported Outcomes; RTI Press: Research Triangle Park, NC, USA, 2015. Available online: https://www.ncbi.nlm.nih.gov/books/NBK424381/ (accessed on 25 November 2025).
- Ivanova, D.; Nenchovski, B. Experimental Framework and Graphical User Interface for Research in Bioinformatics: GRAY—Gene Rapid Analysis. In 2020 International Conference on Information Technologies (InfoTech); IEEE: Bulgaria, Varna, 2020; pp. 1–4. [Google Scholar] [CrossRef] [Scilit]
- Nenchovski, B.A.; Ivanova, D. Big data bioinformatics discoveries: Machine learning approaches, tools, and perspectives. In AIP Conference Proceedings; AIP Publishing LLC.: Melville, NY, USA, 2023; p. 020006. [Google Scholar] [CrossRef] [Scilit]
- Arthur, D.; Date, P. A Hybrid Quantum-Classical Neural Network Architecture for Binary Classification. arXiv 2022. [Google Scholar] [CrossRef] [Scilit]
- Ivanova, D.; Staeva, J.; Shinkov, A.; Kovacheva, R. Intelligent EU-TIRADS classificator for early detection of thyroid anomalies using deep learning convolutional neural network. In AIP Conference Proceedings; AIP Publishing LLC.: Melville, NY, USA, 2023; Volume 2939, p. 020007. [Google Scholar] [CrossRef] [Scilit]
- Broughton, M.; Verdon, G.; McCourt, T.; Martinez, A.J.; Yoo, J.H.; Isakov, S.V.; Massey, P.; Halavati, R.; Niu, M.Y.; Zlokapa, A.; et al. TensorFlow Quantum: A Software Framework for Quantum Machine Learning. arXiv 2021. [Google Scholar] [CrossRef] [Scilit]
- Divya, B.; Ravi, K. Quantum Computing-Applications in Bioinformatics. Int. J. Comput. Appl. 2019, 177, 26–28. [Google Scholar] [CrossRef] [Scilit]
- Parkinson, J.B.; Farnell, D.J. An Introduction to Quantum Spin Systems; Springer: Berlin/Heidelberg, Germany, 2010. [Google Scholar] [CrossRef] [Scilit]
- Bener, A.; Barışık, C.C.; Acar, A.; Özdenkaya, Y. Assessment of the Gail Model in Estimating the Risk of Breast Cancer: Effect of Cancer Worry and Risk in Healthy Women. Asian Pac. J. Cancer Prev. 2019, 20, 1765–1771. [Google Scholar] [CrossRef] [Scilit] [PubMed]
- Kim, G.; Bahl, M. Assessing Risk of Breast Cancer: A Review of Risk Prediction Models. J. Breast Imaging 2021, 3, 144–155. [Google Scholar] [CrossRef] [Scilit] [PubMed]
- Seyednoori, T.; Pakseresht, S.; Roushan, Z. Risk of developing breast cancer by utilizing Gail model. Women Health 2012, 52, 391–402. [Google Scholar] [CrossRef] [Scilit] [PubMed]

Disclaimer/Publisher’s Note: The statements, opinions and data contained in all publications are solely those of the individual author(s) and contributor(s) and not of MDPI and/or the editor(s). MDPI and/or the editor(s) disclaim responsibility for any injury to people or property resulting from any ideas, methods, instructions or products referred to in the content. |
© 2026 by the authors. Licensee MDPI, Basel, Switzerland. This article is an open access article distributed under the terms and conditions of the Creative Commons Attribution (CC BY) license.