


Abstract
This paper presents a methodology for the comparative analysis of invasive electromyographic (iEMG) signals based on motor unit action potential (MUAP) extraction and characterization. The approach includes preprocessing, automatic MUAP detection, waveform segmentation, feature extraction, and statistical comparison. Three iEMG categories—healthy, myopathic, and neuropathic—were analyzed in LabVIEW. Extracted features include amplitude, active duration, number of zero-crossings, and symmetry ratio. Results reveal clear distinctions between normal and pathological signals, supporting the methodology’s relevance for neuromuscular investigation. The study focuses on signal analysis and interpretation, with automatic classification reserved for future work.
Keywords:
EMG; MUAP; signal analysis; LabVIEW; wavelet denoising; peak detection; myopathy; neuropathy; invasive EMG 1. Introduction
Electromyographic (EMG) signals reflect muscle fiber activity and are widely used for assessing neuromuscular function [1,2]. They result from the superposition of motor unit action potentials, capturing both normal physiology and pathological alterations [3], and are valuable in diagnosis, monitoring, rehabilitation, and research [4,5,6]. Direct interpretation of raw EMG is challenging due to its stochastic, non-stationary nature and high inter-subject variability [7]. Signal morphology is influenced by needle electrode placement, contraction type, tissue composition, and experimental noise [8], while motion artifacts and power line interference can obscure meaningful activity [9]. Reliable analysis requires preprocessing, segmentation, and characterization of elementary components [10]. Decomposition into motor unit action potentials (MUAPs) isolates individual motor unit activity and provides physiologically interpretable descriptors for comparing healthy and pathological signals [11,12,13]. Wavelet-based processing is effective for EMG due to its transient nature, providing time–frequency localization for denoising while preserving MUAP morphology [14,15,16]. Daubechies wavelets are preferred for their compact support, resembling typical MUAP shapes [17]. This study proposes a comparative framework for EMG analysis, including wavelet denoising, automatic MUAP detection, feature extraction, and statistical evaluation, implemented entirely in LabVIEW [18]. The focus is on signal processing and interpretation, with automatic classification reserved for future work.
2. Materials and Methods
EMG Data and Processing Workflow
The study considered three categories of invasive EMG (iEMG) signals- healthy, myopathic, and neuropathic- sourced from the publicly available PhysioNet database [19]. These signals were collected using a 25 mm concentric needle electrode placed into the tibialis anterior muscle of each subject. The signals were originally recorded at 50 KHz and then downsampled to 4 KHz, with analog filtering (20 Hz high-pass, 5 KHz low-pass) applied during acquisition. Signals were stored as text files and processed offline in LabVIEW, converting raw samples into numerical arrays and waveform representations, with visualization via Waveform Graph indicators [11].
A uniform processing pipeline was applied to all categories to enable reliable comparison, focusing on the extraction and evaluation of MUAP features, recognized as key descriptors of neuromuscular function [10,18].
The workflow comprises four main stages: signal import, wavelet-based denoising, automatic detection of significant peaks for MUAP extraction within fixed windows, and computation of morphological features followed by comparative statistical analysis. This structured approach ensures methodological consistency and aligns with established EMG processing frameworks [6,11].
3. EMG Signal Preprocessing
Wavelet Denoising
Preprocessing was based on wavelet denoising, suitable for the non-stationary nature of EMG signals and short-duration MUAP events that must be preserved [8,14]. Unlike conventional filters, wavelet transforms provide time–frequency localization, enabling noise reduction while maintaining waveform morphology [12].
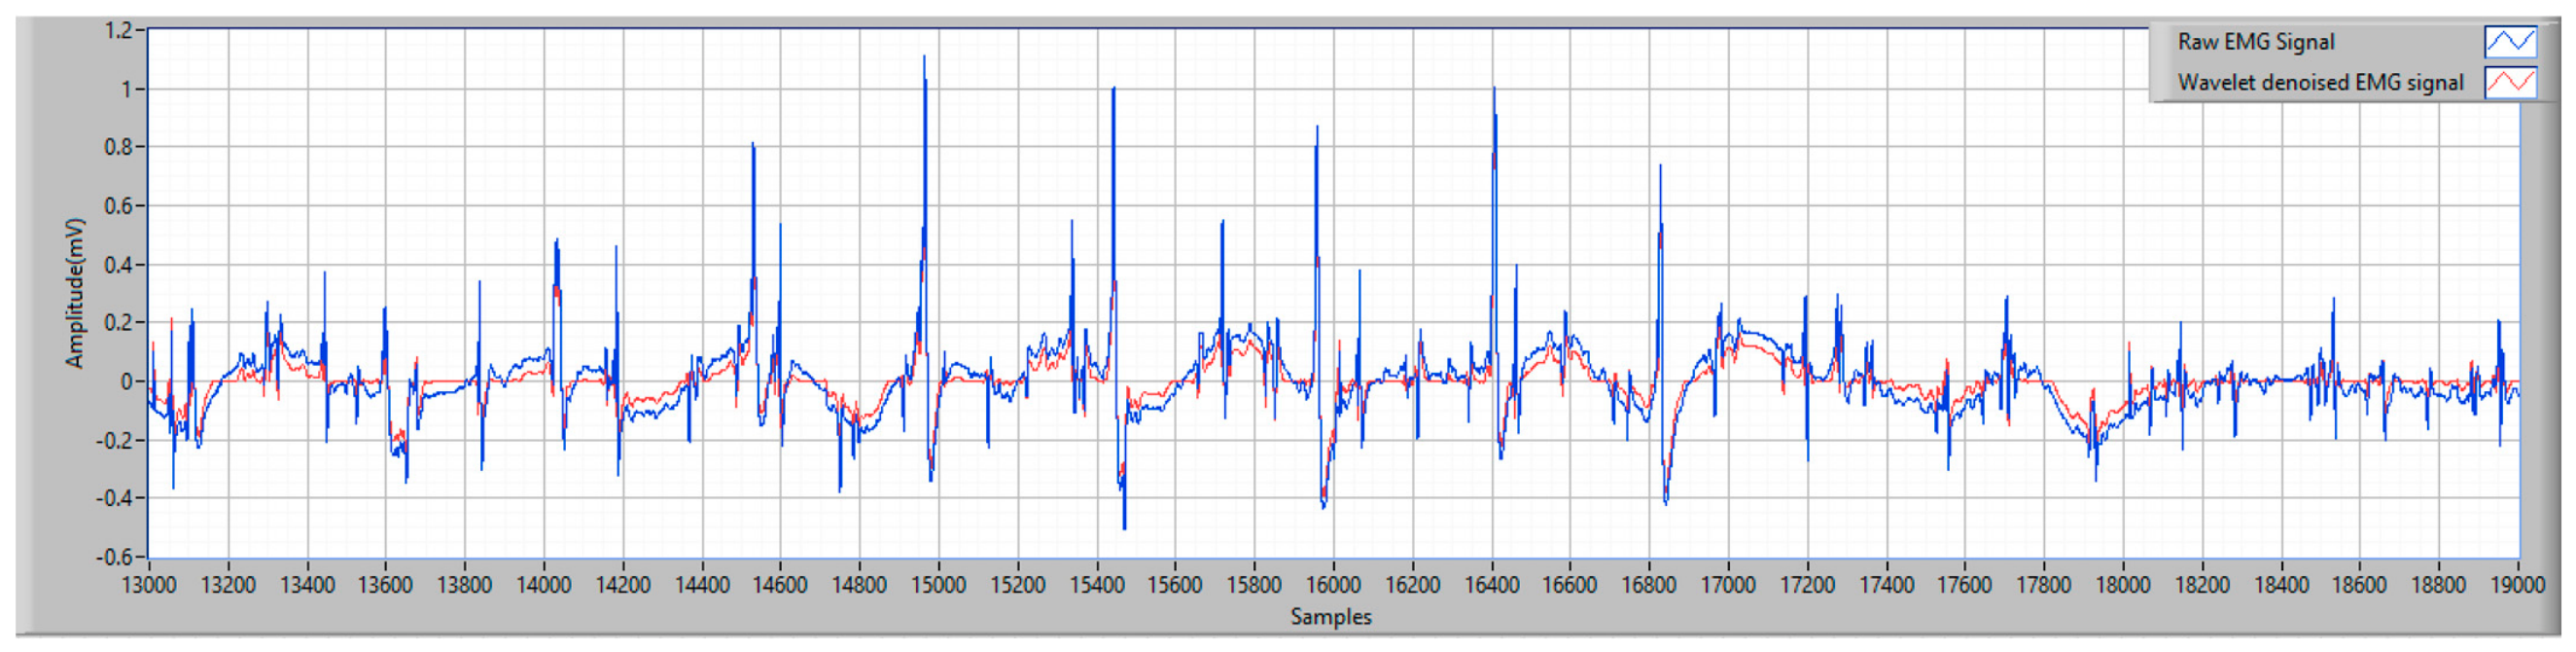
Denoising was implemented in LabVIEW using a Daubechies db4 wavelet at decomposition level three, with soft-thresholding based on Stein’s Unbiased Risk Estimate (SURE) [17]. Representative time windows illustrate the local effects on signal morphology, achieving a balance between noise attenuation and preservation of relevant features [6].
The denoised signals (Figure 1) improved visibility of waveform components, facilitating more reliable MUAP peak detection for further analysis [13].
Figure 1.
Comparison between raw and wavelet-denoised EMG signal segments for the healthy EMG signal category.
4. MUAP Detection and Extraction
4.1. Peak Detection
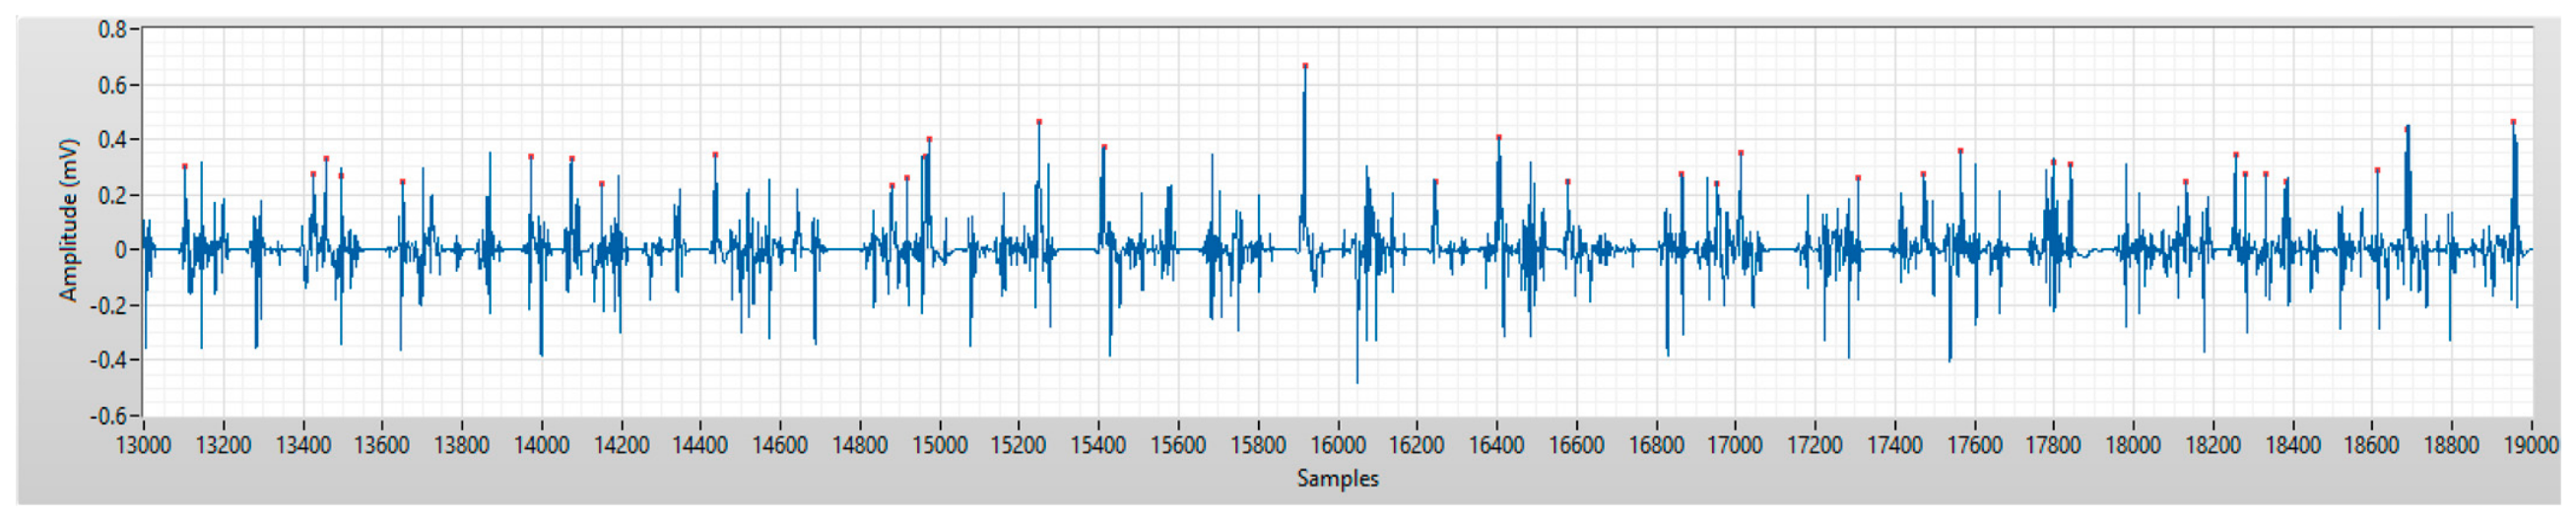
Automatic MUAP detection was performed by identifying significant peaks in the wavelet-denoised EMG signal. An adaptive threshold was defined as a multiple of the standard deviation of the processed signal (threshold = k·σ), where k was selected in the range of 3 to 4. In the present implementation, a value of 3σ was used, allowing the retention of waveform events that clearly exceed the background variation level of the signal, consistent with common EMG detection strategies [11,13].
To prevent multiple detections of the same event, a minimum distance of approximately 20 samples was imposed between consecutive peaks. The detected peaks were visually marked in the LabVIEW interface and used as reference points for MUAP extraction (Figure 2). This approach enables reliable localization of motor unit activity in noisy EMG environments [18].
Figure 2.
Automatic peak detection in the wavelet-denoised myopathic EMG signal used for MUAP localization.
4.2. MUAP Extraction
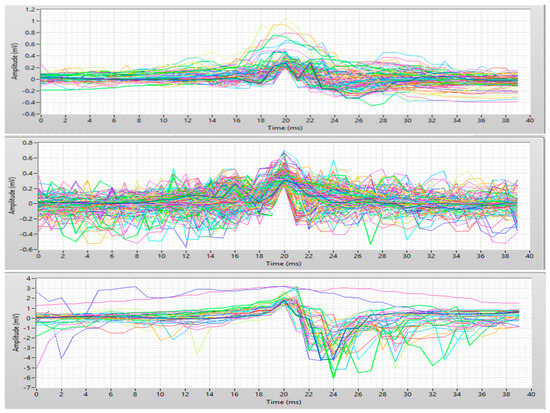
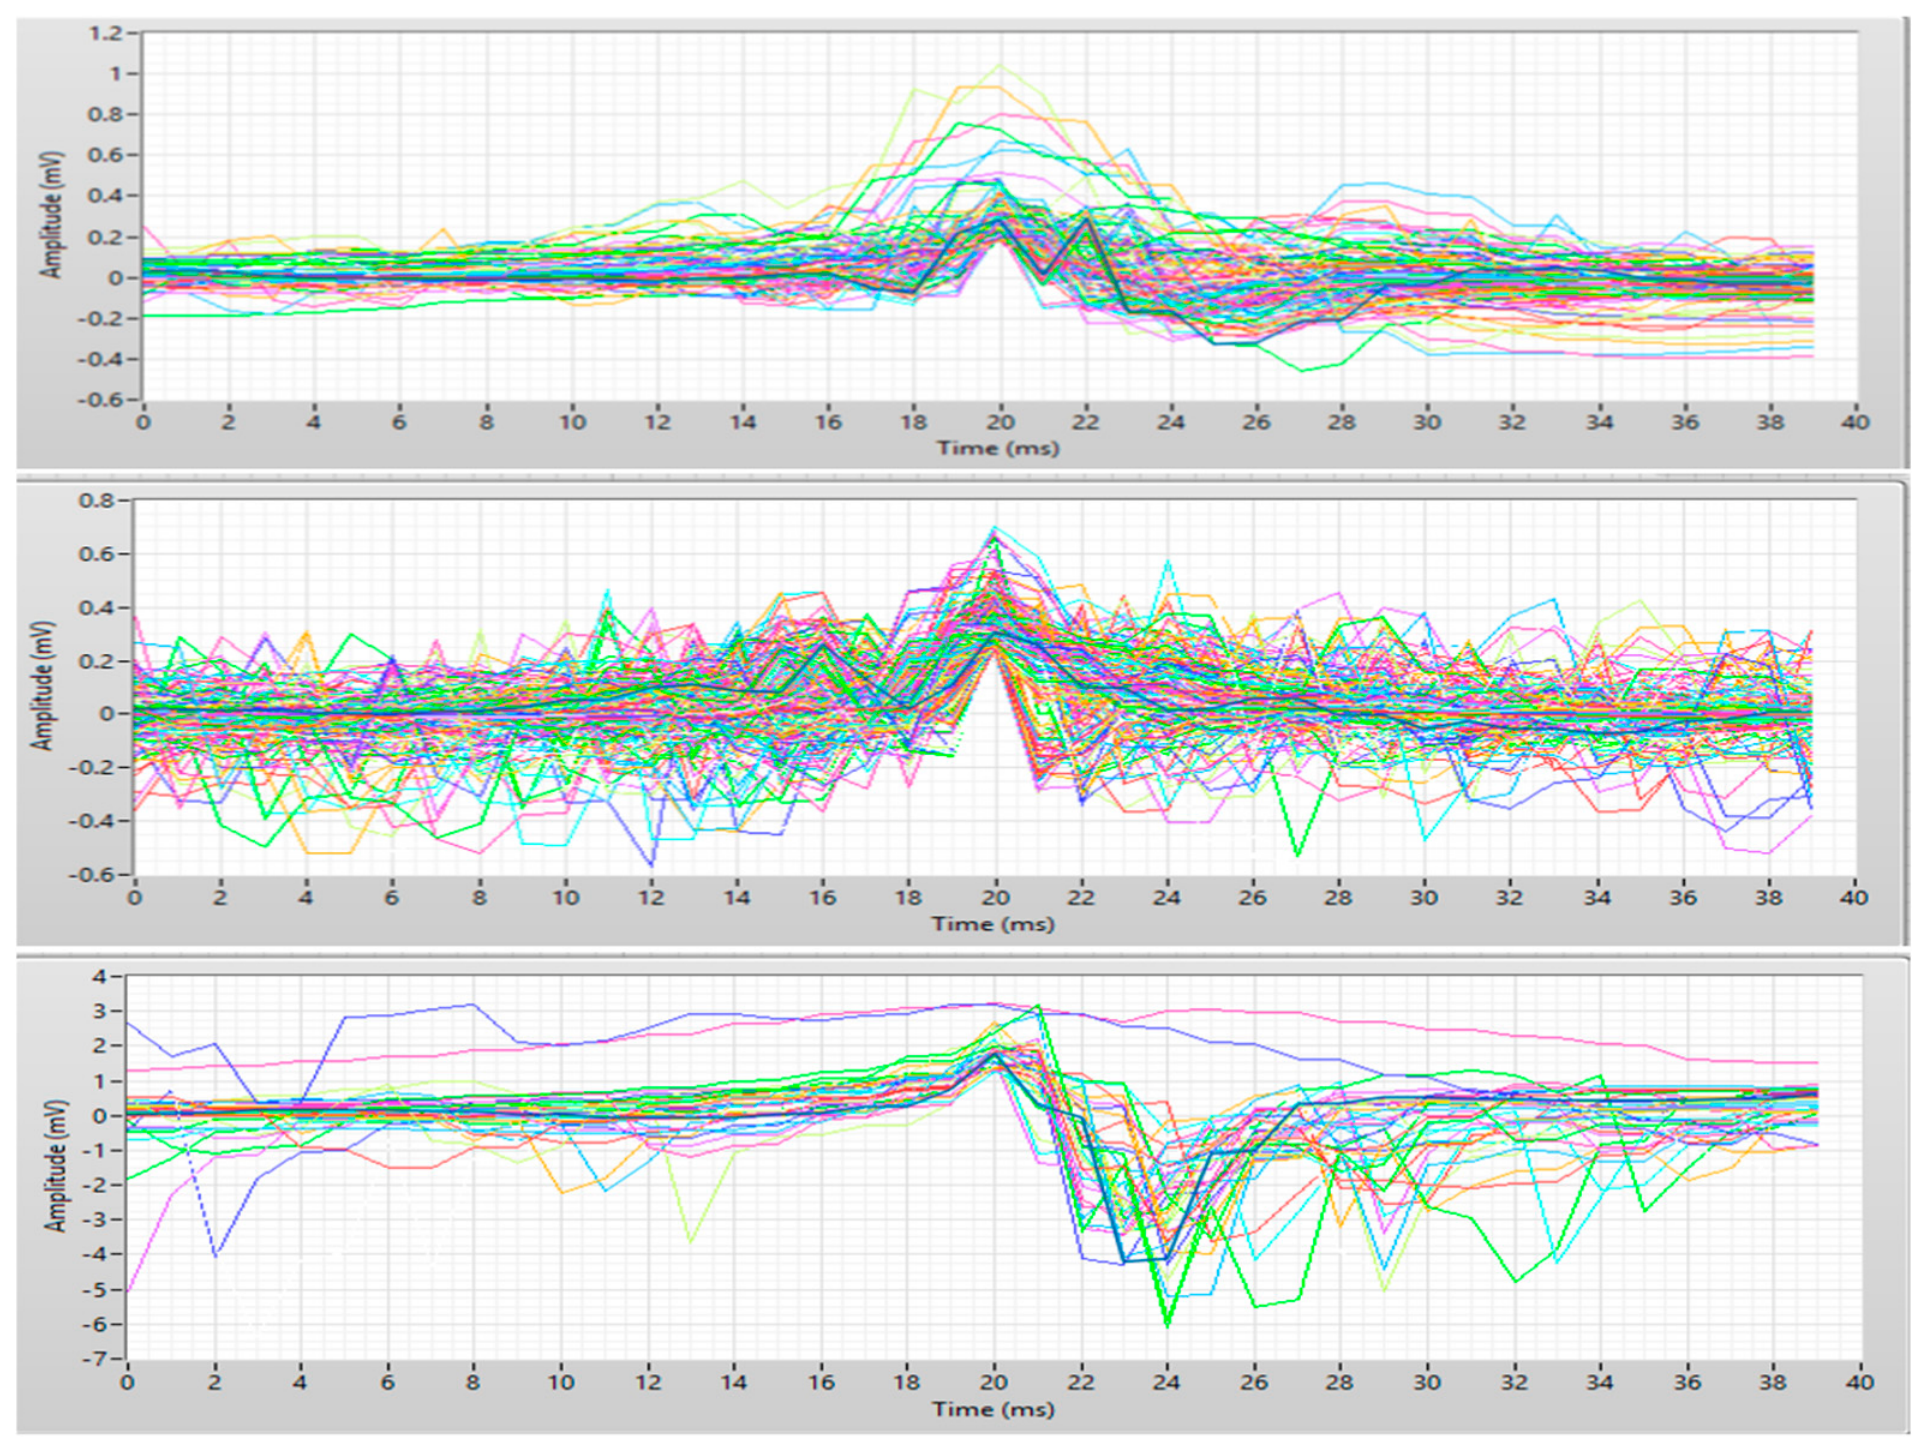
Following peak detection, fixed-length temporal windows centered on each peak were extracted to isolate individual MUAP waveforms. A window size of 40 samples (±20 samples around the peak) was selected to capture the relevant morphology while minimizing the inclusion of unrelated signal components, in line with established MUAP analysis practices [10]. The extracted segments were organized in matrix form, where each row corresponds to a single MUAP. This structure facilitates both visual inspection and quantitative analysis of waveform characteristics. The resulting MUAPs exhibited distinct morphological patterns across the analyzed signal categories, supporting their use in comparative evaluation (Figure 3).
Figure 3.
Representative extracted MUAP waveforms for the healthy, myopathic, and neuropathic EMG signals. (Different colors represents individual extracted MUAP waveforms and do not indicate different classes or variables).
5. MUAP Feature Extraction
For each extracted MUAP, four morphological features were computed using LabVIEW. The peak-to-peak amplitude was defined as: A = max(x) − min(x) and reflects the magnitude of electrical activity generated by the motor unit. The active duration was calculated as the number of samples for which the signal magnitude exceeded 10% of the maximum absolute amplitude: |x| > 0.1·max(|x|), representing the temporal extent of the MUAP’s active region [10,14]. The number of zero-crossings corresponds to the number of sign changes in the waveform, with higher values indicating increased morphological complexity or fragmentation [6,15]. The symmetry ratio quantifies the balance between positive and negative waveform components, providing an additional descriptor of MUAP shape.
For each feature, descriptive statistics and graphical distributions were generated for all three signal categories, supporting comparative analysis of healthy, myopathic, and neuropathic EMG patterns [18].
6. Comparative Statistical Analysis
6.1. Statistical Analysis
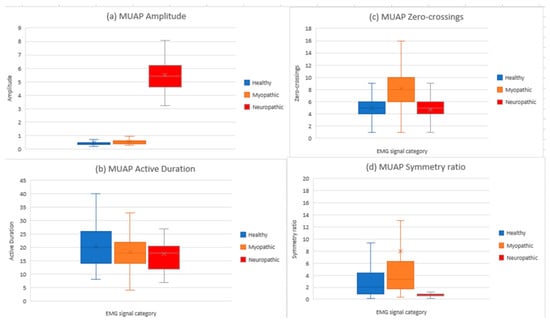
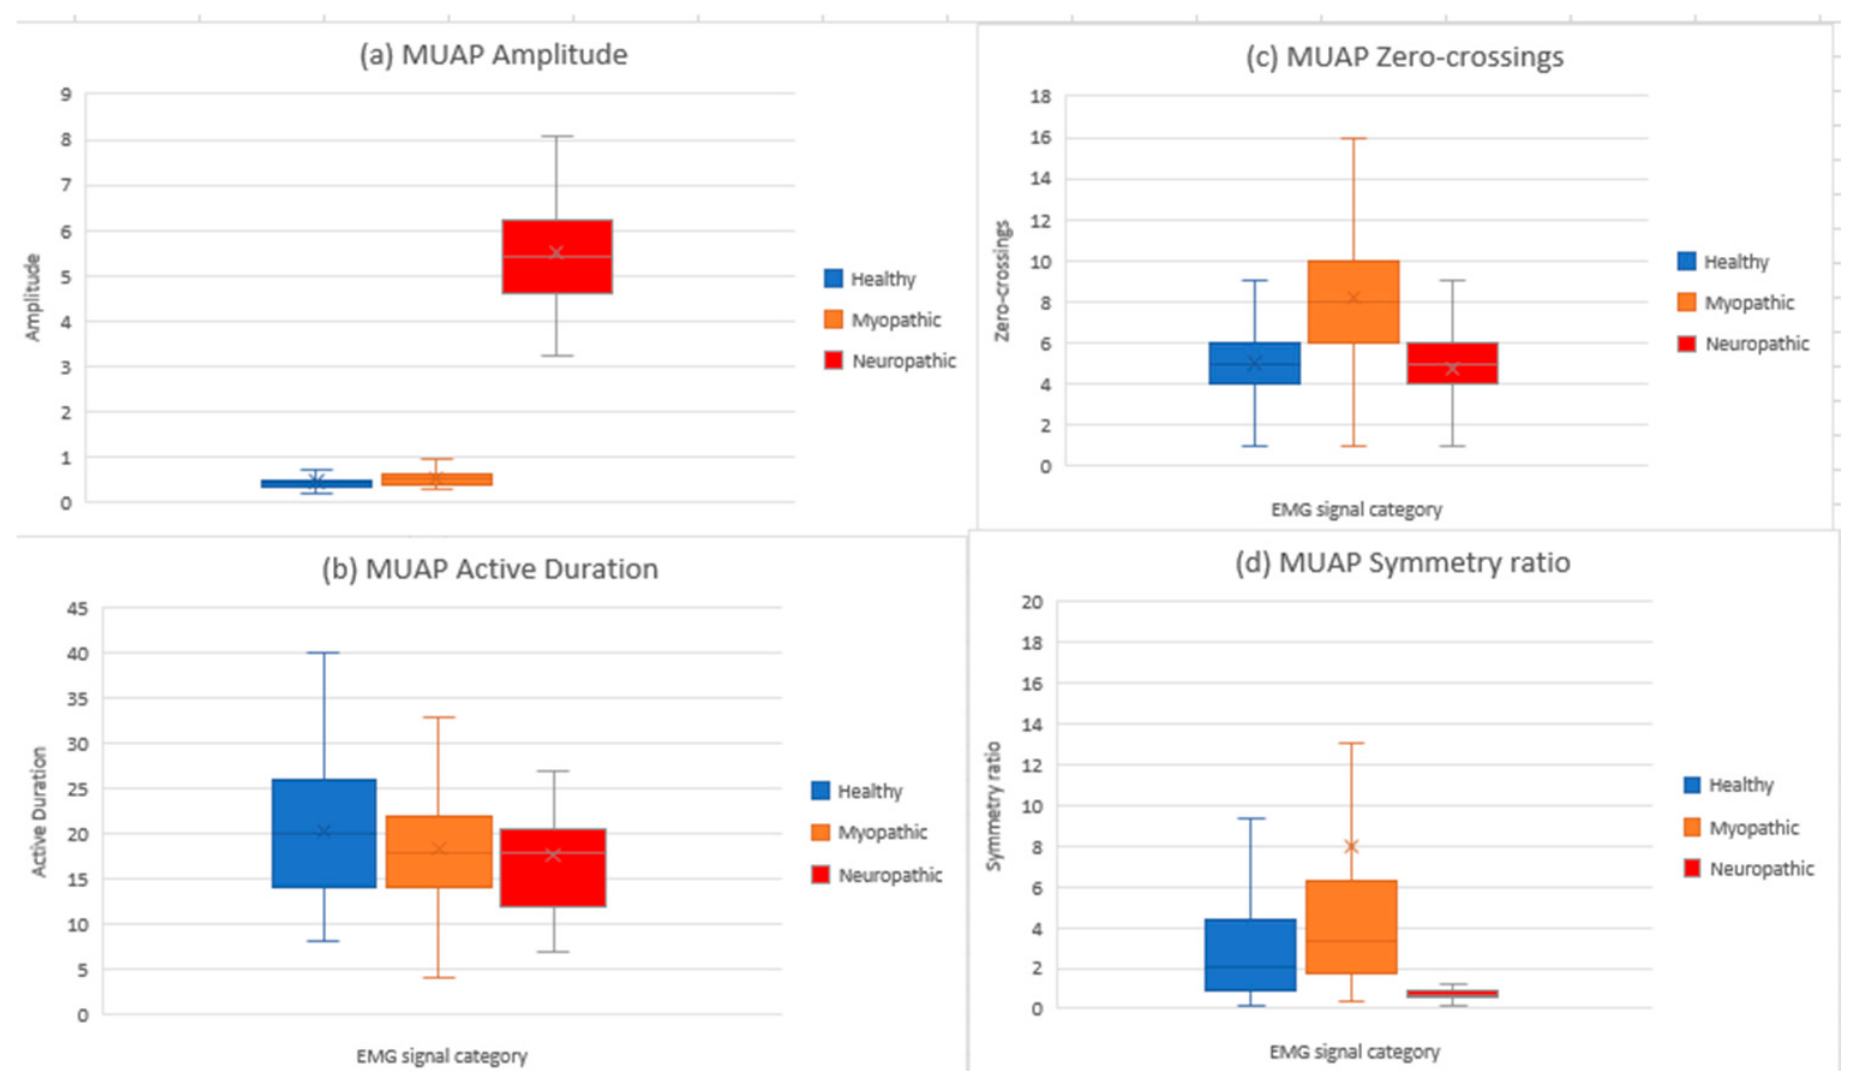
Boxplot analysis of MUAP amplitude (Figure 4a) reveals a clear separation between neuropathic signals and the other two categories. Neuropathic MUAPs exhibit substantially higher amplitudes, whereas healthy and myopathic signals remain within a lower amplitude range with partial overlap. This pattern aligns with known phenomena such as enlarged motor units and reinnervation in neuropathic conditions.
Figure 4.
Comparative boxplot representation of the extracted MUAP features: (a) amplitude, (b) active duration, (c) zero-crossings, and (d) symmetry ratio for healthy, myopathic, and neuropathic EMG signals.
Active duration distributions (Figure 4b) indicate that healthy signals are relatively compact, myopathic signals show slightly reduced durations, and neuropathic signals present increased variability, reflecting differences in the temporal spread of MUAP activity. The number of zero-crossings (Figure 4c) provides insight into waveform complexity. Myopathic signals exhibit higher zero-crossing counts, suggesting greater waveform fragmentation, while healthy signals remain centered around moderate values. Neuropathic signals display lower central values, indicating reduced complexity.
Symmetry ratio analysis (Figure 4d) complements these observations. Extreme values, sensitive to low-amplitude components, were excluded for clarity. The resulting distributions highlight distinct morphological differences between categories: myopathic signals show higher median symmetry ratios, while neuropathic signals are lower.
6.2. Statistical Indicators
Descriptive statistics for the extracted MUAP features are summarized in Table 1, providing a quantitative comparison among the three signal categories. Both mean and median values were considered in order to obtain robust estimates while reducing the influence of outliers. For the healthy signal, amplitude remained within a low-to-moderate range (mean 0.456, median 0.417), active duration averaged approximately 20 samples, zero-crossings had a mean value of 5.47, and the median symmetry ratio was 2.01. The myopathic signal showed a slightly higher amplitude (mean 0.531, median 0.506), a slightly shorter active duration (mean 18.31), an increased number of zero-crossings (mean 8.22, median 8.0), and a higher median symmetry ratio (3.28), suggesting greater waveform fragmentation and a more pronounced asymmetry between positive and negative components. The neuropathic signal was distinguished primarily by its markedly higher amplitude (mean 5.51, median 5.40), while active duration remained at 17.63 samples, zero-crossings had a mean value of 4.73, and the median symmetry ratio decreased to 0.711. These results indicate a clearly distinct waveform morphology for neuropathic MUAPs compared with the healthy and myopathic categories.
Table 1.
Statistical descriptors of the extracted MUAP features.
6.3. Comparative Interpretation
The results indicate that amplitude is one of the most discriminative MUAP features, particularly for separating neuropathic signals from healthy and myopathic ones. The pronounced increase in amplitude observed in neuropathic signals aligns with reinnervation phenomena and the formation of enlarged motor units.
Active duration provides complementary information on the temporal characteristics of MUAPs. Myopathic signals exhibit slightly shorter durations, whereas neuropathic signals show increased variability, reflecting altered neuromuscular activity.
The number of zero-crossings is particularly relevant for assessing waveform complexity. Higher values in myopathic signals suggest increased fragmentation, while healthy signals remain within moderate complexity levels. Finally, the symmetry ratio should be interpreted cautiously due to sensitivity to extreme values. Nevertheless, neuropathic signals consistently display a distinct balance between positive and negative waveform components compared with healthy and myopathic signals.
7. Discussion
The proposed methodology enables a reproducible analysis of iEMG signals using MUAPs as the fundamental units. Compared with direct inspection of raw signals, this approach isolates elementary events and computes physiologically meaningful descriptors. All processing stages were implemented in LabVIEW, providing an intuitive environment for signal import, visualization, denoising, detection, segmentation, and statistical analysis, making the framework suitable for both research and educational purposes.
Limitations include signal quality, wavelet denoising parameters, threshold selection, and extraction window size. Certain features, particularly the symmetry ratio, may be affected by low-energy components. Despite these constraints, the selected MUAP features provide coherent and physiologically meaningful comparisons across healthy, myopathic, and neuropathic signals.
8. Conclusions
This paper presented a complete framework for the comparative analysis of iEMG signals based on MUAP extraction and characterization. In this study, invasive EMG (iEMG) recordings, sourced from the publicly available PhysioNet database [19], were utilized. The method, implemented entirely in LabVIEW, integrates wavelet-based denoising, automatic peak detection, fixed-window MUAP extraction, and statistical analysis of morphological features.
The results demonstrate that the proposed approach effectively differentiates between healthy, myopathic, and neuropathic EMG signals. Among the analyzed features, amplitude proved particularly effective in identifying neuropathic patterns, while the number of zero-crossings highlighted the increased waveform complexity associated with myopathic signals.
The methodology is suitable for both educational and research applications and may serve as a foundation for future development of computer-assisted neuromuscular analysis tools. As a natural extension of this work, the extracted MUAP features may be used as input variables for automatic classification algorithms. The obtained results indicate that amplitude represents a highly discriminative feature for identifying neuropathic signals, while the number of zero-crossings is particularly relevant for detecting myopathic patterns. Active duration and symmetry ratio provide complementary information, contributing to the overall characterization of EMG signal classes. These findings support the development of intelligent systems for distinguishing between healthy and pathological EMG signals.
Author Contributions
Conceptualization, A.H. and M.M.; methodology, A.H. and M.M.; software, A.H. and M.M.; validation, A.H., M.M. and R.C.; formal analysis, A.H.; investigation, A.H.; resources, A.H. and M.M.; data curation, A.H.; writing—original draft preparation, A.H.; writing—review and editing, M.M. and R.C.; visualization, A.H.; supervision, M.M. and R.C.; project administration, A.H. and M.M.; funding acquisition, M.M. All authors have read and agreed to the published version of the manuscript.
Funding
This research received no external funding.
Institutional Review Board Statement
Ethical review and approval were waived for this study because it used publicity available analyzed data from PhysioNet database.
Informed Consent Statement
Not applicable.
Data Availability Statement
The data analyzed during this study are publicly available in the PhysioNet EMG Database at https://www.physionet.org/content/emgdb/1.0.0/ (accessed on 1 July 2026); No new datasets were generated during the current study.
Conflicts of Interest
The authors declare no conflict of interest.
References
- Chowdhury, R.H.; Reaz, M.B.I.; Ali, M.A.B.M.; Bakar, A.A.A.; Chellappan, K.; Chang, T.G. Surface Electromyography Signal Processing and Classification Techniques. Sensors 2013, 13, 12431–12466. [Google Scholar] [CrossRef] [Scilit]
- Konrad, P. The ABC of EMG: A Practical Introduction to Kinesiological Electromyography; Noraxon Inc.: Scottsdale, AZ, USA, 2015. [Google Scholar]
- Parsaei, H. EMG Signal Decomposition Using Motor Unit Potential Train. Master’s Thesis, University of Waterloo, Waterloo, ON, Canada, 2011. [Google Scholar]
- Tăbîrță, A. Reabilitarea Medicală în Afecțiuni Musculo-Scheletale; Centrul Editorial-Poligrafic Medicina: Chișinău, Moldova, 2023. [Google Scholar]
- Kraus, G.E. Peripheral Neuropathies. In Handbook of Medical Aspects of Disability and Rehabilitation for Life Care Planning; Routledge: London, UK, 2024. [Google Scholar]
- Singh, S.; Mishra, B.; Wadhwani, A.K. Electromyography (EMG)-Based Signal Processing and Feature Selection Using Wavelet Transform. Int. J. Appl. Eng. Res. 2019, 14, 123–135. [Google Scholar]
- Silva, A.M.S.; Campos, E.D.; Zanoteli, E. Inflammatory Myopathies: An Update for Neurologists. Arq. Neuropsiquiatr. 2022, 80, 238–248. [Google Scholar] [CrossRef] [Scilit] [PubMed]
- Mademli, L. The Physiological Background of EMG; Centre for Research & Technology Hellas—Informatics and Telematics Institute: Thermi, Greece, 2020. [Google Scholar]
- Strzecha, K.; Krakoś, M.; Więcek, B.; Chudzik, P.; Tatar, K.; Lisowski, G.; Mosorov, V.; Sankowski, D. Processing of EMG Signals with High Impact of Power Line and Cardiac Interferences. Appl. Sci. 2021, 11, 4625. [Google Scholar] [CrossRef] [Scilit]
- Farina, D.; Holobar, A. Characterization of Human Motor Units from Surface EMG Decomposition. Proc. IEEE 2016, 104, 353–373. [Google Scholar] [CrossRef] [Scilit]
- Reaz, M.B.I.; Hussain, M.S.; Mohd-Yasin, F. Techniques of EMG Signal Analysis: Detection, Processing, Classification and Applications. Biol. Proced. Online 2006, 8, 11–35. [Google Scholar] [CrossRef] [Scilit]
- Constable, R.T.; Thornhill, R.E. Using the Discrete Wavelet Transform for Time-Frequency Analysis of Rhe Surface EMG Signal. Biomed. Sci. Instrum. 1993, 29, 121–127. [Google Scholar] [CrossRef] [Scilit] [PubMed]
- Boyer, M.; Bouyer, L.; Roy, J.-S.; Campeau-Lecours, A. Reducing Noise, Artifacts and Interference in Single-Channel EMG Signals: A Review. Sensors 2023, 23, 2927. [Google Scholar] [CrossRef] [Scilit] [PubMed]
- Merletti, R.; Farina, D. Surface Electromyography: Physiology, Engineering, and Applications; IEEE Press: Hoboken, NJ, USA, 2016. [Google Scholar]
- Subasi, A.; Kiymik, M.K. Muscle Fatigue Detection in EMG Using Wavelet Transform and Neural Networks. J. Med. Syst. 2010, 34, 777–785. [Google Scholar] [PubMed]
- Englehart, K.; Hudgins, B. A Robust, Real-Time Control Scheme for Multifunction Myoelectric Control. IEEE Trans. Biomed. Eng. 2003, 50, 848–854. [Google Scholar] [CrossRef] [Scilit] [PubMed]
- Mashhadi, M.B.; Najafizadeh, L. Wavelet-Based Denoising of EMG Signals Using Adaptive Thresholding Techniques. Front. Neuroinform. 2020, 14, 40. [Google Scholar]
- Herry-Claudet, C.; Schwartz, D.; Arendt-Nielsen, L. Advances in Electromyographic Signal Analysis for Neuromuscular Disorders. Diagnostics 2021, 11, 2075. [Google Scholar] [CrossRef] [Scilit]
- PhysioNet. EMG Database. Available online: https://www.physionet.org/content/emgdb/1.0.0/ (accessed on 17 February 2026).

Disclaimer/Publisher’s Note: The statements, opinions and data contained in all publications are solely those of the individual author(s) and contributor(s) and not of MDPI and/or the editor(s). MDPI and/or the editor(s) disclaim responsibility for any injury to people or property resulting from any ideas, methods, instructions or products referred to in the content. |
© 2026 by the authors. Licensee MDPI, Basel, Switzerland. This article is an open access article distributed under the terms and conditions of the Creative Commons Attribution (CC BY) license.