Proceeding Paper

Low-Cost Solution for Increasing Efficiency in Chromatic Perception for Visual Screening †
by
Barbu Braun
*,
Mihaela Ioana Baritz
,
Mirela Apostoaie
and
Alexandra Maria Lazăr
Department of Product Design and Environment, Transilvania University of Brasov; Universitatii Street No. 1, 500068 Brasov, Romania
*
Author to whom correspondence should be addressed.
Presented at the International Conference on Electromagnetic Fields, Signals and BioMedical Engineering (ICEMS-BIOMED), Suceava, Romania, 7–9 May 2026.
Eng. Proc. 2026, 148(1), 22; https://doi.org/10.3390/engproc2026148022
Published: 9 July 2026

Abstract

Th paper describes a low-cost solution forsignificantly increasing the efficiency of color perception testing for visual screening. The target areas are school and preschool children, people taking medical exams, testing in occupational medicine, and military recruitment. The research involved two stages: developing a virtual application for rapid and objective assisted testing of chromatic vision, and effectively testing about 30 subjects, of different social and age categories, for visual screening. We proved not the low cost, but also the high effectiveness of the method. This creates potential for a better way to prevent visual impairments, especially in children.

1. On the Importance of Chromatic Perception

Color vision is our ability to perceive and distinguish colors. This complex process involves the interaction of the eye, brain, and environment. Color receptors: Our eyes contain specialized cells called cones, which are responsible for color perception. There are three main types of cones, each sensitive to specific wavelengths. Cones sensitive to red, green, and blue are responsible for encoding color information [1,2]. The trichromatic color theory, developed by researchers Thomas Young and Hermann von Helmholtz, holds that all colors can be reproduced by mixing three primary colors: red, green, and blue. This model explains how the interaction between cones sensitive to these primary colors allows us to see a wide range of colors [3].
A number of research studies have shown that the RGB (red–green–blue) test is a color vision test that assesses an individual’s ability to perceive and differentiate between the primary colors: red, green, and blue. It is commonly used to detect color vision deficiencies and is based on the additive color model, which combines these primary colors to create a full range of colors [4].
Among the most common forms of dyschromatopsia is color blindness, consisting of the inability to distinguish between the fundamental colors of red, green or blue. Specifically, studies show that there are three main types of dyschromatopsia: Protanopia is the first type of dyschromatopsia and involves difficulty perceiving red light. Red appears as a dark color and can be confused with black or dark brown. Deuteranopia affects the perception of green light, so green appears as a grayish color and can be confused with other shades of gray or brown. Tritanopia is a rare form of dyschromatopsia that affects the perception of blue light. Blue appears greenish, being confused with other shades of green or gray [5]. Achromatism, or achromatopsia, is the most severe dyschromatopsia, characterized by the total inability to perceive colors, with affected individuals unable to distinguish between colors and perceiving the environment only in shades of gray [6].
There are currently several methods available for detecting color perception problems, including many color tests: Ishihara tests are commonly used to assess a person’s ability to distinguish colors. They consist of a series of images composed of colored patterns with numbers or shapes hidden within them. People with color vision problems may have difficulty identifying the numbers or shapes in these images. The Farnsworth–Munsell 100 Hue test tests a person’s ability to sort and arrange color shades in the correct order. This test involves sorting a set of colored capsules into the correct order of the color gradient. The capsules are numbered and must be arranged in a specific sequence. The person being tested must distinguish and correctly organize the color shades to achieve a smooth and continuous gradient. The Farnsworth–Munsell 100 Hue test is considered a more detailed and accurate test than the Ishihara test and can provide additional information about the type and degree of color perception deficiency. Complete ophthalmological examinations can also be applied to detect color perception problems, including stages of testing color sensitivity and color discrimination [7,8].

2. Proposed Solution

The research focused on the development and testing of an alternative methodology for testing and training visual function from the point of view of chromatic perception. An innovative strategy was proposed to allow the alternation of training techniques in an efficient and enjoyable way, so that they guarantee maximum efficiency and objectivity. For this reason, the proposed method consists of assisted testing, through play, the target group being mainly children. This method would greatly reduce the risk of boredom during a training session and, at the same time, would considerably increase interest and attention for a correct and complete solution of chromatic tests [1].
For this purpose, in the first stage of the research, a set of non-conventional computer-assisted tests specific to chromatic vision was developed. For this, a software application was designed, programmed and tested for testing chromatic perception through a game, using the graphical programming and virtual instrumentation environment, LabVIEW (2025 version). The design of the specific interface for game-assisted testing had as its starting point its main purpose, namely to be able to test as efficiently and objectively as possible the ability to distinguish the shades of the fundamental colors R, G, B but also of three combinations between the fundamental colors (yellow, purple and orange). For example, on the red background, nine dots were provided, of different sizes and different shades, slightly different from the background color.
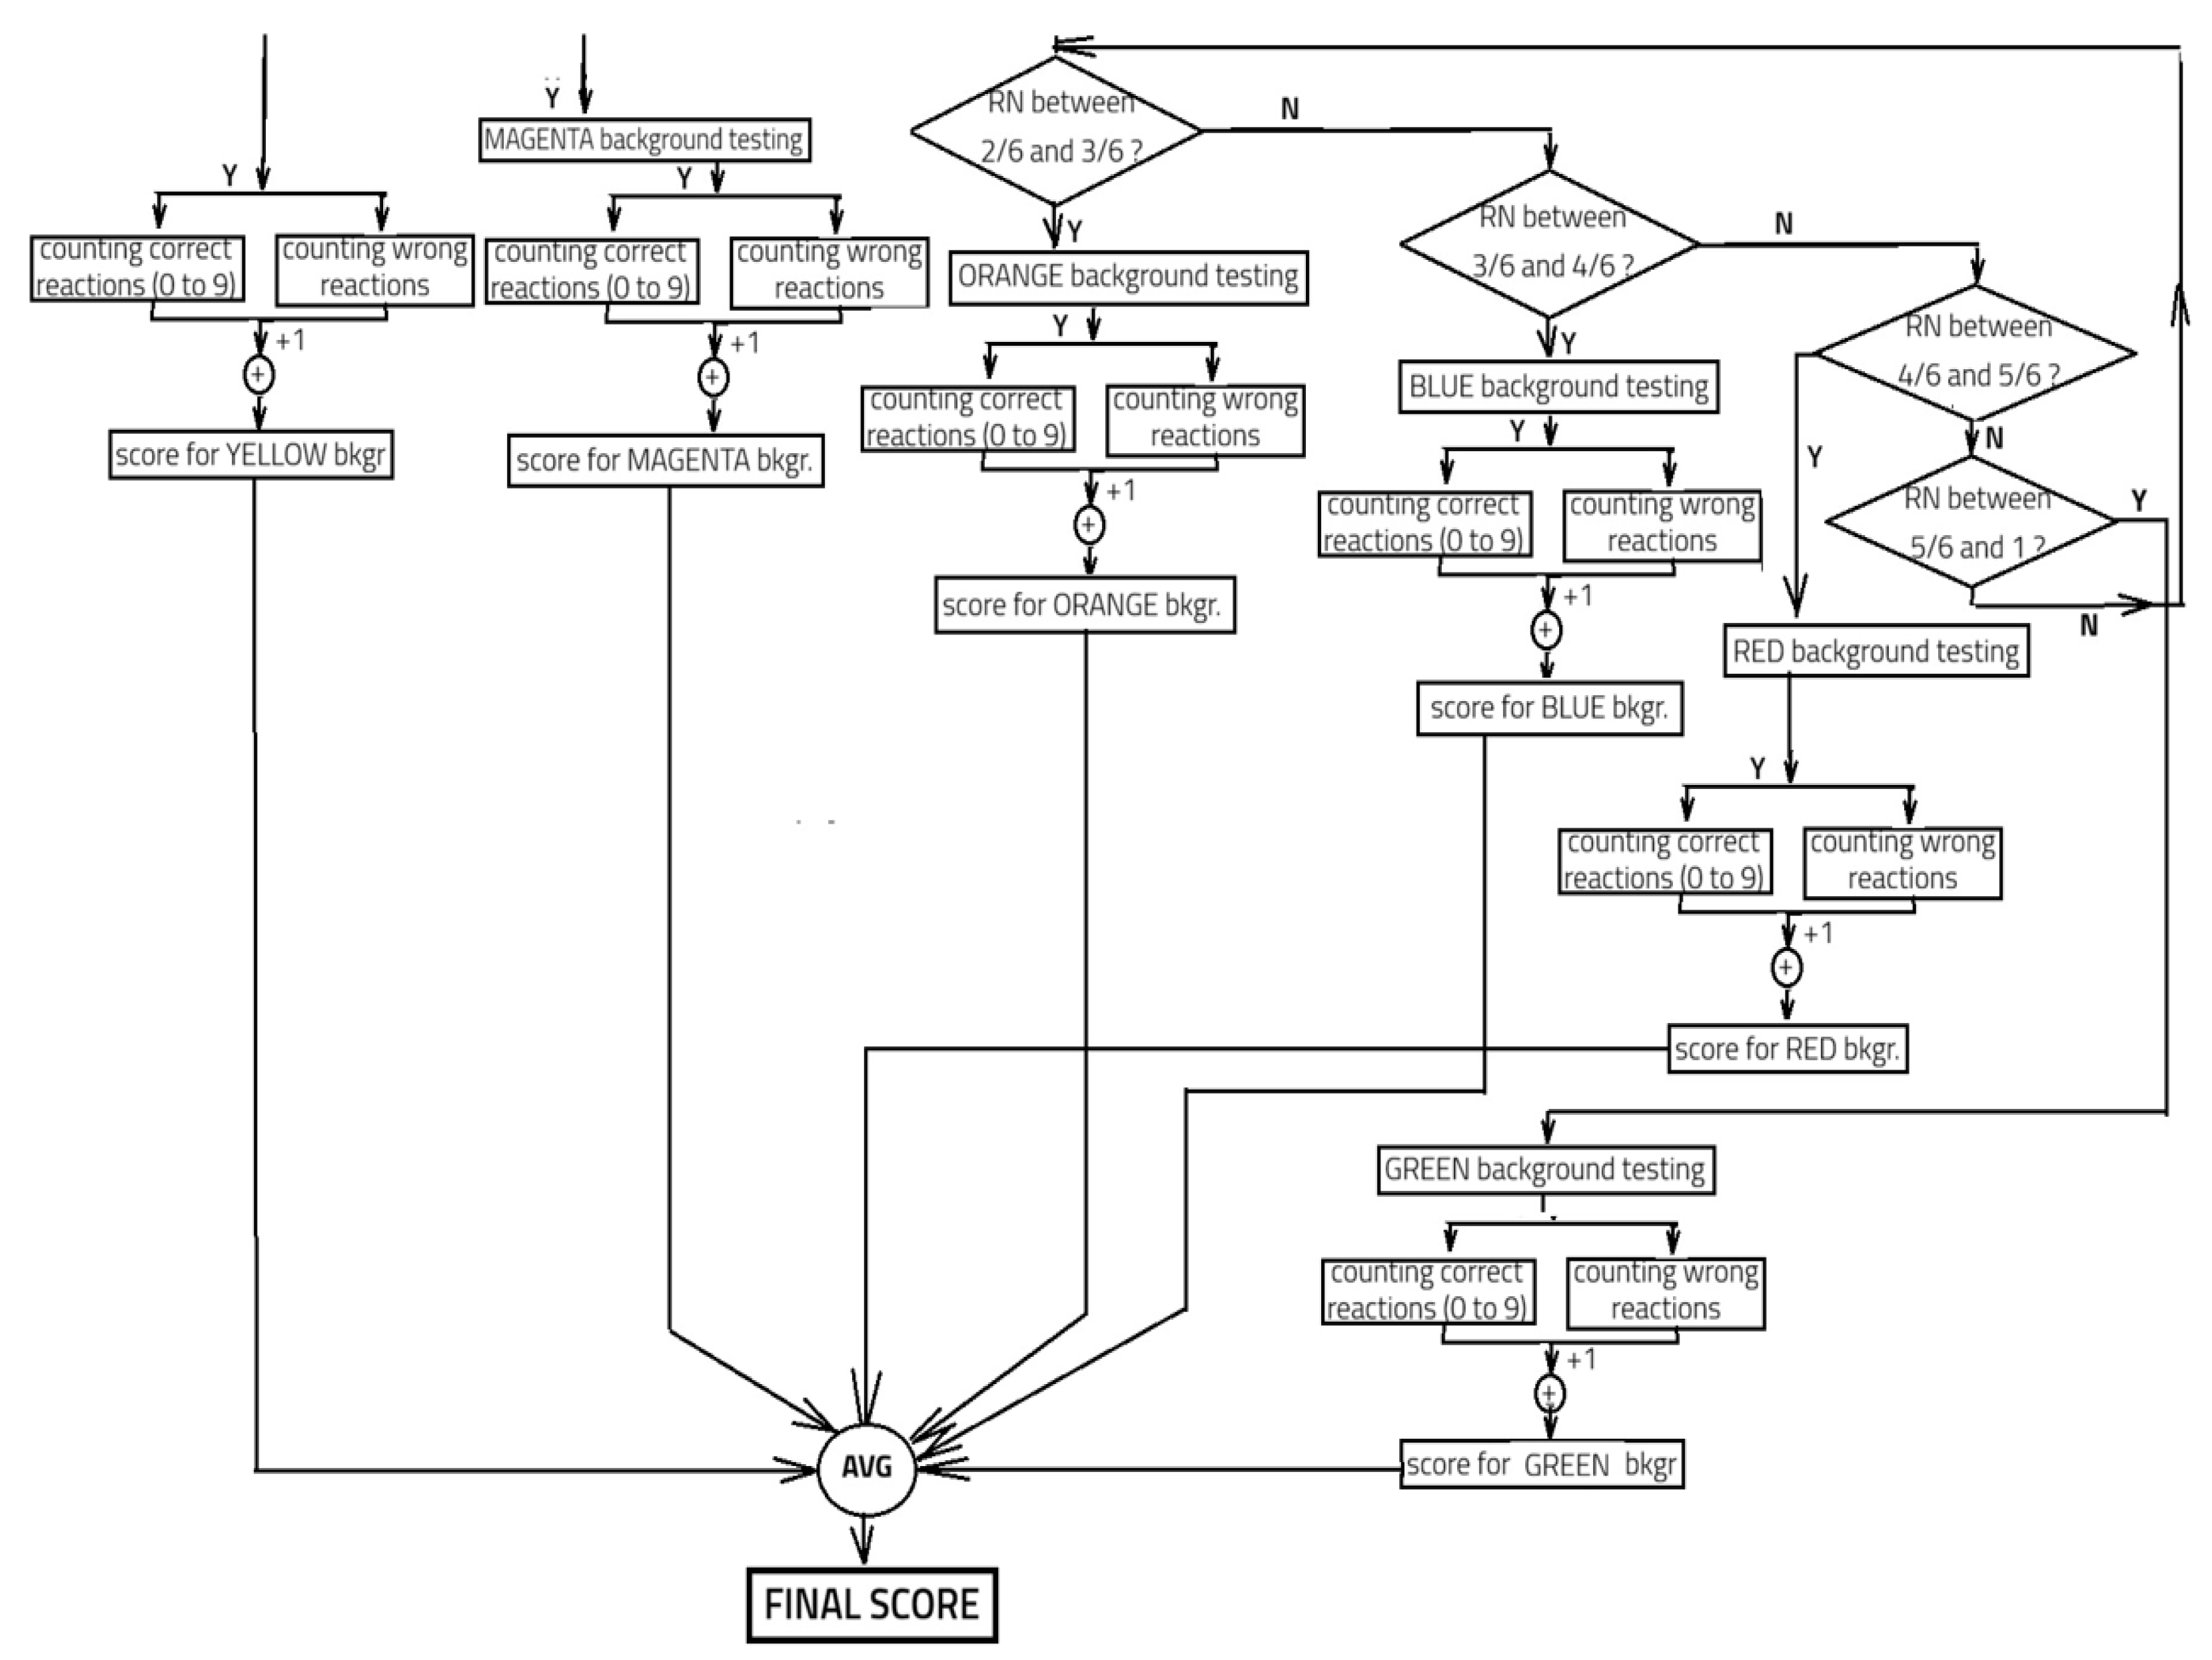
The logic scheme of the LabVIEW interface programing algorithm is presented in Figure 1 and Figure 2. The algorithm is described as follows: If the START button is pressed when running the interface, the assisted testing begins. A random number (R.N.) which generates numbers from 0 to 1 will define one of the six situations, each being a color background for testing. More precisely, if R.N. returns a number between 0 and 1/6, the current testing step will be performed for the YELLOW background. In this case, the subject must identify and turn off all polka dots of different yellow shades related to the yellow background. If R.N. returns a number between 1/6 and 1/3, the current testing step will be performed for the MAGENTA background. In this case, the subject must identify and turn off all polka dots of different magenta shades related to the magenta background. If R.N. returns a number between 1/3 and 1/2, the current testing step will be performed for the ORANGE background. In this case, the subject must identify and turn off all polka dots of different orange shades related to the orange background. If R.N. returns a number between 1/2 and 2/3, the current testing step will be performed for the BLUE background. In this case, the subject must identify and turn off all polka dots of different blue shades related to the blue background. If R.N. returns a number between 2/6 and 5/6, the current testing step will be performed for the RED background. In this case, the subject must identify and turn off all polka dots of different red shades related to the red background. And, finally, if R.N. returns a number between 5/6 and 1, the current testing step will be performed for the GREEN background. In this case, the subject must identify and turn off all polka dots of different green shades related to the green background.
For each of the six stages of the test, an intermediate score is given and, at the end of the test, the final score is obtained as the arithmetic average of the six intermediate scores, as it can be seen in relation (1):
FS = (Sr + Sy + Sb + Sg + So + Sm)/6
where FS is the final score for each testing, Sr is the intermediary score for the red background, Sy is the intermediary score for the yellow background, Sb is the intermediary score for the blue background, Sg is the intermediary score for the green background, So is the intermediary score for the orange background and Sm is the intermediary score for the magenta background.
The calculation of the intermediate score for each of the six backgrounds is expressed by relationship (2):
Si = SUM(Pr) − SUM(Lr) − SUM(FPr) + 1
where Si is the intermediary score for each of the six types of background, Pr represents the positive reactions for each instance of turning off the different shades of polka dots, Lr is the loss of reaction for the dots being turned off and FPr is a false-positive reaction for turning off by clicking the background instead of one of the polka dots when the current background is automatically activated.
For each situation related to color perception, the intermediary obtained score is the sum of the correct reactions to turn off the different shades of dots and also the sum of wrong reactions, for instance turning off the background. A half-point is awarded for each partial score.
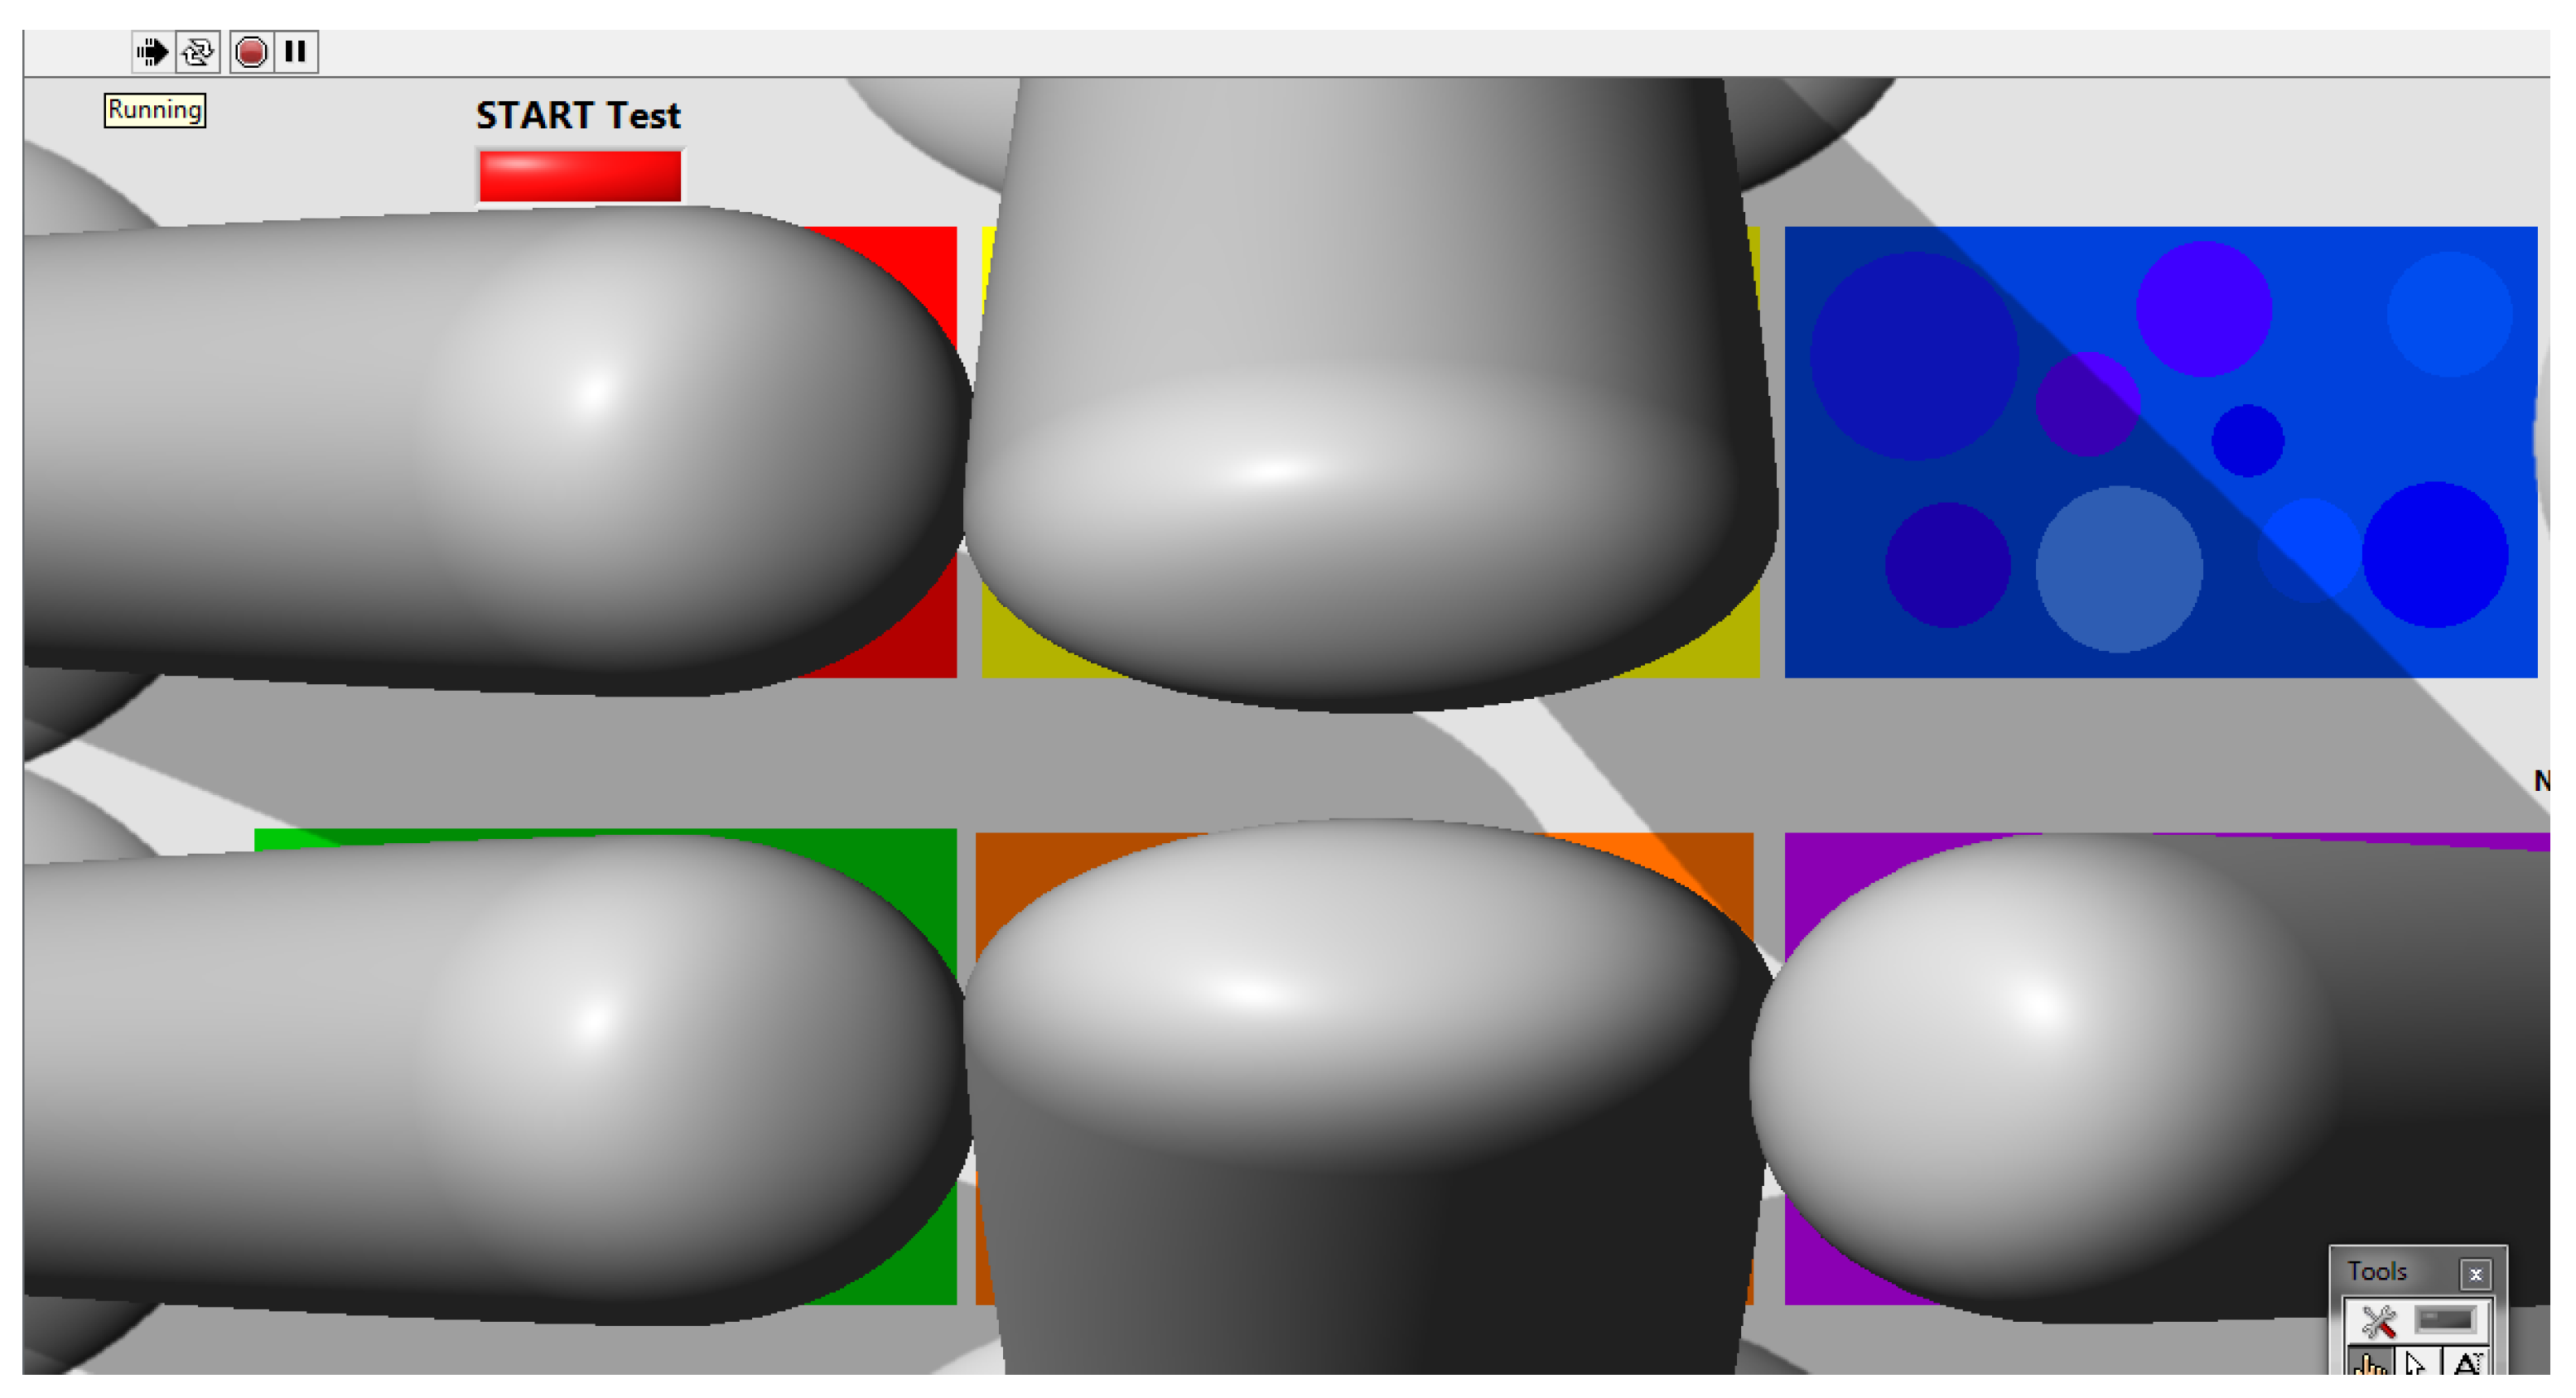
For a correct, objective assessment during the test, access to dots of a different shade for the respective background color must be restricted. Specifically, if the background color-specific responses for the current stage were not given on time, they are automatically blocked by switching a knob over the respective color entity. Figure 3 presents the software interface.

3. Experimental Setup

The proposed method for game-assisted testing of chromatic vision was applied to a sample of 30 subjects, 15 females and 15 males, aged between 14 and 20 years. Testing was done for each subject in three stages, more precisely on the right eye, on the left eye, and in binocular vision. Testing of all subjects was done under identical environmental and physiological conditions, in approximately the same time intervals (10 to 12 AM).

4. Results and Conclusions

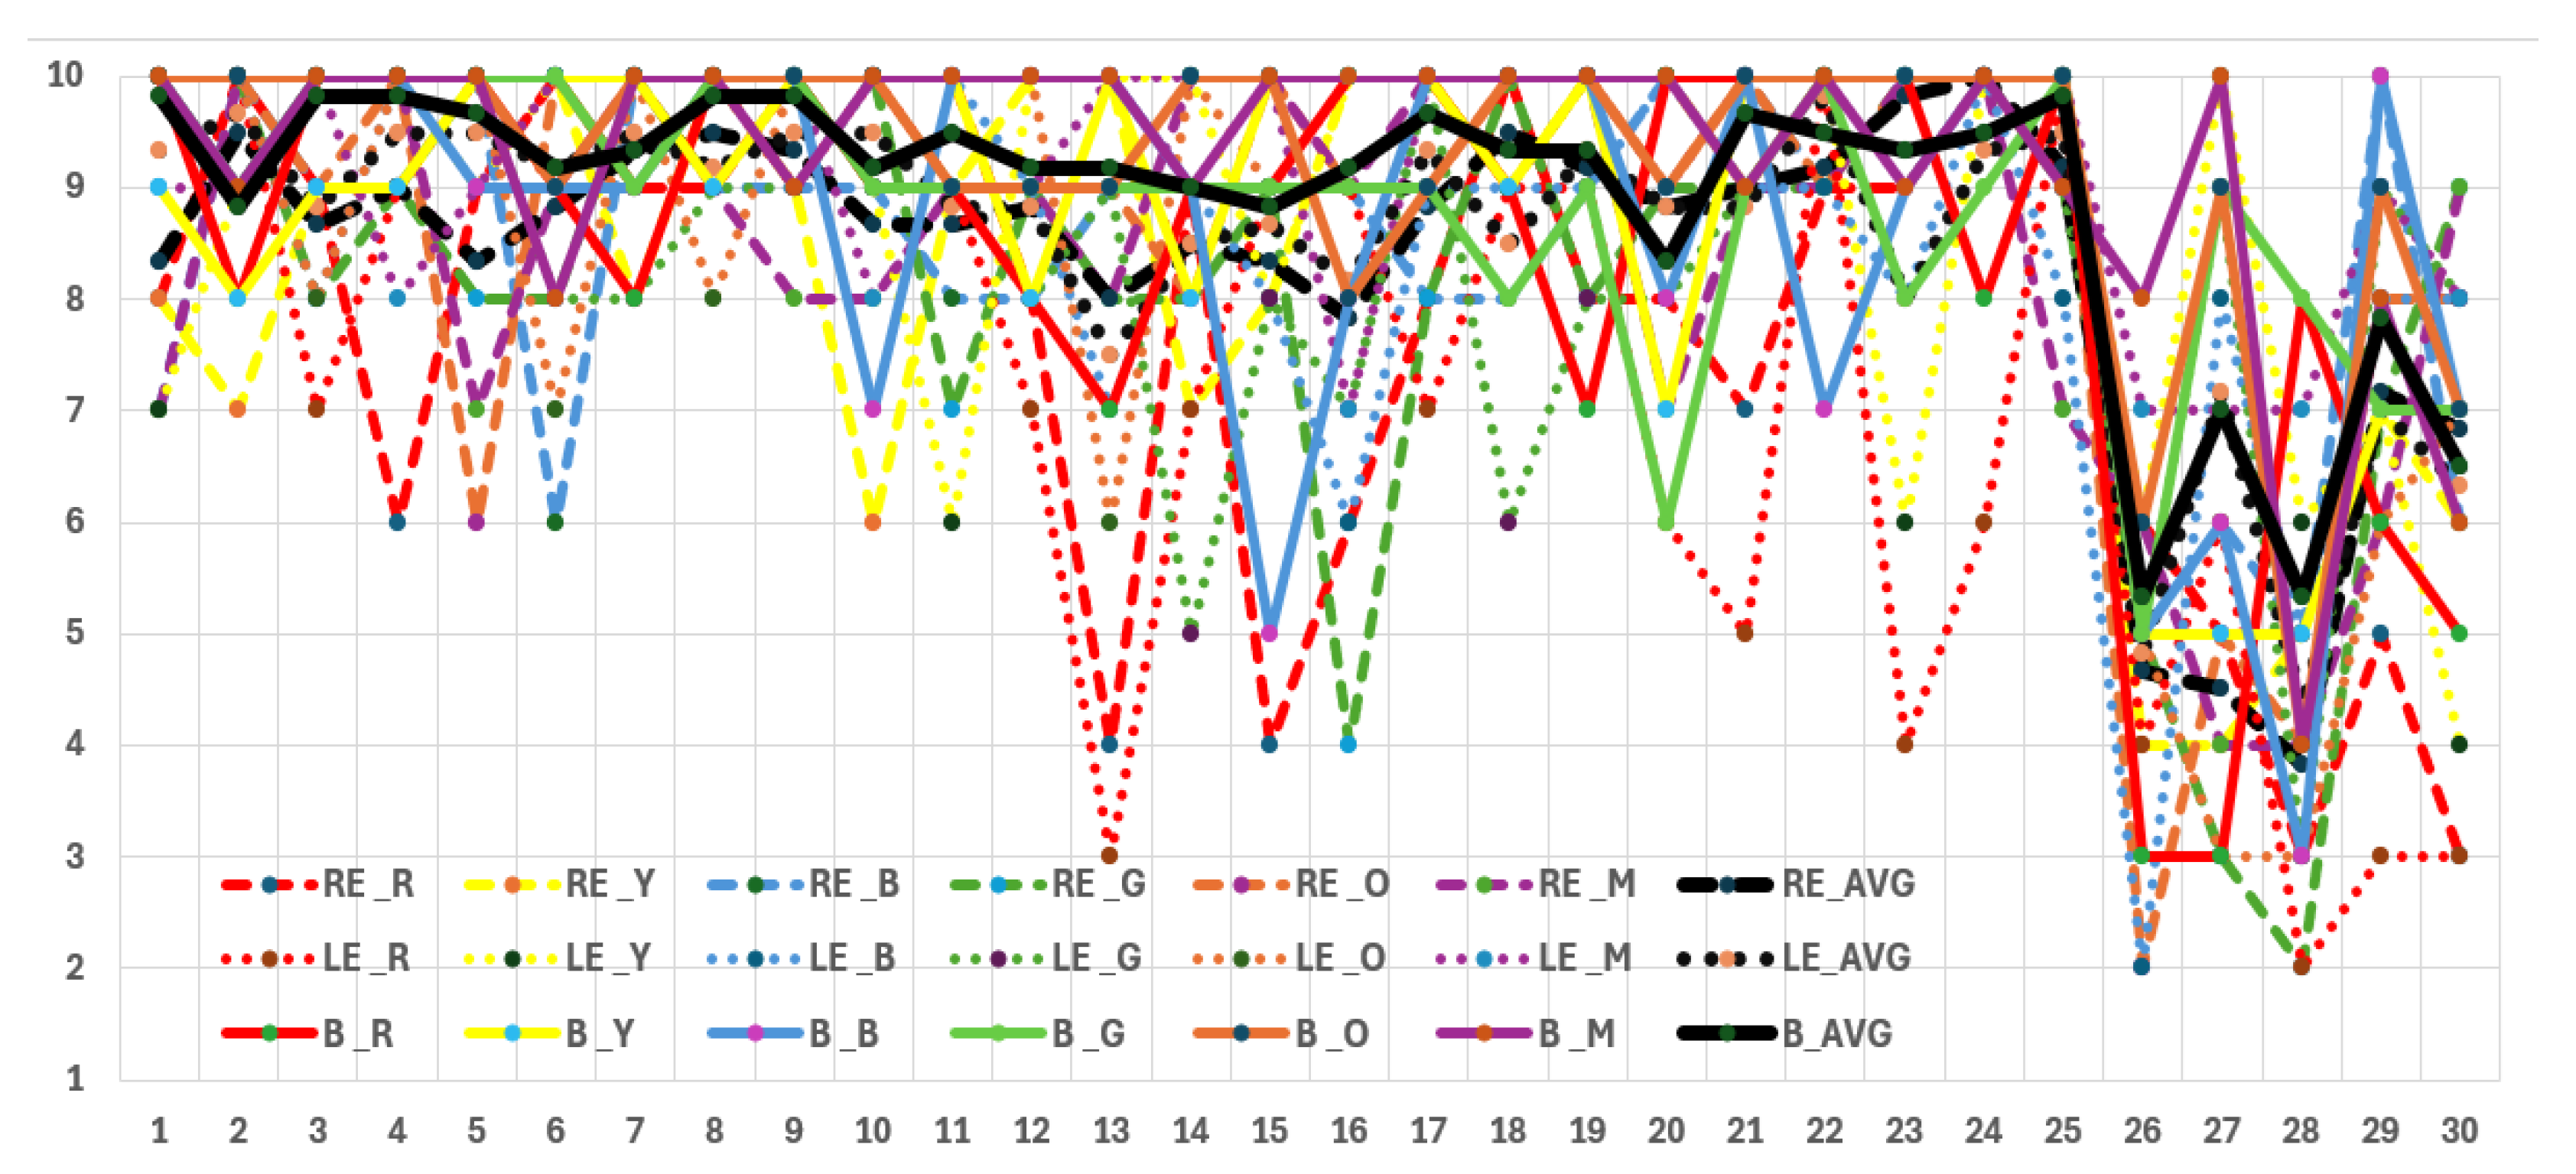
After testing the subjects, it was observed that five of them had problems solving the test, obtaining poor scores in both monocular and binocular chromatic testing. All other subjects managed to obtain scores above eight in all three stages of testing (on the right eye (RE), on the left eye (LE) and in binocular vision (B)).
Thus, for the five subjects tested with poor scores, a problem related to color perception was suspected, and a thorough check-up at a specialized clinic was recommended.
Table 1 presents the results for all testing persons, in monocular and binocular vision.
Two of the five persons having problems while solving the tests were found to have specific chromatic problems, one of them in terms of protanopia (for the RED background, the scores were very poor), and another in terms of deuteranopia (very poor scores for the GREEN background). Figure 4 and Figure 5 present the results in terms of score variation for all tested subjects, for all background types, both in monocular and binocular vision.
The testing results, the acceptance by the subjects of the method as an attractive and playful one, and its efficiency were able to demonstrate that the proposed method is a very useful low-cost solution, which could be implemented on a large scale in visual screening procedures, but also in casuistics.

Author Contributions

Administration, software and validation, B.B.; conceptualization, methodology, formal analysis and supervision, M.I.B.; investigation, writing review and editing, M.A.; data curation and visualization, A.M.L. All authors have read and agreed to the published version of the manuscript.

Funding

This research received no external funding.

Institutional Review Board Statement

Not applicable.

Informed Consent Statement

Informed consent was obtained from all subjects involved in the study.

Data Availability Statement

The data presented in this study are available upon request from the corresponding author.

Conflicts of Interest

There are no conflicts of interest.

References

  1. Costache, B. Proiectarea și Realizarea Sistem Pentru Eficientizarea Testării Convenționale și Asistate a Percepției Cromatice. Ph.D. Thesis, Transylvnaia University of Brasov, Brasov, Romania, 2023. [Google Scholar]
  2. American Optometric Association, Color Vision Deficiency, 2022. Available online: https://www.aoa.org/healthy-eyes/eye-and-vision-conditions/color-vision-deficiency?sso=y%20I (accessed on 15 January 2026).
  3. Peter, G. Color Vision, 2009. Available online: https://webvision.med.utah.edu/book/part-vii-color-vision/color-vision/ (accessed on 10 February 2026).
  4. Utama, D.Q.; Mengko, T.L.R.; Mengko, R.; Aulia, M.N. Color blind test quantification using RGB primary color cluster. In Proceedings of the 2016 International Conference on Information Technology Systems and Innovation (ICITSI), Bandung, Indonesia, 24–27 October 2016. [Google Scholar]
  5. National Eye Institute, Types of Color Blindness. Available online: https://www.nei.nih.gov/learn-about-eye-health/eye-conditions-and-diseases/color-blindness/types-color-blindness (accessed on 10 February 2026).
  6. Ray Optics, Physics–eSeral, Achromatism in Lenses, 2021. Available online: https://www.esaral.com/achromatism-in-lenses/ (accessed on 17 February 2026).
  7. National Research Council (US) Committee on Vision. Washington (DC). Color Vision Tests, National Academies Press (US). 1981. Available online: https://www.ncbi.nlm.nih.gov/books/NBK217823/ (accessed on 10 March 2026).
  8. Ignasi, J. Anomalous Colour Vision, Medical Content Revised, Medical Content, 2019. Available online: https://icrcat.com/en/anomalous-colour-vision/ (accessed on 17 March 2026).
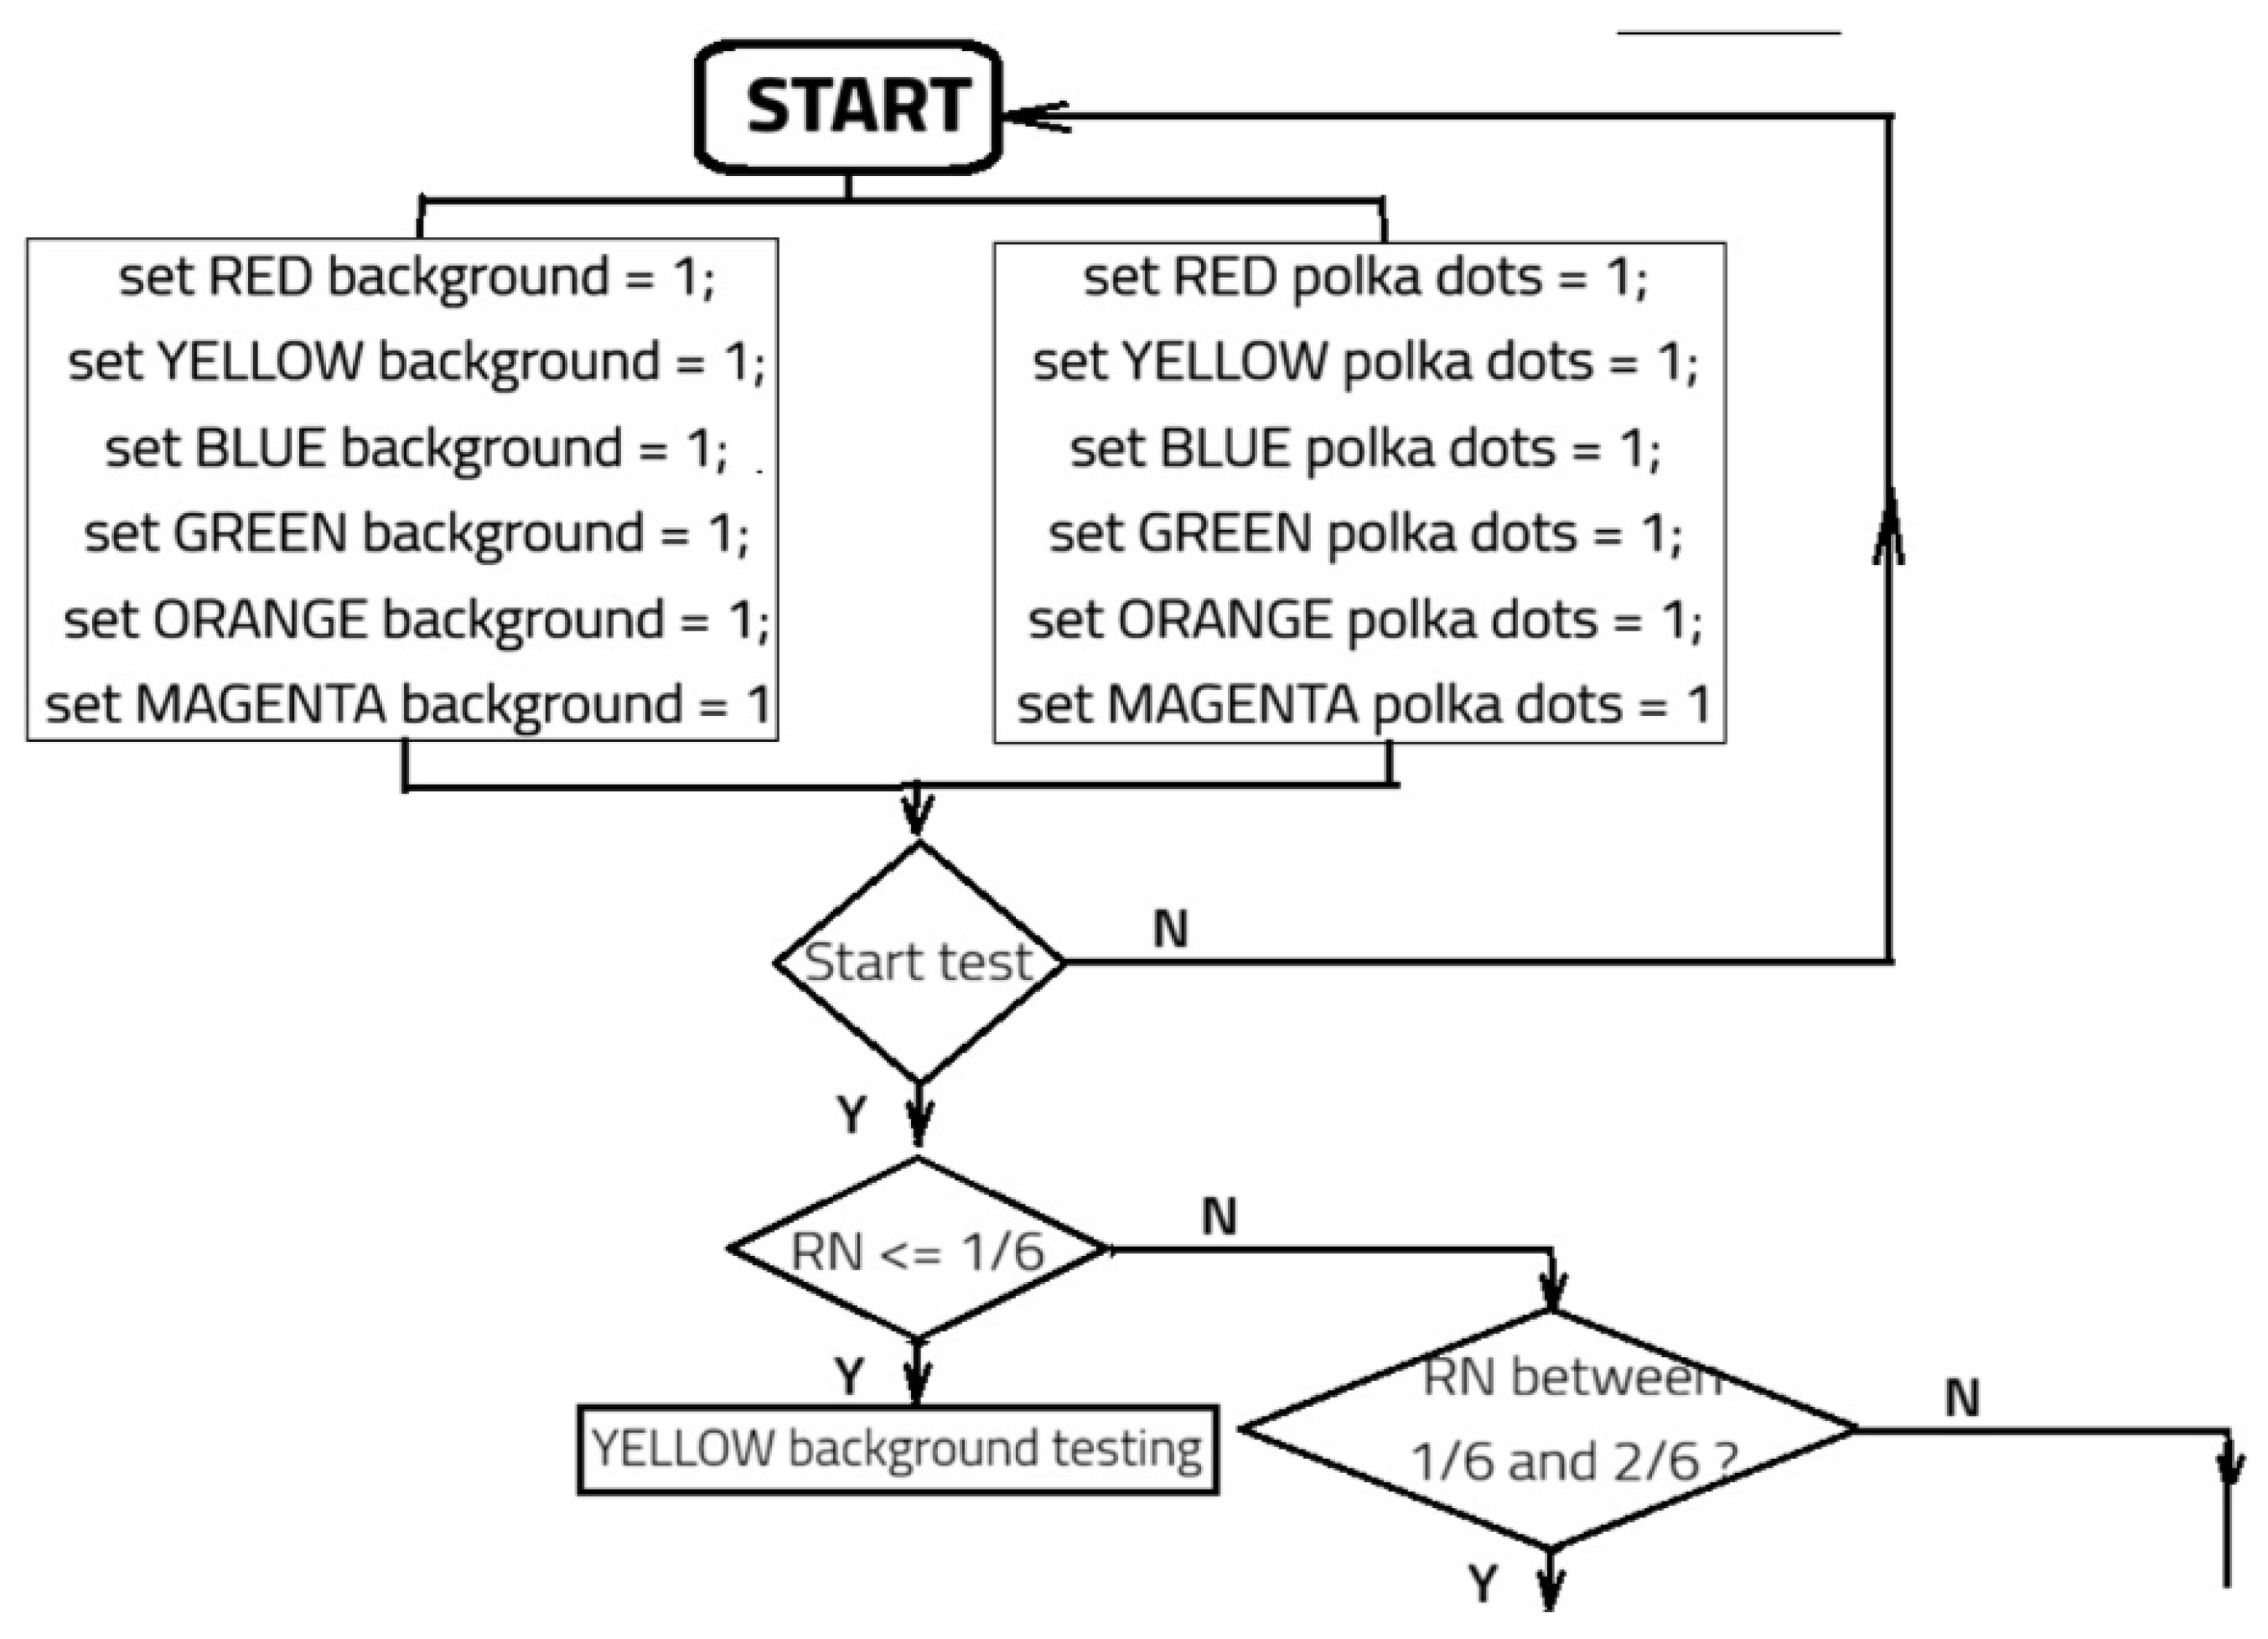
Figure 1. Logic scheme related to the interface programing algorithm—part 1.
Engproc 148 00022 g001
Figure 2. Logic scheme related to the interface programing algorithm—part 2.
Engproc 148 00022 g002
Figure 3. The software interface for testing while running. There are 6 colors used for tests. Three of theese are the fundamental colors (RGB) and other three colors (yellow, orange, magenta) are optical combinations of these. Theese are the most suggestive for the chromatic tests.
Engproc 148 00022 g003
Figure 4. The obtained score for all tested subjects for all backgrounds.
Engproc 148 00022 g004
Figure 5. The obtained averaged scores for the two groups of tested persons.
Engproc 148 00022 g005
Table 1. Tested subjects’ results.
Subject No. RED bkgr.YELLOW
bkgr.
BLUE
bkgr.
GREEN
bkgr.
ORANGE
bkgr.
MAGENTA
bkgr.
TOTAL Score
RELEBRELEBRELEBRELEBRELEBRELEBRELEB
1810108797101010101010101079108.339.339.83
210108798101091010910101010999.509.678.83
39710910998108101098101010108.678.839.83
4691091099101091010101010108109.009.509.83
5910101091010109810106101079108.339.509.67
61010910101061098810107991088.839.179.17
791088910101091089910101010109.339.509.33
891010101099910109101081099109.509.179.83
9109109101099101091010101081099.339.509.83
101010969109107101099101088108.679.509.17
111099961081010799910999108.678.839.50
12878101088910989910999108.838.839.17
134371010109710899969810108.007.509.17
14979710899985981010101098.508.509.00
154998810985989109101010108.338.678.83
166910101010968479910897107.838.179.17
1787101010108910810991091010108.839.339.67
1810999998910106810910109109.508.509.33
1989710101099108891010101010109.179.339.33
2086101010710108986910979108.838.838.33
217510910101091099910101091099.008.839.67
22910101010109979101091010910109.179.839.50
23941010610108910108101010101099.838.009.33
2410681010101010101010910101010101010.009.339.50
259101010101010810991010101071099.179.509.83
266434655255552566784.674.835.33
27563410568639953947104.507.177.00
283285655532384344743.834.335.33
29536777108107978696987.177.007.83
303356476879878779866.836.336.50
Disclaimer/Publisher’s Note: The statements, opinions and data contained in all publications are solely those of the individual author(s) and contributor(s) and not of MDPI and/or the editor(s). MDPI and/or the editor(s) disclaim responsibility for any injury to people or property resulting from any ideas, methods, instructions or products referred to in the content.