


Abstract
This paper presents a physics-informed Deep Q-Network (DQN) framework for optimizing the deployment of 100 vortex bladeless turbines (VBTs) in a Saharan microgrid. The proposed approach integrates wake interaction modeling, land-use constraints, techno-economic factors, and power quality (PQ) indicators at the point of common coupling. The novelty lies in coupling aerodynamic modeling with reinforcement learning and grid constraints. Results show that dense layouts (≤400 m2) yield up to 41% gains but degrade PQ (Pst > 1.0, THD > 5%). An optimal range of 500–800 m2 achieves stable performance with moderate gains (6–9%) and acceptable PQ. Larger surfaces (>1000 m2) show limited benefits (<4%). The framework supports efficient and sustainable wind deployment in constrained environments.
1. Introduction
The transition toward decentralized and sustainable energy systems requires compact and efficient solutions capable of operating under constrained land conditions. In this context, Vortex Bladeless Turbines (VBTs) have emerged as a promising alternative to conventional horizontal-axis wind turbines. Based on vortex-induced vibrations (VIV), these systems convert oscillatory motion into electrical energy, eliminating rotating blades and reducing mechanical complexity, maintenance requirements, and environmental impact. Recent studies have confirmed the potential of VBT systems to achieve simplified design with acceptable energy performance under realistic operating conditions [1,2,3].
VBTs are particularly suitable for deployment in dense or constrained environments such as urban areas and isolated microgrids. However, when deployed in compact configurations, strong wake interactions may significantly affect their performance. Previous studies have addressed this issue using analytical wake models and metaheuristic optimization techniques such as Ant Colony Optimization (ACO) and wake-loss minimization approaches [4,5], identifying an optimal surface range between 500 and 800 m2 for balancing energy production and land use.
Despite these advances, conventional optimization approaches remain limited by their static nature and lack of adaptability to dynamic operating conditions. To overcome these limitations, this paper proposes a Deep Reinforcement Learning approach based on the Deep Q-Network (DQN) algorithm. The proposed framework enables an intelligent agent to iteratively learn optimal turbine layouts by considering aerodynamic interactions, spatial constraints, and techno-economic factors. Reinforcement learning approaches have recently demonstrated strong performance in complex energy systems and microgrid management problems characterized by nonlinear dynamics and uncertainty [6,7,8,9].
In addition, the integration of VBT systems into electrical networks raises power quality challenges due to the oscillatory nature of VIV-based generation. This work evaluates the impact of turbine layout on key power quality indicators, including harmonic distortion and flicker at the point of common coupling. These issues are consistent with recent findings on renewable-rich microgrids, where power quality degradation remains a critical challenge for stable grid operation [10,11,12]. A comparative analysis between random and optimized configurations is conducted within a realistic microgrid context in Boujdour, Morocco, representative of hybrid renewable systems deployed in remote and constrained environments [13,14,15].
The main contributions of this work are threefold: (i) the development of a physics-informed DQN framework for compact VBT layout optimization, (ii) the integration of aerodynamic, electrical, and economic constraints into a unified model, and (iii) the identification of an optimal deployment range ensuring both energy efficiency and grid compatibility.
The physics-informed aspect of the proposed framework lies in embedding aerodynamic wake interactions and power quality constraints directly into the state representation and reward function, ensuring that the learning process remains consistent with physical and grid-level operational constraints.
2. System Modeling and Environment
2.1. Vortex Bladeless Turbine Modeling and VIV Mechanism
Vortex Bladeless Turbines (VBTs) exploit vortex-induced vibrations (VIV) to convert wind energy into electricity through oscillatory motion rather than rotational dynamics. When wind flows around a cylindrical mast, alternating vortex shedding generates periodic transverse forces, producing structural oscillations. This phenomenon, known as a von Kármán vortex street, governs the energy conversion process.
The vortex shedding frequency is defined by the Strouhal relation:
where U is the wind speed, D the mast diameter, and ≈ 0.2 represents the Strouhal number for circular cylinders under subcritical flow conditions [16]. This relation governs vortex shedding dynamics and directly links flow velocity to excitation frequency.
Maximum energy transfer occurs under the lock-in condition when , leading to resonance between fluid excitation and structural dynamics. This regime is typically observed within a reduced velocity range:
where denotes the reduced velocity, U is the incoming wind speed, D is the characteristic diameter of the mast, and is the natural frequency of the structure. This parameter controls the lock-in phenomenon, which is essential for efficient energy extraction in VIV-based systems.
Which corresponds to practical wind speeds between 4 and 8 m/s for VBT systems.
2.2. Structural Dynamics and Energy Conversion
The dynamic response of a VBT can be approximated by a single-degree-of-freedom system:
where m, c, and k represent mass, damping, and stiffness, respectively.
F(t) represents the aerodynamic forcing induced by vortex shedding, intrinsically linked to periodic fluid–structure interactions governed by the Strouhal relation, thereby ensuring consistency between fluid excitation and structural response [16].
Advanced designs incorporate nonlinear stiffness mechanisms (e.g., magnetic tuning) to extend the lock-in range and improve energy capture. Geometric optimization, including tapered mast configurations, further enhances vortex synchronization and aerodynamic efficiency.
Geometric optimization, including tapered mast configurations, further enhances vortex synchronization and aerodynamic efficiency, as demonstrated in recent studies on VBT design and optimization [2,17].
The extracted power is expressed as:
where is the air density, A is the effective swept area of the turbine, is the conversion efficiency coefficient, and U is the incoming wind speed. Although lower than conventional turbines, VBT efficiency (2–15%) is offset by simplified structure and dense deployment capability.
The resulting power corresponds to the electrical output after conversion losses, and although lower than conventional turbines, VBT efficiency is compensated by simplified structure and dense deployment capability [1].
2.3. Wake Modeling and Interactions
In multi-turbine configurations, wake interactions significantly impact performance. Although VBT wakes differ from classical HAWT wakes, simplified analytical models such as Jensen-type formulations remain widely used due to their computational efficiency and suitability for layout optimization [4,5].
A modified Jensen-type formulation is adopted:
with the velocity deficit coefficient:
where R is the wake radius at a downstream distance x, R0 is the initial rotor radius, k is the wake expansion coefficient, is the free-stream wind speed, is the wind speed at distance x, is the velocity deficit coefficient, and is the thrust coefficient.
Multiple wake interactions are modeled through quadratic superposition:
This quadratic superposition approach provides a practical approximation of cumulative wake effects in multi-turbine configurations and is widely adopted in wind farm optimization studies [4].
This approach captures the cumulative impact of upstream turbines on downstream flow conditions.
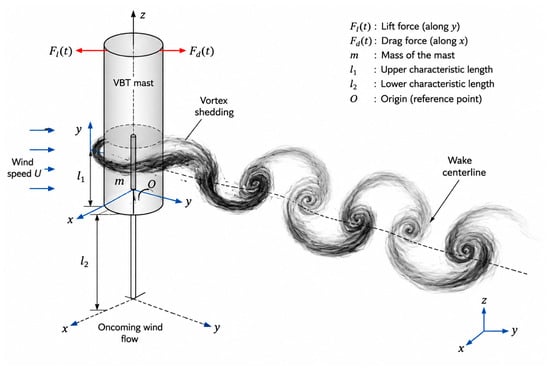
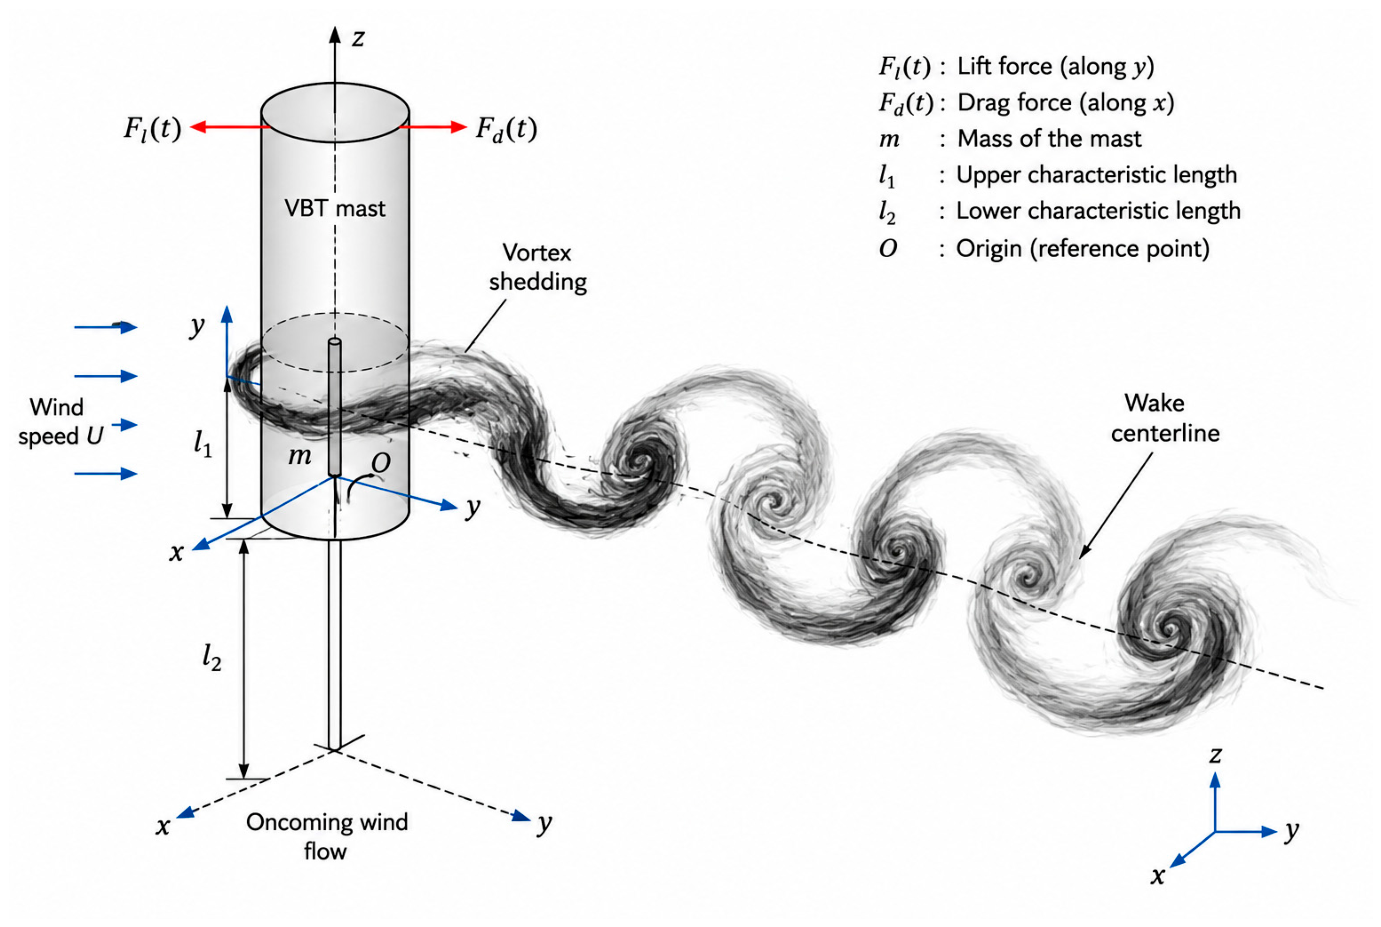
Figure 1 illustrates the vortex-induced vibration mechanism and the simplified wake interaction model adopted for the VBT array.
Figure 1.
Schematic representation of the vortex-induced vibration mechanism and wake interactions in VBT systems.
The dashed line indicates the wake centerline used to represent the idealized downstream trajectory of the vortex street.
2.4. Power Output Under Wake Influence
The effective wind speed at each turbine is reduced by wake interactions:
This cubic dependence highlights the importance of optimal spacing to limit energy losses. The model provides a computationally efficient framework for integration within optimization algorithms.
2.5. Site Description and Deployment Scenario
The study is conducted for the Boujdour coastal region (southern Morocco), characterized by favorable wind conditions and low terrain complexity. Average wind speeds typically range between 4 and 8 m/s in the operating regime of VBT systems.
The considered system includes 100 VBT units (≈25 W each), deployed over surfaces ranging from 100 m2 to 2000 m2. This configuration enables evaluation of the trade-off between turbine density, wake interactions, and land use. Previous optimization studies identified an optimal range between 500 and 800 m2, which serves as a reference for the present analysis. Such configurations are consistent with hybrid microgrid deployments in remote regions, where renewable integration must balance resource availability, land constraints, and system reliability [13,14,15].
2.6. Grid Integration and Power Quality Constraints
Beyond aerodynamic considerations, VBT deployment introduces power quality (PQ) challenges due to the oscillatory nature of energy conversion. Key issues include voltage fluctuations, flicker, harmonic distortion, and ramp-rate variability, particularly in weak or islanded microgrids. These power quality challenges are well documented in renewable-rich microgrids, where intermittent generation and converter-based systems introduce harmonic distortion and voltage fluctuations [10,11,12].
To address these aspects, the proposed framework incorporates PQ indicators at the PCC, including:
- short-term flicker (Pst);
- total harmonic distortion (THD);
- power ramp-rate variations.
To quantitatively assess harmonic distortion at the point of common coupling (PCC), the total harmonic distortion (THD) is defined as the ratio of the root mean square of higher-order voltage harmonics to the fundamental component, in accordance with standard power quality formulations. The acceptable THD limits considered in this study follow IEC 61000 standards series of international standards governing electromagnetic compatibility and power quality [18,19].
where represents the RMS voltage of the nth harmonic component and denotes the RMS value of the fundamental voltage. The Total Harmonic Distortion (THD) quantifies the distortion level of the voltage waveform and is typically expressed as a percentage. This formulation follows standard power quality definitions and is consistent with international grid codes and IEC 61000 standards [18,19].
Mitigation strategies such as converter control, filtering, and battery energy storage systems (BESS) are considered to ensure compliance with grid standards.
This integrated approach aligns with recent advances in renewable-rich microgrid operation, where co-optimization of generation and grid constraints improves stability and system reliability.
3. DQN-Based Optimization Framework
To address the limitations of static optimization approaches, a Deep Q-Network (DQN) framework is employed to optimize the spatial deployment of 100 Vortex Bladeless Turbines (VBTs) under varying land constraints. The objective is to maximize energy production while minimizing wake interactions and ensuring efficient land utilization. As a Deep Reinforcement Learning (DRL) method, DQN has demonstrated strong performance in high-dimensional and nonlinear optimization problems, particularly in energy systems, microgrid control, and spatial planning [6,7,8,9].
3.1. Reinforcement Learning Formulation
The layout optimization problem is formulated as a Markov Decision Process (MDP) defined by the tuple where S represents the state space, including turbine configuration, wake interactions, and land occupancy, A denotes the action space corresponding to feasible layout modifications, T is the transition function governed by the simulation environment, R is the reward function, and is the discount factor. At each timestep t, the agent observes a state , selects an action , receives a reward , and transitions to a new state . The objective is to maximize the expected cumulative reward:
The optimal action-value function is approximated using the Bellman update:
This formulation enables adaptive learning of optimal layouts under complex aerodynamic and grid-related constraints, as demonstrated in recent reinforcement learning applications to microgrid energy management and decision optimization [7,8,9].
3.2. State and Action Space Design
The state representation integrates both aerodynamic and electrical information, including turbine spatial coordinates, a wake interaction map based on Jensen-type modeling, land occupancy, wind conditions such as speed and direction, and power quality indicators including total harmonic distortion (THD), short-term flicker (), and power ramp variations. This hybrid representation ensures that layout decisions simultaneously account for energy efficiency and grid compatibility.
The action space is defined through a set of discrete operations applied at each decision step, including displacement of a turbine in cardinal directions, swapping positions between turbines, or maintaining the current configuration. This formulation ensures controlled exploration while preserving system stability during the learning process.
3.3. Reward Function with PQ Integration
The reward function balances energy gain and spatial constraints while explicitly penalizing power quality (PQ) violations:
where represents the incremental power gain, accounts for wake overlap and spatial penalties, and α is a weighting coefficient. Additional penalties are applied when PQ thresholds are exceeded, ensuring compliance with grid integration constraints. This formulation promotes solutions that are both energy-efficient and compliant with PQ standards, consistent with recent studies on grid-aware optimization of renewable energy systems [10,11,12].
3.4. Simulation Environment
The simulation environment models wake propagation using a modified Jensen approach, allowing estimation of local wind speed at each turbine. After each action, both aerodynamic conditions and grid-level indicators are updated. The aggregated power output is then injected into a simplified microgrid model, where PQ metrics are evaluated at the point of common coupling (PCC), in line with recent research on renewable integration in distributed energy systems [10,11,12].
3.5. Neural Network Architecture and Training
The Q-function is approximated using a feedforward neural network composed of two hidden layers with 64 and 32 neurons, respectively, using ReLU activation functions. The selected architecture represents a trade-off between computational efficiency and convergence stability. Training robustness is ensured through experience replay, target network updates, and an exploration strategy, where ε decreases progressively from 1.0 to 0.01.
The main hyperparameters include a learning rate of 0.001, a discount factor γ of 0.99, a replay buffer size of 10,000, a batch size of 64, and an episode length of 200 steps. Negative rewards are assigned in cases of turbine overlap, spacing violations, or excessive PQ deviations, enabling the learning process to incorporate both physical and grid-related constraints.
3.6. Multi-Surface Evaluation
The trained agent is evaluated across multiple land surfaces ranging from 100 to 2000 m2. Performance metrics include total energy production, wake-induced losses, spatial efficiency, and power quality indicators such as THD, , and ramp-rate variations. Results indicate that the DQN-based approach consistently outperforms baseline methods, particularly in constrained configurations between 500 and 800 m2, where wake interactions and PQ issues are most significant. These findings are consistent with previous studies on layout optimization and renewable energy system integration [4,5,10].
3.7. Optimization Workflow
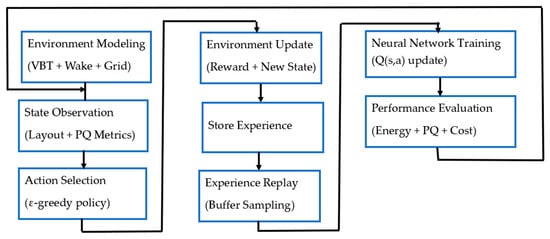
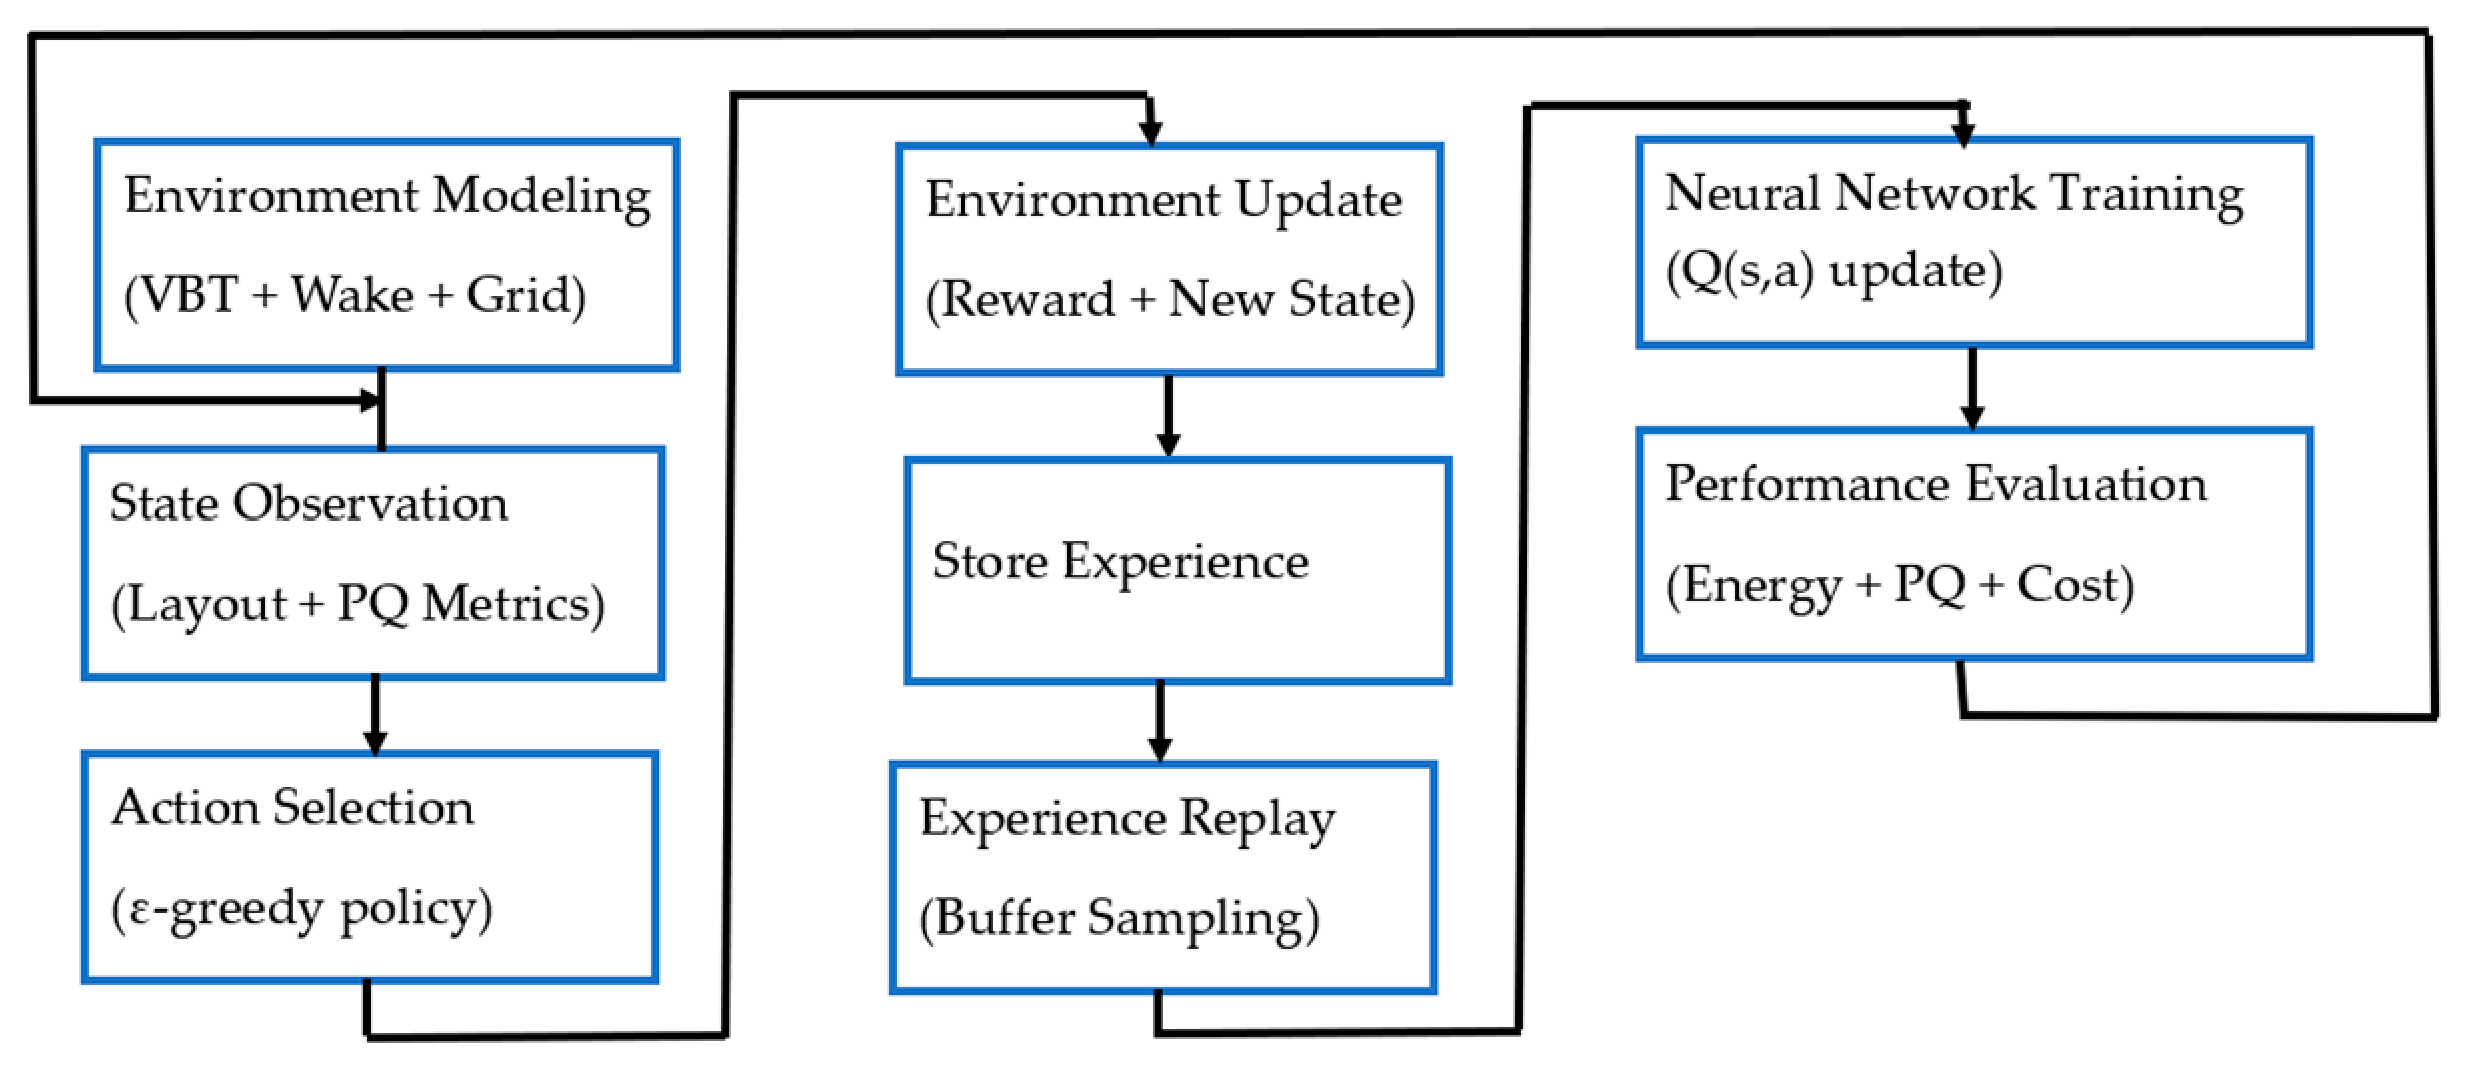
Figure 2 illustrates the overall DQN-based optimization workflow, including environment modeling, agent interaction, neural training, and performance evaluation. This framework enables adaptive spatial optimization by jointly considering aerodynamic interactions and grid-related constraints. The obtained results are benchmarked against Ant Colony Optimization (ACO), confirming the effectiveness of learning-based approaches for compact wind farm deployment. Similar studies have emphasized the importance of adaptive control strategies and wake-aware optimization in improving system performance [4,6].
Figure 2.
Learning workflow of the DQN training process.
4. Results and Discussion
The proposed DQN-based optimization framework was evaluated across multiple land surface configurations ranging from 100 m2 to 2000 m2. The analysis focuses on energy production, power output, economic performance, and power quality (PQ) indicators at the point of common coupling (PCC). The results reveal a nonlinear relationship between surface area and optimization benefits, primarily driven by wake interactions, turbine density, and grid-side constraints, consistent with previous studies on wind farm layout optimization and renewable integration [4,5,10].
4.1. Small Surfaces (≤400 m2): Wake-Dominated Regime
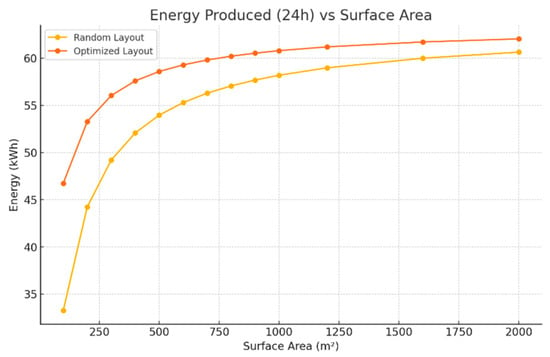
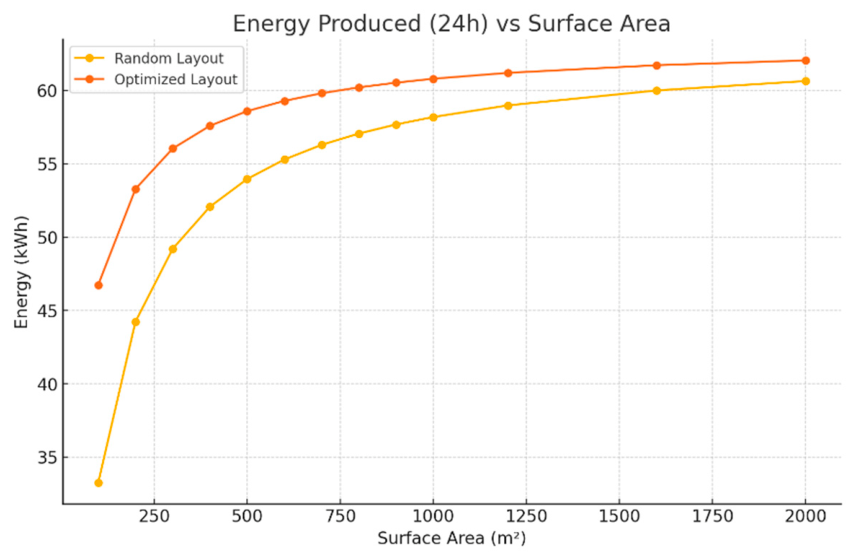
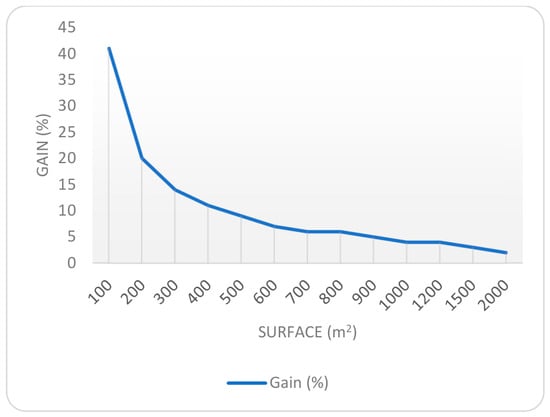
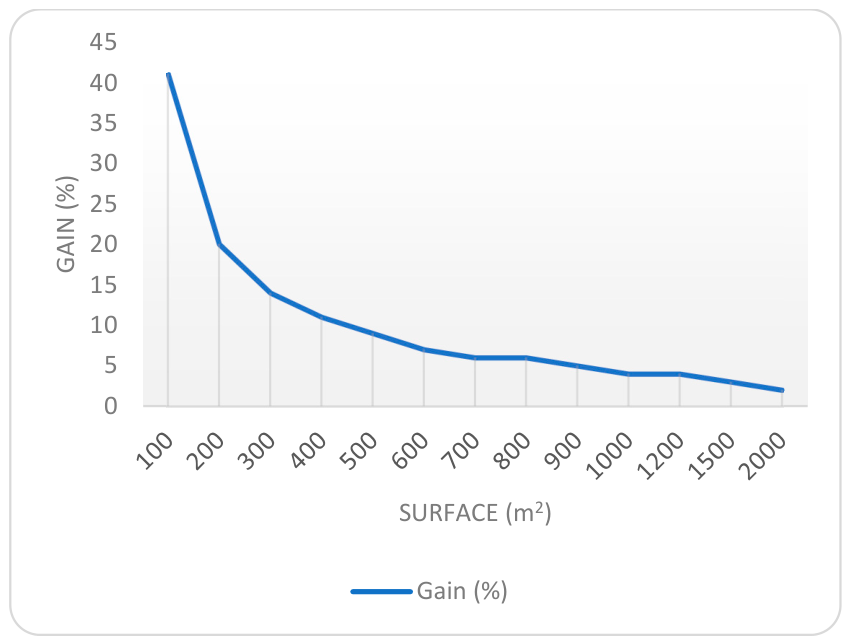
At highly constrained surfaces (100–300 m2), turbine density induces strong wake interactions, significantly reducing effective wind velocity and oscillation amplitude. Even with DQN optimization, total power remains limited (<2 kW), with daily production ranging from 33 to 53 kWh. However, relative gains are substantial, reaching up to +41% at 100 m2 and +20% at 200 m2, as illustrated in Figure 3 and Figure 4, which show the variation in daily energy production and relative gain with surface area for both random and optimized layouts, highlighting the strong impact of wake interactions in highly constrained configurations. These results confirm the strong influence of wake losses in dense configurations, as widely reported in wind farm optimization studies [4,5].
Figure 3.
Daily energy production versus surface area for random and optimized layouts.
Figure 4.
Variation in energy gain (%) with surface area.
From a grid perspective, clustered power injection leads to pronounced variability, resulting in high flicker levels ( > 1.0) and increased harmonic distortion. These observations are consistent with known power quality issues in renewable-rich microgrids, where high variability and converter-based generation lead to voltage fluctuations and harmonic distortion [10,11,12]. Although optimization improves energy yield, PQ degradation remains a critical limitation in dense layouts, requiring mitigation strategies such as energy buffering or filtering techniques.
4.2. Medium Surfaces (500–800 m2): Optimal Deployment Zone
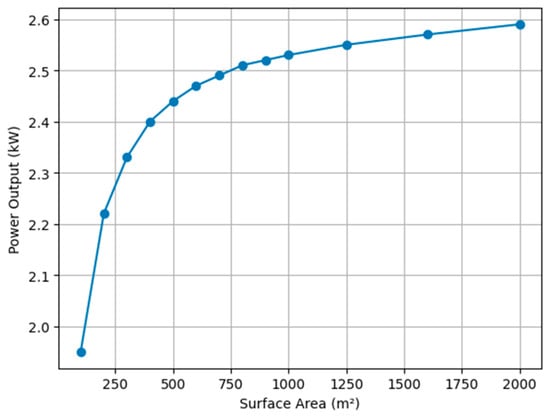
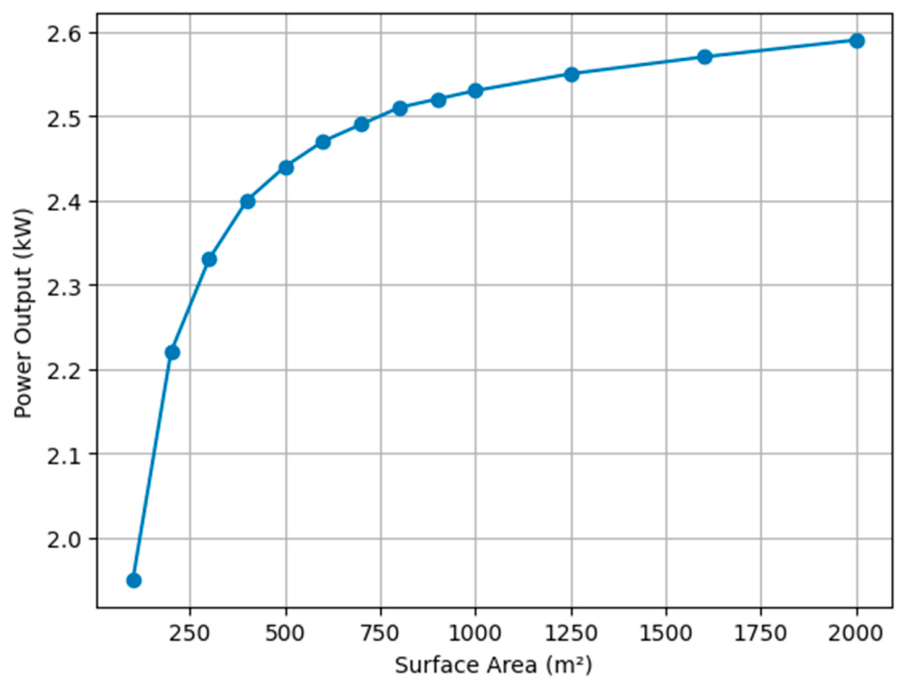
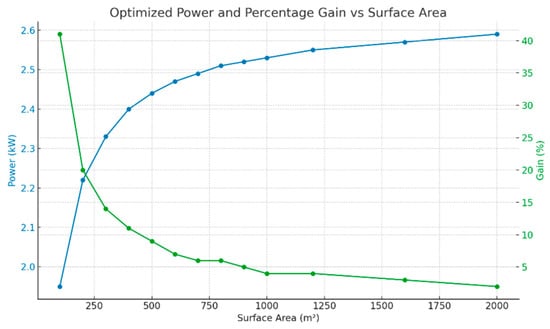
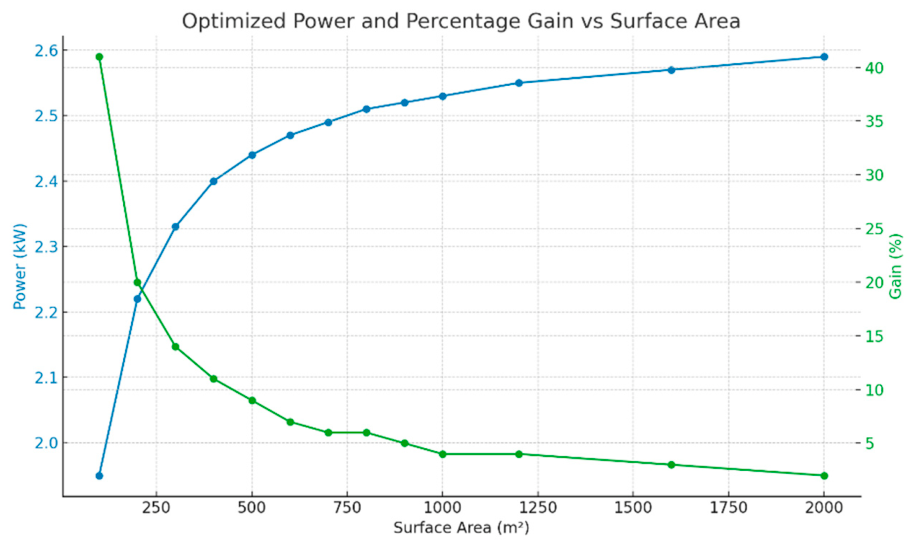
The 500–800 m2 range represents the optimal trade-off between energy efficiency and land utilization. Increased spacing reduces wake overlap while maintaining compact deployment. The optimized layouts achieve daily production above 58 kWh, with power output between 2.44 and 2.52 kW. Figure 5 and Figure 6 present the evolution of power output and optimization gain as a function of surface area, illustrating the improved performance achieved within the optimal deployment range. These findings align with previous studies highlighting the importance of spacing optimization in minimizing wake interactions [4].
Figure 5.
Power output (kW) versus surface area for the optimized layout.
Figure 6.
Combined analysis of optimized power output and percentage gain versus surface area.
Although relative gains are moderate (6–9%), they remain economically attractive due to limited land cost increase. More importantly, PQ performance significantly improves: flicker indices decrease below 0.8, THD remains within acceptable limits, and power fluctuations are reduced. This behavior is consistent with grid integration requirements for low-voltage microgrids and confirms that this range ensures a balance between aerodynamic performance, economic viability, and PQ compliance [10,11,12].
4.3. Large Surfaces (>1000 m2): Saturation Regime
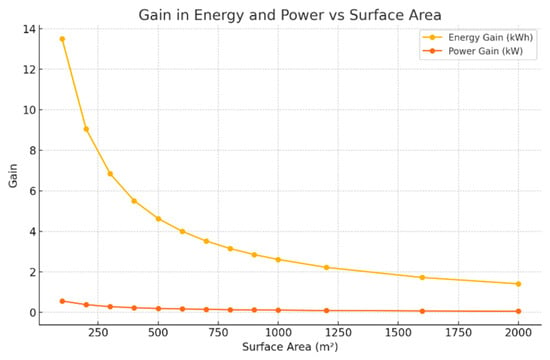
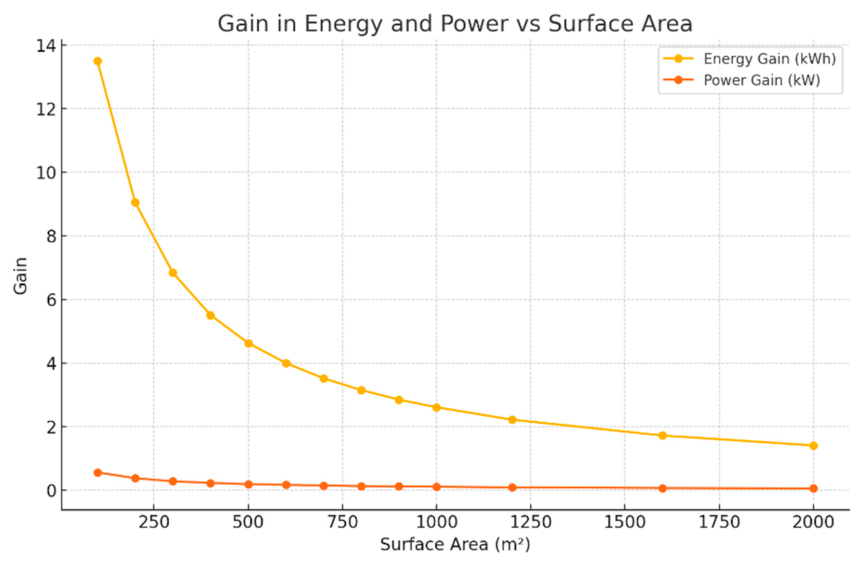
For larger surfaces, wake interactions become negligible even in non-optimized layouts. Consequently, DQN gains fall below 4%, with marginal improvements (<2 kWh/day beyond 1600 m2). The power output stabilizes around 2.59 kW, approaching free-stream conditions. Figure 7 illustrates the evolution of energy and power gain with increasing surface area, highlighting the saturation behavior as wake interactions diminish under near free-stream conditions. This saturation behavior is typical of low-density wind farm configurations, where wake effects are minimized [4].
Figure 7.
Energy and power gain versus surface area.
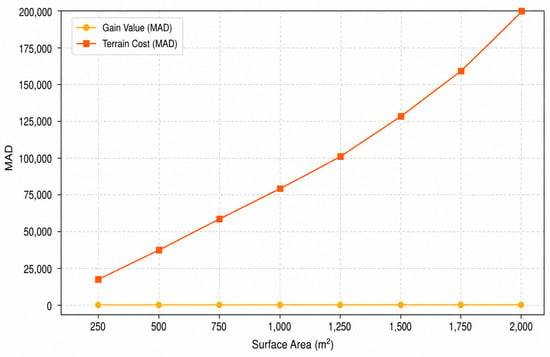
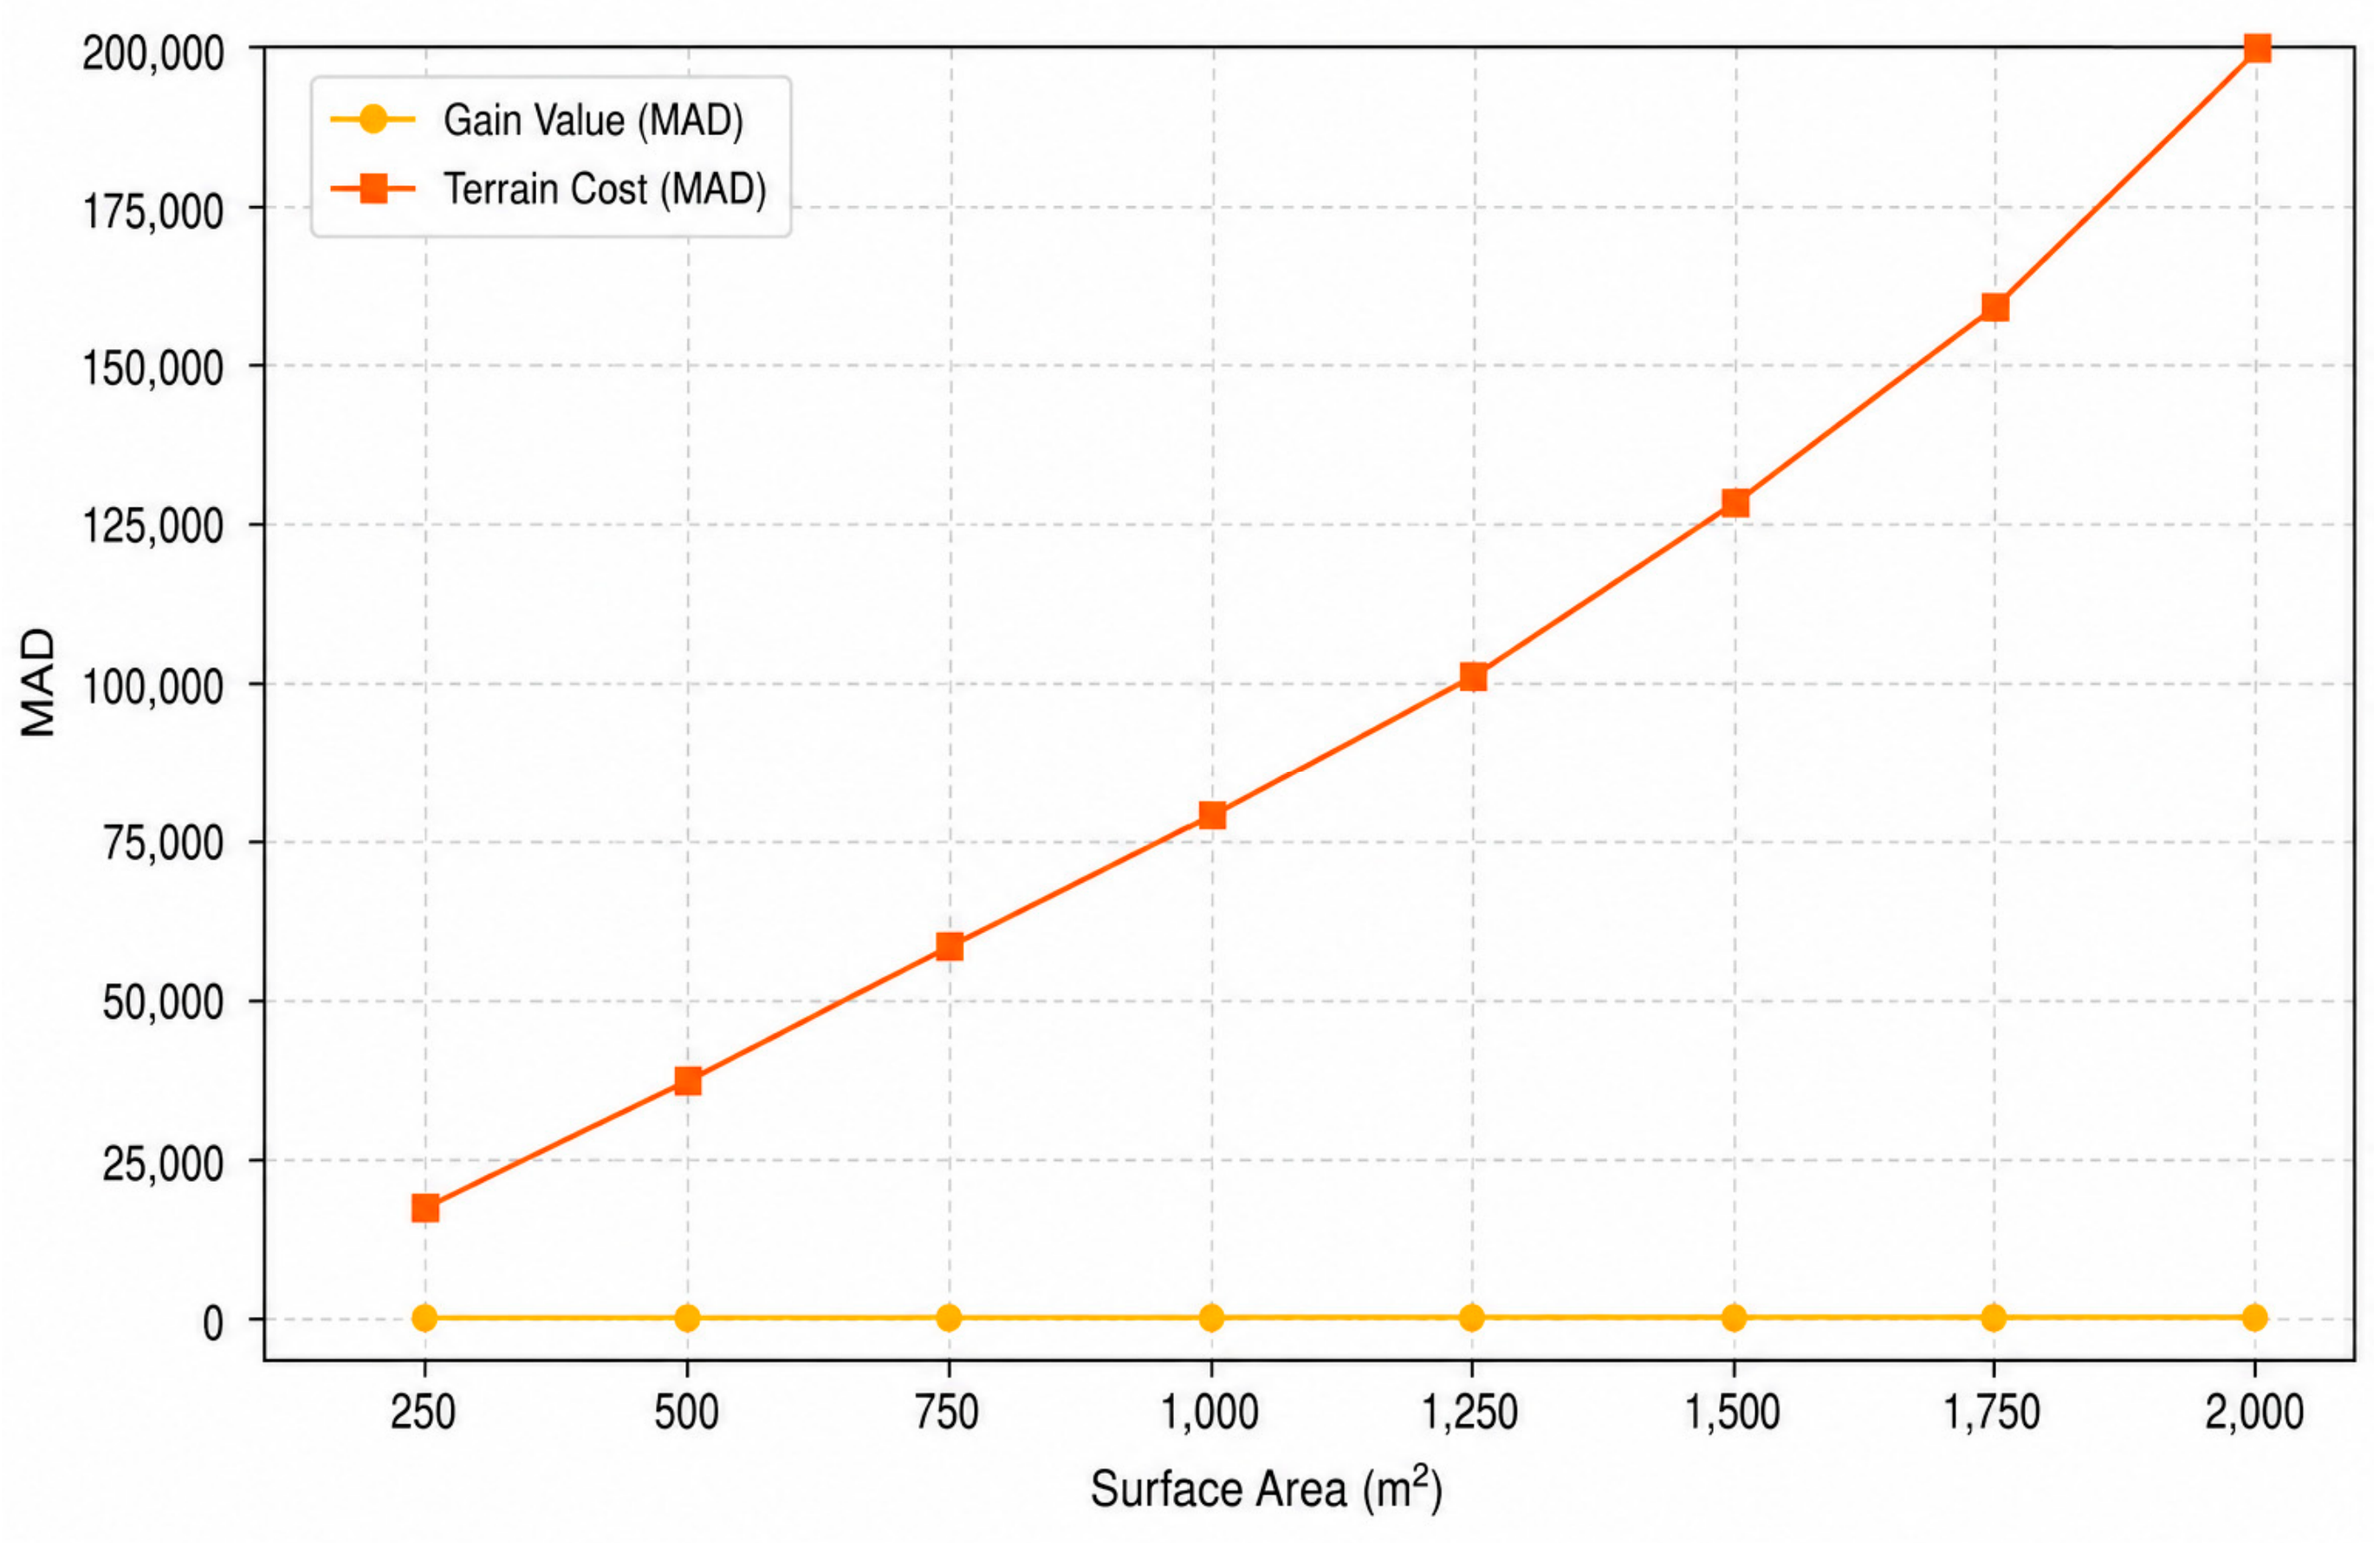
From an economic perspective, land cost increases significantly, resulting in very low gain-to-cost ratios. Figure 8 illustrates the relationship between energy gain and terrain cost, highlighting the decreasing economic efficiency as surface area increases. PQ performance is naturally improved, with negligible flicker and low harmonic distortion, consistent with reduced interaction between turbines. However, these benefits do not compensate for the increasing land cost, making such configurations less attractive for practical deployment.
Figure 8.
Economic value of energy gain versus terrain cost.
4.4. Comparative Analysis
Table 1 summarizes the performance metrics across all surface configurations, including energy production, optimization gain, and PQ indicators. The results highlight a clear transition between wake-dominated, optimal, and saturation regimes. The observed trends confirm that energy performance alone is insufficient to assess optimal deployment, and that power quality and economic constraints must be jointly considered, as emphasized in recent renewable energy system studies [10,11,12].
Table 1.
Summary of energy, optimization gain, and PQ indicators.
4.5. Key Insights
The results clearly identify three operating regimes. The dense regime (<400 m2) is characterized by strong wake losses and significant PQ degradation. The optimal regime (500–800 m2) provides the best compromise between energy, cost, and PQ. The sparse regime (>1000 m2) exhibits stable performance but limited optimization benefit. These findings confirm that layout optimization must simultaneously consider aerodynamic efficiency, economic constraints, and grid integration aspects, in agreement with recent work on hybrid renewable systems and microgrid operation [4,10].
4.6. Discussion and Perspectives
The proposed DQN framework demonstrates its ability to adaptively balance competing objectives in compact wind farm design. Compared to conventional approaches such as ACO, it enables dynamic and context-aware optimization, particularly relevant in constrained environments. Reinforcement learning approaches have shown similar advantages in energy systems optimization and adaptive control problems [6,7,8,9].
Future developments may include multi-agent reinforcement learning for distributed control, integration of real-time PQ monitoring, and co-optimization with storage systems and flexible loads, which are increasingly considered in advanced microgrid management strategies [7,8,9].
5. Conclusions
This work investigates a Deep Q-Network (DQN)-based framework for optimizing the spatial deployment of Vortex Bladeless Turbines (VBTs) in a Saharan microgrid. The results identified an optimal deployment range between 500 and 800 m2, where moderate energy gains (6–9%) are achieved while ensuring acceptable power quality (PQ) performance.
Dense configurations (≤400 m2) provide high relative gains but suffer from significant wake interactions and PQ degradation, limiting their practical applicability. In contrast, larger surfaces (>1000 m2) offer stable operation but yield marginal optimization benefits due to reduced wake effects and increasing land cost.
Overall, the proposed approach demonstrates that combining deep reinforcement learning with physics-based modeling enables efficient and grid-compliant wind farm design in constrained environments.
Author Contributions
Conceptualization, N.E.-C. and S.S.E.-C.; methodology, N.E.-C. and S.S.E.-C.; software, N.E.-C., S.S.E.-C. and A.E.-C.; validation, N.E.-C., S.S.E.-C., A.B., A.E.-C. and R.M.; formal analysis, A.E.-C. and R.M.; investigation, R.M.; resources, A.B. and A.E.-C.; data curation, R.M.; writing—original draft preparation, N.E.-C. and S.S.E.-C.; writing—review and editing, A.E.-C. and R.M.; visualization, N.E.-C. and S.S.E.-C.; supervision, N.E.-C., S.S.E.-C. and A.B.; project administration, A.B. All authors have read and agreed to the published version of the manuscript.
Funding
This research received no external funding.
Institutional Review Board Statement
Not applicable.
Informed Consent Statement
Not applicable.
Data Availability Statement
Data presented in this study are available from the corresponding author upon reasonable request.
Conflicts of Interest
The authors declare no conflict of interest.
References
- González-González, E.; Yánez, D.J.; Del Pozo, S.; Laguela, S. Optimizing bladeless wind turbines: Morphological analysis and lock-in range variations. Appl. Sci. 2024, 14, 2815. [Google Scholar] [CrossRef] [Scilit]
- Bahadur, I. Dynamic modeling and investigation of a tunable vortex bladeless wind turbine. Energies 2022, 15, 6773. [Google Scholar] [CrossRef] [Scilit]
- Eldawy, R.S.; Ghorab, A.A.; Sayed, M.M. A State-of-the-Art Review on Vortex-Induced Vibrations Phenomenon in Bladeless Wind Turbine Technology. J. Sci. Res. Rep. 2024, 30, 1045–1056. [Google Scholar] [CrossRef] [Scilit]
- Pranupa, S.; Rao, S.N.; Sriram, A.T. A review of wind farm layout optimization techniques. Int. J. Renew. Energy Res. 2023, 13, 957–965. [Google Scholar] [CrossRef] [Scilit]
- Bellat, A.; Mansouri, K.; Raihani, A.; Tajeddine, K. Optimizing the Wind Farm Layout for Minimizing Wake Losses. Adv. Sci. Technol. Eng. Syst. J. 2021, 6, 309–315. [Google Scholar] [CrossRef] [Scilit]
- Barbalho, P.I.N.; Moraes, A.L.; Lacerda, V.A.; Barra, P.H.A.; Fernandes, R.A.S.; Coury, D.V. Reinforcement learning solutions for microgrid control: A survey. IEEE Access 2025, 13, 39782–39799. [Google Scholar] [CrossRef] [Scilit]
- Liu, D.; Zang, C.; Zeng, P.; Li, W.; Wang, X.; Liu, Y.; Xu, S. Deep reinforcement learning for real-time energy management of microgrids. Front. Energy Res. 2023, 11, 1163053. [Google Scholar] [CrossRef] [Scilit]
- Nakabi, T.; Toivanen, P. Deep reinforcement learning for energy management in microgrids with flexible demand. Sustain. Energy Grids Netw. 2021, 25, 100413. [Google Scholar] [CrossRef] [Scilit]
- Wu, J.; Li, S.; Yu, Y.; Guan, Y.; Wei, B.; Chen, Z. Deep reinforcement learning-based multi-objective energy management system for microgrids under flexible energy market. Appl. Energy 2026, 406, 127223. [Google Scholar] [CrossRef] [Scilit]
- Etanya, T.F.; Tsafack, P.; Ngwashi, D.K. Power quality issues in grid-connected renewable systems: A review. Energy Rep. 2025, 13, 3181–3203. [Google Scholar] [CrossRef] [Scilit]
- Shao, H.; Henriques, R.; Morais, H.; Tedeschi, E. Power quality monitoring in wind-integrated grids: A review. Renew. Sustain. Energy Rev. 2024, 191, 114094. [Google Scholar] [CrossRef] [Scilit]
- Chahine, K.; Tarnini, M.; Moubayed, N.; El Ghaly, A. Power quality enhancement using active filtering techniques. Sustainability 2023, 15, 887. [Google Scholar] [CrossRef] [Scilit]
- Mihramane, R.L.; Ech-Charqaouy, S.S.; Saifaoui, D.; Ech-Charqaouy, N.; Ech-Charqaouy, A. Optimization of hybrid microgrid energy systems under operational constraints. Int. J. Renew. Energy Res. 2025, 15, 213–225. [Google Scholar] [CrossRef] [Scilit]
- Samal, K.B.; Mahapatra, M.; Pati, S.; Debnath, M.K. A review on microgrid control: Conventional, advanced and intelligent control approaches. Results Eng. 2025, 9, 100297. [Google Scholar] [CrossRef] [Scilit]
- Rodriguez-Gil, J.A.; Mojica-Nava, E.; Vargas-Medina, D.; Arevalo-Castiblanco, M.F.; Cortes, C.A.; Rivera, S.; Cortes-Romero, J. Energy management system in networked microgrids. Prot. Control Mod. Power Syst. 2024, 17, 315–346. [Google Scholar] [CrossRef] [Scilit]
- Christin, S.; Meunier, P.; Le Dizès, S. Fluid–structure interactions of a circular cylinder in a stratified fluid. J. Fluid Mech. 2021, 910, A45. [Google Scholar] [CrossRef] [Scilit]
- Mohamed, Z.; Soliman, M.; Feteha, M. Optimal design approach for bladeless wind turbines considering composite materials. Sci. Rep. 2025, 15, 1355. [Google Scholar] [CrossRef] [Scilit] [PubMed]
- IEC 61000-3-2:2018; Electromagnetic Compatibility (EMC)–Part 3-2: Limits–Limits for Harmonic Current Emissions (Equipment Input Current ≤ 16 A per Phase). IEC: Geneva, Switzerland, 2018.
- IEC 61000-3-3:2013+AMD1:2017; Electromagnetic Compatibility (EMC)–Part 3-3: Limits–Limitation of Voltage Changes, Voltage Fluctuations and Flicker in Public Low-Voltage Supply Systems. IEC: Geneva, Switzerland, 2017.

Disclaimer/Publisher’s Note: The statements, opinions and data contained in all publications are solely those of the individual author(s) and contributor(s) and not of MDPI and/or the editor(s). MDPI and/or the editor(s) disclaim responsibility for any injury to people or property resulting from any ideas, methods, instructions or products referred to in the content. |
© 2026 by the authors. Licensee MDPI, Basel, Switzerland. This article is an open access article distributed under the terms and conditions of the Creative Commons Attribution (CC BY) license.