


Abstract
Biomass waste is a renewable energy source applied in various forms of energy, including electricity, heat, and fuel. Fuel generated through the pyrolysis of gas-fired industrial burners has played a crucial role in decreasing carbon emissions and addressing the greenhouse effect. This work investigated the efficiency of pyrolysis in gas-fired industrial burners using a numerical study using Computational Fluid Dynamics (CFD). The study observed the effects of varying combustion power levels (200 kW, 700 kW, and 1000 kW) and operational pressures (105.5 kPa and 211 kPa). The numerical analysis employs the k-ω standard viscous model for turbulence and assumes steady-state conditions. Grid testing and validation were conducted based on prior studies. The results show that the highest efficiency was achieved at 62.03% using a combustion power level of 1000 kW and an operating pressure of 211 kPa. The selected parameters are the recommended configuration for practical applications.
1. Introduction
Biomass waste is organic material derived from living organisms, such as plants, animals, and microorganisms, that are no longer utilized [1]. Biomass waste represents a renewable energy source that can be converted into various forms of energy, such as electricity, heat, and fuel [2]. To process biomass waste, pyrolysis using gas-fired industrial burners is frequently employed [3]. Converting biomass waste into fuel is a viable solution to address the energy crisis and reduce dependence on fossil fuels [4]. The reason is that fuel made from biomass waste processed with gas-fired industrial burners has been shown to greatly help in lowering carbon emissions and reducing the greenhouse effect [5]. Therefore, researchers and engineers have made optimizing the combustion of biomass waste through pyrolysis in gas-fired industrial burners to obtain alternative fuels a primary concern [6]. A gas-fired industrial burner is a combustion device that uses gas as fuel to perform the pyrolysis process [7]. In practice, the application of pyrolysis with gas-fired industrial burners presents numerous benefits, including significant emission reduction potential, cost-effective production, and elevated thermal efficiency [8]. However, pyrolysis using gas-fired industrial burners also has drawbacks, including suboptimal final product purification, fouling, and corrosion [9]. Given these aspects and the need to optimize pyrolysis using gas-fired industrial burners, innovative and in-depth research is required, both experimentally and numerically [10]. The goal of optimization is to achieve high performance and efficiency in pyrolysis using gas-fired industrial burners [11].
Researchers have used various methods to achieve optimal performance and efficiency in pyrolysis using gas-fired industrial burners. For instance, Li et al. [12] characterized combustion power level variations of 3.65 MW and 3.91 MW using numerical methods. The results showed that carbon utilization efficiency for combustion increased by 67.19%. Tabakaev et al. [13] investigated the mass fraction of 10% and 20% in microwave pyrolysis of solid organic raw materials using experimental and numerical methods to assess efficiency and energy consumption. The research revealed that increasing the mass fraction from 10% to 20% resulted in a 32% increase in efficiency. Chen et al. [14] applied the combustion temperatures of 600 °C, 650 °C, and 700 °C to waste tire pyrolysis using a numerical approach to determine thermal performance and efficiency. The results showed that a temperature of 700 °C yielded the highest thermal performance and efficiency due to the shorter combustion time required. Csemány et al. [7] investigated the air volumetric flow rate during pyrolysis using gas-fired industrial burners at combustion power levels of 200 kW, 700 kW, and 1000 kW using both experimental and numerical methods. The test results indicate that secondary air is sufficient to maintain NOx emissions and flame temperature at relatively low values, meeting the emission standard of 250 mg/Nm3 at 3% O2 content in the flue gas and the refractory wall temperature requirement of 1400 °C. Kumar et al. [15] proposed mass flow rates of fluid of 8.5 kg/s and 11.3 kg/s to characterize combustion efficiency in pyrolysis using gas-fired industrial burners. The research results show a 44.4% increase in combustion efficiency at a mass flow rate of 11.3 kg/s.
Previous studies have focused on how combustion factors affect the efficiency of gas-fired industrial burners, examining aspects such as combustion power levels, fluid mass flow rate, and combustion temperature. There has yet to be a numerical study examining the impact of variations and operational pressures on the combustion performance and efficiency of gas-fired industrial burners. This study aims to analyze the effects of combustion power levels of 200 kW, 700 kW, and 1000 kW, with operational pressures of 105,500 Pa and 211,000 Pa, on thermal, hydrodynamic, and efficiency aspects. The numerical analysis utilized the Computational Fluid Dynamics (CFD) software, employing the viscous k-ω Standard model for turbulence and assuming steady-state conditions for the study.
2. Research Method
2.1. Model Design
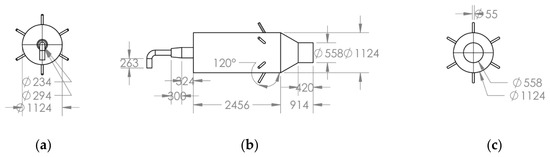
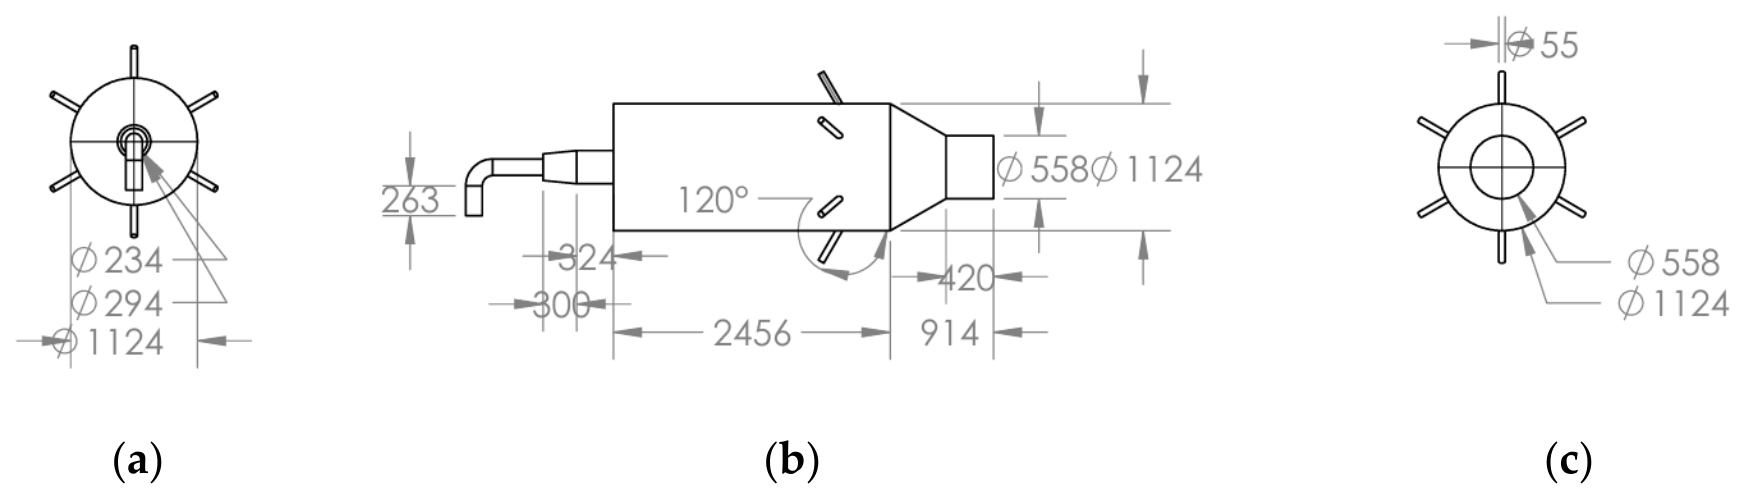
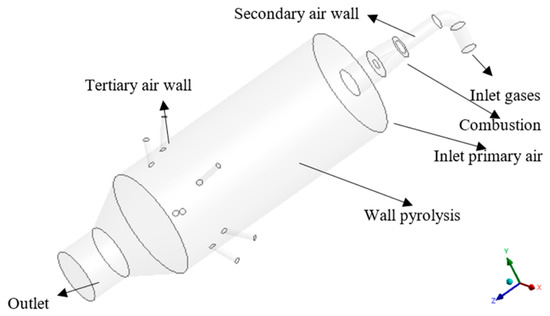
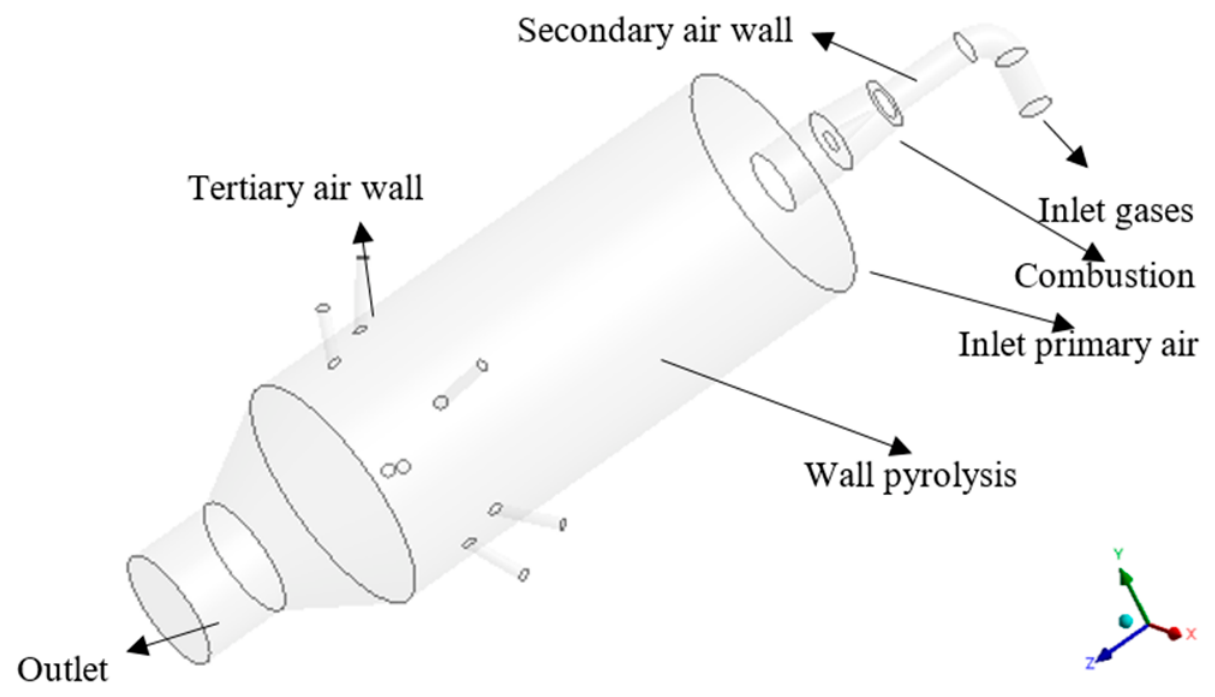
Figure 1 shows the pyrolysis gas-fired industrial burner along with its dimensions. The modeling of the pyrolysis gas-fired industrial burner was conducted using SolidWorks 2020 version software, based on the work of Csemány et al. [7]. The figure provides a three-dimensional visual representation of the pyrolysis gas-fired industrial burner and its components, which is used for numerical analysis purposes. Figure 2 shows the computational domain of the pyrolysis gas-fired industrial burner, created using the Design Modeler tool in the CFD R1 version program. The size of the computational domain is selected to analyze the performance and efficiency of the pyrolysis gas-fired industrial burner, assuming steady-state conditions while considering the differential equations of continuity, momentum, and energy.
Figure 1.
(a) Top view, (b) Side view, and (c) Front view.
Figure 2.
Computing Scope on Pyrolysis Gas-Fired Industrial Burner.
2.2. Meshing
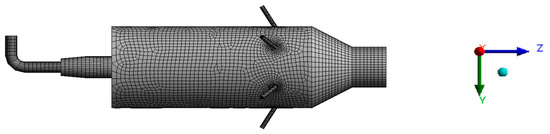
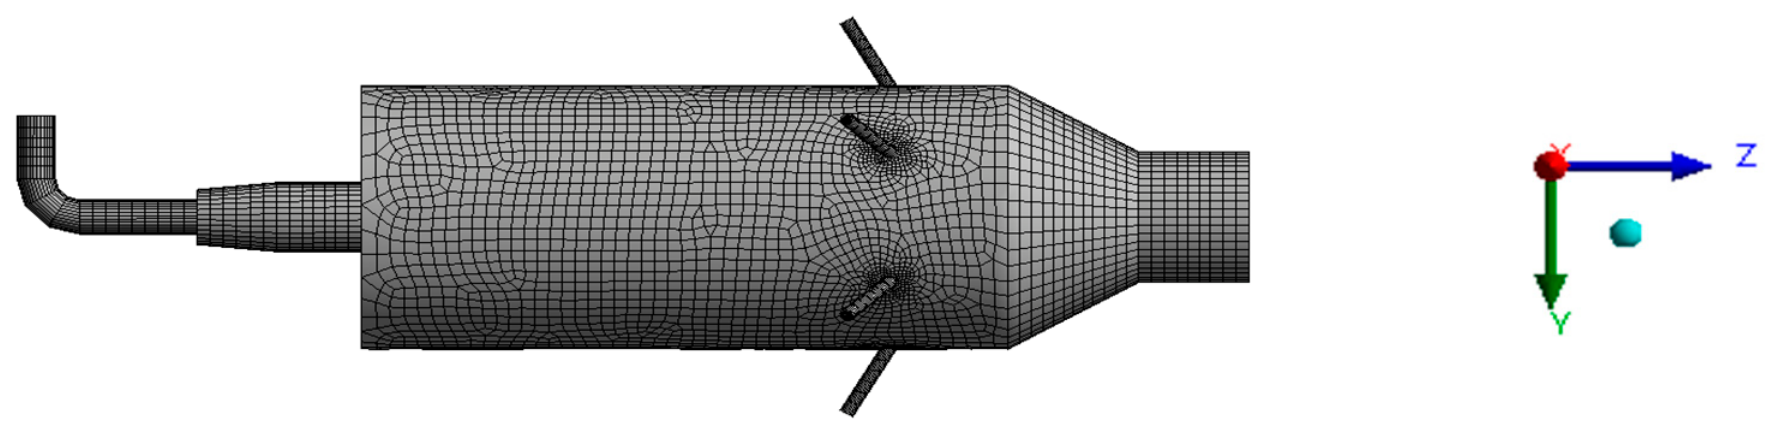
A control volume-based meshing technique was employed to discretize the differential equations, using a first-order upwind scheme to achieve enhanced accuracy and outstanding results. Furthermore, reducing computational cost was a primary consideration while maintaining mesh quality parameters such as wall y+ value, mesh metric skewness, and orthogonal quality. Figure 3 shows the poly-hexcore grid topology with high resolution and a fully structured mesh applied to the computational domain, enabling precise and accurate capture of thermal and hydraulic boundary layer effects. The mesh size at the interface of the pyrolysis gas-fired industrial burner was selected using 50 mm.
Figure 3.
Poly-Hexcore Grid Structural.
2.3. Grid Independence Test
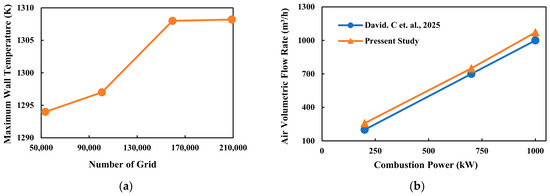
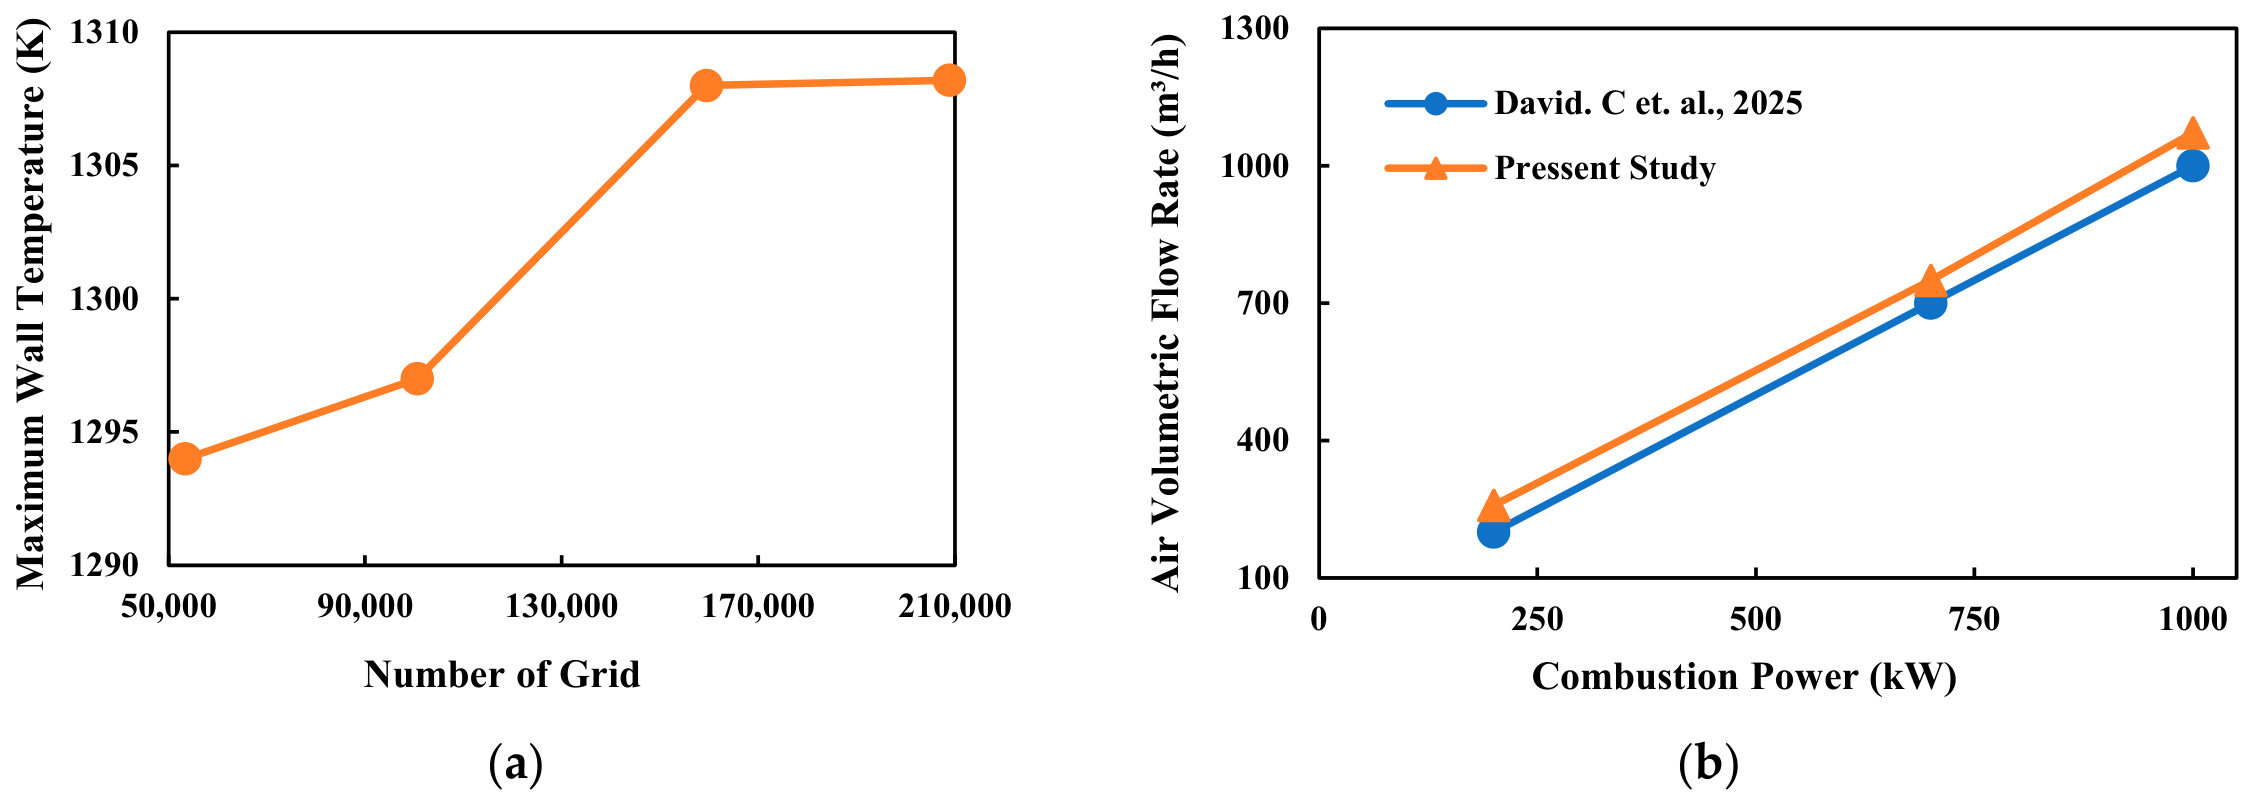
The grid independence test was conducted to identify the optimal point of the experimental values for the pyrolysis gas-fired industrial burner, based on the average temperature of the entire wall surface derived from the combustion results. The grid independence test for the pyrolysis gas-fired industrial burner geometry was performed by evaluating the number of mesh cells in the computational domain: 53,344; 100,625; 159,469; and 208,951. Figure 4a shows the results of the grid independence test, depicting the correlation between the grid number and the average wall surface temperature of the pyrolysis gas-fired industrial burner. The numerical study calculations in the grid test indicated relative errors of ±0.2% between grids 53,344 and 100,625; ±8% between grids 100,625 and 159,469; and ±0.2% between grids 159,469 and 208,951. The findings suggest that the grid comprising 159,469 cells is appropriate for application, considering the minimal variance compared to the grid of 208,951 cells, as evidenced by the wall surface temperature readings of the pyrolysis gas-fired industrial burner.
Figure 4.
(a) Grid Independence Test; (b) Validation Numerical [7].
2.4. Validation
Validation is the process of testing to identify values that correspond with those found in the referenced literature of this research. This numerical study validates findings against experimental data from Csemány et al. [7], regarding gas-fired industrial burner pyrolysis. This research aims to determine the average wall temperature of the gas-fired industrial burner during pyrolysis and calculate temperature and heat transfer rate values, which will subsequently be used to assess the energy value. This energy can be used to determine the efficiency value. The volumetric flow rate of water is utilized to ascertain the optimal gas composition generated in the newly proposed gas-fired industrial burner pyrolysis. Validation involved varying the grid count about the power combustion value of the proposed gas-fired industrial burner pyrolysis. Figure 4b shows the validation results, illustrating the relationship between volumetric flow rate and power combustion. The graph presents the experimental results from the study by Csemány et al. [7] on the pyrolysis of a gas-fired industrial burner, which achieved volumetric flow rates of 200 m3/h, 700 m3/h, and 1000 m3/h. The simulation results, when compared to experimental data in the literature, indicated volumetric flow rates of 258.660 m3/h, 749.860 m3/h, and 1072.324 m3/h. The maximum relative error observed is 3.7% at a volumetric flow rate of 200 m3/h, in comparison to 258.660 m3/h. Conversely, the minimum relative error is 2.9% at a volumetric flow rate of 700 m3/h, relative to 749.860 m3/h. The results demonstrate a strong correlation between the experimental findings of Csemány et al. [7] and the numerical study undergoing validation.
3. Research and Discussion
3.1. The Influence of Combustion Power Level
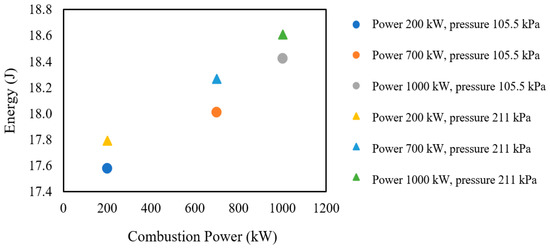
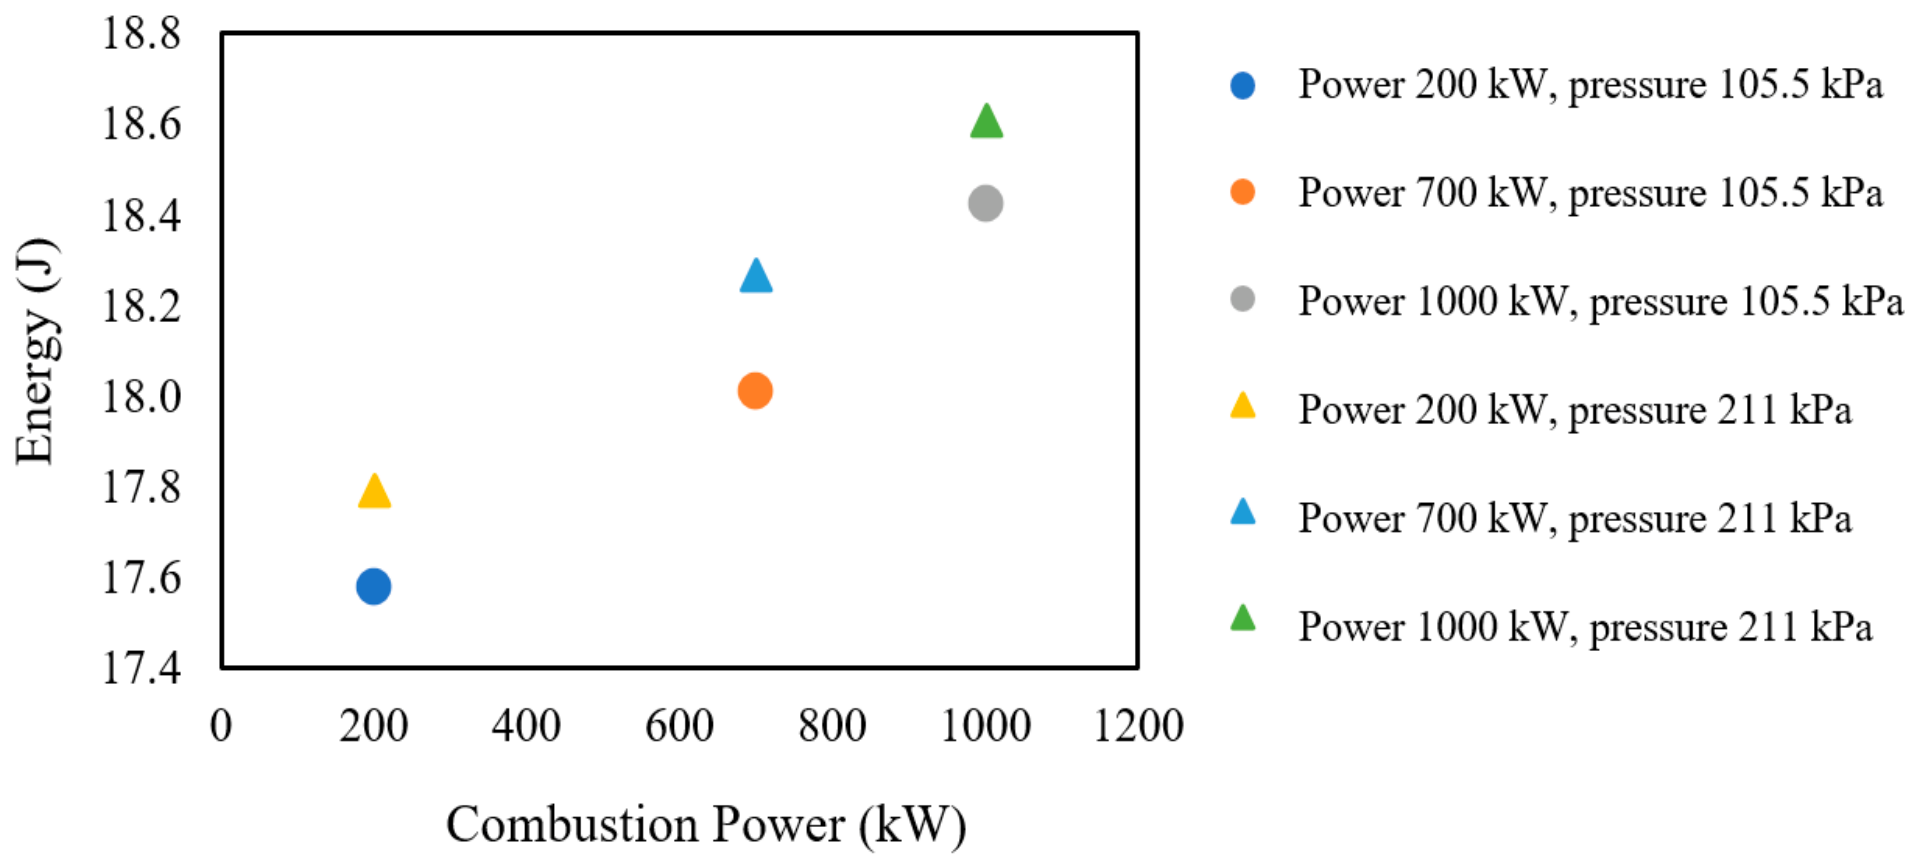
A gas-fired industrial burner pyrolysis reactor regulates biomass flow and temperature conditions to maximize product yield. Figure 5 shows the energy released by a gas-fired industrial burner, operated using combustion power levels of 200 kW, 700 kW, and 1000 kW. The results show that the combustion power level in the pyrolyzer has a positive impact on energy. Using the pressure of 211 kPa produces an energy of 17.79 J, 18.27 J, and 18.61 J for the combustion power levels of 200 kW, 700 kW, and 1000 kW, respectively. For the same combustion powers, the pressures of 105.5 kPa release energies of 17.58 J, 18.01 J, and 18.42 J, which are lower than those with 211 kPa pressure. This result indicates that an increased combustion power level elevates the energy content. A higher pressure also increases the energy. However, excessive combustion power levels may lead to uncontrolled temperature increases, causing potential damage to the pyrolyzer. An optimal energy value observed in gas-fired industrial burner pyrolysis is typically characterized by a combustion power level of 1000 kW, producing an energy of 18.61 J.
Figure 5.
Energy vs. Combustion Power level.
3.2. The Influence of Combustion Temperature
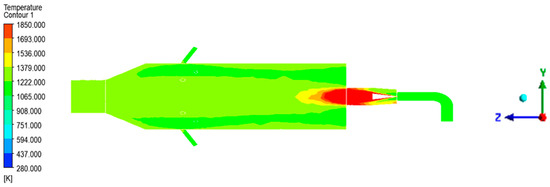
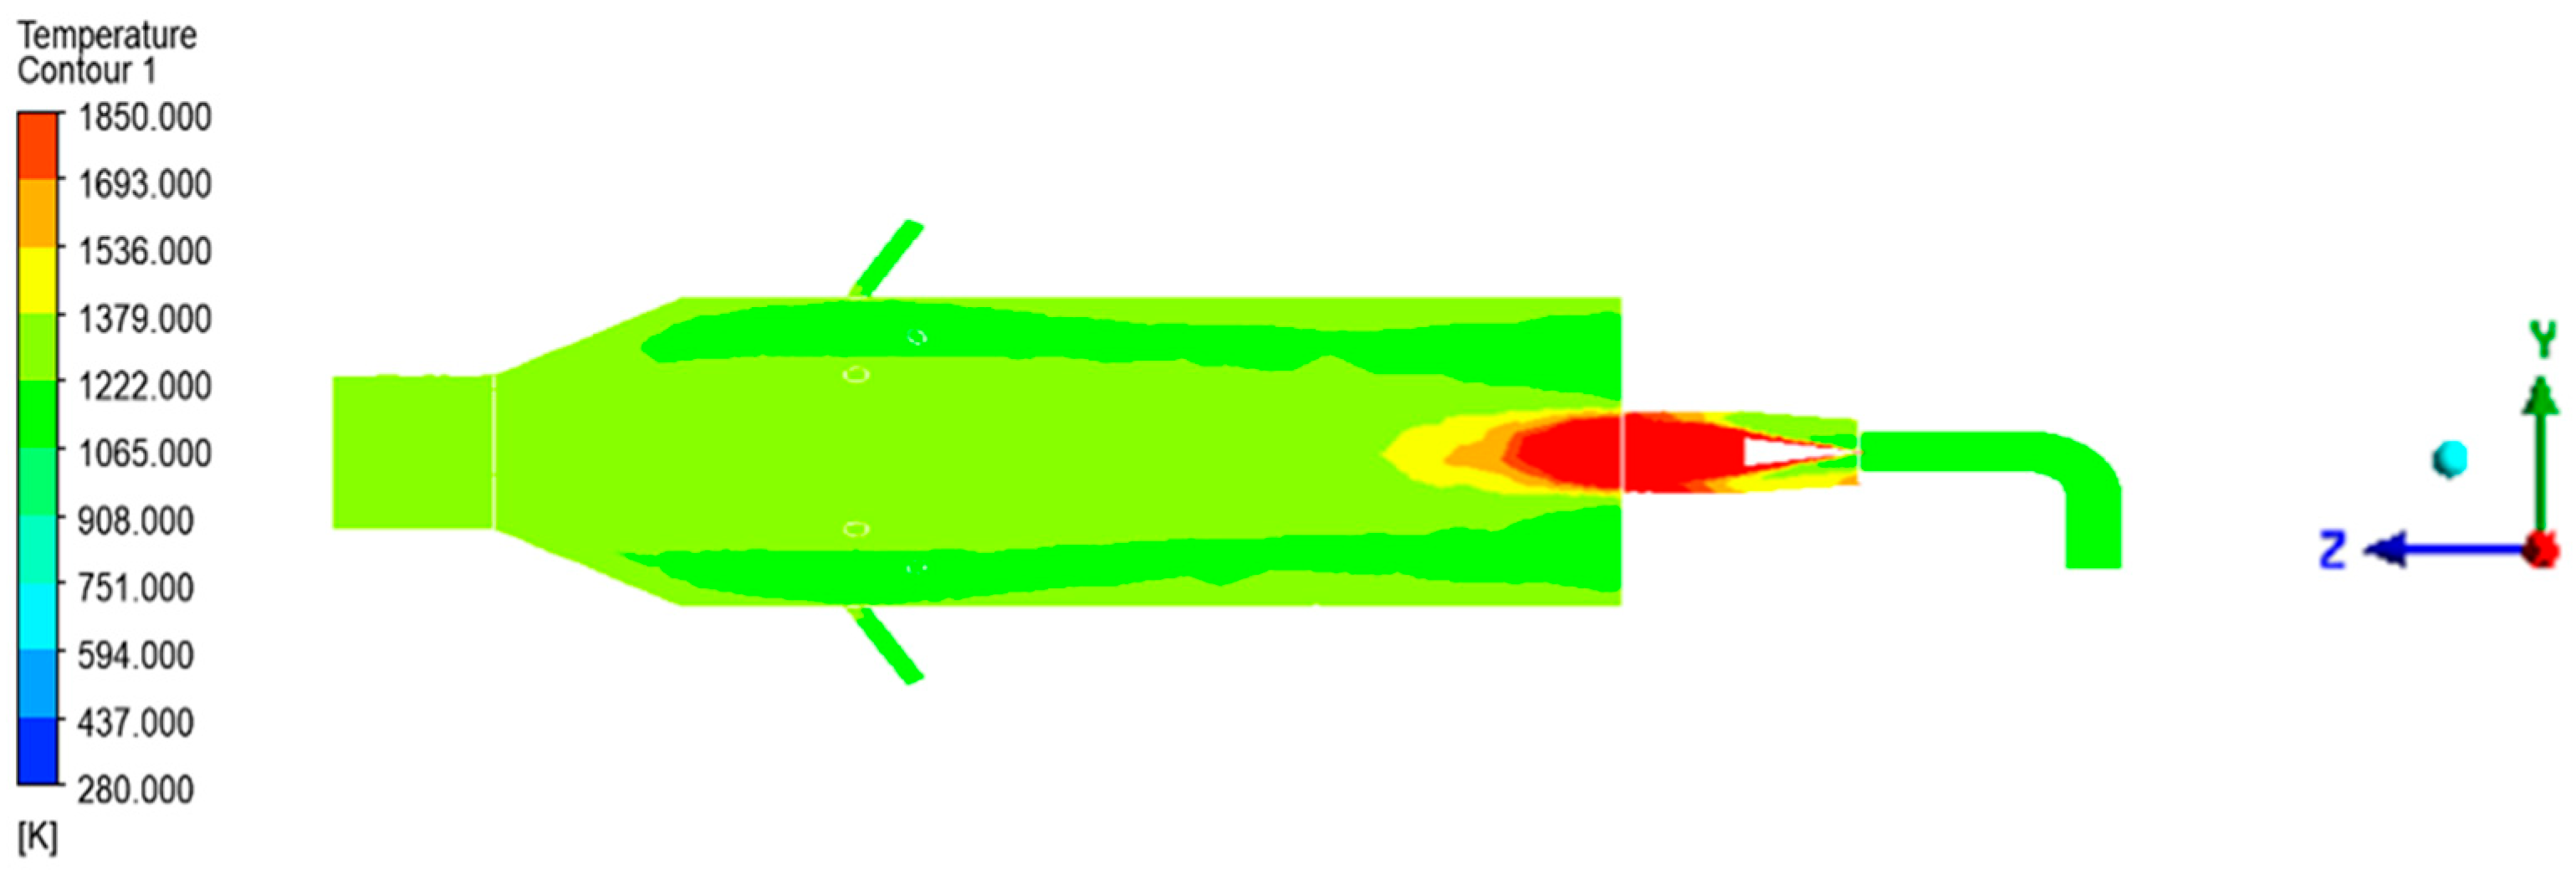
The elevation of the combustion power level will result in a higher temperature within the pyrolyzer. Elevated temperatures can promote the decomposition of complex molecules in raw materials into simpler products with increased energy value, including bio-oil or gas. Figure 6 shows the contours of the temperature distribution in the pyrolyzer at an operating pressure of 105.5 kPa. The temperatures vary from 280 K to 1850 K across the pyrolyzer. The highest temperature distribution occurs in the burner domain, attributable to the influence of the combustion center. The elevated temperature from the burner progressively disseminates to the walls and subsequently exits via the outlet channel at varying temperatures. The simulation with a pressure of 105.5 kPa demonstrates that the combustion power levels of 200 kW, 700 kW, and 1000 kW generate the maximum temperatures of 1507 K, 1564 K, and 1614 K, respectively. Thus, the combustion power level is vital since it can sustain the temperature within the optimal range for the pyrolysis reaction.
Figure 6.
Temperature Distributions.
3.3. The Influence of Operational Pressure
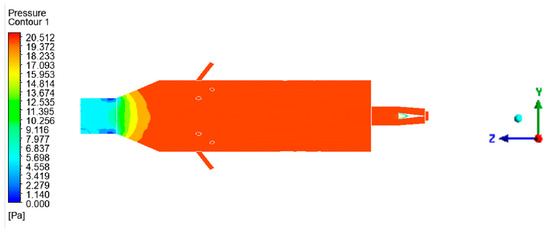
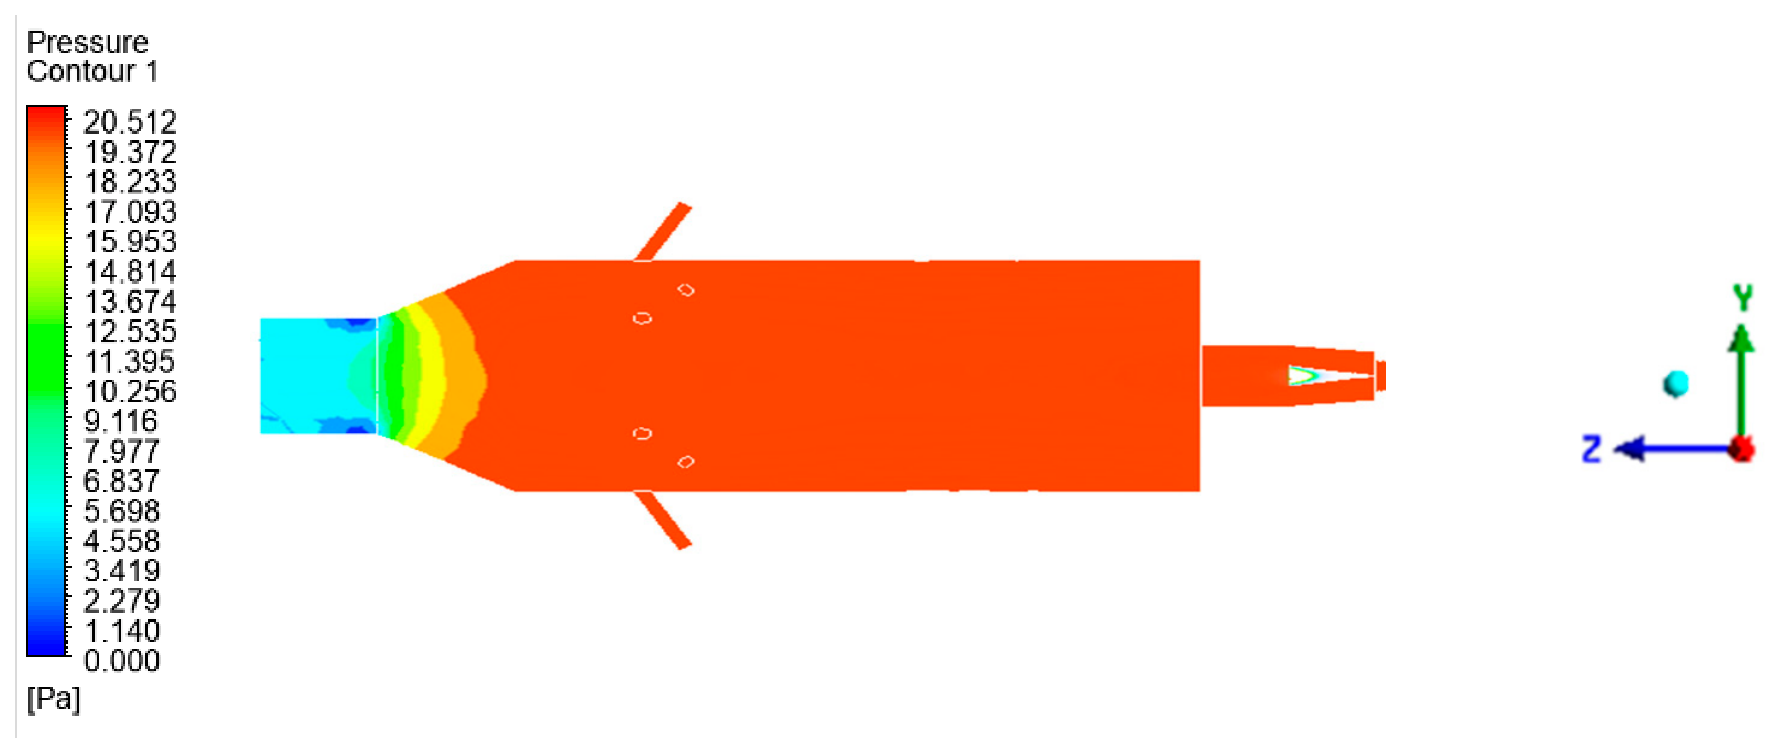
The pressure in a gas-fired industrial burner pyrolysis significantly influences the energy of the process. Changes in pressure can affect the equilibrium of a reaction, consequently affecting the quantity and characteristics of the products generated. Figure 7 shows the contours of pressure distribution, specifically 211 kPa. The pressure is distributed almost uniformly in the pyrolyzer. High pressure affects the reaction rate and chemical equilibrium in the pyrolysis reactor, which impacts the conversion of raw materials into oil, gas, or solids. At high pressures, pyrolysis gas separation from liquid or solid products may be less efficient and require a more complicated and energy-intensive apparatus.
Figure 7.
Pressure Distributions.
3.4. Efficiency
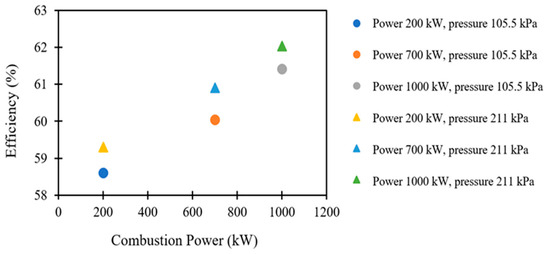
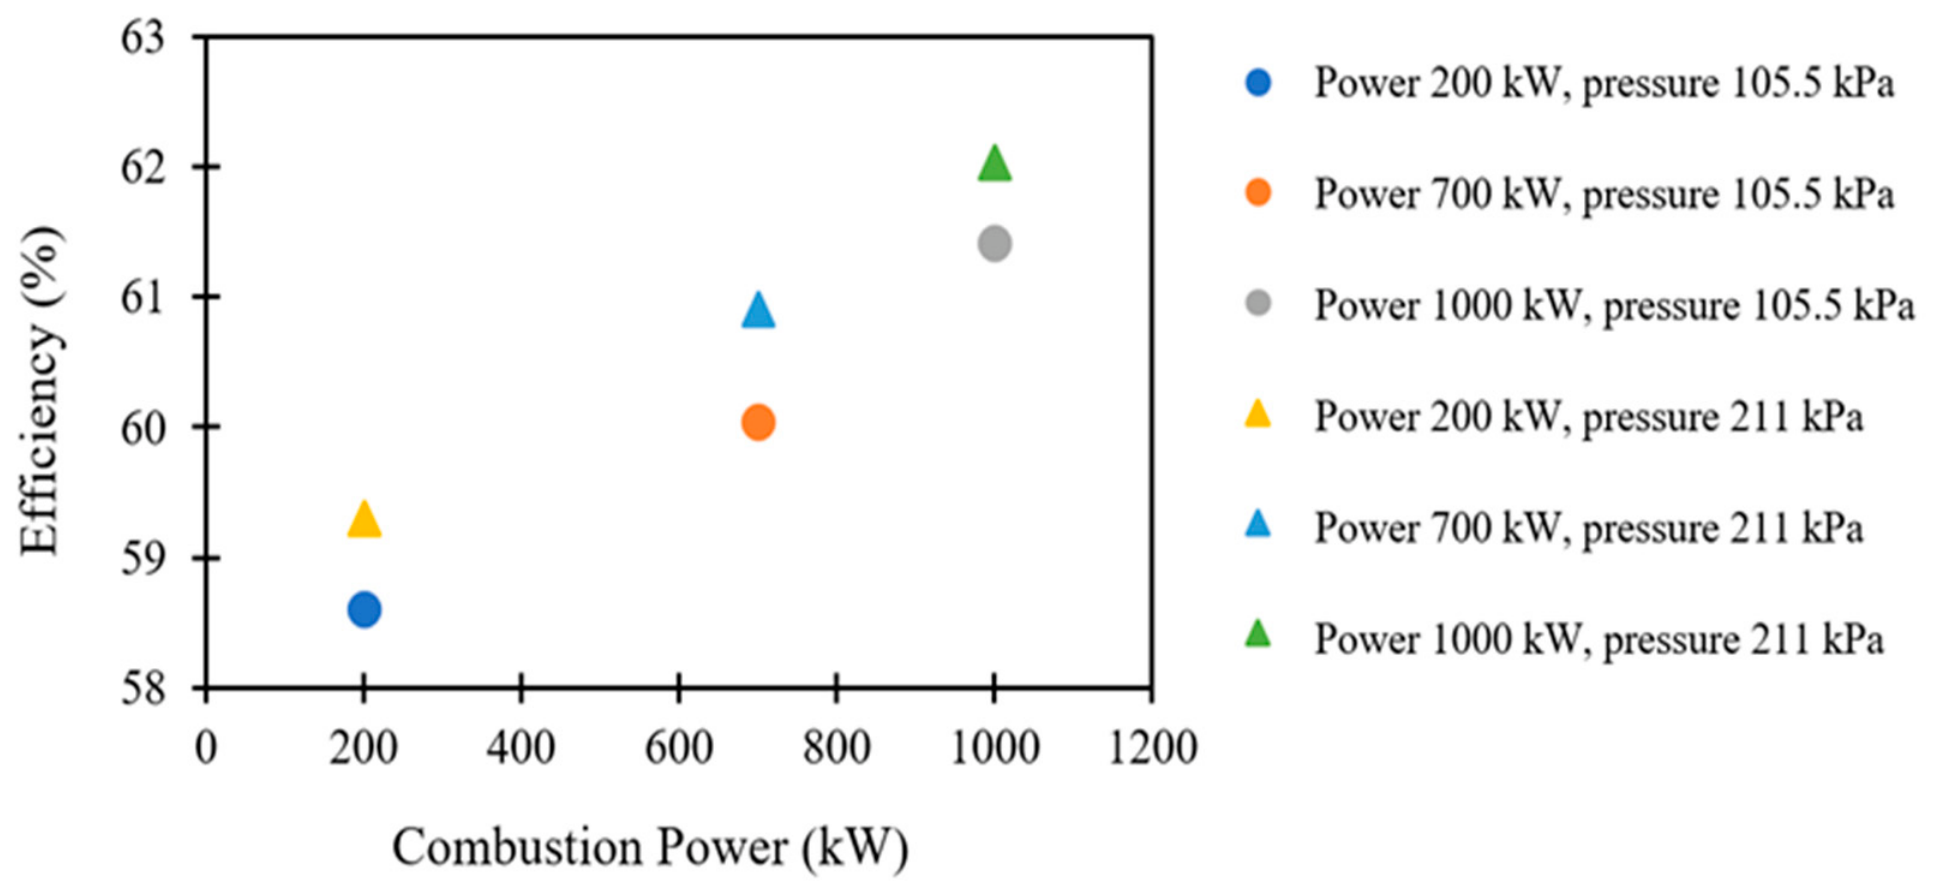
Thermal efficiency is affected by pressure variations, which can impact the thermal efficiency of the pyrolysis reactor. Increased thermal efficiency reduces energy waste and enhances energy utilization for the pyrolysis reaction. Figure 8 shows the efficiency of the gas-fired industrial burner in pyrolysis processes, operated at a pressure of 105.5 kPa and 211 kPa. The results show that increasing the combustion power level increases the efficiency. Using a pressure of 105.5 kPa, the combustion power levels of 200 kW, 700 kW, and 1000 kW produce an efficiency of 58.6%, 60.3%, and 61.4%, respectively. For similar combustion power levels, applying a pressure of 211 kPa results in the efficiencies of 59.3%, 60.9%, and 62.03%, which are higher than those with a pressure of 105.5 kPa. The maximum efficiency occurs at a combustion power of 1000 kW and an operating pressure of 211 kPa. The results indicate that the gas-fired industrial burner exhibits strong performance. The present finding might be applied for a gasification furnace [16] and a fluidized bed gasifier [17].
Figure 8.
Efficiency.
4. Conclusions
This study investigated pyrolysis in the gas-fired industrial burners using Computational Fluid Dynamics (CFD). The energy and efficiency of the pyrolysis were observed at various operational pressures (105.5 kPa and 211 kPa) and combustion power levels (200 kW, 700 kW, and 1000 kW). The results show that at combustion power levels of 200 kW, 700 kW, and 1000 kW, a pressure of 211 kPa produces an energy of 17.79 J, 18.27 J, and 18.61 J, respectively. For the same combustion power levels, a pressure of 105.5 kPa releases a lower energy with 17.58 J, 18.01 J, and 18.42 J. The temperature distribution in the pyrolyzer shows that the highest temperature occurs in the burner part. On the other hand, the pressure spreads almost uniformly. The efficiency of a pyrolysis reactor increases with the combustion power level. Using a pressure of 105.5 kPa, the combustion power levels of 200 kW, 700 kW, and 1000 kW produce an efficiency of 58.6%, 60.3%, and 61.4%, respectively. For similar combustion power levels, applying a pressure of 211 kPa results in the efficiencies of 59.3%, 60.9%, and 62.03%, which are higher than those with a pressure of 105.5 kPa. This work enables recommendations and applications in practical field settings.
Author Contributions
R.M., M.S. and G.P.N. conducted experiments, while B.S.R.P. and H.R.N. drafted the manuscript and provided editorial support. M.N. were responsible for data recording and preparation. D.G. and T.W.B.R. performed data analysis and interpretation. All authors have read and agreed to the published version of the manuscript.
Funding
Research center Politeknik Negeri Jakarta (P3M), through the Grant Indexed International Publication funding scheme with number 819/PL3.A.10/PT.00.06/2025, supplied the authors.
Institutional Review Board Statement
Not applicable.
Informed Consent Statement
No applicable.
Data Availability Statement
All data related to this study have been presented in the manuscript. No new data were generated or described in this study.
Acknowledgments
All authors would like to express gratitude to Research center Politeknik Negeri (P3M) for their financial support and assistance throughout this research.
Conflicts of Interest
The author declares no conflicts of interest.
References
- Ti, S.; Deng, S.; Yang, J.; Liu, X.; Zhu, Y.; Yang, Z.; Gao, K.; Wang, H. Feasibility analysis of resource recovery from electronic waste and biomass through pyrolysis technology. J. Environ. Manag. 2025, 391, 126507. [Google Scholar] [CrossRef] [Scilit] [PubMed]
- Sun, S.-H.; Wan, J.; Fu, H.-C.; Sun, Y.-H.; Shao, F.; Ni, D.-S.; Lu, J.-J. Influence of pyrolysis on biomass structure: Microscopic deformation patterns and chemical composition variations. Fuel 2025, 403, 136090. [Google Scholar] [CrossRef] [Scilit]
- Wei, R.; Ren, L.; Liu, L. Gasification reactivity and kinetic simulation of anthracite/biomass chars and co-pyrolysis chars. Renew. Energy 2026, 256, 123916. [Google Scholar] [CrossRef] [Scilit]
- Ritisha, D.K.; Maheswata, L.; Chinta, S.R. Leveraging explainable AI framework for predictive modeling of products of microwave pyrolysis of lignocellulosic biomass using machine learning. J. Anal. Appl. Pyrolysis 2025, 192, 107249. [Google Scholar] [CrossRef] [Scilit]
- Nisha, R.; Taraknath, D. Biomass and Bioenergy Exploring biomass pyrolysis for sustainable hydrogen-rich gas production. Biomass Bioenergy 2025, 202, 108162. [Google Scholar]
- Reza, M.S.; Taweekun, J.; Afroze, S.; Siddique, S.A.; Islam, M.S.; Wang, C.; Azad, A.K. Investigation of Thermochemical Properties and Pyrolysis of Barley Waste as a Source for Renewable Energy. Sustainability 2025, 15, 1643. [Google Scholar] [CrossRef] [Scilit]
- Dávid, C.; Dániel, F.; Viktor, J. Numerical analysis on the thermal load and NO emission of a novel 1 MW pyrolysis gas/natural gas-fired industrial burner. Results Eng. 2025, 25, 104388. [Google Scholar]
- Zhang, B.; Qu, M.; He, W.; Pang, B.; Yu, R.; Zhang, K.; Xie, Z.; Liu, X.; Xu, Y. A novel low-NO burner with in-burner high-speed air jet array for ammonia-coal co-firing: Integrating ammonia pyrolysis and deep air staging. J. Energy Inst. 2025, 119, 101952. [Google Scholar] [CrossRef] [Scilit]
- Songkran, W.; Nathawat, U.; Pichai, A.; Sittinun, T.; Surachai, N.J.; Sommas, K. Electricity generation from co-pyrolysis gas of fresh palm fruit bunches and medical waste plastic bottles for sustainable energy applications. Case Stud. Chem. Environ. Eng. 2025, 12, 101240. [Google Scholar] [CrossRef] [Scilit]
- Sallevelt, J.L.H.P.; Atur, K.P.; Gerrit, B. Numerical study of pyrolysis oil combustion in an industrial gas turbine. Energy Convers. Manag. 2016, 127, 504–514. [Google Scholar] [CrossRef] [Scilit]
- Feng, Y.; Jiang, Y.; Li, X.; Zhang, S.; Qin, J.; Cao, Y.; Huang, H. Numerical study on the influences of heat and mass transfers on the pyrolysis of hydrocarbon fuel in mini-channel. Appl. Therm. Eng. 2017, 119, 650–658. [Google Scholar] [CrossRef] [Scilit]
- Li, F.; Li, Y.; Lin, R.; Sun, D.; Zhang, H. A comparative thermodynamic assessment of microwave-assisted and conventional pyrolysis of biomass in poly-generation systems using coupled numerical and process simulations. Energy Convers. Manag. 2024, 319, 118965. [Google Scholar] [CrossRef] [Scilit]
- Roman, T.; Ivan, K.; Daria, D.; Andrei, M.; Ivan, S. Influence of liquid products formed at microwave pyrolysis of solid organic raw materials on process duration and energy consumption. Energy Convers. Manag. 2025, 343, 120197. [Google Scholar] [CrossRef] [Scilit]
- Chen, Y.; Li, C.; Zhang, Q.; Qu, Y.; Duan, J.; Wang, W. Simulation of waste tire pyrolysis in a multi-chamber fluidized bed by coupling CFD-DEM with a particle shrinkage model. Energy 2025, 329, 136821. [Google Scholar] [CrossRef] [Scilit]
- Shirish, K.S.; Anand, M.S.; Dasappa, S. Optimizing cyclone reactor design using single particle analysis, gas-solid flow simulation, and visualization for coal pyrolysis. Therm. Sci. Eng. Prog. 2025, 64, 103850. [Google Scholar] [CrossRef] [Scilit]
- Subroto, S.; Afif, F. The Effect of Bentonite Addition to Rice Husk on the Performance of Downdraft Gasification Furnace. Media Mesin Maj. Tek. Mesin. 2021, 22, 31–37. [Google Scholar]
- Nur, A.; Tri, A.R.; Harwin, S. The Effect of Thermal Wall on Hydrodynamic Characteristics and Syngas Characteristics in Coconut Shell Fueled Dual Fluidized Bed Gasifier with CPFD Based Simulation. Media Mesin Maj. Tek. Mesin. 2021, 22, 49–63. [Google Scholar]
Disclaimer/Publisher’s Note: The statements, opinions and data contained in all publications are solely those of the individual author(s) and contributor(s) and not of MDPI and/or the editor(s). MDPI and/or the editor(s) disclaim responsibility for any injury to people or property resulting from any ideas, methods, instructions or products referred to in the content. |
© 2026 by the authors. Licensee MDPI, Basel, Switzerland. This article is an open access article distributed under the terms and conditions of the Creative Commons Attribution (CC BY) license.